university of huddersfield...
TRANSCRIPT

Electrical Motor Current Signal Analysis using a Modulation
Signal Bispectrum for the Fault Diagnosis of a Gearbox
Downstream
M Haram1, T Wang
2, and F Gu
1 and A D Ball
1
1University of Huddersfield, Queensgate, Huddersfield HD1 3DH, UK;
2 Department
of Vehicle Engineering Taiyuan University of Technology, Taiyuan, 030024, China
E-mail: [email protected]
Abstract. Motor current signal analysis has been an effective way for many years of
monitoring electrical machines themselves. However, little work has been carried out in using
this technique for monitoring their downstream equipment because of difficulties in extracting
small fault components in the measured current signals. This paper investigates the
characteristics of electrical current signals for monitoring the faults from a downstream
gearbox using a modulation signal bispectrum (MSB), including phase effects in extracting
small modulating components in a noisy measurement. An analytical study is firstly performed
to understand amplitude, frequency and phase characteristics of current signals due to faults. It
then explores the performance of MSB analysis in detecting weak modulating components in
current signals. Experimental study based on a 10kw two stage gearbox, driven by a three
phase induction motor, shows that MSB peaks at different rotational frequencies can be based
to quantify the severity of gear tooth breakage and the degrees of shaft misalignment. In
addition, the type and location of a fault can be recognized based on the frequency at which the
change of MSB peak is the highest among different frequencies.
Key words: Gearbox, Motor current signature analysis, Modulation signal bispectrum.
1. Introduction In the last three decades a number of papers have been published on condition monitoring (CM) using
MCSA for detection and diagnosis of mechanical defects. Benbouzid [1] reviewed MCSA (spectral
analysis of the stator current) as a mechanism for fault detection and showed how MCSA could be
used for the detection and localisation of abnormal electrical and mechanical conditions that indicate,
or may lead to, a failure of an induction motor. Kar and Mohanty [2] used MCSA to detect gearbox
faults instead of conventional vibration techniques. Based on a 7.5kw test rig he found that the MCSA
can detect low frequencies using FFT analysis, but that high frequencies were difficult to detect. They
also found that the use of MCSA combined with discrete wavelet transform DWT can be a good
replacement for conventional vibration mentoring, but that continuous wavelet transforms CWT is not
suitable for detecting fault or load fluctuations. In addition, Kia et al [3] developed a signal model for
monitoring gearboxes using phase current and demonstrated the effectiveness of the spectrum method
in extracting the frequency components relating to a signal stage gearbox driven by a 5.5kw.

To expand the capability of the current signature analysis, Rgeai [4] used the spectrum and
conventional bispectrum to analyse phase current signals and demonstrated that these can be used to
detect different degrees of tooth breakage of a two stage helical gearbox driven by an 11kW motor.
More recently, Naid and Gu et al [ 5, 6, 7] proposed a new modulation signal bispectrum (MSB) and
showed reliable fault diagnosis based on the current signals from a reciprocating compressor in which
the motor was subject to a high oscillatory load. To improve the performance of monitoring
gearboxes, this study focuses on applying MSB to current signals from a two stage helical gearbox of
11kW under different incipient faults.
2. Motor Current Responses Due to Faults
2.1. Phase current response under healthy conditions
When a motor drive such as the gearbox system shown in Figure 2 is operating under healthy
conditions, the ideal electromagnetic relationship of the driving motor can be examined in phase A for
a simple understanding of the fault effect. By neglecting the higher order harmonics and mechanical
errors and referring to supply voltage signal, the current signal in phase A for a healthy motor drive
can be expressed [8, 9] as
)2cos(2 IsA tfIi
(1)
Correspondingly, the magnetic flux in the motor stator is
)2cos(2 tf sA (2)
The electrical torque produced by the interaction between the current and flux can be expressed as
)sin(3 IIPT
(3)
where I and denote the root mean squared (RMS) amplitudes of the supply current and linkage
flux respectively, I and are the phases of the current and flux referring to supply voltage, sf is
the fundamental frequency of electrical supply and P is the number of pole pairs.
2.2. Phase current response under faulty conditions
If there is a fault, such as a broken rotor bar, a damaged gear and a misaligned shaft occurring in the
gear drive system, there will be an additional mechanical torque component induced by the fault. To
balance this torque component, a corresponding electric torque will be generated by the motor.
Supposing that the additional torque T is a sinusoidal wave with a frequency Ff and an associated
current wave with an amplitude FI and phase F , the oscillatory torque can be expressed
])(2sin[3 FIFF tfIPT (4)
which causes a corresponding angular oscillation:
)](2sin[4
322
2
FF
F
F
F tfJf
IPdt
(5)
where J is the inertia of the rotor system of motor . This angular oscillation modulates the phases of
linkage flux in equation. (2) and eventually leads to additional motor current signals in conjunction
with associated phases to be approximated as [8]:
]2)(2cos[2
])(2cos[2
)2cos(2
FIFsr
FIFsl
IsAF
tffI
tffI
tfIi
(6)
where is the angular displacement of the motor equivalent circuit impedance at the supply
frequency, lI and rI are the RMS values of the lower sideband component and the upper sideband
component, respectively, which are the currents induced by the back-EMF voltages produced by the
flux variations at frequencies of Fs ff and Fs ff . This simplified expression of current signal is
employed widely for motor fault condition monitoring. By checking the amplitude of the sidebands
through spectrum analysis, various faults such as rotor bar breakage and eccentricity can be diagnosed
with a high degree of accuracy. It is noted in equation. (5) that the amplitude of angular oscillation
depends inversely on squared frequency and the inertia and hence that sidebands amplitudes also
correlate to the frequency and inertia in the same way.
However, conventional spectrum analysis uses amplitude information only and overlooks the phase
effect which also contains fault information, as shown in equation. (6). The consequence of ignoring
phase information may degrade diagnosis performance in the case of incipient faults when the
sideband amplitude is very small and is masked by random noise. This is particularly true for
diagnosing faults from the downstream mechanical system. Fortunately, bispectrum analysis allows
the retention of both the amplitude and the phase information. In addition, it has good noise
suppression and identification of nonlinear effects. Therefore, bispectrum can be a more powerful tool
to process the current signals for resolving the weak fault signals and for better fault diagnosis.
3. Sideband Extraction using Modulation Signal Bispectrum
3.1. Modulation signal bispectrum
For a discrete time current signal )(tx its Discrete Fourier Transform )( fX is defined as:
t
tjetxfX 2)()(
(7)
and the second-order measure (power spectrum) of )(tx , can be computed by the formula
)]()([)( * fXfXEfP (8)
where )(* fX is the complex conjugate of )( 1fX and .E is the statistical expectation. The power
spectrum is a linear transform and is a function of the frequency f . Extending this definition to the
measures of order 3 gives rise to the conventional bispectrum:
)()()(),( 212121 ffXfXfXEffB
(9)
Conventional bispectrum of equation.(8) examines only the presence of quadratic phase coupling
(QPC) from the harmonically related frequency components of 21, ff and 21 ff . It neglects the
possibility that the occurrence of 21 ff may be also so due to the nonlinearity between f1 and f2.
Because of this, it is not adequate to describe modulation signals such as the motor current signal in
equation.(6). Several approaches such as [10, 11, 12 13] have been studied on the use of bispectrum
for modulation signals and showed more compact results in analysing signals. To improve the

performance of the conventional bispectrum in describing the motor current signals, this study uses the
signal bispectrum (MSB) suggested in [7]:
)]()()()([),( 2
*
2
*
121221 fXfXffXffXEffBMS (10)
Unlike equation.(9), this equation considers both )( 21 ff and )( 21 ff concurrently for possible
QPC in MS signals. It illustrates that a bispectral peak will be clear at bifrequency ),( 21 ffBMS if
)( 21 ff and )( 21 ff are both due to QPC between 2f and 2f . This is more accurate and effective
in representing the MS signal features.
The total phase of MS bispectrum in equation (9) is
)()()()(),( 22121221 ffffffffMS
(11)
when two components f1 and f2 are in coupling, their phases are related by
)()()(
)()()(
1212
1212
ffff
ffff
(12)
By substituting (11) into (10) the total phase of MS bispectrum will be zero and its amplitude will
be the product of the four magnitudes, which is the maximum of the complex product. Therefore, a
bispectral peak will appear at (f1, f2). Especially, equation. (9) now takes into account both (f1+f2) and
(f1-f2) simultaneously for measuring the nonlinearity of modulation signals. If (f1+f2) and (f1-f2) are
both due to nonlinear effect between f1 and f2, a bispectral peak will appear at bifrequency (f1, f2). This
is more accurate and apparent in representing the sideband characteristics of modulated signals.
For the current signal in equation (5), its MS bispectrum phase can be
222),( FFsMS ff
(13)
Equation.(13) shows that the bispectrum phase is connecting to only sideband components i.e. the
angular position of faults and motor design and operating parameters, but exclude the phase of the
fundamental component. It means that MS bispectrum is independent of the angular position of the
rotor or the start point of a signal acquired. This will allow an average of MS bispectrum estimation to
be performed using a data set collected or framed at any time. The average in turn will suppress
random noise and unrelated components to obtain a reliable estimation of MS bispectrum and of the
hidden modulating signal.
3.2. Sideband detection MSB
Because a motor current signal with mechanical faults contains a series of sideband components which
appear mainly around the supply component, a bispectrum slice at the supply frequency is sufficient to
characterize the sidebands for fault detection. By setting f2 of equation. (9) into a constant frequency
values such as fs=50Hz, MSB at supply frequency can be expressed as:
sssssMS fXfXffXffXEffB **
111, (14)
To extract sidebands only, the magnitude influences of the supply component on the resultant
bispectrum amplitude can be removed by normalizing the supply component by its magnitude:
sssn fXfXfX / , which has unity magnitude but maintains the useful phase for averaging. In
this way equation (13) becomes a sideband MSB:
snsnsssMS
n fXfXffXffXEffB **
111, (15)

And in the form of magnitude-phase, the sideband MSB is
),(
1111||||, sMS ffj
sssMSn effXffXEffB
(16)
These equations show that the magnitude of normalized MSB is only the products of the 2 sideband
components. Under the condition that the amplitude of the sideband is the same, the amplitude from
equation (14) or (15) can be directly compared with the sideband amplitude of power spectrum in
equation. (7). However, the amplitude from equation. (14) is obtained by including phase influences. It
will suppress any components with phase inconsistency due to random noise. On the other hand, the
sideband amplitude includes noise influences because the power spectrum is unable to use phase
information.
Corresponding MSB bicoherence for modulation signals only in [7] can be simplified as
2
11
2
11
2
||
|),(|,
ffXffXE
ffBffb
ss
sMSn
sMSn
(17)
to check the degree of random noise influences and hence confirm the existence of MSB peaks.
3.3. Performance evaluation
To evaluate the performance of the sideband MSB in detecting and diagnosing weak modulating
components, a synthetic signal is created to have a carrier frequency of 50Hz, two modulating
components of 50±24 Hz and 50±15Hz, an additional component of 10Hz and a high level of
Gaussian noise. Figure 1(a) shows the power spectrum of the signal. To highlight the small
modulating components, the figure does not display the full amplitude at 50Hz and at 10Hz, but shows
the details of the disband changes with and without noise induced. It is clear that the spectrum has a
high background level through the whole frequency range due to the high noise induced. Moreover,
the amplitudes at the smaller and the larger sidebands are higher than those of the noise free signal.
These higher amplitudes obviously will degrade detection performance.
In contrast, the MSB slice at 50Hz shown in Figure 1(b) presents a very clean representation for the
signal with noise. It has an almost zero background floor and shows clearly the two frequency
components accounting for the sidebands in the spectrum. In addition, these two components are
confirmed by high amplitudes of MSB coherence shown in Figure 1(c).
Most importantly, the two amplitudes from MSB are very close to those of the noise-free case. It
gives a more accurate estimation of the modulating signals because MSB takes phase information
during the average process. In addition, the error of peak estimation is in a similar range, less than 2%
for both the larger and smaller modulating signals. On the other hand, the peak estimation of power
spectrum produces significantly greater errors and becomes worse when the signal-noise ratio (SNR)
is lower for the case of small modulating signal. This shows that the MSB spectrum can produce more
accurate detection and diagnosis.
In addition, MSB can also exclude any components that are not from modulation effects. The
component at 10Hz has a small peak at 40Hz in MSB due to limited accuracy in numerical calculation.
However, because the amplitude of MSB coherence is very low, it is easy to identify that this is not a
real modulating component.
This simulation study enhances understandings that MSB can provide a much cleaner
representation of the modulating process which creates a reliable basis for reliable detection and
accurate estimation of modulating signals.

Figure 1. Comparison of detection and diagnosis between power spectrum and MSB.
4. Test Setups
To evaluate the performance of MSB analysis in diagnosing gearbox faults, a number of electric
current signals were measured from a two stage gearbox test rig under different gear fault cases and
operating conditions.
4.1. Test rig
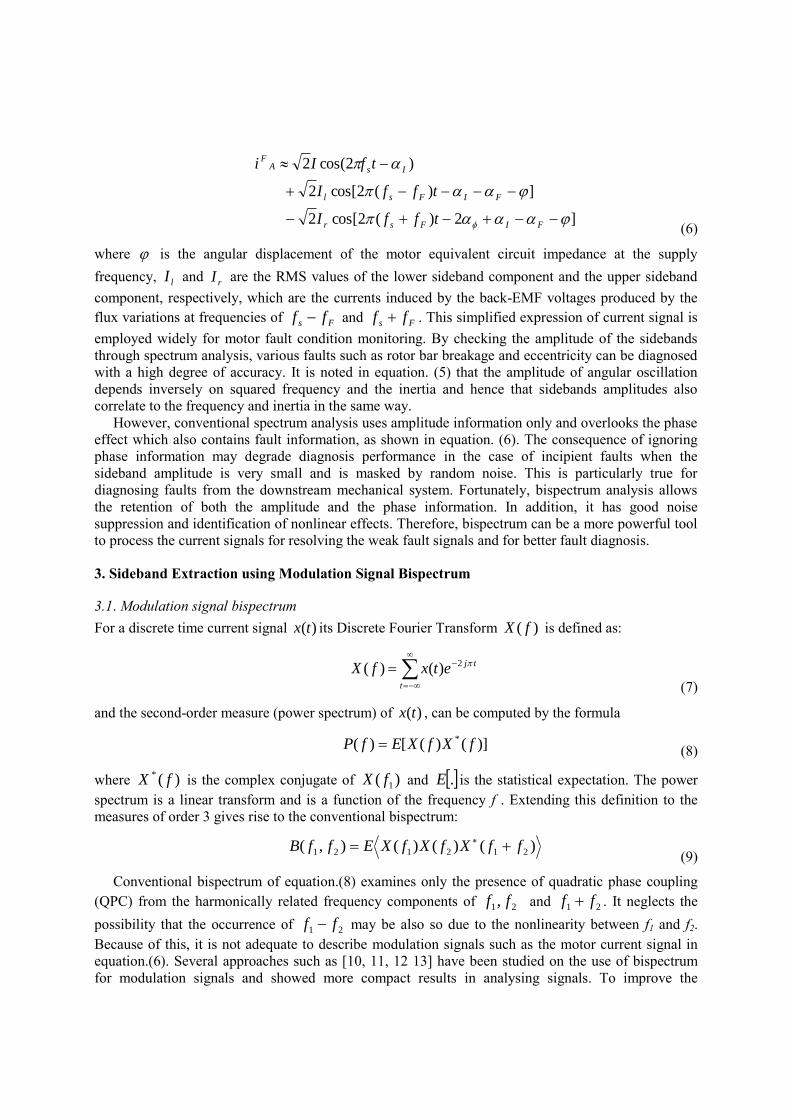
Figure 2 shows the gearbox test rig used to test different gear conditions using motor current diagnosis
in this research. It consists of a 3-phase induction motor, a two stage helical gearbox, flexible
couplings and a DC motor which acts as a mechanical load. The induction motor (11kW, 1465 rpm
and four magnetic poles) was supplied by a 3-phase power supply through a variable speed drive
which allows different operating conditions to be specified. The schematic of the test rig setup is
0 10 20 30 40 50 60 70 80 90 1000
2
4
6
8
x 10-6
Frequency(Hz)
Am
plit
ude
(a) Power Spectrum
Noise-free
SNR= -81dB
0 5 10 15 20 25 30 35 40 45 500
2
4
6
8
x 10-6 (b) MSB at 50Hz
Frequency(Hz)
Am
plit
ude
Pxx error for large peak: 14.5%
MSB error for large peak: 1.92%
Pxx error for small peak: 85.5%
MSB error for small peak: 0.951%
non-QPC
0 5 10 15 20 25 30 35 40 45 500
0.2
0.4
0.6
0.8
1(c) MCB Coherence at 50Hz
Frequency(Hz)
Am
plit
ude
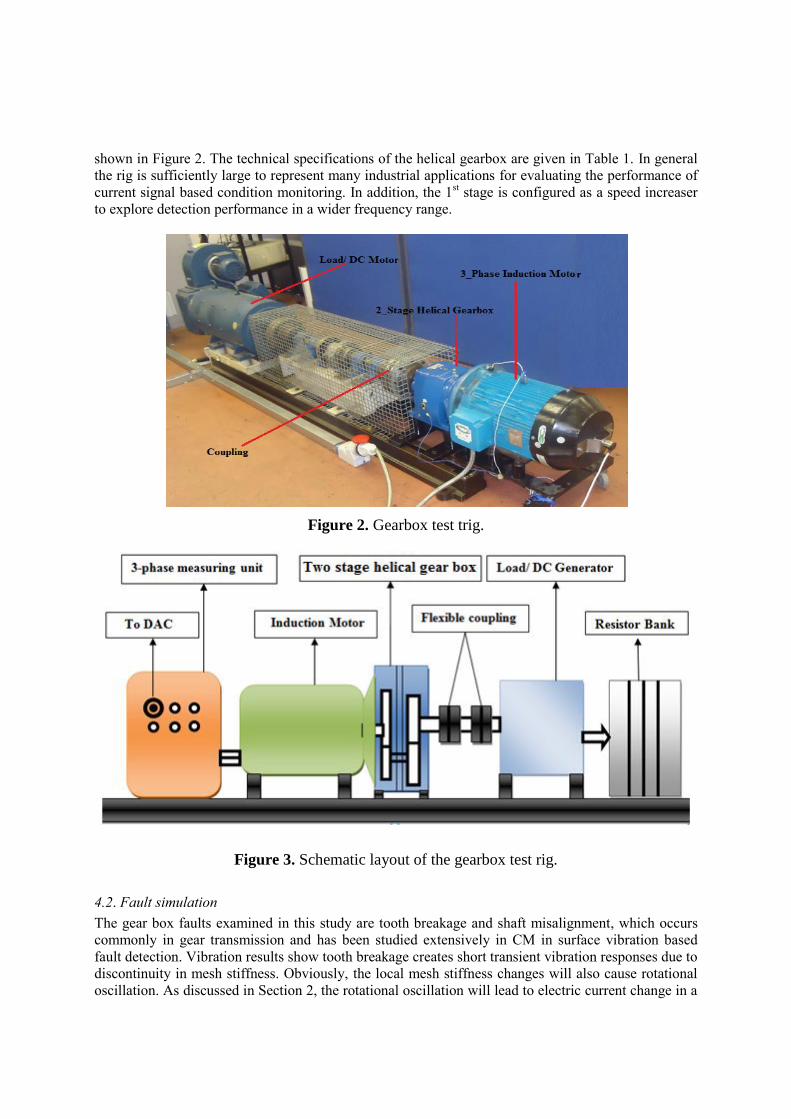
shown in Figure 2. The technical specifications of the helical gearbox are given in Table 1. In general
the rig is sufficiently large to represent many industrial applications for evaluating the performance of
current signal based condition monitoring. In addition, the 1st stage is configured as a speed increaser
to explore detection performance in a wider frequency range.
Figure 2. Gearbox test trig.
Figure 3. Schematic layout of the gearbox test rig.
4.2. Fault simulation
The gear box faults examined in this study are tooth breakage and shaft misalignment, which occurs
commonly in gear transmission and has been studied extensively in CM in surface vibration based
fault detection. Vibration results show tooth breakage creates short transient vibration responses due to
discontinuity in mesh stiffness. Obviously, the local mesh stiffness changes will also cause rotational
oscillation. As discussed in Section 2, the rotational oscillation will lead to electric current change in a
form of modulation. Thus by detecting the degree of modulation, it is possible to find the level of tooth
breakage.
To study the detection performance of MSB, four fault cases were examined. As detailed in table 2,
the faults were created with different severity and locations. As both the tooth breakage and shaft
misalignment can induce torque oscillations, but at different frequencies and locations, it is possible
for MSB to detect and separate between these two types of faults and differing severity.
Table 1. Specification of two-stage helical gearbox.
Description First Stage (Input Shaft 1) Second Stage (Output Shaft 3)
Reduction ratio 0.8103 (speed increase) 4.5385(speed decrease) Number of teeth Z1/Z2=58/47
Z3/Z4=13/59
Overlap ratio 2.890 1.289
Contact ratio 1.450 1.469
Shaft diameter 42mm 40mm
Shaft frequency fr1=24.42Hz fr2=30.16Hz fr3=6.46Hz
Mesh frequency 1416.36Hz 391.76Hz
Table 2. Tested gear sets and fault details.
Gear ID Fault location Fault description Fault severity
Gear01 Pinion on shaft 1 25% tooth breakage on one pinion tooth small Gear10 Pinion on shaft 1
50% tooth breakage on one pinion tooth
large
Gear07 Gear on shaft 2 25% tooth breakage on one gear tooth small
Gear12 Pinion on shaft 1
Healthy but with misalignment on shaft 3
3 grades
4.3. Data acquisition
Electrical current signals are measured by a hall-effect sensor with a linear frequency response from
0Hz to 4kHz, which allows the content in a wide frequency range, especially around the supply
fundamental of 50Hz, to be measured accurately. To examine the influence of the operating condition
on fault diagnosis performance, electrical current signals were measured under loads: 12%, 20%, 30%,
38% and 44% of the full operating load of the AC motor. In addition, to create a sufficient number of
averages and obtain reliable results, data acquisition for each gear condition was repeated three times.
To benchmark the performance of the current signal based fault detection, vibration from the gearbox
casing and instantaneous angular speed were also measured. All of the measurements were sampled
simultaneously at a rate of 100 kHz and with a data length of 16 seconds per channel at each
acquisition.
5. Results and Discussions
The datasets for the 4 gear sets are processed to obtain their corresponding MSB respectively. To
reduce the influences of spectral leakage, the segment size of Fourier Transform (FT) is set to be
402128 points, coving nearly 1000 cycles of the supply components. A Blackman-Harris window is
applied to the segment to minimise the sidelopes of FT. In addition, the number of average is 90 for
each MSB calculation.

5.1. Characteristics of MSB from a multistage gearbox
To find best detection frequency components, MSB has been explored up to 3000Hz. However, it was
found that the most useful information lies in the range below 50Hz where gear shaft related
components show high amplitudes and exhibit high correlation with operating conditions. This
confirms the fast attenuation modulation with frequency in equation.(5). Therefore, the components in
the low frequency are focused to develop diagnostic features. Figure 4 shows typical spectra of the
current signals from Gear07 under both baseline and faulty cases. Figure 4(a) shows that MSB of the
baseline has two primary components at 24.631Hz and 30.396Hz. These components are the shaft
frequencies of fr1 and fr2 respectively and hence link to the transmission performance at the 1st stage
of the gearbox. As both of them have high amplitudes at the baseline case it shows that they are
mainly caused by manufacturing errors such as gear eccentricity on the gear set, although fr1 may
have some contribution from the rotor eccentricity of the motor. Nevertheless, the existence of these
two components shows that the current signal contains useful information about the conditions of the
gear set.
For more detailed understanding, the MSB spectrum is presented with a magnification of the low
amplitude components as shown in Figure 4(b). It shows that the MSB has a series of secondary
components due to gear transmission in the low amplitude range. Although they have low amplitude in
MSB, their MSB coherence of Figure 4(c) are significantly high to support the existence of the
components. Firstly, the components at fr3=6.7617Hz and its high order harmonics can be clearly
seen, showing that the current signals also contain the information of the transmission at the second
stage, even though it is further away from the driving motor. Secondly, two more components due to
the interactions of shaft 1 and shaft 2 can be observed at fr2-fr1=5.7648Hz and at 2xfr1-fr2=18.867,
which shows again the high errors of the gear set at the 1st stage. Finally, a component at 9.455Hz is
found to be the higher order harmonics of rotor bar pass frequency (BPF), which are identified by
investigating the frequency variation characteristics with loads in high frequency ranges.
Comparing these identified components between the baseline and the faulty case has found that the
amplitudes of the components linking to fr1, fr2 and their interactions: fr2-fr1 and 2xfr1-fr2 has a clear
and humongous increase due to more oscillations from the fault. On the other hand, the amplitudes at
fr3 and its harmonics show an increase only at 2fr2 whereas a decrease at fr2 and 4xfr2, which are not
so consistent with the fault effect. These change characteristics indicate that the faulty tooth creates
more oscillation on the first stage and this can be used to determine the presence, the location and
severity of the fault. In particular, the most significant changes due to the fault are at fr1 and fr2 and
they have high SNR. Therefore, they are taken in the following sections as key features to examine the
MSB performance of diagnosing gear tooth breakage at the first stage.
However, the distinctive component at 39.51Hz for the faulty case is not from gear transmission
because it has very low coherence amplitude. It has demonstrated again that the MSB analysis has the
capability of excluding interference components.
5.2. MSB peaks with load variation
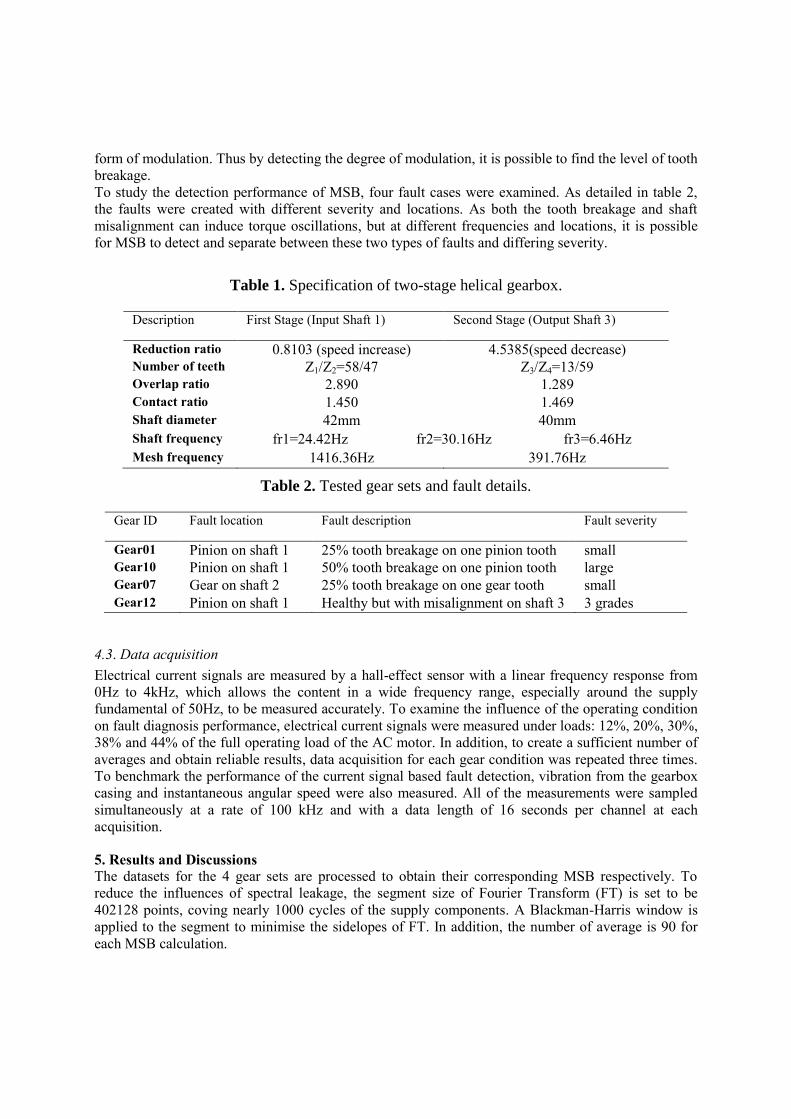
Figure 5 shows MSB peaks and their diagnosis performance under different load conditions based on
Gear10 and Gear01. It is clear that from Figure 5 (a) and (b) that MSB peaks at fr1 and fr2 vary with
load in a nonlinear behaviour. With load increases they increase in the small load range and then
decrease in the high load ranges. Especially, the maximum value of fr1 is at 20% load whereas that of
fr2 is at 30% load. These behaviours are not so consistent with the sideband amplitudes decreasing
with increase in load due to an effect of load damper in [3]. Moreover, the distribution of amplitudes at
fr1, fr2 and fr3 is very different in that MSB peaks are inversely proportional to the square of
frequency values, shown in equation. (5), providing that the inertia difference and error discrepancy
between the three shafts is relatively small. Because of these inconsistencies and very high amplitudes
at fr1 and fr2 compared with that of fr3 components, it has found that the gearbox under testing may
have possible torsional resonances in the frequency range from 24Hz to 30Hz.

Based on these resonance effects, the nonlinear variation of MSB peaks with loads can be
understood as a combined effect of the load damper and torsional resonance. For fr1 component, its
peak starts with lower amplitude at 13% load. When the load increases to 30%, the frequency value
decreases and moves closer to its resonance, which results in the maximum MSB peak. As the load
increases further, the frequency moves even lower and moves away from the resonant point, which
results in lower MSB amplitudes. In a similar way the component at fr2 shows the highest at 31% load
where a second resonance may exist.
Figure 4. Frequency contents of motor current MSB results.
5.3. Gear tooth breakage diagnosis
From Figure 5 (a) and (b), it can also be seen that baseline MSB amplitudes at fr1 and fr2 are very
different between the two gear sets. In particular, the amplitude of Gear10 is several times higher than
that of Gear01 due to inherent manufacture errors. However, compared with the baseline for each gear
set, MSB peaks at fr1 for corresponding faulty cases and becomes higher under nearly all load
conditions. However, peaks at fr2 show an increase in a fewer cases. In addition, the amplitude
0 5 10 15 20 25 30 35 40 45 500
0.002
0.004
0.006
0.008
0.01(a) MSB at 50Hz-Gear07 at Load 20%
Frequency(Hz)
Am
plit
ude(A
2)
fr1
fr2
Baseline
Tooth Breakage
0 5 10 15 20 25 30 35 40 45 500
1
2
3
4
5x 10
-5 (b) MSB at 50Hz
Frequency(Hz)
Am
plit
ude(A
2)
1xfr
3
2xfr
3
4xfr
3
1xfr
2-1
xfr
1
2xfr
1-1
xfr
2
Bar P
ass
Fre
q.
0 5 10 15 20 25 30 35 40 45 500
0.2
0.4
0.6
0.8
1(c) MSB Coherence at 50Hz
Frequency(Hz)
Am
plit
ude
distribution with loads also shows a distinctive difference. These show that the faulty cases can be
differentiated from their baseline in spite of the high manufacturing error.
However, because the peaks value of Gear10 are much higher than that of Gear01, it is difficult to
tell which gear set has a severe fault using peak value directly. Instead, relative changes have to be
employed for measuring the severity. Figure 5 (c) and (d) show relative changes with load at fr1 and
fr2 respectively. It can be seen that the changes at fr1 are much higher, compared with that at fr2,
showing that the fault is located at shaft 1. Moreover the changes of Gear01 at fr1 are higher than that
of Gear10, showing that the fault at Gea01 is severe.
Figure 5. Gear tooth breakage diagnosis under different loads.
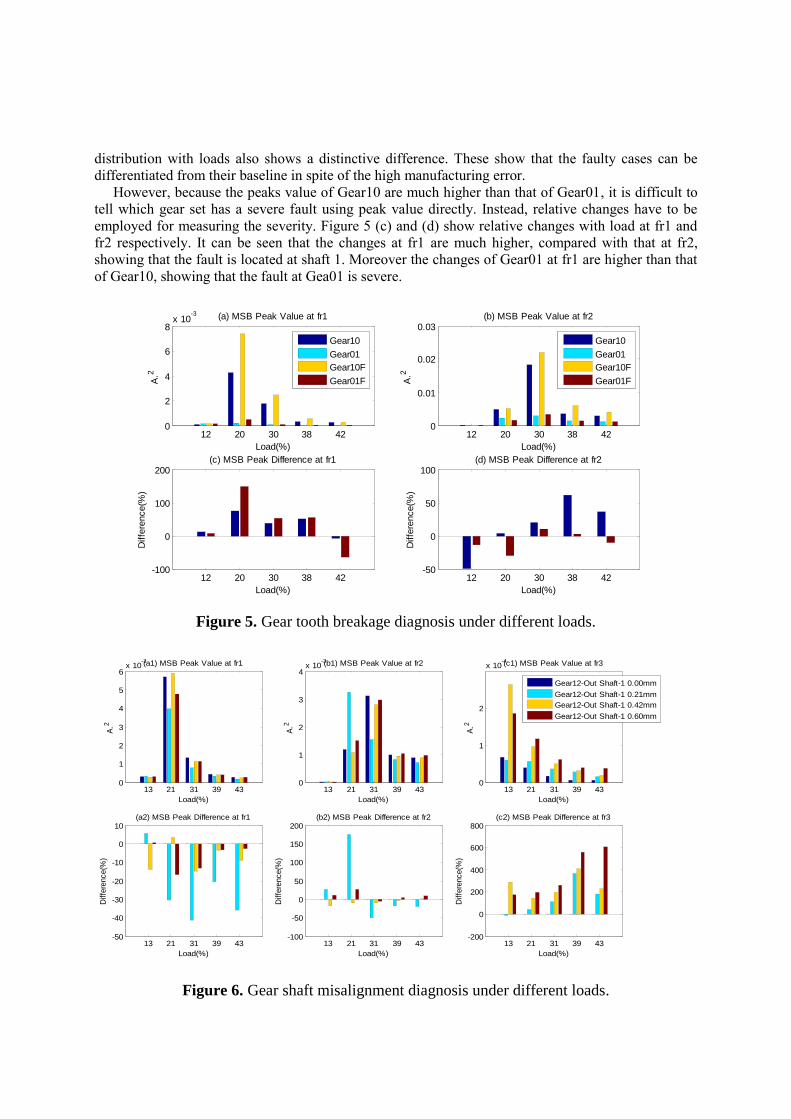
Figure 6. Gear shaft misalignment diagnosis under different loads.
12 20 30 38 420
2
4
6
8x 10
-3
Load(%)
A.2
(a) MSB Peak Value at fr1
Gear10
Gear01
Gear10F
Gear01F
12 20 30 38 42-100
0
100
200(c) MSB Peak Difference at fr1
Diffe
rence(%
)
Load(%)
12 20 30 38 420
0.01
0.02
0.03
Load(%)
A.2
(b) MSB Peak Value at fr2
Gear10
Gear01
Gear10F
Gear01F
12 20 30 38 42-50
0
50
100(d) MSB Peak Difference at fr2
Diffe
rence(%
)
Load(%)
13 21 31 39 430
1
2
3
4
5
6x 10
-3(a1) MSB Peak Value at fr1
A.2
Load(%)
13 21 31 39 43-50
-40
-30
-20
-10
0
10(a2) MSB Peak Difference at fr1
Diffe
rence(%
)
Load(%)
13 21 31 39 430
1
2
3
4x 10
-3(b1) MSB Peak Value at fr2
A.2
Load(%)
13 21 31 39 43-100
-50
0
50
100
150
200(b2) MSB Peak Difference at fr2
Diffe
rence(%
)
Load(%)
13 21 31 39 430
1
2
x 10-4(c1) MSB Peak Value at fr3
A.2
Load(%)
Gear12-Out Shaft-1 0.00mm
Gear12-Out Shaft-1 0.21mm
Gear12-Out Shaft-1 0.42mm
Gear12-Out Shaft-1 0.60mm
13 21 31 39 43-200
0
200
400
600
800(c2) MSB Peak Difference at fr3
Diffe
rence(%
)
Load(%)

5.4. Gear shaft misalignment diagnosis
To confirm the diagnostic performance, successive misalignments are induced to the end of output
shaft end by adding different thicknesses of washers underneath the base of gearbox. Because of the
rigid coupling connections, the misalignment will cause load oscillations at 1X. As shown in Figure 6
(c1) MSB peaks at fr3 increase gradually with the degrees of misalignments. However, the peaks at fr1
and fr2 do not show such a gradual increase change. This may show that the fault is located at shaft 3.
This can be further confirmed by the relative changes presented in graphs of the bottom row.
Especially, relative changes at fr3 also show the gradual changes but with a much higher amplitude.
On the other hand, the changes at fr1 and fr2 are small. This conforms further that the fault is at shaft 3
and that MSB of current measurement is able to produce a good detection and diagnosis of different
mechanical faults.
6. Conclusion
Mechanical faults occurring in an electrical motor drive result in a modulation effect to current signals.
However, the modulating component is very small and difficult to be estimated accurately by
conventional power spectrum analysis.
The modulation signal bispectrum (MSB) suggested in this paper is able to include the phase
effects of modulating components and hence suppress noise influences to obtain an accurate
estimation of the modulating components.
Experimental study based on a 10kw two stage gearbox driven by a three phase induction motor,
shows that MSB peaks at different rotational frequencies can be used to quantify the severity of gear
tooth breakage and the degree of shaft misalignment. In addition, the type and location of a fault can
be determined based on the frequency at which the relative change of MSB peak is the highest among
different rotational frequencies.
References
[1] Benbozid M H 2000 A review of induction motor signature analysis as a medium for fault
detection IEEE. transactions on industrial electronics vol. 47 no. 5 pp 984-993
[2] Kar C and Mohanty A R 2004 Monitoring gear vibrations through motor current signature
analysis and wavelet transform, Mechanical Engineering Department, Indian Institute of
Technology, Kharagpur, 721 302. India.
[3] Kia, S.H.;Henao, H.;Capolino, G.A., 2007,Gearbox Monitoring Using Induction Machine
Stator Current Analysis,: Diagnostics for Electric Machines, Power Electronics and Drives,
SDEMPED,
[4] Rgeai M 2007 Helical gearbox fault detection using motor current signature analysis. PhD
Thesis. University of Manchester.
[5] Naid A 2009 Fault detection and diagnosis of reciprocating compressors using motor current
signature analysis. PhD Thesis. University of Huddersfield.
[6] Naid A, Gu F S, Yimin Hu, Al-Arbi, S and Ball A 2009 Bispectrum Analysis of Motor
Current Signals for Fault Diagnosis of Reciprocating Compressors. Key Engineering
Materials, 413-41. pp. 505-511. ISSN 1013-9826
[7] Gu F S, Y Hu, N Naid A and Ball A 2011 Electrical motor current signal analysis using a
modified bispectrum for fault diagnosis of downstream mechanical equipment, Mechanical
Systems and Signal Processing ,Vol. 25, no. 1,ISSN 0888-3270
[8] Obaid R R, Habetler T G and Tallam R M 2003. Detecting load unbalance and shaft
misalignment using stator current in inverter-driven induction motors, IEEE int. Elec. Mach.
and Drives Conf., pp1454-1458.
[9] Bellini A, Filippetti F, Franceschini G, Tassoni C, and Kliman G B 2001 Quantitative
evaluation of induction motor broken bars by means of electrical signature analysis IEEE.
Transactions on Industry Applications, Vol. 37, No. 5, pp 1248-1255.
[10] Jouny I and Morese R L 1994 Bispectra of modulated stationary signals IEE. Electronics

Letters Vol.30 No. 18 1994 pp. 1465-1466.
[11] Wong D, Clifton D A and Tarassenko L An introduction to the bispectrum for EEG analysis.
Biomedical Signal Processing Group. Institute of Biomedical Engineering. University of
Oxford. Oxford UK.
[12] Collis W B, White P R and Hammond J K 1997 Higher-Order Spectra: The Bispectrum and
Trispectrum. Mechanical Systems and Signal Processing Vol. 12 No.3 pp. 375-394.
[13] Jouny I and Morese R L 1994 Bispectra of modulated stationary signals IEE. Electronics
Letters Vol.30 No. 18. 1994 pp. 1465-1466.