university of huddersfield repositoryeprints.hud.ac.uk/25431/1/aboajela final thesis july24.pdf1 the...
TRANSCRIPT
University of Huddersfield Repository
Aboajela, Samia Mohamed
The Influence of Organisational Culture on Performance Measurement Systems in Libyan Higher Education
Original Citation
Aboajela, Samia Mohamed (2015) The Influence of Organisational Culture on Performance Measurement Systems in Libyan Higher Education. Doctoral thesis, University of Huddersfield.
This version is available at http://eprints.hud.ac.uk/id/eprint/25431/
The University Repository is a digital collection of the research output of theUniversity, available on Open Access. Copyright and Moral Rights for the itemson this site are retained by the individual author and/or other copyright owners.Users may access full items free of charge; copies of full text items generallycan be reproduced, displayed or performed and given to third parties in anyformat or medium for personal research or study, educational or notforprofitpurposes without prior permission or charge, provided:
• The authors, title and full bibliographic details is credited in any copy;• A hyperlink and/or URL is included for the original metadata page; and• The content is not changed in any way.
For more information, including our policy and submission procedure, pleasecontact the Repository Team at: [email protected].
http://eprints.hud.ac.uk/
1
The Influence of Organisational Culture on Performance Measurement
Systems in Libyan Higher Education
Samia Mohamed Aboajela
A Thesis Submitted to the University of Huddersfield in
Partial Fulfilment of the Requirements for the Degree of
Doctor of Philosophy
The University of Huddersfield
University of Huddersfield Business School
2015
2
Abstract
This research attempts to study the influence of organisational culture (OC) on the acceptance,
importance and use of performance measurement systems (PMS) in Libyan higher education. To
achieve the objectives of this research, a contingency theory is adopted. Organisational culture as a
contingent variable was identified from the literature and appropriate statistical tests were undertaken
to ascertain its influence.
The organisational culture assessment instrument (OCAI) devised by Cameron & Quinn (2011) was
chosen to be the conceptual model for determining the organisational culture type of institutions. Using
the OCAI, an organisational culture profile could be verified by determining the organisation's
dominant culture type characteristics. The Competing Values Framework (CVF) model developed by
Cameron & Quinn (2011) was chosen to be a measurement tool for Organisational Culture (OC) to
examine aspects of dominant organisational culture types in the Libyan higher education sector.
A mixed methods (quantitative and qualitative) approach, involving a survey questionnaire and
interviews, was adopted. Descriptive statistics, which include frequencies and percentages, were
utilized to present the main characteristics of the sample, the profiles of organisations’ cultural types,
and the information gained in relation to the acceptance, importance and use of performance
measurement systems.
The sample of this study consists of three types of Libyan higher education (universities, higher
institutions and technical collages). The intended participant lists covered the entire population of all
groups in Libyan higher education.
The study revealed that the three types of Libyan higher education are not homogeneous. In addition,
the study showed that job titles and positions, experience and education levels are among the factors
that influence organisational culture and thereby PMS acceptance, importance and use. While Libyan
higher education in general, which includes public universities and technical colleges, was dominated
by a Hierarchy culture that favours a centralised management style, the private and higher institutions
were dominated by a Clan culture which is often found in ‘family-type’ organisations.
Hierarchy culture exhibited a significant negative direct relationship with the acceptance and
importance of performance measurement systems in Libyan universities. On the other hand, Clan

3
culture exhibited a significant negative direct relationship with the acceptance and use of performance
measurement systems in Libyan higher institutions.
The contingency theory of performance measurement systems is based on the assumption that there is
no universally appropriate use of performance measurement systems that applies equally to all
organisations in all circumstances and the findings of this thesis are consistent with this contingency
theory assumption. Therefore, organisational culture as a factor of contingency theory has influence on
some aspects of performance measurement systems and does not influence others, and this depends on
a given organisation’s circumstances.

4
Table of Contents
Abstract ........................................................................................................................................... 2
Table of Contents ............................................................................................................................. 4
List of Tables .................................................................................................................................... 9
List of Figures ................................................................................................................................. 17
Acknowledgments .......................................................................................................................... 18
Abbreviations ................................................................................................................................. 19
Chapter 1 : Introduction ................................................................................................................. 20 1.1 Chapter Outline .................................................................................................................................. 20 1.2 Background to the Study .................................................................................................................... 20 1.3 Study problem .................................................................................................................................... 23 1.4 Research Aim and Objectives .............................................................................................................. 25 1.5 Research Questions ............................................................................................................................ 25 1.6 The Need for the Research ................................................................................................................. 26 1.7 Research Framework .......................................................................................................................... 28 1.8 Research Methodology ....................................................................................................................... 29 1.9 Contribution to the knowledge ........................................................................................................... 30 1.10 Structure of the Thesis ...................................................................................................................... 32 1.11 Summary .......................................................................................................................................... 34
Chapter 2 : Literature Review -‐ Organisational Culture ................................................................... 35 2.1 Introduction ....................................................................................................................................... 35 2.2 Organisational Culture Definition and importance .............................................................................. 37 2.3 Measures of Organisational Culture ................................................................................................... 38 2.4 Typologies of Organisational Culture .................................................................................................. 41
2.4.1 Rowe, Mason, Dickel, Mann and Mockler’s organisational culture Typology ..................................... 41 2.4.1 Hellriegel, Jackson, Slocum, Staude, Amos, Klopper, Louw and Oosthuizen’s organisational culture typology ........................................................................................................................................................ 43 2.4.2 The Competing Values Framework (CVF) ............................................................................................ 45
2.5 Organisational Performance Types According to "Competing Values Framework CVF" ....................... 52 2.6 Strategy Formulation and Change of Organisational Culture ............................................................... 55 2.7 Organisational Culture and Performance Measurement Systems ........................................................ 58 2.8 Conceptual Model and Hypotheses ..................................................................................................... 60
2.8.1 Research Questions ............................................................................................................................. 61 2.8.2 Defining the Variables .......................................................................................................................... 62 2.8.3 The Conceptual Model of the Study .................................................................................................... 62 2.8.4 The Conceptual Model for Organisational Culture .............................................................................. 63
2.8.4.1 The Organisational Culture Assessment Instrument (OCAI) ......................................................................... 64 2.8.4.2 The competing values framework (CVF) ....................................................................................................... 66
2.9 Summary ............................................................................................................................................ 71
Chapter 3 : Literature Review for Contingency theory of Performance Measurement Systems ....... 72 3.1 Introduction ....................................................................................................................................... 72

5
3.2 Definition and Origins of Contingency Theory ..................................................................................... 72 3.3 The Contingency Theory of Performance Measurement ..................................................................... 74
3.3.1 Contingent Variable Categories ........................................................................................................... 76 3.4 Performance Measurement systems .................................................................................................. 78
3.4.1 Definition of Performance Measurement ........................................................................................... 80 3.5 Financial performance measurements ................................................................................................ 84
3.5.1 Non-‐Financial Performance measurement .......................................................................................... 86 3.6 Balanced Scorecard (BSC) ................................................................................................................... 88
3.6.1.1 Balanced Scorecard and Education ............................................................................................................... 89 3.7 The Performance Measurement Systems: Acceptance, Importance and Use ....................................... 91
3.7.1 PMS Acceptance .................................................................................................................................. 92 3.7.2 The Importance and Use of PMS ......................................................................................................... 94 3.7.3 Summary .............................................................................................................................................. 96
Chapter 4 : The Libyan Context ....................................................................................................... 97 4.1 Introduction ....................................................................................................................................... 97 4.2 Historical Background ......................................................................................................................... 97 4.3 The Libyan Environment and Population ............................................................................................ 97 4.4 Libyan Economy and Management ..................................................................................................... 98 4.5 Overview of the Libyan Education System .......................................................................................... 99 4.6 Higher Education in Libya ................................................................................................................... 99 4.7 Objectives of the Higher Education System in Libya .......................................................................... 103
4.7.1 Objectives of Libyan Universities ....................................................................................................... 103 4.7.2 Objectives of Libyan Higher Institutions ............................................................................................ 104
4.8 Financing of Libyan Higher Education ............................................................................................... 105 4.9 Accountability and Autonomy of Libyan Higher Education ................................................................ 106 4.10 Libyan Organisational Culture ......................................................................................................... 107 4.11 Summary ........................................................................................................................................ 109
Chapter 5 : Research Methodology ............................................................................................... 110 5.1 Introduction ..................................................................................................................................... 110 5.2 Research Questions .......................................................................................................................... 110 5.3 Development of the Hypotheses ...................................................................................................... 111
5.3.1 Hierarchy Culture ............................................................................................................................... 113 5.3.2 Clan Culture ....................................................................................................................................... 114 5.3.3 Adhocracy Culture ............................................................................................................................. 115 5.3.4 Market Culture ................................................................................................................................... 116
5.4 Research Methodology .................................................................................................................... 119 5.5 Research Philosophy ........................................................................................................................ 121 5.6 Research Approaches ....................................................................................................................... 123 5.7 Quantitative Research methods ....................................................................................................... 124
5.7.1 Research Strategies ........................................................................................................................... 125 5.7.2 Survey ................................................................................................................................................ 126 5.7.3 Research Design ................................................................................................................................. 126 5.7.4 Questionnaire Design ........................................................................................................................ 127 5.7.5 Research Population .......................................................................................................................... 128 5.7.6 Pilot Study .......................................................................................................................................... 129 5.7.7 Translation of the Questionnaire ....................................................................................................... 130

6
5.7.8 Data Collection .................................................................................................................................. 131 5.7.9 Mailing-‐Out of Questionnaires .......................................................................................................... 131 5.7.10 Follow-‐up and Questionnaire Collection ......................................................................................... 132 5.7.11 Questionnaire Data Analysis ............................................................................................................ 132 5.7.12 Response Rate ................................................................................................................................. 132 5.7.13 Organisational Culture Data Analysis ............................................................................................... 134 5.7.14 Performance Measurement Systems Data Analysis ........................................................................ 135 5.7.15 The Influence of PMS on OC Data Analysis ...................................................................................... 136
5.8 Qualitative Research Methods .......................................................................................................... 138 5.8.1 Qualitative Research Design: The Case Study .................................................................................... 139 5.8.2 Descriptive of the Interviews Sample ................................................................................................ 139 5.8.3 Data Collection: The interview methods ........................................................................................... 140 5.8.4 Structured interview .......................................................................................................................... 141 5.8.5 Semi-‐Structured Interview ................................................................................................................. 141 5.8.6 Source of Data ................................................................................................................................... 142 5.8.7 Interview data Analysis ...................................................................................................................... 142
5.9 Validity and Reliability ...................................................................................................................... 143 5.10 Summary ........................................................................................................................................ 145
Chapter 6 : Organisational Culture and Performance Measurement Systems Results ................... 146 6.1 Introduction ..................................................................................................................................... 146 6.2 Respondents' Profile in General ........................................................................................................ 146
6.2.1 Organisational Culture Profile by Job Title and Position .................................................................... 149 6.2.2 Organisational Culture Profile by experience and education level .................................................... 150 6.2.3 Organisational Culture Profile by Institution Type ............................................................................ 153
6.3 Organisational Culture Profile .......................................................................................................... 154 6.3.1 Higher Education Organisational Culture .......................................................................................... 154 6.3.2 Universities’ Organisational Culture Types ........................................................................................ 159
6.3.2.1 Public Universities’ Organisational Culture Type ........................................................................................ 159 6.3.2.2 Private Universities’ Organisational Culture Type ...................................................................................... 161
6.3.3 Higher Institutions’ Organisational Culture Type .............................................................................. 162 6.3.4 Technical Colleges’ Organisational Culture Type ............................................................................... 163 6.3.5 Organisational Culture Type in Public and Private Universities ......................................................... 165
6.4 Interviews Results for Organisational Culture Profile ........................................................................ 166 6.4.1 Interviewees' Profile in General ........................................................................................................ 167 6.4.2 Organisational Culture Profile ........................................................................................................... 168
6.5 Performance Measurement Systems Profile ..................................................................................... 170 6.5.1 Performance Measurement Systems acceptance and Influence on Organisational Performance ... 171
6.5.1.1 Financial Performance Measurement system ............................................................................................ 171 6.5.1.2 Non-‐Financial Performance Measurement Systems .................................................................................. 172 6.5.1.3 Advanced Techniques of Performance Measurement Systems ................................................................. 173 6.5.1.4 Effectiveness of Using Advanced Techniques of Performance Measurement Systems ............................. 173 6.5.1.5 Using Performance Measurement Systems ................................................................................................ 174 6.5.1.6 Summary Performance Measurement Systems acceptance and Influence on Organisational Performance ................................................................................................................................................................................ 174
6.5.2 Importance of Performance Measurement Systems ......................................................................... 175 6.5.2.1 Importance of financial performance measurement systems .................................................................... 175 6.5.2.2 Importance of Non-‐Financial Performance Measurement Systems: Customer Satisfaction ..................... 176
7
6.5.2.3 Importance of Non-‐Financial Performance Measurement Systems: Innovation ....................................... 177 6.5.2.4 Importance of Non-‐Financial Performance Measurement Systems: Employee ......................................... 177 6.5.2.5 Importance of Non-‐Financial Performance Measurement Systems: Quality ............................................. 178 6.5.2.6 Importance of Non-‐Financial Performance Measurement Systems; Community ...................................... 178 6.5.2.7 Summary of Financial and Non-‐Financial Performance Measurement Systems Importance .................... 179
6.5.3 Use of performance measurement system ....................................................................................... 180 6.5.3.1 Financial Performance Measurement Systems Use ................................................................................... 180 6.5.3.2 Use of Non-‐Financial Performance Measurement Systems: Customer Satisfaction .................................. 181 6.5.3.3 Use of Non-‐Financial Performance Measurement Systems: Innovation .................................................... 181 6.5.3.4 Use of Non-‐Financial Performance Measurement Systems: Employee ..................................................... 182 6.5.3.5 Use of Non-‐Financial Performance Measurement Systems: Quality .......................................................... 182 6.5.3.6 Use of Non-‐Financial Performance Measurement Systems: Community ................................................... 183 6.5.3.7 Summary of Financial and Non-‐Financial Performance Measurement Systems Used to Evaluate Libyan Higher Education Performance ............................................................................................................................... 184
6.6 Summary .......................................................................................................................................... 185
Chapter 7 : The Influence of Organisational Culture on Performance Measurement Systems Results .................................................................................................................................................... 186
7.1 Introduction ..................................................................................................................................... 186 7.2 Influence of Organisational Culture on (PMS) Acceptance in Libyan Higher Education ...................... 186
7.2.1 Influence of Organisational Culture on PMS acceptance in Libyan Universities ............................... 189 7.2.1.1 Influence of Organisational Culture on (PMS) acceptance in Libyan Public Universities ........................... 192 7.2.1.2 Influence of Organisational Culture on (PMS) acceptance in Libyan Private Universities ......................... 195
7.2.2 Influence of Organisational Culture on PMS acceptance for Higher Institutions in Libya ................. 198 7.2.3 Influence of Organisational Culture on (PMS) Acceptance for Public Technical colleges in Libya .... 201
7.3 Influence of Organisational Culture on Performance Measurement Systems Importance in Libyan Higher Education .................................................................................................................................... 204
7.3.1 Influence of Organisational Culture on PMS’s importance in Libyan Universities ............................ 207 7.3.1.1 Influence of Organisational Culture on (PMS) Importance in Libyan Public Universities ........................... 209 7.3.1.2 Influence of Organisational Culture on (PMS) Importance in Libyan Private Universities ......................... 212
Private Universities ........................................................................................................................................... 212 7.3.2 Influence of Organisational Culture on PMS’s importance for Higher Institutions in Libya .............. 215 7.3.3 Influence of Organisational Culture on PMS’s importance for Public Technical colleges in Libya .... 218
7.4 Influence of Organisational Culture on Performance Measurement Systems Use in Libyan Higher Education ............................................................................................................................................... 220
7.4.1 Influence of Organisational Culture on PMS Use in Libyan Universities ........................................... 223 7.4.1.2 Influence of Organisational Culture on (PMS) Use in Libyan Public Universities ....................................... 225 7.4.1.3 Influence of Organisational Culture on (PMS) Use in Libyan Private Universities ...................................... 228
Private Universities ........................................................................................................................................... 229 7.4.2 Influence of Organisational Culture on PMS Use for Higher Institutions in Libya ............................. 231 7.4.3 Influence of Organisational Culture on PMS Acceptance for Public Technical colleges in Libya ...... 234
7.5 Summary .......................................................................................................................................... 237
Chapter 8 : Discussion of Research main findings ......................................................................... 238 8.1 Introduction ..................................................................................................................................... 238 8.2 Descriptive of the Survey Sample ..................................................................................................... 239 8.3 Research Questions, Objectives and Discussion ................................................................................ 240
8.3.1 Research objective one: Organisational Culture Types ..................................................................... 241 8.3.2 Research objective two: The Use of PMS .......................................................................................... 246
8.3.2.1 PMS Acceptance ......................................................................................................................................... 246
8
8.3.2.2 Performance Measurement Systems Importance and Use ........................................................................ 249 8.3.3 Research objective Three: Influence and role of Organisational Culture on Performance Measurement Systems ............................................................................................................................... 254
8.3.3.1 Results of the Testing Research of Hypotheses .......................................................................................... 254 8.3.3.2 Findings Related to the Research Hypotheses of Organisational Culture .................................................. 256 8.3.3.3 Results of Research Hypotheses Tests ........................................................................................................ 267 8.3.3.4 Findings Related to the Research Hypotheses of Organisational Culture in Different Job Titles, Positions and Levels of Education .......................................................................................................................................... 268
8.4 Summary .......................................................................................................................................... 270
Chapter 9 : Conclusion .................................................................................................................. 271 9.1 Introduction ..................................................................................................................................... 271 9.2 Research Aim, Objectives and Conclusions ....................................................................................... 271 9.3 Research contributions ..................................................................................................................... 277
9.3.1 Contributions to Knowledge and Theory ........................................................................................... 277 9.3.2 Empirical and Practical Contributions ................................................................................................ 278
9.4 Limitations ....................................................................................................................................... 278 9.5 Future Studies .................................................................................................................................. 279
Reference: .................................................................................................................................... 280 Appendix A .............................................................................................................................................................. 296 Appendix B: Thesis Questionnaire .......................................................................................................................... 300 Appendix C: An interview guide .............................................................................................................................. 309 Appendix D ............................................................................................................................................................. 314 Appendix E .............................................................................................................................................................. 326 Appendix F .............................................................................................................................................................. 333 Appendix G ............................................................................................................................................................. 375 Appendix H ............................................................................................................................................................. 428

9
List of Tables
Table 2:1 Classifications of organisational culture typologies ............................................................... 53
Table 2:2 Studies in Organisational Culture and Performance Measurement ........................................ 58
Table 2:3 Six Organisational Culture Dimensions ................................................................................. 65
Table 2:4 Studies Used the Competing Values Framework Model ........................................................ 68
Table 3:1 Contingency Theories Studies ................................................................................................ 74
Table 3:2 Contingency Factors Affecting Performance Measurement ................................................... 78
Table 4:1 Number of Students and Academic Staff Members in different Libyan Universities for the
Academic Year 2008-2009 ................................................................................................................... 102
Table 5:1 Research Steps ...................................................................................................................... 119
Table 5:2 A three dimensional framework for categorizing four scientific paradigms ........................ 122
Table 5:3 Major differences between deductive and inductive approaches to research ....................... 123
Table 5:4 Qualitative and Quantitative Research – A Comparison ...................................................... 125
Table 5:5 Libyan Public and Private Higher education ........................................................................ 129
Table 5:6 The Questionnaire Distribution and Response Rate ............................................................. 133
Table 5:7 Reliability Test Results ......................................................................................................... 144
Table 6:1 Job Title and Position ........................................................................................................... 147
Table 6:2 Experiences ........................................................................................................................... 147
Table 6:3 Education Level .................................................................................................................... 148
Table 6:4 Organisational Age ............................................................................................................... 148
Table 6:5 Types of Higher Education and Ownership .......................................................................... 149
Table 6:6 Experiences in the Current Job ............................................................................................. 150
Table 6:7 Experiences with the Current Organisation .......................................................................... 151
Table 6:8 Education Level .................................................................................................................... 152
10
Table 6:9 Percentage of Who Have the Dominant Culture Type ......................................................... 153
Table 6:10 The Dominating Organisational Culture Profile ................................................................. 155
Table 6:11 The Dominating of Organisational Culture type in Libyan Higher Education ................... 157
Table 6:12 Organisational Performance Type in Libyan Higher Education ........................................ 157
Table 6:13 Mean of Organisational Culture Dimensions in Higher Education .................................... 158
Table 6:14 Dominant Organisational Culture Type in Different Higher Education Organisations ..... 159
Table 6:15 Dominant Organisational Culture Type for Public Universities ........................................ 160
Table 6:16 Organisational Performance Type for Public Universities ................................................. 160
Table 6:17 Organisational Performance Type for private Universities ................................................ 161
Table 6:18 Organisational Performance Type for Private Universities ................................................ 161
Table 6:19 Dominant Organisational Culture Type for Higher Institutions ......................................... 162
Table 6:20 Organisational Performance Type for Higher Institutions ................................................. 163
Table 6:21 Dominant Organisational Culture Type for Technical Colleges ........................................ 164
Table 6:22 Organisational Performance Type for Technical Colleges ................................................. 164
Table 6:23 Organisational Culture Type for Public and Private Universities ...................................... 165
Table 6:24 Organisational Performance Type for Public and Private Universities .............................. 165
Table 6:25 Job title and position ........................................................................................................... 167
Table 6:26 Experience .......................................................................................................................... 168
Table 6:27 Dominant Organisational Culture Type for University of Tripoli ...................................... 169
Table 6:28 Financial Performance Measurement Systems ................................................................... 172
Table 6:29 Non-Financial Performance Measurement Systems ........................................................... 172
Table 6:30 Advanced Techniques of Performance Measurement Systems .......................................... 173
Table 6:31 Effectiveness of Using Advanced Techniques of Performance Measurement Systems .... 173
Table 6:32 Useful of Using Performance Measurement Systems (e.g. Balanced Scorecard) .............. 174
11
Table 6:33 Summary ............................................................................................................................. 175
Table 6:34 Financial Performance Measurement Systems Importance ................................................ 176
Table 6:35 Non-Financial Performance Measurement Systems Importance: Customer Satisfaction .. 176
Table 6:36 Non-Financial Performance Measurement Systems Importance: Innovation .................... 177
Table 6:37 Non-Financial Performance Measurement Systems Importance: Employee ..................... 178
Table 6:38 Non-Financial Performance Measurement Systems Importance: Quality ......................... 178
Table 6:39 Non-Financial Performance Measurement Systems Importance/ Community .................. 179
Table 6:40 Summary of Financial and Non-Financial Performance Measurement Systems Importance
............................................................................................................................................................... 179
Table 6:41 Financial Performance Measurement Systems Use ............................................................ 180
Table 6:42 Non-Financial Performance Measurement Systems Use: Customer Satisfaction .............. 181
Table 6:43 Non-Financial Performance Measurement Systems Use: Innovation ................................ 182
Table 6:44 Non-Financial Performance Measurement Systems Use: Employee ................................. 182
Table 6:45 Non-Financial Performance Measurement Systems Use: Quality ..................................... 183
Table 6:46 Non-Financial Performance Measurement Systems Use: Community .............................. 183
Table 6:47 Summary of Financial and Non-Financial Performance Measurement Systems Used to
Evaluate Performance ........................................................................................................................... 184
Table 7:1 Dominant and Significant Organisational Cultures in Libyan Higher Education ................ 187
Table 7:2 Correlations and Significant Culture in Libyan Higher Education ....................................... 187
Table 7:3 Linear Regression Model for Organisational Culture in Libyan higher education .............. 188
Table 7:4 Model Summary ................................................................................................................... 189
Table 7:5 ANOVAa ............................................................................................................................... 189
Table 7:6 Dominant and Significant Organisational Cultures in Libyan Universities ......................... 190
Table 7:7 Correlations and Significant Culture in Libyan Universities ................................................ 190
12
Table 7:8 Linear Regression Model for Organisational Culture in Libyan Universities ...................... 191
Table 7:9 Model Summary ................................................................................................................... 192
Table 7:10 ANOVA .............................................................................................................................. 192
Table 7:11 The Dominant Culture Type for the Libyan Public Universities ........................................ 192
Table 7:12 Correlations and Significant Culture in Libyan Public Universities .................................. 193
Table 7:13 Linear Regression Model for Organisational Culture in Libyan Public Universities ......... 194
Table 7:14 Model Summary ................................................................................................................. 195
Table 7:15 ANOVA .............................................................................................................................. 195
Table 7:16 Dominant and Significant Organisational Cultures in Libyan Private Universities ........... 196
Table 7:17 Linear Regression Model for Organisational Culture in Libyan Universities .................... 197
Table 7:18 Model Summary ................................................................................................................. 198
Table 7:19 ANOVA .............................................................................................................................. 198
Table 7:20 Dominant and Significant Organisational Cultures for Higher Institutions in Libya ......... 199
Table 7:21 Correlations and Significant Culture for Higher Institutions in Libya ............................... 199
Table 7:22 Linear Regression Model for Organisational Culture for Higher Institutions in Libya ..... 200
Table 7:23 Model Summary ................................................................................................................. 201
Table 7:24 ANOVA .............................................................................................................................. 201
Table 7:25 Dominant and Significant Organisational Cultures for Public Technical colleges in Libya
............................................................................................................................................................... 201
Table 7:26 Correlations and Significant Culture for Public Technical colleges in Libya .................... 202
Table 7:27 Linear Regression Model for Organisational Culture for Public Technical colleges in Libya
............................................................................................................................................................... 203
Table 7:28 Model Summary ................................................................................................................. 204
Table 7:29 ANOVA .............................................................................................................................. 204

13
Table 7:30 Dominant and Significant Organisational Cultures in Libyan Higher Education .............. 205
Table 7:31 Correlations and Significant Culture in Libyan Higher Education ..................................... 205
Table 7:32 Linear Regression Model for Organisational Culture in Libyan Higher Education ........... 206
Table 7:33 Model Summary ................................................................................................................. 206
Table 7:34 ANOVAa ............................................................................................................................. 207
Table 7:35 Dominant and Significant Organisational Cultures in Libyan Universities ....................... 207
Table 7:36 Correlations and Significant Culture in Libyan Universities .............................................. 208
Table 7:37 Linear Regression Model for Organisational Culture in Libyan Universities .................... 208
Table 7:38 Model Summary ................................................................................................................. 209
Table 7:39 ANOVA for Libyan Universities ........................................................................................ 209
Table 7:40 The Dominant Culture Type for the Libyan Public Universities ........................................ 210
Table 7:41 Correlations and Significant Culture in Libyan Public universities ................................... 210
Table 7:42 Linear Regression Model for Organisational Culture in Libyan Public Universities ......... 211
Table 7:43 Model Summary ................................................................................................................. 211
Table 7:44 ANOVA .............................................................................................................................. 212
Table 7:45 Dominant and Significant Organisational Cultures in Libyan Private Universities ........... 212
Table 7:46 Correlations and Significant Culture in Libyan Private Universities ................................. 213
Table 7:47 Linear Regression Model for Organisational Culture in Libyan Universities .................... 214
Table 7:48 Model Summary ................................................................................................................. 214
Table 7:49 ANOVA .............................................................................................................................. 215
Table 7:50 Dominant and Significant Organisational Cultures for Higher Institutions in Libya ......... 215
Table 7:51 Correlations and Significant Culture for Higher Institutions in Libya ............................... 216
Table 7:52 Linear Regression Model for Organisational Culture for Higher Institutions in Libya ..... 216
Table 7:53 Model Summary ................................................................................................................. 217

14
Table 7:54 ANOVA .............................................................................................................................. 217
Table 7:55 Dominant and Significant Organisational Cultures for Public Technical colleges in Libya
............................................................................................................................................................... 218
Table 7:56 Correlations and Significant Culture for Public Technical colleges in Libya .................... 218
Table 7:57 Linear Regression Model for Organisational Culture for Public Technical colleges in Libya
............................................................................................................................................................... 219
Table 7:58 Model Summary ................................................................................................................. 220
Table 7:59 ANOVA .............................................................................................................................. 220
Table 7:60 Dominant and Significant Organisational Cultures in Libyan Higher Education .............. 220
Table 7:61 Correlations and Significant Culture in Libyan Higher Education ..................................... 221
Table 7:62 Linear Regression Model for Organisational Culture in Libyan Higher Education ........... 222
Table 7:63 Model Summary ................................................................................................................. 222
Table 7:64 ANOVAa ............................................................................................................................. 223
Table 7:65 Dominant and Significant Organisational Cultures in Libyan Universities ....................... 223
Table 7:66 Correlations and Significant Culture in Libyan Universities .............................................. 224
Table 7:67 Linear Regression Model for Organisational Culture in Libyan Universities .................... 224
Table 7:68 Model Summary ................................................................................................................. 225
Table 7:69 ANOVA for Libyan Universities ........................................................................................ 225
Table 7:70 The Dominant Culture Type for the Libyan Public Universities ........................................ 226
Table 7:71 Correlations and Significant Culture in Libyan Public universities ................................... 226
Table 7:72 Linear Regression Model for Organisational Culture in Libyan Public Universities ......... 227
Table 7:73 Model Summary ................................................................................................................. 228
Table 7:74 ANOVA .............................................................................................................................. 228
Table 7:75 Dominant and Significant Organisational Cultures in Libyan Private Universities ........... 229
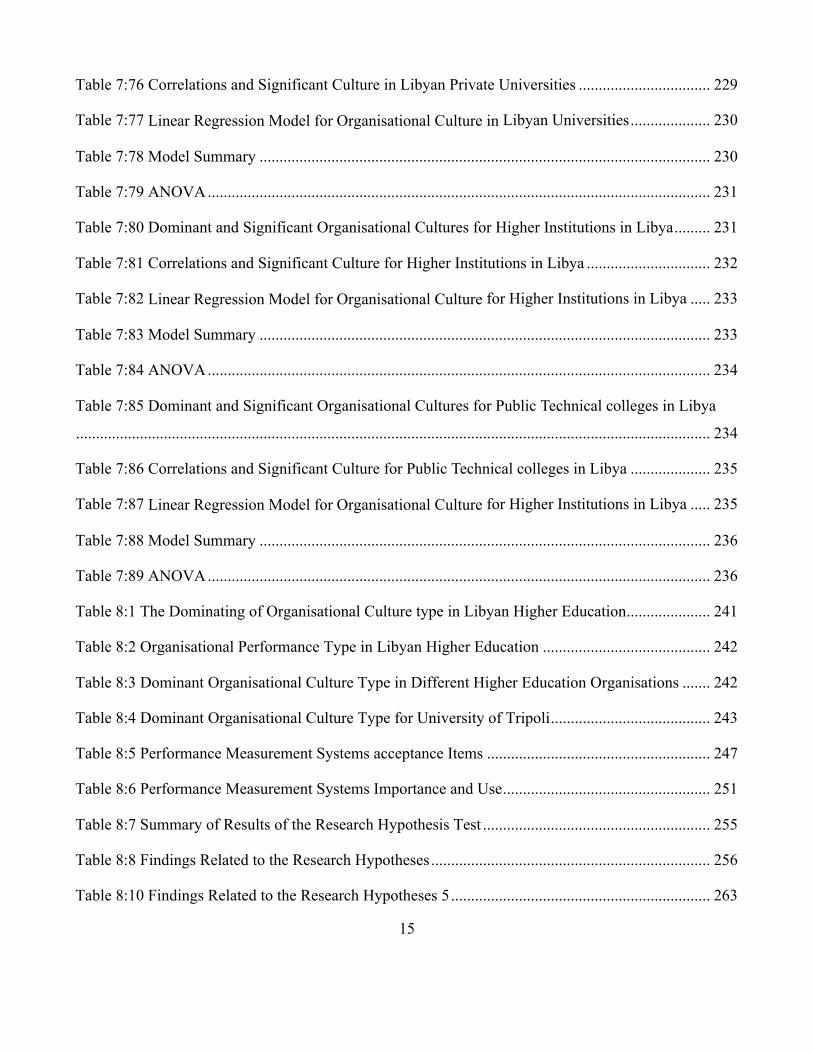
15
Table 7:76 Correlations and Significant Culture in Libyan Private Universities ................................. 229
Table 7:77 Linear Regression Model for Organisational Culture in Libyan Universities .................... 230
Table 7:78 Model Summary ................................................................................................................. 230
Table 7:79 ANOVA .............................................................................................................................. 231
Table 7:80 Dominant and Significant Organisational Cultures for Higher Institutions in Libya ......... 231
Table 7:81 Correlations and Significant Culture for Higher Institutions in Libya ............................... 232
Table 7:82 Linear Regression Model for Organisational Culture for Higher Institutions in Libya ..... 233
Table 7:83 Model Summary ................................................................................................................. 233
Table 7:84 ANOVA .............................................................................................................................. 234
Table 7:85 Dominant and Significant Organisational Cultures for Public Technical colleges in Libya
............................................................................................................................................................... 234
Table 7:86 Correlations and Significant Culture for Public Technical colleges in Libya .................... 235
Table 7:87 Linear Regression Model for Organisational Culture for Higher Institutions in Libya ..... 235
Table 7:88 Model Summary ................................................................................................................. 236
Table 7:89 ANOVA .............................................................................................................................. 236
Table 8:1 The Dominating of Organisational Culture type in Libyan Higher Education ..................... 241
Table 8:2 Organisational Performance Type in Libyan Higher Education .......................................... 242
Table 8:3 Dominant Organisational Culture Type in Different Higher Education Organisations ....... 242
Table 8:4 Dominant Organisational Culture Type for University of Tripoli ........................................ 243
Table 8:5 Performance Measurement Systems acceptance Items ........................................................ 247
Table 8:6 Performance Measurement Systems Importance and Use .................................................... 251
Table 8:7 Summary of Results of the Research Hypothesis Test ......................................................... 255
Table 8:8 Findings Related to the Research Hypotheses ...................................................................... 256
Table 8:10 Findings Related to the Research Hypotheses 5 ................................................................. 263

16
Table 8:11 Findings Related to the Research Hypotheses 6 ................................................................. 264
Table 8:12 Findings Related to the Research Hypotheses 7 ................................................................. 265
Table 8:13 Summary of Results of the Research Hypothesis Test ....................................................... 267
17
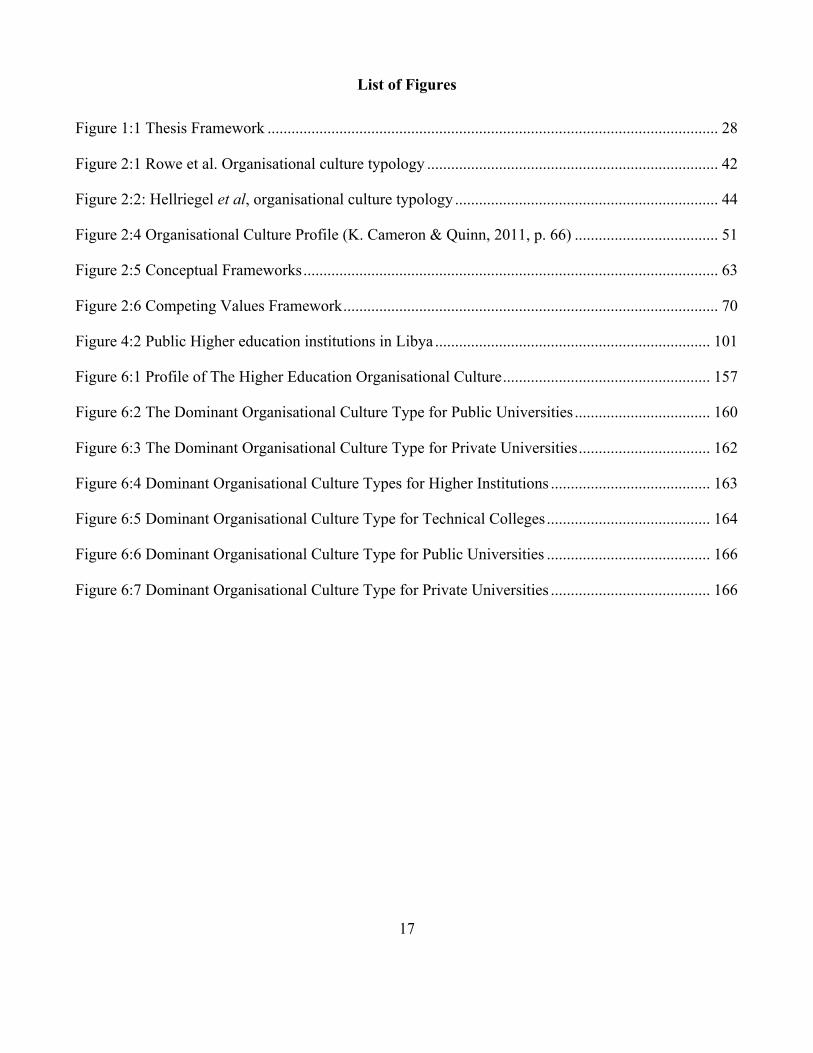
List of Figures
Figure 1:1 Thesis Framework ................................................................................................................. 28
Figure 2:1 Rowe et al. Organisational culture typology ......................................................................... 42
Figure 2:2: Hellriegel et al, organisational culture typology .................................................................. 44
Figure 2:4 Organisational Culture Profile (K. Cameron & Quinn, 2011, p. 66) .................................... 51
Figure 2:5 Conceptual Frameworks ........................................................................................................ 63
Figure 2:6 Competing Values Framework .............................................................................................. 70
Figure 4:2 Public Higher education institutions in Libya ..................................................................... 101
Figure 6:1 Profile of The Higher Education Organisational Culture .................................................... 157
Figure 6:2 The Dominant Organisational Culture Type for Public Universities .................................. 160
Figure 6:3 The Dominant Organisational Culture Type for Private Universities ................................. 162
Figure 6:4 Dominant Organisational Culture Types for Higher Institutions ........................................ 163
Figure 6:5 Dominant Organisational Culture Type for Technical Colleges ......................................... 164
Figure 6:6 Dominant Organisational Culture Type for Public Universities ......................................... 166
Figure 6:7 Dominant Organisational Culture Type for Private Universities ........................................ 166

18
Acknowledgments
I first and foremost extend my thanks to Almighty Allah for His direction and blessings that
inaugurated my project by granting me the knowledge, power, time and health to achieve my study
objectives.
This doctoral thesis could not have been accomplished without the inspiration and encouragement of
numerous dedicated people and agencies, who have each contributed in their own way to the
completion of this thesis. I would like to express my deepest thanks and gratitude to my supervisors,
who dedicated their precious time and efforts to help me achieve what I feel proud of today. They have
been generous with their guidance, support, advice, and valuable, critical and insightful comments and
suggestions, especially about the initial drafts of each chapter of this thesis. My thanks go to Dr John
Anchor and Dr Olu Aluko.
I would also like to thank all the members of the teaching staff of the Business School at the University
of Huddersfield for their assistance, kindness, and productive discussions and cherished advice. I also
highly appreciate the companionship, care and support of my doctoral colleagues. My appreciation also
goes to Zaitona University for granting me a scholarship to pursue my PhD research. I would also like
to record my thankfulness to the participants who completed the questionnaires, for their insightful
contribution to the research.
My special thanks go to my mother Kamila, for her prayers and constant encouragement throughout my
study, and to my beloved small family, my husband Abdussalam for his backing, tolerance and
physical and emotional assistance during our life and especially during the period of this research.
Profound thanks also go to my children, Hanin, Roubeen and Mohamed, for their patience during my
study and to my sister for her support, encouragement and understanding. They have all overwhelmed
me and may Allah reward all of them.

19
Abbreviations
PMS Performance measurement systems
FPMS Financial Performance measurement systems
Non-FPMS Non- Financial Performance measurement systems
BSC Balanced scorecard
CVF Competing Values Framework
OC Organisational Culture
CC Clan Culture
AC Adhocracy Culture
MC Market Culture
HC Hierarchy Culture
GDP Gross Domestic Product
OCAI The organisational culture assessment instrument
JIT Just-in-Time
TQM Total Quality Management
ORG Organisation
MHE Ministry of Higher Education

20
Chapter 1: Introduction
1.1 Chapter Outline
The purpose of this introductory Chapter is to present the background to the study and to provide a
rationale for pursuing the issue of the correlation between organisational culture (OC) and performance
measurement systems (PMS). The aims, objectives and research question are established. In addition,
the need for the research, the research framework, and the contributions to existing knowledge is
presented. Thereafter, a brief indication of the proposed research methodology is provided, and this is
followed by an outline of the structure of the thesis.
1.2 Background to the Study
The low levels of performance of various public sector establishments in developing countries is
attributable to numerous cultural, economic, social, political, technical and other reasons which
obstruct the administrative authority from playing its role in an efficient and effective manner. The
majority of these reasons were identified through a number of studies and analyses in an attempt to
reach to a logical scientific interpretation, which accurately defines the problems, which prevent the
public sector from playing its role properly. But the aspects of organisational culture with regard to the
personnel and those in charge of the public sector units have not received sufficient attention in spite of
the findings in a number of the world’s countries that confirmed the feasibility of studying
organisational culture and its positive effect on the level of organisational performance.
Organisational culture represents a set of common values of knowledge, traditions, customs, ethics and
behavioural forms, which control the interactions between the organisation’s personnel and
stakeholders outside the organisation. It may be a strength or weakness depending on its impact on the
behaviour of the organisation’s personnel. The human being is considered to be the main theme of this
study, which involves an analysis of the prevailing cultural system, since human resources are the basis
of development and are responsible for implementation of the strategic plans of any organisation.
This research attempts to study the influence of organisational culture on the acceptance, importance
and use of performance measurement systems and the relationship of these systems to organisational
performance in Libyan higher education.
Non-profit organisations in sectors such as education, public health care, charities, civil society and
social enterprise, aim to offer a service and a benefit, and do not aim to maximise profit. Public and
21
private higher education institutions and universities in Libya are a few of the non-profit organisations
discussed in this thesis. Al-Turki & Duffuaa (2003) discuss the important role that education
institutions play development; they support global development strategies with the necessary highly
qualified manpower and research.
Elferjani et al (2011) argue that the increase in the number of Libyan higher education institutions can
be attributed to the increase in oil revenues which gave Libya the opportunity to accelerate the
development of education, as well as the restructuring and reform of the education system in 1980
under what was known as the New Structural Plan for Education.
On the other hand, the graduates of the education system in Libya in all disciplines are neither
sufficiently knowledgeable nor trained to be productive, and usually need extensive retraining to
improve themselves (Libya Business Executive Survey, 2005, cited in Porter and Yergin, (2006, p.
119). Moreover, there are no links between research institutions and companies in Libya, resulting in
the Global Competitiveness Report (GCR) ranking Libya 113 among 144 countries in university
research association / industry; this demonstrates a serious disjunction between the education system
and the labour market.
The poor quality of the Libyan higher educational system is a justification for this research. There is a
consensus that the quality of Libyan higher education is not good. According to the GCR (World
Forum, 2013) the Libyan higher educational system performs poorly and Libya ranks 113th out of 144
countries. Libyan higher educational institutions need to evaluate their performance, which requires the
acceptance of performance measurement systems. Kaplan & Norton (1996c, p. 35; Kaplan Robert &
Norton David, 2001) have warned that the concentration should move by going beyond the financial
norms; in this research, this movement is oriented towards the non-financial indexes and proposes
several books of various domains in order to measure and evaluate performance which involves several
orientations like the balanced scorecard, which is within the scope of the non-financial indexes.
Therefore, the acceptance of a performance measurement system should focus on both financial and
non-financial aspects.
Neely (1999) argues that business performance measurement has become topical because of seven
main reasons: increasing competition; international and national quality awards; changing
organisational roles; the changing nature of work; changing external demands; specific improvement
initiatives; and the power of information technology.

22
A contingency theory theoretical framework of performance measurement has been adopted in this
research to investigate the contingent relationships between different factors in organisational culture
and the acceptance, importance and use of financial and non-financial performance measures, in an
attempt to understand performance measurement systems. This thesis builds on financial and non-
financial performance measurement systems. Otley (1980, p. 413) (1999, p. 367) states that:
“The contingency approach to management accounting is based on the premise that there is no
universally appropriate accounting system equally applicable to all organisations in all circumstances”
(Emmanuel, Merchant, & Otley, 1990, p. 57).
A performance measurement system is a component of management control systems and management
accounting. The purpose of management accounting is to provide information to people inside the
company. This information is used for planning and controlling the operations of the business.
Management accounting is usually divided into five areas: pricing, investment analysis, integration
with financial accounts, budgeting and performance measurement (G. M. D. Medori, 1998).
Performance measurement systems play a key role in organisations not only because of their
importance as a source of information about financial transactions and internal activities, but also due
to their effect on the monetary success of organisations (M. I. K. Zuriekat, 2005).
Murphy & Cleveland (1995) believe that research on culture will contribute to the understanding of
performance management. Magee (2002) contends that without considering the impact of
organisational culture, organisational practices such as performance management could be
counterproductive because the two are interdependent and change in one will impact the other.
Organisational culture is an important factor used to determine how well an employee fits into their
organisational context, and the importance of a good fit has been asserted (O'Reilly, Chatman, &
Caldwell, 1991; Silverthorne, 2004). Organisational culture could vary from country to country with
great differences in this aspect between developing and developed countries. Moreover, organisational
culture is one of the unique characteristics that differentiate successful firms from others (Cartwright &
Cooper, 1996). Schneider (2000) argues that understanding organisational culture is important for
organisational success in the business environment and a vital task for leaders within organisations
because it has an influence on planned growth, productivity, adopting new systems, and future changes
of the organisation. With the rapid transformation of economies, the impact of globalisation, and
increasing multinational business cooperation, organisational culture is more important today than ever
23
before, as it has a crucial effect upon an organisation’s performance and ability to adopt changes
(Wilkins & Ouchi, 1983, p. 225). Schein (1985) argues that the actions, attitudes and assumptions of
individuals and organisations cannot be fully understood without an analysis and interpretation of
culture.
Many academics and researchers who have studied culture have defined culture differently, and have
developed different definitions according to their discipline and area of interest. Although there are many
definitions of organisational culture, nearly all definitions consist of a combination of values, beliefs,
and assumptions about proper, adequate, and acceptable behaviour that members of each organisation
consider important (Hofstede, 1991, 2001).
Schein (1992) indicates that basic beliefs form the main and most important feature of organisational
culture and defines it as follows:
A pattern of shared basic assumptions that the group learned as it solved its problems of external adaptation and internal integration, that has worked well enough to be considered valid and, therefore, to be taught to new members of the organisation as the correct way to perceive, think, and feel in relation to those problems (Schein, 1992, p. 12).
1.3 Study problem
The success of an organisation’s performance depends to a large extent on strategic analysis, which is
the first stage of the strategic planning, through a process of identifying the core elements in the
organisation’s internal and external environments. In each environment there are strengths, which
should be enhanced, and weaknesses that should be admitted and dealt with it. Organisational culture is
one the most important elements of the internal environment that leads, in its turn, to the development
of loyalty and making the personnel feel of their respective identification and stability. Various studies
point out that a successful establishment is that which exists on the basis of cooperation between the
personnel and a common understanding of the establishment’s message. Thus it is necessary to
emphasise the necessity of accordance and consistency between the prevailing organisational culture
and the strategic plans of the organisation, because inconsistency leads, in its turn, to an organisation’s
failure in executing its policies. Thus emerges the need to scrutinise the prevailing organisational
culture in order to understand its determinants and to try to amend replace the prevailing values in a
manner which helps them continue to develop according of the vast, rapid and continuous local and
international changes.

24
Any organisation needs to assess the development of its financial and non-financial performance in
order to determine its strengths or weaknesses. Medori (1998) states that the performance measurement
systems are one of the important areas of management accounting that play a major role in evaluating
the achievement of organisational objectives. Adriana (2004) argues that performance measurement,
although extensively studied, has been given relatively little consideration in terms of the factors that
influence the design of performance measurement systems. In order to achieve their objectives,
organisations mainly depend on performance measures to evaluate, control and improve processes, to
compare the performance of departments and teams, and to assess employees. Agnaia (1997) believes
that in Libya the whole area of management has historically been affected by the fact that aspects of
extended families, clans, tribes, villages and the Islamic religion characterise the social environment.
Moxham (2009) argues that though non-profit performance measurement is receiving increasing
academic and practitioner attention, the design of non-profit measurement systems has received limited
consideration.
Organisational culture is associated with an organisation’s sense of uniqueness, its aim, goals, mission,
values, and main ways of working and establishing shared beliefs (Cameron & Quinn, 1999).
Although, a review of the relevant literature pointed to some key research studies (Ramachandran,
Choy Chong, & Ismail, 2011; Vakkuri & Meklin, 2003) in the educational sector which examine the
relationship between the organisational culture and performance measurement system, these studies do
not examine the relationship between organisational culture and the acceptance, importance and use of
(financial and non-financial) a performance measurement system. Therefore, this study examines the
influence of organisational culture on the acceptance, importance and use of (financial and non-
financial) performance measurement systems in Libyan higher education.
In addition, (Schein, 2010) says that in the research of recent decades, the subject of organisational
culture has drowned those of anthropology, sociology, social psychology and cognitive psychology. It
has become a sought after research area and has become connected significantly with broader cultural
studies that have lately been generated by widespread globalisation. While several of the studies in the
literature that examined organisational culture have focused on industrial and commercial sectors such as
(Al-Hussari, 2006; Chow, 2002; Deshpande, Farley, & Webster, 1993; Rashid, Sambasivan, & Johari,
2003), there is very limited specific investigation done in the higher education sector such as
(Ramachandran et al., 2011; Vakkuri & Meklin, 2003).
25
The study problem is represented by the shortcomings of the higher education institutions and
universities in Libya in terms of the current performance of their role.
The purpose of this study is to explore and investigate the relationship and the influence of
organisational culture as an independent variable on the acceptance, importance and use of the financial
and non-financial performance measurement system as a dependent variable for Libyan higher
education.
1.4 Research Aim and Objectives
This research aimed to explore and investigate the influence of organisational culture on the
acceptance, importance and use of performance measurement systems in Libyan higher education and
to investigate the following objectives:
Objective 1: To identify the organisational culture types in Libyan higher education.
Objective 2: To identify the use of performance measurement systems in Libyan higher education.
Objective 3: To investigate the role of organisational culture in the use of performance measurement
systems in Libyan higher education.
1.5 Research Questions
The study adopted the exploratory research approach to explore the impact of the four organisational
culture types (Hierarchy, Clan, Adhocracy and Market) on the acceptance, importance and use of PMS
in Libyan higher education. The main and subsidiary questions for this research arise from gaps
existing in the literature concerning the relationships between organisational culture and PMS
acceptance, importance and use in Libyan higher education in general and in each type of Libyan
higher education in particular. This leads us to the following main research question:
What influence does organisational culture have on the acceptance, importance and use of
performance measurement systems in Libyan higher education?
Subsidiary questions are the following:
1. To achieve the first objective the researcher developed the following questions: What types
of organisational culture are found in Libya’s higher education system?
2. What types of organisational performance are found in Libya’s higher education system?

26
To achieve the second objective the researcher developed the following questions:
3. To what extent are performances measurement systems (financial, non-financial and advanced)
adopted in the Libyan higher education system?
4. To what extent are performance measurement systems considered important in the Libyan
higher education system?
5. To what extent are the performance measurement systems used in the Libyan higher education
system?
To achieve the third and fourth objectives the researcher developed the following questions:
6. What influence does organisational culture have on the acceptance of performance
measurement systems (PMS) in the Libyan higher education system?
7. What influence does organisational culture have on the importance of performance
measurement systems (PMS) in the Libyan higher education system?
8. What influence does organisational culture have on the use of performance measurement
systems (PMS) in the Libyan higher education system?
9. Do culture types differ for different job titles and positions and levels of education in the Libyan
higher education system?
To assess the influence of organisational culture on the acceptance of PMS, Cameron and Quinn’s
(1999; K. Cameron & Quinn, 2011) model was used. This model has six dimensions, namely:
Organisational Characteristics, Organisational Leadership, Management of Employees, Organisational
Glue, Strategic Emphasis, and Criteria of Success. Cameron and Quinn used a six dimensional model
for an analysis, which then helped them derive four organisational culture types. These are: Hierarchy
Culture, Clan Culture, Adhocracy Culture and Market Culture.
1.6 The Need for the Research
The most important justification for a study on organisational culture in the higher education system is
that institutions of higher education around the world are known to play a significant role in the
development of any nation's workforce and the economy in general; Libya is no exception. There are a
number of other factors that make this study an invaluable one, not least of which is the poor quality of
the Libyan higher educational system. According to the Global Competitiveness Report GCR (World
27
Forum, 2013), the Libyan educational system performs poorly and the report ranks Libya 113th out of
144 countries; therefore there is a need for a different performance measurement system (PMS) to
evaluate organisational performance.
The researcher's first contact with Libyan education dates back to 1996 when she worked as a teacher
in Libyan education. This experience helped the researcher to identify many of the difficulties and
challenges associated with the development of higher education in Libya.
On the other hand, an academic experience will widen the researcher's knowledge gather fieldwork
data easily, in particular, through conducting distribution of the questionnaire, and making the
interviews with various respondents.
One other simple reason for choosing this topic is the change in Libyan government policy to raise the
level of an international degree is the main objective of the Ministry of higher education, where the
Ministry with the support and structure of the Libyan universities until the cause procession. To raise
the level of Libya higher education should use financial and non-financial PMS to identify the currently
PMS used and to work on adding the useful and effective PMS to evaluate Libyan higher education.
In addition, different cultural environments require a different PMS to increase organisational success
(Eker & Eker, 2009). Therefore, managers have to define the existing organisational culture and design
a PMS relevant to that culture, because if there is an incompatibility between both, a designed system
can not achieve any success for their ultimate goal, which is to produce capable human resources in the
fields for which they attempt to prepare their students. Thus, the top management must be capable of
correct decision-making and designing a PMS for organisational culture. As Detert et al, (2000)
rightfully say, the dominant organisational culture can undermine management efforts before they can
begin. DeLong & Fahey (2000) also assert that while most managers instinctively recognize the
importance of culture , the rationalisation of the relationship of culture to existing management
objectives will be a mammoth task. This challenge has also inspired this study because a conducive
culture is needed for the acceptance of PMS in general, and advanced techniques in particular.
Therefore, an investigation into the types of OC in Libyan higher education will create the platform for
the planning and execution of organisation-wide management efforts for change, including the
acceptance of innovative strategies and practices such as PMS. Kotter & Heskett (1992) state that
culture is a critical factor in long-term financial success. Without cultural change, there is little hope for
improvement in organisational performance. Organisational culture as a significant contextual factor in

28
performance management is scarcely studied.
People are not aware of their culture until it is challenged or they experience a new culture. Most
organisational scholars and observers now recognise that organisational culture has a powerful effect
on the performance and long-term efficacy of organisations. Empirical research has demonstrated the
importance of culture in improving organisational performance (for reviews, refer to Cameron & Quinn
2011, Cameron and Ettington, 1988; Denison, 1990, Trice and Beyer, 1993). Cameron and Quinn
(1999) argue that understanding organisational culture is important because plans for any changes
which are adopted without considering organisational culture could normally have unforeseen and
usually negative consequences.
A strong, unique culture has the ability to reduce collective uncertainties (that is, facilitate a common
interpretation system for members), create social order (make clear to members what is expected),
create continuity (perpetuate key values and norms across generations of members), create a collective
identity and commitment (bind members together), and elucidate a vision of the future (energize
forward movement) (see Trice and Beyer, 1993).
Most organisational scholars and observers now recognize that organisational culture has a powerful
effect on the performance and long-term effectiveness of organisations. Empirical research has
produced an impressive array of findings demonstrating the importance of culture to enhancing
organisational performance (for reviews, see Cameron and Ettington, 1988; Denison, 1990; and Trice
and Beyer, 1993).
1.7 Research Framework
In order to address the above-mentioned problem and research questions, the researcher developed a
research design based on models from the organisational culture of Cameron and Quinn (1999; 2011).
Figure (1:1) shows the conceptual framework of this research as a theoretical model outlining the
relationship between the three important components: The first is concerned with four organisational
culture types, the second with the extent of usage of the performance measurement diversity, and the
third with Libyan higher education.
Figure 1:1 Thesis Framework
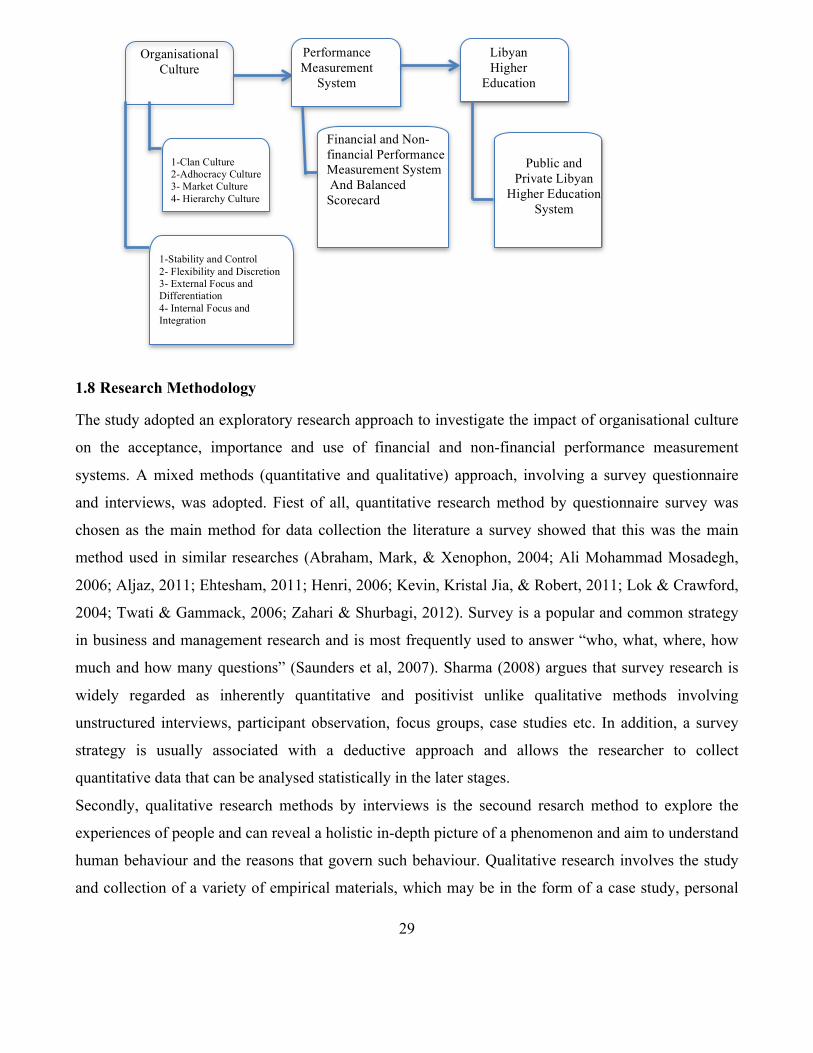
29
1.8 Research Methodology
The study adopted an exploratory research approach to investigate the impact of organisational culture
on the acceptance, importance and use of financial and non-financial performance measurement
systems. A mixed methods (quantitative and qualitative) approach, involving a survey questionnaire
and interviews, was adopted. Fiest of all, quantitative research method by questionnaire survey was
chosen as the main method for data collection the literature a survey showed that this was the main
method used in similar researches (Abraham, Mark, & Xenophon, 2004; Ali Mohammad Mosadegh,
2006; Aljaz, 2011; Ehtesham, 2011; Henri, 2006; Kevin, Kristal Jia, & Robert, 2011; Lok & Crawford,
2004; Twati & Gammack, 2006; Zahari & Shurbagi, 2012). Survey is a popular and common strategy
in business and management research and is most frequently used to answer “who, what, where, how
much and how many questions” (Saunders et al, 2007). Sharma (2008) argues that survey research is
widely regarded as inherently quantitative and positivist unlike qualitative methods involving
unstructured interviews, participant observation, focus groups, case studies etc. In addition, a survey
strategy is usually associated with a deductive approach and allows the researcher to collect
quantitative data that can be analysed statistically in the later stages.
Secondly, qualitative research methods by interviews is the secound resarch method to explore the
experiences of people and can reveal a holistic in-depth picture of a phenomenon and aim to understand
human behaviour and the reasons that govern such behaviour. Qualitative research involves the study
and collection of a variety of empirical materials, which may be in the form of a case study, personal
Organisational Culture
1-Clan Culture 2-Adhocracy Culture 3- Market Culture 4- Hierarchy Culture
Performance Measurement
System
Financial and Non-financial Performance Measurement System And Balanced Scorecard
Libyan Higher
Education
Public and Private Libyan
Higher Education System
1-Stability and Control 2- Flexibility and Discretion 3- External Focus and Differentiation 4- Internal Focus and Integration

30
experience, life story, interview, observation, and/or visual texts; these materials are used to describe
routine and problematic moments and meanings of facts, events, personalities and others (Denzin &
Lincoln, 2005).
Therefore, the research will mainly apply a quantitative approach to address the research objective and
questions, in order to assess the likely impacts of contingency theory factor (organisational culture) on
the acceptance, importance and use of the performance measurement systems in Libyan higher
education. In addition, the research will apply a qualitative research method to identify the OC type in
one of the Libyan higher education organisations to confirm one of the main objectives of this research,
in which the content emphasises the importance of organisational culture.
’Research method’ is relate to specific activities designed to generate data for questionnaires, and
‘research methodology’ is more about attitude and understanding of research and a strategy that will
answer questions on research (Greener, 2008). The methodology which is used in this study could be
described as a cross-sectional study adopting a quantitative approach conducted through a survey
questionnaire to investigate the specific contingency theory factor (organisational culture) on the
acceptance of performance measurement systems in Libyan higher education and their impact on
organisational performance.
Prior to data collection in the current research, a pilot study was planned and conducted using a
sample of 10 public and private sector employees with postgraduate certificates and a lot of experience
in education. This pilot study helped to clarify the issues that the researcher would face in preparing the
questionnaire. After that, the comments and suggestions they made were included in the final version
of the questionnaire. The researcher translated the questionnaire into Arabic, which was later checked
by an expert translator.
Data were analysed using the Statistical Package for Social Sciences (SPSS) version 20.0 for Mac
software. Descriptive statistics, which include frequencies and percentages, were utilized to present the
main characteristics of the sample and the profile of organisational culture and performance
measurement systems.
1.9 Contribution to the knowledge
Research in the Arab regions on cultural influences on performance measurement systems to date
has been very limited. Moreover, no general studies were found that incorporate organisational culture

31
and PMS acceptance, importance and use. Therefore, this study has contributed in general to the
literature on management accounting and particularly to bridging the gap in the knowledge about
performance measurement systems; this has specific implications for researchers and practitioners.
These aspects can be summarized as follows:
1- This study has been applied to the education sector in Libya, a developing country with context
and culture different to that of developed and western countries where most previous studies on
PMS have been conducted in sectors unrelated to education.
2- Due to the scarcity of the literature and studies on the influence of organisational culture and
performance measurement systems on higher education, the present study attempts to fill this
gap by addressing those issues.
3- It is an empirical test of contingency theory to investigate the influence of a contingency theory
factor (organisational culture) on the acceptance, importance and use of performance
measurement systems in Libyan higher education.
4- This study has produced results based on contingency theory and a defined conceptual model of
organisational culture in the Libyan education sector and its influence on PMS acceptance,
importance and use, providing a theoretical contribution to existing knowledge by expanding
the concept of OC in answering the research question.
5- This study is perhaps the first to compare four types of higher education in terms of
performance measurement systems, using four organisational culture variables.
6- This study had produced results for the Libyan education sector with a comparison of its types;
while previous studies in the Libyan context found that different sectors have the same OC type,
this study has found that OC types were different even within the same sector.
7- Investigation of the financial and non-financial PMS, and the balanced scorecard can be applied
in higher education.
8- This research may draw attention to the influence of organisational culture on PMS. Culture,
regardless of how powerfully it may be established, it is not stable or fixed, but may be changed
and affected by its environment.
9- The impact of the adopting performance measurement systems on higher education
organisations has been discussed in this study.
10- This study being the most recent to investigate the organisational culture profile within Libya,
32
with insights into the cultural values currently operating within the society, its findings are up to
date enough to be for new a PMS framework design to be implemented in Libyan higher
education.
1.10 Structure of the Thesis
This thesis is organised as follows:
Chapter One The purpose of this introductory Chapter is to present the background to the study and to
provide a rationale for pursuing the issue of organisational culture and performance measurement
systems. The aim and objectives of the research and the main research question are established in this
chapter. In addition, the need for the research, the framework of the research, and its contributions to
knowledge is presented. Thereafter, a brief indication of the research methodology is provided, and this
is followed by an outline of the structure of the thesis.
Chapter Two contains the critical review of the literature on organisational culture (OC), different
definitions of OC, measures of organisational culture. This chapter gives an overview of organisational
culture types, organisational culture and performance measurement systems, conceptual model and
hypotheses, research questions, and proceeds to define the variables, the conceptual model of the study,
the conceptual model for organisational culture, and the development of the hypotheses.
Chapter Three contains the critical review of the literature of performance measurement systems,
which includes: contingency theory of performance measurement, performance measurement systems
(PMS), different definitions of PMS, the financial / non-financial PMS, and the balanced scorecard.
Finally, this chapter proceeds to discuss the performance measurement systems acceptance, importance
and use.
Chapter Four The purpose of this chapter is to discuss the historical factors as well as those relating to
the environment, population, and political background of Libya, which influence the country’s current
HE environment. In doing this, the chapter provides an in-depth understanding of the Libyan education
system in general, and then proceeds to discuss Higher Education specifically.
Chapter Five discusses the methodology of this research. It describes the various aspects of this
research such as its philosophy, approach, strategy, design, population, pilot study and data collection
methods. It considers the validity and reliability of the methods of analysis employed to address the
aim and objectives of the research. At the end of this chapter is the description of the response rate.
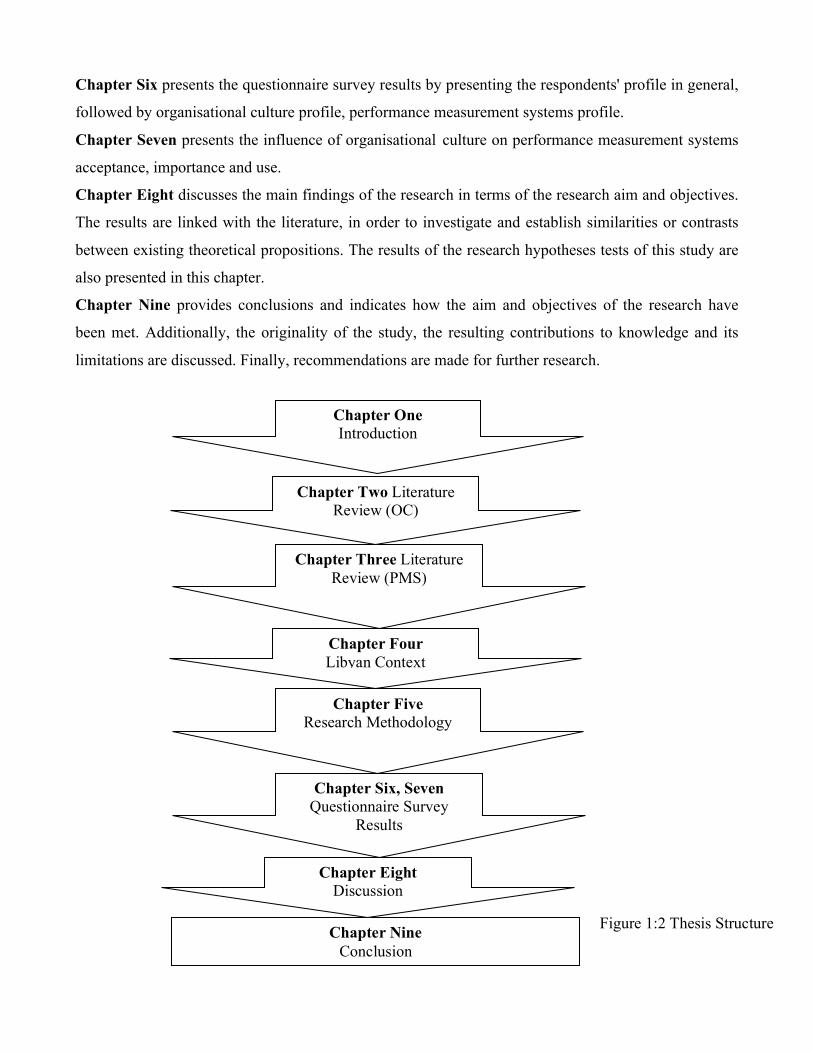
33
Chapter Six presents the questionnaire survey results by presenting the respondents' profile in general,
followed by organisational culture profile, performance measurement systems profile.
Chapter Seven presents the influence of organisational culture on performance measurement systems
acceptance, importance and use.
Chapter Eight discusses the main findings of the research in terms of the research aim and objectives.
The results are linked with the literature, in order to investigate and establish similarities or contrasts
between existing theoretical propositions. The results of the research hypotheses tests of this study are
also presented in this chapter.
Chapter Nine provides conclusions and indicates how the aim and objectives of the research have
been met. Additionally, the originality of the study, the resulting contributions to knowledge and its
limitations are discussed. Finally, recommendations are made for further research.
Chapter Nine Conclusion
Chapter One Introduction
Chapter Three Literature Review (PMS)
Chapter Four Libyan Context
Chapter Five
Research Methodology
Chapter Six, Seven Questionnaire Survey
Results
Chapter Eight Discussion
Chapter Two Literature Review (OC)
Figure 1:2 Thesis Structure

34
1.11 Summary This chapter serves as an introduction to the most important issues of the research study. It first
highlighted the background to the study and the essential problem of this research; it then came up with
an overview of the research aim and objectives. The main research question, the need of the research,
its framework, its contribution to existing knowledge and its structure has also been presented at the
end of this chapter. Since this study adopts an organisational culture theoretical framework, it is
discussed in more detail in the next chapter

35
Chapter 2: Literature Review - Organisational Culture
2.1 Introduction
The main purpose of a literature review of organisational culture is to give an overview of the concept
of organisational culture and its four types (Hierarchy culture, Clan culture, Market culture and
Adhocracy culture) as independent variables. This Chapter also describes the conceptual model for
organisational culture and the instrument for its assessment.
The organisational culture with regard to the acceptance of PMS in higher education, organisational
culture is a crucial area for research because of the ability of culture to affect motivation, behaviour and
performance. Cameron and Quinn (1999) argue that organisational culture is important because plans
for any changes adopted without including organisational culture would normally have unforeseen and
usually negative consequences.
Organisational culture is an important factor, which is used to determine how well an employee fits into
their organisational context, and it has been asserted that a good fit between the employee and their
organisation is important (O'Reilly et al., 1991; Silverthorne, 2004). Organisational culture is associated
with an organisation’s sense of uniqueness, its aim, goals, mission, values, and main ways of working
and establishing shared beliefs (K. Cameron & Quinn, 2011). While organisations have always had
cultures, few managers have been able to understand how to manage them (Druckman, Singer, & Harold
Van Cott, 1997). Many of the studies in the literature that examined organisational culture have focused
on industrial and commercial sector (Al-Hussari, 2006; Chow, 2002; Deshpande et al., 1993; Rashid et
al., 2003). Limited specific investigation has been conducted on the relationship between the
organisational culture and PMS in higher education organisations. Although, the literature pointed out
some studies in the educational sector which examine the relationship between the organisational culture
and PMS such as: (Ehtesham, 2011; Vakkuri & Meklin, 2003). These studies do not examine the
relationship between organisational culture and financial and non-financial PMS in the higher education
sector from the perspective of decision makers who use financial and non-financial PMS in their
organisations. For example, the main objective of the study of Ramachandran et al. (2011) was to provide
empirical insights from the perspective of faculty members on the differences between organisational
culture (OC) in private and public higher education institutions (HEIs) and to consequently pave an
avenue for cross-learning in order. Their study used the competing values framework (CVF), and found
36
that the faculty members perceive all the four OC types in public HEIs as being significantly different
those of private HEIs. On the other hand, this study of Ramachandran et al. (2011) is in the area of
private and public HEIs from the perspective of the members (decision makers) of financial and
administration sections in higher education; its objective is to provide empirical insights on the
differences and consequently pave an avenue for cross learning.
With the rapid transformation of economies, the impact of globalisation, and increasing multinational
business cooperation, organisational culture is more important today than ever before, as it has a crucial
effect upon an organisation’s performance and ability to adopt changes (Wilkins & Ouchi, 1983).
Organisational culture could be different from country to country, especially when comparing developing
and developed countries; each culture is unique, and this study tests the influence of organisational
culture in a developing country (Libya) to investigate which types of organisational culture influence the
acceptance, importance and use of PMS. Schneider (2000), as cited in Twati & Gammack (2006, p. 181),
argues that understanding organisational culture affects strategic development, productivity and learning
at all levels of management. Prior research on management control systems and culture has focused on
national culture instead of organisational culture such as (Awasthi, Chow, & Wu, 1998; Robert H.
Chenhall, 2003). There are few studies about organisational culture and PMS (Chee, Tim, & Anne, 2001;
Henri, 2006; M. Zuriekat, Salameh, & Alrawashdeh, 2011) especially in higher educational sector.
However, in recent years, the literature on organisational culture in business organisations has been
prolific. Henri (2006) in his study tests the relationships between organisational culture and two
attributes of PMS, namely the diversity of measurement and the nature of PMS use at manufacturing
firms.
Through archival data from Canada, Hong Kong, New Zealand, South Africa, United Kingdom and the
United USA, Boglarsky and Kwantes (2007) studied the perception that aspects of organisational
culture are associated with personal effectiveness and leadership. It was reported that organisational
culture was strongly associated with both leadership effectiveness and personal effectiveness. Jofreh
and Masoumi (2013) in their empirical investigation to find important factors influencing
organisational culture in a banking sector, adopted a questionnaire based on Denison’s organisational
culture dimensions and distributed it among different groups of employees who worked for an Iranian
bank. The survey concluded that while dimensions of job involvement and organisational mission were

37
in a better position compared with dimensions of compatibility and consistency, there was some
positive and meaningful correlation among all four components.
Many researchers e.g., (D. Denison, Haaland, & Goelzer, 2003) as cited in (Yilmaz & Ergun, 2008)
have called to investigate the phenomenon of organisational culture in different cultural contexts,
particularly in non-western nations (Ehtesham, 2011). According to Kandula (2006) the key to good
performance is a strong culture. Thus, it is important to investigate the influence of organisational
culture on the acceptance, importance and use of PMS. In the Cameron and Quinn (2011, p. 72)
framework, the strength of your culture is determined by the number of points awarded to a specific
culture type. The higher the score, the stronger or more dominant is that particular culture.
2.2 Organisational Culture Definition and importance
The term ‘organisational culture’ made its first appearance in the academic literature in an article in
Administrative Science Quarterly by Pettigrew (Hofstede, Neuijen, Ohayv, & Sanders, 1990;
Pettigrew, 1979). The concept of organisational culture has received increasing attention in recent years
both from academics and practitioners (Schein, 1990). In every organisation there are specific attitudes,
symbols, and beliefs that are taken for granted within that organisation (Schein, 1990). Many academics
and researchers who have studied culture have defined culture differently, and have developed different
definitions according to their discipline and area of interest. Although there are many definitions of
organisational culture, nearly all definitions consist of a combination of values, beliefs, and
assumptions about proper, adequate, and acceptable behaviour that members of each organisation
consider important (Hofstede, 1991, 2001).
As Bresnen and Marshall (2000) reiterate, “organisational culture is a complex and multifaceted
phenomenon that arises and develops through on-going social interaction among members of a
community. It is not simply something that can be imposed from on high, and frequently attempts to do
so simply provoke resistance or produce unintended and undesired consequences”.
Hofstede (1984) states that organisational culture can be defined as the values, attitudes, beliefs and
behaviours that represent an organisation’s working environment, organisational objective, and vision.
In addition, organisational culture refers to a set of shared values, belief, and assumptions and practices
that shape and guide the attitudes and behaviour of the members of the organisation. This definition is
consistent with the findings of Deshpande et al (1993), who reviewed more than 100 studies in
organisational culture. They defined organisational culture as a pattern of shared values and beliefs that

38
help individuals understand organisational functions and provide them the norm for the behaviour in
organisations (Aljaz, 2011). Culture is rooted in people and subconsciously influences their behaviour;
Culture affects their performance and vice versa – that is, performance is a factor that affects
organisational culture. Informally, such culture can be described as follows: “That’s the way we do it!”
or “The way things are done around here” (Lewis, 1995). Culture includes the different philosophies
and approaches to doing work within an organisation (Moore, 2002).
Pinto (2010) reveals four ways organisational culture can affect project management. First, it affects
how departments are expected to interact and support each other in the pursuit of project goals. Second,
it influences the level of employee commitment to the goals of the project in the context of balancing
them with other, potentially competing goals. Third, it influences project planning processes such as
the way work is estimated or how resources are assigned to projects. Finally, it how managers evaluate
the performance of project teams and how they view projects’ outcomes.
Denison (1984) believes that organisational culture includes: fundamental values and beliefs in
organisations; patterns of behaviour that come from shared values and symbols that link assumptions and
values; and the behaviour of members.
Schein (1992) indicates that basic beliefs form the main and most important feature of organisational
culture and defines it as follows:
“A pattern of shared basic assumptions that the group learned as it solved its problems of external
adaptation and internal integration, that has worked well enough to be considered valid and, therefore,
to be taught to new members of the organisation as the correct way to perceive, think, and feel in
relation to those problems (Schein, 1992, p. 12).”
Another definition was established by Cameron and Quinn (2011, p. 17) where “OC is reflected by what
is valued, the dominant leadership styles, the language and symbols, the procedures and routines, and the
definitions of success that make an organisation unique”.
As a consequence of globalization, understanding culture’s impact on the environment of a business or
of multinational corporations has attracted considerable research interest.
2.3 Measures of Organisational Culture
In order to better understand the concept of organisational culture, several studies have attempted to
measure it. Many researchers (Cameron & Quinn, 1999; Hofstede, 1980; Schein, 1985, 1992) have
studied organisational culture according to their varying interests, and hence, they have all developed
39
different measures and dimensions of organisational culture. In this section, a typology of eight models
and frameworks will be reviewed. Each scholar has his or her own ways of typifying organisational
culture, which may create both similarities and differences in comparisons.
The work of Ramachandran et al. (2011) and Deal and Kennedy ((1983) on OC focuses on the
measurement of organisations based on feedback and risk, where quick feedback means an instant
response, and risk represents the degree of uncertainty in the organisation’s activities. They used
several parameters to classify four OCs:
(1) Tough-guy macho culture;
(2) Work hard/play hard culture;
(3) Bet your company culture; and
(4) Process culture.
Schein (Schein, 1985) classifies OC into three dimensions:
(1) Assumptions at the first level;
(2) Values at the second level; and
(3) Artefacts at the third level.
Denison (1990) explains OC in four distinct hypotheses:
(1) The consistency hypothesis – the notion that a common perception, communal beliefs, and values
among the organisational members will enhance internal coordination and promote meaning and sense
for the members;
(2) The mission hypothesis – the notion that a communal sense of purpose, direction, and strategy can
synchronise and move organisational members toward collective goals;
(3) The involvement/participation hypothesis – the notion that involvement and participation will
contribute to a sense of responsibility and ownership, and organisational commitment and loyalty; and
(4) The adaptability hypothesis – the notion that customs and beliefs that enhance an organisation’s
ability to receive, construe, and translate information from various sources into internal organisational
and behavioural changes will promote its survival, growth, and ultimately its development.
These hypotheses focus on different facets of culture but, more importantly, they stress different
functions of culture. The first two hypotheses encourages/promotes stability, while the second two
allow for change and adaptability. The first and third hypotheses see culture as focusing on internal
organisational dynamics, while the second and fourth see culture as addressing the relationship of the

40
organisation with the external environment (D. R. Denison, 1990). Thus, a company might exhibit an
OC with either a high external orientation (high adaptability and strong sense of mission) or a high
internal orientation (high involvement and consistent work practice and regulation).
These hypotheses correspond closely to Cameron and Quinn’s (1999) categorisation of organisational
focus and associated types of organisations, which are represented in the competing values framework
(CVF).
The CVF has received renewed attention from organisational development researchers and leadership
development scholars (Belasen, 2007; Burgess, Ong, & Shaw, 2007). Much of this attention has
focused on the wide applicability of the CVF as a diagnostic and development tool for cultural
variables (Goodman, Zammuto, & Gifford, 2001; Igo & Skitmore, 2006), human resource development
(Belasen & Frank, 2004; Panayotopoulou, Bourantas, & Papalexandris, 2003) and the relationships
between leadership roles, personal growth, and organisational effectiveness (Belasen & Rufer, 2007).
The CVF also provides researchers with a common metric for multi-level, trans-organisational, and
cross-cultural analyses of OC as a key influence on the effectiveness of change management initiatives
(Howard, 1998). Due to this, the CVF is argued to be a valid framework for examining OCs (Goodman
et al., 2001; Harris & Mossholder, 1996; Howard, 1998).
The topic of organisational culture often presents two contradictory images. The presents culture as
"the glue that holds the organisation together"; the second presents it as a central part of the change
process (D. R. Denison, 2000).
Umit et al (2006), in their research paper on the dynamics of PMS and OC found that OC and
management style seem to be interdependent throughout the life cycle of the PMS and the management
style needs to evolve as PMS and OC evolve. In addition, during these implementations, the authors
observed that organisational culture and management styles have an impact on how PMS are
implemented and used, thus affecting their success or failure.
Henri (2006) believes that OC has been overlooked in recent PMS studies, even though several authors
have argued that organisational culture has had a significant impact on management control systems.
In his survey of organisational culture and performance measurement, Henri tested the relationships
between organisational culture and two attributes of performance measurement systems, namely the
diversity of measurement and the nature of use. The results of the survey reveal that top managers of
firms reflecting a flexibility dominant type tend to use more performance measures and to use

41
performance measurement systems to focus organisational attention and to support strategic decision-
making and legitimate actions to a greater extent than top managers of firms reflecting a control
dominant type.
(Zu, Robbins, & Fredendall, 2010) Investigated how organisational culture influences the
implementation of different practices incorporated in the recent Six Sigma approach as well as those
associated with traditional total quality management (TQM). They employed the competing values
framework to capture the underlying value orientations of organisational culture. Using survey data
collected from 226 US manufacturing plants; the relationships between four culture types and 10
TQM/Six Sigma practices were examined via the structural equation modelling technique. The results
reveal the differential effects of the culture types on the implementation of TQM/Six Sigma practices.
The implications of the links between different cultures and different TQM/Six Sigma practices are
discussed. While the relationship between TQM practices and culture has been the subject of prior
research, this is the first look at the relationship between organisational culture and a comprehensive set
of quality management practices including the new Six Sigma practices. The understanding of the
advantage of each culture type should help managers achieve effective implementation of TQM/ Six
Sigma practices from a holistic perspective of both quality management and culture.
2.4 Typologies of Organisational Culture
A number of theoretical frameworks, or typologies, have been designed with regard to organisational
culture (Cameron & Quinn, 2006; K. Cameron & Quinn, 2011; Deal & Kennedy, 1983; Harrison &
Stokes, 1992; Hellriegel et al., 2004; Hofstede, 1993; Rowe, Mason, Dickel, Mann, & Mockler, 1994).
Typologies are useful because they provide broad overviews of the variations that exist between
organisational cultures (Brown, 1995). In order to get a better understanding of different concepts of
organisational culture, three typologies will be briefly discussed, with particular emphasis on their
relationship with PMS.
2.4.1 Rowe, Mason, Dickel, Mann and Mockler’s organisational culture Typology
Rowe et al. (1994) developed a classification that identifies four types of cultural environments,
illustrated in Figure 2-2. These classifications of organisational culture suggest that an organisation’s

42
culture provides clues to appropriate change strategies, and by studying these clues, an organisation can
increase the likelihood of successful implementation of a strategic change (ibid).
Figure 2-2 indicates the different combinations of organisational settings or organisational rules and the
organisation’s orientations, which produce the four types of cultural orientations within which an
organisation is believed to function (Rowe et al., 1994). An organisation’s values range from
achievement in an open system, to performance in a controlled system (ibid).
Achievement in an open system refers to an organisation being creative, whereas performance in a
controlled system refers to an organisation being market orientated and following market trends. An
organisation’s orientations can be either technical, which is differential; or social, which has high levels
of integration and coordination (Rowe et al., 1994). Within a technical orientation, an organisation
revolves around differentiation and task orientation, and the social orientation refers to an organisation
being more people and relationship orientated. The combination of such values of orientation will bring
about a specific cultural environment (Rowe et al., 1994).
Achievement
(Open system)
Quality Culture
Effective Planning
Problem Solving
Accepts Change
Creative Culture
Innovation
Entrepreneurship
Risk Taking
Initiates Change
Performance
(Controlled system)
Productive Culture
Efficiency
Consistence
Procedure
Rituals
Resists Change
Supportive Culture
Teamwork
Cooperation
Growth
Responds to Change
Technical
(differentiation)
Social (Integration
Figure 2:1 Rowe et al. Organisational culture typology
Source: Rowe et al. (1994).

43
The four organisational cultures have different characteristics:
1) The productive culture: this cultural type concentrates on efficiency and consistency within an
organisation. The organisational values and norms within this cultural environment stress performance,
and the organisation’s orientation is technical. Due to the technical orientation combined with the
controlled system, this type of organisation is likely to resist change.
2) The quality culture: the focus in this organisational cultural environment is on the growth of the
organisation’s employees through problem solving and effective planning. In practice, an organisation
with this type is more flexible in its approaches and therefore more accepting when change occurs. The
organisation values the achievement of individuals, and there is a strong technical orientation within
the organisation.
3) The creative culture: this tends to be innovative and entrepreneurial and is therefore more inclined
towards risk taking and initiating change. An advantage of this culture is that change is easily initiated
and made. This organisation achieves creativity because it values individual achievement and has a
more social orientation.
4) The supportive culture: an organisation with this cultural type produces an organisational
environment that is characterised by teamwork, cooperation, and reinforcement. The focus of
organisational values and norms is on performance, and the organisations orientation is social, and
therefore this organisation is quick and ready to respond to change.
2.4.1 Hellriegel, Jackson, Slocum, Staude, Amos, Klopper, Louw and Oosthuizen’s organisational
culture typology
Hellriegel et al (2004) state that cultural elements and their relationships within an organisation create a
pattern that is a unique part of that organisation, creating an organisation’s culture. Several types of
organisational culture can be described, namely bureaucratic culture, clan culture, entrepreneurial
culture, and market culture (Hellriegel et al., 2004). Figure 3.3 graphically represents the first typology
that will be discussed with regard to organisational culture.
In Figure 2:3, the vertical axis reflects the relative formal control orientation within the organisation,
which ranges from stable control to flexible control. The horizontal axis, on the other hand, reflects the
relative focus of attention of the organisation, and ranges from internal functioning to external
functioning. The farthest corners of the four quadrants correspond to four pure organisational cultural

44
types, which are bureaucratic, clan, entrepreneurial and market. Each of the four organisational cultural
types developed by Hellriegel et al. (2004) will be briefly discussed.
Figure 2:2: Hellriegel et al, organisational culture typology
Flexible
Clan
Culture
Entrepreneurial
Culture
Stable Bureaucratic
Culture
Market
Culture
Internal External
Focus of Attention
Source: (Hellriegel et al., 2004, p. 365)
Bureaucratic Culture: This type of organisation values rules, hierarchical coordination, formalisation
and standard operating procedures; with the long-term concerns being efficiency, predictability and
stability (Hellriegel et al., 2004). Managers within a bureaucratic organisation are good coordinators,
organisers and enforcers of rules and procedures that are clearly defined. The tasks, responsibilities and
authority for the entire organisation’s employees are also clearly stated. (Hellriegel et al., 2004) Assert
that most government institutions have bureaucratic cultures, which can hinder their effectiveness and
efficiency. The focus of attention of this organisation is internal, and the formal control is stable.
Clan Culture: Aspects of this type of organisation are tradition, loyalty, teamwork, personal
commitment and self-management. The organisation focuses their attention internally, yet their formal
control is flexible. The members of this organisation recognise an obligation that is beyond their job
descriptions, with the understanding that their contributions to the organisation may exceed their
contractual agreements. Employees identify that their long-term commitment to their organisation, in
the form of loyalty, is in exchange for the organisation’s long-term commitment to the employee, in the
form of security. Unity from this culture type is created through a long and thorough socialisation
process, where long-term clan members serve as mentors and role models for newer members. There is
also strong peer pressure to adhere to important norms within the organisation, and an environment is

45
created in which few departments are left completely free from normative pressures, which may
generate creative and risk-taking behaviour (Hellriegel et al., 2004). Success of this type of
organisation is assumed to depend on teamwork, participation, consensus decision making, as well as
employee sensitivity to customers and concern for people (Hellriegel et al., 2004).
Entrepreneurial Culture: This cultural form is characterised by high levels of risk-taking, dynamism
and creativity (Hellriegel et al., 2004). Employees are committed to experimentation, innovation and
being on the leading edge. This organisational culture type reacts quickly to change, as well as creates
it due to the fact that individual initiative, flexibility and freedom promoting growth are encouraged
and rewarded (Hellriegel et al., 2004). Effectiveness within this organisation means providing new and
unique products and rapid growth. The organisation focuses their attention externally and formal
control orientation is flexible in order to foster creativity and change.
Market Culture: According to Hellriegel et al. (2004), the achievement of measurable and demanding
goals, especially those that are finance-based and market-based are characteristics of this type of
organisational culture. In this organisation, the relationship between employee and organisation is
contractual, where the obligation of each is agreed in advance; therefore the formal control orientation
is quite stable. This is because the employee is responsible for an agreed level of performance with the
organisation exchanging this for an agreed level of remuneration and reward in return (Hellriegel et al.,
2004). Competitiveness and a profit gaining orientation therefore exist throughout this organisation
because increased levels of performance from the employee are rewarded through increased
compensation from the organisation (Hellriegel et al., 2004).
2.4.2 The Competing Values Framework (CVF)
Model by Quinn and Rohrbaugh (1981; 1983) and Cameron and Quinn (1999; K. Cameron & Quinn,
2011). This model of organisational culture typology is used in this research to classify the different
types of organisational cultures within the selected organisations.
The CVF is chosen to be a measurement tool for OC in this study for several reasons. First, the CVF
corresponds closely to Cameron and Quinn’s (1999) definition of OC, which is the operational
definition of OC used in this study. It is also consistent with Denison’s hypotheses of categorisation of
organisation focus and types of organisations. More importantly, the CVF has wide implications for a
variety of organisational issues, including leadership, decision-making, and strategic management
(Goodman et al., 2001; R. E. Quinn & Rohrbaugh, 1983; R. Quinn & Rohrbaugh, 1981). This
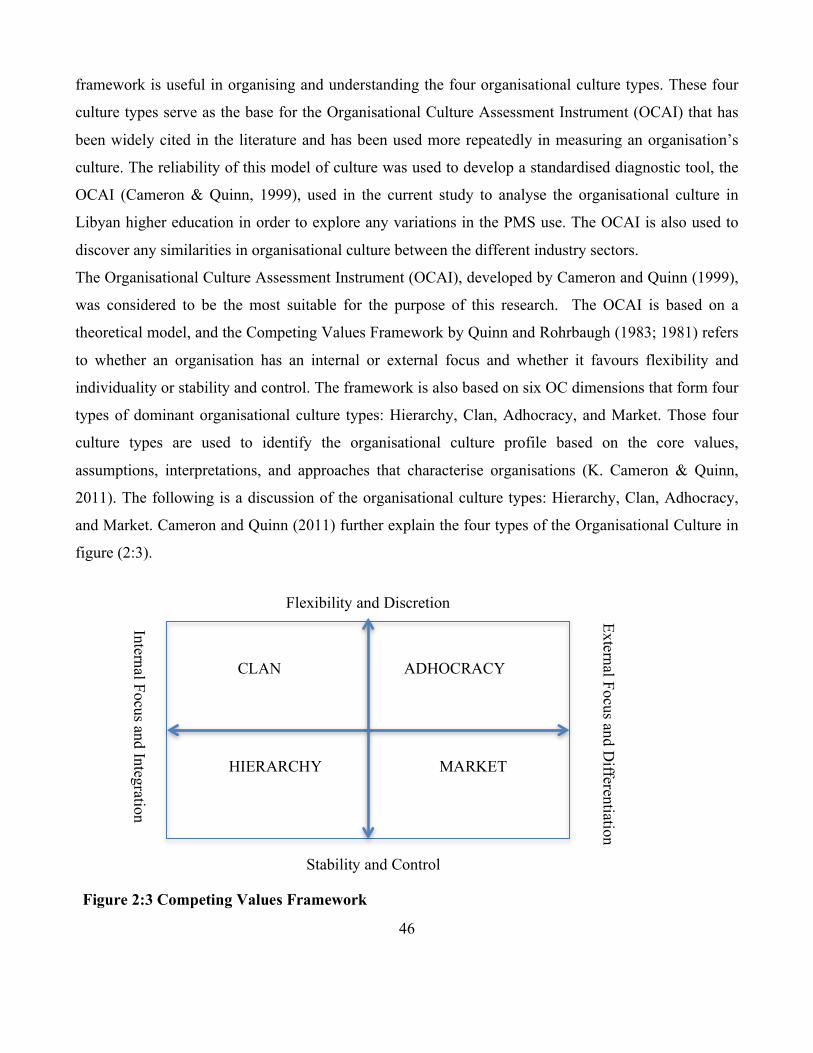
46
framework is useful in organising and understanding the four organisational culture types. These four
culture types serve as the base for the Organisational Culture Assessment Instrument (OCAI) that has
been widely cited in the literature and has been used more repeatedly in measuring an organisation’s
culture. The reliability of this model of culture was used to develop a standardised diagnostic tool, the
OCAI (Cameron & Quinn, 1999), used in the current study to analyse the organisational culture in
Libyan higher education in order to explore any variations in the PMS use. The OCAI is also used to
discover any similarities in organisational culture between the different industry sectors.
The Organisational Culture Assessment Instrument (OCAI), developed by Cameron and Quinn (1999),
was considered to be the most suitable for the purpose of this research. The OCAI is based on a
theoretical model, and the Competing Values Framework by Quinn and Rohrbaugh (1983; 1981) refers
to whether an organisation has an internal or external focus and whether it favours flexibility and
individuality or stability and control. The framework is also based on six OC dimensions that form four
types of dominant organisational culture types: Hierarchy, Clan, Adhocracy, and Market. Those four
culture types are used to identify the organisational culture profile based on the core values,
assumptions, interpretations, and approaches that characterise organisations (K. Cameron & Quinn,
2011). The following is a discussion of the organisational culture types: Hierarchy, Clan, Adhocracy,
and Market. Cameron and Quinn (2011) further explain the four types of the Organisational Culture in
figure (2:3).
Flexibility and Discretion
Stability and Control
Internal Focus and Integration
External Focus and Differentiation
CLAN ADHOCRACY
MARKET HIERARCHY
Figure 2:3 Competing Values Framework

47
Hierarchy culture The hierarchy culture refers to the culture of an organisation that concentrates on
internal maintenance with a need for stability and control in their management and structure. The
hierarchy culture has a structure and control that is derived from a strict chain of command, which is
governed by formal rules, policies and procedures. It highlights stability, reliability, predictability and
security of employment.
People in the hierarchy culture organisations have respect for the position and power, and these
organisations often have clear policies, rules and procedures. Managers are usually the coordinators
and organisers who keep a close eye on what is happening. Such organisational culture is dominant in
large organisations and government agencies (K. Cameron & Quinn, 2011)
Hierarchy culture occurs in a bureaucratic organisation, where most people are helpful to each other
and work together collectively.
Hierarchy culture is characterised by the desire to increase, improve and standardise the existing
models, techniques, products, processes, services and technologies to task- or business-related use
(Jordan et al., 2004). Cameron & Quinn (2011) found that when an organisation is dominated by the
hierarchy culture its most effective managers those rated as most successful by their subordinates,
peers, and superiors and those who tend to move up quickly in the organisation demonstrate a matching
leadership style. That is, they are good at organising, controlling, monitoring, administering,
coordinating, and maintaining efficiency.
Twati & Gammack (2006) who found that the organisational culture profiles of both the oil and gas and
banking sectors of Libyan industry fit predominantly in the lower left quadrant (Figure 3:1), or the
Hierarchy culture. Zahari & Shurbagi (2012) found that the Hierarchy culture was the dominant culture
type in the Libyan Oil sector. In addition, (Parker & Bradley, 2000) in their study, which focuses on six
organisations in the Queensland university public sector, found that four out of six departments were
dominated by a Hierarchy culture. Trivellas & Dargenidou (2009), in their study on a sample of faculty
and administration members at the Technological Educational Institution of Larissa, found that the
Hierarchy culture proved to be the most prevalent among administration staff, while Clan and
Hierarchy dominated among faculty members.
A hierarchy culture focuses on internal maintenance and strives for stability and control through the
establishment of clear tasks and compliance with strict rules. Therefore, it tends to adopt a formal
48
relationship between those in non-leadership roles and leaders; the latter have to be good organisers
and coordinators and follow the ‘party line’. Great value is given to economy, formality, rationality,
order and obedience. Cameron and Quinn (1999, 2006) stated that government agencies fit very
strongly in the Hierarchy culture, which confirms this study’s findings. Moreover, organisations in the
Hierarchy culture are characterised as a formalised and structured workplace, governed by formal rules,
policies and procedures, with efficiency-minded leaders valuing coordination and smooth organisation,
and where stability, dependability, predictability and employment security are highlighted (Cameron
and Quinn, 1999).
Clan culture Thus named because of their similarity to a family-run organisation, these organisations
seem more like extended families than economic entities. Some basic assumptions in a clan culture are:
the environment can best be managed through teamwork and employee development; customers are
best thought of as partners; the organisation is in the business of developing a humane work
environment; and the major task of management is to empower employees and facilitate their
participation, commitment, and loyalty. (K. Cameron & Quinn, 2011). Clan culture refers to the culture
of an organisation that focuses on internal maintenance with flexibility, care for people and sensitivity
for customers. Clan culture organisations have less focus on control and a greater concern for
flexibility. People are driven by vision, shared goals, outputs and outcomes. Organisations with this
type of culture have an internal focus and a sense of family, and people work well together, strongly
driven by loyalty to one another. Managers work in a facilitative, supportive way and may take on a
parental role. Keskin et al (2005) point out that Clan culture highlights the human resources department
and the human factor and emphasizes one to one connections and participations.
When the organisation is dominated by clan culture, the most effective leaders are parent figures, team
builders, facilitators, nurturers, mentors, and supporters. Previous studies such as that of Shurbagi and
Zahari (2013) find that Clan culture was the second dominant culture in National Oil Corporation of
Libya.
Abousaber & Papazafeiropoulou (2011), whose study shows that the majority of organisational cultures
of Saudi Arabia’s Small and Medium Enterprises (SMEs) are clearly dominated by clan culture.
Florida and Kenney (1991) have established that this culture type is prevalent in Japanese
organisations. Henri (2006) has analysed a population consisting of 2175 Canadian manufacturing
firms and concluded that top managers of firms reflect a clan type culture. Thomas, et al (2002) found
49
in a study of the relationship between project cultures (as assessed by Quinn’s Competing Values
Framework) and the quality of outcomes on thirteen construction sites that clan culture type was found
to correlate to improved quality outcomes, whereas market culture was more common in construction
companies.
Clan culture is typically seen in organisations that focus on internal maintenance with flexibility,
concern for people, and sensitivity to customers. Emphasis is placed on human relations and internal
relationships adopt flexible operational procedures. The core values include cooperation, consideration,
agreement, justice and social equality. Such an organisation is generally a very pleasant place to work
where people share a lot of themselves. It is like a big family where leaders are seen as mentors, and
loyalty and tradition are seen as keeping the organisation together. This result is consistent with many
previous studies: (Abousaber & Papazafeiropoulou, 2011; Florida & Kenney, 1991; Henri, 2006;
Thomas et al., 2002).
Adhocracy culture Adhocracy culture relates to the ethos of an organisation that concentrates on
external positioning with a high degree of flexibility and individuality. Adhocracy organisations have
even greater independence and flexibility than those with clan culture; they rapidly form teams to face
new challenges, and rely on experimenting rather than long projects and developments. Managers are
visionary, innovative entrepreneurs who take calculated risks to make significant gains. Keskin et al
(2005) argue that adhocracy culture focuses on entrepreneurship, innovativeness and creativity.
Effective leaders in organisations dominated by adhocracy culture tend to be entrepreneurial, visionary,
innovative, creative, risk-oriented, and focused on the future. The most effective leadership styles tend
to match the organisation’s culture, the dominant styles are in quadrants diagonally opposite to each
other See (Figure 3:1). Adhocracy leaders are rule breakers, for example, whereas hierarchy leaders are
rule reinforces. Clan leaders are warm and supportive, whereas market leaders are tough and
demanding. Cameron and Quinn (1999, 2006) further explain the four types of the organisational
Culture in figure (3:1). (Naranjo-Valencia, Jiménez-Jiménez, & Sanz-Valle, 2011) State that
Adhocracy culture has a positive effect on innovative orientation. Twati (2006) hypothesised that
organisations dominated by an adhocracy culture type will exhibit a significant positive direct
relationship associated with acceptance and use of management information system MIS applications,
and his study supported this hypothesis in the Arab Gulf region only. Keskin et al (2005) in their

50
investigation about the relationship between Adhocracy culture and tacit knowledge oriented
management, found their hypothesis fully supported: Adhocracy culture was found to be positively
related to tacit knowledge oriented management.
An adhocracy culture, where the organisation focuses on external positioning with a high degree of
flexibility and individuality, is based on an open system that promotes the will to act. Overall, it is a
dynamic, entrepreneurial and creative place to work where people take risks. Leaders are visionary and
innovative, and success means producing unique and original products and services. The organisation
values creativity, experimentation, risk, autonomy and responsiveness.
Market culture The name market is not synonymous with the role of marketing function or the
consumer marketplace. Rather, it refers to a type of organisation that serves as a market in itself.
Market culture points to an organisation that focuses on external maintenance with a need for stability
and control. Market culture is not focused on only marketing, but it is where all actions, internal and
external, are viewed in market terms. In an efficient market culture organisation, value passes between
people and stakeholders with minimum cost and delay. Market cultures are outward looking, result-
driven and usually very competitive. Managers in this type of culture are hard-driving competitors who
attempt to achieve goals (Cameron & Quinn, 2011). When an organisation is dominated by market
culture, the managers rated as most effective tend to be hard driving. Igo & Skitmore (2006), applying
the tool called Organisational Culture Assessment instrument (OCAI); found that this culture was
dominant in Australian companies. (Zu et al., 2010) Investigated how organisational culture influences
the implementation of various practices incorporated in the recent focus of Six Sigma, which related to
the traditional management called Total Quality Management (TQM); they used survey data collected
from 226 manufacturing plants in the United States. Relationships between the four types of and 10
practices of TQM / Six Sigma were examined, and the results revealed that the dominant culture was
market culture. Twati (2006) hypothesised that organisations dominated by market culture type will
exhibit a significant positive direct relationship associated with the acceptance and use of management
information system (MIS) applications, and his study supported this hypothesis in Arab Gulf region
only. Also, Shurbagi and Zahari (2013) pointed out that there was a positive relationship between
transformational leadership and Market culture in the National Oil Corporation of Libya. They are
good at directing, producing results, negotiating, and motivating others.

51
Figure 2:4 Organisational Culture Profile (K. Cameron & Quinn, 2011, p. 66)
The Clan Culture A very friendly place to work where people share a lot of themselves. It is like an extended family. The leaders, or head of the organisation, are considered to be mentors and, maybe even, parent figures. The organisation is held together by loyalty or tradition. Commitment is high. The organisation emphasizes the long-term benefit of human resource development and attaches great importance to cohesion and morale. Success is defined in terms of sensitivity to customers and concern for people. The organisation places a premium on teamwork, participation, and consensus.
The Adhocracy Culture A dynamic, entrepreneurial, and creative place to work. People stick their necks out and take risks. The leaders are considered to be innovators and risk takers. The glue that holds the organisation together is commitment to experimentation and innovation. The emphasis is on being on the leading edge. The organisation’s long-term emphasis is on growth and acquiring new resources. Success means gaining unique and new products or services. Being a product or service leader is important. The organisation encourages individual initiative and freedom.
The Hierarchy Culture A very formalized and structured place to work. Procedures govern what people do. The leaders pride themselves on being good coordinators and organizers, who are efficiency-minded. Maintaining a smooth-running organisation is most critical. Formal rules and policies hold the organisation together. The long-term concern is on stability and performance with efficient, smooth operations. Success is defined in terms of dependable delivery, smooth scheduling, and low cost. The management of employees is concerned with secure employment and predictability.
The Market Culture A results-oriented organisation. The major concern is getting the job done. People are competitive and goal-oriented. The leaders are hard drivers, producers, and competitors. They are tough and demanding. The glue that holds the organisation together is an emphasis on winning. Reputation and success are common concerns. The long-term focus is on competitive actions and achievement of measurable goals and targets. Success is defined in terms of market share and penetration. Competitive pricing and market leadership are important. The organisational style is hard-driving competitiveness.
52
2.5 Organisational Performance Types According to "Competing Values Framework CVF" The Organisational Culture Assessment Instrument (OCAI) is based on a theoretical model, the
Competing Values Framework (CVF) model by Quinn and Rohrbaugh (1981; 1983) and Cameron and
Quinn (1999; K. Cameron & Quinn, 2011), which is considered to be the most suitable for the purposes
for a certain type and this research is matched those criteria. The framework is also based on six
organisation culture dimensions that form four types of dominant organisational culture types:
Hierarchy, Clan, Adhocracy, and Market. Those four culture types are used to identify the
organisational culture profile based on the core values, assumptions, interpretations, and approaches
that characterise organisations (Cameron & Quinn, 2011). In addition, CVF refers to organisational
performance types, and is used to identify whether an organisation has an internal or external focus and
whether it favours flexibility and individuality or stability and control.
Each organisational performance type, according to Cameron & Quinn (2011), can be characterised by
one of four core values in the Competing Values Framework that represent opposite or competing
assumptions. Each continuum highlights a core value that is opposite to the value at the other end of the
continuum-flexibility versus stability, internal versus external.
Therefore, the dimensions of the competing values Framework diagram are also produce quadrants
contradictory or competing in the diagonal. The upper left quadrant, for example, identifies values that
emphasize an internal and organic focus, while the lower right quadrant identifies values that
emphasize an external and control focus. Similarly, the upper right quadrant identifies values that
emphasize an external organic approach, while the lower left quadrant emphasizes internal values and
control. The competing or opposite values in each quadrant give rise to the name for the model, the
Competing Values Framework.
According to "Competing Values Framework CVF" model by Quinn and Rohrbaugh (1981; 1983)
Cameron and Quinn (1999; K. Cameron & Quinn, 2011), there are two cultural types associated with
stability and control values that are characterised by the stability and control organisational
performance type: the hierarchy culture, and the market culture. The hierarchy culture concentrates on
internal maintenance, while the market culture points to an organisation that focuses on external
maintenance.
Caermen & Quinn (2011) state that as competition, change, and pressure intensifies for organisations,
organisational culture is given more importance and emphasis, and organisational culture creates both

53
the stability and the adaptability of organisations. Moreover, stability is the glue that holds an
organisation together.
In addition, flexibility values refer to the spontaneity, change, openness, adaptability and
responsiveness. More specifically, the culture of development based on adaptability and willingness is
geared to achieve growth, innovation and creative ability. Group culture sees cohesion, team spirit and
morale as a means to promote the development / empowerment and engagement of human resources. In
short, the types associated with cultural values promote flexibility, loose and informal controls, side
open communication channels and a free flow of information throughout the organisation (Burns &
Stalker, 1961). Culture flexible highlights fundamental values such as spontaneity, change, openness,
adaptability and sensitivity.
To summarise, the main characteristics and values of the four organisational culture typologies are
shown in Table 2:1.
Table 2:1 Classifications of organisational culture typologies
Culture
Classifications
Characteristics Values
Rowe et
al., (1994)
Productive Resists change: Performance
and technical orientation
Efficiency and consistency
within organisation
Quality Accepts change: Achievement
and technical orientation
Problem solving and effective
planning
Creative Initiates change: Achievement
and social orientation
Innovation and entrepreneurial
thinking
Supportive Responds to change:
Performance and social
orientation
Teamwork, cooperation, and
reinforcement
Hellriegel
et
al.,(2004)
Bureaucratic Focus of attention is internal
Control is stable
Rules, hierarchical
coordination, predictability and
stability
Clan Focus of attention is internal
Control is flexible
Teamwork, participation,
consensus decision making,
loyalty, adherence to norms

54
Entrepreneurial Focus of attention is external
Control is flexible
Dynamism, creativity, risk
taking
Market Focus of control is external
Control is stable
Achievement of measurable
and demanding goals that are
finance and market-based
Cameron
and Quinn
(1999; K.
Cameron &
Quinn,
2011)
Hierarchy Focus in internal maintenance
with a need for stability and
control
Formal rules, policies and
procedures. It highlights
stability, reliability,
predictability and security of
employment
Clan Focuses on internal
maintenance with flexibility,
care for people and sensitivity
for customers
Thus named because of their
similarity to a family-run
organisation, these
organisations seem more like
extended families than
economic entities
Adhocracy External positioning with a
high degree of flexibility and
individuality
Organisations dominated by
adhocracy culture tend to be
entrepreneurial, visionary,
innovative, creative, risk-
oriented, and focused on the
future
Market Focuses on external
maintenance with a need for
stability and control
Market cultures are outward
looking, result-driven and
usually very competitive.
Managers in this type of culture
are hard-driving competitors
who attempt to achieve goals.

55
2.6 Strategy Formulation and Change of Organisational Culture
The need for organisation change is generally signalled through changes in strategy. Schneider (1989)
state that the strategy formulation process determines the manner in which an organisation knows and
responds to its environment.
Green (1988) defined Culture as ‘the significant shared meanings which allow managers collectively to
make sense of what they and others do, Strategy constitutes an important constellation of these
meanings and management is a cultural process aimed at altering managers’ interpretations about the
fundamental nature and purpose of their organisation and their roles within it. It is argued that senior
executives seeking strategic change need to pay more attention to what messages they are seeking to
communicate and how these messages are likely to be received. In this way, they can more readily hit
on the right language and symbolic action to influence strategy. However, the most brilliant strategy is
worse than useless if it cannot be implemented because it is socially unacceptable. This may happen
when intended strategy calls for new ways of doing things which either conflict with traditional ways,
or which lead to changes in (relative) power. While formulation of strategic options may be an analytic
process, strategy choices and implementation are behavioural processes. The implicit assumption here
is that, once established, corporate culture becomes relatively resistant to environmental, and hence to
strategic change.
(Ibid) argue that culture is separate from the rest of the organisation’s social system (formal structure,
systems and strategy); it is capable of a wide range of modes of integration within it. A key
management task, therefore, is to enhance system integration.
Shrivastava (1985) argue that the organisational culture is an important variable for effective strategy
making. It influences the different stages of the strategic decision process and consequently affects the
content of corporate strategies. The challenge facing managers in charge of strategy making is to
examine cultural products and their impact on strategy. While many cultural characteristics may be
difficult to change, managers can at least be aware of them and try to develop strategies consistent with
organisational culture. Therefore, if a culture effect people to the need for change or causes them to
resist it, then cultural blocks have to be eliminated. Although organisational cultures are conceptually
elusive, they have important influences on corporate strategy. Hence, managers need to assess their
impact in qualitative terms and try to integrate cultural products and processes with corporate strategy
56
formulation.
As Cameron & Quinn (2011) has shown in their research that organisations may be worse off than if
the change strategy had not been attempted in the first place. Modifying organisational culture, in other
words, is a key to the successful implementation of major improvement strategies (TQM, downsizing,
reengineering) as well as adaptation to the increasing turbulent environment faced by modern
organisations. Organisations should identify what needs to change in an organisation’s culture and for
developing a strategy to initiate change in key elements. The methodology relies on a process of
dialogue among individuals charged with initiating and managing the change. This usually involves
managers near the top of the organisation, but it may involve organisation members at all levels. Of
course, changing culture is a difficult and long-term effort. It will be necessary, over time, to address
almost every aspect of the organisation to ensure that it is aligned and reinforces the preferred culture.
To remember the various aspects of the organisation that need to be considered is to use a variation on
the “Seven S” model which introduced by Waterman, Peters, & Phillips (1980), they recognise that
successful culture change may require a change in structure, symbols, systems, staff, strategy, style of
leaders, and skills of managers. Alignment of these factors will be an important part of successful
culture change.
Cameron & Quinn (2011) state that without changing personal behaviour by members of the
organisation, organisational culture change will be frustrated. A change in culture depends on the
implementation of behaviours by individuals in the organisation that reinforce the new cultural values
and are consistent with them. It is possible to identify a desired culture and specify strategies and
activities designed to produce change, but without the change process becoming personalized, without
individuals' willingness to engage in new behaviours without an alteration in the administrative
competence in the organisation, fundamental culture of the organisation will not change. Therefore, the
Competing Values Framework to include a process by which managerial behaviours that is, the skills
and competencies of managers can be changed to reinforce the culture change process.
Cameron & Quinn (2011) present a six-step process that should be followed when designing and implementing an organisational culture change effort. The purpose of these six steps is to foster involvement and to minimize resistance to the culture change by those affected, to clarify for all concerned what the new cultural emphasis will be, to identify what is to remain unaltered in the organisation in the midst of change, and to generate specific action steps that can be initiated to create
57
momentum toward culture change. The six steps for initiating organisational culture change are as follows:
1. Reach consensus on the current culture.
2. Reach consensus on the desired future culture.
3. Determine what the changes will and will not mean.
4. Identify illustrative stories.
5. Develop a strategic action plan.
6. Develop an implementation plan.
Of course, changing culture is a difficult and long-term effort. It will be necessary, over time, to
address almost every aspect of the organisation to ensure that it is aligned and reinforces the preferred
culture.
Our intent in outlining these six steps for implementing culture change is to help ensure that the
organisation is clear from the outset about its current culture and why it needs to change. A common
mistake in organisations desiring to improve is that they do not take the time to arrive at a common
viewpoint among employees about where the organisation is starting from and where it needs to go.
Unsuccessful organisation often launch right into a new change program without considering the need
to develop a consensual view of the current culture, the need to reach consensus of what change means
and doesn’t mean, and the specific changes that will be started, stopped, and continued. This six-step
strategy will help you overcome these common obstacles to change and make the management of
culture change more systematic.
Culture change at a deep level, of course, may require actions that supplement and build on this six-
step process. As an example, we provide one more case study of an organisation that faced the need to
change its culture. The key to culture change in this organisation, however, was certain actions taken
by the top management team that complemented the OCAI methodology. We discuss this case in order
to illustrate variations that are possible when the OCAI serves as the foundation but not the
comprehensive strategy for culture change.

58
Shrivastava (1985) state that since organisational cultures influence the meaning attributed to
information in decision-making contexts, the design of strategic information systems should explicitly
consider cultural factors.
2.7 Organisational Culture and Performance Measurement Systems Currently, there is a continuing debate in the organisational culture literature as to whether or not
organisational culture has an impact on performance measurement systems. As the literature review
will show, the evidence is mixed. As a consequence, a better question may be: “Under what
circumstances does organisational culture impact on performance measurement system?” An
observation from reviewing the literature was that there was little field research focusing on the
influence of organisational culture and therefore this researcher designed this research specifically to
investigate the influence of organisational culture on performance measurement systems.
Murphy & Cleveland (1995) believe that research on culture will contribute to the understanding of
performance management. Magee (2002) contends that without considering the impact of
organisational culture, organisational practices such as performance management could be
counterproductive because the two are interdependent and change in one will impact the other.
According to Kandula (2006) the key to good performance is a strong culture.
The relationship between organisational culture and performance has been examined by some
researchers such as: (Abraham et al., 2004; Aljaz, 2011, 2012; Ehtesham, 2011; Eker & Eker, 2009;
Grifel, 1994; Henri, 2006; Jofreh & Masoumi, 2013; Vakkuri & Meklin, 2003). However, not much
research has been done on organisational culture and performance measurement systems, especially in
the higher education sector. Therefore, the purpose of this study is to fill these gaps by determining the
relationship between the four types of organisational culture and performance measurement systems.
Table 2:2 Studies in Organisational Culture and Performance Measurement
N Author Title Year Reference
Vakkuri & Meklin The impact of culture on the use of
performance measurement information in the
university setting
2003 (Vakkuri &
Meklin, 2003)
1 Abraham, Mark, The Impact of Organisational Culture on 2004 (Abraham et

59
& Xenophon Time-Based Manufacturing and Performance al., 2004)
2 Henri, Jean
Francois
Organizational culture and performance
measurement systems
2006 (Henri, 2006)
3 Melek Eker &
Semih Eker
An Empirical Analysis of the Association
between the Organisational Culture and
Performance Measurement Systems in the
Turkish Manufacturing Sector
2009 (Eker & Eker,
2009)
4 Aljaz, Stare The Impact Of The Organisational Structure
And Project Organisational Culture On Project
Performance In Slovenian Enterprises
2011 Aljaz, 2011
5 Ehtesham, U. M.,
Muhammad, T.
M., &
Muhammad, S. A
Relationship between Organizational Culture
and Performance Management Practices
2011 (Ehtesham,
2011)
6 Aljaz, Stare The impact of a project organisational culture
and team rewarding on project performance
2012 (Aljaz, 2012)
7 Manouchehr
Jofreh
Elahe Sadat
Masoumi
Diagnosing organizational culture: An
empirical investigation
2013 Jofreh &
Masoumi,
2013
Ehtesham (2011) points out that the statistical analysis results of his study show that participation is
highly correlated with consistency and adaptability. Also, the other dimensions of organisational
culture have a positive significant relationship with performance management practices, and this study
is about performance measurement systems.
Kandula (2006) further maintains that due to differences in organisational culture, same strategies do
not yield same results for two organisations in the same industry and in the same location. A positive
and strong culture can make an average individual perform and achieve brilliantly whereas a negative
and weak culture may de-motivate an outstanding employee to underperform and end up with no
achievement.
60
Therefore, organisational culture has an active and direct role in performance management. Murphy
and Cleveland (1995) believe that research on culture will contribute to the understanding of
performance management. Magee (2002) contends that without considering the impact of
organisational culture, organisational practices such as performance management could be
counterproductive because the two are interdependent and change in one will impact the other.
Overall, there is a strong view in the literature that a good organisational culture leads to increased
organisational performance. However, studies on this relationship often differ as to the extent a practice
is likely to be positively or negatively related to performance.
Many researchers (e.g., Denison, Haaland, & Goelzer in Yilmaz, 2008) have called to investigate the
phenomenon of organisational culture in different cultural contexts, in those of non-western nations in
particular.
(Bititci et al., 2006) argue that the findings from the case studies suggest that there is indeed interplay
between organisational culture, management styles and performance measurement.
Eker & Eker (2009) studied the relationship between organisational culture and performance
measurement systems (PMS) in the context of the Turkish Business environment. This study has led to
a greater understanding of the influence of organisational culture on the design and use of performance
measurement systems. The results show that there is a noticeably positive and significant relationship
between the flexibility value firms and the use of PMS for organisational attention and strategic
decision-making and non-financial PMS.
This study of organisational culture and performance measurement tested the relationships between
organisational culture and the acceptance, importance and use of performance measurement systems, to
understand which organisational culture type has more or less influence on the acceptance of specific
indicators of performance measurement and the disregarding of others, and why.
2.8 Conceptual Model and Hypotheses
Literature refers to organisational culture as a moderating factor in the acceptance and implementation
of any successful changes in organisations (Van den Bosch, Volberda, & de Boer, 1999). One of the
general research questions of this research is: In Libyan higher education, does organisational culture
influence the acceptance, importance and use of performance measurement systems. To address this
more specifically we need a measure of organisational culture, and a look at some key organisations
61
that have been (and can be expected to be) leading users and adopters of performance measurement
systems.
2.8.1 Research Questions
The study adopted the exploratory research approach to explore the impact of the four organisational
culture types (Hierarchy, Clan, Adhocracy and Market) on the acceptance, importance and use of PMS
in Libyan higher education. The main and subsidiary questions for this research arise from gaps
existing in the literature concerning the relationships between organisational culture and PMS
acceptance, importance and use in Libyan higher education in general and in each type of Libyan
higher education in particular. This leads us to the following main research question:
What influence does organisational culture have on the acceptance, importance and use of
performance measurement systems in Libyan higher education?
Subsidiary questions are the following:
To achieve the first objective the researcher developed the following questions:
1- What types of organisational culture are dominant in Libya’s higher education system?
2- What types of organisational performance are found in Libya’s higher education system?
To achieve the second objective the researcher developed the following questions:
3- To what extent are the performance measurement systems (financial, non-financial and
advanced) acceptable in Libyan education system?
4- To what extent are the performance measurement systems considered important in Libyan
education system?
5- To what extent are the performance measurement systems used in Libyan education system?
To achieve the third and fourth objectives the researcher developed the following questions:
6- What influence does organisational culture have on the acceptance of performance
measurement systems (PMS) in Libyan higher education system?
7- What influence does organisational culture have on the importance of performance
measurement systems (PMS) in Libyan higher education system?
62
8- What influence does organisational culture have on the use of performance measurement
systems (PMS) in Libyan higher education system?
9- Do culture types differ for different job titles and positions and levels of education?
To assess the influence of organisational culture on the acceptance of PMS, Cameron and Quinn’s
(1999; K. Cameron & Quinn, 2011) model was used. This model has six dimensions, namely:
Organisational Characteristics, Organisational Leadership, Management of Employees, Organisational
Glue, Strategic Emphasis, and Criteria of Success. Cameron and Quinn used a six dimensional model
for an analysis, which then helped them derive four organisational culture types. These are: Hierarchy
Culture; Clan Culture; Adhocracy Culture; and Market Culture.
2.8.2 Defining the Variables
Definition of variables is a primary objective in quantitative and qualitative research. This study
defined two types of variables: dependent and independent. A dependent variable is the outcome
measure in which researchers are interested (i.e., the effect under investigation). The independent
variables are variables that are systematically controlled by the researchers to determine the variable's
effect on the outcome (dependent variable) (VanderStoep & Johnson, 2009). For the purposes of this
study, the researcher focuses on the two mentioned variables, namely:
1-The dependent variables: (Financial and Non-financial Performance Measurement Systems).
a. Performance measurement systems (PMS) acceptance.
b. Performance measurement systems (PMS) importance.
c. Performance measurement systems (PMS) use.
2-The independent variables: (Four types of organisational culture).
a. Clan Culture
b. Adhocracy Culture
c. Market Culture
d. Hierarchy Culture
2.8.3 The Conceptual Model of the Study
In order to address the above-mentioned problem and research questions, the researcher developed a
research design based on models from the organisational culture of Cameron and Quinn (1999; K.
Cameron & Quinn, 2011). Figure (3:1) explains the research theoretical model, which is the
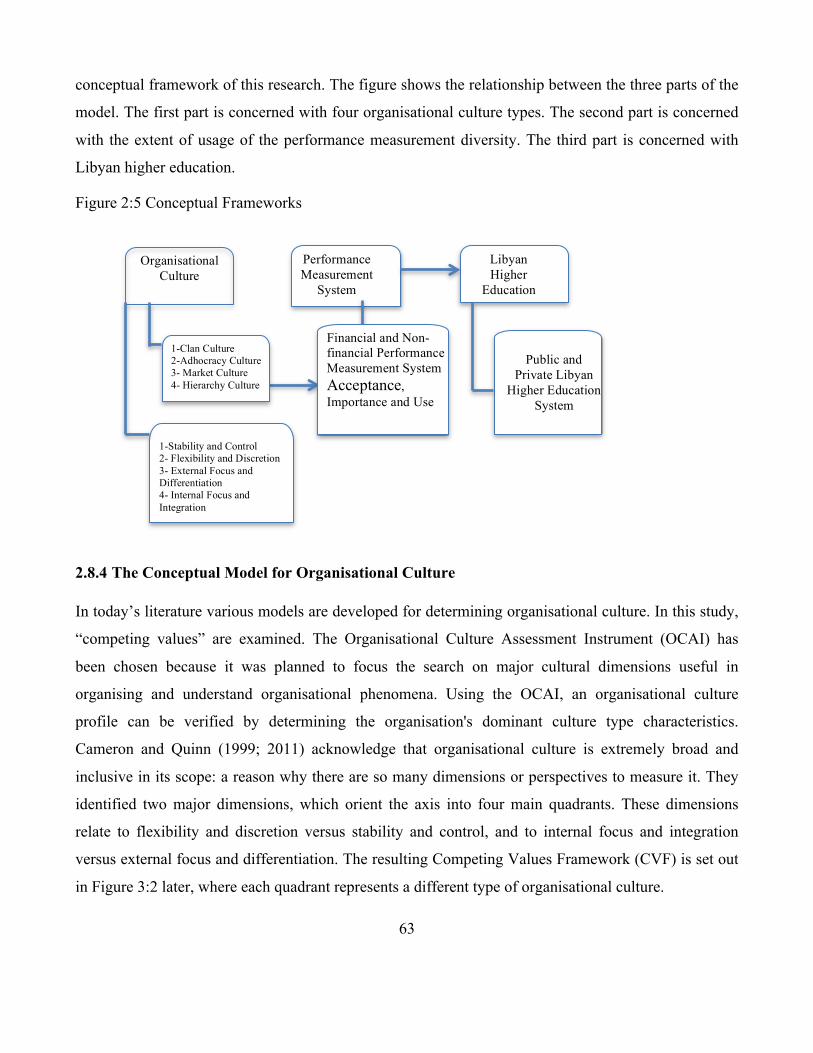
63
conceptual framework of this research. The figure shows the relationship between the three parts of the
model. The first part is concerned with four organisational culture types. The second part is concerned
with the extent of usage of the performance measurement diversity. The third part is concerned with
Libyan higher education.
Figure 2:5 Conceptual Frameworks
2.8.4 The Conceptual Model for Organisational Culture
In today’s literature various models are developed for determining organisational culture. In this study,
“competing values” are examined. The Organisational Culture Assessment Instrument (OCAI) has
been chosen because it was planned to focus the search on major cultural dimensions useful in
organising and understand organisational phenomena. Using the OCAI, an organisational culture
profile can be verified by determining the organisation's dominant culture type characteristics.
Cameron and Quinn (1999; 2011) acknowledge that organisational culture is extremely broad and
inclusive in its scope: a reason why there are so many dimensions or perspectives to measure it. They
identified two major dimensions, which orient the axis into four main quadrants. These dimensions
relate to flexibility and discretion versus stability and control, and to internal focus and integration
versus external focus and differentiation. The resulting Competing Values Framework (CVF) is set out
in Figure 3:2 later, where each quadrant represents a different type of organisational culture.
Organisational Culture
1-Clan Culture 2-Adhocracy Culture 3- Market Culture 4- Hierarchy Culture
Performance Measurement
System
Financial and Non-financial Performance Measurement System Acceptance, Importance and Use
Libyan Higher
Education
Public and Private Libyan
Higher Education System
1-Stability and Control 2- Flexibility and Discretion 3- External Focus and Differentiation 4- Internal Focus and Integration

64
The Competing Values Framework (CVF) model developed by Cameron and Quinn (1999; K.
Cameron & Quinn, 2011) has been chosen to be a measurement tool for Organisational Culture (OC)
to examine aspects of dominating organisational culture type on the acceptance, importance and use of
performance measurement systems (PMS).
Thus, as there are many approaches to the study and measurement of organisational culture, the
researcher has sought, for the purposes of the current study, a valid and reliable instrument that can be
adapted to measure the influence of OC on the acceptance of PMS.
The OCAI is based on a theoretical model, the "Competing Values Framework" by Quinn and
Rohrbaugh (1981; 1983) and Cameron and Quinn (1999; K. Cameron & Quinn, 2011). This
framework refers to whether an organisation has an internal or external focus and whether it favours
flexibility and individuality or stability and control. The framework is also based on six organisation
Culture dimensions that form four types of dominant organisational culture types: hierarchy, clan,
adhocracy, and market. Those four culture types are used to identify the organisational culture profile
based on the core values, assumptions, interpretations, and approaches that characterise organisations
(K. Cameron & Quinn, 2011). The OCAI is discussed more fully in next section.
2.8.4.1 The Organisational Culture Assessment Instrument (OCAI)
Although there are multiple ways to assess organisational culture, this instrument has been found to be
both useful and accurate in diagnosing important aspects of an organisation’s underlying culture.
Cameron and Quinn (1999; K. Cameron & Quinn, 2011) argue that OCAI has been used in more than
a thousand organisations that they know of, and it has been found to predict organisational
performance.
The OCAI consisted of 24 questions organised into six organisational culture dimensions or parts of the
competing values framework (dominant characteristics, organisational leadership, organisation glue,
strategic emphases, management of employees and criteria of success) with four descriptions in each
part (K. Cameron & Quinn, 2011). The four descriptions matched the definitions of each of the four
culture types (i.e. Hierarchy, Clan, Market and Adhocracy). Respondents were asked to distribute 100
points among the four culture types in each of the parts, depending on how well the descriptions
matched their view of their own organisation. Scores for each of the four culture types were then added

65
across the six parts. The OCAI is a simple questionnaire that has six categories in which 100 points are
distributed between four sub-items, each representing the four Competing Values cultures, where:
• Type A style indicates a Clan culture
• Type B style indicates an Adhocracy culture
• Type C style indicates a Market culture
• Type D style indicates a Hierarchy culture
Table 2:3 Six Organisational Culture Dimensions
Category Style
1.Dominant organisational characteristics
A: Personal, like a family B: Entrepreneurial, risk taking C: Competitive, achievement oriented D: Controlled and structured
2. Leadership style
A: Mentoring, facilitating, nurturing B: Entrepreneurial, innovative, risk taking C: No-nonsense, aggressive, results oriented D: Coordinating, organizing, efficiency oriented
3. Management of employees
A: Teamwork, consensus, and participation B: Individual risk taking, innovation, freedom, and uniqueness C: Competitiveness and achievement D: Security, conformity, predictability
4. Organisational glue
A: Loyalty and mutual trust B: Commitment to innovation, development C: Emphasis on achievement and goal accomplishment D: Formal rules and policies
5. Strategic emphasis
A: Human development, high trust, openness B: Acquisition of resources, creating new challenges C: Competitive actions and winning D: Permanence and stability
6. Criteria for success
A: Development of human resources, teamwork, concern for people B: Unique and new products and services C: Winning in the marketplace, outpacing the competition D: Dependable, efficient, low cost
66
The Organisational Culture Assessment Instrument (OCAI), which is based on the competing values
framework (CVF) and provides a pragmatic toolkit for change managers “to help managers, change
agents, and scholars understand, diagnose and facilitate the change of an organisation's culture to
enhance its effectiveness” (K. Cameron & Quinn, 2011). The following is a discussion of the
Competing Values Framework (CVF).
It should be noted that, although the OCAI is a well-developed, valid and reliable instrument (Cameron
and Quinn, 1999; Kalliath et al., 1999), it does not claim to cover comprehensively all cultural
phenomena in organisations (Paparone, 2003). Instead, it offers an intuitively appealing and relatively
easy way to ‘organise organisational culture types’ (Cameron and Quinn, 1999: 17).
2.8.4.2 The competing values framework (CVF)
The Competing Values Framework (CVF) model was originally developed by Quinn and Rohrbaugh
(1981). Basically, the framework was for an empirical investigation on the question of what made
organisations effective (R. E. Quinn & Rohrbaugh, 1983).
The Competing Values Framework (CVF) was introduced in many studies: (Aljaz, 2012; K. S.
Cameron & Quinn, 1991; Deshpande et al., 1993; Henri, 2004, 2006; Shafei, Ghaderzadeh, Salavati, &
Lavei, 2011; Shurbagi & Zahari, 2013; Twati & Gammack, 2006; Zu, Zhou, Zhu, & Yao, 2011). They
have all identified the four types of culture: clan, adhocracy, hierarchy and market (K. S. Cameron &
Quinn, 1991; R. E. Quinn & Cameron, 1983; R. E. Quinn & Rohrbaugh, 1983). The competing values
framework (CVF) of Cameron and Quinn (1999; K. Cameron & Quinn, 2011) for measuring
organisational culture has been adopted in this study as mentioned before. Quinn & Cameron (1983)
argue that organisational culture is a complex, interrelated, comprehensive and ambiguous set of
factors. It is impossible to include all relevant factors in diagnosing and assessing organisational
culture.
Cameron and Quinn (2011) state that the CVF was developed initially from research conducted on the
major indicators of effective organisations. The key questions asked in the investigation were these:
What are the main criteria for determining if an organisation is effective or not? What key factors
define organisational effectiveness? When people judge an organisation to be effective, what indicators
do they have in mind? John Campbell et al (1974) created a list of thirty-nine indicators that they
claimed represented a comprehensive set of all possible measures for organisational effectiveness.
67
Quinn and Rohrbaugh (1983) analysed that list of indicators to determine if patterns or clusters could
be identified. Since thirty-nine indicators are too many to comprehend or to be useful in organisations,
they sought a more parsimonious way to identify the key factors of effectiveness. The thirty-nine
indicators of effectiveness were submitted to a statistical analysis, and two major dimensions emerged
that organized the indicators into four main clusters. One dimension differentiates effectiveness criteria
that emphasize flexibility, discretion, and dynamism from criteria that emphasize stability, order, and
control. Organisations are viewed as effective if they are stable, predictable, and mechanistic. The
continuum ranges from organisational versatility and pliability on one end to organisational steadiness
and durability on the other end. The second dimension differentiates effectiveness criteria that
emphasize internal orientation, integration, and unity from criteria that emphasize an external
orientation, differentiation, and rivalry. Some organisations are viewed as effective if they have
harmonious internal characteristics. Others are judged to be effective if they are focused on interacting
or competing with others outside their boundaries.
On the other hand, in this study the performance measurement system defined in Neely et al., (2005,
pp. 80-81) is as follows:
“Performance Measurement can be defined as the process of quantifying the efficiency and
effectiveness of action.
Performance Measurement can be defined as a metric used to quantify the efficiency and/or
effectiveness of action.
Performance Measurement system can be defined as a set of metrics used to quantify both the
efficiency and effectiveness of actions.”
From previous definitions it can be seen that the authors have focused on the effectiveness and
efficiency of performance measurement actions, whereas, organisational culture has been widely
considered as critical for effective quality management implementation (Prajogo and McDermott,
2005, as cited in (Zu et al., 2011). Organisational culture, however, has been an area in which
conceptual work and scholarship have provided guidance for managers as they search for ways to
improve their organisations’ effectiveness (K. Cameron & Quinn, 2011).
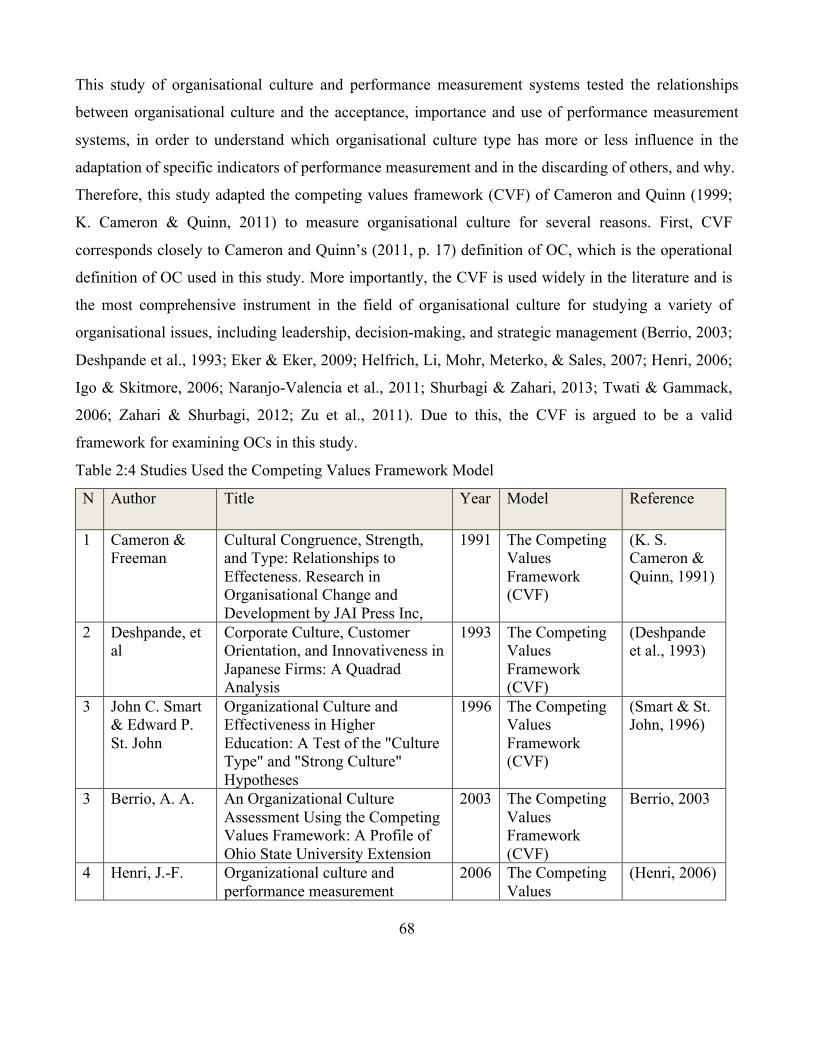
68
This study of organisational culture and performance measurement systems tested the relationships
between organisational culture and the acceptance, importance and use of performance measurement
systems, in order to understand which organisational culture type has more or less influence in the
adaptation of specific indicators of performance measurement and in the discarding of others, and why.
Therefore, this study adapted the competing values framework (CVF) of Cameron and Quinn (1999;
K. Cameron & Quinn, 2011) to measure organisational culture for several reasons. First, CVF
corresponds closely to Cameron and Quinn’s (2011, p. 17) definition of OC, which is the operational
definition of OC used in this study. More importantly, the CVF is used widely in the literature and is
the most comprehensive instrument in the field of organisational culture for studying a variety of
organisational issues, including leadership, decision-making, and strategic management (Berrio, 2003;
Deshpande et al., 1993; Eker & Eker, 2009; Helfrich, Li, Mohr, Meterko, & Sales, 2007; Henri, 2006;
Igo & Skitmore, 2006; Naranjo-Valencia et al., 2011; Shurbagi & Zahari, 2013; Twati & Gammack,
2006; Zahari & Shurbagi, 2012; Zu et al., 2011). Due to this, the CVF is argued to be a valid
framework for examining OCs in this study.
Table 2:4 Studies Used the Competing Values Framework Model
N Author Title Year Model Reference
1 Cameron & Freeman
Cultural Congruence, Strength, and Type: Relationships to Effecteness. Research in Organisational Change and Development by JAI Press Inc,
1991 The Competing Values Framework (CVF)
(K. S. Cameron & Quinn, 1991)
2 Deshpande, et al
Corporate Culture, Customer Orientation, and Innovativeness in Japanese Firms: A Quadrad Analysis
1993 The Competing Values Framework (CVF)
(Deshpande et al., 1993)
3 John C. Smart & Edward P. St. John
Organizational Culture and Effectiveness in Higher Education: A Test of the "Culture Type" and "Strong Culture" Hypotheses
1996 The Competing Values Framework (CVF)
(Smart & St. John, 1996)
3 Berrio, A. A. An Organizational Culture Assessment Using the Competing Values Framework: A Profile of Ohio State University Extension
2003 The Competing Values Framework (CVF)
Berrio, 2003
4 Henri, J.-F. Organizational culture and performance measurement
2006 The Competing Values
(Henri, 2006)
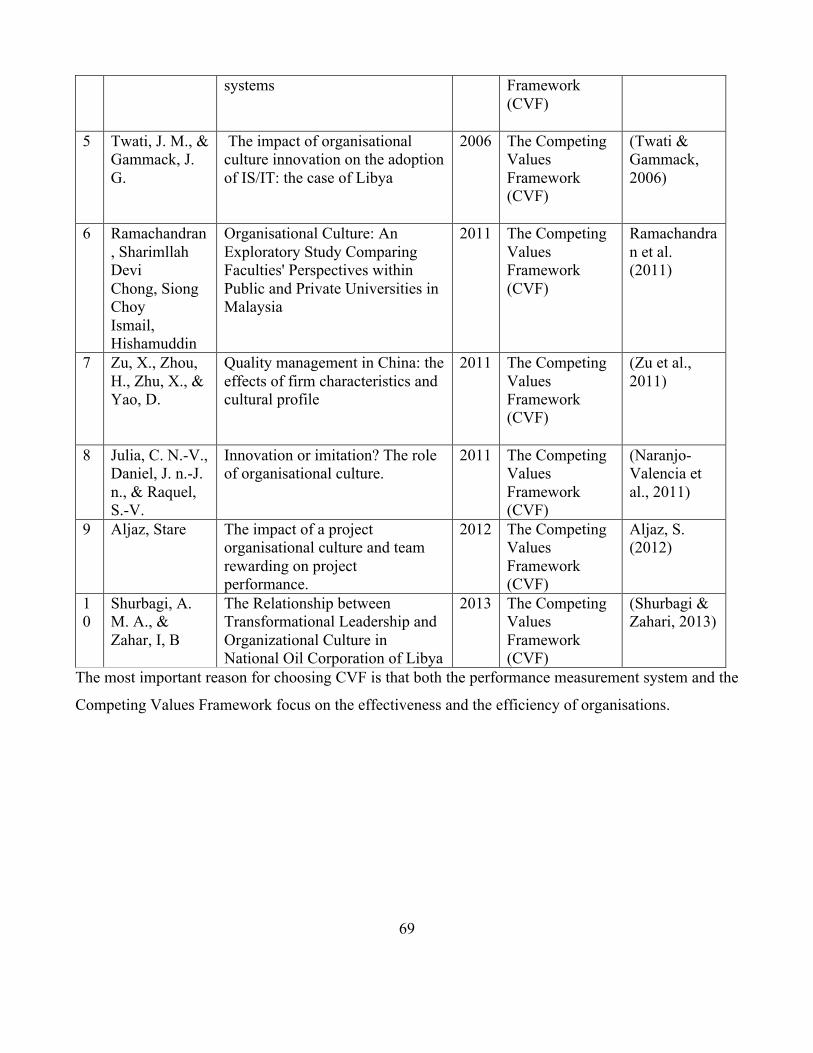
69
systems Framework (CVF)
5 Twati, J. M., & Gammack, J. G.
The impact of organisational culture innovation on the adoption of IS/IT: the case of Libya
2006 The Competing Values Framework (CVF)
(Twati & Gammack, 2006)
6 Ramachandran, Sharimllah Devi Chong, Siong Choy Ismail, Hishamuddin
Organisational Culture: An Exploratory Study Comparing Faculties' Perspectives within Public and Private Universities in Malaysia
2011 The Competing Values Framework (CVF)
Ramachandran et al. (2011)
7 Zu, X., Zhou, H., Zhu, X., & Yao, D.
Quality management in China: the effects of firm characteristics and cultural profile
2011 The Competing Values Framework (CVF)
(Zu et al., 2011)
8 Julia, C. N.-V., Daniel, J. n.-J. n., & Raquel, S.-V.
Innovation or imitation? The role of organisational culture.
2011 The Competing Values Framework (CVF)
(Naranjo-Valencia et al., 2011)
9 Aljaz, Stare The impact of a project organisational culture and team rewarding on project performance.
2012 The Competing Values Framework (CVF)
Aljaz, S. (2012)
10
Shurbagi, A. M. A., & Zahar, I, B
The Relationship between Transformational Leadership and Organizational Culture in National Oil Corporation of Libya
2013 The Competing Values Framework (CVF)
(Shurbagi & Zahari, 2013)
The most important reason for choosing CVF is that both the performance measurement system and the
Competing Values Framework focus on the effectiveness and the efficiency of organisations.

70
Figure 2:6 Competing Values Framework
Source: (K. Cameron & Quinn, 2011)
(R. E. Quinn & Cameron, 1983) Argue that organisational culture is a complex,
interrelated, comprehensive and ambiguous set of factors. It is difficult to include all relevant factors in
diagnosing and assessing organisational culture.
Competing values framework model defines four organisational cultures types – adhocracy, clan,
market and hierarchy – using two dimensions (see Figure 4:4), namely flexibility and discretion versus
stability and control, and external focus versus internal focus and integration, and six organisational
characteristics, dominant characteristics, organisational leadership, and management of employees,
organisational glue, strategic emphases and criteria of success.
The hierarchy culture (or the internal process model) refers to organisations that emphasise internal
maintenance with a need for stability and control. The hierarchy culture sees key values centred on
maintaining efficient, reliable, fast, smooth-flowing productions or services. The market culture (or the
rational goal model) concentrates on external maintenance with a need for stability and control. Its core
values are competitiveness and productivity. The clan culture (or the human relations model) has
characteristics of an extended family where shared values, beliefs and goals, participation,
Flexibility and Discretion
Stability and Control
Internal Focus and Integration
External Focus and Differentiation
CLAN ADHOCRACY
MARKET HIERARCHY

71
individuality, and a sense of “we” exist. The adhocracy culture (or the open system model) is
temporary in nature and is characterised by a dynamic, entrepreneurial and creative workplace (R. E.
Quinn & Cameron, 1983).
2.9 Summary
This section gave a brief summary of the conceptual model used in this study. Next the independent
variables and the dependent variables are explained in terms of their theoretical and conceptual support
in the literature that was reviewed. The next chapter will discuss the literature review relating to the
contingency theory of performance measurement systems.
72
Chapter 3: Literature Review for Contingency theory of
Performance Measurement Systems
3.1 Introduction
The main purpose of a literature review for contingency theory of performance measurement systems
(PMS) is to provide a description of the existing knowledge in a research area and an account of
independent research work done before. Chapter three reviews the literature on (PMS) as dependent
variable, while also discussing the relevant literature on organisational culture, the independent
variable.
The literature review consists of three main sections. The first section discusses the contingency theory
of PMS, and the second section discusses from an academic perspective the financial and non-financial
PMS. Finally, the third section discusses the three dependent variables of PMS: PMS acceptance, PMS
importance and PMS use.
3.2 Definition and Origins of Contingency Theory
Several theories have been increasingly considered in relation to how organisations should be managed.
The early theories of organisation adopted a universal approach to determine the best method to
perform special tasks, regardless of the circumstances that surround the organisations (Watson, 1975).
Traditional theories of management such as the theory of scientific management, administrative theory
and bureaucratic theory believe that there is only one way to structure an organisation, suggesting that
there is no significant relationship between organisational structure and contextual variables; thus, there
is only one optimal way business should be organised to suit all organisations and all circumstances
(Watson, 1975). Therefore, the administrative theory and the theory of scientific management are filled
prescriptions for what is the best organisational structure to be adopted by an organisation to achieve
the highest level of effectiveness. Recently, these theories have tended to be contingent, seeking to link
their prescription to a situation more precisely defined (Emmanuel et al., 1990).
Contingency formulations arose in the mid-1960s as an important perspective of organisation theory,
and developed in the organisation theory literature through empirical researches of Burns and Stalker
(1961), Woodward (1965) and Lawrence and Lorsch (1967) as a response to the rapid changes and
increasing environmental uncertainty (Kreitner, 1998). An important set of contextual factors was
73
tested by Bruns and Waterhouse (1975); their study offered an explanation of the differences between
management accounting and between companies.
Kreitner (1998) argues that as a result of traditional theories having become insufficient, contingency
theory has become a promising alternative. It seeks to take a step forward from the universal approach
of management towards the contingent approach. It shows that one case depends upon another or that
different aspects of an organisation depend upon the circumstances of the whole organisation (Daft,
2001). The theory explains how organisational characteristics have a causal relationship with each
other.
Kreitner (1998, p. 55) defines the contingency approach as:
“An effort to determine through research which managerial practices and techniques are appropriate
in specific situations”
Covaleski, Dirsmith, & Samuel (1996, p. 4) defined contingency theory as:
“A theoretical perspective of organisational behavior that emphasizes how contingent factors, such as
technology and the task environment affects the design and functioning of the organisations”.
Otley (1980, p. 413) (1999, p. 367) states that:
“The contingency approach to management accounting is based on the premise that there is no
universally appropriate accounting system applicable to all organisations in all circumstances. Rather
a contingency theory attempts to identify specific aspects of an accounting system that are associated
with certain defined circumstances and to demonstrate an appropriate matching.”
(Donaldson, 2001, p. 7) has defined contingency as follows:
“… any variable that moderates the effect of an organisational characteristic on organisational
performance”. In addition, the author argues that the contingency approach states “the effect of one
variable on another depends upon some third variable”.
The reason to consider management accounting before turning to performance measurement lies in the
fact that both fields are closely related. In addition, a contingency theory framework has been widely
used in management accounting research, but this stream of research has generally investigated the
impact of few contingent variables relating to PMS. Thus, several researchers (e.g. Francis and
Minchington, 2000; Ittner and Larcker, 2001; Speckbacher et al., 2003; Maltz et al., 2003) suggest the
need to undertake more research to examine the impact of several contingent variables on the design

74
and use of performance measures. These suggestions provide further insights for studying PMS. (M. I.
K. Zuriekat, 2005)
3.3 The Contingency Theory of Performance Measurement
Since the late 1980s, performance measurement has become very topical with growing interest in the
topic. The growing interest has been driven by the increase in the rate of change in the business
environment, both in the public and private sector (Rejc, 2004). Consequently, the contingency theory
of PMS is also based on the assumption that there is no universally appropriate standard of
performance measurement systems that applies equally to all organisations in all circumstances (Rejc,
2004). Proponents of contingency theories argue that such an approach might be appropriate in a
specific set of circumstances, and may not be suitable for a different set of circumstances. Most studies
in this field of research show that no single form of organisation can be the best in all circumstances
(Martinez & Kennerley, 2005).
(Slocum & Tosi, 1984) argue that contingency theories have been an important part of the management
literature for the past twenty years. Many studies have shown many types of contingency theories that
can be utilised such as contingency theory for management, management accounting, organisation,
decision-making, leadership, and performance measurement systems (Buttermann, Germain, & Iyer,
2008; Cho & Lee, 2005; Eker & Eker, 2009; Garengo & Bititci, 2007; Haldma & Lääts, 2002; Henri,
2006; Jaaskelainen et al., 2012; Tung, Baird, & Schoch, 2011; Zahirul, 2004).
Table 3:1 Contingency Theories Studies
N Author Title Year Reference 1 Toomas Haldma
Kertu Lääts Contingencies influencing the management accounting practices of Estonian manufacturing companies
2002 (Haldma & Lääts, 2002)
2 Hoque Zahirul A contingency model of the association between strategy, environmental uncertainty and performance measurement: impact on organizational performance.
2004 Zahirul, 2004
3 Eunseong Cho / Mushin Lee
An exploratory study on contingency factors affecting R&D performance measurement
2005 Cho & Lee, 2005
4 Jean Francois Henri
Organizational culture and performance measurement systems
2006 J. F. Henri, 2006
5 Patrizia Garengo Umit Bititci
Towards a contingency approach to performance measurement
2007 Garengo & Bititci, 2007
6 Garry Buttermann Richard Germain
Contingency theory "fit" as gestalt: An application to supply chain management
2008 (Buttermann et al., 2008)

75
Karthik N. S. Iyer 7 Melek Eker /
Semih Eker An Empirical Analysis of the Association between the Organizational Culture and Performance Measurement Systems in the Turkish Manufacturing Sector
2009 Eker & Eker, 2009
8 Tung Amy / Baird Kevin / P. Schoch Herbert.
Factors influencing the effectiveness of performance measurement systems.
2011 (Tung et al., 2011)
9 Aki Jaaskelainen Harri Laihonen Antti Lonnqvist Miikka Palvalin Virpi Sillanpaa Sanna Pekkola Juhani Ukko
A contingency approach to performance measurement in service operations
2012 Jaaskelainen et al., 2012
The theory explains how organisational characteristics have a causal relationship with each other.
Contingency theory states that there is no single management technique that can be considered the best
in all circumstances, and that depends on the set of variables under a particular situation (Rompho,
2006, p. 155). Hoy and Miskel (1991), as cited in (Tarter & Wayne, 1998), argue that:
There is no single best way to organise, to teach, to do research, or to make decisions. However, some
approaches are more effective than others. The “best approach” is the one that fits the circumstances.
The main idea of the contingency theory model is that organisational efficacy results from appropriate
characteristics of the organisation, ranging from its structure to contingencies that reflect the
organisation's situation. Contingencies include the environment organisational size and organisational
strategy. Structural contingency theory argues that organisational structure needs to fit the three
contingencies of environment, size, and strategy.
Henry at el (1984) have reported that “the common to all contingency approaches is the idea that
performance is a consequence of the suitability between various factors: structure, people, technology,
strategy, and culture”. Smith & Reid (2000) report four factors in their study that have been noted as
potentially carrying significant implications for management accounting system design. These are: 1-
business strategy, 2- degree to which the adopted strategy is deliberate or emergent, 3- market
orientation, and 4- firm size.
Child (2008) has argued strongly that the effects of culture must be integrated into contingency theory.
In addition, (Aljaz, 2011) states that organisational culture is one of the most influential dimensions of
76
the work climate and to the main driving force of a business. Thus, the study is consistent with the
previous PMS literature, which follows the contingency theory approach.
Wisner & Fawcett (1991) were among the first to recognize the need for performance measures to be
reviewed and changed to ensure that the measures are still relevant. Dixon et al., (1990) argue that
organisations need a process in place to ensure that the measures and the measurement system are
reviewed and modified as circumstances change in organisations. Bourne et al., (2000) suggest that
measurement systems should be reviewed and revised, and identified the need to review the objectives
and performance against them, to adopt individual measures as circumstances change a set of measures
to ensure they reflect the strategic direction. In addition, Rejc (2004) argues that while the authors note
the potential obsolescence of PMS, they do not discuss any possible contingencies as to when an
organisation should implement new performance measures.
In an attempt to understand PMS, a contingency theory theoretical framework of performance
measurement has been adopted in this thesis to investigate the contingent relationships between
different factors in organisational culture and the acceptance, importance and use of financial and non-
financial performance measures. This thesis builds on financial and non-financial PMS.
3.3.1 Contingent Variable Categories
The literature points out that there are certain contingency theory factors affecting performance
measurement in both service operations and manufacturing.
Researchers have categorised these contingent variables into many classifications to clarify them.
Several earlier contingency theory researchers have examined some factors in the design and usage of
performance measurement. For example, Zuriekat et al. (2011) utilised the contingency theory
theoretical framework to examine the contingent relationships between several contextual factors and
the usage of financial and non-financial performance measures for performance measurement and
evaluation purposes; their recommendation for future research is to identify and examine the impact of
other contingent variables (e.g. culture, management style). Therefore, organisational culture is an
important area to be researched, especially in terms of its influence on the acceptance and usage of
PMS.
The relationship between four contingency factors (corporate governance structure, management
information systems, strategy, organisational culture and management style) and performance

77
measurement systems has been investigated in small and medium enterprises (SMEs) by Garengo &
Bititci (2007), and the findings inferred that corporate governance structure is one of the main factors
influencing the acceptance and use of performance measurement. Second, information on practices and
behaviour from the people involved seem to be a necessary condition for the implementation and
effective use of PMS in SMEs. Third, a change in the business model of a business development seems
to lead to an improvement in PMS. Finally, the successful implementation of a PMS seems to be driven
by an authoritarian management style. Garengo & Bititci (2007) studied the contingency factors
independently, and they suggested how future research might investigate how these factors collectively
influence performance measurement practices to make interdependencies more explicit which is one of
the purposes of this study.
Pedersen & Sudzina (2012) argue that though much has been said about changes in the environment
and business structure requiring companies to develop new ways to measure performance, less has
been said about whether companies adopting multiple of performance measurement systems actually
match the characteristics of the “new economy”.
Jaaskelainen et al. (2012) investigated the contingency factors affecting performance measurement in
the service context. This study only focuses on how organisational capabilities and perceived
environmental uncertainties influence the acceptance of comprehensive PMS. However, there may be
other firm, industry, and country-specific factors that influence the acceptance and use of PMS. In the
future, more research is needed to better understand the complex dynamics that affect the role of PM in
different types of organisations.
Eker & Eker (2009) studied the relationship between organisational culture and performance
measurement systems (PMS) in the context of the Turkish business environment, Data for this study
were gathered from 122 manufacturers of the top 500 companies in Turkey., while this research for
higher education. Also, their study examined the relationship between an organisational culture and a
performance measurement system, while this research includes variables such as four different types of
organisational culture (clan, adhocracy, hierarchy and market).
Chenhall (2003) examines issues related to the purpose of the management control system (MCS), and
its elements, the meaning and measurement of contextual variables, and issues relating to development
theory. A final section considers the possibility that the ideas on a contingency basis could encompass

78
the views of a variety of theories to help understand MCS within their organisational context.
Contingency-based research has approached the study of MCS assuming that managers act with the
intention of their organisations adapt to changes in the contingencies in order to achieve adequate and
improved performance.
Contingency-based research can provide a neat way to integrate thinking about the sociological
processes affecting MCS in action, perhaps combining these ideas with conventional elements of
models based on contingency. Such research agenda involves many issues of development theory and
model building that provide challenges for researchers.
Table 3:2 Contingency Factors Affecting Performance Measurement
Contingency factors Reference
Organisational size and structure Chenhall (2003); Garengo and Bititci (2007); Lettice et al. (2006); King, et al. (2010); Jaaskelainen (2012)
Strategy Garengo and Bititci (2007); King, et al. (2010)
Organisational level Jaaskelainen (2012); Tillema (2005)
Social practices and organisational culture
Chenhall (2003); Garengo and Bititci (2007); Henri (2006); Bourne et al. (2005)
Existing measurement and information systems
Garengo and Bititci (2007); Bourne et al. (2005)
External factors (political environment, industry competitiveness etc.)
Chenhall (2003); Garengo and Bititci (2007); Bourne et al. (2005); King, et al. (2010); Jaaskelainen (2012)
To conclude, it is important to acknowledge generic contingency factors in the service context also. For
example, the choice of what to measure is always affected by the purpose of measurement, as well as
the mission, strategy and objectives of an organisation. (Amir, et al., (2010) state that while the
measurement of services is complicated and it is necessary to know which PMS should be used to
evaluate the organisational performance, organisational culture as a contingency factor must also be
taken into account to investigate the influence of organisational culture on PMS.
This study will use a contingency approach and prior research on performance measurement to
examine the influence of organisational culture on the acceptance, importance and use of PMS.
3.4 Performance Measurement systems The performance measurement system is a component of management control systems and
management accounting. The purpose of management accounting is to provide information to people

79
inside the company. This information is used for planning and controlling the operations of the
business. Medori (1998) states that PMS are one of the important areas of management accounting that
plays a major role in evaluating the achievement of organisational objectives. Management accounting
is usually divided into five areas: pricing, investment analysis, integration with financial accounts,
budgeting and performance measurement (ibid). PMS play a key role in organisations because of their
importance as a source of information about financial transactions and internal activities, but also for
their effect on the monetary success of organisations (M. I. K. Zuriekat, 2005). In order to achieve their
objectives, organisations also use ratios as a method of assessing financial performance. In addition,
organisations mainly depend on performance measures to evaluate, control and improve processes, to
compare the performance of departments and teams, and to assess employees.
Chan (2004) says that performance measurement is an essential component of any process of change
adopted. It can give information on the effectiveness of plans and their implementation. Both business
managers and accountants are well aware of the important role performance measurement plays in an
organisational planning and control system. Reporting on companies’ past performance is one of the
fundamental uses of performance measurement system.
Neely (Neely, 1999) argues that business performance measurement has become so topical because of
seven main reasons: increasing competition; international and national quality awards; changing
organisational roles; the changing nature of work; changing external demands; specific improvement
initiatives; and the power of information technology.
In another major study, Umit et al. (2006) point out that in recent years, literature has witnessed
significant research and development in the area of performance measurement system. As a result,
there is a generation of different frameworks, models and methodologies by consultants, academics and
practitioners. Some of these models, such as the balanced scorecard, have enjoyed wide acceptance and
popularity with these communities.
Kennerley et al. (2002) summarised some factors affecting the evolution of PMS and listed them into
two groups. The first group consists of factors that cause change such as customers, nature of the work,
future uncertainty, effective review and actual performance. The second group consists of obstacles to
change, among which corporate culture topped the list.
In recent years, great advances have been made in the development of performance measurement as a
scientific discipline, but it has been imperfect from the perspective of the factors that influence the
80
formation of performance measurement systems.
Few organisations develop systematic processes to guide the evolution of performance measurement
systems and few researchers deal adequately with the question of how to design a performance
measurement system. Performance measurement, although extensively studied in the past two decades,
has received relatively little attention in terms of the factors that influence the acceptance of
performance measurement systems. Few organisations seem to have systematic processes to manage
the evolution of their measurement systems and few researchers appear to have explored the factors
that determine the acceptance of performance measurement systems in higher education in Libya.
This study will focus on the financial and non-financial PMS and how organisational culture influences
the acceptance, importance and use of these PMS in higher education.
The main purpose of this section is to demonstrate the importance of PMS by providing an overview of
their development, based on a literature review of performance measurement. In addition, the section
aims to demonstrate the importance of financial and non-financial performance measures by providing
an overview of the different approaches proposed by researchers for adopting integrated frameworks
for performance measurement, including the acceptance of the balanced scorecard.
3.4.1 Definition of Performance Measurement
The purpose of measuring performance is not only to know how a business is performing but also to
enable it to perform better. The ultimate aim of implementing a performance measurement system is to
improve the performance of an organisation so that it may better serve its customers, employees,
owners, and stakeholders (Johnson, 2007). There is a volume of published studies describing the role of
performance measurement systems. Kuwaiti (2004) found that the aim of traditional PMS has been to
provide operational control and external financial reporting. Grifel (1994) mentions that there are
different ways to define the success of the PMS in local governments. For some local governments,
success means that performance measurement is an integral part of the organisation's management and
budgetary decision-making systems. For other local governments, success means developing a few
measures and reporting them annually within the budget. Two well-known sayings about measurement
and performance quoted by Armstrong & Baron (2000) are:
1- What gets measured gets done.
2- If you can't measure it, you can't manage it.
81
The authors argue that measurement of performance is a significant tool because unless quantified,
performance cannot be managed, (Micheli & Manzoni, 2010) write: “Recent reports suggest that an
average company with $1 billion sales spends over 25,000 person-days per year planning and
measuring performance”. Hence, performance measurement is an important element in a management
accounting system, defined in many articles and books, such as:
1- Neely et al., (2005, pp. 80-81): “Performance Measurement can be defined as a metric used to
quantify the efficiency and/or effectiveness of the action”.
2- (NAPA, 1996): “Performance measurement, as defined by US National Academy of Public
Administration, is the application of a measure or a set of measures to the decision-making and/or
operations of an organisation to assess achievement of mission goals and priorities.”
3-According to UK Audit Commission (1999), “there are at least two key reasons why government
would want to set performance measures. First is to improve public services, and second is to reinforce
accountability”.
4-Marshall, Wray, Epstein and Grifel (1999) define performance measurement as “a development of
indicators and collection of data to describe and analyse performance.”
5- (Bititci, Turner, & Begemann, 2000; A. Neely, C. Adams, & M. Kennerley, 2002; A. D. Neely, C.
Adams, & M. Kennerley, 2002) defines PMS as a balanced and dynamic system that supports the
decision-making process by gathering, elaborating and analysing information.
To be more precise, performance measurement relates to the use of a multidimensional set of
performance measures. This package is multi-dimensional if it includes both financial and non-
financial performance measures. Internal and external measures of performance include quantify what
has been achieved. Kulatunge et al (2007) suggest that the following factors be considered with regard
to performance measurement: efficiency and effectiveness of actions (these determine the attainment of
organisational goals and other influential factors); delivering value to the stakeholders; and the need for
infrastructure (data collection, sorting, analysing, interpreting and disseminating).
Accordingly, the authors define performance measurement as “the evaluation of the efficiency and
effectiveness of actions that determine the attainment of stakeholder satisfaction, and factors that
influence this attainment”. Hence, it can be seen from previous definitions that almost all of the authors
agree with the “efficiency and effectiveness of actions” factor, which when defined determines its
attainment. However, every author adds his or her idea when performance measurement is defined.

82
Effective systems of performance measurement are necessary to enable the organisation to assess
whether it achieves its objectives and to facilitate the improvement of the organisation as a whole
(Lebas, 1995).
Leen Yu et al. (2009) believe that performance has different meanings when used in a disparate
environment. They state that performance should not be about producing reports instead of making a
decision or taking a direction based on information available on a particular situation.
Marchand and Raymond (2008) use a four-period temporal scale(before 1980, 1980-1989, 1990-1999,
2000 and after) when they define performance measurement. Before 1980, the situation was generally
the following: unidimensionality of performance, essentially financial, focusing on results
(retrospective management). In the 1980s, performance was still envisioned as essentially financial in
most organisations whereas between 1990 and 1999 performance was defined in relation to strategic
objectives and stakeholder expectations. Since 2000, performance has been defined as increasing the
value/cost ratio in relation to society’s expectations (multiple stakeholders) and the firm’s strategic
objectives.
Notably, all of the previous definitions focus on quantifying the efficiency and effectiveness of the
action, which is the main idea of performance measurement.
Kaplan (1984) defined a performance measurement system as an information system that aims to
provide financial signals in order to help the management make decisions. The Procurement Executive
Association (1998) defines performance measurement thus:
[A] Process of assessing progress toward achieving predetermined goals, including information on
the efficiency with which resources are transformed into goods and services (outputs), the quality of
those outputs (how well they are delivered to clients and the extent to which clients are satisfied) and
outcomes (the results of a programme of activity compared to its intended purpose.
Amaratunga and Baldry (2003) argue that “a clear performance measurement definition can help
managers go in the right direction and focus on what really matters”. Indeed, as Gaster (1995),
referring to quality in public services, says: “Definitions are important: they drive the whole
implementation process”. The most quoted performance measurement definition is that of Neely et al.
(2002): “The process of quantifying the efficiency and effectiveness of past actions”. While this
definition emphasises effectiveness as well as efficiency, it is unlikely to make managers stop and

83
challenge their performance measurement systems and it gives little indication to what they should
quantify or why.
As Moullin (2002) suggests , “evaluating how well organisations are managed and the value they
deliver for customers and other stakeholders” could be another definition. There is a deliberate
circularity within the definition. Since performance measurement is itself part of how an organisation is
managed, it too has to provide value to customers and other stakeholders.
Performance measurement has become something of an industry in recent years. Many organisations
spend millions of pounds providing a myriad of measures, making it difficult for managers to pick the
ones that really matter (Max Moullin, 2007). Neely et al (1995) argue that the choice of performance
measures and performance measurement system design is a critical challenge facing organisations.
Globerson (1985) identified a set of criteria for performance measurement system design depending on
several guidelines. The set of guidelines (Neely et al., 1995; Neely , Gregory , & Platts 1995) are:
• Performance criteria must be chosen from the organisation's objectives.
• The aim and calculation method of each performance criterion should be clear.
• The ability of performance criteria should be comparable with those of other organisations.
• Objective performance criteria are preferable to subjective ones.
• Data collection and methods of calculating the performance must be clearly defined.
• Performance criteria should be under the control of the evaluated organisational unit.
• Ratio-based performance criteria are preferred to an absolute number.
People who are involved with the organisation should determine performance criteria.
As indicated by Neely et al. (1995; Neely et al., 2005), PMS design can be examined at three levels,
which are:
(1) The individual performance measures;
(2) The set of performance measures – the performance measurement system as an entity.
(3) The relationship between the performances.
In addition, a “performance measurement system” can be analysed by asking questions such as:
• What performance measures are used?
• What are they used for?
• How much do they cost?
• What benefit do they provide?
84
These precise questions help organisations to choose the right performance measurement system,
which are effective and helpful for them, but the use of these measurements differs between
organisations. Therefore, the next section will discuss financial and non-financial performance
measurements.
Although many authors use the phrases ‘performance measurement’ and ‘performance management’
interchangeably, they are different entities; performance measurement is about the past, and
performance management extrapolates the data to provide information about the future (Lebas, 1995).
Radnor and Barnes (2007) differentiate them thus: Performance measurement is quantifying, either
quantitatively or qualitatively, the input, output or level of activity of an event or process. Performance
management is action, based on performance measures and reporting, which results in improvements in
behaviour, motivation and processes, and promotes innovation.
3.5 Financial performance measurements All performance measurement systems consist of a number of individual performance measures, and
there are various ways in which these performance measures can be categorized.
The main purpose of financial accounting is to report the activities of the organisation to interested
parties outside the organisation, such as investors, analysts, the public, government, creditors,
employees and lenders. In financial accounting, main measures of financial performance come from a
profit and loss account, and a balance sheet. The profit and loss account, as the name suggests,
indicates whether an organisation is making a profit or a loss. Financial measures play an important
role in evaluating the prior financial conditions and performance of the organisation.
The American Accounting Association (1975) defined financial performance measurements as pieces
of information expressed in monetary units, ratios resulting from mathematical manipulations of
information.
According to Morgan (2007, p. 742) the development performance measurement indicates at least five
identifiable phases of evolution. These start with the basic measurement of financial transactions, an
element that is still in evidence today and which is focused on the traditional “buy cheap – sell dear –
make profit” perspective. While this mode of measurement is as old as trading itself, it became
formalized with the invention of the double entry book keeping systems in Venice during the fifteenth
century, the principles of which are still embedded in modern accounting practice. The next phase of

85
performance measurement resulted from the industrial revolution and the development of the
manufacturing environment.
Marginson et al. (2010, p. 345) state that “financial measures may have no impact on short-termism
irrespective of the manner of their use”. These findings support other studies that have failed to find a
relationship between financial measures and short-termism (Marginson & McAulay, 2008; Van der
Stede, 2000)”. As the authors say in the previous statement, their results find that the financial
measures in the short-term might have no influence irrespective of the way they are used. However,
non-financial performance techniques should be used to force the company to change over time when it
needs to change. In addition, qualitative indicators, such as customer service and satisfaction, product
quality, learning and innovation, must be included (Kaplan & Norton, 1996c; Neely, 2002; A. Neely et
al., 2002).
Accounting information can be financial or non-financial. Traditionally, the focus of performance
measurement has been on financial measures such as sales growth, the balance sheet, profits, income
statement, returns on investment and cash flows (Chan, 2004; Neely et al., 2005; Yeniyurt, 2003). As a
consequence, decision-making in accounting usually focuses on financial ratio combinations and makes
little use of non-financial indicators. However, there are many intangible assets an organisation
possesses that are not reflected on the balance sheet but do contribute greatly to the performance of the
organisation. Hence, the limitations of financial data as the basis for decision making in organisations
has been recognised for a long time. Neely, et al (2005) point out that traditional financial measures do
not match the skills and competencies of companies required for facing today's business environment.
Also, Kuwaiti (2004) argues that performance measurement indicators at the early stages of the
management accounting system depended on financial indicators by using financial reporting only to
measure their performance. The citation by Moxham (2009, p. 742) states that “fiscally focused
performance measures have long been used to provide operational control and external financial
reporting in private sector organisations”. In other words, financial performance measurement has been
used for a long time to offer operational control and external financial reporting.
Financial measures have faced much criticism for many reasons such as the changing nature of work,
increasing competition, specific improvement initiatives, national and international awards for quality,
changes in organisational roles, changing external demands, and the power of information technology
(R. H. Chenhall & Langfield-Smith, 1998; Hyvonen, 2005; Neely, 1999).
86
Management cannot get information from financial accounting measures to make critical decisions as
they do not provide the understanding of the big picture because they include too many different
measures that do not directly relate to the strategy of the company (Bourne et al., 2000). Furthermore,
financial accounting measures do not support modern management concepts such as just-in-time (JIT)
and total quality management (TQM), so they cannot help companies to implement them (R Kaplan &
Norton, 1992) as the financial measures are a poor guide to success.
Traditional lagging indicators include financial measures, such as revenue growth and profitability
(Johnson, 2007) while Hussain & Gunasekaran (2002) believe that the poor reflection of performance
measurement by traditional management accounting methods have prompted the need for new
advanced management accounting systems.
To overcome the limitations of financial measures, many researchers have suggested that for
organisations to survive in a competitive market, they must use a new set of operational performance
measures (Burgess et al., 2007). These measures should provide managers, supervisors and operators
with timely information that is necessary for daily decision making. These measures should be flexible,
non-financial and adaptable (Ghalayini & Noble, 1996; R Kaplan & Norton, 1992).
3.5.1 Non-Financial Performance measurement
Non-financial performance measures are defined as measures that provide performance information in
non-monetary terms such as customer satisfaction and employee satisfaction (Verbeeten & Boons,
2009).
Johnson (2007) stated that the major performance measurement systems in use include the Balanced
Scorecard, Activity-based Costing and Management, Economic Value Added (EVA), Quality
Management, Customer Value Analysis, Customer Relationship Management and Performance Prism;
this study places emphasis on the balanced scorecard as a non-financial and financial performance
measurement system.
This study investigates the balanced scorecard as an advanced performance measurement technique
that includes non-financial and financial indicators. Said et al. (2003) found that companies that use a
mixture of non-financial and financial measures perform better contemporaneously and prospectively
than companies that use financial measures alone. Chan (2004) perceived shortcomings in a system of
performance measurement that emphasizes traditional financial measures and has led many
organisations to switch to and put more emphasis on forward-looking non-financial measures such as
87
customer satisfaction, employee training and innovation. Medori & Steeple (2000) argue that
traditional measures are at best too aggregated to be useful and, at worst, provide a very limited and
often misleading picture of the performance of the organisation.
As Said et al. (2003) suggest, a company’s strategy and vision can be transformed into a tool to
motivate performance and communicate planned goals by utilizing non-financial performance
measures.
Neely (1999) says that traditional financial measures are criticised because, for example, they
encourage short-termism, lack strategic focus and fail to provide data on quality, responsiveness and
flexibility, and fail to provide information on what customers want and how competitors are
performing.
From the previous studies it can be note that many researchers believe that financially oriented
performance and traditional PMS are no longer acceptable for evaluating an organisation’s
performance. Therefore, PMS that are advanced and are a mix between financial and non-financial in
their orientation are needed to evaluate an organisation’s performance. Consequently, a number of
helpful frameworks for planning and implementing PMS have been identified in the literature, such as
the balanced scorecard, the performance prism, the performance measurement matrix, and the results
and determinants framework. Many methods and techniques have been suggested to evaluate the
performance in universities or higher education institutions over the years, and the balanced scorecard
(BSC) is one of them (Beard, 2009; Inaam, 2012; Inianty, 2012; P. Karathanos & D. Karathanos, 2005;
Kurt & Cam, 2012; Maria Manuela & Nuno Filipe, 2012; Naqi, 2013; U. Venkatesh & Kirti, 2007;
Wu, Lin, & Chang, 2011; Yu, Hamid, Ijab, & Soo, 2009). Thus, this study focuses on balanced
scorecard as an advanced PMS technique that includes financial and non-financial perspectives, as the
balanced scorecard is the most famous and helpful framework in planning and implementing PMS
(Cohen et al , 2008).
Using non-financial performance measures do not mean that they should replace financial performance
measures; a balance of financial and non-financial measures is needed, which the Balanced Scorecard
does provide.
According to Kaplan & Norton (1992), the scorecard was designed for private business, but is
increasingly being used by governmental and non-profit organisations. As its name suggests, the
balanced scorecard tries to strike a “balance” between the financial and non-financial, between internal
88
and external and between current performance and future performance measures in evaluating the
company and its personnel. Kaplan and Norton (1996) state that the use of the balanced scorecard in
organisations can translate mission and strategy into objectives and measures. They define strategy as a
set of hypotheses about cause and effect, which calls for the existence of a cause-and-effect relationship
in a properly constructed balanced scorecard.
3.6 Balanced Scorecard (BSC) Balanced Scorecard (BSC) is a comprehensive performance management and measurement model,
which has been developed by Kaplan & Norton in 1992 in the USA, Balanced Scorecard (BSC) can be
expressed as the name of a model or mechanism, which transforms a firm’s organisational strategy to
operational concepts (Kaplan and Norton, 2001; Kaplan and Norton, 1992). The model emphasizes, in
particular, the terms of “balance” and “measurement”. Here, “balance” is explained through four
desired factors of the model: (1) long and short-term purposes, (2) financial and non-financial
measurements, (3) operation and result indicators, and (4) internal and external perspectives of the
organisation. The “measurement” gets it’s meaning in the concise expression of Kaplan and Norton
(1996) - “if you cannot measure, you cannot manage”. Briefly, BSC reminds us once more of how a
PMS is important in affecting the attitude and behaviour of the manager and employees.
Mendoza & Zrihen (2001) argue that although the balanced scorecard (BSC) has been extremely
successful in the US, it had known success in France before that. BSC is a French management control
tool called Tableaux De Bord, which in English means performance. Jones (2009) states that in recent
years, the balanced scorecard (BSC) has become a standard topic in journals and management
accounting textbooks because companies are seeking new ways to maintain a viable position in the
marketplace.
Neely et al., (2005) state that the best-known performance measurement framework is Kaplan and
Norton’s “balanced scorecard”. The Balanced Scorecard (BSC) is a strategic performance measure that
Kaplan and Norton created in the 1990s. The “Balanced Scorecard” is discussed as one of the non-
financial performance measurements in an article titled “The Balanced Scorecard – Measures that
Drive Performance” in the Harvard Business Review, January/February 1992. This article reveals that
balanced scorecard can report on outcomes and consequences of past actions and help find ways to
correct wrong actions and do right ones. The balanced scorecard is an advanced tool of the
management accounting performance measurement systems, which is utilized to evaluate, control and

89
improve processes through comparing the performance of different organisational levels. In addition,
all types of profit and non-profit organisations use the balanced scorecard, and it has become a standard
management tool.
It has been found that Balanced Scorecard adopters who did not develop a causal model of their
strategy experienced more specific problems than those who developed a causal model of their strategy
did. It affected the outcomes and ease of implementation of the Balanced Scorecard (Othman, 2006).
From the results of their survey of Investment Management Association (IMA) members of
management positions, Debusk & Crabtree (2006) argue that 88% of regular users of the balanced
scorecard think that it has improved their operating performance.
Self (2004, p. 101) adopted this tool for a variety of reasons: “In essence, the BSC enables us to gain
better control of our statistical operations. By limiting the number of scorecard metrics, it forces the
user to decide what is important and to identify those numbers that truly make a difference. It also
introduces some balance into their statistical work. Like many libraries, they have collected much data
regarding resources and user services, but other areas have not received the same attention. The BSC
compels them to look at finance, internal processes and the future. Another important aspect of the
BSC is the assigning of targets or goals”. A good balanced scorecard should have an appropriate mix of
outcomes (lagging indicators) and performance drivers (leading indicators) of the business unit’s
strategy.
There is a large volume of published studies describing the role of the BSC as an important model.
Eker & Eker (2009), in their study, discuss the possibility of a comprehensive understanding on
multiple performance measures with the balanced scorecard concept. Meng & Minogue (2011, p. 472),
found in their research that the Balanced Scorecard (BSC) and the Business Excellence Model (BEM),
are more widely accepted as performance indicators that are more effective than other performance
indicators. Lisiecka & Czyż-Gwiazda (2013) argue that to achieve a level of excellence in the new
global economy, global organisations need to search for methods and models to help organisations
achieve the best results. Performance measurement systems (PMS), such as Balanced Scorecard, focus
on organisational performance and can be considered as a means to achieve performance objectives.
3.6.1.1 Balanced Scorecard and Education
PMS have received wide discussions in the private sector after the introduction of the Balanced
Scorecard (Saunders et al., 2007), which puts strategy and vision in the core. It is argued that
90
developing a set of performance indicators related to strategic developments can more effectively
manage an organisation; however, this idea is not without its critics. Within the public sector and
especially in higher education, enforcement and understanding of PMS is less frequently reported;
furthermore, the literature in relation to higher education is very limited. League tables of performance
reports provide an external view of the institutions of higher education, but little research has been
published on how strategy is managed internally through a system of effective performance
management (Broad & Goddard, 2010).
The goal of non-profit entities, such as the public education sector, the public health care sector,
charities, voluntary organisations, civil society and social enterprise, is not to obtain a profit, but to
offer a service for public benefit.
Education services are considered one of the main supports of social services, which all the countries
care to offer, finance or manage; they supervise these services and secure them in accordance with their
various economic systems. Offering of adequate educational services to the individuals of society
means at the end the continuation of human wealth, which is considered the basic pillar of the
economic and social development of any society. The sectors mentioned earlier offer services for
human development (like health and educational services), which rely basically on professional
leadership; it is practically difficult to separate their achievements and therefore it is impossible to
subject them to the direct typical measurement methods.
The educational institutions and universities discussed in this thesis are non-profit organisations (Al-
Turki & Duffuaa, 2003) state that institutions play an important role in the human development. They
support global development strategies with the necessary highly qualified manpower and research. The
development of a strategic plan, supported by a mechanism for monitoring, controlling and adjusting it,
is the way to the success of education institutions in achieving this aim. For academic development, the
education of the students, and organisation of national development requests, are the objectives of
universities that provide in-depth knowledge. Chen et al. (2006) argue that educational institutions
should learn from business in this respect. In order to establish educational aims and standards, and to
increase the competitiveness of university education in a globalised environment, it is necessary to
create a set of performance management tools.
91
According to Beard (2009), the balanced scorecard is considered to be a successful PMS tool in higher
education, even though published reports of successful applications of BSC in higher education are
limited.
The balanced scorecard as a performance measurement system tool is widely accepted in many
business corporations, but is less developed in the area of higher education. Karathanos & Karathanos
(2005) argue that although the application of the balanced scorecard in the business sector is well
documented, very little research has been reported regarding the adaptation or application of the
balanced scorecard in the education sector.
Abouzar & Asghar (2011) state that evaluating the performance of a university is fundamental to
understanding how teaching and research contribute to organisational and strategic objectives;
evaluation methods based on pure financial measures alone are not adequate in this context. Many
methods and techniques have been suggested to evaluate the performance in universities or higher
education institutions over the years. However, well-known financial measures such as return on
investment (ROI), internal rate of return (IRR), net present value (NPV) and payback period (PB) have
been demonstrated as inadequate (Abouzar & Asghar, 2011; Fryer, Antony, & Ogden, 2009).
Umashankar & Dutta (2007) reported that the balanced scorecard approach offers an institution the
opportunity to make a cascade of steps to translate the mission of knowledge creation, exchange and
use in a comprehensive and coherent framework. Karathanos & Karathanos (2005) have compared the
Baldrige Award and balanced scorecard criteria in the context of education and have come up with
measures closely aligned between both the instruments. McDevitt (2008) presented an empirical
analysis that explores the impact of the balanced scorecard in strategic revitalization in universities.
Therefore, most of these previous studies are focused on how to set up an effective framework to select
measurement criteria.
(Umashankar & Dutta, 2007) Reported that the BSC approach offers an institution the opportunity to
formulate a cascade of measures to translate the mission of knowledge creation, sharing and utilization
into a comprehensive, coherent, communicable and mobilizing framework – for external stakeholders
and for one another.
3.7 The Performance Measurement Systems: Acceptance, Importance and Use
The study investigated the influence of organisational culture on the acceptance of PMS; it also
investigated both financial and non-financial performance measurement systems to understand the extent
92
of their acceptance, importance and use in Libyan higher education. Moreover, the advanced technique
of the balanced scorecard was investigated for its effective and useful role in organisational performance.
PMS acceptance, importance and use are dependent variables in this research, as the four types of
organisational culture are independent variables.
3.7.1 PMS Acceptance
In order to measure the higher education's acceptance of PMS, a fixed set of PMS categories were
developed. The respondents were asked about their use of the financial, non-financial and advanced
techniques of PMS, and the relative importance of these techniques in evaluating organisational
performance. Moreover, the effectiveness of using advanced PMS techniques (e.g. BSC) to evaluate
organisational performance was investigated. A similar method has been applied in previous studies of
the diversity of PMS (Eker & Eker, 2009; Henri, 2006; Hoque, Mia, & Alam, 2001; Pedersen &
Sudzina, 2012). The PMS acceptance questions were designed according to idea of the model used in
the Technology Acceptance Model (TAM) by Davis (Davis, 1986, 1989), which seeks to assess the
values, reactions, perceived ease of use, and benefits of the system as professed by the user.
Investigations based on a sample of 71 New Zealand based business units in manufacturing had been
done by Hoque, et al (2001) to examine the relationships among an organisation’s market competition,
computer-aided manufacturing processes and a multiple performance measurement usage. The results
suggest that a greater emphasis on multiple measures for performance evaluation is associated with
businesses facing high competition and a greater use of computer aided manufacturing processes.
In (2006), Henri published a paper in which he described the relationships between organisational
culture and two attributes of performance measurement systems (PMS), namely the diversity of
measurement and the nature of use in manufacturing firms. Data were collected by a structured
questionnaire sent to the highest member of the corporate top management team or local top
management team. Data from 2175 Canadian manufacturing firms were analysed and it was concluded
that senior managers of companies that reflect a flexibility dominant type tend to use more performance
measures and use PMS to focus organisational attention, support strategic decision-making and
legitimate actions than senior managers of companies that reflect a control dominant type. Henri (2006)
in his study adapted the (Cameron & Quinn) competing values form but he focuses on the two

93
dimensions of flexibility and discretion versus those of stability and control. In his detailed
investigation, Henri (2006) did not define the four cultures types of organisational cultures (Hierarchy,
Clan, Adhocracy, and Market).
Another study by Eker & Eker (2009), which was based on the subject of Henri’s study, is about the
relationship between organisational culture and performance measurement systems (PMS) in the
context of the Turkish Business environment. In this study, a model of Jean-François Henri (2006) is
used to understand and analyse the relationship under Turkish conditions. Specifically investigated in
this study are the changes in the aims and measures of PMS used in different organisational cultures by
managers. The main question was about the effect of culture on the aims and measures of a PMS. Data
for this study were gathered from 122 manufacturers of the top 500 companies in Turkey. According to
the results of logistic regression analysis, companies with a flexible culture tend to use non-financial
performance measures, and use PMS for aims such as organisational attention focusing and supporting
strategic decision-making; they use these more often than companies that have a control culture do.
Companies with a control culture tend to use PMS for aims such as monitoring and legitimization more
often than firms that have a flexible culture do.
Pedersen & Sudzina (2012) state that the purpose of their paper is to outline the anatomy of firms that
adopt comprehensive performance measurement systems in order to gain an understanding of how
internal (organisational capabilities) and external (perceived environmental uncertainties) factors shape
performance measurement practices. This paper hypothesises that firms dominated by organic
capabilities and operating in unpredictable markets are more likely to adopt comprehensive PM
systems. The statistical test of these hypotheses is based on a 2008 survey of 299 Danish firms. The
objective of this paper was to analyse the relationship between PM acceptance s, the internal, and the
external characteristics of the firm. Their analysis of 299 Danish firms shows that neither the
organisational capabilities nor the predictability of markets has a uniform impact on the use of
comprehensive PMS. This paper concludes that a limited number of internal and external factors have a
significant influence on the acceptance of PMS. There is no consistent pattern, however, between the
different sub-categories of organisational capabilities /perceived environmental uncertainties and PM
adoption.
94
3.7.2 The Importance and Use of PMS This study to investigate the extent of the importance and use of multiple performance measurement
systems (financial, non-financial, advanced techniques) to evaluate performance in Libyan higher
education and how these PMS would enable organisations to evaluate organisational performance.
Therefore, the importance of financial performance measurement systems was investigated to
understand the importance level and use of financial PMS in evaluating the organisational performance.
On the other hand, the investigation also included the importance and use of non-financial performance
measurement systems criteria, such as:
1- Customer (student and staff), (e.g. customer satisfaction, customer retention).
Results of student learning assessment will be based on a variety of methods to assess and
reflect the overall mission of the organisation and improvement targets taken together to
represent a holistic assessment of student learning
2- Innovation (e.g. courses or educational programs).
3- Employee (e.g. employee satisfaction, workforce capabilities).
4- Quality (e.g. academic quality awards).
5- Community (e.g. public image, community involvement).
The purpose of management accounting is to provide information to people inside the company. (Neely
et al., 2005) Academics and practitioners from a variety of functional disciplines have long recognized
the importance of performance measurement. Medori (1998) states that PMS are one of the important
areas of management accounting that play a major role in evaluating the achievement of organisational
objectives. PMS play a key role in organisations not only because of their importance as a source of
information about financial transactions and the internal activities, but also for their effect on the
monetary success of organisations (M. I. K. Zuriekat, 2005).
The importance of PMS variable is to identify those areas of improvement that are of long-term
importance to the organisations, to explore whether the current performance measurement system
(financial, non-financial, advanced technical) inhibits or supports appropriate activity, and to compare
and contrast what is currently most important for the organisations with what the measurement system

95
emphasises. Amir, et al. (2010) explains that the importance of PMS as a source of information is to
guide management decisions and the choice of actions.
Stivers et al. (1998) empirically examined the importance of 21 non-financial measures in setting
company goals in USA and Canada. The study findings indicated that of the 253 responding firms, 235
(92.9%) rated customer satisfaction and delivery performance/customer service as highly important.
Factors in the innovation and employee involvement categories were perceived to be less important in
goal setting. For example, employee turnover in the employee involvement category was rated as
highly important by only 122 (48.2%) of the responding firms. However, the findings of Stivers et al.
(1998) also indicated that an individual measure was identified as highly important if it received a
rating of four or greater on the five-point scale of importance.
Verbeeten and Boons (2009) included an additional question on the importance of the performance
measures for several goals. Their findings indicated that PMS is important or very important for
operational decisions (85%), strategic decisions (80%), evaluating economic performance (71%),
evaluating managerial performance (70%), rewarding employees (68%) and communication of strategy
(50%). Additionally, non-financial measures of customer satisfaction and innovation are more
important for the communication of strategy.
Veen-Dirks (2010) examined how the importance that is attributed to a variety of financial and non-
financial performance measures depends on periodic evaluation of performance and determination of
rewards. The empirical evidence in this study is based on a survey among 84 industrial companies
located in the Netherlands. Multiple interviews were conducted with both production managers and
management accountants. The study provided evidence of a higher importance attached to both
financial and non-financial performance measures in the periodic evaluation than in the determination
of rewards. The results of the studies above indicate that PMS is used for many purposes other than
evaluating and rewarding managers (Verbeeten & Boons, 2009).
Recently, Al Sawalqa (2011, p. 280) found that multiple measures of performance are important not
only to support the financial performance, but also to support non-financial performance in several
areas such as customer satisfaction and innovation.
96
3.7.3 Summary
Performance measurement has gained more recognition from researchers and higher acceptance from
practitioners over the last two decades (e.g. Neely, 1998; Try and Radnor, 2007). In addition,
performance measurement is perceived to be a critical management tool that can help determine
success or a failure in both organisational and functional performance (Neely, 1998; Putu & Helden,
2007; Sink, 1985). The purpose of this study is to explore the influence of one of the contingency
theory factors (Organisational culture) and the acceptance, importance and use of performance
measurement systems (financial and non-financial) in Libyan higher education. Moreover, this study
has investigated the influence of this contingency theory factor (Organisational culture) on financial
and non-financial of performance measurement systems. To achieve the final objectives of this
research, a contingency theory is adopted. Organisational culture as a contingent variable was
identified from the literature and appropriate statistical tests were undertaken to ascertain its influence.
Contingency theory research has mostly involved the use of cross-sectional studies (in which measures
of the relevant variables are obtained by questionnaires) and has attempted to identify statistical
relationships between organisational culture (as a contingent variable) and PMS aspects.
The next chapter will focus on the Libyan milieu from which the participants of this study were chosen.
97
Chapter 4: The Libyan Context
4.1 Introduction
The purpose of this chapter is to discuss the historical, environmental, demographic and political
backgrounds of Libya that influence the current HE environment of the country. In doing this, the
chapter provides an in-depth understanding of the Libyan education system in general, and then
proceeds to discuss Higher Education specifically.
4.2 Historical Background
Libya has been subjected to varying degrees of foreign control, and over the centuries, Phoenicians,
Carthaginians, Greeks, Romans, Vandals, and Byzantines have ruled all or parts of the country.
Between 1911 and World War II, Italian troops occupied Tripoli. Until 1914, the Libyans continued to
fight the Italians, who controlled most of the land. Tripolitania and Cyrenaica were united in 1934 as a
colony of Libya. After World War II, Libya came under the administration of the allies, and in 1949,
the United Nations (UN) agreed that Libya should become independent; the result is that became the
United Kingdom of Libya in 1951.
A military revolution in 1969 swept away the monarchy and instituted a revolutionary regime for about
42 years. In 17th Feb. 2011 the Libyan Civil War (also referred to as the Libyan Revolution) began; it
ended on the 23th of October that year with the fall of the Gaddafi regime.
4.3 The Libyan Environment and Population
Officially known as the Libyan State, Libya is a developing economy. Islamic ideals and beliefs
provide the foundation for the country's conservative customs, laws, and practices. Geographically,
Libya lies between longitudes 9-25 degrees east and latitudes 18-33 degrees north. It borders Chad and
Niger to the south, Egypt and Sudan to the east, and Tunisia and Algeria to the west. Libya is at the
heart of the North African states, and at the crossroads between Europe and the middle of Africa, which
gives it a considerable advantage over many other countries, as a potential location for investment and
for manufacturing enterprises by multinational companies. Libya has a total area of 1,775,500 square
kilometres, making it the fourth largest country in Africa. Its size equals the combined size of
Germany, France, Holland and the Scandinavian countries (www.Libyaconnected.com, 2007). With a
range of terrains and climates, the country has a long coastline of nearly 1,900 km by the
98
Mediterranean Sea, comprising mostly virgin beaches with outstanding natural environments, making it
a productive area for water sports, diving and all kinds of beach activities. The Libyan desert lies in the
southern part of the country (making up nearly 80% of the country’s area), with significant tourist sites
that could play a key role in making Libya one of the most important desert tourist destinations in the
world (Brookes, 2001).
Libya's population is small compared to that of other countries in Africa and the Middle East. The
current population is estimated at five and a half million. According to the General Census Information
Authority (2008), the highest percentage of the population lives in Tripoli, the capital, with over one
million inhabitants; and Benghazi is the second largest city. However, the population is not distributed
evenly throughout the country, with approximately 80% concentrated in a narrow strip along the coast,
where the main industrial, commercial and other activities are centred (General Authority information,
2008).
4.4 Libyan Economy and Management
The Libyan economy depends on the exploitation of oil, which accounts for about 95 % of the
country’s globally traded currency earnings, 60 % of public sector wages, and about 25 % of GDP
(Gross Domestic Product). Non-oil sectors account for over 20 % of GDP, evolved from the processing
of agricultural products and the production of petrochemicals, iron, steel and aluminium. The Oil and
Gas Journal (2011) revealed that Libya has about 44 billion barrels of oil reserves, the largest in Africa,
and more than 54 trillion cubic feet of natural gas reserves. Revenues from the oil sector, along with a
small population, give Libya one of the highest per capita GDP figures in Africa (Saleh, 2013).
The extended family, clan, tribe, tribe, village and Islamic religion characterise the social environment
in Libya, and historically the whole area of management has been affected by all these factors which
play a major role in the community's life and people's relationships with each other (Agnaia, 1997).
The transfer of Western management techniques and practices, and the selection of appropriate
frameworks to achieve ambitious development goals are the key issues that arise in the managements
of developing countries. Agnaia (1997, p. 120) argues that management decisions in Libya have a
tendency to be influenced by beliefs, customs, community attitudes and personal relationships, as seen
in many of its procedures, including staffing, selection and promotion. Managers in Libya are accused
of being more concerned with the creation of social relations in the workplace than with the work itself.

99
Management procedures in Arab societies in general are often influenced by personal connections,
nepotism, and sectarian and ideological affiliations.
4.5 Overview of the Libyan Education System
Education in Libya is free for all, from primary school to university, irrespective of the geographical
area one belongs to, since schools are located throughout the country. The education system in Libya
includes five stages as shown in Figure 2:1, kindergarten for 2 years that enrols children aged 4 or 5;
basic education for 9 years which enrols students from the age of from 6; and secondary education for 3
years. Specialized Secondary Schools include Institutes for Professional Training; higher education that
lasts from 4 years to 6 years, and includes universities, Higher Institutes, and technical colleges. The
last stage is that of Postgraduate studies which includes masters and PhD (Doctoral) degrees and
advanced degrees in various specialties.
Source: adapted from (Porter & Yergin, 2006)
4.6 Higher Education in Libya
The higher education system in Libya plays a vital role in the intellectual, economic, cultural and social
development of Libya. Its goal is to create highly qualified professionals with the education and
knowledge to form the main human resources of the country, which can be trusted to deal appropriately
Age 5 10 15 20 25 30
Kindergarten
Basic Education 9 years
Specialised Secondary
School 3 Years
Vocational School 3 Years
Intermediate Training 1-2 Years
Higher Technical Institute 3 Years
Undergraduate University Studies4-6 Years
Higher Vocational
Centres 3 Years
Post-graduate Studies
Figure 4:1 The Libyan Educational System

100
with international developments in technology. The Higher Education system is financed by, and under
the authority of, the state. In recent years, the government has allowed the establishment of private
HEIs. Education in the public sector is free up to university level, and it is completely financed by the
state, and although post-graduate studies are not free; they are subsidised, except in private universities.
In Libya, higher education happens in universities and higher institutes, which have both general and
specialized training colleges, and technical colleges. These include the teacher-training institutes of
higher vocational colleges that train students to be trainers and instructors in polytechnics, colleges and
institutes of technical sciences, both industrial and agricultural. Several colleges for teacher training
were established in 1997. The new scientific institutions, which are known as scientific research
centres, were created in the areas of Health and Pharmacy, Education, Environment and Basic
Sciences; they act as both teaching and research institutions.
Higher education in Libya is a modern and growing area; the Faculty of Arts and Education was first
established in 1955 in the city of Benghazi, with only 33 male students. This was followed in 1957 by
the establishment of the Faculty of Science in Tripoli. In 1957, the Faculty of Economics and
Commerce was also founded, followed by the Faculty of Law in 1962. Later, in 1966, the Faculty of
Agriculture was established. In 1970, the Faculty of Medicine was founded and in the same year, the
Libyan University under the name of the Faculty of Arabic Language and Islamic Studies incorporated
the Islamic University in Al-Bayda City. In 1972, the Faculty of Oil and Mining Engineering was
established.
In 1973, the Libyan University was separated into two independent Universities; the University of
Tripoli and the University of Benghazi. Later these Universities were respectively renamed the
University of Tripoli and the University of Gar-Younis in Benghazi.
Due to the increasing number of students enrolling in HE since 1981, the government established a
number of universities throughout the country, so that by 1995, 13 universities were in existence,
consisting altogether of 76 specialised faculties and more than 344 specialised scientific departments.
In the late 1990s, the Libyan authorities invited the private sector to play a role in the country’s
education system, since which time, more than 1,000 private primary and secondary schools as well as
more than 30 private universities have been established (Rhema & Miliszewska, 2010). Due to recent
policy changes, the number of universities was reduced (in April 2010) to fourteen.

101
In general, there is a dearth of current reliable social statistics on Libya (Rhema & Miliszewska, 2010),
but according to some sources, the total number of students in Libyan Higher Institutes and
Universities is 439,000 for academic year (2010-2011) including foreign students (Centre for
Information and Documentation, 2011). More than 80,000 students are enrolled in the Technical
colleges and more than 10,000 students are studying outside the country (Assistant Secretary of Higher
Education, 2010).
Figure 4:2 Public Higher education institutions in Libya
n Universities
uHigher Education Institutes
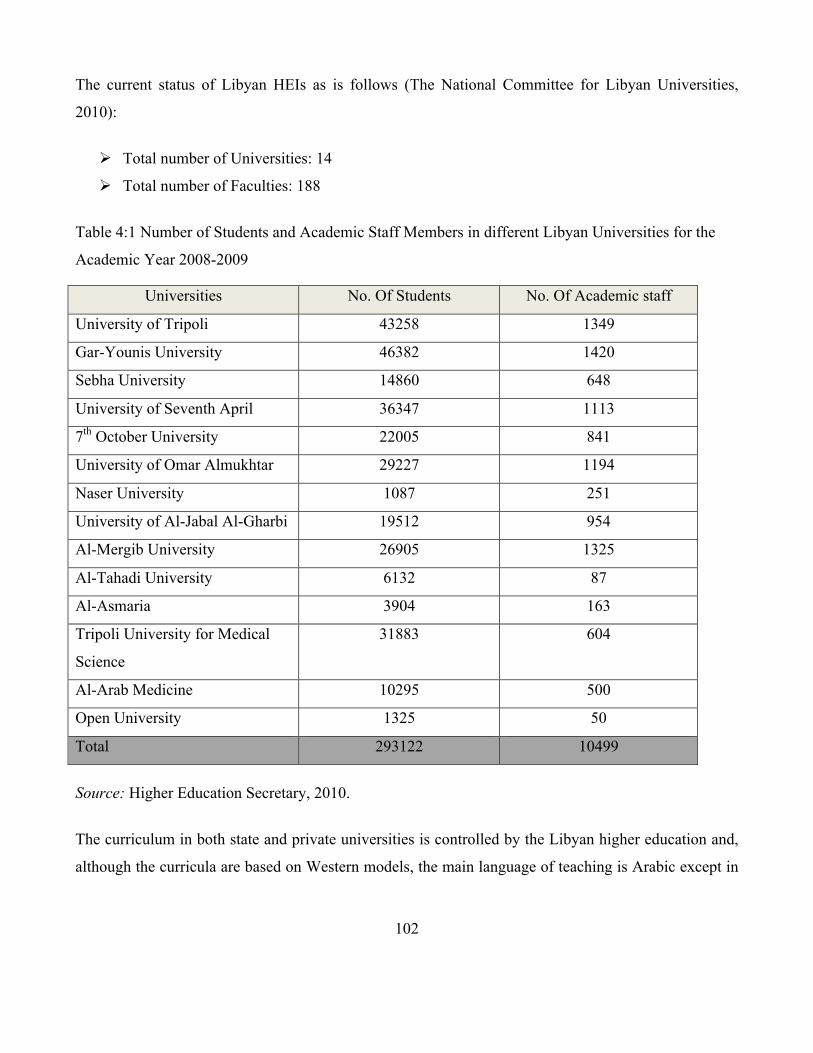
102
The current status of Libyan HEIs as is follows (The National Committee for Libyan Universities,
2010):
Ø Total number of Universities: 14
Ø Total number of Faculties: 188
Table 4:1 Number of Students and Academic Staff Members in different Libyan Universities for the
Academic Year 2008-2009
Universities No. Of Students No. Of Academic staff
University of Tripoli 43258 1349
Gar-Younis University 46382 1420
Sebha University 14860 648
University of Seventh April 36347 1113
7th October University 22005 841
University of Omar Almukhtar 29227 1194
Naser University 1087 251
University of Al-Jabal Al-Gharbi 19512 954
Al-Mergib University 26905 1325
Al-Tahadi University 6132 87
Al-Asmaria 3904 163
Tripoli University for Medical
Science
31883 604
Al-Arab Medicine 10295 500
Open University 1325 50
Total 293122 10499
Source: Higher Education Secretary, 2010.
The curriculum in both state and private universities is controlled by the Libyan higher education and,
although the curricula are based on Western models, the main language of teaching is Arabic except in
103
medicine and in some branches of science and engineering where the main language of teaching is
English
4.7 Objectives of the Higher Education System in Libya
In Libya, higher education have three types that are, universities, higher institutes, which have both
general and specialized training colleges, and technical colleges. Consequently, etch type has their
objectives, the main objectives of higher education in Libya are the following (NCETR, 1996).
1. To satisfy society’s needs for high-level professional personnel for all sectors of national life.
2. To perform theoretical and applied research.
3. To organize and prepare training courses and applied programmes in the continuing education.
4. To organize conferences and symposia, as well as maintaining academic relationships with research
associations inside and outside the country.
5. To promote Arabisation, the translation, writing, publication and asserting the use of Arabic
language in teaching.
6. To generate adequate numbers of scientists, researchers, and faculty members.
Following Libya’s parliamentary elections in 2012 and the establishment of a new government, the
new representatives announced a bold vision for the future of Libyan higher education. The aim is to
create world-class universities that would help diversify Libya’s economy and turn Libya into a hub of
academic achievement. Using its significant oil resources, this aim of higher education reform showed
a candid understanding of the long-term effort required making change. An improved higher education
system will yield job growth, decrease reliance on foreign expertise in technical sectors and increase
Libya’s chances to become a higher education hub for the region.
4.7.1 Objectives of Libyan Universities
Universities offer three types of qualifications. The first degree offered is the Bachelor degree that
requires four, five or six years of study in different programmes after obtaining the secondary school
certificate. Universities and the National Libyan Academy also offer programmes leading to Master's
degree in some specializations, which requires, on average, 2-3 years of study after obtaining the
104
Bachelor degree. PhD degrees in selected specializations can be obtained at certain universities as well
as at the National Libyan Academy requiring three to four years of study.
According to the Ministry of Libyan Higher Education and Scientific Research, the Libya universities
objectives are:
1. Improve the level of education in the universities to meet student and community educational needs
in the twenty-first century.
2. Take care of vocational and technical education, development and linking it to the needs of Libya's
future in construction and economic development
3. Increase the efficiency of the educational and research institutions and to emphasize the need for
compliance with international standards accreditation and quality.
4. Promote scientific research and its role in economic development for the benefit of the Libyan
society
5. Encourage partnership and cooperation with Arab and foreign scientific institutions.
6. Maintain that higher education remains affordable for everyone in the society.
4.7.2 Objectives of Libyan Higher Institutions
The second type of Libyan higher education is the Technical and vocational institutions, according to
the (Education, 2011) several colleges for teacher training were established in 1997. The new scientific
institutions, which are known as scientific research centres, were created in the areas of Health and
Pharmacy, Education, Environment and Basic Sciences; they act as both teaching and research
institutions. The objectives of the higher institutions are different in some points compering with the
objectives of universities and they are as following:
1. Acquisition of technical skills and to those involved in it to suit the needs of the labour market.
2. Provide the country with technical and specialized technical competencies to contribute to the
overall development.
3. Upgrading technical and professional education through the application of modern systems is
seeking to develop training and rehabilitation programs in technical colleges and technical institutes.
4. Closer relations professional and technical tie with institutions and related companies.

105
4.8 Financing of Libyan Higher Education
The public higher education system is financed by, and under the authority of, the state and according
to a suggestion made by it. Each university, however, manages its own budget and administration.
The Ministry of Higher Education (MHE) allocates the annual budget (current and developmental
spending) for each institution according to suggestions made by it. The (MHE) also allocates the annual
budget for technical colleges through the National Foundation for Technical & Vocational Education
according to the budget suggested by these institutions. Libyan higher education organisations are non-
profit because they are for economic and social development. (Ali, 2006, p. 199) stats that Libyan HE
aims to link the plans, programs and education projects with the objectives of economic and social
development within an integrated comprehensive framework aimed at in the end to raise the living
level of the individual and to improve its share in this life on the one hand, and the development of
society in its relations and systems and values on the other hand.
The budget is considered according to the criteria set by the (MHE), such as the institution's
population, current infrastructure, needed construction and facilities. Students' fees are very small.
Students pay only registration fees at the beginning of the academic year or semester. Other limited
financial resources are generated through grants, investments and services provided to the public.
In accordance with the Article number 4 of the balance sheet issued by the Libyan Ministry of Finance,
when the Minister of Treasury issues the annual publication in June every year to plan the budget
project and prepare it. This publication is directed to all ministries, departments and offices related to
the independent budget under the international financial law. The mentioned publication includes the
instructions and the general rules that are followed in the preparation of the estimates of the revenue
and expenditure of the new annual budget.
Article 5 of the balance sheet state that all Ministries and departments should submit to the Ministry of
Treasury not later than 31st of August of every year, their estimates of their revenue and expenditure
after approved from the competent Minister.
Also the Article 11 of the balance sheet said that the General office of the budget in the Ministry of
Treasury has to provide all referral estimates from all Ministries and departments after studying and
reviewing to the financial committee together with all their notes. Following by the Article number 12

106
of the balance sheet, which confirms that the Minister of Treasury presents the budget project to the
Cabinet to approve and take all procedures.
In contrast, private higher institutions are self-financed, their main financial resources are from
students' fees and services provided to the public, but they are under the control of the ministry of
higher education and flow their regulations and rules.
4.9 Accountability and Autonomy of Libyan Higher Education
Financial accountability and autonomy report should submit to the Audit Bureau to control during and
after the expenditure, and with large amounts of money must be approved by the Audit Bureau (Libyan
Ministry of Finance). Article number 24 of the balance sheet issued by the Libyan Ministry of Finance
offers the final report account to the financial audit in a period not exceeding six months from the date
of the expiration of the fiscal year. , The financial statements on the final accounts should be submitted
to the Libyan Ministry of Finance within three months at most of the fiscal year end. In addition,
Article (25) includes the final account of the state of the following data:
1 - Statement of assets and liabilities (assets and liabilities).
2 - Full detailed statement of income and expenses calculates the state, and the actual expenditures for
each section of the budget sections compared to the budget estimates for the same year.
3 - Full detailed data on each account from the state accounts.
4 - Any other data that the Libyan Ministry of Finance or the Libyan Ministry of financial audit should
be included the final account.
These reports are provided on a regular basis, and they are not publically available. Article (25) states
that it may not be disposed in the fixed or movable funds except in accordance with the rules and
procedures established by a decision of the Libyan Ministry of Finance that if the money exceeds the
value of the subject of disposition hundred thousand dinars in the fiscal year is not permissible to act
except by law.
According to Article 22 of the balance sheet issued by the Libyan Ministry of Finance, which state that
in every Ministry, there is a financial controller followed by his/her assistants in that department. Their
job is to adjust and control the implementation of the budget. They make sure not to exceed the
commitments undertaken by the Ministry or the department the limits of their interest credits and their
107
exchange of them. In the Article 24 of the balance sheet: The financial controller is particularly
interested in the following:
1-Participating in the preparation of the Ministry’s budget project.
2-Participating in discussing the budget project with the financial committee.
3-Preparing rules to amend and adjust the budget.
4-Preparing monthly reports
5-Supervising the Ministry’s financial department.
6-Supervising the stores.
7-Submitting a report to the Deputy Minister on the progress of the financial and the accounting
matters in the Ministry.
Also, in Article 25 of the same balance sheet which states that the assistants of the financial controller
have to provide a periodical report every month after approved from the Head of Department of what
has been collected from the revenues and expenses have been spent.
The State Law of the financial system in Article 18 said that every ministry has a financial controller
and sufficient number of assistants chosen by the Minister of Treasury from his/her staff in the
Ministry. All of them work in the Ministry of Treasury and responsible for doing all their work. The
financial controller and his/her assistants are particularly responsible in preparing the financial records
and saving them under the rules of the issued law. They have to take sufficient procedures to protect
the government fund, the general storage and other expensive things and inform immediately about any
missing money as soon as possible.
The financial controller has to submit to the Treasury’s Deputy Minister a monthly report on the
progress of the Ministry’s work not later than the end of the next month and a copy of this report are
for the Deputy Minister of that Ministry. Other executive regulations organize the other financial tasks
of the controllers and their assistants and show their duties.
4.10 Libyan Organisational Culture
The behaviours and attitudes towards accounting and PMS are affected by culture, as are the
behaviours and attitudes towards any other human activity (Douglas, 1989; R. M. C. T. E. Haniffa,
2002; Wildavsky, 1989). As a result, a substantial attention has been paid in the accounting literature to
the impact of culture on PMS and its practices (Hamid, Craig, & Clarke, 1993). A number of
researchers such as (Adler, 1983; Adler & Graham, 1989; Archambault & Archambault, 2003;

108
Belkaoui, 1992, 1997; Cravens & Oliver, 2000; Douglas, 1989; Doupnik & Salter, 1995; Hamid, Craig,
& Clarke, 1993; R. Haniffa & Hudaib, 2002; Hofstede, 1991; Jaeger, 1986; Jaggi & Low, 2000;
Wildavsky, 1989), have demonstrated that culture is a major factor that affects the structure of
business, society as well as accounting.
A study comprising Libya and other Arab countries including Libya, Egypt, Iraq, Kuwait, Lebanon,
Saudi Arabia, and the United Arab Emirates which done by (Hofstede, 1997) demonstrated that Arab
countries share many characteristics in common, they differ in many aspects. Hofstede (1980) says that
Libya is characterised by the extended family, tribe and village. Thus, the employees are more likely to
be influenced by many members within society.
The Islamic religion, the Arabic language and reputation are the three dimensions that characterize
Libyan culture. In this vein, Aghila (2000) pointed out that religion, family; language and reputation
have an important effect on the behaviour and attitude of certain members of a society, both in Libya
and in the other Arab countries. However, in Libyan society, individuals and employees of
organisations adhere to societal values such as guarding the reputation of their families and tribes.
Hence, social reputation is a very important element of societal relationships (Hofstede, 1980
(Hofstede, 1980) in Libyan society. Therefore, strict adherence to the tradition of Islam in Libya would
strengthen deontological norms and codes of ethics in individuals’ ethical system. Islam is the main
religion of Libyan society that comprises extended families and tribes, where national culture, values
and norms have their influence in all aspects of everyday life, which may also influence the accounting
and auditing service.
Similarly, (El-Fathaly, 1977, p. 12) states : The strong role of religion in a traditional Islamic society
like that of Libya has produced a society with special features. Conservative attitudes have been
predominant in every respect. People’s values and behaviour have been a function of their religious
background and attachment: hence, evaluation and acceptance of innovation and change have been
subject to religious beliefs and notion”.
(Pargeter, 2006) Highlighted that the socio-cultural structure in Libya is integrated into the political
system; for instance an informal association of popular leaders, consists of senior leaders of all the
Libyan tribes. Therefore, Libya is still suffering the real limitations of a development model based on
the ideology of its current administrative system that aims to impose the rule of law in the country.

109
4.11 Summary
In this chapter an overview of the Libyan context has been discussed in order to create an
understanding of the environment where the research took place. Information has been provided about
Libya’s geography and historical background. The structure of the education system in general and of
HE in particular was discussed. Finally, the Libyan organisational culture has been highlighted. The
next chapter will discuss the research methodology of this research study, which was adopted to
achieve the aim and objectives.
110
Chapter 5: Research Methodology
5.1 Introduction
The previous chapters have provided an introduction and a review of the literature to support this study.
The aim of this chapter is to describe the research philosophy and methodology that have been adopted
and the methods and procedures that have been conducted to collect the research data. This chapter is
structured as follows: it starts with a justification and discussion of the research philosophy and
methodology together with an explanation of the data collection methods, including the questionnaire
design and interviews. This is followed by details of questionnaire construction and the pilot study. The
response rate is also shown in this chapter. Finally, the chapter ends with a discussion of the statistical
methods that will be used in this research.
The methodology, which is used in this study, could be described as a cross-sectional exploration
adopting mixed methods (quantitative and qualitative), conducted through a survey questionnaire to
investigate the specific contingency theory factor (organisational culture) on the acceptance of
performance measurement systems in Libyan higher education and a case study interviews for more
investigation about OC types.
5.2 Research Questions
The study adopted the exploratory research approach to explore the impact of the four organisational
culture types (Hierarchy, Clan, Adhocracy and Market) on the acceptance, importance and use of PMS
in Libyan higher education. The main and subsidiary questions for this research arise from gaps
existing in the literature concerning the relationships between organisational culture and PMS
acceptance, importance and use in Libyan higher education in general and in each type of Libyan
higher education in particular. This leads us to the following main research question:
What influence does organisational culture have on the acceptance, importance and use of
performance measurement systems in Libyan higher education?
To achieve the first objective the researcher developed the following questions:
1- What types of organisational culture are dominant in Libya’s higher education system?
2- What types of organisational performance are found in Libya’s higher education system?
3- Do culture types differ for different job titles and positions and levels of education?
111
4- To what extent are the performance measurement systems acceptable in Libyan education
sector?
To achieve the second objective the researcher developed the following questions:
5- To what extent is the performance measurement systems (financial, non-financial and
advanced) adopted in Libyan education system?
6- To what extent are the performance measurement systems considered important in Libyan
education system?
7- To what extent are the performance measurement systems used in Libyan education system?
To achieve the third and fourth objectives the researcher developed the following questions:
8- What influence does organisational culture have on the acceptance of performance
measurement systems (PMS) in Libyan higher education system?
9- What influence does organisational culture have on the importance of performance
measurement systems (PMS) in Libyan higher education system?
10- What influence does organisational culture have on the use of performance measurement
systems (PMS) in Libyan higher education system?
To assess the influence of organisational culture on the acceptance of PMS, Cameron and Quinn’s
(1999; K. Cameron & Quinn, 2011) model was used. This model has six dimensions, namely:
Organisational Characteristics, Organisational Leadership, Management of Employees, Organisational
Glue, Strategic Emphasis, and Criteria of Success. Cameron and Quinn used a six dimensional model
for an analysis, which then helped them derive four organisational culture types. These are: Hierarchy
Culture; Clan Culture; Adhocracy Culture; and Market Culture.
5.3 Development of the Hypotheses Cameron and Quinn’s (1999) OCAI is among the well-known instruments used to predict the influence
of the four types of organisational culture on PMS acceptance, importance and use. This instrument
also allows predictions to be made about the differences in PMS acceptance between organisations and
cultures (Vakkuri & Meklin, 2003; (Eker & Eker, 2009). PMS acceptance, importance and use vary

112
significantly in each of the four types of organisational culture defined by Cameron and Quinn. (Bruns
& Waterhouse, 1975)
The literature points to several studies that have used this instrument in organisational studies (Berrio,
2003; Deshpande et al., 1993; Eker & Eker, 2009; Helfrich et al., 2007; Henri, 2006; Igo & Skitmore,
2006; Naranjo-Valencia et al., 2011; Ramachandran et al., 2011; Shurbagi & Zahari, 2013; Twati &
Gammack, 2006; Zahari & Shurbagi, 2012; Zu et al., 2011).
Research studies on PMS make some hypotheses or predictions about the expected outcomes of the
study based on one or more of the above-mentioned organisational culture types. There are different
hypotheses about the association of relationships between two or more variables; some are positive and
some are negative. This section will explain the relationships between the dependent and the
independent variables stated above. To assess the influence of organisational culture on the
acceptance, importance and use of PMS, Cameron and Quinn’s (1999) model was used. This model
has six dimensions, namely: Organisational Characteristics, Organisational Leadership, Management
of Employees, Organisational Glue, Strategic Emphasis, and Criteria of Success. Analysing these six
dimensions produced four types of organisational culture. These are: Hierarchy culture; Clan culture;
Adhocracy culture; and Market culture, and using two dimensions namely as flexibility and discretion
versus stability and control, and external focus versus internal focus and integration.
The first set of hypotheses of this research predicts the direct influence of the organisational culture
type on PMS acceptance, importance and use in Libyan higher education in general and its branches in
particular. Ehtesham (2011) accepted with sufficient evidence the hypothesis that the organisational
culture has a significantly positive relationship with performance management practices (PMP) in
Pakistan’s higher education. In addition, Twati (2006) states that the findings of his research in the
Arab Gulf region supported the hypothesis that a particular dominant organisational culture type
exhibited a significant positive direct relationship associated with management information systems
(MIS) adoption and use in Arab Gulf region.
Shurbagi and Zahari (2013) hypothesised that there is a relationship between transformational
leadership and organisational culture in the National Oil Corporation of Libya, and they found the
relationship to be positive and significant while also identifying that the dominant culture in this
corporation was Hierarchy culture.
113
As the literature pointed out a significant positive relationship between organisational culture and
performance management practices (PMP) in Ehtesham (2011), between organisational culture and
management information systems MIS in (Twati & Gammack, 2006), and between organisational
culture and transformational leadership in (Shurbagi & Zahari, 2013). In this study the relationship
between organisational culture and the three dependent variables (performance measurement systems
acceptance, importance and use) were tested and they were found to be inter-related. Therefore, it is
hypothesised that:
H1: A particular dominant organisational culture type exhibits a significant positive direct
relationship with the acceptance of performance measurement systems in Libyan higher
education.
H2: A particular dominant organisational culture type exhibits a significant positive direct
relationship with the importance of performance measurement systems in Libyan higher
education.
H3: A particular dominating organisational culture type exhibits a significant positive direct
relationship with the use performance measurement systems in Libyan higher education.
The acceptance, importance, and use of PMS in organisations have been developing at a rapid pace. In
a fast-changing world many organisations are eager to adopt and implement advanced PMS, as many
organisations depend on it for their success. However, many organisations have encountered
difficulties in adopting and implementing their new PMS.
5.3.1 Hierarchy Culture
Hierarchy culture exists in bureaucratic organisations where the organisation is well established, and
where most people are helpful to one another and work as a team.
Organisations dominated by a hierarchy culture are characterised as a very formalised and structured
place to work, where procedures govern what people do. A hierarchy culture is typical in governmental
and well-established organisations with many levels of structure and large numbers of employees (K.
Cameron & Quinn, 2011).
Cameron & Quinn (2011) state that research on hundreds of organisations has shown that hierarchy and
clan cultures appear more frequently in organisations than adhocracy or market cultures.

114
The technological aim of this type of culture is to increase and differentiate the efficiency of a
technology or manufacturing process to lower its cost. Their large size, large number of employees,
financial support, and expenditure on facilities characterise organisations in this culture. Well-
organised and well-managed internal processes, good technical management, and adequate staff and
capital resources are significant drivers of the success of organisations dominated by this type of
culture. (Naranjo-Valencia et al., 2011) accepted the hypothesis that the Hierarchy culture will have a
positive effect on imitative orientation. In addition, Shurbagi and Zahari (2013) poited out that the
dominant culture in the National Oil Corporation of Libya was Hierarchy culture and has a positive
relationship with transformational leadership.
On the other hand, Twati (2006) in his study supported the hypothesis that the organisations dominated
by hierarchy culture type will exhibit a significant negative direct relationship with the acceptance and
use of management information systems (MIS) applications.
Therefore, this study adopted the hypothesis of the Twati (2006) because his study was in the same
country (Libya), meaning that the cultural aspects found in both studies would be similar, while the
study of . (Naranjo-Valencia et al., 2011) was in Spain. Therefore, the hypothesis related to hierarchy
culture is:
H4: A Hierarchy culture type will exhibit a significant negative direct relationship with the
acceptance, importance and use of PMS.
5.3.2 Clan Culture
Clan culture is so called because of its similarity to a family-type organisation (K. Cameron & Quinn,
2011). The organisations of this type seem more like extended families than economic entities. Some
basic assumptions in a Clan culture are: the environment can best be managed through teamwork and
employee development; customers are best thought of as partners; the organisation is in the business of
developing a humane work environment; and the major task of management is to empower employees
and facilitate their participation, commitment, and loyalty. Clan culture emphasises flexibility but its
focus is on the internal organisation. The characteristics of this type of organisational culture are self-
directed teamwork (collectivist); rewards and encouragements are received on the basis of that
teamwork, and there is support for employees’ ideas about how to improve the work and performance
of the organisation (K. Cameron & Quinn, 2011). Ramachandran et al. (2011) find that the Clan
culture thus portrayed had more dominance in the organisational culture dimensions of the Competing
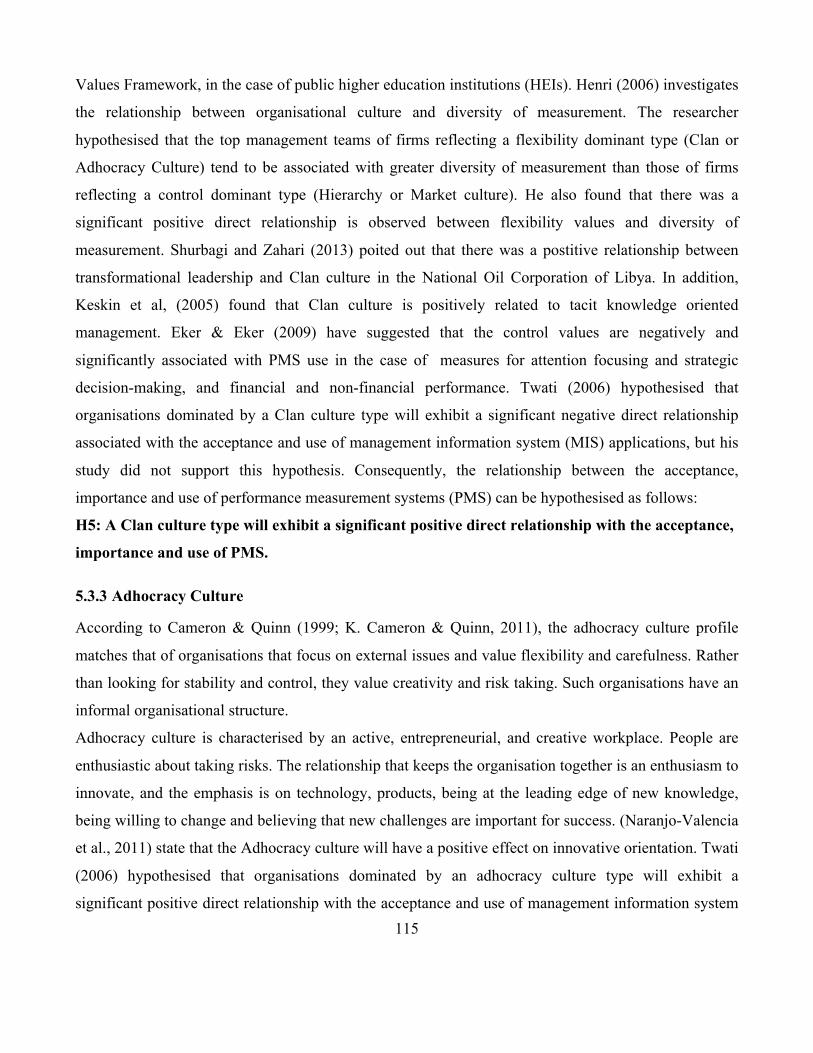
115
Values Framework, in the case of public higher education institutions (HEIs). Henri (2006) investigates
the relationship between organisational culture and diversity of measurement. The researcher
hypothesised that the top management teams of firms reflecting a flexibility dominant type (Clan or
Adhocracy Culture) tend to be associated with greater diversity of measurement than those of firms
reflecting a control dominant type (Hierarchy or Market culture). He also found that there was a
significant positive direct relationship is observed between flexibility values and diversity of
measurement. Shurbagi and Zahari (2013) poited out that there was a postitive relationship between
transformational leadership and Clan culture in the National Oil Corporation of Libya. In addition,
Keskin et al, (2005) found that Clan culture is positively related to tacit knowledge oriented
management. Eker & Eker (2009) have suggested that the control values are negatively and
significantly associated with PMS use in the case of measures for attention focusing and strategic
decision-making, and financial and non-financial performance. Twati (2006) hypothesised that
organisations dominated by a Clan culture type will exhibit a significant negative direct relationship
associated with the acceptance and use of management information system (MIS) applications, but his
study did not support this hypothesis. Consequently, the relationship between the acceptance,
importance and use of performance measurement systems (PMS) can be hypothesised as follows:
H5: A Clan culture type will exhibit a significant positive direct relationship with the acceptance,
importance and use of PMS.
5.3.3 Adhocracy Culture
According to Cameron & Quinn (1999; K. Cameron & Quinn, 2011), the adhocracy culture profile
matches that of organisations that focus on external issues and value flexibility and carefulness. Rather
than looking for stability and control, they value creativity and risk taking. Such organisations have an
informal organisational structure.
Adhocracy culture is characterised by an active, entrepreneurial, and creative workplace. People are
enthusiastic about taking risks. The relationship that keeps the organisation together is an enthusiasm to
innovate, and the emphasis is on technology, products, being at the leading edge of new knowledge,
being willing to change and believing that new challenges are important for success. (Naranjo-Valencia
et al., 2011) state that the Adhocracy culture will have a positive effect on innovative orientation. Twati
(2006) hypothesised that organisations dominated by an adhocracy culture type will exhibit a
significant positive direct relationship with the acceptance and use of management information system

116
(MIS) applications, and his study supported this hypothesis in the Arab Gulf region only. Keskin et al,
(2005) in their investigation about the relationship between Adhocracy culture and tacit knowledge
oriented management, found full support for their hypothesis that the Adhocracy culture is positively
related to tacit knowledge oriented management. Hence, to investigate the relationship between
Adhocracy culture and PMS acceptance, importance and use can be hypothesised as follows:
H6: An Adhocracy culture type will exhibit a significant positive direct relationship with
acceptance, importance and use of PMS.
5.3.4 Market Culture
The term ‘market’ is not to be confused with the meaning of the word in ‘marketplace’. Rather, it refers
to a type of organisation that serves as a market in itself. Market culture is a type of organisational
culture that fits very well with organisations that focus on the market, product diversity and taking
advantage of opportunities in the market environment. The new design is known as a form of market
organisation. The organisations that have this type of culture are also oriented towards the external
environment rather than internal relations. They focus on their main goals of profit-making, product
improvement, the strength of their market position, and customer product bases (K. Cameron & Quinn,
2011). Most educational organisations in this study are public and government funded. Therefore they
are unlikely to fall into this type as market culture is not dominant in Libyan higher education.
Moreover, Igo & Skitmore (2006), (Igo & Skitmore, 2006) applying the OCAI method found
indications that Australian companies have a dominant market culture. Zu et al (2010) investigated how
organisational culture influences the implementation of various practices incorporated in the recent
focus of Six Sigma related to traditional Total Quality Management (TQM). They used survey data
collected from 226 manufacturing plants in the United States. Relationships between the four types and
10 practices TQM / Six Sigma were examined, and the results reveal that the type of dominant culture
was a market culture.
Twati (2006) hypothesised that organisations dominated by a Market culture type will exhibit a
significant positive direct relationship with acceptance and use of MIS applications, and his study
supported this hypothesis in Arab Gulf region only. Also, Shurbagi and Zahari (2013) pointed out that
there was a positive relationship between transformational leadership and Market culture in the
National Oil Corporation of Libya. Consequently, the hypothesis is:
117
H7: A Market culture type will exhibit a significant positive direct relationship with the
acceptance, importance and use of PMS.
According to the literature, each of the four organisational culture types varies from country to
country, sector to sector, and organisation to organisation. This study investigated employees in
different levels of management in different organisational culture types.
Therefore, the questionnaire for the survey undertaken aimed to investigate and identify the views of
decision makers who were using performance measurement systems in Libyan higher education sector;
respondents’ characteristics, depending upon their job title and position, are important in terms of
information to be gained about their experiences and education level. Twati (2006) states that
employees in different levels of management have different organisational culture types, and he found
that in the Arabian Gulf region, senior and middle management share a clan culture while middle and
low management share a market culture. The employees in different management levels in the oil and
gas sector as well as the banking sector in Libya have the same organisational culture. Twati (2006)
also found that in employees with different levels of experience in the Arab Gulf region and the North
Africa region (which includes Libya) shares the same organisational culture. Ramachandran et al.
(2011) found that the dominant culture was different in private and public Malaysian universities.
Henri (2006), by analysing a population consisting of 2175 Canadian manufacturing firms, concluded
that top managers of firms demonstrate a clan type culture. The literature has shown the relationship
between organisational culture, its performance and its leaders. Schein (1992) argues that
organisational leaders create and enforce the culture of the organisation. A vast majority of senior
management executives who are the creators of organisational culture prefer (and impose) a hierarchy
culture in many organisations in this sector. Hierarchy Culture provides them with the authority over
their subordinates, with whom they have a formal relationship.
The research hypotheses H8, H9, H10 are about the organisational culture types depending on the
difference in job titles and levels of education. Libyan higher education consists of three types of
institutions: universities (Public & Private), higher institutions and technical colleges.
H8: The type of organisational culture dominant is different depending on the type of higher
education system.
Hypothesis 8 was to test whether the dominant organisational culture type differed, according to the
type of higher education system. Some previous studies support this hypothesis; others do not. For

118
example Ramachandran et al. (2011) found that the dominant culture was different in private and
public Malaysian universities. This result is not consistent with that of the study of Twati & Gammack
(2006), who found that Hierarchy culture dominated the organisational culture profiles of both the oil
and gas sector and the banking sector of Libyan industry. The researcher adopted the hypothesis of the
first study by Ramachandran et al. (2011) because his study was about the higher education system and
its branches, and is therefore similar to this study. Therefore, it is hypothesised that:
H9: The type of organisational culture dominant is different depending on job title and position.
Hypothesis 9 was to test whether the employees in different levels of management have different
organisational culture types. Job titles and positions in Libyan higher education tested in this study are:
President, vice president, chief of finance department, assistant / vice chief of administrative
department and assistant/vice financial controller. Some previous studies support this hypothesis; Twati
(2006) found that in the Arab Gulf region different culture types characterised the different job levels in
the oil sector. The same study also found that the employees in the North African region share the same
organisational culture type. Henri (2006), by analysing a population consisting of 2175 Canadian
manufacturing firms, concluded that top managers of firms demonstrate a clan type culture. The
literature has shown the relationship between organisational culture, its performance and its leaders.
Schein (1992) argues that leaders of organisations leaders create and enforce the culture of the
organisation. A vast majority of senior management executives who are the creators of organisational
culture prefer (and impose) a hierarchy culture in many organisations in this sector. Hierarchy Culture
provides them with the authority over their subordinates, with whom they have a formal relationship.
Therefore, it is hypothesised that:
H10: The type of dominant organisational culture is different depending on level of education
and experience.
Hypothesis 10 was to test whether the employees in different levels of management education and
experience have different organisational culture types. Libyan higher education levels tested were
Bachelor’s degree, Post-graduate degree and professional qualifications. The tested experience levels in
Libyan higher education were under the classifications of ‘current job’ and ‘experience with the current
organisation’. Some previous studies support this hypothesis such as; Twati (2006) found that in the
Arab Gulf region the oil sector employees with different organisational culture types had different

119
education levels, while the same study found that the employees in the North Africa region share the
same organisational culture type even at different education levels.
Also, employees with different levels of experience belong to different organisational culture types,
and employees who have experiences of less than one year and those with 6-10 years share a Hierarchy
culture, while those with experience between 1-5 years and more than 10 years share a clan culture.
Therefore, it is hypothesised that:
5.4 Research Methodology
This study adopted the exploratory research approach to understand the impact of organisational
culture on the acceptance, importance and use of financial and non-financial performance measurement
systems. Research methods relate to specific activities designed to generate data (for example
questionnaires, focus groups, interviews, observation) and research methodology is more about attitude
and understanding of research and strategy that will answer questions on research (Greener, 2008). The
research methodology consists of a number of steps that have to be determined before starting the
research. The following table lists the steps of the research methodology as shown in Saunders et al
(2009, p. 108).
Table 5:1 Research Steps
Philosophies Approaches Strategies Choices Time Horizons
Techniques and
Procedures
Positivism
Deductive
Experiment Mono method
Cross-sectional
Data Collection And Data Analysis
Survey
Realism
Case study
Action research
Mixed methods
Grounded theory
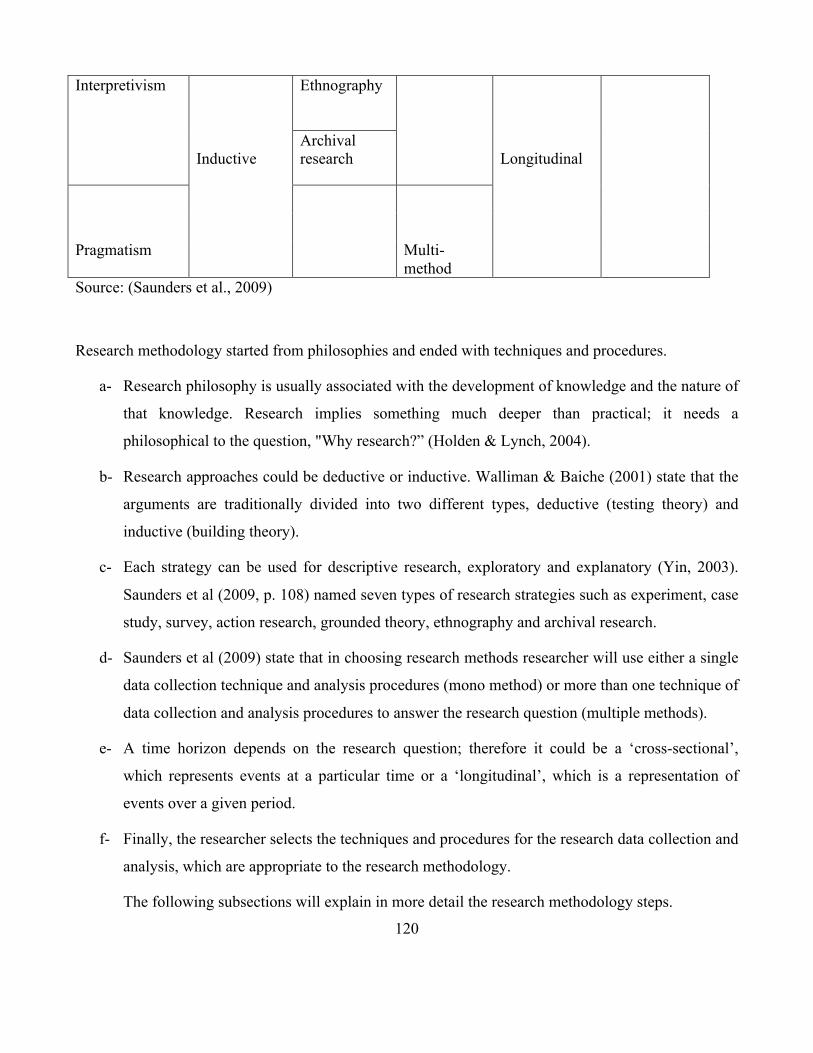
120
Interpretivism Inductive
Ethnography Longitudinal
Archival research
Pragmatism
Multi- method
Source: (Saunders et al., 2009)
Research methodology started from philosophies and ended with techniques and procedures.
a- Research philosophy is usually associated with the development of knowledge and the nature of
that knowledge. Research implies something much deeper than practical; it needs a
philosophical to the question, "Why research?” (Holden & Lynch, 2004).
b- Research approaches could be deductive or inductive. Walliman & Baiche (2001) state that the
arguments are traditionally divided into two different types, deductive (testing theory) and
inductive (building theory).
c- Each strategy can be used for descriptive research, exploratory and explanatory (Yin, 2003).
Saunders et al (2009, p. 108) named seven types of research strategies such as experiment, case
study, survey, action research, grounded theory, ethnography and archival research.
d- Saunders et al (2009) state that in choosing research methods researcher will use either a single
data collection technique and analysis procedures (mono method) or more than one technique of
data collection and analysis procedures to answer the research question (multiple methods).
e- A time horizon depends on the research question; therefore it could be a ‘cross-sectional’,
which represents events at a particular time or a ‘longitudinal’, which is a representation of
events over a given period.
f- Finally, the researcher selects the techniques and procedures for the research data collection and
analysis, which are appropriate to the research methodology.
The following subsections will explain in more detail the research methodology steps.

121
5.5 Research Philosophy
Easterby-Smith et al, (2002, p. 27) emphasise that:
“There are at least three reasons why an understanding of philosophical issues is very useful. First, it
can help to clarify research designs. Second, knowledge of philosophy can help the researcher to
recognise which designs will work and which will not. It should enable the researcher to avoid going
up too many blind alleys and should indicate the limitations of particular approaches. Third, knowledge
of philosophy can help the researcher identify, and even create, designs that may be outside his or her
past experience. And it may also suggest how to adapt research designs according to the constraints of
different subject of knowledge structures”.
Sekaran (2003) notes that research design involves a series of rational decisions. These include
identifying the purpose of the study, testing whether it is exploratory, and descriptive or testing
hypothesis. Also, deciding the degree of involvement of the researcher could identify the elements of
the study configuration: measurement and measures; data analysis; methods of data collection, time
horizon, sampling design and unit of analysis.
The development of a philosophical perspective requires the researcher to make several core
assumptions concerning two dimensions; namely the nature of society and the nature of science
(Burrell & Morgan, 1979) . Holden & Lynch (2004) state that the sociological dimension consists of
two views of society: regulatory view and radical change view. In a regulatory view of society, the
researcher assumes that society evolves rationally. On the other hand, the radical change view sees
society as being in constant battle while humans struggle to free themselves from the control of societal
structures. The other dimension, science, includes either a subjective or an objective approach to
research, and these two main philosophical approaches are defined by several basic assumptions
concerning ontology (reality), epistemology (knowledge), human nature (predetermined or not) and
methodology. Research methodology writers differ in the number of paradigms that are identified, and
labels that are given, but the most common classification, used, for example, by Collis and Hussey
(2003) is the identification of two main research paradigms or philosophies: positivist and
phenomenological. Some authors prefer the term ‘interpretive’ to ‘phenomenological’, as it implies a
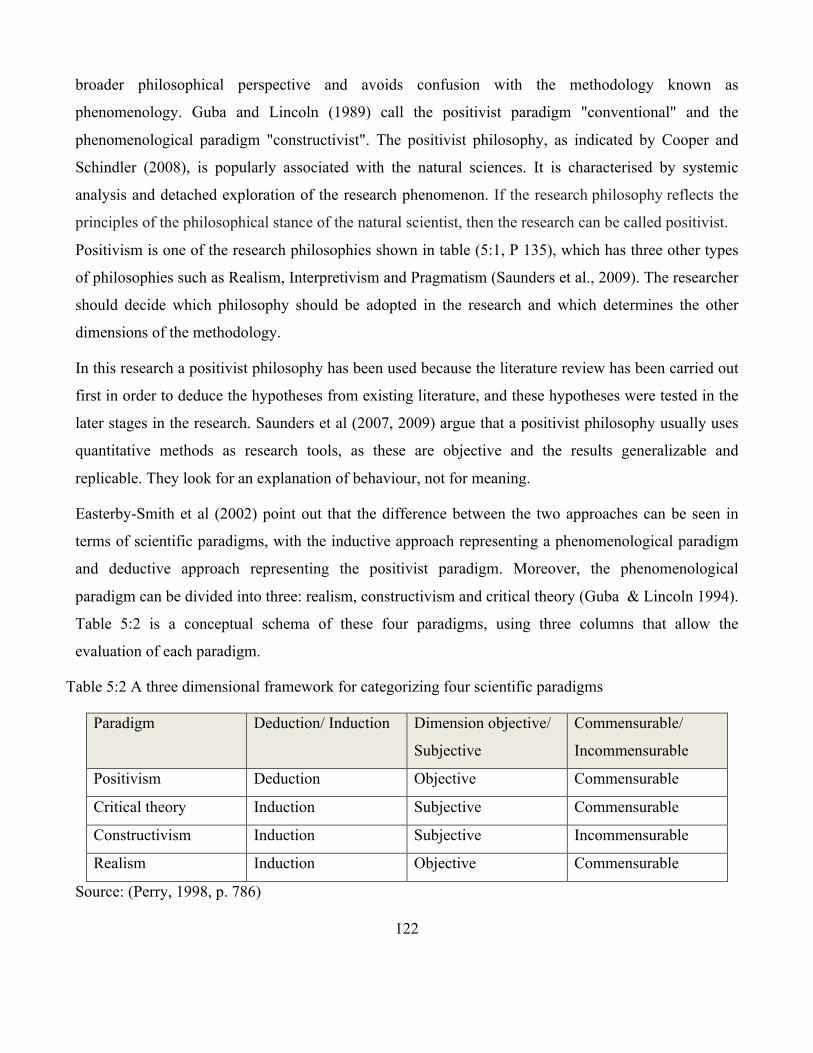
122
broader philosophical perspective and avoids confusion with the methodology known as
phenomenology. Guba and Lincoln (1989) call the positivist paradigm "conventional" and the
phenomenological paradigm "constructivist". The positivist philosophy, as indicated by Cooper and
Schindler (2008), is popularly associated with the natural sciences. It is characterised by systemic
analysis and detached exploration of the research phenomenon. If the research philosophy reflects the
principles of the philosophical stance of the natural scientist, then the research can be called positivist.
Positivism is one of the research philosophies shown in table (5:1, P 135), which has three other types
of philosophies such as Realism, Interpretivism and Pragmatism (Saunders et al., 2009). The researcher
should decide which philosophy should be adopted in the research and which determines the other
dimensions of the methodology.
In this research a positivist philosophy has been used because the literature review has been carried out
first in order to deduce the hypotheses from existing literature, and these hypotheses were tested in the
later stages in the research. Saunders et al (2007, 2009) argue that a positivist philosophy usually uses
quantitative methods as research tools, as these are objective and the results generalizable and
replicable. They look for an explanation of behaviour, not for meaning.
Easterby-Smith et al (2002) point out that the difference between the two approaches can be seen in
terms of scientific paradigms, with the inductive approach representing a phenomenological paradigm
and deductive approach representing the positivist paradigm. Moreover, the phenomenological
paradigm can be divided into three: realism, constructivism and critical theory (Guba & Lincoln 1994).
Table 5:2 is a conceptual schema of these four paradigms, using three columns that allow the
evaluation of each paradigm.
Table 5:2 A three dimensional framework for categorizing four scientific paradigms
Paradigm Deduction/ Induction Dimension objective/
Subjective
Commensurable/
Incommensurable
Positivism Deduction Objective Commensurable
Critical theory Induction Subjective Commensurable
Constructivism Induction Subjective Incommensurable
Realism Induction Objective Commensurable
Source: (Perry, 1998, p. 786)
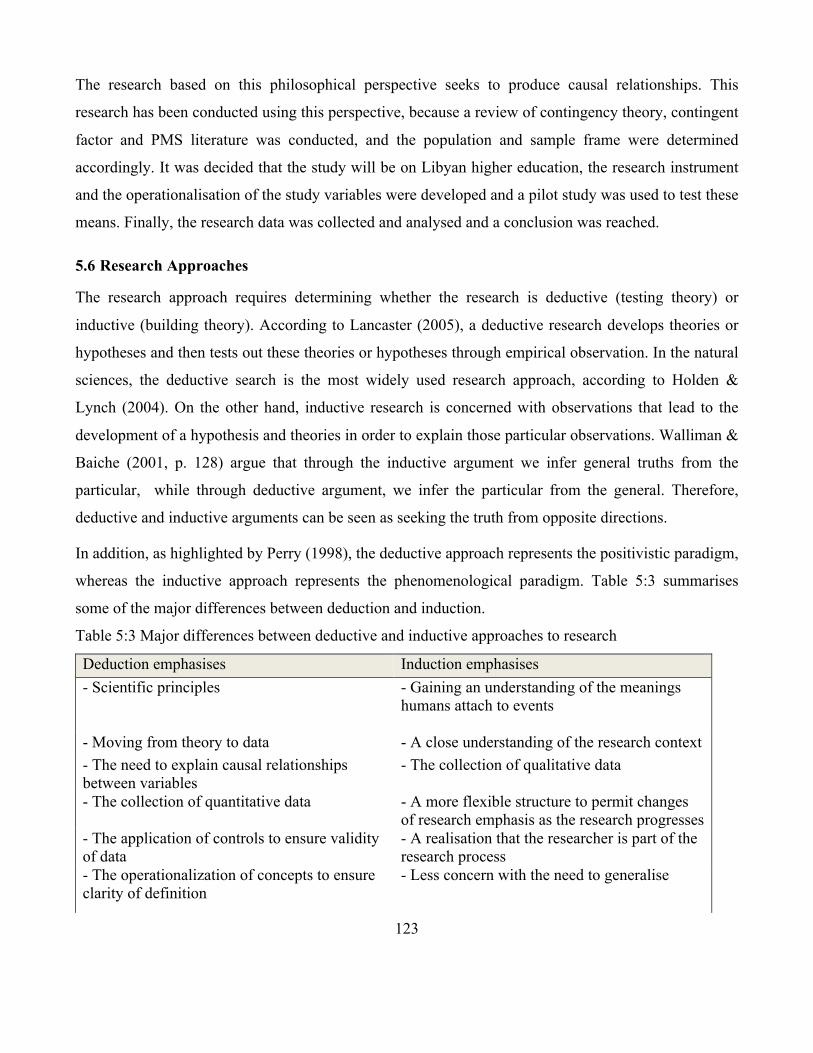
123
The research based on this philosophical perspective seeks to produce causal relationships. This
research has been conducted using this perspective, because a review of contingency theory, contingent
factor and PMS literature was conducted, and the population and sample frame were determined
accordingly. It was decided that the study will be on Libyan higher education, the research instrument
and the operationalisation of the study variables were developed and a pilot study was used to test these
means. Finally, the research data was collected and analysed and a conclusion was reached.
5.6 Research Approaches
The research approach requires determining whether the research is deductive (testing theory) or
inductive (building theory). According to Lancaster (2005), a deductive research develops theories or
hypotheses and then tests out these theories or hypotheses through empirical observation. In the natural
sciences, the deductive search is the most widely used research approach, according to Holden &
Lynch (2004). On the other hand, inductive research is concerned with observations that lead to the
development of a hypothesis and theories in order to explain those particular observations. Walliman &
Baiche (2001, p. 128) argue that through the inductive argument we infer general truths from the
particular, while through deductive argument, we infer the particular from the general. Therefore,
deductive and inductive arguments can be seen as seeking the truth from opposite directions.
In addition, as highlighted by Perry (1998), the deductive approach represents the positivistic paradigm,
whereas the inductive approach represents the phenomenological paradigm. Table 5:3 summarises
some of the major differences between deduction and induction.
Table 5:3 Major differences between deductive and inductive approaches to research
Deduction emphasises Induction emphasises - Scientific principles
- Gaining an understanding of the meanings humans attach to events
- Moving from theory to data - A close understanding of the research context - The need to explain causal relationships between variables
- The collection of qualitative data
- The collection of quantitative data - A more flexible structure to permit changes of research emphasis as the research progresses
- The application of controls to ensure validity of data
- A realisation that the researcher is part of the research process
- The operationalization of concepts to ensure clarity of definition
- Less concern with the need to generalise
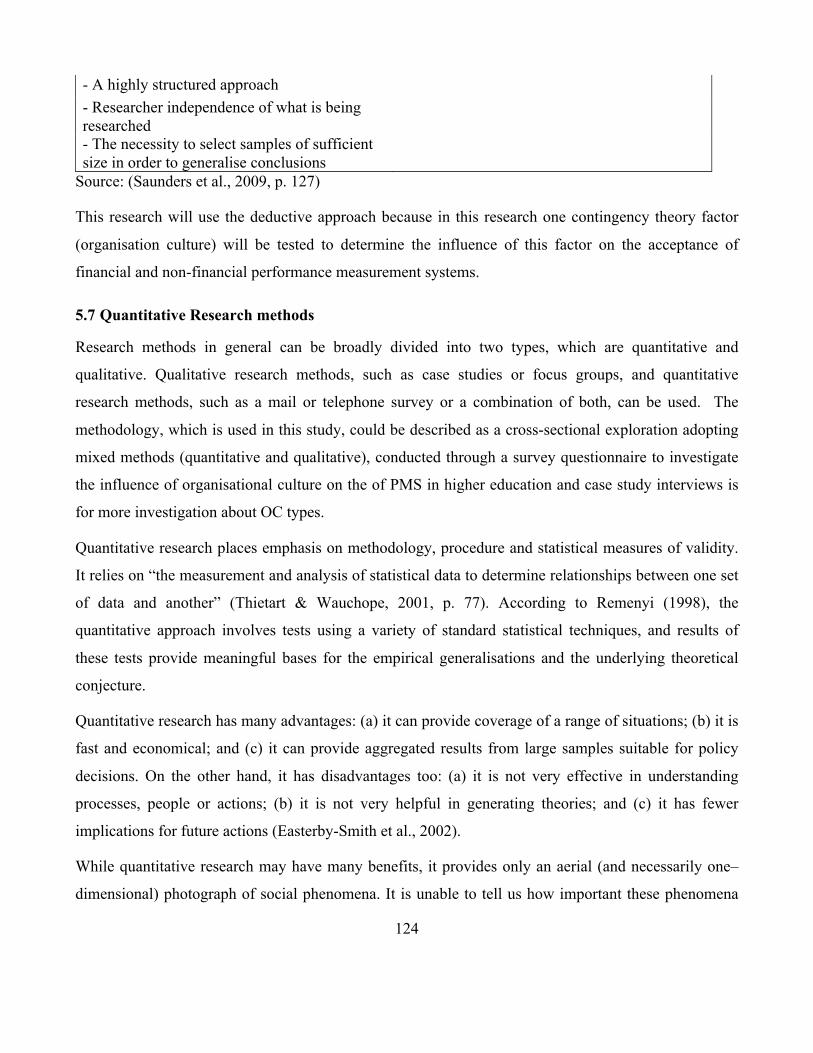
124
- A highly structured approach - Researcher independence of what is being researched
- The necessity to select samples of sufficient size in order to generalise conclusions
Source: (Saunders et al., 2009, p. 127)
This research will use the deductive approach because in this research one contingency theory factor
(organisation culture) will be tested to determine the influence of this factor on the acceptance of
financial and non-financial performance measurement systems.
5.7 Quantitative Research methods
Research methods in general can be broadly divided into two types, which are quantitative and
qualitative. Qualitative research methods, such as case studies or focus groups, and quantitative
research methods, such as a mail or telephone survey or a combination of both, can be used. The
methodology, which is used in this study, could be described as a cross-sectional exploration adopting
mixed methods (quantitative and qualitative), conducted through a survey questionnaire to investigate
the influence of organisational culture on the of PMS in higher education and case study interviews is
for more investigation about OC types.
Quantitative research places emphasis on methodology, procedure and statistical measures of validity.
It relies on “the measurement and analysis of statistical data to determine relationships between one set
of data and another” (Thietart & Wauchope, 2001, p. 77). According to Remenyi (1998), the
quantitative approach involves tests using a variety of standard statistical techniques, and results of
these tests provide meaningful bases for the empirical generalisations and the underlying theoretical
conjecture.
Quantitative research has many advantages: (a) it can provide coverage of a range of situations; (b) it is
fast and economical; and (c) it can provide aggregated results from large samples suitable for policy
decisions. On the other hand, it has disadvantages too: (a) it is not very effective in understanding
processes, people or actions; (b) it is not very helpful in generating theories; and (c) it has fewer
implications for future actions (Easterby-Smith et al., 2002).
While quantitative research may have many benefits, it provides only an aerial (and necessarily one–
dimensional) photograph of social phenomena. It is unable to tell us how important these phenomena
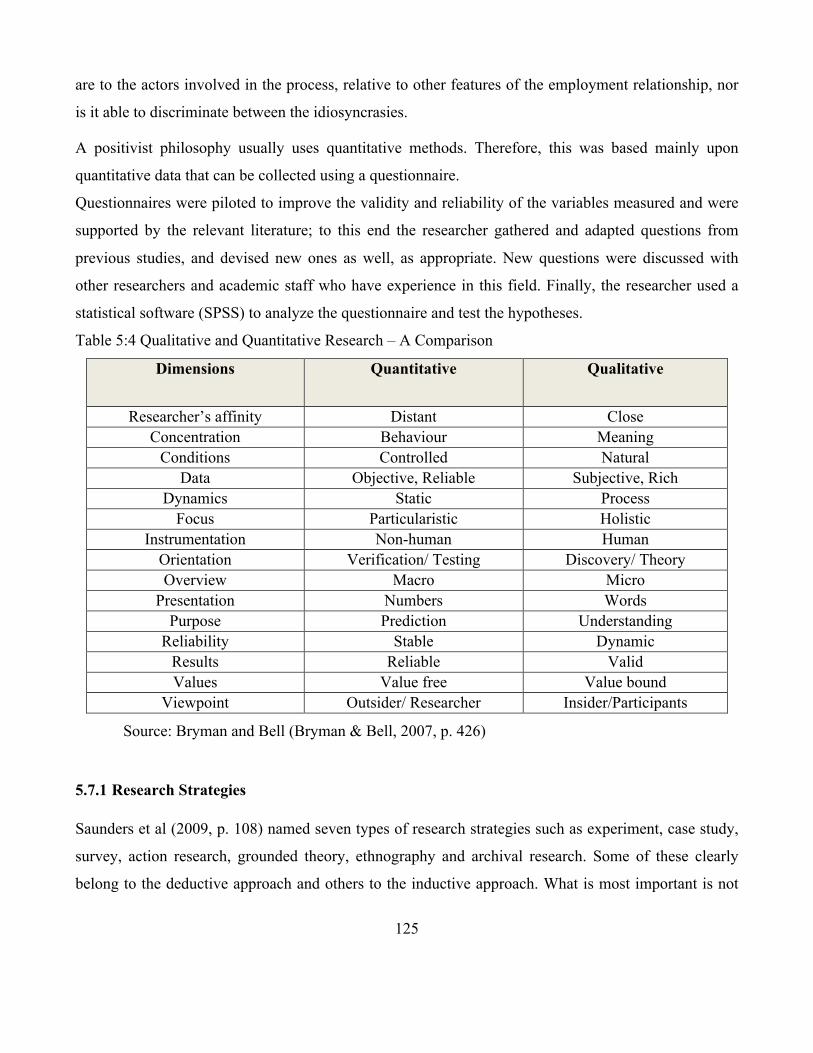
125
are to the actors involved in the process, relative to other features of the employment relationship, nor
is it able to discriminate between the idiosyncrasies.
A positivist philosophy usually uses quantitative methods. Therefore, this was based mainly upon
quantitative data that can be collected using a questionnaire.
Questionnaires were piloted to improve the validity and reliability of the variables measured and were
supported by the relevant literature; to this end the researcher gathered and adapted questions from
previous studies, and devised new ones as well, as appropriate. New questions were discussed with
other researchers and academic staff who have experience in this field. Finally, the researcher used a
statistical software (SPSS) to analyze the questionnaire and test the hypotheses.
Table 5:4 Qualitative and Quantitative Research – A Comparison
Dimensions Quantitative Qualitative
Researcher’s affinity Distant Close Concentration Behaviour Meaning
Conditions Controlled Natural Data Objective, Reliable Subjective, Rich
Dynamics Static Process Focus Particularistic Holistic
Instrumentation Non-human Human Orientation Verification/ Testing Discovery/ Theory Overview Macro Micro
Presentation Numbers Words Purpose Prediction Understanding
Reliability Stable Dynamic Results Reliable Valid Values Value free Value bound
Viewpoint Outsider/ Researcher Insider/Participants
Source: Bryman and Bell (Bryman & Bell, 2007, p. 426)
5.7.1 Research Strategies
Saunders et al (2009, p. 108) named seven types of research strategies such as experiment, case study,
survey, action research, grounded theory, ethnography and archival research. Some of these clearly
belong to the deductive approach and others to the inductive approach. What is most important is not

126
the name of the strategy, but whether it helps the researcher to answer the research question(s) and
meet research objectives.
As mentioned in the discussion on research approach earlier, this research used a deductive approach to
answer the research questions and to meet the research objectives. A cross-sectional questionnaire
survey technique was used in this research as it is considered to be the most widely used by empirical
studies in the social sciences.
5.7.2 Survey
A survey provides a quantitative or numerical description of trends, attitudes, or opinions of a
population by studying a sample of that population (Creswell, 2009).
A survey is a popular and common strategy in business and management research and is most
frequently used to answer questions that start with ‘who’, ‘what’, ‘where’, ‘how much’ and ‘how
many’ (Saunders et al, 2007). In addition, a survey is not just a particular technique of collecting
information by questionnaires; other techniques such as structured and in depth interviews and
observations can also be used (De Vaus, 2002). Sharma (2008) argues that survey research is widely
regarded as inherently quantitative and positivist and is contrasted to qualitative methods involving
unstructured interviews, participant observation, focus groups, case studies etc.
Thus, this technique has been chosen as the main method for data collection to attain the aim and
objectives of this study, because according to the literature, a survey method was the main method in
similar studies: (Abraham et al., 2004; Ali Mohammad Mosadegh, 2006; Aljaz, 2011; Ehtesham, 2011;
Henri, 2006; Kevin et al., 2011; Lok & Crawford, 2004; Twati & Gammack, 2006; Zahari & Shurbagi,
2012). In addition, a survey strategy is usually associated with the deductive approach and allows the
researcher to collect quantitative data that can be analysed statistically in later stages. Therefore, the
research mainly applied a quantitative approach to address the research objective and questions, in
order to assess the likely impacts of contingency theory factors on the effectiveness of performance
measurement systems.
5.7.3 Research Design
Research design is the general plan conceived to answer the research questions formulated, and it must
be chosen as a function of the research situation (Saunders et al., 2007). Furthermore, Bryman and Bell,
(2007), have outlined the following designs for business research:
127
a) Experimental design (such as the quasi-experiment, laboratory experiments);
b) Cross-sectional design, the most common form of the social survey research;
c) Longitudinal design (such as panel study and the cohort study); and
d) Case study design.
Research design is usually assumed to be a way of conducting research, which incorporates a particular
style and employs different research methods. Each research design has its own specific approach to
the collection and analysis of empirical data and, therefore, has its own advantages and disadvantages.
Although each research has a unique design that defines overlapping areas, the complexity of design
choice remains.
Research design adopting in this study mixed methods (quantitative and qualitative), conducted
through a survey questionnaire and interviews to investigate the influence of the organisational culture
on the acceptance of performance measurement systems in higher education and their impact on
organisational performance.
The following sub-section describes in detail the questionnaire survey technique selected by the
research design for this study.
5.7.4 Questionnaire Design
A considerable amount of attention was paid to the development of the questionnaire, and several drafts
including an assessment and pre-test were trialled before choosing the final version of the
questionnaire. The questionnaire was designed to obtain information on performance measurement
systems, contingent factor of organisational culture in Libyan higher education. The questionnaire was
chosen according to the literature as suggested by (Ehtesham, 2011).
Therefore, a set of requirements was taken into account during the various steps in the construction of
the questionnaire, as recommended by many authors such as Oppenheim (1992) and Collis & Hussey
(2009).These requirements are as follows:
1- Use clear, simple and direct language, avoid words that carry more than one meaning and use
short questions as much as possible in a way that does not affect content and meaning.
2- Coordinate the questionnaire and design a good layout for the questions, using a consistent style
in each section, and allow clear answers to the questions by making them easy to follow.
128
3- Help the participants through the questionnaire by providing questions that are similar in
content in the same sections. Start the questionnaire with general questions followed by more
specific questions to give more confidence to respondents, in order to enable them to respond to
the rest of the questionnaire. Move through questions in a logical sequence, without making
major changes or spaces for respondents.
4- Easterby-Smith et al. (2002; Van de, Wilhelmus, & Anderson, 2004) indicate that the important
decisions to be considered in questionnaire design are related to the types of questions to be
used and the overall format of the questionnaire. They also suggest that the type of questions is
associated with the aim and paradigm adopted in the research (Van de et al., 2004).
5- Several researchers recommend using closed questions in long and comprehensive
questionnaires, as they are quicker and easier to answer and then be coded (Cooper &
Schindler, 2008; De Vaus, 2002; Hair, 2011; Mangione, 1995).
6- A five-point scale was used in all questions except those questions regarding general
information about the respondents and general information about the organisations. In this
regard, it was pointed out that a five-point scale is perfectly adequate, and that an increase to
seven or nine points on a rating scale does not have an impact in improving the reliability of the
ratings (Elmore & Beggs, 1975; Sekaran, 2003).
7- Present appearance of the questionnaire perfectly, because this gives an initial impression about
the seriousness and importance of the questionnaire.
8- Finally, test the questionnaire in the pilot study.
5.7.5 Research Population
The study included 102 Libyan public higher education institutions listed by the Libyan as being in
higher education in the year 2011/2012; this information is shown in table (5:5). The study also
included about 20 private higher education institutions. According to Easterby-Smith et al (2002)
when the population is small (less than 500), it is customary to use a 100 per cent sample, which is
called a census sample, in which the questionnaire is sent to all the members of the research
population. Because the population of this research was relatively small, the target sample was the
entire population. Therefore, the entire population, which consists of 122 Libyan higher educational
institutions, was targeted as the sample for this research. The main reason for choosing the entire
population was to ensure that the sample is representative and not biased. The questionnaire was
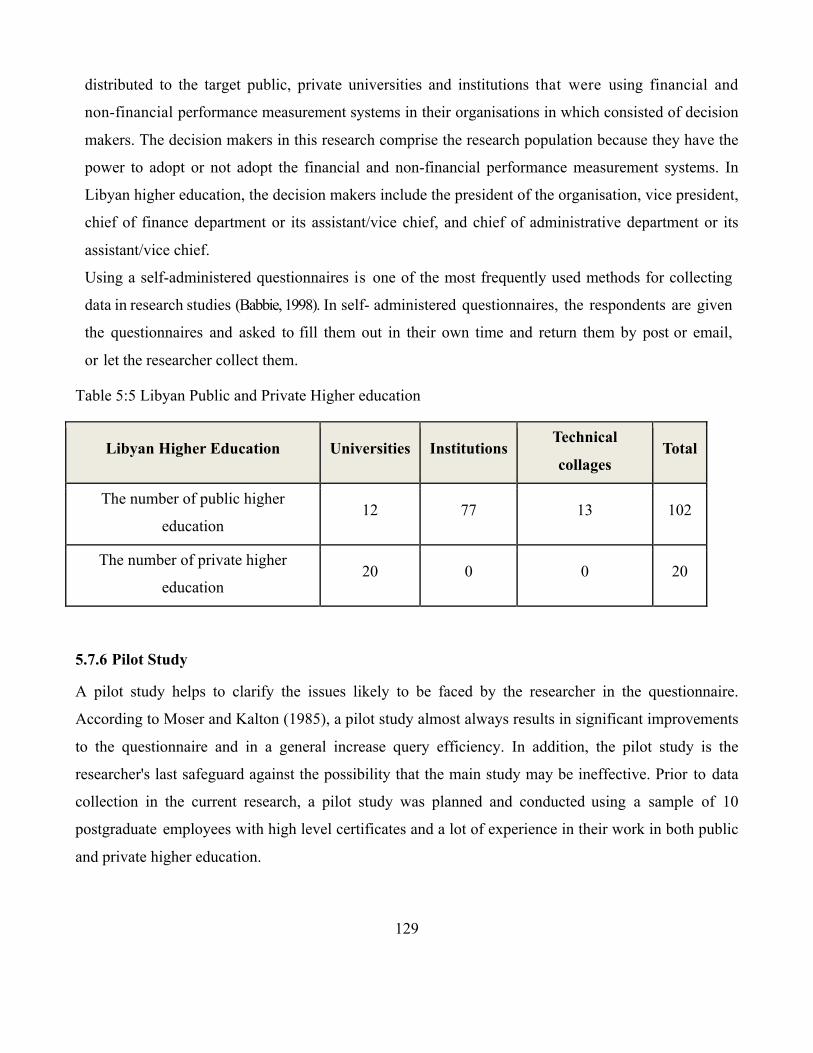
129
distributed to the target public, private universities and institutions that were using financial and
non-financial performance measurement systems in their organisations in which consisted of decision
makers. The decision makers in this research comprise the research population because they have the
power to adopt or not adopt the financial and non-financial performance measurement systems. In
Libyan higher education, the decision makers include the president of the organisation, vice president,
chief of finance department or its assistant/vice chief, and chief of administrative department or its
assistant/vice chief.
Using a self-administered questionnaires is one of the most frequently used methods for collecting
data in research studies (Babbie, 1998). In self- administered questionnaires, the respondents are given
the questionnaires and asked to fill them out in their own time and return them by post or email,
or let the researcher collect them.
Table 5:5 Libyan Public and Private Higher education
Libyan Higher Education Universities Institutions Technical
collages Total
The number of public higher
education 12 77 13 102
The number of private higher
education 20 0 0 20
5.7.6 Pilot Study
A pilot study helps to clarify the issues likely to be faced by the researcher in the questionnaire.
According to Moser and Kalton (1985), a pilot study almost always results in significant improvements
to the questionnaire and in a general increase query efficiency. In addition, the pilot study is the
researcher's last safeguard against the possibility that the main study may be ineffective. Prior to data
collection in the current research, a pilot study was planned and conducted using a sample of 10
postgraduate employees with high level certificates and a lot of experience in their work in both public
and private higher education.
130
All the participants had held middle and senior management positions for at least five years. A total of
10 questionnaires were distributed in two languages (Arabic and English), according to the preference
of the participant. A total of 6 completed questionnaires were returned. Management experience was
considered an important factor in choosing the sample respondents of the pilot study because the
researcher is measuring the influence of organisational culture on the acceptance of performance
measurement systems, and inexperienced employees are less likely to have a sense of the culture of the
organisation. The experience of the pilot study respondents with PMS in general, and another important
factor that gives us an indication of whether the organisations are using financial and non-financial of
PMS to assess the response of the employees to the use of PMS.
The pilot study served as a useful training experience for administering the questionnaire. Results and
feedback from the pilot study were helpful in revising the questionnaire and changes were made
accordingly. Some of the questions were revised, reworded, or eliminated, according to the results of
the data collected from the pilot study and by using the respondents’ comments; the questionnaire was
thus upgraded to its final usable version. Changes included:
1. Adjusting the wording of the Arabic version of the questionnaire to make it more understandable.
2. Deleting a number of questions that are not suitable for Libya's environment.
5.7.7 Translation of the Questionnaire
This study explores the influence of OC on PMS in Libya, where Arabic is the official language, and is
not extensively utilised in the higher education sector; therefore, the questionnaire needed to be
translated to make it very clear to the respondents.
To avoid potential problems related to the translation process, some steps were considered in the design
of the Arabic version, such as a review of previous questionnaires related to OC and PMS in the Arab
countries initially written in English and rendered to Arabic. This review provides useful information
regarding the most appropriate translation of given business words and expressions used in the
questionnaires. The two versions of the questionnaire (English and Arabic) were delivered to the
private translation office in the capital of Libyan (Tripoli) to review them in order to avoid any
prejudice that may be encountered if the researcher approved the translation herself. Moreover, one of
the main objectives of pilot study was to ensure that the translation process would not yield any
misinterpretation of the questionnaire itself. The pilot study offered the possibility of translation
problems with participants who were familiar with both languages (e.g., professionals and academics).
131
Consequently, some changes and modifications were made to the questionnaire before it was finally
delivered; for example, the expression "organisational glue" cannot be translated literally.
5.7.8 Data Collection
Data collection is the process of gathering the required information for each selected unit in the survey.
There are many methods that can be considered for collecting data in survey research. The selection of
the method of data collection in survey research depends mainly on the availability of samples, the
desired size of the sample and the research objective and budget (A. Venkatesh & Vitalari, 1991). The
most commonly used method of data collection is the self-administered questionnaire.
The first step in data collection involved the researcher using the information from the Ministry of
Higher Education and Scientific Research in Libya to identify a listing of all the potential organisations
that could participate in the study. Emails with questionnaires were sent to 21.5% (105 in number) of
these organisations. About 50% (244 in number) of the questionnaires were distributed by post. The
researcher visited about 28.5% of the target higher education universities and institutions to distribute a
total of 139 questionnaires. The researcher introduced herself in the beginning of the questionnaire, and
a glossary was included in the questionnaire with more information to help respondents who were
willing to participate in the survey.
5.7.9 Mailing-Out of Questionnaires
Due to the nature of the research study and the large geographic area of Libya, which has a total area of
1,775,500 square kilometres, three different methods of distributing the questionnaires were used:
directly handing questionnaires to respondents, using email with an attachment and using Libyan
higher education post system. Organisations, which are part of the all-Libyan higher education system,
were visited by the researcher, who met some of the senior and middle management officials in charge
of Libyan higher education to discuss the nature of the study, to explain its aims and purposes, and to
obtain their permission to conduct the study in their universities and institutions. The senior
management of the higher education sector in Libya nominated a contact person from the department
of services and public affairs to help introduce the researcher to the participants and to help distribute
the questionnaires. The researcher personally distributed the questionnaires to some of the participants,
who were given time to fill them out in their own time. The researcher personally collected each

132
questionnaire from the participants, received respondents’ emails and received posted questionnaires in
sealed envelopes to ensure their privacy, confidentiality and anonymity.
5.7.10 Follow-up and Questionnaire Collection
The literature suggests that a follow-up on survey questionnaires is strongly recommended for
increasing the return rates. At the same time, it is crucial that participation is voluntary and that
potential participant’s feel under no obligation to be involved. In the present study, a period of one
week was given to each participant to answer the questionnaire and have it ready for collection or send
it by using any convenient method (email or regular post) to the researcher personally.
In the case of some of the participating organisations, after the researcher has met participants to
distribute questionnaires, she later sent them a reminder by phone or email. If the questionnaire was
still not filled in after a week, another week was given. If it was still not ready because the participant
had lost the questionnaire, a replacement was given and a further one-week period was added to the
timeframe. After three weeks, the researchers checked with the participants to find out whether they
were still interested in participating in the study. If they were, the researcher offered to collect the
questionnaire later that day or the next day.
5.7.11 Questionnaire Data Analysis
The respondents were asked in the questionnaire to give information about the acceptance, importance
and use of the performance measurement systems. Also, to investigate the contingent factor of
organisational culture types in Libyan higher education, data were analysed using the Statistical
Package for Social Sciences (SPSS) version 20.0 for Mac software. Descriptive statistics, which
include frequencies and percentages, were utilized to present the main characteristics of the sample and
the profile of organisational culture and information related to the acceptance, importance and use of
performance measurement systems.
5.7.12 Response Rate
As shown in table 4:6, the sample of this study consists of two types of Libyan higher education,
namely, public and private. Libyan higher education consists of three types of institutions (universities,
higher institutions and technical collages. The intended participant lists covered the entire population of

133
all groups (universities, higher institutions and technical collages) in public higher education. A
personally administered questionnaire survey was carried out on 488 participants (see table 4:6): 80 in
private higher education, and 408 in public higher education; these participants were from 48
universities, 308 higher institutions, and 52 technical collages.
The questionnaires not returned from the respondents were 172 in number (35 per cent): 37 from
private higher education, and 135 for public higher education (both institution types represented by 12
universities, 110 higher institutions, and 13 technical colleges.
Received questionnaires were 316, which constituted about 65 per cent of the questionnaires
distributed. Of these, 59 questionnaires were incomplete and thus not acceptable for the purpose of the
research. The usable questionnaires amounted to 257 (53 per cent). As a result, the general response
rate over all groups was 53%, which is considered a good response rate compared to other studies
conducted in the same field, where the response rate was 38.2 (Saunders et al., 2007)
Table 5:6 The Questionnaire Distribution and Response Rate
Higher Education
The number of
higher education
Distributed Question-
naires
Not Received Question-
naires
Received Question-
naires
Excluded Question-
naires
Usable Question-
naires
Response Rate (%)
Private Higher Education
20 80 37 43 6 37 46%
Public Higher Education
102 408 135 273 53 220 54%
Universities 12 48 12 36 7 29 60%
Institutions 77 308 110 198 34 164 53%
Technical colleges
13 52 13 39 12 27 52%
Total 122 488 172 316 59 257
53%
Response Rate (%)
100% 35% 65% 12% 53%
134
5.7.13 Organisational Culture Data Analysis
The organisational culture assessment instrument (OCAI) devised by (K. Cameron & Quinn, 2011) was
been chosen to be a conceptual model for determining organisational culture type, because the research
design was to focus on major cultural dimensions useful in organising and understanding organisational
phenomena. Using the OCAI, an organisational culture profile can be verified by determining the
organisation's dominant culture type characteristics. The Competing Values Framework (CVF) model
developed by (K. Cameron & Quinn, 2011) was chosen to be a measurement tool for Organisational
Culture (OC) to examine aspects of dominant organisational culture types in Libyan higher education
sector.
The analysis was by using the following formulae:
Clan Culture = Mean (Clan Culture1 + Clan Culture 2 + Clan Culture 3 + Clan Culture 4 + Clan
Culture 5 + Clan Culture 6)
In which Clan Culture 1 is the mean score for question C1A, and Clan Culture 2 is the mean score for
question C2A, etc. (Appendix A).
Adhocracy Culture = Mean (Adhocracy Culture 1 + Adhocracy Culture 2 + Adhocracy Culture 3 +
Adhocracy Culture 4 + Adhocracy Culture 5 + Adhocracy Culture 6)
In which Adhocracy Culture 1 is the mean score for question C1B, and Adhocracy Culture 2 is the
mean score for question C2B, etc. (Appendix A).
Market Culture = Mean (Market Culture 1 + Market Culture 2 + Market Culture 3 + Market Culture 4
+ Market Culture 5 + Market Culture 6)
In which Market Culture 1 is the mean score for question C1C, and Market Culture 2 is the mean score
for question C2C, etc. (Appendix A).
Hierarchy Culture = Mean (Hierarchy Culture 1 + Hierarchy Culture 2 + Hierarchy Culture 3 +
Hierarchy Culture 4 + Hierarchy Culture 5+ Hierarchy Culture 6)
In which Hierarchy Culture 1 is the mean score for question C1D, and Hierarchy Culture 2 is the mean
score for question C2D, etc. (Appendix A).

135
5.7.14 Performance Measurement Systems Data Analysis
This subsection seeks to explore the status of performance measurement systems in Libyan higher
education, through an investigation of the frequency, percentage and mean of the use of PMS on one
hand, and the responses related to the importance of PMS on the other.
In order to measure higher education's acceptance of performance measurement systems (PMS), a fixed
set of PMS categories were developed. The respondents were asked about their use of financial, non-
financial and advanced techniques of PMS, and of the relative importance of these techniques in
evaluating organisational performance. Moreover, the effectiveness of using advanced techniques of
performance measurement systems (e.g. balanced scorecard) to evaluate organisational performance
was investigated, alongside responses regarding the usefulness of using PMS in the respondents’ jobs.
The present study investigated both financial and non-financial performance measurement systems
acceptance and to what extent PMS influence the organisational performance. In addition, the advanced
technique of the balanced scorecard was investigated for its role in the effectiveness and usefulness in
the organisational performance. The first three questions in section D (D1, D2, D3) were about how
using multiple performance measurement systems (financial, non-financial, advanced techniques)
would enable organisations to evaluate the organisational performance. The fourth and fifth questions
in the same section (D4, D5) were about the effectiveness and usefulness of performance measurement
system in organisational performance (see appendix B). In addition to investigate the acceptance of
performance measurement systems in Libyan higher education, the study explored the importance of
performance measurement systems (financial, non-financial, and advanced techniques) to discover to
what extent the performance measurement systems are important in Libyan education sector as drivers
of the long-term success. The first question in section E (E1) was about the financial PMS (e.g. annual
earnings, return on assets, cost reduction, general administrative expenditures per student tuition and
fee levels etc.), and the other questions (E2, E3, E4, E5, E6) were about non-financial PMS (Customer,
innovation, employee, quality, community) (see appendix B).
This study investigated the importance of performance measurement systems in Libyan higher
education; it also investigated the use of performance measurement systems (financial, non-financial,
advanced techniques) to find out to what extent the performance measurements systems are used in
Libyan higher education sector to evaluate performance. The first question in section F (F1) was about
136
the financial performance measurement systems (e.g. annual earnings, return on assets, cost reduction,
general administrative expenditures per student tuition and fee levels etc.), and the other questions (F2,
F3, F4, F5, F6) were about non-financial performance measurement systems (Customer, innovation,
employee, quality, community). Five-point scales (Likert scale) are used to investigate the extent of
using of financial and non-financial performance measurement systems in Libyan higher education
sector. (1= Not used at all, 2= Slightly used, 3= Moderately used, 4= Significantly used, 5= Highly
used).
5.7.15 The Influence of PMS on OC Data Analysis
The study investigated the influence of organisational culture on the acceptance of performance
measurement systems, both financial and non-financial, to understand the extent of their acceptance,
importance and use in Libyan higher education. Moreover, the advanced technique of the balanced
scorecard was investigated for its role in the effectiveness and usefulness in organisational
performance. To investigate the influence of the acceptance, importance and use of the performance
measurement systems as a dependent variables in this research, and the four types of organisational
culture as an independent variables. Therefore, a Pearson correlation and a multiple linear regression
analysis were used to test hypotheses in this study.
Pearson correlation, “A correlation expresses the extent to which two variables vary together. A
positive correlation means that as one variable increases so does the other. A negative correlation is
when one variable increases as the other decreases. Correlations vary between -1.00 and +1.00; a
correlation of 0.00 means there is no relationship between the two variables.” (Foster, 2002). Pearson
correlation is used for exploring the strength of the relationship between two continuous variables. This
gives you an indication of both the direction (positive or negative) and the strength of the relationship.
Multiple linear regression analysis: Regression analysis is a way of predicting an outcome variable
from one predictor variable (simple regression) or several predictor variables (multiple regression)
(Field, 2009). A multiple regression is a more sophisticated extension of correlation and is used to
explore the predictive ability of a set of independent variables on one continuous dependent measure
(Pallant, 2007). Different types of multiple regressions allow you to compare the predictive ability of
particular independent variables and to find the best set of variables to predict a dependent variable.
The interpretation values between are between 0 and 1, and different authors suggest different
interpretations; however, Cohen (1988) suggests the following guidelines:
137
r=0.10 to 0.29 or r=–0.10 to –0.29 small
r=0.30 to 0.49 or r=–0.30 to – 4.9 medium
r=0.50 to 1.0 or r=–0.50 to –1.0 large
This study examined one independent variable (organisational culture). However there are other
potential impacts of omitted variables (e.g. government, environment or structure), which are also
important. For these reasons, the study relied on several signals to illustrate the importance of the
elements of organisational culture through several indicators in the multiple regression analysis. While
adjusted R square is one of the indicators to show the model fit, Maddala (1977) argued that a higher R
square is not necessarily better than a lower R square. Therefore, we should also look at whether
coefficients have the right signs such as P value with a confidence level of 95% and an ANOVA test to
show that the F statistic is significant.
Another method to detect the multicollinearity problems is to evaluate the value of the Variance
Inflation Factor (VIF) and tolerance statistics, which are the common measures used to identify the
degree of multicollinearity of the independent variable with the other independent variables in a
regression model. In addition, the Variance Inflation Factor (VIF) is an indicator of the effect the other
explanatory variables have on the variance of a regression coefficient of a particular variable, given by
the reciprocal of the square of the multiple correlation coefficient of the variable with the remaining
variables (Everitt, 2002). The SPSS program performs a test for 'collinearity diagnostics’, which
includes both the variance inflation factor and tolerance Statistics as part of multiple regression
procedure (Firth, 1996; Laitinen, 2001). Many writers as (Field, 2009) and Hair et al. (1998) suggest
that VIF should be below 10 to indicate that there is no problem of multicollinearity among the
independent variables. In addition, it has also been recommended that the acceptable tolerance value
should not be less than 0.1 (Field, 2009; Hair, 1998).
When using regression analysis in this study, Hierarchy culture and Clan culture were found to have a
high VIF (Appendix E). As a result the estimated coefficients of the fitted model will be unstable as
multicollinearity arises because Clan and Hierarchy cultures have similar mean results and a strong
correlation (0.649) (Pallant, 2007, p. 150). As a result, the Clan culture or Hierarchy culture types
(dependent of which culture is the dominant culture type) variable will be excluded from the model in
order to avoid any unstable results.

138
5.8 Qualitative Research Methods
Qualitative research methods explore the experiences of people and can reveal a holistic in-depth
picture of a phenomenon and aim to understand human behaviour and the reasons that govern such
behaviour.
Qualitative research involves the study and collection of a variety of empirical materials, which may be
in the form of a case study, personal experience, life story, interview, observation, and/or visual texts;
these materials are used to describe routine and problematic moments and meanings of facts, events,
personalities and others (Denzin & Lincoln, 2005).
Four major sources of evidence for qualitative research have been identified in the literature: (a)
Observation, (b) Analysing texts and documents, (c) Interviews, and (d) Recording and transcribing
(Silverman, 2010). This thesis takes a qualitative approach with an emphasis on the case study by using
the interview method.
Qualitative evidence uses words to describe the situation, individuals, or circumstances surrounding a
phenomenon. Qualitative analysis deriving from open-ended questions can establish the reasons why
companies behave the way they do. This facilitates a better understanding, and provides further details
in relation to the practical behaviour of organisations. As a result, qualitative research methods are
associated with face-to-face contact with people in the research setting, together with verbal data and
observations. Qualitative data can also be collected in a number of forms, including the collection of
thoughts and opinions that are recorded verbatim through the use of tape recorders and later
transcribed.
Qualitative research methods can rarely handle large samples; quantitative methods, in contrast, can
cope with large samples, but some of the depth permitted by qualitative techniques is beyond their
reach (Glenn, 2010; Mutch & New Zealand Council for Educational Research, 2005).
Like the quantitative approach, qualitative research also has strengths and weaknesses. Strengths
include the facts such as: (a) its data gathering methods are seen as more natural than artificial; (b) it
has the ability to look at change processes over time; (c) it has the ability to understand people's
meanings; (d) it has the ability to adjust to new issues and ideas as they emerge; and (e) it can
contribute to theory generation. Its weaknesses can be summed up as: (a) it is tedious and requires more
resources; (b) it is difficult to analyse and interpret the data; (c) it is difficult to control the progress of
research process; and (e) it has low credibility among policy-makers (Easterby-Smith et al., 2002).
139
This thesis takes a qualitative approach with an emphasis on the case study
5.8.1 Qualitative Research Design: The Case Study
To identify the OC type in one of the Libyan higher education organisations in order to confirm one of
the main objectives of this research, in which the content emphasises the importance of organisational
culture. Yin (2003) pointed out that case studies can be utilised in many situations and that they help
contribute to the knowledge of individuals, groups, organisations, social, political, and other related
phenomena.
The selected case for study in this research is the University of Tripoli (UT). By way of introduction,
this section will provide some background information about the university.
The University of Tripoli (UT) is the largest university in Libya and is located in the capital, Tripoli. It
was founded in 1957, as a branch of the University of Libya before it was divided in 1973 and one part
become what are now known as the University of Tripoli. The Faculty of Science was established in
1957. It was the first practical college in Libya at that time, and thus became a focus for Libyan
students seeking a university degree. The faculty prepares specialists in fundamental and applied
sciences. In addition, the faculty performs scientific research and studies in various scientific fields.
Two good reasons to choose the UT for the case study are as follow:
1- The significance and contribution of the information from the selected institution from employees of
various levels support the questionnaire results of the OC type.
2- An earlier-established university is assumed to be more resilient and resistant to change than
universities that have been established more recently.
According to the University of Tripoli (UT, 2012), there were 43258 male and female students in 12
faculties in Tripoli, while there were two branch faculties of teachers training outside the University.
5.8.2 Descriptive of the Interviews Sample
The underlying purpose in conducting the interviews was to obtain more information about the
organisational culture type of the education sector in general, and of the University of Tripoli (UT) in
particular, in order to test the survey results drawn from decision makers’ responses. The majority of
the interviewees were employees in the finance and administrative departments, and the other
interviewees were employed as members of university teaching staff.

140
The data revealed that 50% of the interviewees had been in their current job for 1 -5 years. On the other
hand, 37.5% had 6-10 years’ experience with their current organisation, and 12.5% had more than 10
years’ experience. The interviewees of this group were highly experienced in their current organisation
as the result of their long period of employment with their organisation; all the case study participants
held a post-graduate degree (e.g. MSc, MBA, Ph.D.).
5.8.3 Data Collection: The interview methods
The interviews in this research constituted the second method of data collection to support the
questionnaire results regarding the OC types in Libyan higher education and to answer deep questions
of “why”. Robson, (2002, p. 371) argues that “multiple methods can be used in a complementary
fashion to enhance interpretability. For example, in a primarily quantitative study, the interpretation of
statistical analyses may be enhanced by a qualitative narrative account.”
Saunders, et al. (2007) classified interviews into three categories: structured, semi structured and
unstructured. Furthermore, they are used in different contexts: structured interviews are used in
descriptive studies to attain quantitative data whereby the researcher uses questionnaires based on a set
of questions that is prearranged and standardised or equal. Collies and Hussey (2003) noted that the
interview is "a technique of assembling information data within which designated participants are
asked as to search out what they are doing, assume or feel".
Interviews make it simple to compare responses and they may be face-to-face or screen-to-screen,
conducted with individuals or groups who can meaningfully help us address the research questions and
objectives. Interviews are particularly conducive to the production of data that deal with issues in depth
or in detail.
This qualitative study complements and affirms the quantitative component. The qualitative analysis
presented here is used as a follow-up for further clarification of the results of the survey. It helps to
confirm the results of the survey findings of the OC types in Libyan higher education.
In this research, the main techniques used to collect the field data were face-to-face interviews, while
both domestic and international telephone interviews were also undertaken as a supplementary tool.
To address the two research questions, there will be a reliance on two sets of interview questions. Each
set of interview questions has a unique purpose to serve and constructs the efficient data related to each
research question. The two sets of interview questions used during the field study were:
1. “General information about the interviewers”, presented in appendix C.
141
2. “Organisational culture types”, presented in appendix C.
There are several ways in which an interview may be conducted. These include face-to-face, telephonic
and online interaction. To answer research questions, the researcher conducted semi-structured face-to-
face interviews and recorded the responses. In the first part, introductory questions were asked at the
beginning of each interview including those that sought the respondent personal information. Bailey
(2007) recommends beginning the interview with an overview to help put participants at ease.
5.8.4 Structured interview
In using the structured interview, the preparation of the interview questions was controlled and guided
by a set of predetermined questions. In particular, this thesis discusses the questions involving the six
key elements derived from the adoption of the Competing Values Framework. Therefore, the structured
interviews discussed in this thesis were accomplished through the aspects of (1) organisation’s domain
characteristics (2) organisational leadership style (3) management of employees (4) organisation
glue/cohesion (5) strategic emphases (6) criteria of success.
With respect to the structured interview, it tailored the data collection process in such a way as to allow
the researcher to examine the level of understanding of the informants. Moreover, the technique helped
to create a space for standardisation in which all respondents provided their views in answer the same
series of questions. Finally, the structured interview provided a reliable source of data. A particularly
important aspect of this thesis is that the use of structured interviews is regarded as one of the ways to
collect quantitative data. It has a specific characteristic of being very simple. This thesis uses the
structured interview as a complementary tool to compensate for what the thesis may have lost via the
use of questionnaires and survey methods.
5.8.5 Semi-Structured Interview
The qualitative methods discussed in this thesis relied on in-depth and semi-structured interviews. Semi
structured interviews bring about the opportunity for the interviewees to include additional issues that
they might be of interest and are related to the thesis’s findings. Furthermore, many Libyan researchers
advocate the use of face-to-face semi-structured interviews as a means of gathering data, together with
the survey questionnaire, to carry out research studies (Khorwatt, 2006). The researcher started by
reading out the questions and then recorded the responses on a standardised schedule, frequently with
pre-coded answers. All semi-structured interviews were conducted between the researcher and the

142
participant face to-face. They were therefore conducted on a one to-one basis with a single participant,
and the choice of the time and date of interviews was left to the respondents. The interviews took
between 30 to 40 minutes on average, depending on the length of the answers.
All interviews were recorded on audio taped with the prior permission of the respondents. To avoid a
tape recording being misplaced, lost or damaged, each interview was recorded as a separate audio
document, and the questions of each interview were divided into three parts. The written questions are
exactly what were asked orally. In addition, the researcher took notes during each interview.
5.8.6 Source of Data
Eight participants from Libyan public universities were involved in identifying the organisational
cultural profile for Libyan higher education. Each interview session consisted of two main interviewing
activities – asking fixed-choice questions and open-ended questions.
The first activity concentrated on a set of fixed-choice questions called Organisational Culture
Assessment Instrument (OCAI), in which a particular set of questions (presented in Appendix C) was
used. The participants were asked to choose from among four answer alternatives to indicate the most
appropriate way to describe their organisation; the six aspects were originally adopted from the
Organisational Culture Assessment Instrument (OCAI) by Cameron and Quinn (2006).
Once the answers to the fixed-choice questions were successfully recorded, the researcher proceeded to
the next activity that sought answers to open-ended questions (see Appendix C).
In order to gain rich and insightful data reflecting the six key aspects mentioned above, the participants
were asked to give in-depth details to explain and describe their organisation in the light of the four
organisational culture types.
5.8.7 Interview data Analysis
The interviewees were asked in the interviews to investigate the contingent factor of organisational
culture types in one of the main public universities in Libyan higher education. Data were analysed
using the Statistical Package Nvivo - version 10.0 for Mac software. One of the key features of the
Nvivo software is that it has powerful tools to help the researcher examine possible relationships
among themes. Furthermore, the use of software in the analysis process helped the researcher to
organise the interview transcripts and to generate codes linked to the information before performing the
143
analysis. Descriptive statistics, which include frequencies and percentages, were utilised to present the
main characteristics of the sample and the profile of organisational culture.
5.9 Validity and Reliability
Validity is considered to be one of the most important criteria of the research (Bryman & Bell, 2011).
Validity refers to the degree to which a measure actually measures the concept being measured
(Bryman & Cramer, 2005). This implies that validity draws attention to the question whether or not
researchers are measuring the right concept. Therefore, the concept of validity relates to the accuracy of
the results of the research, and it is representative of the real situation.
To establish content validity, existing and validated scales used in the existing literature have been
employed. Moreover, the questionnaire was pre-tested in three steps. First, several academics were
asked to revise the questionnaire. They were asked to complete the questionnaire and to provide
comments on its form and content. Second, a pilot study was conducted to help clarify the issues the
researcher may face with regard to the questionnaire. A total of 10 questionnaires were distributed for
the participants who had held middle and senior management positions for at least five years, and a
total of 6 completed questionnaires were returned.
Finally, regarding this study, many procedures have been followed to achieve questionnaire validity:
• An extensive literature review was carried out to define the topic and understand the purpose of the
study and the research methodology (chapter 2 and 3).
• The study questionnaire was assessed and refereed by a number of people who have adequate
knowledge and experience in the study area; a pilot study was also conducted (see subsection 5.6).
• By using a self-administered questionnaire the respondents were provided the outline of the research
and its objectives and encouraged to contact the researcher at any time with any questions using the
contact details provided by the researcher.
• Organisational culture questions were tested by using the Organisational Culture Assessment
Instrument (OCAI) and the Competing Values Framework (CVF) model of (K. Cameron & Quinn,
2011), who argue that OCAI has been used in more than a thousand organisations that they know of.
The CVF is used widely in the literature and is one of the most comprehensive instruments in the field
of organisational culture for assessing a variety of organisational issues, including leadership,
decision-making, and strategic management (Berrio, 2003; Deshpande et al., 1993; Eker & Eker,

144
2009; Helfrich et al., 2007; Henri, 2006; Igo & Skitmore, 2006; Naranjo-Valencia et al., 2011;
Shurbagi & Zahari, 2013; Twati & Gammack, 2006; Zahari & Shurbagi, 2012; Zu et al., 2011). Due to
this, the CVF is argued to be a valid framework for examining OCs in this study.
• Questions about performance measurement systems were driven by previous studies that used different
populations at different times. A similar method has been applied in previous studies with regard to the
diversity of PMS (Eker & Eker, 2009; Henri, 2006; Hoque et al., 2001; Pedersen & Sudzina, 2012),
thereby contributing to a construct (see Subsection 3.4).
Reliability refers to the extent to which the instrument is unbiased and consistent over time (Bryman &
Bell, 2011; Sekaran, 2003). In other words, reliability is primarily concerned with the stability of the
measurements and the results of the research, and refers to the consistency of a method in measuring
concepts that it is designed to measure. Reliability is said to be present when other researchers are able
to repeat the study and get the same results (Easterby-Smith, Thorpe, & Jackson, 2008; Ghauri &
GrnÃúhaug, 2006). Pallant (2007) argues that when selecting scales to include in the study, it is
important to find scales that are reliable. One of the most used indicators of internal consistency is
Cronbach's alpha coefficient. Therefore, to measure the reliability, Cronbach’s alpha was used to
determine the internal consistency of the research variables. Table 5.6 shows the test result for each
contingent variable, each performance measurement system and each classification of PMS and its
purposes. The results confirm the relatively high internal consistency of each classification item, which
ranged from 0.628 to 0.838. (Hair, 1998) Recommends that the acceptable level of reliability for
Cronbach’s alpha is 0.60 or more. In the case of this study, therefore, the results indicate a rather high
reliability, which indicates the internal integrity of the questionnaire.
Table 5:7 Reliability Test Results
Variable The Items Cronbach Alpha
Performance Measurement Systems 17 0.838
Performance Measurement Systems acceptance 5 0.691
Performance Measurement Systems Importance 6 0.628
Performance Measurement Systems Use 6 0.818
The reliability of this model of organisational culture was used to develop a standardised diagnostic
tool, the OCAI (K. Cameron & Quinn, 2011), used in the current study to analyse the organisational
145
culture in Libyan education sector in order to explore any variations in the acceptance and
implementation of PMS. The OCAI is also used to discover any similarities in organisational culture
between the different Libyan education sector types. It should be noted that, although the OCAI is a
well-developed, valid and reliable instrument (K. Cameron & Quinn, 2011; Kalliath, Bluedorn, &
Gillespie, 1999), it does not claim to cover comprehensively all cultural phenomena in organisations
(Paparone, 2003). Instead, it offers an intuitively appealing and relatively easy way to 'organise
organisational culture types’ (Cameron and Quinn, 1999: 17). In addition, the established strength in
validity and reliability is an attribute which none of its rivals have demonstrated (Paparone, 2003).
5.10 Summary
This section discussed a Research Methodology, and its aim was to describe the philosophy behind the
methods and procedures that have been adopted to collect and analyse the research data. The chapter
started with a reminder of the research questions, and moved to the research hypotheses derived from
the literature reviewed. A discussion of the research philosophy and methodology were provided
together with an explanation of the research data collection methods, including the questionnaire
design. This was followed by the details of questionnaire construction and pilot study. The responses
rate was also shown in this chapter. The chapter ended with a discussion of the statistical methods that
were used in this research.
146
Chapter 6: Organisational Culture and Performance
Measurement Systems Results
6.1 Introduction
The previous chapter outlined the research methodology. The aim of this chapter is to present, analyse
and discuss the data obtained from questionnaires filled in by respondents, with a view to understand
the dominant type of organisational culture and the influential relationships of that culture, at
organisational level, on the acceptance, importance and use of performance measurement systems. The
results of this chapter are presented in five main sections, following this introductory paragraph. The
first section, presents the respondents' profile in general, the second section contains organisational
culture profiles, the third section reports organisational performance profiles, the fourth section
discusses the performance measurement system profiles and finally the fifth section summarises the
chapter in section 6.5.
6.2 Respondents' Profile in General
Work title, location, qualifications and experience of the respondents could have influenced their
perceptions and the quality of their responses to the questionnaire. It was important to make sure that
the respondents held senior positions and could be considered sufficiently knowledgeable and
experienced about organisational performance and performance measurement systems, in general and
in relation to their own organisations.
A total of 257 completed questionnaires, from different user groups in Libyan higher education, were
analysed. The questionnaire sought information about the respondents' job title and position, level of
education, years of experience in the current job and organisation. Also, the questionnaire collected
information about the organisations’ age, the types of higher education they were involved in, and
whether their ownership was public or private.
The presidents and vice presidents of organisations together constituted about 94 participants (about
37%) and the chief and assistant/vice chief of administrative departments constituted 36 participants
(10%). Others with different job titles and positions (such as a former employee in the financial
department) constituted about 26 participants (14%). As can be seen from table 6:1, about 101
participants (25%+ 15%=40%) occupied senior accounting and financial management positions in their
organisations (Chief of Finance Department and Assistant/ Vice Chief and Financial Controller).
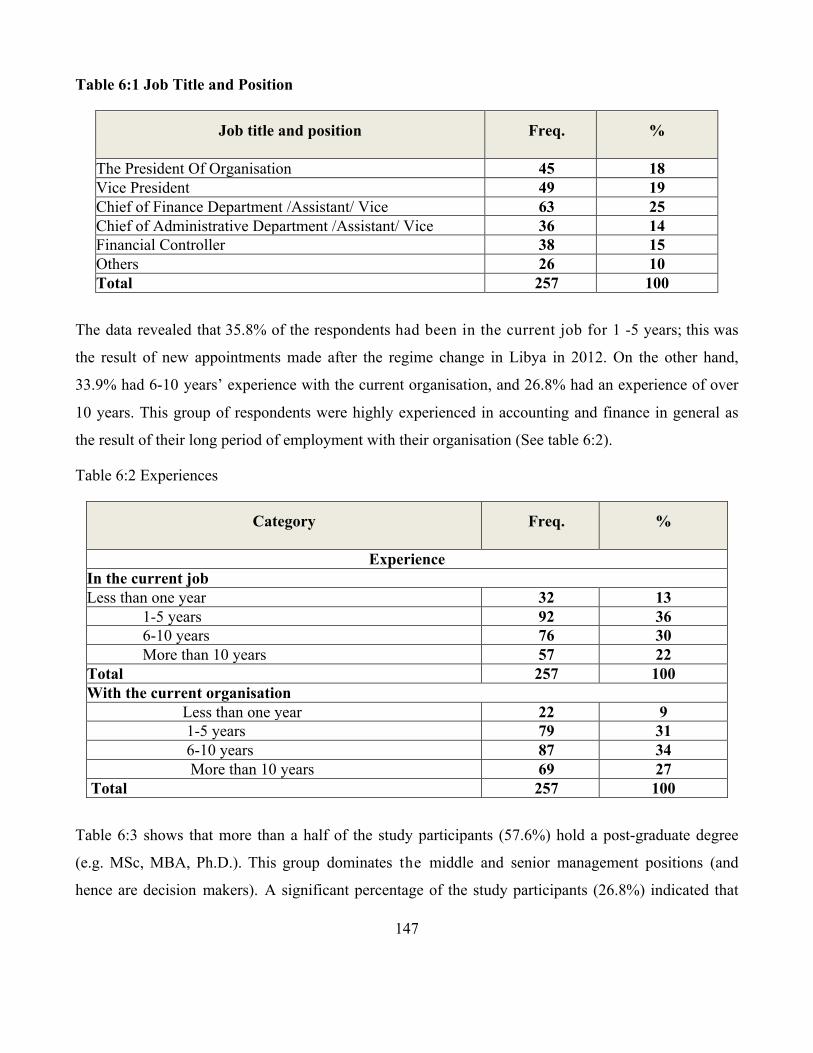
147
Table 6:1 Job Title and Position
Job title and position Freq. %
The President Of Organisation
[ ] Vice President
45 18 Vice President
[] Other (please specify).
49 19 Chief of Finance Department /Assistant/ Vice 63 25 Chief of Administrative Department /Assistant/ Vice 36 14 Financial Controller 38 15 Others 26 10 Total 257 100
The data revealed that 35.8% of the respondents had been in the current job for 1 -5 years; this was
the result of new appointments made after the regime change in Libya in 2012. On the other hand,
33.9% had 6-10 years’ experience with the current organisation, and 26.8% had an experience of over
10 years. This group of respondents were highly experienced in accounting and finance in general as
the result of their long period of employment with their organisation (See table 6:2).
Table 6:2 Experiences
Category Freq. %
Experience In the current job Less than one year 32 13 1-5 years 92 36 6-10 years 76 30 More than 10 years 57 22 Total 257 100 With the current organisation Less than one year 22 9 1-5 years 79 31 6-10 years 87 34 More than 10 years 69 27 Total 257 100
Table 6:3 shows that more than a half of the study participants (57.6%) hold a post-graduate degree
(e.g. MSc, MBA, Ph.D.). This group dominates the middle and senior management positions (and
hence are decision makers). A significant percentage of the study participants (26.8%) indicated that

148
they hold a Bachelor degree. Professional qualifications were held by about 12.5%; this may be
because such qualifications are not popular in the Libyan environment. Only 3.1% revealed that they
hold other qualifications such as medium and higher diplomas.
Table 6:3 Education Level
Category Freq. %
Education Level Bachelor’s degree
69 27 Post-graduate (e.g. MSc, MBA, Ph.D.)
148 58 Professional qualifications 32 13 Others 8 3 Total 257 100
The organisation age was between 11-20 years in 56.4%, and more than 20 years were 32% of the
cases as the Libyan public higher education was established in 1955 (Education, 2011). Table 6:4 also
shows that 31.9% of the organisations were more than 20 years old, and 11.7% were between 5-11
years old, while none of the organisations in question was less than 5 years old (See table 6:4).
Table 6:4 Organisational Age
Category Freq. %
Organisational Age Less than 5 years 0 0 5- 11years 30 12 11-20 years 145 56
More than 20 years 82 32 Total 257 100
Types of higher education ownership were both public and private (See table 6:5). The majority of
respondents were from public organisations (about 86%) because Libyan higher education depends
mainly on public universities and institutions, which are older than the private ones. However,
respondents from private organisations made up 14%, and they were all from universities and not from
other kinds of private institutes, because such universities are more organised and larger than private
institutes. As mentioned earlier, Libyan higher education consists of three types of higher education
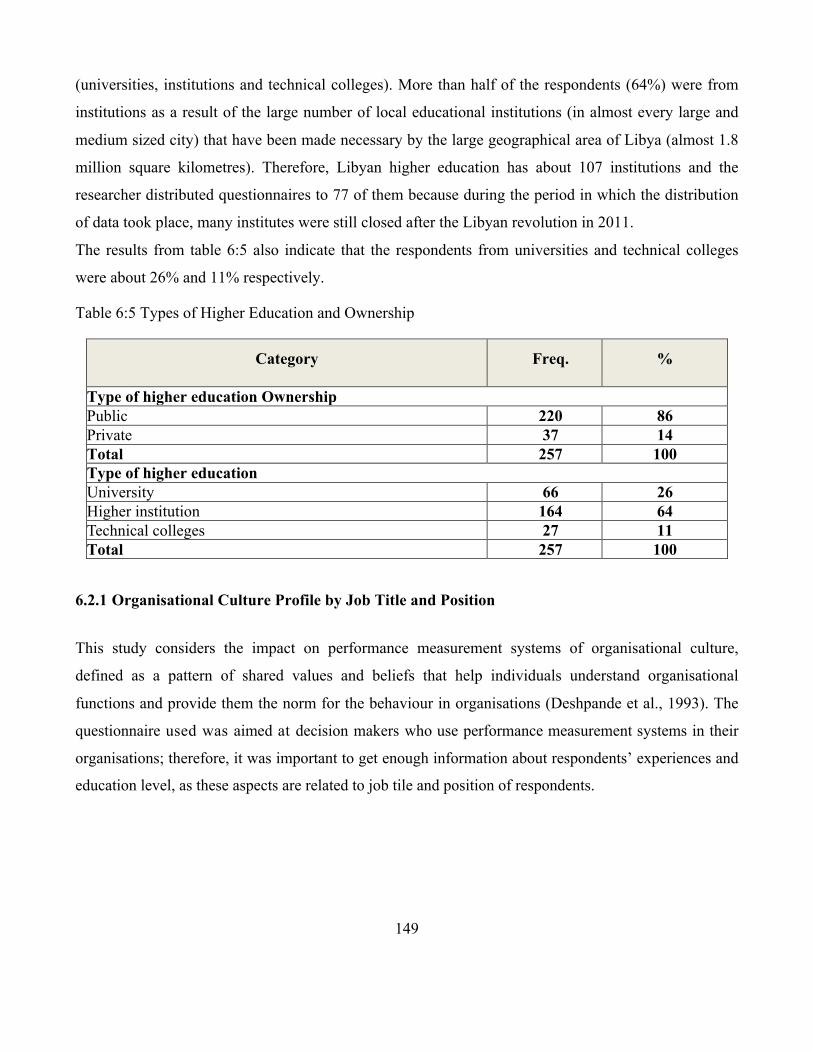
149
(universities, institutions and technical colleges). More than half of the respondents (64%) were from
institutions as a result of the large number of local educational institutions (in almost every large and
medium sized city) that have been made necessary by the large geographical area of Libya (almost 1.8
million square kilometres). Therefore, Libyan higher education has about 107 institutions and the
researcher distributed questionnaires to 77 of them because during the period in which the distribution
of data took place, many institutes were still closed after the Libyan revolution in 2011.
The results from table 6:5 also indicate that the respondents from universities and technical colleges
were about 26% and 11% respectively.
Table 6:5 Types of Higher Education and Ownership
Category Freq. %
Type of higher education Ownership Public 220 86 Private 37 14 Total 257 100 Type of higher education University
66 26 Higher institution
164 64 Technical colleges 27 11 Total 257 100
6.2.1 Organisational Culture Profile by Job Title and Position
This study considers the impact on performance measurement systems of organisational culture,
defined as a pattern of shared values and beliefs that help individuals understand organisational
functions and provide them the norm for the behaviour in organisations (Deshpande et al., 1993). The
questionnaire used was aimed at decision makers who use performance measurement systems in their
organisations; therefore, it was important to get enough information about respondents’ experiences and
education level, as these aspects are related to job tile and position of respondents.
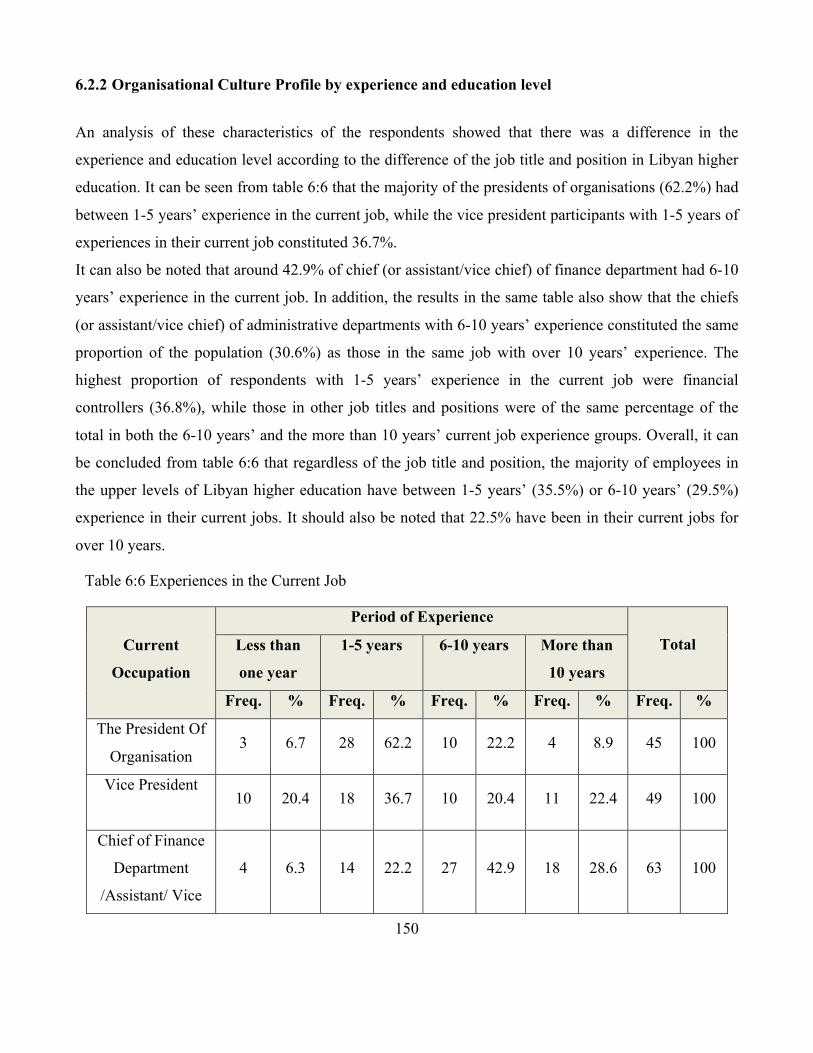
150
6.2.2 Organisational Culture Profile by experience and education level
An analysis of these characteristics of the respondents showed that there was a difference in the
experience and education level according to the difference of the job title and position in Libyan higher
education. It can be seen from table 6:6 that the majority of the presidents of organisations (62.2%) had
between 1-5 years’ experience in the current job, while the vice president participants with 1-5 years of
experiences in their current job constituted 36.7%.
It can also be noted that around 42.9% of chief (or assistant/vice chief) of finance department had 6-10
years’ experience in the current job. In addition, the results in the same table also show that the chiefs
(or assistant/vice chief) of administrative departments with 6-10 years’ experience constituted the same
proportion of the population (30.6%) as those in the same job with over 10 years’ experience. The
highest proportion of respondents with 1-5 years’ experience in the current job were financial
controllers (36.8%), while those in other job titles and positions were of the same percentage of the
total in both the 6-10 years’ and the more than 10 years’ current job experience groups. Overall, it can
be concluded from table 6:6 that regardless of the job title and position, the majority of employees in
the upper levels of Libyan higher education have between 1-5 years’ (35.5%) or 6-10 years’ (29.5%)
experience in their current jobs. It should also be noted that 22.5% have been in their current jobs for
over 10 years.
Table 6:6 Experiences in the Current Job
Current
Occupation
Period of Experience
Total Less than
one year
1-5 years 6-10 years More than
10 years
Freq. % Freq. % Freq. % Freq. % Freq. %
The President Of
Organisation 3 6.7 28 62.2 10 22.2 4 8.9 45 100
Vice President
10 20.4 18 36.7 10 20.4 11 22.4 49 100
Chief of Finance
Department
/Assistant/ Vice
4 6.3 14 22.2 27 42.9 18 28.6 63 100
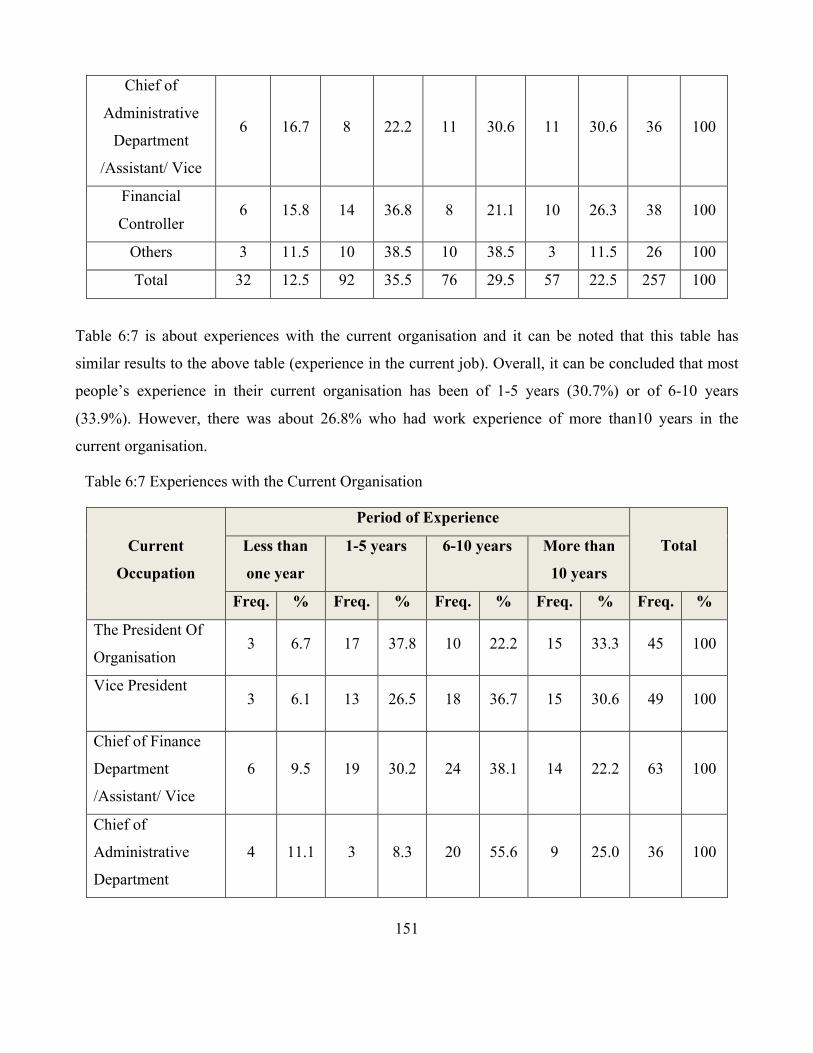
151
Chief of
Administrative
Department
/Assistant/ Vice
6 16.7 8 22.2 11 30.6 11 30.6 36 100
Financial
Controller 6 15.8 14 36.8 8 21.1 10 26.3 38 100
Others 3 11.5 10 38.5 10 38.5 3 11.5 26 100
Total 32 12.5 92 35.5 76 29.5 57 22.5 257 100
Table 6:7 is about experiences with the current organisation and it can be noted that this table has
similar results to the above table (experience in the current job). Overall, it can be concluded that most
people’s experience in their current organisation has been of 1-5 years (30.7%) or of 6-10 years
(33.9%). However, there was about 26.8% who had work experience of more than10 years in the
current organisation.
Table 6:7 Experiences with the Current Organisation
Current
Occupation
Period of Experience
Total Less than
one year
1-5 years 6-10 years More than
10 years
Freq. % Freq. % Freq. % Freq. % Freq. %
The President Of
Organisation 3 6.7 17 37.8 10 22.2 15 33.3 45 100
Vice President
3 6.1 13 26.5 18 36.7 15 30.6 49 100
Chief of Finance
Department
/Assistant/ Vice
6 9.5 19 30.2 24 38.1 14 22.2 63 100
Chief of
Administrative
Department
4 11.1 3 8.3 20 55.6 9 25.0 36 100

152
/Assistant/ Vice
Financial
Controller 6 15.8 13 34.2 12 31.6 7 18.4 38 100
Others 0 0 14 53.8 3 11.5 9 34.6 26 100
Total 22 8.6 79 30.7 87 33.9 69 26.8 257 100
The education level a l so va r i ed depending on the job title and position. Table 6:8 shows that the
majority of the presidents of organisations (96.6 per cent) obtained a post-graduate degree (e.g. MSc,
MBA, PhD), while 77.6% of the vice presidents had the same level of education. A similar percentage
of respondents in the post of chief/assistant chief / vice chief of finance department or of chief
/assistant chief / vice chief of administrative department hold graduate or post-graduate degrees. In
addition, it can be noted that financial controllers have the highest percentage of the professional
qualifications (26.3%) compared to other respondents.
Table 6:8 Education Level
Current
Occupation
Education Level
Total
Bachelor’s
Degree
Post-graduate
(e.g. MSc,
MBA, Ph.D.)
Professional
Qualifications
Others
Freq. % Freq. % Freq. % Freq. % Freq. %
The President Of
Organisation 2 4.4 43 96.6 0 0 0 0 45 100
Vice President
10 20.4 38 77.6 0 0 0 0 49 100
Chief of Finance
Department
/Assistant/ Vice
25 39.7 24 38.1 13 20.6 1 2.0 63 100
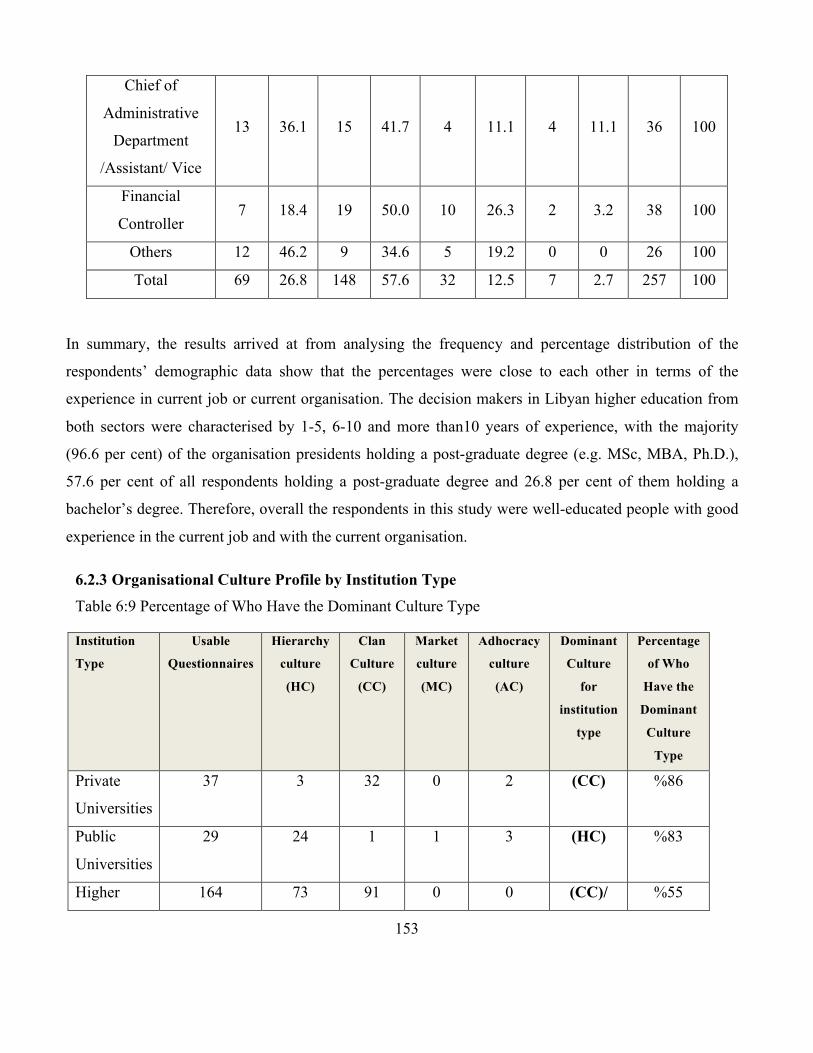
153
Chief of
Administrative
Department
/Assistant/ Vice
13 36.1 15 41.7 4 11.1 4 11.1 36 100
Financial
Controller 7 18.4 19 50.0 10 26.3 2 3.2 38 100
Others 12 46.2 9 34.6 5 19.2 0 0 26 100
Total 69 26.8 148 57.6 32 12.5 7 2.7 257 100
In summary, the results arrived at from analysing the frequency and percentage distribution of the
respondents’ demographic data show that the percentages were close to each other in terms of the
experience in current job or current organisation. The decision makers in Libyan higher education from
both sectors were characterised by 1-5, 6-10 and more than10 years of experience, with the majority
(96.6 per cent) of the organisation presidents holding a post-graduate degree (e.g. MSc, MBA, Ph.D.),
57.6 per cent of all respondents holding a post-graduate degree and 26.8 per cent of them holding a
bachelor’s degree. Therefore, overall the respondents in this study were well-educated people with good
experience in the current job and with the current organisation.
6.2.3 Organisational Culture Profile by Institution Type
Table 6:9 Percentage of Who Have the Dominant Culture Type
Institution
Type
Usable
Questionnaires
Hierarchy
culture
(HC)
Clan
Culture
(CC)
Market
culture
(MC)
Adhocracy
culture
(AC)
Dominant
Culture
for
institution
type
Percentage
of Who
Have the
Dominant
Culture
Type
Private
Universities
37 3 32 0 2 (CC) %86
Public
Universities
29 24 1 1 3 (HC) %83
Higher 164 73 91 0 0 (CC)/ %55

154
Institutions (HC)
Technical
colleges
27 18 6 1 2 (HC) %59
6.3 Organisational Culture Profile Organisational culture was assessed using the Organisational Culture Assessment Instrument (OCAI),
an organisational culture profiler that can determine the organisation's culture type from its dominant
characteristics. The model developed by Cameron and Quinn (1999, 2006) was used to examine aspects
of dominating organisational culture type and was considered to be the most suitable for the purpose of
this research. The OCAI is based on a theoretical model, the "Competing Values Framework" by Quinn
and Rohrbaugh (1981; 1983). The framework is based on six organisation culture dimensions that form
four dominant organisational culture types: hierarchy, clan, adhocracy, and market. Those four culture
types are used here to identify the organisational culture profile of organisations in Libyan higher
education, based on their core values, assumptions, interpretations, and approaches.
6.3.1 Higher Education Organisational Culture
One of the aims in this study is to investigate the organisational culture type of Libyan higher
educational institutions in general their branches in particular. Table 6:9 illustrate the dominant
organisational culture for this education sector, broken down according to the characteristics of the
sample.
The first section of the questionnaire (section A) was intended to gather respondents’ personal
background information. The respondents were asked to provide the information related to their present
position, their years of experience in the current position, in the current organisation, and their level of
education and their organisation’s age and type. Also, they were asked about their organisation
ownership type. Thus, the demography, job, experience and educational background are important in
this study. These are aspects might influence their perceptions and the quality of their responses to the
questionnaire, particularly in relation to their perceptions of the culture type their organisations belong
to and the impact of this culture type on their performance measurement systems.
As can be seen in table 6:9, employees in different managerial job levels have different organisational
culture types. The highest levels in job title and position (The President of Organisation, Vice
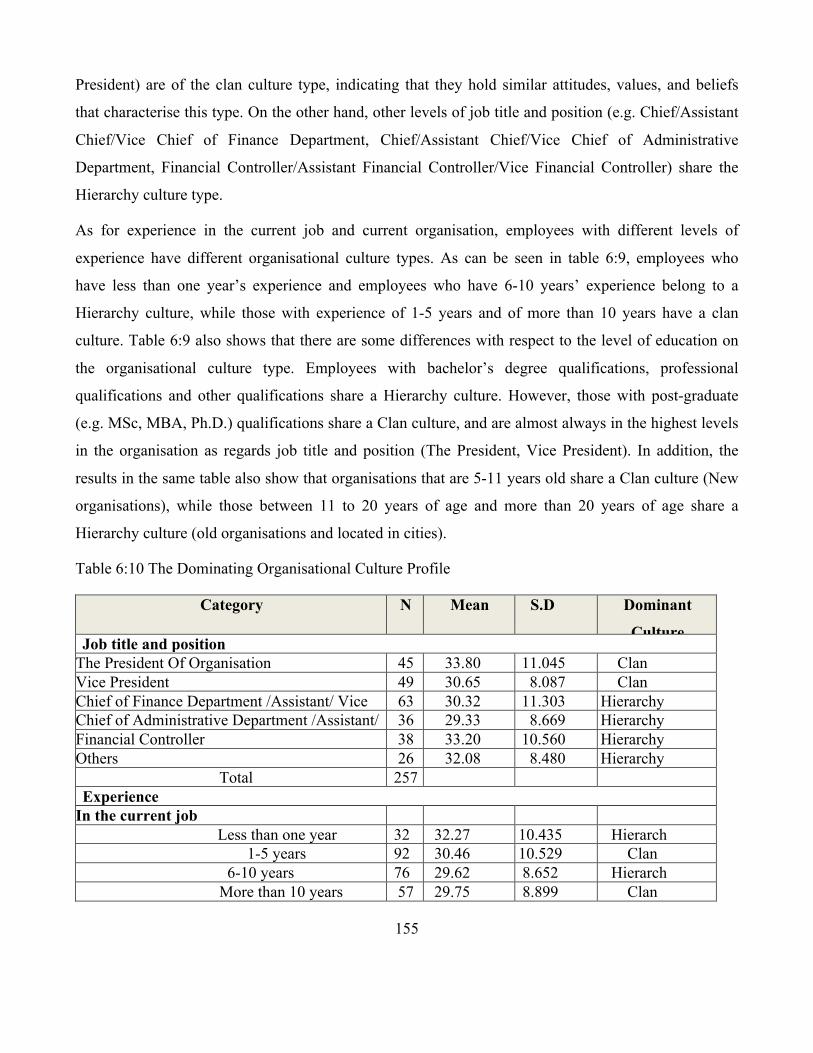
155
President) are of the clan culture type, indicating that they hold similar attitudes, values, and beliefs
that characterise this type. On the other hand, other levels of job title and position (e.g. Chief/Assistant
Chief/Vice Chief of Finance Department, Chief/Assistant Chief/Vice Chief of Administrative
Department, Financial Controller/Assistant Financial Controller/Vice Financial Controller) share the
Hierarchy culture type.
As for experience in the current job and current organisation, employees with different levels of
experience have different organisational culture types. As can be seen in table 6:9, employees who
have less than one year’s experience and employees who have 6-10 years’ experience belong to a
Hierarchy culture, while those with experience of 1-5 years and of more than 10 years have a clan
culture. Table 6:9 also shows that there are some differences with respect to the level of education on
the organisational culture type. Employees with bachelor’s degree qualifications, professional
qualifications and other qualifications share a Hierarchy culture. However, those with post-graduate
(e.g. MSc, MBA, Ph.D.) qualifications share a Clan culture, and are almost always in the highest levels
in the organisation as regards job title and position (The President, Vice President). In addition, the
results in the same table also show that organisations that are 5-11 years old share a Clan culture (New
organisations), while those between 11 to 20 years of age and more than 20 years of age share a
Hierarchy culture (old organisations and located in cities).
Table 6:10 The Dominating Organisational Culture Profile
Category N Mean S.D Dominant
Culture Job title and position
The President Of Organisation
[ ] Vice President
45 33.80 11.045 Clan Vice President
[ ] Other (please specify)
…………………..
49 30.65 8.087 Clan Chief of Finance Department /Assistant/ Vice 63 30.32 11.303 Hierarchy Chief of Administrative Department /Assistant/
Vice
36 29.33 8.669 Hierarchy Financial Controller 38 33.20 10.560 Hierarchy Others 26 32.08 8.480 Hierarchy
Total 257 Experience
In the current job Less than one year 32 32.27 10.435 Hierarch
1-5 years 92 30.46 10.529 Clan 6-10 years 76 29.62 8.652 Hierarch
More than 10 years 57 29.75 8.899 Clan
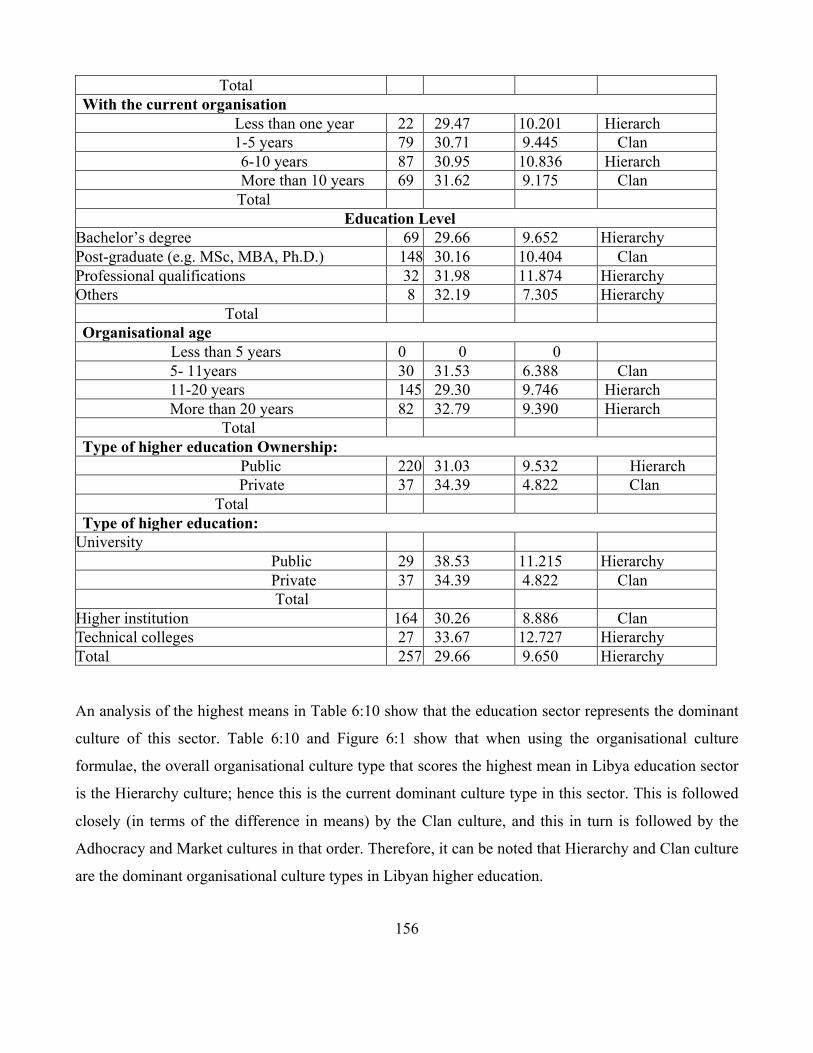
156
Total With the current organisation
Less than one year 22 29.47 10.201 Hierarch 1-5 years 79 30.71 9.445 Clan
6-10 years 87 30.95 10.836 Hierarch More than 10 years 69 31.62 9.175 Clan Total
Education Level Bachelor’s degree
69 29.66 9.652 Hierarchy Post-graduate (e.g. MSc, MBA, Ph.D.)
148 30.16 10.404 Clan Professional qualifications 32 31.98 11.874 Hierarchy Others 8 32.19 7.305 Hierarchy
Total Organisational age
Less than 5 years 0 0 0 5- 11years 30 31.53 6.388 Clan 11-20 years 145 29.30 9.746 Hierarch More than 20 years 82 32.79 9.390 Hierarch Total
Type of higher education Ownership: Public 220 31.03 9.532 Hierarch
Private 37 34.39 4.822 Clan Total
Type of higher education: University
Public 29 38.53 11.215 Hierarchy Private 37 34.39 4.822 Clan Total Higher institution
164 30.26 8.886 Clan Technical colleges 27 33.67 12.727 Hierarchy Total 257 29.66 9.650 Hierarchy
An analysis of the highest means in Table 6:10 show that the education sector represents the dominant
culture of this sector. Table 6:10 and Figure 6:1 show that when using the organisational culture
formulae, the overall organisational culture type that scores the highest mean in Libya education sector
is the Hierarchy culture; hence this is the current dominant culture type in this sector. This is followed
closely (in terms of the difference in means) by the Clan culture, and this in turn is followed by the
Adhocracy and Market cultures in that order. Therefore, it can be noted that Hierarchy and Clan culture
are the dominant organisational culture types in Libyan higher education.
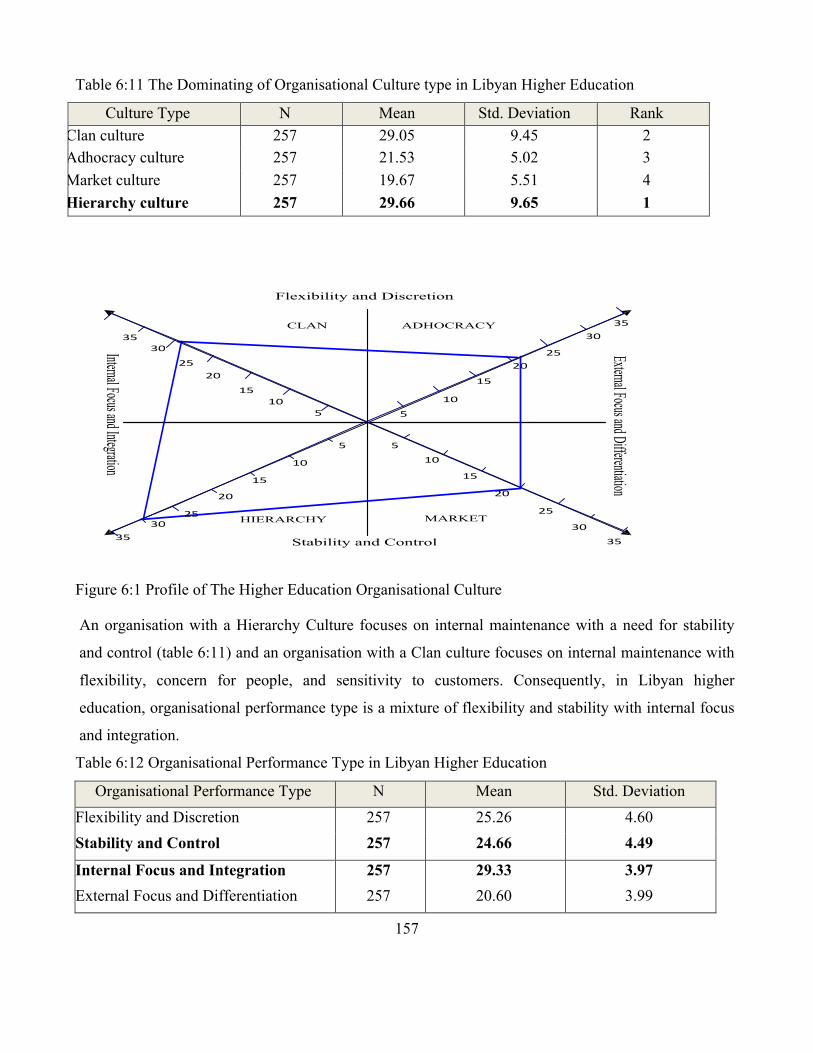
157
Table 6:11 The Dominating of Organisational Culture type in Libyan Higher Education
Culture Type N Mean Std. Deviation Rank Clan culture 257 29.05 9.45 2 Adhocracy culture 257 21.53 5.02 3 Market culture 257 19.67 5.51 4 Hierarchy culture 257 29.66 9.65 1
Figure 6:1 Profile of The Higher Education Organisational Culture
An organisation with a Hierarchy Culture focuses on internal maintenance with a need for stability
and control (table 6:11) and an organisation with a Clan culture focuses on internal maintenance with
flexibility, concern for people, and sensitivity to customers. Consequently, in Libyan higher
education, organisational performance type is a mixture of flexibility and stability with internal focus
and integration.
Table 6:12 Organisational Performance Type in Libyan Higher Education
Organisational Performance Type N Mean Std. Deviation Flexibility and Discretion 257 25.26 4.60 Stability and Control 257 24.66 4.49
Internal Focus and Integration 257 29.33 3.97 External Focus and Differentiation 257 20.60 3.99
CLAN
Internal Focus and Integration
External Focus and Differentiation
510
15
2025
30
5
10
15
2025
30ADHOCRACY
HIERARCHY MARKET
Flexibility and Discretion
Stability and Control
35
5 5
10 10
15 15
20 20
25 2530 30
3535
35
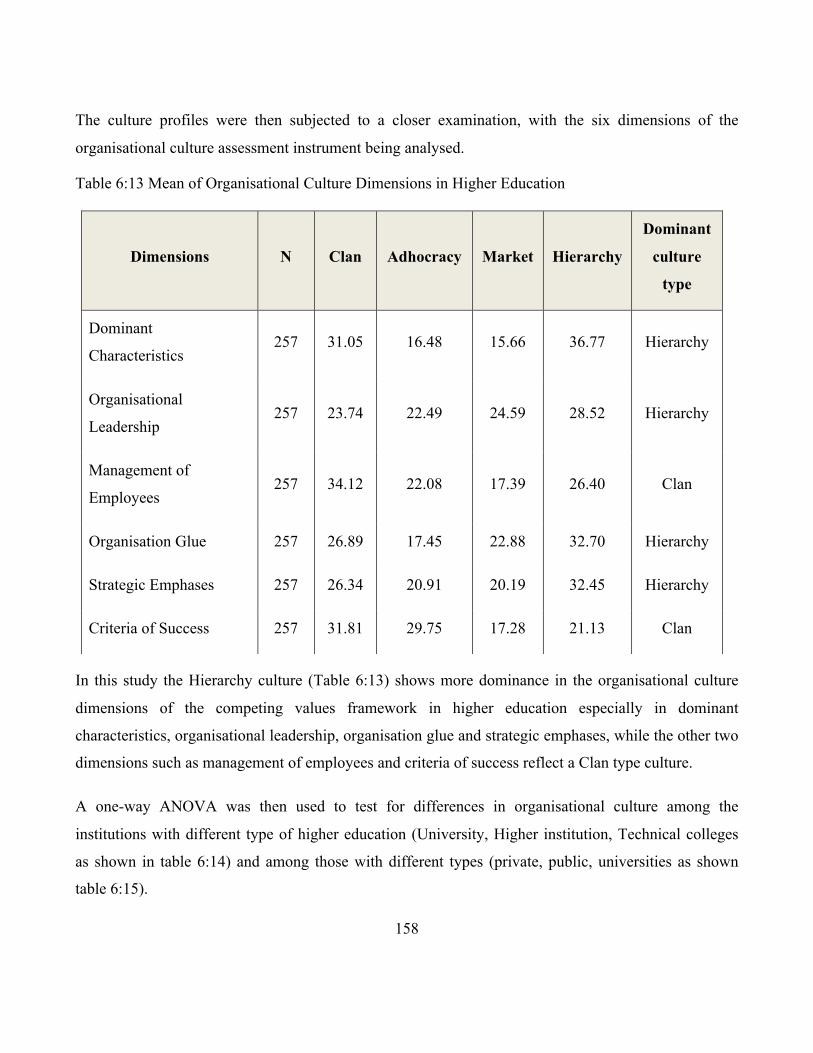
158
The culture profiles were then subjected to a closer examination, with the six dimensions of the
organisational culture assessment instrument being analysed.
Table 6:13 Mean of Organisational Culture Dimensions in Higher Education
In this study the Hierarchy culture (Table 6:13) shows more dominance in the organisational culture
dimensions of the competing values framework in higher education especially in dominant
characteristics, organisational leadership, organisation glue and strategic emphases, while the other two
dimensions such as management of employees and criteria of success reflect a Clan type culture.
A one-way ANOVA was then used to test for differences in organisational culture among the
institutions with different type of higher education (University, Higher institution, Technical colleges
as shown in table 6:14) and among those with different types (private, public, universities as shown
table 6:15).
Dimensions N Clan Adhocracy Market Hierarchy
Dominant
culture
type
Dominant
Characteristics 257 31.05 16.48 15.66 36.77 Hierarchy
Organisational
Leadership 257 23.74 22.49 24.59 28.52 Hierarchy
Management of
Employees 257 34.12 22.08 17.39 26.40 Clan
Organisation Glue 257 26.89 17.45 22.88 32.70 Hierarchy
Strategic Emphases 257 26.34 20.91 20.19 32.45 Hierarchy
Criteria of Success 257 31.81 29.75 17.28 21.13 Clan

159
Table 6:13 shows that the organisational culture type of Libyan higher education was different
depending on the type of higher education and ownership. As can be seen from the table, universities
and technical colleges share the same dominant organisational culture type, while the higher
institutions share different culture type (Clan culture).
Table 6:14 Dominant Organisational Culture Type in Different Higher Education Organisations
Culture Universities Higher institutions Technical colleges
N Mean Rank N Mean Rank N Mean Rank
Clan 66 28.14 2 164 30.26 1 27 23.92 2
Adhocracy 66 21.87 3 164 21.49 3 27 20.90 4
Market 66 21.16 4 164 18.80 4 27 21.30 3
Hierarchy 66 29.00 1 164 29.27 2 27 33.67 1
Dominant
culture type
Hierarchy Clan Hierarchy
The study was devoted to discovering the types of organisational culture dominant in Libya’s higher
education system in general and in its branches in particular on the basis of the type of higher education
and ownership; therefore, the next subsections will explain this aspect further.
6.3.2 Universities’ Organisational Culture Types
Libyan universities are public and private, and this research investigated the organisational culture
types in both of them to identify the similarities and the differences.
6.3.2.1 Public Universities’ Organisational Culture Type Table 6:15 and figure 6:2 show the culture types in Libyan public universities. They both show that this
culture type is Hierarchy (83% of public universities), followed by Adhocracy, Clan and Market in
order. It can be noted that the difference in means between Hierarchy culture and Adhocracy culture is
high (38.53, 22.50).

160
Table 6:15 Dominant Organisational Culture Type for Public Universities
Culture Type N of Qus. % Mean Std. Deviation Rank Clan culture 1 3.6% 20.16 7.602 3 Adhocracy culture 3 10% 22.50 5.446 2 Market culture 1 3.5% 19.20 4.281 4 Hierarchy culture 24 83% 38.53 11.215 1 Total 29 100% Ous. = Questionnaire
Hierarchy culture type values internal focus and integration while maintaining stability and control
(Table 6:16) and it is the organisational performance type for Libyan public universities.
Table 6:16 Organisational Performance Type for Public Universities
Organisational Performance Type N Mean Std. Deviation Flexibility and Discretion 29 21.08 5.08 Stability and Control 29 28.86 5.00
Internal Focus and Integration 29 29.09 3.68 External Focus and Differentiation 29 20.85 3.70
Figure 6:2 The Dominant Organisational Culture Type for Public Universities
CLAN
Internal Focus and Integration
External Focus and Differentiation
510
15
2025
30
5
10
15
2025
30ADHOCRACY
HIERARCHY MARKET
Flexibility and Discretion
Stability and Control
35
5 5
10 10
15 15
20 20
25 2530 30
3535
35

161
6.3.2.2 Private Universities’ Organisational Culture Type Table 6:16 and figure 6:2 represent the current dominant culture type in Libyan private universities.
They both show that Clan culture is the dominant organisational culture type in such universities
because it got a high percentage 87% for 32 private questionnaires out of 37, followed by Hierarchy,
Market and Adhocracy cultures in that order. It can be noted that the difference in means between Clan
culture and Market culture is high (34.39, 22.70).
Table 6:17 Organisational Performance Type for private Universities
Culture Type N of Qus. % Mean Std. Deviation Rank Clan culture 32 87% 34.39 4.822 1 Adhocracy culture 0 0% 21.37 3.978 4 Market culture 2 5% 22.70 4.359 3 Hierarchy culture 3 8% 21.53 5.484 2 Total 37 100%
Ous. = Questionnaire
Clan culture type values internal focus and integration while maintaining flexibility and discretion
(Table 6:18) and it is the organisational performance type for Libyan private universities.
Table 6:18 Organisational Performance Type for Private Universities
Organisational Performance Type N Mean Std. Deviation
Flexibility and Discretion 37 27.88 2.31
Stability and Control 37 22.12 2.31
Internal Focus and Integration 37 27.96 2.28
External Focus and Differentiation 37 22.04 2.28
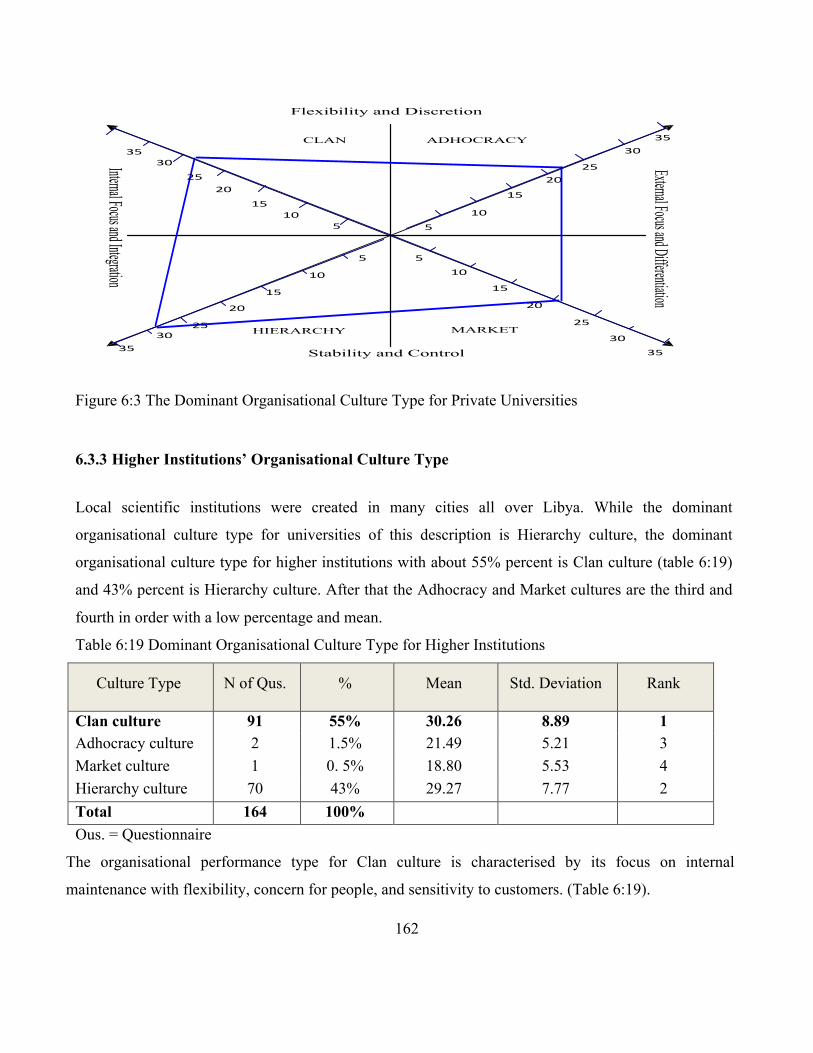
162
Figure 6:3 The Dominant Organisational Culture Type for Private Universities
6.3.3 Higher Institutions’ Organisational Culture Type
Local scientific institutions were created in many cities all over Libya. While the dominant
organisational culture type for universities of this description is Hierarchy culture, the dominant
organisational culture type for higher institutions with about 55% percent is Clan culture (table 6:19)
and 43% percent is Hierarchy culture. After that the Adhocracy and Market cultures are the third and
fourth in order with a low percentage and mean.
Table 6:19 Dominant Organisational Culture Type for Higher Institutions
Culture Type N of Qus. % Mean Std. Deviation Rank
Clan culture 91 55% 30.26 8.89 1 Adhocracy culture 2 1.5% 21.49 5.21 3 Market culture 1 0. 5% 18.80 5.53 4 Hierarchy culture 70 43% 29.27 7.77 2 Total 164 100% Ous. = Questionnaire
The organisational performance type for Clan culture is characterised by its focus on internal
maintenance with flexibility, concern for people, and sensitivity to customers. (Table 6:19).
CLAN
Internal Focus and Integration
External Focus and Differentiation
510
15
2025
30
5
10
15
2025
30ADHOCRACY
HIERARCHY MARKET
Flexibility and Discretion
Stability and Control
35
5 5
10 10
15 15
20 20
25 2530 30
3535
35

163
Table 6:20 Organisational Performance Type for Higher Institutions
Organisational Performance Type N Mean Std. Deviation Flexibility and Discretion 164 25.88 3.79 Stability and Control 164 24.03 3.64
Internal Focus and Integration 164 29.76 4.16
External Focus and Differentiation
164 20.14 4.18
Figure 6:4 shows the graphical representation of the highest mean scores in the four culture types
for the current situation. It is clear from the graph that Clan culture is dominant.
Figure 6:4 Dominant Organisational Culture Types for Higher Institutions
6.3.4 Technical Colleges’ Organisational Culture Type
It is clearly evident that the dominant culture type for the Technical colleges is Hierarchy culture, with
60% percentage followed by Clan culture with 22% percentage; this is for the first time followed by
Market and Adhocracy cultures, in that order. Also, the difference in means between Hierarchy culture
and Clan culture is high (Table 6:21).
CLAN
Internal Focus and Integration
External Focus and Differentiation
510
15
2025
30
5
10
15
2025
30ADHOCRACY
HIERARCHY MARKET
Flexibility and Discretion
Stability and Control
35
5 5
10 10
15 15
20 20
25 2530 30
3535
35

164
Table 6:21 Dominant Organisational Culture Type for Technical Colleges
Culture Type N of Ous. % Mean Std. Deviation Rank Clan culture 6 22% 23.92 11.13 2 Adhocracy culture 2 7% 20.90 4.79 4 Market culture 3 11% 21.30 6.39 3 Hierarchy culture 16 60% 33.67 12.73 1 Total 27 100% Ous. = Questionnaire
Hierarchy culture indicates that this organisation values internal focus and integration while
maintaining stability and control (Table 6:22).
Table 6:22 Organisational Performance Type for Technical Colleges
Organisational Performance Type N Mean Std. Deviation
Flexibility and Discretion 27 22.41 6.540 Stability and Control 27 27.48 6.44
Internal Focus and Integration 27 28.80 4.58
External Focus and Differentiation
27 21.10 4.53
Figure 6:5 shows the graphical representation of the highest mean scores in the four culture types
for the current situation. It is clear from the graph that Hierarchy culture is dominant.
Figure 6:5 Dominant Organisational Culture Type for Technical Colleges
CLAN
Internal Focus and Integration
External Focus and Differentiation
510
15
20
2530
5
10
15
2025
30ADHOCRACY
HIERARCHY MARKET
Flexibility and Discretion
Stability and Control
35
5 5
10 10
15 15
20 20
25 2530 30
3535
35
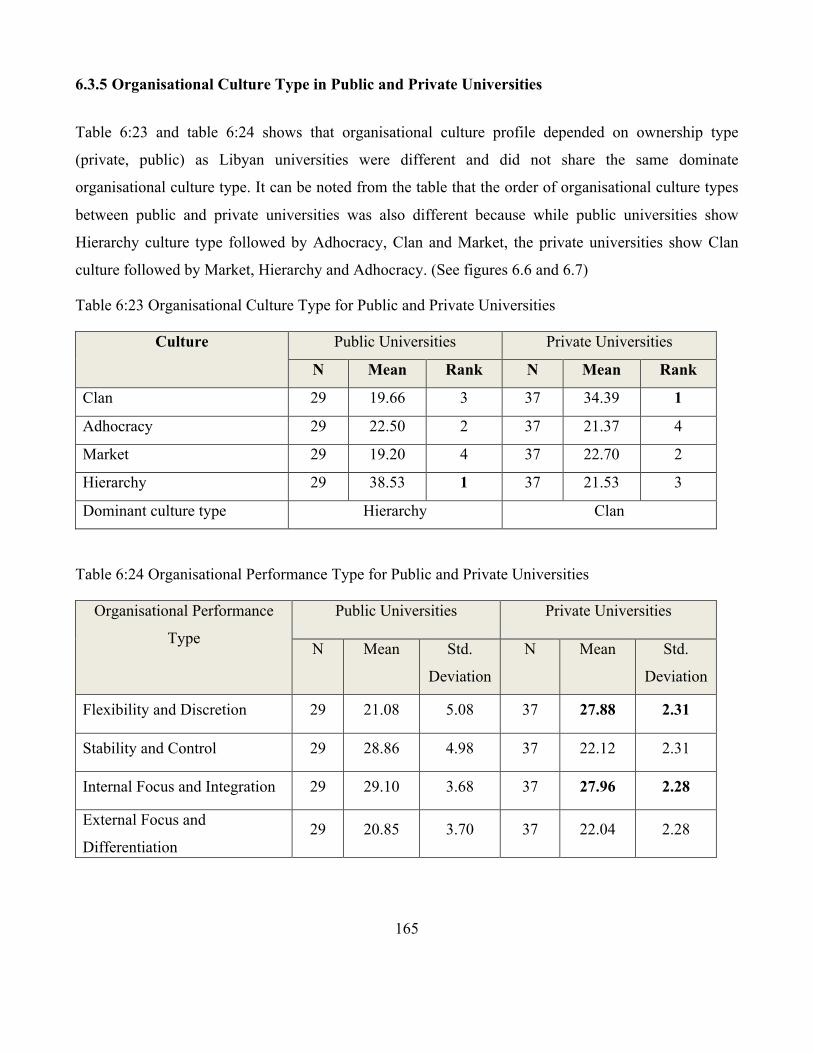
165
6.3.5 Organisational Culture Type in Public and Private Universities
Table 6:23 and table 6:24 shows that organisational culture profile depended on ownership type
(private, public) as Libyan universities were different and did not share the same dominate
organisational culture type. It can be noted from the table that the order of organisational culture types
between public and private universities was also different because while public universities show
Hierarchy culture type followed by Adhocracy, Clan and Market, the private universities show Clan
culture followed by Market, Hierarchy and Adhocracy. (See figures 6.6 and 6.7)
Table 6:23 Organisational Culture Type for Public and Private Universities
Culture Public Universities Private Universities
N Mean Rank N Mean Rank
Clan 29 19.66 3 37 34.39 1
Adhocracy 29 22.50 2 37 21.37 4
Market 29 19.20 4 37 22.70 2
Hierarchy 29 38.53 1 37 21.53 3
Dominant culture type Hierarchy Clan
Table 6:24 Organisational Performance Type for Public and Private Universities
Organisational Performance
Type
Public Universities Private Universities
N Mean Std.
Deviation
N Mean Std.
Deviation
Flexibility and Discretion 29 21.08 5.08 37 27.88 2.31
Stability and Control 29 28.86 4.98 37 22.12 2.31
Internal Focus and Integration 29 29.10 3.68 37 27.96 2.28
External Focus and
Differentiation
29 20.85 3.70 37 22.04 2.28

166
Figure 6:6 Dominant Organisational Culture Type for Public Universities
Figure 6:7 Dominant Organisational Culture Type for Private Universities
6.4 Interviews Results for Organisational Culture Profile
The empirical investigation demonstrated in this thesis relies primarily on the analysis of both the
quantitative and qualitative data; the former is analysed in the previous sections.
CLAN
Internal Focus and Integration
External Focus and Differentiation
510
15
2025
30
5
10
1520
2530
ADHOCRACY
HIERARCHY MARKET
Flexibility and Discretion
Stability and Control
35
55
1010
15 15
2020
2525
3030
3535
3540 40
4040
CLAN
Internal Focus and Integration
External Focus and Differentiation
510
15
2025
30
5
10
1520
2530
ADHOCRACY
HIERARCHY MARKET
Flexibility and Discretion
Stability and Control
35
55
1010
15 15
2020
2525
3030
3535
3540 40
4040

167
The quantitative data to investigate the OC types firstly and to investigate the extent of the acceptance,
importance and use of PMS, finally the influence of OC types on PMS. While the qualitative case study
data to determine perceptions of organisational culture types, in order to strengthen the findings that the
researcher got them from the quantitative data.
This section emphasises that qualitative data analyses are founded on the structured and semi-
structured interviews carried out on a sample of one Libyan public university throughout the
organisation at numerous levels (employee and member staff). The objective of the interviews was to
promote the information attained from the questionnaire. The outcomes of the interview enabled the
researcher to determine the collective views on organisational culture and to assess whether they are
the same as the views of the decision makers.
The results of the first activity were concentrated on a set of fix-choice questions called, Organisational
Culture Assessment Instrument (OCAI). Interviewees were asked to divide 100 points among the four
alternatives depending on the extent to which each alternative fitted their own organisation and give a
higher number of points to the alternative fitted their organisation.
6.4.1 Interviewees' Profile in General
The first section in the interview was about general information of interviewees. A total of eight
completed interviews, from the University of Tripoli, were analysed. The interviews sought
information about the interviewees' job title and position, level of education, years of experience in the
current job and organisation.
As shown in table 6:25, the interviewees were from two different categories in Libyan public
university, four interviewers were employees in the finance and administrative department, and the
other four interviewees were employees as academic staff university.
Table 6:25 Job title and position
Interviewees Job title and position Level of Education
1 Employee in Finance Department Post-graduate degree (MSc) 2 Employee in Administrative Department Post-graduate degree (MSc) 3 Employee in Finance Department Post-graduate degree (MSc) 4 Employee in Administrative Department Post-graduate degree (MPA) 5 Business school Staff Post-graduate degree (Ph.D.)
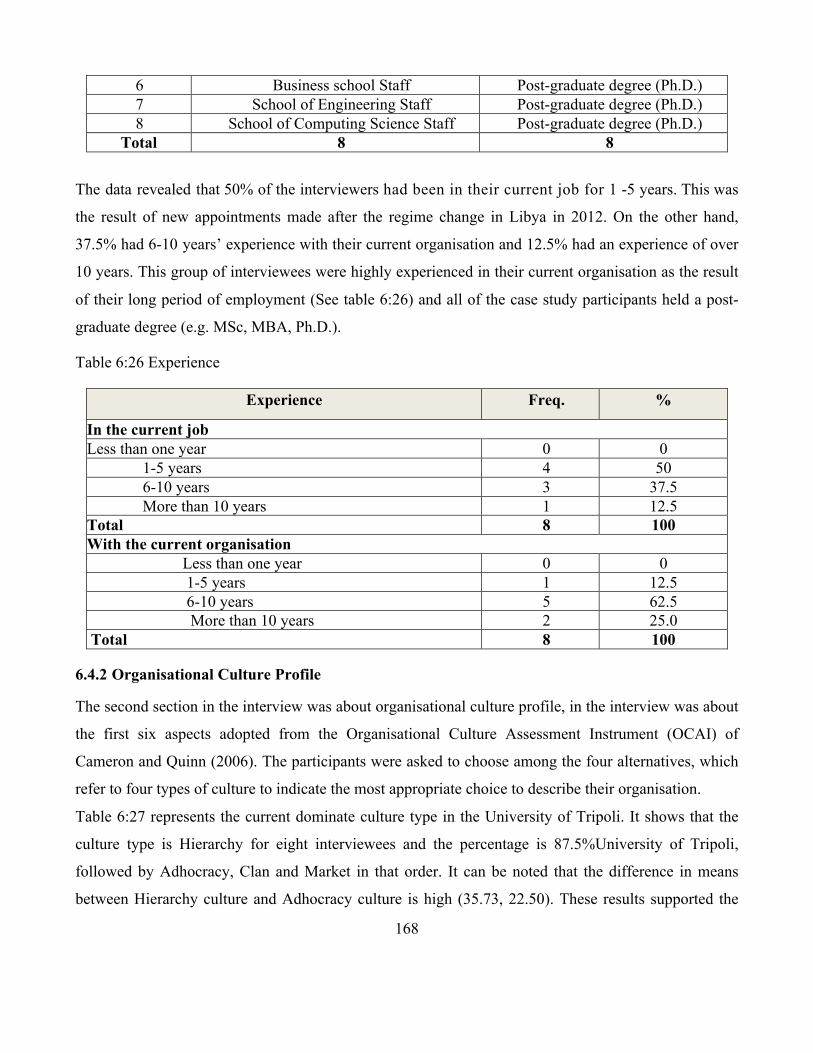
168
6 Business school Staff Post-graduate degree (Ph.D.) 7 School of Engineering Staff Post-graduate degree (Ph.D.) 8 School of Computing Science Staff Post-graduate degree (Ph.D.)
Total 8 8
The data revealed that 50% of the interviewers had been in their current job for 1 -5 years. This was
the result of new appointments made after the regime change in Libya in 2012. On the other hand,
37.5% had 6-10 years’ experience with their current organisation and 12.5% had an experience of over
10 years. This group of interviewees were highly experienced in their current organisation as the result
of their long period of employment (See table 6:26) and all of the case study participants held a post-
graduate degree (e.g. MSc, MBA, Ph.D.).
Table 6:26 Experience
Experience Freq. %
In the current job Less than one year 0 0 1-5 years 4 50 6-10 years 3 37.5 More than 10 years 1 12.5 Total 8 100 With the current organisation Less than one year 0 0 1-5 years 1 12.5 6-10 years 5 62.5 More than 10 years 2 25.0 Total 8 100
6.4.2 Organisational Culture Profile
The second section in the interview was about organisational culture profile, in the interview was about
the first six aspects adopted from the Organisational Culture Assessment Instrument (OCAI) of
Cameron and Quinn (2006). The participants were asked to choose among the four alternatives, which
refer to four types of culture to indicate the most appropriate choice to describe their organisation.
Table 6:27 represents the current dominate culture type in the University of Tripoli. It shows that the
culture type is Hierarchy for eight interviewees and the percentage is 87.5%University of Tripoli,
followed by Adhocracy, Clan and Market in that order. It can be noted that the difference in means
between Hierarchy culture and Adhocracy culture is high (35.73, 22.50). These results supported the
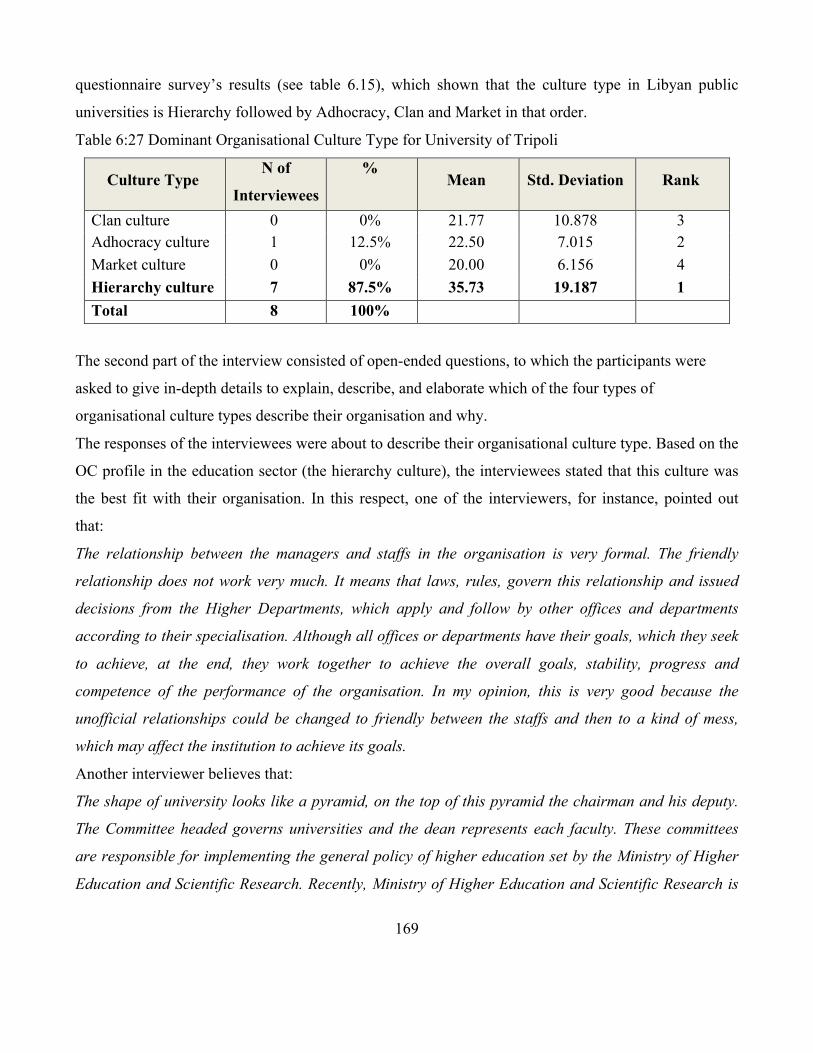
169
questionnaire survey’s results (see table 6.15), which shown that the culture type in Libyan public
universities is Hierarchy followed by Adhocracy, Clan and Market in that order.
Table 6:27 Dominant Organisational Culture Type for University of Tripoli
Culture Type N of
Interviewees
.
% Mean Std. Deviation Rank
Clan culture 0 0% 21.77 10.878 3 Adhocracy culture 1 12.5% 22.50 7.015 2 Market culture 0 0% 20.00 6.156 4 Hierarchy culture 7 87.5% 35.73 19.187 1 Total 8 100%
The second part of the interview consisted of open-ended questions, to which the participants were
asked to give in-depth details to explain, describe, and elaborate which of the four types of
organisational culture types describe their organisation and why.
The responses of the interviewees were about to describe their organisational culture type. Based on the
OC profile in the education sector (the hierarchy culture), the interviewees stated that this culture was
the best fit with their organisation. In this respect, one of the interviewers, for instance, pointed out
that:
The relationship between the managers and staffs in the organisation is very formal. The friendly
relationship does not work very much. It means that laws, rules, govern this relationship and issued
decisions from the Higher Departments, which apply and follow by other offices and departments
according to their specialisation. Although all offices or departments have their goals, which they seek
to achieve, at the end, they work together to achieve the overall goals, stability, progress and
competence of the performance of the organisation. In my opinion, this is very good because the
unofficial relationships could be changed to friendly between the staffs and then to a kind of mess,
which may affect the institution to achieve its goals.
Another interviewer believes that:
The shape of university looks like a pyramid, on the top of this pyramid the chairman and his deputy.
The Committee headed governs universities and the dean represents each faculty. These committees
are responsible for implementing the general policy of higher education set by the Ministry of Higher
Education and Scientific Research. Recently, Ministry of Higher Education and Scientific Research is
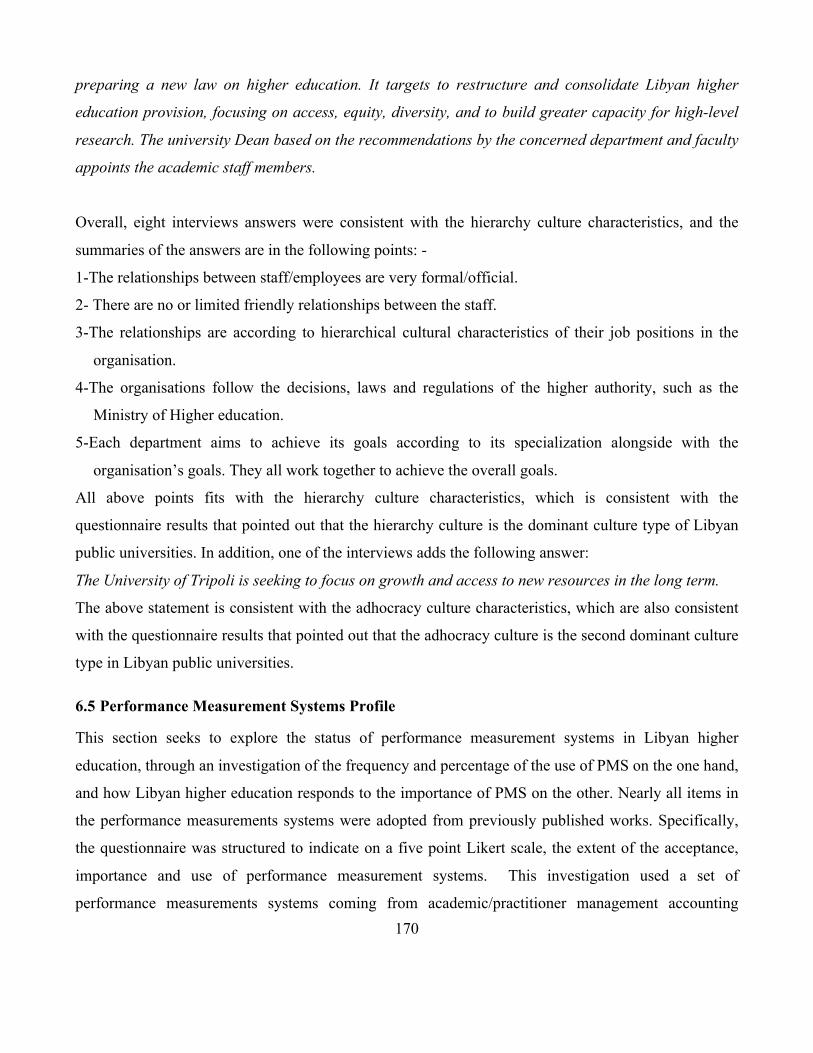
170
preparing a new law on higher education. It targets to restructure and consolidate Libyan higher
education provision, focusing on access, equity, diversity, and to build greater capacity for high-level
research. The university Dean based on the recommendations by the concerned department and faculty
appoints the academic staff members.
Overall, eight interviews answers were consistent with the hierarchy culture characteristics, and the
summaries of the answers are in the following points: -
1-The relationships between staff/employees are very formal/official.
2- There are no or limited friendly relationships between the staff.
3-The relationships are according to hierarchical cultural characteristics of their job positions in the
organisation.
4-The organisations follow the decisions, laws and regulations of the higher authority, such as the
Ministry of Higher education.
5-Each department aims to achieve its goals according to its specialization alongside with the
organisation’s goals. They all work together to achieve the overall goals.
All above points fits with the hierarchy culture characteristics, which is consistent with the
questionnaire results that pointed out that the hierarchy culture is the dominant culture type of Libyan
public universities. In addition, one of the interviews adds the following answer:
The University of Tripoli is seeking to focus on growth and access to new resources in the long term.
The above statement is consistent with the adhocracy culture characteristics, which are also consistent
with the questionnaire results that pointed out that the adhocracy culture is the second dominant culture
type in Libyan public universities.
6.5 Performance Measurement Systems Profile
This section seeks to explore the status of performance measurement systems in Libyan higher
education, through an investigation of the frequency and percentage of the use of PMS on the one hand,
and how Libyan higher education responds to the importance of PMS on the other. Nearly all items in
the performance measurements systems were adopted from previously published works. Specifically,
the questionnaire was structured to indicate on a five point Likert scale, the extent of the acceptance,
importance and use of performance measurement systems. This investigation used a set of
performance measurements systems coming from academic/practitioner management accounting

171
literature (Gosselin, 2005; Robert Kaplan & Norton, 1996; Kaplan Robert & Norton David, 2001).
Moreover, the research investigated the influence of financial, non-financial and advanced PMS to
evaluate organisational performance, in particular the effectiveness and usefulness of advanced
techniques of performance measurement systems for organisational performance. Therefore, in section
D of the questionnaire, the respondents were asked about the extent to which they used financial, non-
financial and advanced PMS, with regard to the following points:
- To evaluate the organisational performance of Libyan higher education
- To enhance performance effectiveness in Libyan higher education
- How a useful it is for Libyan higher education performance
6.5.1 Performance Measurement Systems acceptance and Influence on Organisational Performance
The present study investigated the acceptance of both financial and non-financial performance
measurement systems and to what extent this influenced the organisational performance. In addition, the
advanced technique of the balanced scorecard was investigated for its effectiveness and usefulness in
organisational performance. The first three questions in section D (D1, D2, D3) were about how using
multiple performance measurement systems (financial, non-financial, advanced techniques) would
enable organisations to evaluate organisational performance. The fourth and fifth questions in the same
section (D4, D5) were about the effectiveness and usefulness of performance measurement system in
organisational performance.
6.5.1.1 Financial Performance Measurement system
A 5-point scale as shown in the table 6:24 (1= Strongly Disagree, 2= Disagree, 3= Neutral, 4= Agree,
5= Strongly Agree) was used to investigate the extent of the use of financial performance measurement
systems to evaluate organisational Performance.
The respondents were requested in this section of the questionnaire to indicate to what extent financial
performance measurement systems were used to evaluate organisational Performance.
It can be noted from table 6:24 that the value of the mean of using financial performance measurement
systems to evaluate organisational performance is above 3 (i.e. above neutral). The results show that
7% of the respondents were below neutral (Strongly Disagree or Disagree), about 36% were neutral
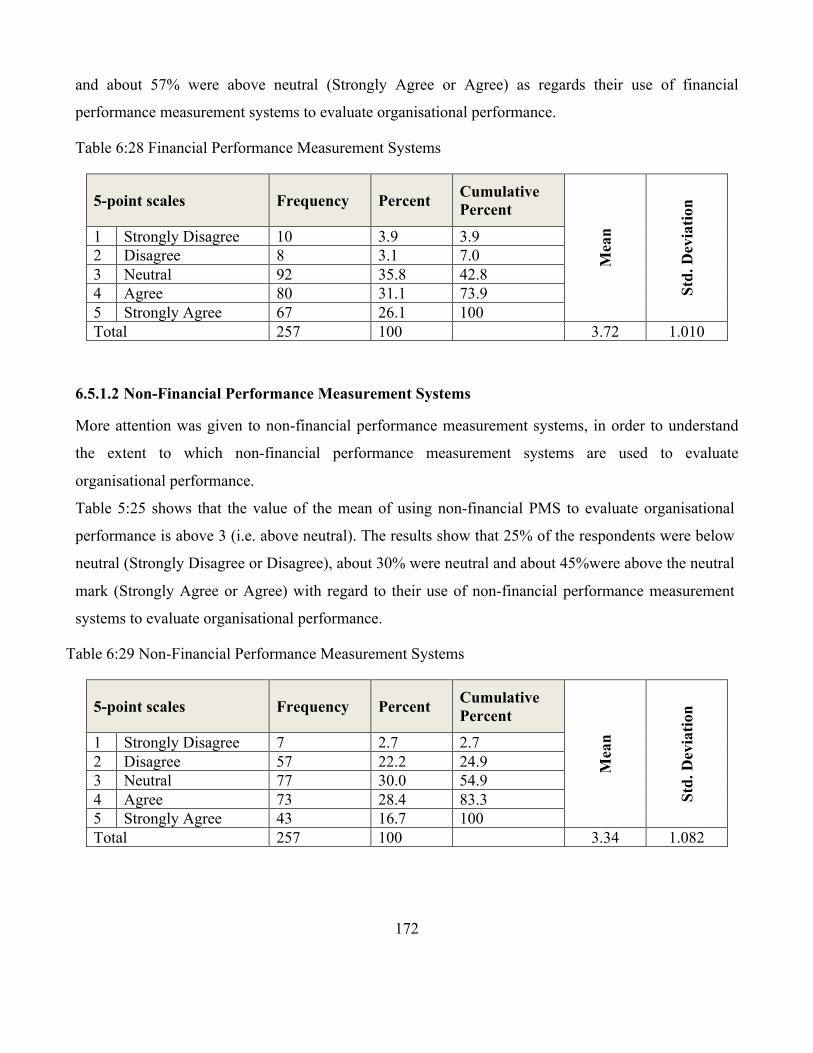
172
and about 57% were above neutral (Strongly Agree or Agree) as regards their use of financial
performance measurement systems to evaluate organisational performance.
Table 6:28 Financial Performance Measurement Systems
5-point scales Frequency Percent Cumulative Percent
Mea
n
Std.
Dev
iatio
n
1 Strongly Disagree 10 3.9 3.9 2 Disagree 8 3.1 7.0 3 Neutral 92 35.8 42.8 4 Agree 80 31.1 73.9 5 Strongly Agree 67 26.1 100 Total 257 100 3.72 1.010
6.5.1.2 Non-Financial Performance Measurement Systems
More attention was given to non-financial performance measurement systems, in order to understand
the extent to which non-financial performance measurement systems are used to evaluate
organisational performance.
Table 5:25 shows that the value of the mean of using non-financial PMS to evaluate organisational
performance is above 3 (i.e. above neutral). The results show that 25% of the respondents were below
neutral (Strongly Disagree or Disagree), about 30% were neutral and about 45%were above the neutral
mark (Strongly Agree or Agree) with regard to their use of non-financial performance measurement
systems to evaluate organisational performance.
Table 6:29 Non-Financial Performance Measurement Systems
5-point scales Frequency Percent Cumulative Percent
Mea
n
Std.
Dev
iatio
n
1 Strongly Disagree 7 2.7 2.7 2 Disagree 57 22.2 24.9 3 Neutral 77 30.0 54.9 4 Agree 73 28.4 83.3 5 Strongly Agree 43 16.7 100 Total 257 100 3.34 1.082
173
6.5.1.3 Advanced Techniques of Performance Measurement Systems
Table 6:26 shows the extent to which the respondents agree or disagree that the use of advanced
techniques of performance measurement systems (e.g. balanced scorecard) would enhance the
evaluation of organisational performance.
The value of the mean of advanced techniques of performance measurement systems (e.g. balanced
scorecard) to evaluate organisational performance is above 3 (i.e. above neutral). The results in table
6:26 show that about 11% of the respondents were below neutral (Strongly Disagree or Disagree),
about 32% were neutral and about 57% were above the neutral point (Strongly Agree or Agree) for
using advanced techniques of performance measurement systems (e.g. balanced scorecard) in
enhancing the evaluation of organisational performance.
Table 6:30 Advanced Techniques of Performance Measurement Systems
5-point scales Frequency Percent Cumulative Percent
Mea
n
Std.
Dev
iatio
n
1 Strongly Disagree 12 4.7 4.7 2 Disagree 17 6.6 11.3 3 Neutral 81 31.5 42.8 4 Agree 99 38.5 81.3 5 Strongly Agree 48 18.7 100 Total 257 100 3.60 1.015
6.5.1.4 Effectiveness of Using Advanced Techniques of Performance Measurement Systems
The value of the mean of effectiveness of using advanced techniques of performance measurement
systems (e.g. balanced scorecard) to evaluate organisational performance was above 3 (i.e. above
neutral). The results in table 6:27 show that about 13% of the respondents were under the neutral point
(Strongly Disagree or Disagree), about 35% per cent were neutral and about 52% were above neutral
(Strongly Agree or Agree) as regards their use of performance measurement systems (e.g. balanced
scorecard) to enhance the effectiveness of their job.
Table 6:31 Effectiveness of Using Advanced Techniques of Performance Measurement Systems
5-point scales Frequency Percent Cumulative Percent
Mea
n
Std.
D
evia
tion
1 Strongly Disagree 19 7.4 7.4 2 Disagree 13 5.1 12.5

174
3 Neutral 91 35.4 47.9 4 Agree 89 34.6 82.5 5 Strongly Agree 45 17.5 100 Total 257 100 3.50 1.072
6.5.1.5 Using Performance Measurement Systems
The results in table 6:28 show that about 0% of the respondents strongly disagree, about 5%were below
neutral (Disagree), about 37% were neutral and about 58% were above the neutral mark (Strongly
Agree or Agree) as regards the usefulness of performance measurement systems (e.g. balanced
scorecard) in their job. The value of the mean was 3.77 (above neutral).
Table 6:32 Useful of Using Performance Measurement Systems (e.g. Balanced Scorecard)
5-point scales Frequency Percent Cumulative Percent
Mea
n
Std.
Dev
iatio
n
1 Strongly Disagree 0 0 5.4 2 Disagree 14 5.4 42.0 3 Neutral 94 36.6 75.1 4 Agree 85 33.1 100 5 Strongly Agree 64 24.9 Total 257 100 3.77 0.886
6.5.1.6 Summary Performance Measurement Systems acceptance and Influence on Organisational
Performance
The performance measurement systems acceptance and the influence on organisational performance in
Libyan higher education are presented in table 6:29.
It can be noted from table 6:29 that the highest value mean of useful of using performance measurement
systems (e.g. balanced scorecard), which was 3.77 and above 3. The second rank was for using financial
performance measurement systems to evaluate organisational performance, and the third was for using
advanced techniques of performance measurement systems. The fourth rank was for effectiveness of
using advanced techniques of performance measurement systems and the last was using non-financial
performance measurement systems to evaluate organisational performance.
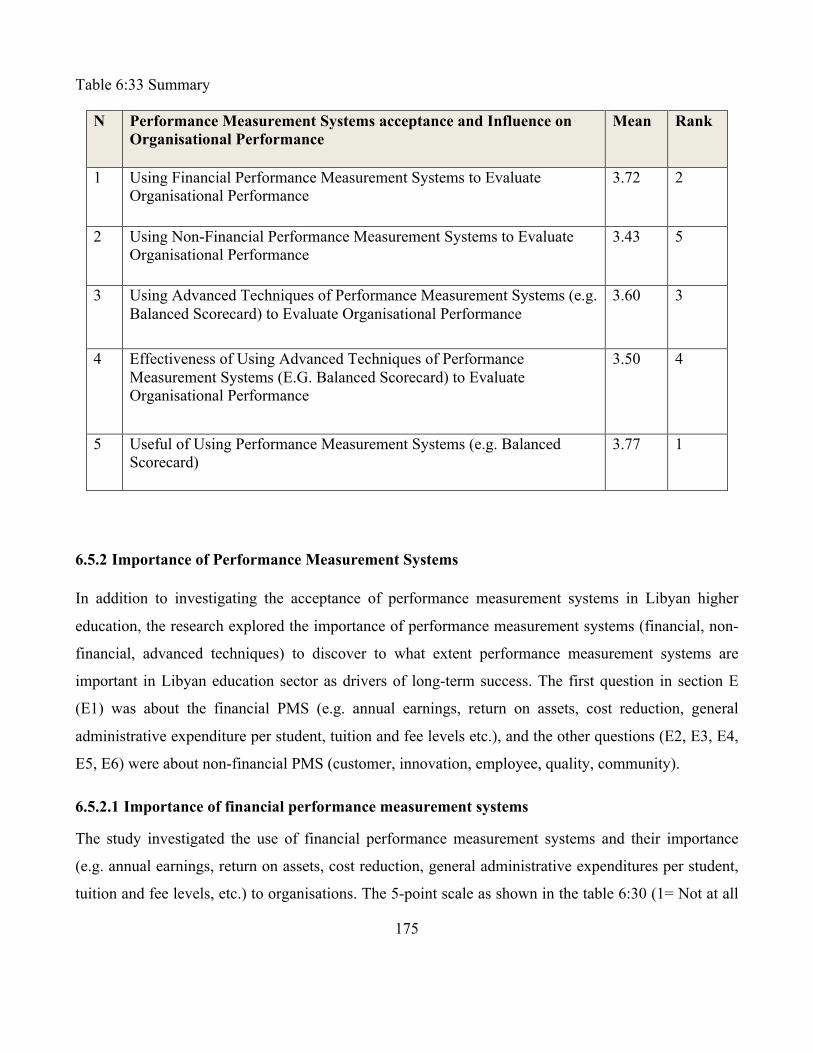
175
Table 6:33 Summary
N Performance Measurement Systems acceptance and Influence on Organisational Performance
Mean Rank
1 Using Financial Performance Measurement Systems to Evaluate Organisational Performance
3.72 2
2 Using Non-Financial Performance Measurement Systems to Evaluate Organisational Performance
3.43 5
3 Using Advanced Techniques of Performance Measurement Systems (e.g. Balanced Scorecard) to Evaluate Organisational Performance
3.60 3
4 Effectiveness of Using Advanced Techniques of Performance Measurement Systems (E.G. Balanced Scorecard) to Evaluate Organisational Performance
3.50 4
5 Useful of Using Performance Measurement Systems (e.g. Balanced Scorecard)
3.77 1
6.5.2 Importance of Performance Measurement Systems
In addition to investigating the acceptance of performance measurement systems in Libyan higher
education, the research explored the importance of performance measurement systems (financial, non-
financial, advanced techniques) to discover to what extent performance measurement systems are
important in Libyan education sector as drivers of long-term success. The first question in section E
(E1) was about the financial PMS (e.g. annual earnings, return on assets, cost reduction, general
administrative expenditure per student, tuition and fee levels etc.), and the other questions (E2, E3, E4,
E5, E6) were about non-financial PMS (customer, innovation, employee, quality, community).
6.5.2.1 Importance of financial performance measurement systems
The study investigated the use of financial performance measurement systems and their importance
(e.g. annual earnings, return on assets, cost reduction, general administrative expenditures per student,
tuition and fee levels, etc.) to organisations. The 5-point scale as shown in the table 6:30 (1= Not at all
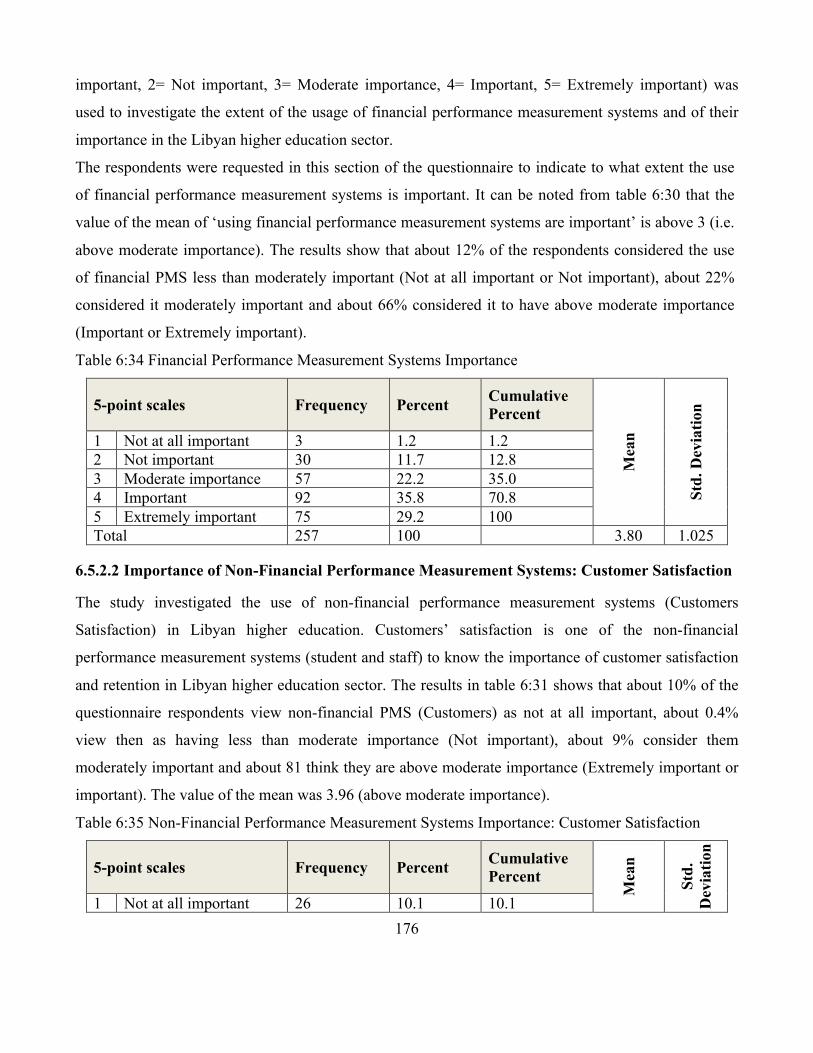
176
important, 2= Not important, 3= Moderate importance, 4= Important, 5= Extremely important) was
used to investigate the extent of the usage of financial performance measurement systems and of their
importance in the Libyan higher education sector.
The respondents were requested in this section of the questionnaire to indicate to what extent the use
of financial performance measurement systems is important. It can be noted from table 6:30 that the
value of the mean of ‘using financial performance measurement systems are important’ is above 3 (i.e.
above moderate importance). The results show that about 12% of the respondents considered the use
of financial PMS less than moderately important (Not at all important or Not important), about 22%
considered it moderately important and about 66% considered it to have above moderate importance
(Important or Extremely important).
Table 6:34 Financial Performance Measurement Systems Importance
5-point scales Frequency Percent Cumulative Percent
Mea
n
Std.
Dev
iatio
n
1 Not at all important 3 1.2 1.2 2 Not important 30 11.7 12.8 3 Moderate importance 57 22.2 35.0 4 Important 92 35.8 70.8 5 Extremely important 75 29.2 100 Total 257 100 3.80 1.025
6.5.2.2 Importance of Non-Financial Performance Measurement Systems: Customer Satisfaction
The study investigated the use of non-financial performance measurement systems (Customers
Satisfaction) in Libyan higher education. Customers’ satisfaction is one of the non-financial
performance measurement systems (student and staff) to know the importance of customer satisfaction
and retention in Libyan higher education sector. The results in table 6:31 shows that about 10% of the
questionnaire respondents view non-financial PMS (Customers) as not at all important, about 0.4%
view then as having less than moderate importance (Not important), about 9% consider them
moderately important and about 81 think they are above moderate importance (Extremely important or
important). The value of the mean was 3.96 (above moderate importance).
Table 6:35 Non-Financial Performance Measurement Systems Importance: Customer Satisfaction
5-point scales Frequency Percent Cumulative Percent
Mea
n
Std.
D
evia
tion
1 Not at all important 26 10.1 10.1
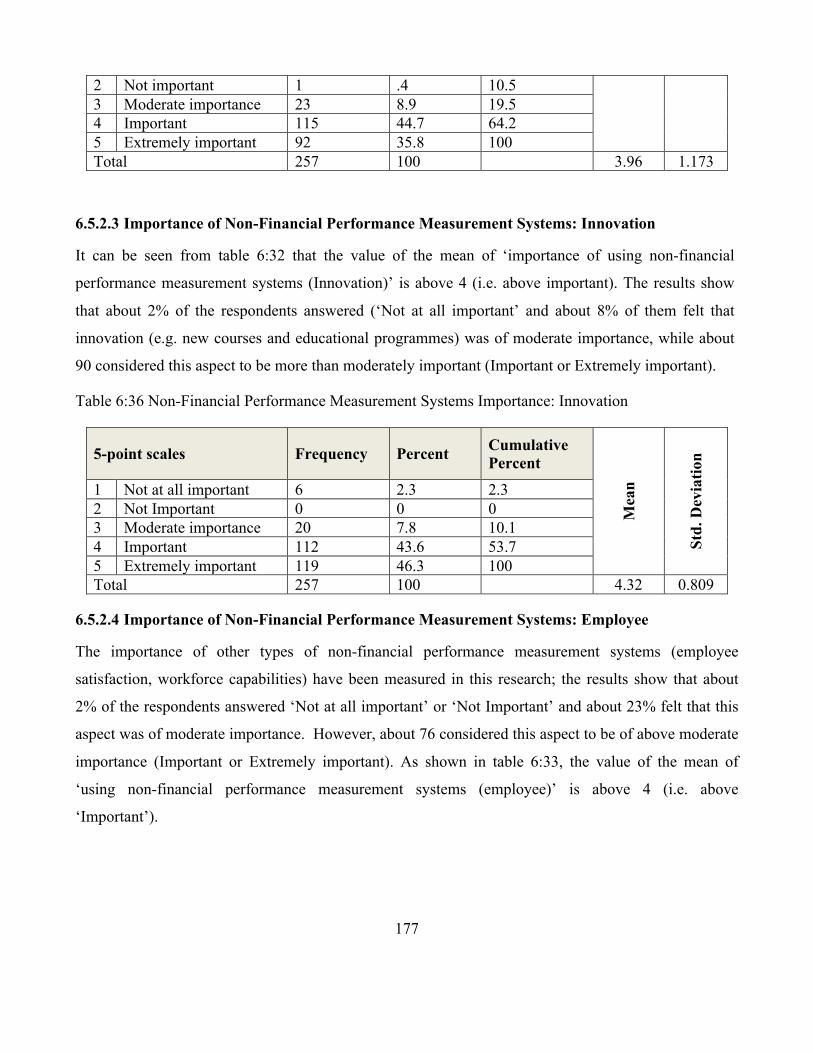
177
2 Not important 1 .4 10.5 3 Moderate importance 23 8.9 19.5 4 Important 115 44.7 64.2 5 Extremely important 92 35.8 100 Total 257 100 3.96 1.173
6.5.2.3 Importance of Non-Financial Performance Measurement Systems: Innovation
It can be seen from table 6:32 that the value of the mean of ‘importance of using non-financial
performance measurement systems (Innovation)’ is above 4 (i.e. above important). The results show
that about 2% of the respondents answered (‘Not at all important’ and about 8% of them felt that
innovation (e.g. new courses and educational programmes) was of moderate importance, while about
90 considered this aspect to be more than moderately important (Important or Extremely important).
Table 6:36 Non-Financial Performance Measurement Systems Importance: Innovation
5-point scales Frequency Percent Cumulative Percent
Mea
n
Std.
Dev
iatio
n
1 Not at all important 6 2.3 2.3 2 Not Important 0 0 0 3 Moderate importance 20 7.8 10.1 4 Important 112 43.6 53.7 5 Extremely important 119 46.3 100 Total 257 100 4.32 0.809
6.5.2.4 Importance of Non-Financial Performance Measurement Systems: Employee
The importance of other types of non-financial performance measurement systems (employee
satisfaction, workforce capabilities) have been measured in this research; the results show that about
2% of the respondents answered ‘Not at all important’ or ‘Not Important’ and about 23% felt that this
aspect was of moderate importance. However, about 76 considered this aspect to be of above moderate
importance (Important or Extremely important). As shown in table 6:33, the value of the mean of
‘using non-financial performance measurement systems (employee)’ is above 4 (i.e. above
‘Important’).
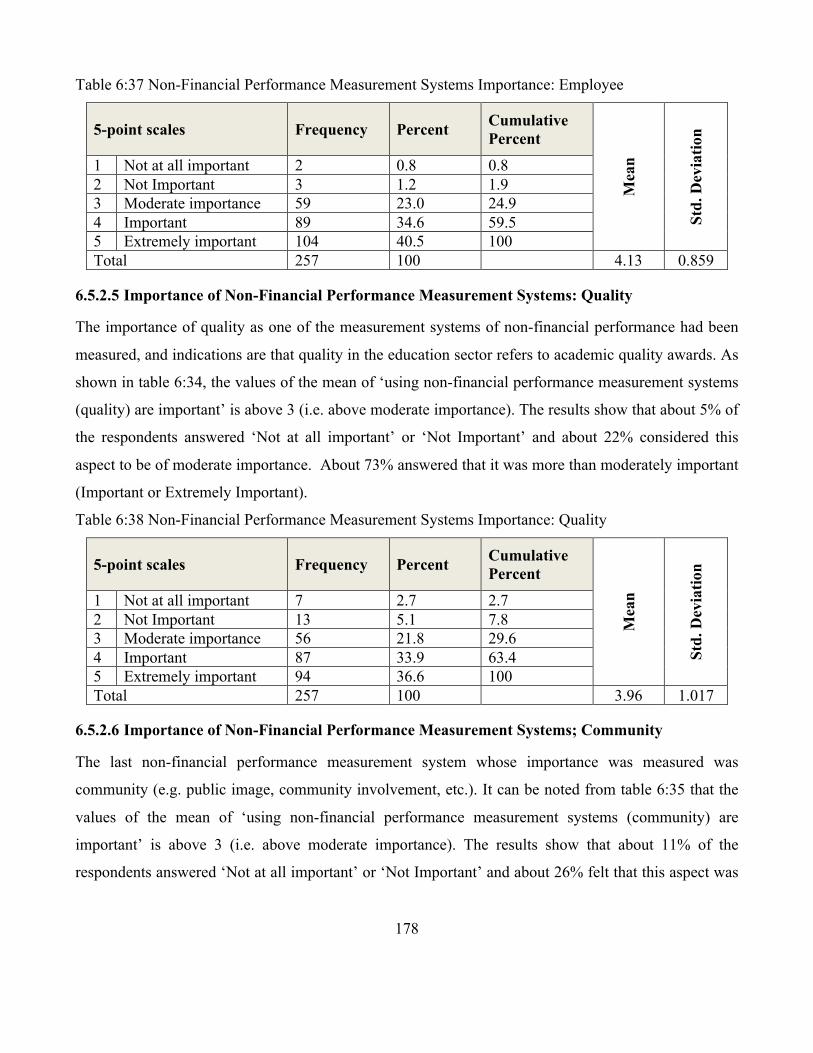
178
Table 6:37 Non-Financial Performance Measurement Systems Importance: Employee
5-point scales Frequency Percent Cumulative Percent
Mea
n
Std.
Dev
iatio
n
1 Not at all important 2 0.8 0.8 2 Not Important 3 1.2 1.9 3 Moderate importance 59 23.0 24.9 4 Important 89 34.6 59.5 5 Extremely important 104 40.5 100 Total 257 100 4.13 0.859
6.5.2.5 Importance of Non-Financial Performance Measurement Systems: Quality
The importance of quality as one of the measurement systems of non-financial performance had been
measured, and indications are that quality in the education sector refers to academic quality awards. As
shown in table 6:34, the values of the mean of ‘using non-financial performance measurement systems
(quality) are important’ is above 3 (i.e. above moderate importance). The results show that about 5% of
the respondents answered ‘Not at all important’ or ‘Not Important’ and about 22% considered this
aspect to be of moderate importance. About 73% answered that it was more than moderately important
(Important or Extremely Important).
Table 6:38 Non-Financial Performance Measurement Systems Importance: Quality
5-point scales Frequency Percent Cumulative Percent
Mea
n
Std.
Dev
iatio
n
1 Not at all important 7 2.7 2.7 2 Not Important 13 5.1 7.8 3 Moderate importance 56 21.8 29.6 4 Important 87 33.9 63.4 5 Extremely important 94 36.6 100 Total 257 100 3.96 1.017
6.5.2.6 Importance of Non-Financial Performance Measurement Systems; Community
The last non-financial performance measurement system whose importance was measured was
community (e.g. public image, community involvement, etc.). It can be noted from table 6:35 that the
values of the mean of ‘using non-financial performance measurement systems (community) are
important’ is above 3 (i.e. above moderate importance). The results show that about 11% of the
respondents answered ‘Not at all important’ or ‘Not Important’ and about 26% felt that this aspect was

179
of moderate importance. About 63% felt that this was more than moderately important (Important or
Extremely important).
Table 6:39 Non-Financial Performance Measurement Systems Importance/ Community
5-point scales Frequency Percent Cumulative Percent
Mea
n
Std.
Dev
iatio
n
1 Not at all important 12 4.7 4.7 2 Not Important 28 10.9 15.6 3 Moderate importance 67 26.1 41.6 4 Important 75 29.2 70.8 5 Extremely important 75 29.2 100 Total 257 100 3.67 1.143
6.5.2.7 Summary of Financial and Non-Financial Performance Measurement Systems
Importance
Respondents’ perception of the importance of financial and non-financial performance measurement
systems in Libyan higher education is presented in table 6:36.
It can be noted from table 6:36 that the highest value mean of ‘the importance of using non-financial
performance measurement systems for innovation’, which was 4.32 (i.e. above 4 and above
‘Important’). The second rank in terms of value mean went to ‘employee’, the third to ‘customer’ and
‘quality’, the fourth to ‘financial performance measurement systems’ and the last to ‘community’.
Table 6:40 Summary of Financial and Non-Financial Performance Measurement Systems Importance
N Importance of Performance Measurement Systems Mean Rank
1 Financial Performance Measurement Systems (e.g. annual earnings, return on assets, cost reduction, general administrative expenditures per student, tuition and fee levels etc.) 3.80 4
2 Non-Financial Performance Measurement Systems: Customer (student and staff), (e.g. customer satisfaction, customer retention, etc.) 3.96 3
3 Non-Financial Performance Measurement Systems : Innovation (e.g. courses or educational programs) 4.32 1
4 Non-Financial Performance Measurement Systems: Employee (e.g. employee satisfaction, workforce capabilities, etc.) 4.13 2

180
5 Non-Financial Performance Measurement Systems: Quality (e.g. academic quality awards, etc.) 3.96 3
6 Non-Financial Performance Measurement Systems: Community (e.g. public image, community involvement, etc.) 3.67 5
6.5.3 Use of performance measurement system
This study investigated the importance of performance measurement systems in Libyan higher
education; it also investigated the use of performance measurement systems (financial, non-financial,
advanced techniques) to find out to what extent the performance measurements systems are used in
Libyan higher education sector to evaluate performance. The first question in section F (F1) was about
the financial performance measurement systems (e.g. annual earnings, return on assets, cost reduction,
general administrative expenditure per student, tuition and fee levels etc.), and the other questions (F2,
F3, F4, F5, F6) were about non-financial performance measurement systems (Customer, innovation,
employee, quality and community). A 5-point scale was used to investigate the extent of using of
financial and non-financial performance measurement systems in Libyan higher education sector. (1=
Not used at all, 2= Slightly used, 3= Moderately used, 4= Significantly used, 5= Highly used).
6.5.3.1 Financial Performance Measurement Systems Use
The respondents were requested in this section of the questionnaire to indicate to what extent the
financial performance measurement systems are used. It can be noted from table 6:37 that the values of
the mean of ‘using financial performance measurement systems in Libyan higher education sector to
evaluate performance’ are 2.98 (i.e. about 3, which is ‘Moderately used’. The results show that 6.6% of
the respondents had not used financial performance measurement systems at all to evaluate
performance; about 3% were had used them occasionally (‘Slightly used’) and about 30 per cent had
used them moderately. In addition, about 30% used them ‘Significantly’ or ‘Highly’.
Table 6:41 Financial Performance Measurement Systems Use
5-point scales Frequency Percent Cumulative Percent
Mea
n
Std.
D
evia
tion
1 Not used at all 17 6.6 6.6 2 Slightly used 85 33.1 39.7

181
3 Moderately used 78 30.4 70.0 4 Significantly used 41 16.0 86.0 5 Highly used 36 14.0 100 Total 257 100 2.98 1.149
6.5.3.2 Use of Non-Financial Performance Measurement Systems: Customer Satisfaction
Customers are one of the non-financial performance measurement systems (student and staff) for
understanding the use of customer satisfaction and customer retention when evaluating performance in
the Libyan higher education sector. The results in table 6:38 show that about 13% of the respondents to
the questionnaire feel that customer satisfaction is not at all used to evaluate performance, about 17%
of them feel that they are ‘Slightly used’ (which is below the ‘Moderately used’ mark). The highest
percentage, which was about 42% felt they were moderately used and about 28% felt they were used
more than moderately (Significantly used or Highly used). The value of the mean was 2.93 (just under
3 or ‘Moderately used).
Table 6:42 Non-Financial Performance Measurement Systems Use: Customer Satisfaction
5-Point Scales Frequency Percent Cumulative Percent
Mea
n
Std.
Dev
iatio
n
1 Not used at all 33 12.8 12.8 2 Slightly used 43 16.7 29.6 3 Moderately used 108 42.0 71.6 4 Significantly used 54 21.0 92.6 5 Highly used 19 7.4 100 Total 257 100 2.93 1.090
6.5.3.3 Use of Non-Financial Performance Measurement Systems: Innovation
It can be seen from table 6:39 that the value of the mean of ‘using non-financial performance
measurement systems (Innovation)’ in Libyan higher education sector to evaluate performance is
above 3 (Moderately used). The results show that about 37% of the respondents answered ‘Not used at
all’ or ‘Slightly used’, about 25% answered ‘Moderately used’ and about 39% answered ‘Significantly
used’ or ‘Highly used’ – which is above ‘moderately used’ for ‘using of non-financial performance
measurement systems (Innovation)’. Here, ‘innovation’ includes courses or educational programs.

182
Table 6:43 Non-Financial Performance Measurement Systems Use: Innovation
5-Point Scales Frequency Percent Cumulative Percent
Mea
n
Std.
Dev
iatio
n
1 Not used at all 35 13.6 13.6 2 Slightly used 59 23.0 36.6 3 Moderately used 65 25.3 61.9 4 Significantly used 50 19.5 81.3 5 Highly used 48 18.7 100 Total 257 100 3.07 1.311
6.5.3.4 Use of Non-Financial Performance Measurement Systems: Employee
The importance of other types of non-financial performance measurement systems (employee
satisfaction, workforce capabilities) had been measured in this research to find out to what extent the
employees are seen as one of the non-performance measurement systems used in Libyan higher
education sector to evaluate performance. As shown in table 6:40, the value of the mean of using ‘non-
financial performance measurement systems (employee)’ to evaluate performance is 2.95, and the
results show that about 34% of the respondents answered ‘Not used at all’ or ‘Slightly used’. Also,
about 35% said they were moderately used and about 31% said they were more than moderately used
(‘Significantly used’ or ‘Highly used’).
Table 6:44 Non-Financial Performance Measurement Systems Use: Employee
5-Point Scales Frequency Percent Cumulative Percent
Mea
n
Std.
Dev
iatio
n
1 Not used at all 16 6.2 6.2 2 Slightly used 71 27.6 33.9 3 Moderately used 90 35.0 68.9 4 Significantly used 70 27.2 96.1 5 Highly used 10 3.9 100 Total 257 100 2.95 0.977
6.5.3.5 Use of Non-Financial Performance Measurement Systems: Quality
The use of quality as one of the measurement systems of non-financial performance to evaluate Libyan
higher education performance was measured. Results indicate that quality in the education sector
refers to academic quality awards, and as shown in table 6:41, the values of the mean of ‘using non-
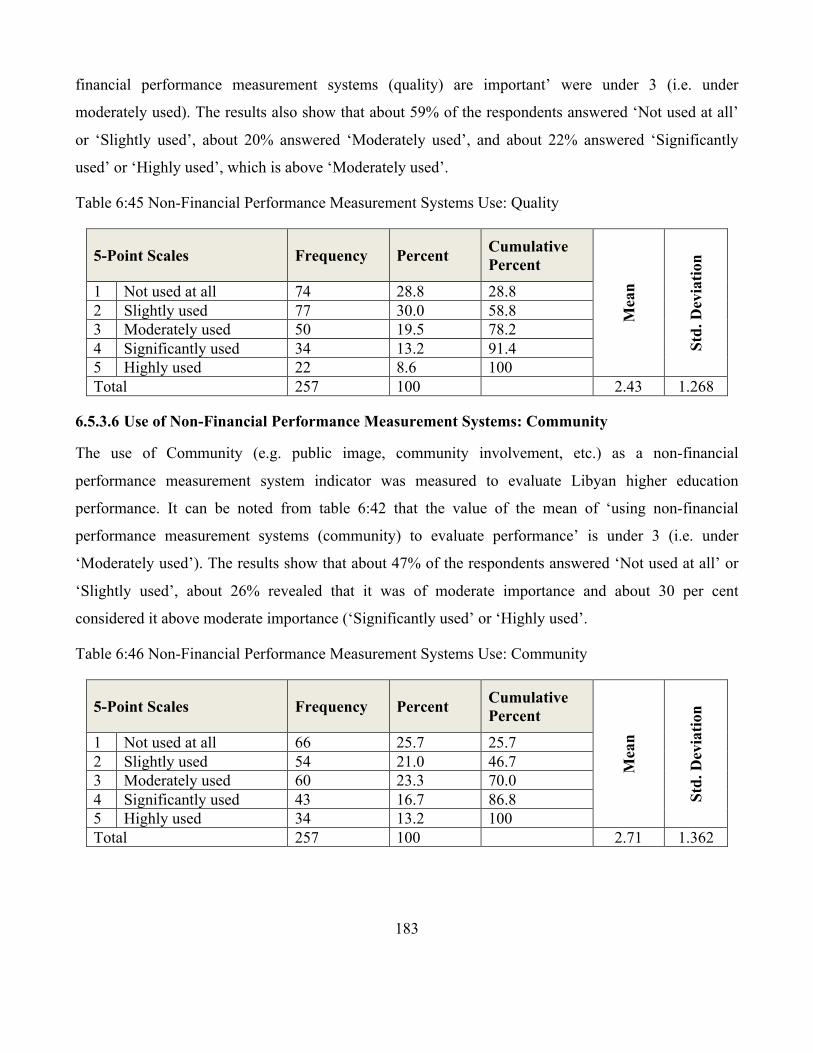
183
financial performance measurement systems (quality) are important’ were under 3 (i.e. under
moderately used). The results also show that about 59% of the respondents answered ‘Not used at all’
or ‘Slightly used’, about 20% answered ‘Moderately used’, and about 22% answered ‘Significantly
used’ or ‘Highly used’, which is above ‘Moderately used’.
Table 6:45 Non-Financial Performance Measurement Systems Use: Quality
5-Point Scales Frequency Percent Cumulative Percent
Mea
n
Std.
Dev
iatio
n
1 Not used at all 74 28.8 28.8 2 Slightly used 77 30.0 58.8 3 Moderately used 50 19.5 78.2 4 Significantly used 34 13.2 91.4 5 Highly used 22 8.6 100 Total 257 100 2.43 1.268
6.5.3.6 Use of Non-Financial Performance Measurement Systems: Community
The use of Community (e.g. public image, community involvement, etc.) as a non-financial
performance measurement system indicator was measured to evaluate Libyan higher education
performance. It can be noted from table 6:42 that the value of the mean of ‘using non-financial
performance measurement systems (community) to evaluate performance’ is under 3 (i.e. under
‘Moderately used’). The results show that about 47% of the respondents answered ‘Not used at all’ or
‘Slightly used’, about 26% revealed that it was of moderate importance and about 30 per cent
considered it above moderate importance (‘Significantly used’ or ‘Highly used’.
Table 6:46 Non-Financial Performance Measurement Systems Use: Community
5-Point Scales Frequency Percent Cumulative Percent
Mea
n
Std.
Dev
iatio
n
1 Not used at all 66 25.7 25.7 2 Slightly used 54 21.0 46.7 3 Moderately used 60 23.3 70.0 4 Significantly used 43 16.7 86.8 5 Highly used 34 13.2 100 Total 257 100 2.71 1.362
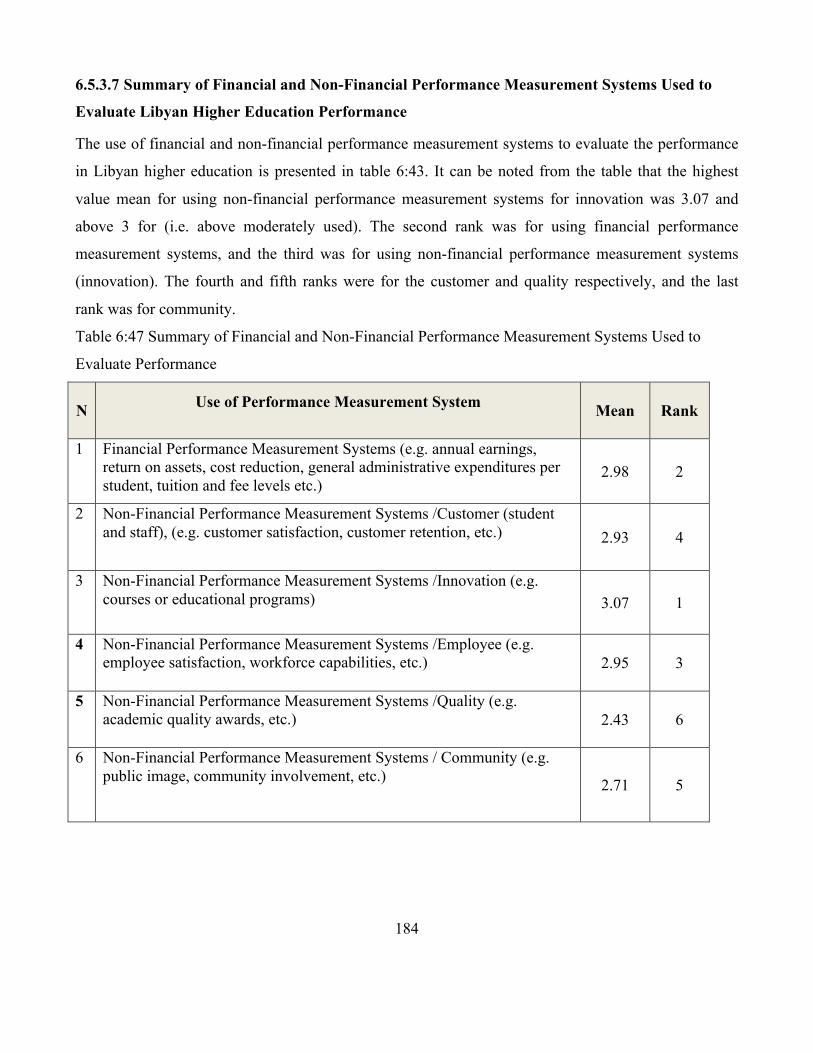
184
6.5.3.7 Summary of Financial and Non-Financial Performance Measurement Systems Used to
Evaluate Libyan Higher Education Performance
The use of financial and non-financial performance measurement systems to evaluate the performance
in Libyan higher education is presented in table 6:43. It can be noted from the table that the highest
value mean for using non-financial performance measurement systems for innovation was 3.07 and
above 3 for (i.e. above moderately used). The second rank was for using financial performance
measurement systems, and the third was for using non-financial performance measurement systems
(innovation). The fourth and fifth ranks were for the customer and quality respectively, and the last
rank was for community.
Table 6:47 Summary of Financial and Non-Financial Performance Measurement Systems Used to
Evaluate Performance
N Use of Performance Measurement System Mean Rank
1 Financial Performance Measurement Systems (e.g. annual earnings, return on assets, cost reduction, general administrative expenditures per student, tuition and fee levels etc.)
2.98 2
2 Non-Financial Performance Measurement Systems /Customer (student and staff), (e.g. customer satisfaction, customer retention, etc.) 2.93 4
3 Non-Financial Performance Measurement Systems /Innovation (e.g. courses or educational programs) 3.07 1
4 Non-Financial Performance Measurement Systems /Employee (e.g. employee satisfaction, workforce capabilities, etc.) 2.95 3
5 Non-Financial Performance Measurement Systems /Quality (e.g. academic quality awards, etc.) 2.43 6
6 Non-Financial Performance Measurement Systems / Community (e.g. public image, community involvement, etc.) 2.71 5
185
6.6 Summary
This chapter has the presented questionnaire survey results, which included the respondents' profile in
general, organisation culture profile, and performance measurement system profile. The purpose of this
chapter was to explore the dominant type of organisational culture in Libyan higher education in
general and in its branches in particular, on the basis of the type of higher education (such as
universities, higher institutions and technical colleges) and of ownership (private, public). In addition,
this study also explored the status of performance measurement systems in Libyan higher education,
through an investigation of the frequency and percentage of use of PMS on one hand, and how decision
makers respond to the importance of PMS on the other. The data was analysed using SPSS version 20
and a descriptive analysis for Libyan higher education was conducted by using a multiple linear
regression. The next chapter discussed the second part of the questionnaire survey results, which are
related to the influence of the organisational culture types on the acceptance, importance and use of the
performance measurement systems.

186
Chapter 7: The Influence of Organisational Culture on
Performance Measurement Systems Results
7.1 Introduction
The previous chapter outlined the questionnaire survey results for organisational culture types and the
acceptance, importance and use of performance measurement systems. The aim of this chapter is to
present, analyse and discuss the data obtained from these questionnaires.
The purpose is to explore the dominant type of organisational culture and the influential relationship of
this culture, at organisational level, on the acceptance, importance and use of performance
measurement systems. The results of this chapter are presented in five main sections, following this
introductory paragraph. The first section is the introduction, the second section presents the results of
the influence of organisational culture on the acceptance of PMS, the third section deals with the
influence of organisational culture on the importance of PMS, and the fourth section reports the
influence of organisational culture on the use of PMS. Finally the fifth section gives the summary of
this chapter.
A multiple linear regression was performed to assess the relationships between the independent
variable (organisational culture) by using the Organisational Culture Assessment Instrument (OCAI)
for the four organisational culture types of Clan, Adhocracy, Market and Hierarchy as the independent
variables, and the acceptance, importance and use of PMS as the dependent variables.
7.2 Influence of Organisational Culture on (PMS) Acceptance in Libyan Higher Education
Table 7:1 describes the organisational culture dominant in Libyan higher education and the significance
of the four organisational culture types of Clan, Adhocracy, Market and Hierarchy. It can be noted
from the table that although the dominant culture in Libyan higher education was Hierarchy, Clan and
Adhocracy cultures were highly significant when associated with PMS acceptance, and Hierarchy and
Market cultures were not significant.
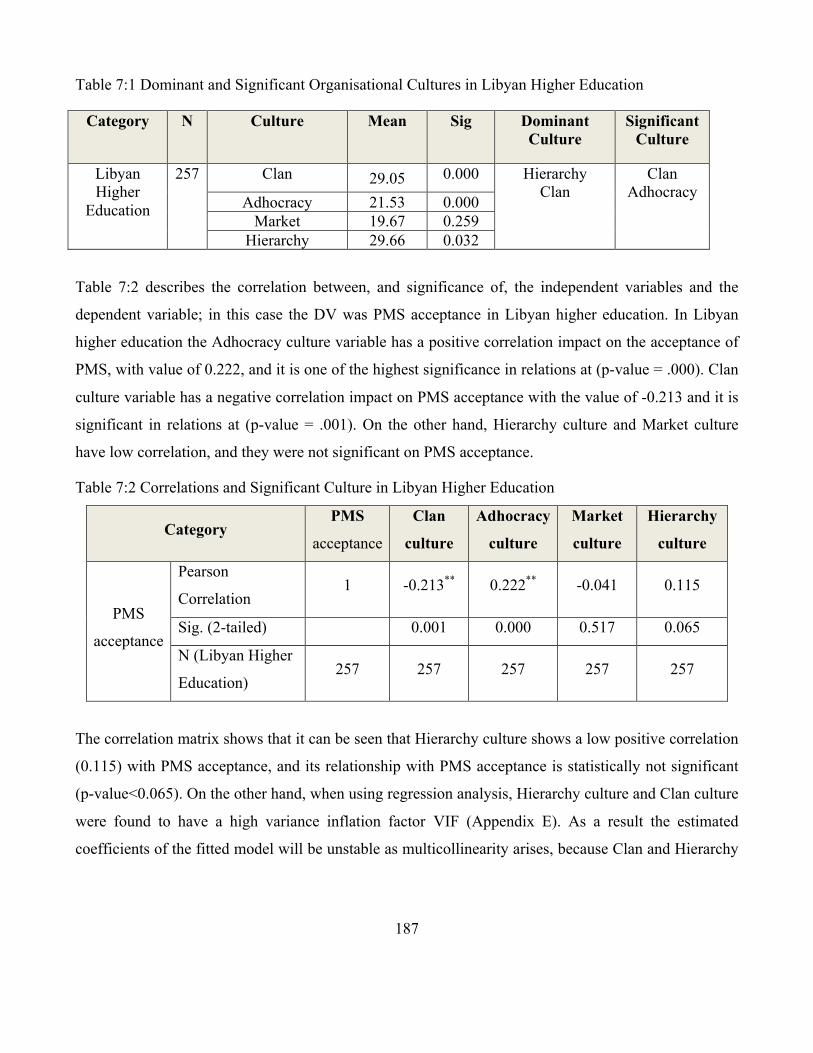
187
Table 7:1 Dominant and Significant Organisational Cultures in Libyan Higher Education
Category N Culture Mean Sig Dominant Culture
Significant Culture
Libyan Higher
Education
257 Clan 29.05 0.000 Hierarchy Clan
Clan Adhocracy
Adhocracy 21.53 0.000 Market 19.67 0.259
Hierarchy 29.66 0.032
Table 7:2 describes the correlation between, and significance of, the independent variables and the
dependent variable; in this case the DV was PMS acceptance in Libyan higher education. In Libyan
higher education the Adhocracy culture variable has a positive correlation impact on the acceptance of
PMS, with value of 0.222, and it is one of the highest significance in relations at (p-value = .000). Clan
culture variable has a negative correlation impact on PMS acceptance with the value of -0.213 and it is
significant in relations at (p-value = .001). On the other hand, Hierarchy culture and Market culture
have low correlation, and they were not significant on PMS acceptance.
Table 7:2 Correlations and Significant Culture in Libyan Higher Education
Category PMS
acceptance
Clan
culture
Adhocracy
culture
Market
culture
Hierarchy
culture
PMS
acceptance
Pearson
Correlation 1 -0.213** 0.222** -0.041 0.115
Sig. (2-tailed) 0.001 0.000 0.517 0.065
N (Libyan Higher
Education) 257 257 257 257 257
The correlation matrix shows that it can be seen that Hierarchy culture shows a low positive correlation
(0.115) with PMS acceptance, and its relationship with PMS acceptance is statistically not significant
(p-value<0.065). On the other hand, when using regression analysis, Hierarchy culture and Clan culture
were found to have a high variance inflation factor VIF (Appendix E). As a result the estimated
coefficients of the fitted model will be unstable as multicollinearity arises, because Clan and Hierarchy

188
cultures have similar mean results and a strong correlation (0.649) (Pallant, 2007, p. 150)1. As a result,
the Clan culture variable will be excluded from the model in order to avoid any unstable results, but it
should be kept in mind that this does not mean that Clan culture is not important.
Table 7.3 reveals the results of the IVs (Hierarchy, Adhocracy, Market and Clan cultures) and the DV
(PMS acceptance). The results show that two of the IVs contributed significantly to the model.
Adhocracy culture is (B) = 037, t = 4.387 and p < 0.000, the confidence level is 95% and the actual
value of B in the population lies somewhere between (0.020) and (0.054). Hierarchy culture is (B) =
0.013, t = 2.787 and p< 0.006, the confidence level is 95%, and the actual value of B in the population
lies somewhere between (0.004) and (0.023). Market culture was not significant in this model.
Table 7:3 Linear Regression Model for Organisational Culture in Libyan higher education
Model
Unstandardised
Coefficients
Standardised
Coefficients
t
Sig.
95%
Confidence
Interval for B
Collinearity
Statistics
B
Std.
Error
Beta
Lower
Bound
B
Toleranc
e VIF
(Constant) 2.404 0.328
7.330 0.000 1.758
3.05
0
Adhocracy 0.037 0.008 0.275 4.387 0.000 0.020
0.05
4 0.923
1.08
3
Market -0.001 0.008 -0.005 -0.069 0.945 -0.017
0.01
5 0.836
1.19
7
Hierarchy 0.013 0.005 0.189 2.787 0.006 0.004
0.02
3 0.790
1.26
6
a. Dependent Variable: PMS acceptance
b. Variance inflation factor (VIF): an indicator of the effect the other explanatory variables have
on the variance of a regression coefficient of a particular variable, given by the reciprocal of the
square of the multiple correlation coefficient of the variable with the remaining variables
(Everitt, 2002)
1 If VIF value of above 10 in your own results, you should seriously consider removing one of the highly intercorrelated

189
Table 7:4 shows that the value of R square is 0.083 (8.3%); this is the explained variance in the DV
PMS by organisational culture traits. The value of R= 0.288 shows that the model is fit and this value is
of low enough for the acceptance of the model.
Table 7:4 Model Summary
Model R R Square Adjusted R Square Std. Error of the
Estimate
1 0.288a 0.083 0.072 0.654
a. Predictors: (Constant), Hierarchy culture, Adhocracy culture, Market culture
b. Dependent Variable: PMS acceptance
Table 7:5 shows that the F statistic is significant at 0.000, which shows the fitness of the model.
Therefore organisational culture is a strong predictor of PMS acceptance.
Table 7:5 ANOVAa
Model Sum of Squares df Mean Square F Sig.
1
Regression 9.814 3 3.271 7.642 0.000b
Residual 108.306 253 0.428
Total 118.120 256
a. Dependent Variable: PMS acceptance b. Predictors: (Constant), Adhocracy culture, Market culture, Clan culture
7.2.1 Influence of Organisational Culture on PMS acceptance in Libyan Universities
Table 7:6 represents the current dominant culture type for the Libyan universities. The dominant
organisational culture type for Libyan universities is Hierarchy culture followed by Clan culture; these
are followed by Adhocracy and Market cultures. It can be noted that the difference in means between
Hierarchy culture and Clan culture is very small (29.00, 28.14).
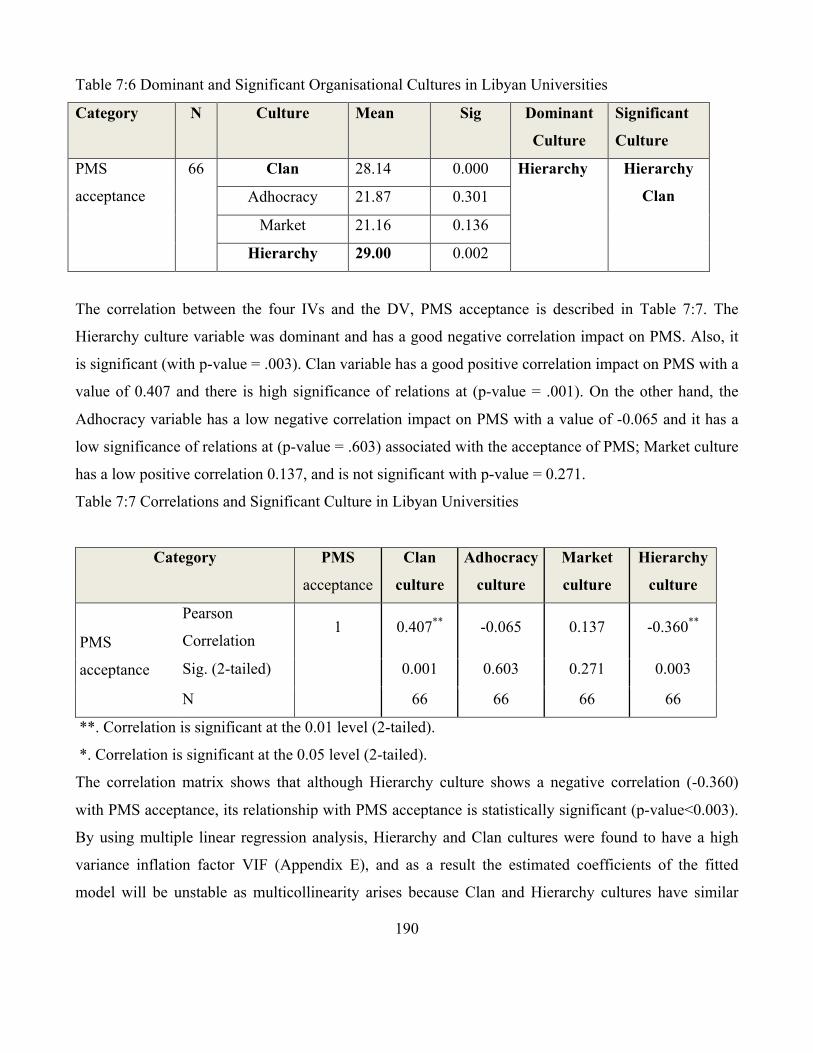
190
Table 7:6 Dominant and Significant Organisational Cultures in Libyan Universities
Category N Culture Mean Sig Dominant
Culture
Significant
Culture
PMS
acceptance
66 Clan 28.14 0.000 Hierarchy
Hierarchy
Clan Adhocracy 21.87 0.301
Market 21.16 0.136
Hierarchy 29.00 0.002
The correlation between the four IVs and the DV, PMS acceptance is described in Table 7:7. The
Hierarchy culture variable was dominant and has a good negative correlation impact on PMS. Also, it
is significant (with p-value = .003). Clan variable has a good positive correlation impact on PMS with a
value of 0.407 and there is high significance of relations at (p-value = .001). On the other hand, the
Adhocracy variable has a low negative correlation impact on PMS with a value of -0.065 and it has a
low significance of relations at (p-value = .603) associated with the acceptance of PMS; Market culture
has a low positive correlation 0.137, and is not significant with p-value = 0.271.
Table 7:7 Correlations and Significant Culture in Libyan Universities
Category PMS
acceptance
Clan
culture
Adhocracy
culture
Market
culture
Hierarchy
culture
PMS
acceptance
Pearson
Correlation 1 0.407** -0.065 0.137 -0.360**
Sig. (2-tailed) 0.001 0.603 0.271 0.003
N 66 66 66 66
**. Correlation is significant at the 0.01 level (2-tailed).
*. Correlation is significant at the 0.05 level (2-tailed).
The correlation matrix shows that although Hierarchy culture shows a negative correlation (-0.360)
with PMS acceptance, its relationship with PMS acceptance is statistically significant (p-value<0.003).
By using multiple linear regression analysis, Hierarchy and Clan cultures were found to have a high
variance inflation factor VIF (Appendix E), and as a result the estimated coefficients of the fitted
model will be unstable as multicollinearity arises because Clan and Hierarchy cultures have similar
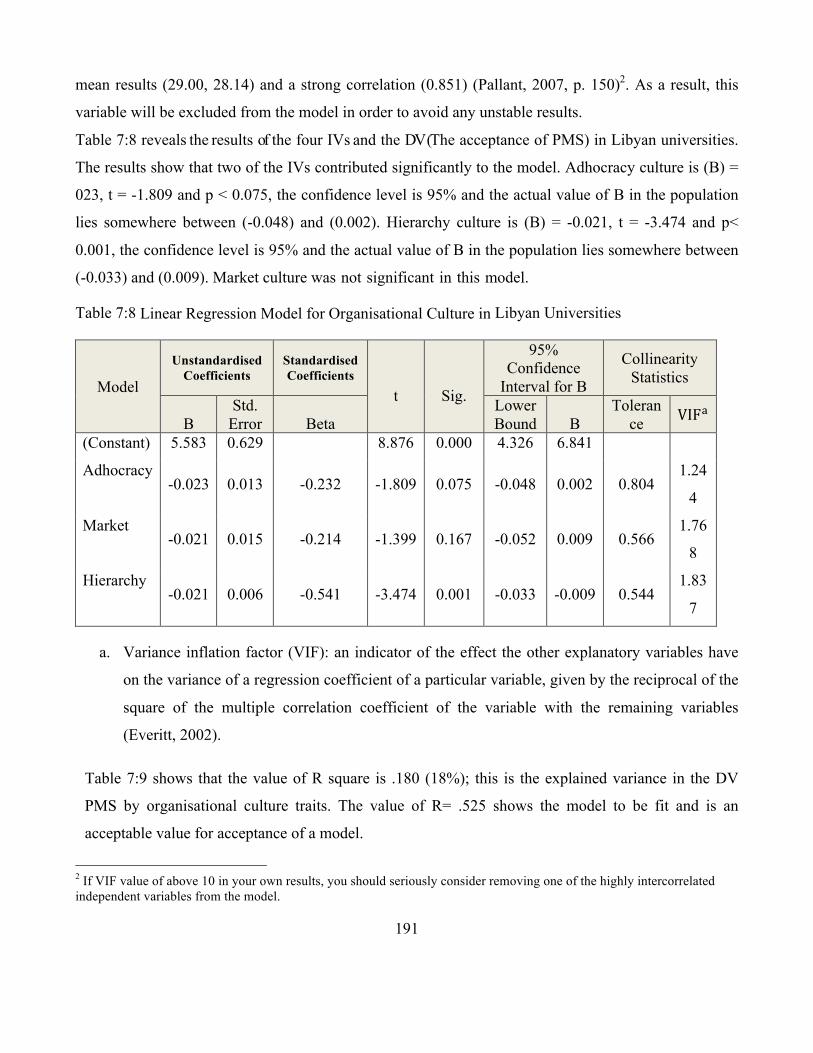
191
mean results (29.00, 28.14) and a strong correlation (0.851) (Pallant, 2007, p. 150)2. As a result, this
variable will be excluded from the model in order to avoid any unstable results.
Table 7:8 reveals the results of the four IVs and the DV (The acceptance of PMS) in Libyan universities.
The results show that two of the IVs contributed significantly to the model. Adhocracy culture is (B) =
023, t = -1.809 and p < 0.075, the confidence level is 95% and the actual value of B in the population
lies somewhere between (-0.048) and (0.002). Hierarchy culture is (B) = -0.021, t = -3.474 and p<
0.001, the confidence level is 95% and the actual value of B in the population lies somewhere between
(-0.033) and (0.009). Market culture was not significant in this model.
Table 7:8 Linear Regression Model for Organisational Culture in Libyan Universities
Model
Unstandardised Coefficients
Standardised Coefficients
t
Sig.
95% Confidence
Interval for B
Collinearity Statistics
B
Std. Error
Beta
Lower Bound
B
Tolerance VIF!
(Constant) 5.583 0.629 8.876 0.000 4.326 6.841
Adhocracy -0.023 0.013 -0.232 -1.809 0.075 -0.048 0.002 0.804
1.24
4
Market -0.021 0.015 -0.214 -1.399 0.167 -0.052 0.009 0.566
1.76
8
Hierarchy -0.021 0.006 -0.541 -3.474 0.001 -0.033 -0.009 0.544
1.83
7
a. Variance inflation factor (VIF): an indicator of the effect the other explanatory variables have
on the variance of a regression coefficient of a particular variable, given by the reciprocal of the
square of the multiple correlation coefficient of the variable with the remaining variables
(Everitt, 2002).
Table 7:9 shows that the value of R square is .180 (18%); this is the explained variance in the DV
PMS by organisational culture traits. The value of R= .525 shows the model to be fit and is an
acceptable value for acceptance of a model.
2 If VIF value of above 10 in your own results, you should seriously consider removing one of the highly intercorrelated independent variables from the model.
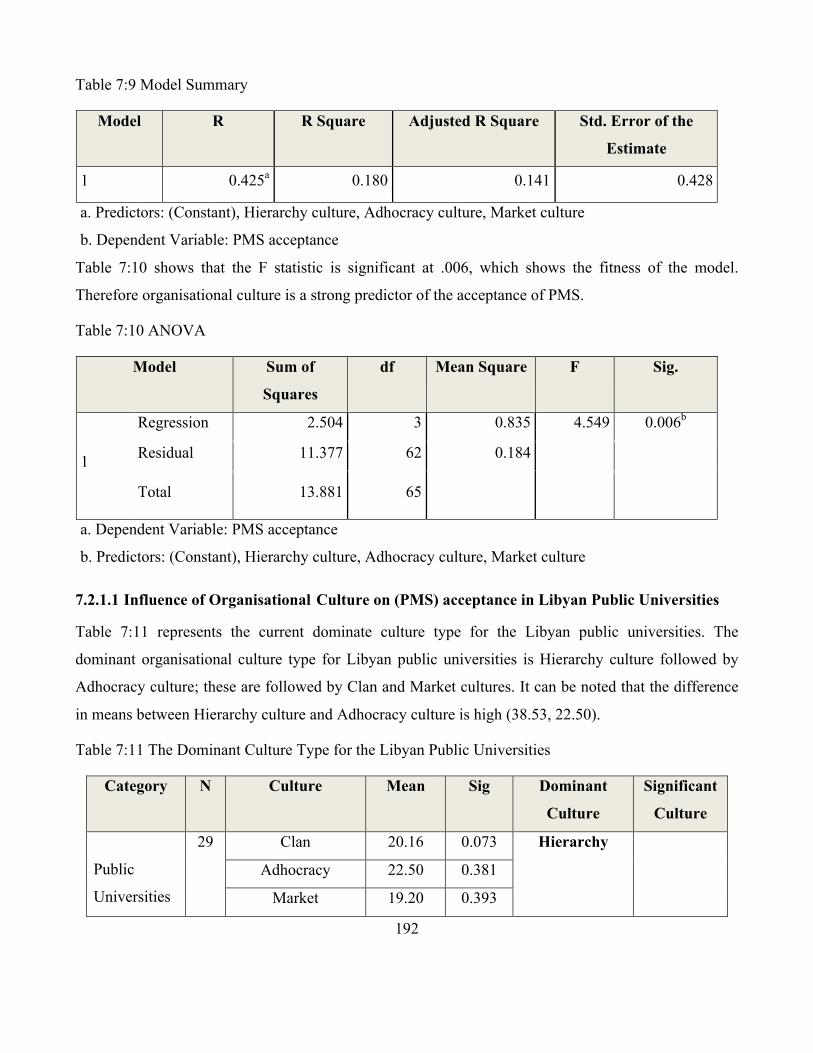
192
Table 7:9 Model Summary
Model R R Square Adjusted R Square Std. Error of the
Estimate
1 0.425a 0.180 0.141 0.428
a. Predictors: (Constant), Hierarchy culture, Adhocracy culture, Market culture
b. Dependent Variable: PMS acceptance
Table 7:10 shows that the F statistic is significant at .006, which shows the fitness of the model.
Therefore organisational culture is a strong predictor of the acceptance of PMS.
Table 7:10 ANOVA
Model Sum of
Squares
df Mean Square F Sig.
1
Regression 2.504 3 0.835 4.549 0.006b
Residual 11.377 62 0.184
Total 13.881 65
a. Dependent Variable: PMS acceptance
b. Predictors: (Constant), Hierarchy culture, Adhocracy culture, Market culture
7.2.1.1 Influence of Organisational Culture on (PMS) acceptance in Libyan Public Universities
Table 7:11 represents the current dominate culture type for the Libyan public universities. The
dominant organisational culture type for Libyan public universities is Hierarchy culture followed by
Adhocracy culture; these are followed by Clan and Market cultures. It can be noted that the difference
in means between Hierarchy culture and Adhocracy culture is high (38.53, 22.50).
Table 7:11 The Dominant Culture Type for the Libyan Public Universities
Category N Culture Mean Sig Dominant
Culture
Significant
Culture
Public
Universities
29 Clan 20.16 0.073 Hierarchy
Adhocracy 22.50 0.381
Market 19.20 0.393

193
Hierarchy 38.53 0.107
The correlation between the four IVs and the DV, PMS acceptance in Libyan public universities, is
described in Table 7:12. The Hierarchy culture variable was dominant in public universities and has a
negative correlation impact on PMS, but it is not significant (with p-value = 0.107). Clan variable has a
positive correlation impact on PMS with a value of 0.258 and there is no significance of relations (p-
value = 0.088). On the other hand, the Adhocracy variable has a low positive correlation impact on the
PMS with a value of 0.059; it has no significance of relations at (p-value = 0.381) associated with PMS
acceptance. Market culture has a low positive correlation of 0.053 and is not significant with (p-value =
0.393).
Table 7:12 Correlations and Significant Culture in Libyan Public Universities
Category PMS acceptance
Clan culture
Adhocracy culture
Market culture
Hierarchy culture
PMS
acceptance
Pearson
Correlation
1 0.258 0.059 0.053 -0.238
Sig. (2-tailed)
0.145 0.762 0.787 0.214
N (Public
Universities)
29 29 29 29 29
The correlation matrix shows that although Hierarchy culture shows a negative correlation (-0.360)
with PMS acceptance, its relationship with PMS acceptance is statistically significant (p-value<0.003).
By using multiple linear regression analysis, Hierarchy and Clan cultures were found to have a high
variance inflation factor VIF (Appendix E), and as a result the estimated coefficients of the fitted
model will be unstable as multicollinearity arises because Clan and Hierarchy cultures have a strong
correlation (0.715) (see appendix F) (Pallant, 2007, p. 150)3. As a result, this variable will be excluded
from the model in order to avoid any unstable results.
Table 7:13 reveals the results of the IVs (Hierarchy, Adhocracy, Market and Clan cultures) and DV (PMS
acceptance) in Libyan universities. The results show that two of the IVs contributed significantly to the
3 If VIF value of above 10 in your own results, you should seriously consider removing one of the highly intercorrelated independent variables from the model.

194
model. Adhocracy culture is (B) = 022, t = -0.958 and p < 0.347, the confidence level is 95%, and the
actual value of B in the population lies somewhere between (0.070) and (0.025). Market culture is (B)
= -0.015, t = -0.618 and p< 0.542, the confidence level is 95% and the actual value of B in the
population lies somewhere between (-0.063) and (0.034). Hierarchy culture is (B) = -0.020, t = -1.566
and p< 0.130, the confidence level is 95% and the actual value of B in the population lies somewhere
between (-0.046) and (0.006). None of the cultures (Hierarchy culture, Market culture and Adhocracy)
were significant in this model.
Table 7:13 Linear Regression Model for Organisational Culture in Libyan Public Universities
Model
Unstandardised Coefficients
Standardised Coefficients
t
Sig.
95% Confidence
Interval for B
Collinearity Statistics
B
Std. Error
Beta
Lower Bound
B
Tolerance VIF!
(Constant) 5.362 1.203 4.456 .000 2.884 7.839
Adhocracy -.022 .023 -.270 -.958 .347 -.070 .025 .457 2.19
Market -.015 .024 -.139 -.618 .542 -.063 .034 .712 1.40
Hierarchy -.020 .013 -.494 -1.566 .130 -.046 .006 .364 2.74
a- Variance inflation factor (VIF): an indicator of the effect the other explanatory variables have
on the variance of a regression coefficient of a particular variable, given by the reciprocal of the
square of the multiple correlation coefficient of the variable with the remaining variables
(Everitt, 2002).
Table 7:14 show that the value of R square is 0.094 (9.4%); this is the explained variance in the DV,
PMS, by organisational culture traits. The value of R= 0.307 shows the model is fit and is quite an
acceptable value for acceptance of a model.

195
Table 7:14 Model Summary
Model R R Square Adjusted R Square Std. Error of the
Estimate
1 0.307a 0.094 -0.014 0.450
a. Predictors: (Constant), Hierarchy culture, Adhocracy culture, Market culture
b. Dependent Variable: PMS acceptance
Table 7:15 shows that the F statistic is significant at .006, which shows the fitness of the model.
Therefore organisational culture is a strong predictor of PMS acceptance.
Table 7:15 ANOVA
Model Sum of Squares df Mean Square F Sig.
1
Regression .526 3 .175 .867 .471b
Residual 5.052 25 .202
Total 5.578 28
a. Dependent Variable: PMS acceptance
b. Predictors: (Constant), Hierarchy culture, Adhocracy culture, Market culture
7.2.1.2 Influence of Organisational Culture on (PMS) acceptance in Libyan Private Universities
Table 7:16 describes the organisational culture dominant in Libyan private universities and the
significance of four organisational culture types of Clan, Adhocracy, Market and Hierarchy Cultures. It
can be noted from the same table that although the dominant cultures in Libyan Private Universities
were Clan culture, none of the organisational culture types were significant associated with PMS
acceptance.
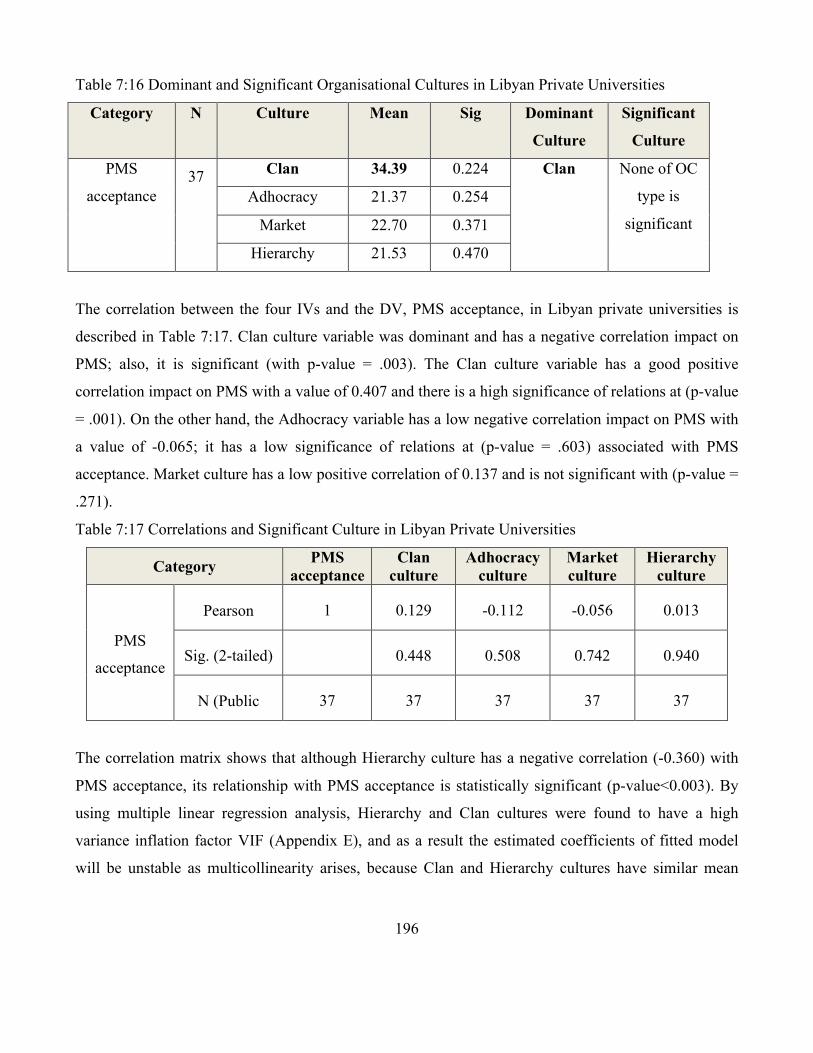
196
Table 7:16 Dominant and Significant Organisational Cultures in Libyan Private Universities
Category N Culture Mean Sig Dominant
Culture
Significant
Culture
PMS
acceptance 37 Clan 34.39 0.224 Clan
None of OC
type is
significant
Adhocracy 21.37 0.254
Market 22.70 0.371
Hierarchy 21.53 0.470
The correlation between the four IVs and the DV, PMS acceptance, in Libyan private universities is
described in Table 7:17. Clan culture variable was dominant and has a negative correlation impact on
PMS; also, it is significant (with p-value = .003). The Clan culture variable has a good positive
correlation impact on PMS with a value of 0.407 and there is a high significance of relations at (p-value
= .001). On the other hand, the Adhocracy variable has a low negative correlation impact on PMS with
a value of -0.065; it has a low significance of relations at (p-value = .603) associated with PMS
acceptance. Market culture has a low positive correlation of 0.137 and is not significant with (p-value =
.271).
Table 7:17 Correlations and Significant Culture in Libyan Private Universities
Category PMS acceptance
Clan culture
Adhocracy culture
Market culture
Hierarchy culture
PMS
acceptance
Pearson
Correlation
1 0.129 -0.112 -0.056 0.013
Sig. (2-tailed)
0.448 0.508 0.742 0.940
N (Public
Universities)
37 37 37 37 37
The correlation matrix shows that although Hierarchy culture has a negative correlation (-0.360) with
PMS acceptance, its relationship with PMS acceptance is statistically significant (p-value<0.003). By
using multiple linear regression analysis, Hierarchy and Clan cultures were found to have a high
variance inflation factor VIF (Appendix E), and as a result the estimated coefficients of fitted model
will be unstable as multicollinearity arises, because Clan and Hierarchy cultures have similar mean
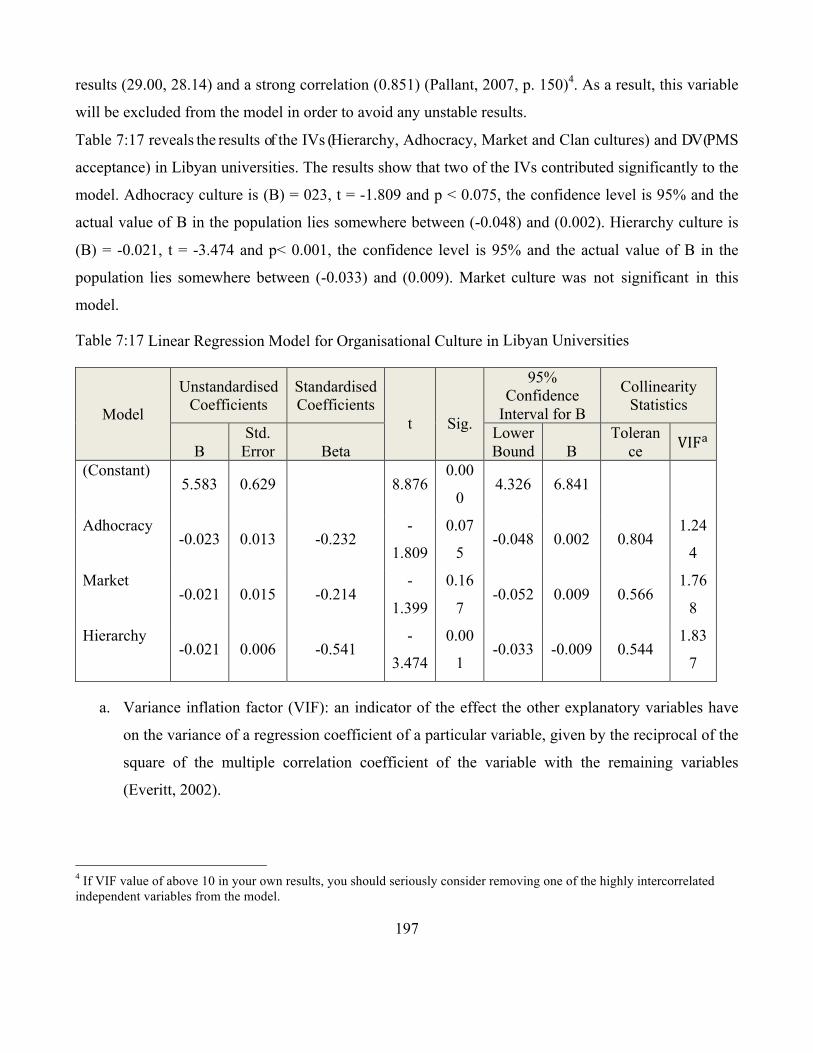
197
results (29.00, 28.14) and a strong correlation (0.851) (Pallant, 2007, p. 150)4. As a result, this variable
will be excluded from the model in order to avoid any unstable results.
Table 7:17 reveals the results of the IVs (Hierarchy, Adhocracy, Market and Clan cultures) and DV (PMS
acceptance) in Libyan universities. The results show that two of the IVs contributed significantly to the
model. Adhocracy culture is (B) = 023, t = -1.809 and p < 0.075, the confidence level is 95% and the
actual value of B in the population lies somewhere between (-0.048) and (0.002). Hierarchy culture is
(B) = -0.021, t = -3.474 and p< 0.001, the confidence level is 95% and the actual value of B in the
population lies somewhere between (-0.033) and (0.009). Market culture was not significant in this
model.
Table 7:17 Linear Regression Model for Organisational Culture in Libyan Universities
Model
Unstandardised Coefficients
Standardised Coefficients
t
Sig.
95% Confidence
Interval for B
Collinearity Statistics
B
Std. Error
Beta
Lower Bound
B
Tolerance VIF!
(Constant) 5.583 0.629
8.876
0.00
0 4.326 6.841
Adhocracy -0.023 0.013 -0.232
-
1.809
0.07
5 -0.048 0.002 0.804
1.24
4
Market -0.021 0.015 -0.214
-
1.399
0.16
7 -0.052 0.009 0.566
1.76
8
Hierarchy -0.021 0.006 -0.541
-
3.474
0.00
1 -0.033 -0.009 0.544
1.83
7
a. Variance inflation factor (VIF): an indicator of the effect the other explanatory variables have
on the variance of a regression coefficient of a particular variable, given by the reciprocal of the
square of the multiple correlation coefficient of the variable with the remaining variables
(Everitt, 2002).
4 If VIF value of above 10 in your own results, you should seriously consider removing one of the highly intercorrelated independent variables from the model.

198
Table 7:18 shows that the values of R square is .180 (18%); this is the explained variance in the DV,
PMS, by organisational culture traits. The value of R= .525, which shows that the model fit and it is
quite an acceptable value for the acceptance of a model.
Table 7:18 Model Summary
Model R R Square Adjusted R Square Std. Error of the
Estimate
1 0.425a 0.180 0.141 0.428
a. Predictors: (Constant), Hierarchy culture, Adhocracy culture, Market culture
b. Dependent Variable: PMS acceptance
Table 7:19 shows that the F statistic is significant at .006, which shows the fitness of the model.
Therefore organisational culture is a strong predictor of performance measurement system acceptance.
Table 7:19 ANOVA
Model Sum of
Squares
df Mean Square F Sig.
1
Regression 2.504 3 0.835 4.549 0.006b
Residual 11.377 62 0.184
Total 13.881 65
7.2.2 Influence of Organisational Culture on PMS acceptance for Higher Institutions in Libya
Table 7:20 describes the organisational culture which is dominant in higher institutions in Libya and
the significance of the four organisational culture types of Clan, Adhocracy, Market, and Hierarchy. It
can be noted from Table 7:20 that the dominant culture in higher institutions in Libya was Clan culture
followed by Hierarchy culture. Adhocracy and Market cultures have a lower mean compared to Clan
and Hierarchy cultures. On the other hand, the four types of cultures (Clan, Adhocracy, Market, and
Hierarchy) were highly significantly associated with PMS acceptance.
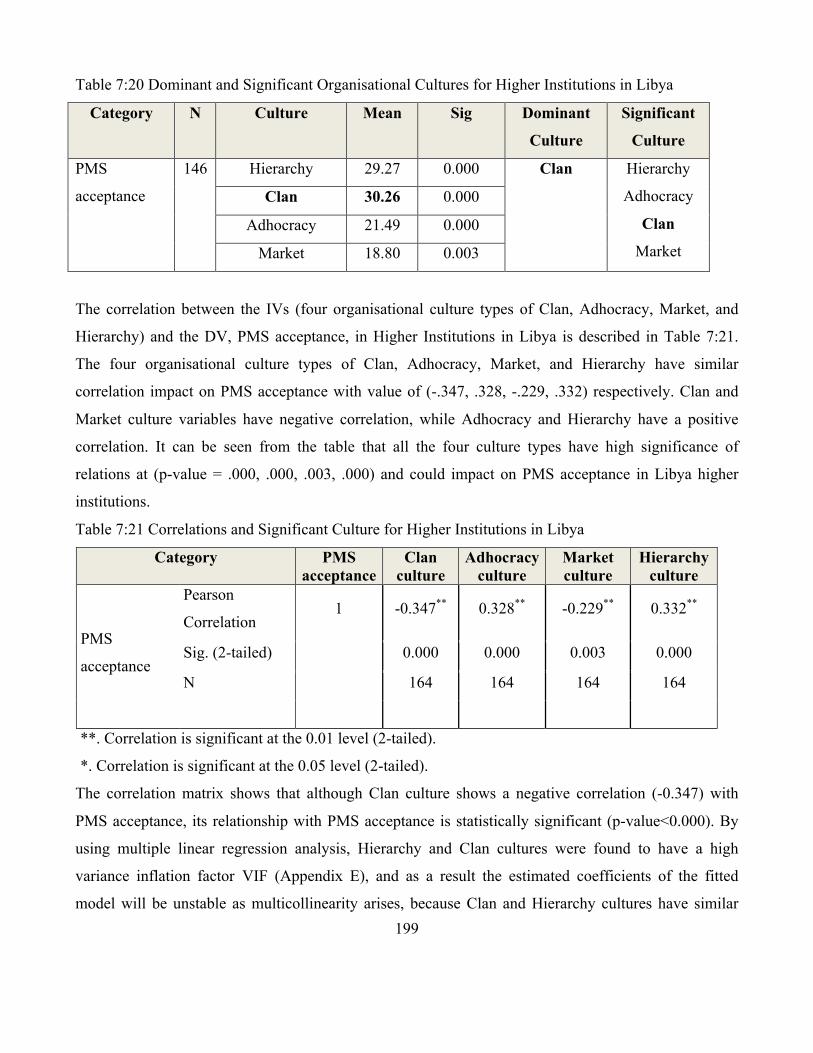
199
Table 7:20 Dominant and Significant Organisational Cultures for Higher Institutions in Libya
Category N Culture Mean Sig Dominant
Culture
Significant
Culture
PMS
acceptance
146 Hierarchy 29.27 0.000 Clan Hierarchy
Adhocracy
Clan
Market
Clan 30.26 0.000
Adhocracy 21.49 0.000
Market 18.80 0.003
The correlation between the IVs (four organisational culture types of Clan, Adhocracy, Market, and
Hierarchy) and the DV, PMS acceptance, in Higher Institutions in Libya is described in Table 7:21.
The four organisational culture types of Clan, Adhocracy, Market, and Hierarchy have similar
correlation impact on PMS acceptance with value of (-.347, .328, -.229, .332) respectively. Clan and
Market culture variables have negative correlation, while Adhocracy and Hierarchy have a positive
correlation. It can be seen from the table that all the four culture types have high significance of
relations at (p-value = .000, .000, .003, .000) and could impact on PMS acceptance in Libya higher
institutions.
Table 7:21 Correlations and Significant Culture for Higher Institutions in Libya
Category PMS acceptance
Clan culture
Adhocracy culture
Market culture
Hierarchy culture
PMS
acceptance
Pearson
Correlation 1 -0.347** 0.328** -0.229** 0.332**
Sig. (2-tailed) 0.000 0.000 0.003 0.000
N 164 164 164 164
**. Correlation is significant at the 0.01 level (2-tailed).
*. Correlation is significant at the 0.05 level (2-tailed).
The correlation matrix shows that although Clan culture shows a negative correlation (-0.347) with
PMS acceptance, its relationship with PMS acceptance is statistically significant (p-value<0.000). By
using multiple linear regression analysis, Hierarchy and Clan cultures were found to have a high
variance inflation factor VIF (Appendix E), and as a result the estimated coefficients of the fitted
model will be unstable as multicollinearity arises, because Clan and Hierarchy cultures have similar
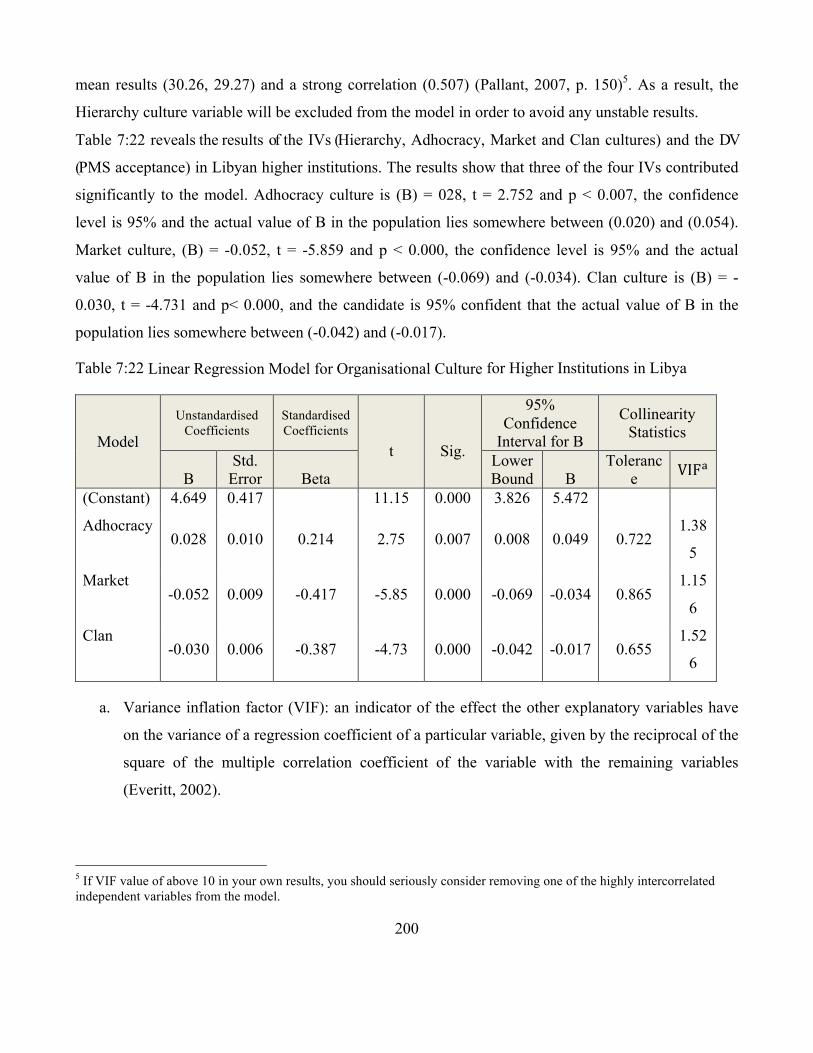
200
mean results (30.26, 29.27) and a strong correlation (0.507) (Pallant, 2007, p. 150)5. As a result, the
Hierarchy culture variable will be excluded from the model in order to avoid any unstable results.
Table 7:22 reveals the results of the IVs (Hierarchy, Adhocracy, Market and Clan cultures) and the DV
(PMS acceptance) in Libyan higher institutions. The results show that three of the four IVs contributed
significantly to the model. Adhocracy culture is (B) = 028, t = 2.752 and p < 0.007, the confidence
level is 95% and the actual value of B in the population lies somewhere between (0.020) and (0.054).
Market culture, (B) = -0.052, t = -5.859 and p < 0.000, the confidence level is 95% and the actual
value of B in the population lies somewhere between (-0.069) and (-0.034). Clan culture is (B) = -
0.030, t = -4.731 and p< 0.000, and the candidate is 95% confident that the actual value of B in the
population lies somewhere between (-0.042) and (-0.017).
Table 7:22 Linear Regression Model for Organisational Culture for Higher Institutions in Libya
Model
Unstandardised Coefficients
Standardised Coefficients
t
Sig.
95% Confidence
Interval for B
Collinearity Statistics
B
Std. Error
Beta
Lower Bound
B
Tolerance VIF!
(Constant) 4.649 0.417 11.15 0.000 3.826 5.472
Adhocracy 0.028 0.010 0.214 2.75 0.007 0.008 0.049 0.722
1.38
5
Market -0.052 0.009 -0.417 -5.85 0.000 -0.069 -0.034 0.865
1.15
6
Clan -0.030 0.006 -0.387 -4.73 0.000 -0.042 -0.017 0.655
1.52
6
a. Variance inflation factor (VIF): an indicator of the effect the other explanatory variables have
on the variance of a regression coefficient of a particular variable, given by the reciprocal of the
square of the multiple correlation coefficient of the variable with the remaining variables
(Everitt, 2002).
5 If VIF value of above 10 in your own results, you should seriously consider removing one of the highly intercorrelated independent variables from the model.
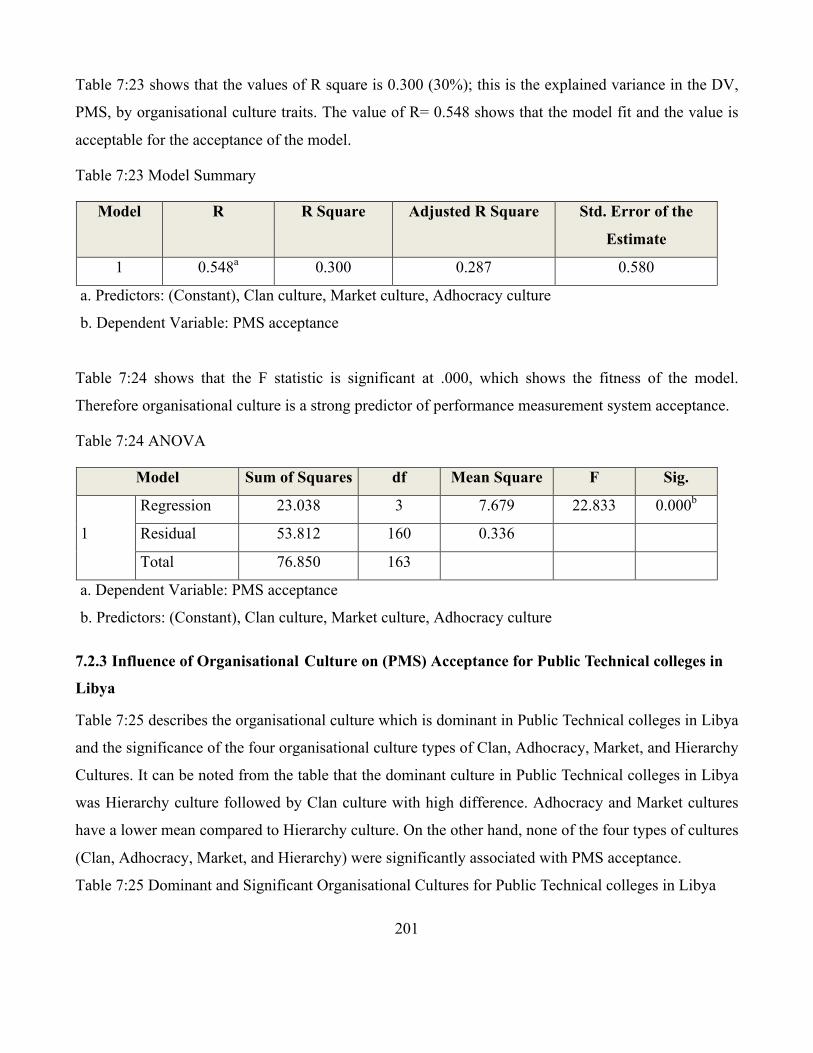
201
Table 7:23 shows that the values of R square is 0.300 (30%); this is the explained variance in the DV,
PMS, by organisational culture traits. The value of R= 0.548 shows that the model fit and the value is
acceptable for the acceptance of the model.
Table 7:23 Model Summary
Model R R Square Adjusted R Square Std. Error of the
Estimate
1 0.548a 0.300 0.287 0.580
a. Predictors: (Constant), Clan culture, Market culture, Adhocracy culture
b. Dependent Variable: PMS acceptance
Table 7:24 shows that the F statistic is significant at .000, which shows the fitness of the model.
Therefore organisational culture is a strong predictor of performance measurement system acceptance.
Table 7:24 ANOVA
Model Sum of Squares df Mean Square F Sig.
1
Regression 23.038 3 7.679 22.833 0.000b
Residual 53.812 160 0.336
Total 76.850 163
a. Dependent Variable: PMS acceptance
b. Predictors: (Constant), Clan culture, Market culture, Adhocracy culture
7.2.3 Influence of Organisational Culture on (PMS) Acceptance for Public Technical colleges in
Libya
Table 7:25 describes the organisational culture which is dominant in Public Technical colleges in Libya
and the significance of the four organisational culture types of Clan, Adhocracy, Market, and Hierarchy
Cultures. It can be noted from the table that the dominant culture in Public Technical colleges in Libya
was Hierarchy culture followed by Clan culture with high difference. Adhocracy and Market cultures
have a lower mean compared to Hierarchy culture. On the other hand, none of the four types of cultures
(Clan, Adhocracy, Market, and Hierarchy) were significantly associated with PMS acceptance.
Table 7:25 Dominant and Significant Organisational Cultures for Public Technical colleges in Libya

202
Category N Culture Mean Sig Dominant
Culture
Significant
Culture
PMS
acceptance
27 Hierarchy 33.67 0.583 Hierarchy Not any one
significant Clan 23.92 0.263
Adhocracy 20.90 0.432
Market 21.30 0.525
The correlation between the IVs (four organisational culture types of Clan, Adhocracy, Market, and
Hierarchy) and the DV, PMS acceptance, in Technical colleges in Libya is described in Table 7:26. The
four organisational culture types of Clan, Adhocracy, Market, and Hierarchy have similar correlation
impacts on PMS acceptance with a value of (-.347, .328, -.229, .332) respectively. The Clan and
Market culture variables have negative correlation, while Adhocracy and Hierarchy have a positive
correlation. It can be seen from the table that all the four culture types have a high significance of
relations at (p-value = .000, .000, .003, .000), and could impact on PMS acceptance in Libya higher
institutions.
Table 7:26 Correlations and Significant Culture for Public Technical colleges in Libya
Category PMS
acceptance
Clan
culture
Adhocracy
culture
Market
culture
Hierarchy
culture
PMS
acceptance
Pearson
Correlation 1 -0.171 0.072 0.024 0.110
Sig. (2-tailed) 0.395 0.722 0.905 0.583
N 27 27 27 27
*. Correlation is significant at the 0.05 level (2-tailed).
**. Correlation is significant at the 0.01 level (2-tailed).
The correlation matrix shows that although Clan culture shows a negative correlation (-0.347) with
PMS acceptance, its relationship with PMS acceptance is statistically significant (p-value<0.000). By
using multiple linear regression analysis, Hierarchy and Clan cultures were found to have a high
variance inflation factor VIF (Appendix E), and as a result the estimated coefficients of the fitted
model will be unstable as multicollinearity arises, because Clan and Hierarchy cultures have similar
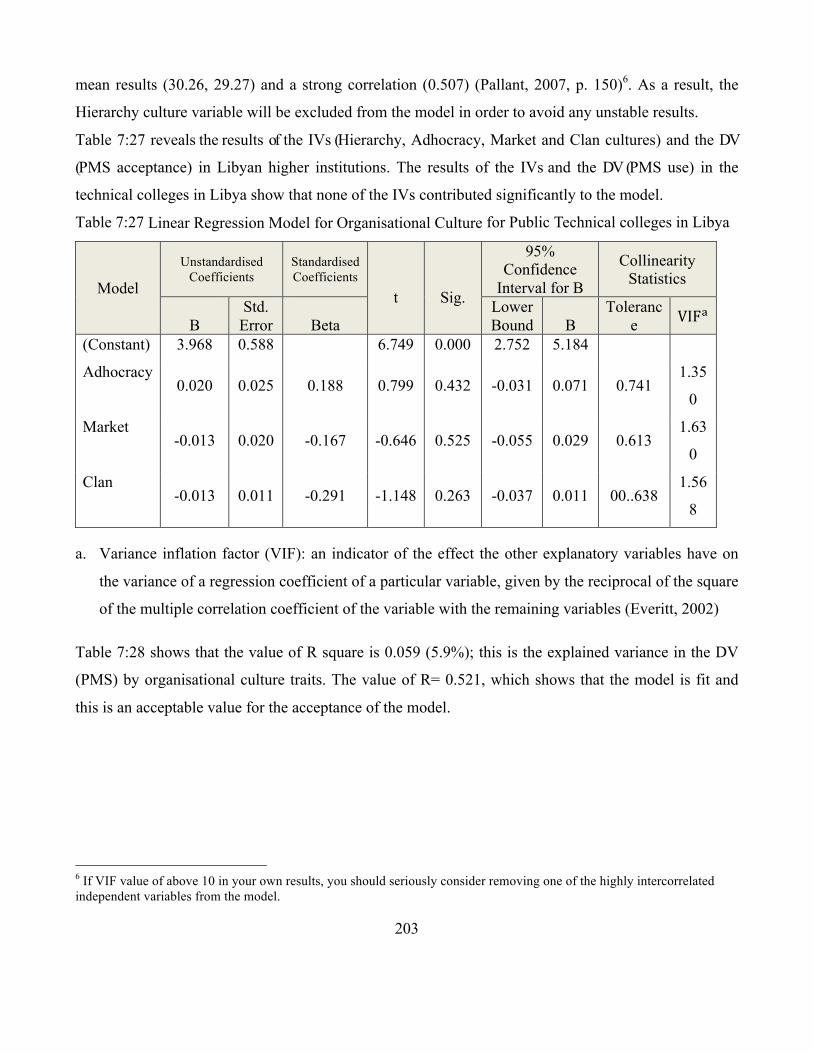
203
mean results (30.26, 29.27) and a strong correlation (0.507) (Pallant, 2007, p. 150)6. As a result, the
Hierarchy culture variable will be excluded from the model in order to avoid any unstable results.
Table 7:27 reveals the results of the IVs (Hierarchy, Adhocracy, Market and Clan cultures) and the DV
(PMS acceptance) in Libyan higher institutions. The results of the IVs and the DV (PMS use) in the
technical colleges in Libya show that none of the IVs contributed significantly to the model.
Table 7:27 Linear Regression Model for Organisational Culture for Public Technical colleges in Libya
Model
Unstandardised Coefficients
Standardised Coefficients
t
Sig.
95% Confidence
Interval for B
Collinearity Statistics
B
Std. Error
Beta
Lower Bound
B
Tolerance VIF!
(Constant) 3.968 0.588 6.749 0.000 2.752 5.184
Adhocracy 0.020 0.025 0.188 0.799 0.432 -0.031 0.071 0.741
1.35
0
Market -0.013 0.020 -0.167 -0.646 0.525 -0.055 0.029 0.613
1.63
0
Clan -0.013 0.011 -0.291 -1.148 0.263 -0.037 0.011 00..638
1.56
8
a. Variance inflation factor (VIF): an indicator of the effect the other explanatory variables have on
the variance of a regression coefficient of a particular variable, given by the reciprocal of the square
of the multiple correlation coefficient of the variable with the remaining variables (Everitt, 2002)
Table 7:28 shows that the value of R square is 0.059 (5.9%); this is the explained variance in the DV
(PMS) by organisational culture traits. The value of R= 0.521, which shows that the model is fit and
this is an acceptable value for the acceptance of the model.
6 If VIF value of above 10 in your own results, you should seriously consider removing one of the highly intercorrelated independent variables from the model.
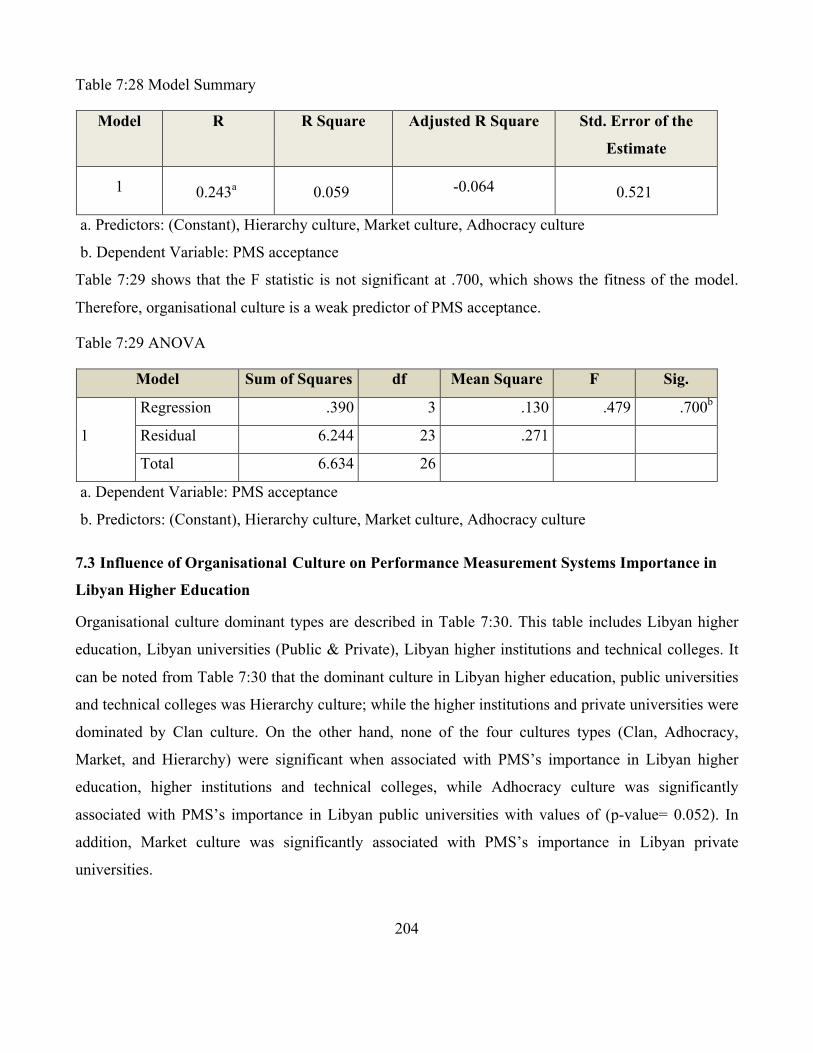
204
Table 7:28 Model Summary
Model R R Square Adjusted R Square Std. Error of the
Estimate
1 0.243a 0.059 -0.064 0.521
a. Predictors: (Constant), Hierarchy culture, Market culture, Adhocracy culture
b. Dependent Variable: PMS acceptance
Table 7:29 shows that the F statistic is not significant at .700, which shows the fitness of the model.
Therefore, organisational culture is a weak predictor of PMS acceptance.
Table 7:29 ANOVA
Model Sum of Squares df Mean Square F Sig.
1
Regression .390 3 .130 .479 .700b
Residual 6.244 23 .271
Total 6.634 26
a. Dependent Variable: PMS acceptance
b. Predictors: (Constant), Hierarchy culture, Market culture, Adhocracy culture
7.3 Influence of Organisational Culture on Performance Measurement Systems Importance in
Libyan Higher Education
Organisational culture dominant types are described in Table 7:30. This table includes Libyan higher
education, Libyan universities (Public & Private), Libyan higher institutions and technical colleges. It
can be noted from Table 7:30 that the dominant culture in Libyan higher education, public universities
and technical colleges was Hierarchy culture; while the higher institutions and private universities were
dominated by Clan culture. On the other hand, none of the four cultures types (Clan, Adhocracy,
Market, and Hierarchy) were significant when associated with PMS’s importance in Libyan higher
education, higher institutions and technical colleges, while Adhocracy culture was significantly
associated with PMS’s importance in Libyan public universities with values of (p-value= 0.052). In
addition, Market culture was significantly associated with PMS’s importance in Libyan private
universities.
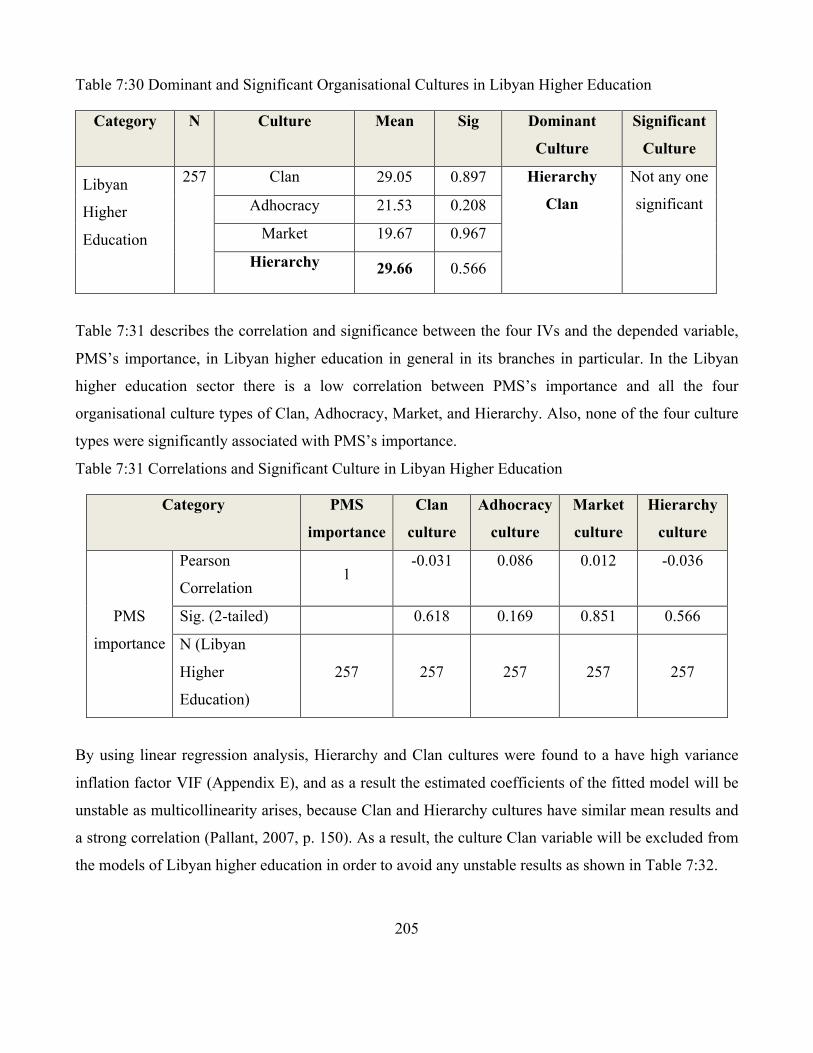
205
Table 7:30 Dominant and Significant Organisational Cultures in Libyan Higher Education
Category N Culture Mean Sig Dominant
Culture
Significant
Culture
Libyan
Higher
Education
257 Clan 29.05 0.897 Hierarchy
Clan
Not any one
significant Adhocracy 21.53 0.208
Market 19.67 0.967
Hierarchy 29.66 0.566
Table 7:31 describes the correlation and significance between the four IVs and the depended variable,
PMS’s importance, in Libyan higher education in general in its branches in particular. In the Libyan
higher education sector there is a low correlation between PMS’s importance and all the four
organisational culture types of Clan, Adhocracy, Market, and Hierarchy. Also, none of the four culture
types were significantly associated with PMS’s importance.
Table 7:31 Correlations and Significant Culture in Libyan Higher Education
Category PMS
importance
Clan
culture
Adhocracy
culture
Market
culture
Hierarchy
culture
PMS
importance
Pearson
Correlation 1
-0.031 0.086 0.012 -0.036
Sig. (2-tailed) 0.618 0.169 0.851 0.566
N (Libyan
Higher
Education)
257 257 257 257 257
By using linear regression analysis, Hierarchy and Clan cultures were found to a have high variance
inflation factor VIF (Appendix E), and as a result the estimated coefficients of the fitted model will be
unstable as multicollinearity arises, because Clan and Hierarchy cultures have similar mean results and
a strong correlation (Pallant, 2007, p. 150). As a result, the culture Clan variable will be excluded from
the models of Libyan higher education in order to avoid any unstable results as shown in Table 7:32.
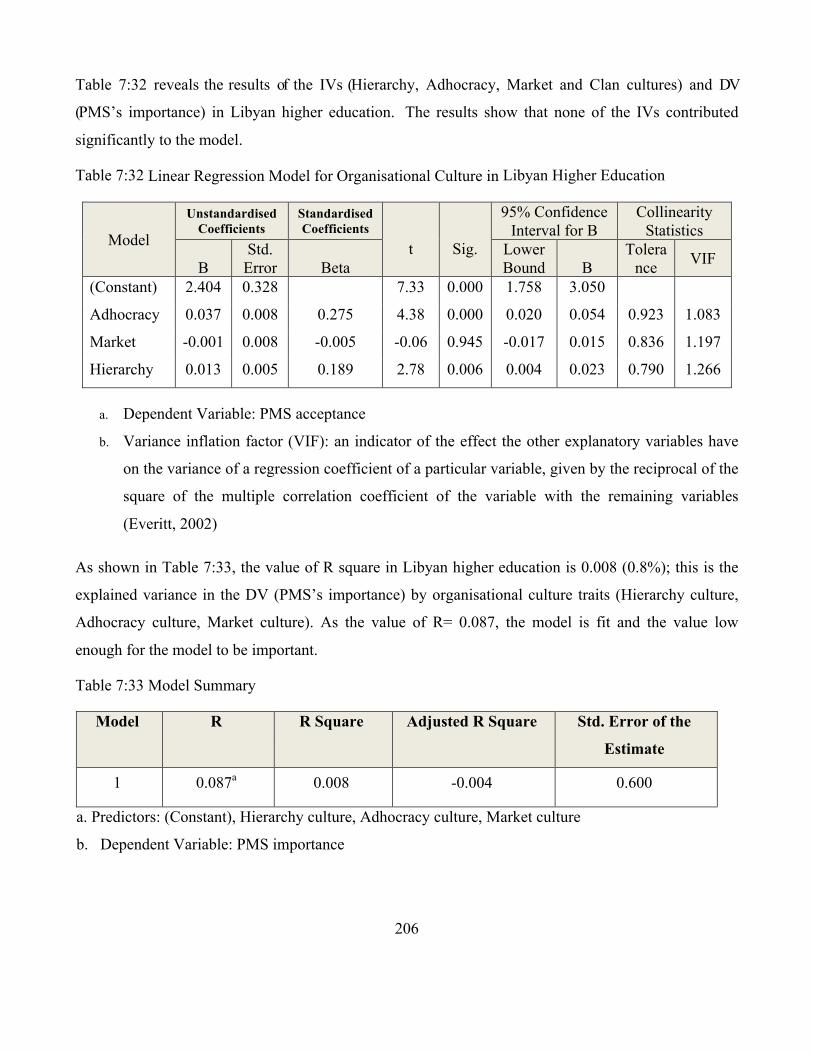
206
Table 7:32 reveals the results of the IVs (Hierarchy, Adhocracy, Market and Clan cultures) and DV
(PMS’s importance) in Libyan higher education. The results show that none of the IVs contributed
significantly to the model.
Table 7:32 Linear Regression Model for Organisational Culture in Libyan Higher Education
Model
Unstandardised Coefficients
Standardised Coefficients
t
Sig.
95% Confidence Interval for B
Collinearity Statistics
B
Std. Error
Beta
Lower Bound
B
Tolerance VIF
(Constant) 2.404 0.328 7.33 0.000 1.758 3.050
Adhocracy 0.037 0.008 0.275 4.38 0.000 0.020 0.054 0.923 1.083
Market -0.001 0.008 -0.005 -0.06 0.945 -0.017 0.015 0.836 1.197
Hierarchy 0.013 0.005 0.189 2.78 0.006 0.004 0.023 0.790 1.266
a. Dependent Variable: PMS acceptance
b. Variance inflation factor (VIF): an indicator of the effect the other explanatory variables have
on the variance of a regression coefficient of a particular variable, given by the reciprocal of the
square of the multiple correlation coefficient of the variable with the remaining variables
(Everitt, 2002)
As shown in Table 7:33, the value of R square in Libyan higher education is 0.008 (0.8%); this is the
explained variance in the DV (PMS’s importance) by organisational culture traits (Hierarchy culture,
Adhocracy culture, Market culture). As the value of R= 0.087, the model is fit and the value low
enough for the model to be important.
Table 7:33 Model Summary
Model R R Square Adjusted R Square Std. Error of the
Estimate
1 0.087a 0.008 -0.004 0.600
a. Predictors: (Constant), Hierarchy culture, Adhocracy culture, Market culture
b. Dependent Variable: PMS importance

207
Table 7:34 shows that the F statistic is not significant at 0.568, which shows the fitness of the model.
Therefore organisational culture is not a strong predictor of the importance of PMS.
Table 7:34 ANOVAa
Model Sum of Squares df Mean Square F Sig.
1
Regression 0.699 3 0.233 0.647 0.586b
Residual 91.147 253 0.360
Total 91.846 256
a. Dependent Variable: PMS Importance
b. Predictors: (Constant), Hierarchy culture, Adhocracy culture, Market culture
7.3.1 Influence of Organisational Culture on PMS’s importance in Libyan Universities
Table 7:35 represents the current dominate culture type for the Libyan universities. The dominant
organisational culture type for Libyan universities is Hierarchy culture followed by Clan; this is
followed by Adhocracy and Market cultures. It can be noted that the difference in means between
Hierarchy culture and Clan culture is very small (29.00, 28.14).
Table 7:35 Dominant and Significant Organisational Cultures in Libyan Universities
Category N Culture Mean Sig Dominant
Culture
Significant
Culture
Libyan
Universities
66 Clan 28.14 0.347 Hierarchy Hierarchy
Market
Adhocracy 21.87 0.483
Market 21.16 0.005
Hierarchy 29.00 0.040
It can be noted from Table 7:36 that in Libyan universities there is a low correlation and no
significance between PMS’s importance and Clan and Adhocracy cultures, while there is positive
correlation, with a value of (0.339) between Market culture and PMS’s importance with high
significant relationship at (p-value= 0.005), which could impact on PMS’s importance in Libyan
universities. Also, there is a negative correlation with value (-0.253) between Hierarchy culture and

208
PMS’s importance at (p-value= 0.040).
Table 7:36 Correlations and Significant Culture in Libyan Universities
Category PMS
Importance
Clan
culture
Adhocracy
culture
Market
culture
Hierarchy
culture
PMS
Importance
Pearson
Correlation 1
0.117 0.088 0.339** -0.253*
Sig. (2-tailed) 0.347 0.483 0.005 0.040
N 66 66 66 66
**. Correlation is significant at the 0.01 level (2-tailed).
*. Correlation is significant at the 0.05 level (2-tailed).
Table 7:37 reveals the results of the IVs and the DV (PMS’s importance) in Libyan universities. The
results show that one of the IVs contributed significantly to the model. Market culture is (B) = 034, t =
2.250 and p < 0.028, and the candidate is 95% confident that the actual value of B in the population
lies somewhere between (0.004) and (0.064).
Table 7:37 Linear Regression Model for Organisational Culture in Libyan Universities
Model
Unstandardised Coefficients
Standardised
Coefficients t
Sig.
95% Confidence Interval for B
Collinearity Statistics
B
Std. Error
Beta
Lower Bound
B
Tolerance VIF!
(Constant) 3.193 0.624 5.119 0.000 1.946 4.439
Adhocracy 0.013 0.013 0.140 1.061 0.293 -0.012 0.038 0.804 1.244
Market 0.034 0.015 0.353 2.250 0.028 0.004 0.064 0.566 1.768
Hierarchy 0.000 0.006 -0.013 -0.083 0.934 -0.012 0.011 0.544 1.837
a. Variance inflation factor (VIF): an indicator of the effect the other explanatory variables have
on the variance of a regression coefficient of a particular variable, given by the reciprocal of the
square of the multiple correlation coefficient of the variable with the remaining variables
(Everitt, 2002).

209
Table 7:38 shows that the value of R square is 0.138 (13.8%); this is the explained variance in the DV
PMS by organisational culture traits. The value of R= .368, which shows that the model is fit, and the
value is quite acceptable for the model to be important.
Table 7:38 Model Summary
Model R R Square Adjusted R Square Std. Error of the
Estimate
1 0.368a 0.136 0.094 0.425
a. Predictors: (Constant), Hierarchy culture, Adhocracy culture, Market culture
b. Dependent Variable: PMS acceptance
Table 7:39 shows that the F statistic is significant at .006, which shows the fitness of the model.
Therefore organisational culture is a strong predictor of performance measurement system acceptance.
Table 7:39 ANOVA for Libyan Universities
Model Sum of Squares df Mean Square F Sig.
1
Regression 1.754 3 0.585 3.241 0.028b
Residual 11.184 62 0.180
Total 12.938 65
a. Dependent Variable: PMS Importance
b. Predictors: (Constant), Hierarchy culture, Adhocracy culture, Market culture
7.3.1.1 Influence of Organisational Culture on (PMS) Importance in Libyan Public Universities
Table 7:40 represents the current dominate culture type for the Libyan public universities. The
dominant organisational culture type for Libyan public universities is Hierarchy culture followed by
Adhocracy culture; this is followed by Clan and Market cultures. It can be noted that the difference in
means between Hierarchy culture and Adhocracy culture is high (38.53, 22.50).

210
Table 7:40 The Dominant Culture Type for the Libyan Public Universities
Category N Culture Mean Sig Dominant
Culture
Significant
Culture
Public
Universities
29 Clan 20.16 0.427 Hierarchy Adhocracy
Adhocracy 22.50 0.052
Market 19.20 0.088
Hierarchy 38.53 0.092
The correlation between the IVs (four organisational culture types of Clan, Adhocracy, Market, and
Hierarchy) and the dependant variable (PMS’s importance) in Libyan public universities is described in
Table 7:41. The Hierarchy culture variable was dominant in public universities and has a negative
correlation impact on PMS but it is not significant. In addition, all four organisational culture types of
Clan, Adhocracy, Market, and Hierarchy were not significant when associated with the importance of
PMS.
Table 7:41 Correlations and Significant Culture in Libyan Public universities
Category PMS
Importance
Clan
culture
Adhocracy
culture
Market
culture
Hierarchy
culture
PMS
Importance
Pearson
Correlation 1 0.001 0.308 0.258 -0.254
Sig. (2-tailed) 0.996 0.104 0.176 0.183
N (Public
Universities) 29 29 29 29 29
The correlation matrix shows that although Hierarchy culture shows a negative correlation (0.254) with
PMS’s importance, its relationship with PMS’s importance is statistically not significant (p-
value<0.183). By using multiple linear regression analysis, Hierarchy and Clan cultures were found to
have a high variance inflation factor VIF (Appendix E), and as a result the estimated coefficients of the
fitted model will be unstable as multicollinearity arises, because Clan and Hierarchy cultures have a
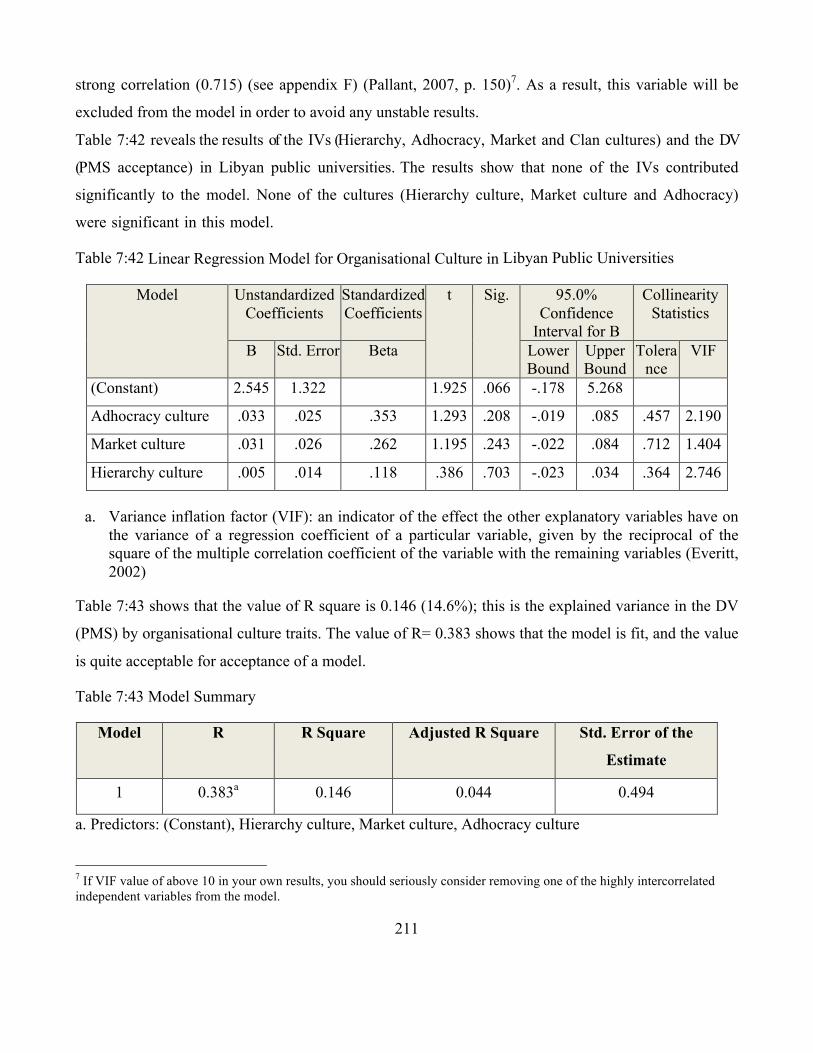
211
strong correlation (0.715) (see appendix F) (Pallant, 2007, p. 150)7. As a result, this variable will be
excluded from the model in order to avoid any unstable results.
Table 7:42 reveals the results of the IVs (Hierarchy, Adhocracy, Market and Clan cultures) and the DV
(PMS acceptance) in Libyan public universities. The results show that none of the IVs contributed
significantly to the model. None of the cultures (Hierarchy culture, Market culture and Adhocracy)
were significant in this model.
Table 7:42 Linear Regression Model for Organisational Culture in Libyan Public Universities
Model Unstandardized Coefficients
Standardized Coefficients
t Sig. 95.0% Confidence
Interval for B
Collinearity Statistics
B Std. Error Beta Lower Bound
Upper Bound
Tolerance
VIF
(Constant) 2.545 1.322 1.925 .066 -.178 5.268
Adhocracy culture .033 .025 .353 1.293 .208 -.019 .085 .457 2.190
Market culture .031 .026 .262 1.195 .243 -.022 .084 .712 1.404
Hierarchy culture .005 .014 .118 .386 .703 -.023 .034 .364 2.746
a. Variance inflation factor (VIF): an indicator of the effect the other explanatory variables have on the variance of a regression coefficient of a particular variable, given by the reciprocal of the square of the multiple correlation coefficient of the variable with the remaining variables (Everitt, 2002)
Table 7:43 shows that the value of R square is 0.146 (14.6%); this is the explained variance in the DV
(PMS) by organisational culture traits. The value of R= 0.383 shows that the model is fit, and the value
is quite acceptable for acceptance of a model.
Table 7:43 Model Summary
Model R R Square Adjusted R Square Std. Error of the
Estimate
1 0.383a 0.146 0.044 0.494
a. Predictors: (Constant), Hierarchy culture, Market culture, Adhocracy culture
7 If VIF value of above 10 in your own results, you should seriously consider removing one of the highly intercorrelated independent variables from the model.
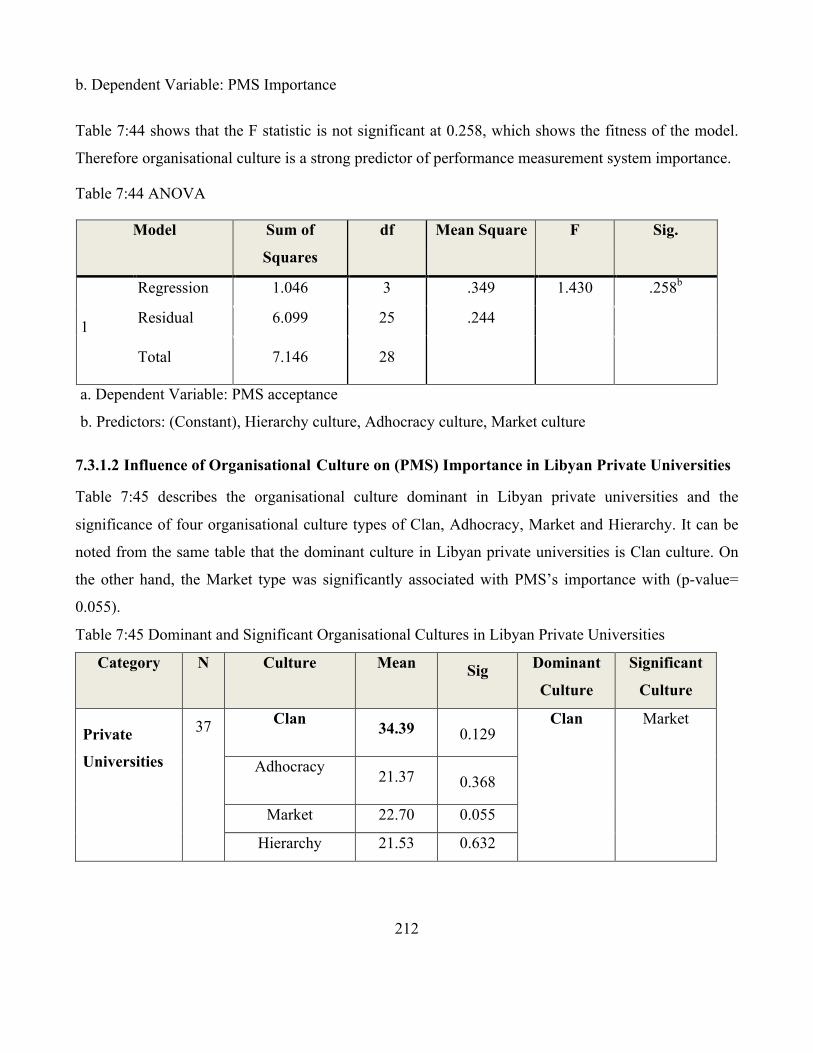
212
b. Dependent Variable: PMS Importance
Table 7:44 shows that the F statistic is not significant at 0.258, which shows the fitness of the model.
Therefore organisational culture is a strong predictor of performance measurement system importance.
Table 7:44 ANOVA
Model Sum of
Squares
df Mean Square F Sig.
1
Regression 1.046 3 .349 1.430 .258b
Residual 6.099 25 .244
Total 7.146 28
a. Dependent Variable: PMS acceptance
b. Predictors: (Constant), Hierarchy culture, Adhocracy culture, Market culture
7.3.1.2 Influence of Organisational Culture on (PMS) Importance in Libyan Private Universities
Table 7:45 describes the organisational culture dominant in Libyan private universities and the
significance of four organisational culture types of Clan, Adhocracy, Market and Hierarchy. It can be
noted from the same table that the dominant culture in Libyan private universities is Clan culture. On
the other hand, the Market type was significantly associated with PMS’s importance with (p-value=
0.055).
Table 7:45 Dominant and Significant Organisational Cultures in Libyan Private Universities
Category N Culture Mean Sig Dominant
Culture
Significant
Culture
Private
Universities
37 Clan 34.39 0.129 Clan
Market
Adhocracy 21.37 0.368
Market 22.70 0.055
Hierarchy 21.53 0.632

213
The correlation between the IVs (four organisational culture types of Clan, Adhocracy, Market, and
Hierarchy) and the dependant variable (PMS acceptance) in Libyan private universities is described in
Table 7:46. The Clan culture variable was dominant and has a negative correlation impact on PMS that
is not significant. On the other hand, the Market variable has a good positive correlation impact on
PMS with a value of 0.318 and it has a low significance of relation at (p-value = .055) associated with
PMS’s importance.
Table 7:46 Correlations and Significant Culture in Libyan Private Universities
Category Clan
culture
Adhocracy
culture
Market
culture
Hierarchy
culture
PMS
importance
Pearson Correlation -0.254 -0.152 0.318 0.081
Sig. (2-tailed) 0.129 0.368 0.055 0.632
N 37 37 37 37
The correlation matrix shows that although Hierarchy culture shows a negative correlation (-0.360)
with PMS acceptance, and that its relationship with PMS acceptance is statistically significant (p-
value<0.003). By using multiple linear regression analysis, Hierarchy and Clan cultures were found to
have a high variance inflation factor VIF (Appendix E), and as a result the estimated coefficients of the
fitted model will be unstable as multicollinearity arises, because Clan and Hierarchy cultures have a
strong correlation (0.715) (Pallant, 2007, p. 150)8. As a result, this variable will be excluded from the
model in order to avoid any unstable results.
Table 7:47 reveals the results of the IVs (Hierarchy, Adhocracy, Market and Clan cultures) and the DV
(PMS’s importance) in Libyan universities. The results show that Clan culture contributed significantly
to the model. Clan culture is (B) = 030, t = -2.171 and p < 0.037, and the confidence level is 95% and
the actual value of B in the population lies somewhere between (-0.058) and (0.002).
8 If VIF value of above 10 in your own results, you should seriously consider removing one of the highly intercorrelated independent variables from the model.
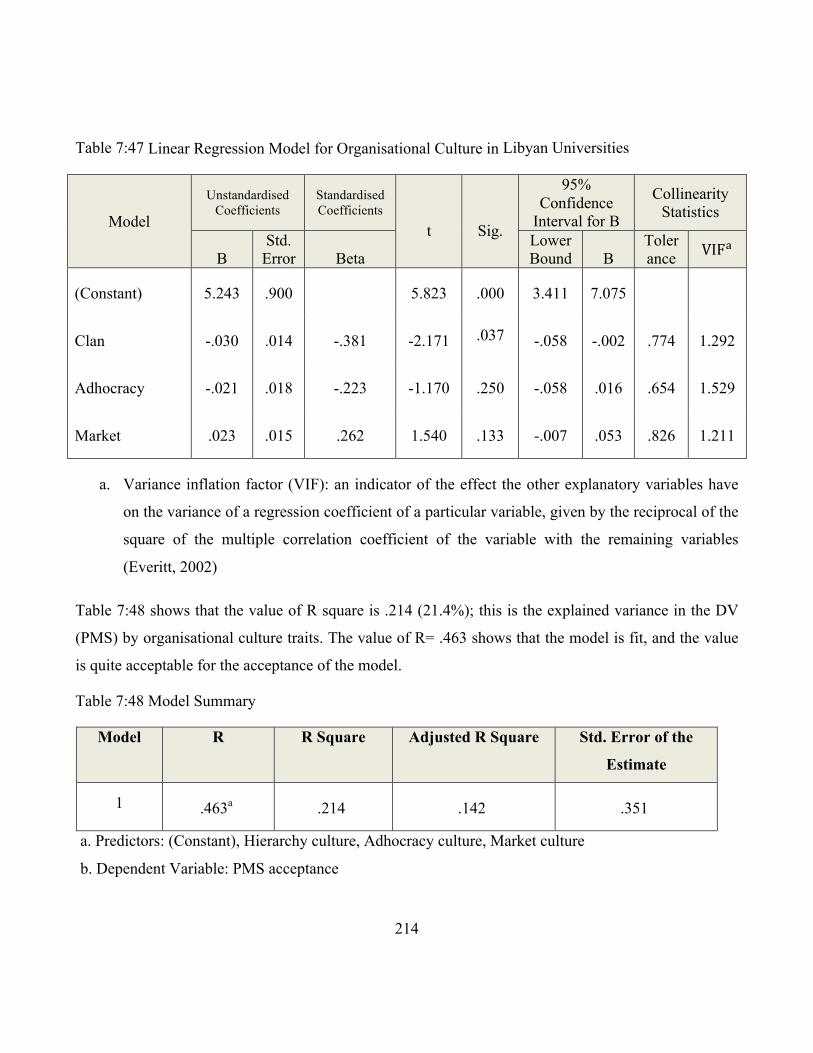
214
Table 7:47 Linear Regression Model for Organisational Culture in Libyan Universities
Model
Unstandardised Coefficients
Standardised Coefficients
t
Sig.
95% Confidence
Interval for B
Collinearity Statistics
B
Std. Error
Beta
Lower Bound
B
Tolerance VIF!
(Constant) 5.243 .900
5.823 .000 3.411 7.075
Clan -.030 .014 -.381 -2.171 .037 -.058 -.002 .774 1.292
Adhocracy -.021 .018 -.223 -1.170 .250 -.058 .016 .654 1.529
Market .023 .015 .262 1.540 .133 -.007 .053 .826 1.211
a. Variance inflation factor (VIF): an indicator of the effect the other explanatory variables have
on the variance of a regression coefficient of a particular variable, given by the reciprocal of the
square of the multiple correlation coefficient of the variable with the remaining variables
(Everitt, 2002)
Table 7:48 shows that the value of R square is .214 (21.4%); this is the explained variance in the DV
(PMS) by organisational culture traits. The value of R= .463 shows that the model is fit, and the value
is quite acceptable for the acceptance of the model.
Table 7:48 Model Summary
Model R R Square Adjusted R Square Std. Error of the
Estimate
1 .463a .214 .142 .351
a. Predictors: (Constant), Hierarchy culture, Adhocracy culture, Market culture
b. Dependent Variable: PMS acceptance
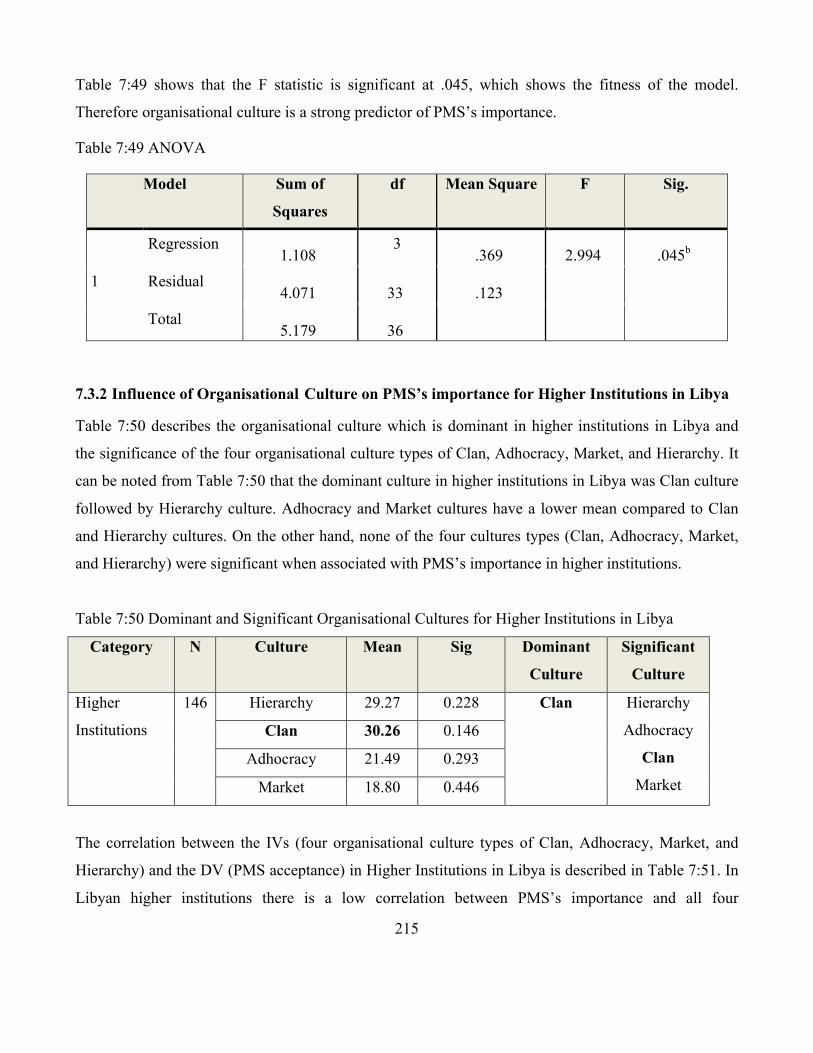
215
Table 7:49 shows that the F statistic is significant at .045, which shows the fitness of the model.
Therefore organisational culture is a strong predictor of PMS’s importance.
Table 7:49 ANOVA
Model Sum of
Squares
df Mean Square F Sig.
1
Regression 1.108
3 .369 2.994 .045b
Residual 4.071 33 .123
Total 5.179 36
7.3.2 Influence of Organisational Culture on PMS’s importance for Higher Institutions in Libya
Table 7:50 describes the organisational culture which is dominant in higher institutions in Libya and
the significance of the four organisational culture types of Clan, Adhocracy, Market, and Hierarchy. It
can be noted from Table 7:50 that the dominant culture in higher institutions in Libya was Clan culture
followed by Hierarchy culture. Adhocracy and Market cultures have a lower mean compared to Clan
and Hierarchy cultures. On the other hand, none of the four cultures types (Clan, Adhocracy, Market,
and Hierarchy) were significant when associated with PMS’s importance in higher institutions.
Table 7:50 Dominant and Significant Organisational Cultures for Higher Institutions in Libya
Category N Culture Mean Sig Dominant
Culture
Significant
Culture
Higher
Institutions
146 Hierarchy 29.27 0.228 Clan Hierarchy
Adhocracy
Clan
Market
Clan 30.26 0.146
Adhocracy 21.49 0.293
Market 18.80 0.446
The correlation between the IVs (four organisational culture types of Clan, Adhocracy, Market, and
Hierarchy) and the DV (PMS acceptance) in Higher Institutions in Libya is described in Table 7:51. In
Libyan higher institutions there is a low correlation between PMS’s importance and all four
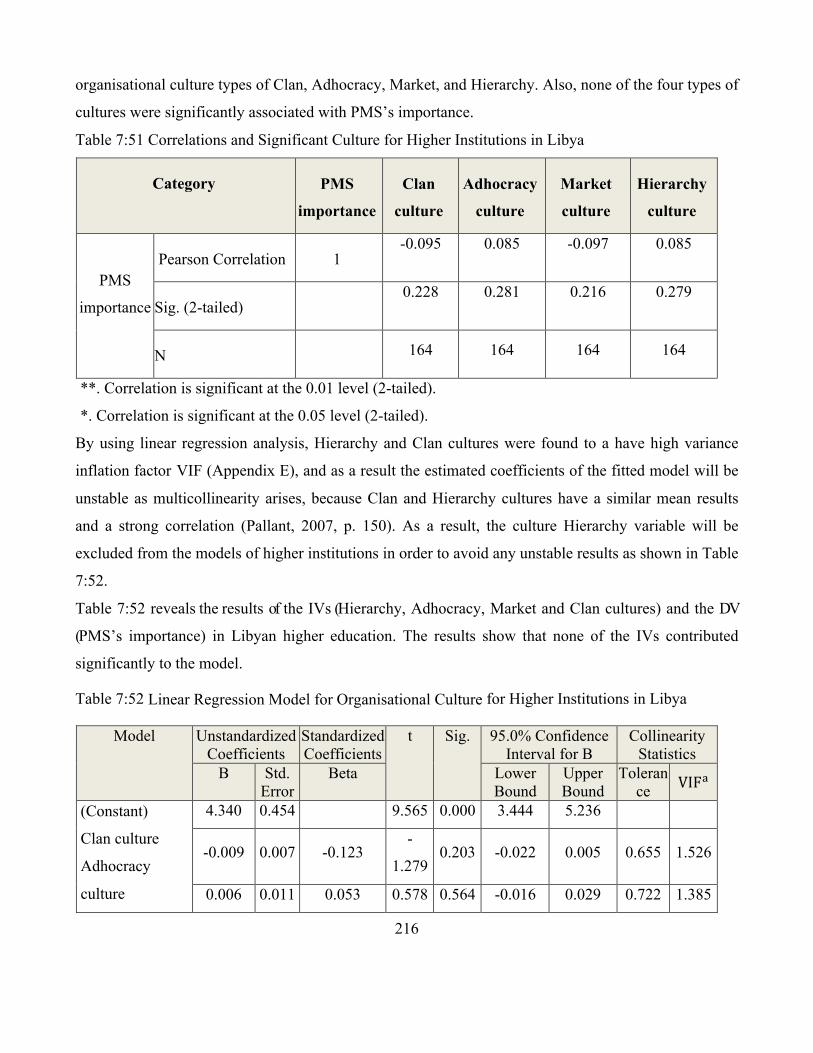
216
organisational culture types of Clan, Adhocracy, Market, and Hierarchy. Also, none of the four types of
cultures were significantly associated with PMS’s importance.
Table 7:51 Correlations and Significant Culture for Higher Institutions in Libya
Category PMS
importance
Clan
culture
Adhocracy
culture
Market
culture
Hierarchy
culture
PMS
importance
7.3.2.1.1.1.1.1 Pearson Correlation 1 -0.095 0.085 -0.097 0.085
Sig. (2-tailed) 0.228 0.281 0.216 0.279
N 164 164 164 164
**. Correlation is significant at the 0.01 level (2-tailed).
*. Correlation is significant at the 0.05 level (2-tailed).
By using linear regression analysis, Hierarchy and Clan cultures were found to a have high variance
inflation factor VIF (Appendix E), and as a result the estimated coefficients of the fitted model will be
unstable as multicollinearity arises, because Clan and Hierarchy cultures have a similar mean results
and a strong correlation (Pallant, 2007, p. 150). As a result, the culture Hierarchy variable will be
excluded from the models of higher institutions in order to avoid any unstable results as shown in Table
7:52.
Table 7:52 reveals the results of the IVs (Hierarchy, Adhocracy, Market and Clan cultures) and the DV
(PMS’s importance) in Libyan higher education. The results show that none of the IVs contributed
significantly to the model.
Table 7:52 Linear Regression Model for Organisational Culture for Higher Institutions in Libya
Model Unstandardized Coefficients
Standardized Coefficients
t Sig. 95.0% Confidence Interval for B
Collinearity Statistics
B Std. Error
Beta Lower Bound
Upper Bound
Tolerance VIF!
(Constant)
Clan culture
Adhocracy
culture
4.340 0.454 9.565 0.000 3.444 5.236
-0.009 0.007 -0.123 -
1.279 0.203 -0.022 0.005 0.655 1.526
0.006 0.011 0.053 0.578 0.564 -0.016 0.029 0.722 1.385

217
Market culture -0.018 0.010 -0.154
-
1.835 0.068 -0.037 0.001 0.865 1.156
a. Variance inflation factor (VIF): an indicator of the effect the other explanatory variables have
on the variance of a regression coefficient of a particular variable, given by the reciprocal of the
square of the multiple correlation coefficient of the variable with the remaining variables
(Everitt, 2002)
It can be seen from 7:53 that in Libyan higher institutions the R square is 0.031 (3.1%); this is the
explained variance in the DV (PMS’s importance) by organisational culture traits (Clan culture,
Adhocracy culture, Market culture). As the value of R= 0.176 shows the model to be fit as this value is
low enough for the acceptance of the model.
Table 7:53 Model Summary
Category Model R R
Square
Adjusted R
Square
Std. Error of the
Estimate
Higher Institutions 1 0.176a 0.031 0.013 0.631
a. Predictors: (Constant), Clan culture, Adhocracy culture, Market culture
b. Dependent Variable: PMS Importance
Table 7:54 shows that the F statistic is not significant at 0.168, which shows the fitness of the model.
Therefore organisational culture is not a strong predictor of PMS’s importance.
Table 7:54 ANOVA
Model Sum of Squares df Mean Square F Sig.
1
Regression 2.042 3 0.681 1.707 0.168b
Residual 63.779 160 0.399
Total 65.820 163
a. Dependent Variable: PMS Importance
b. Predictors: (Constant), Market culture, Adhocracy culture, Clan culture
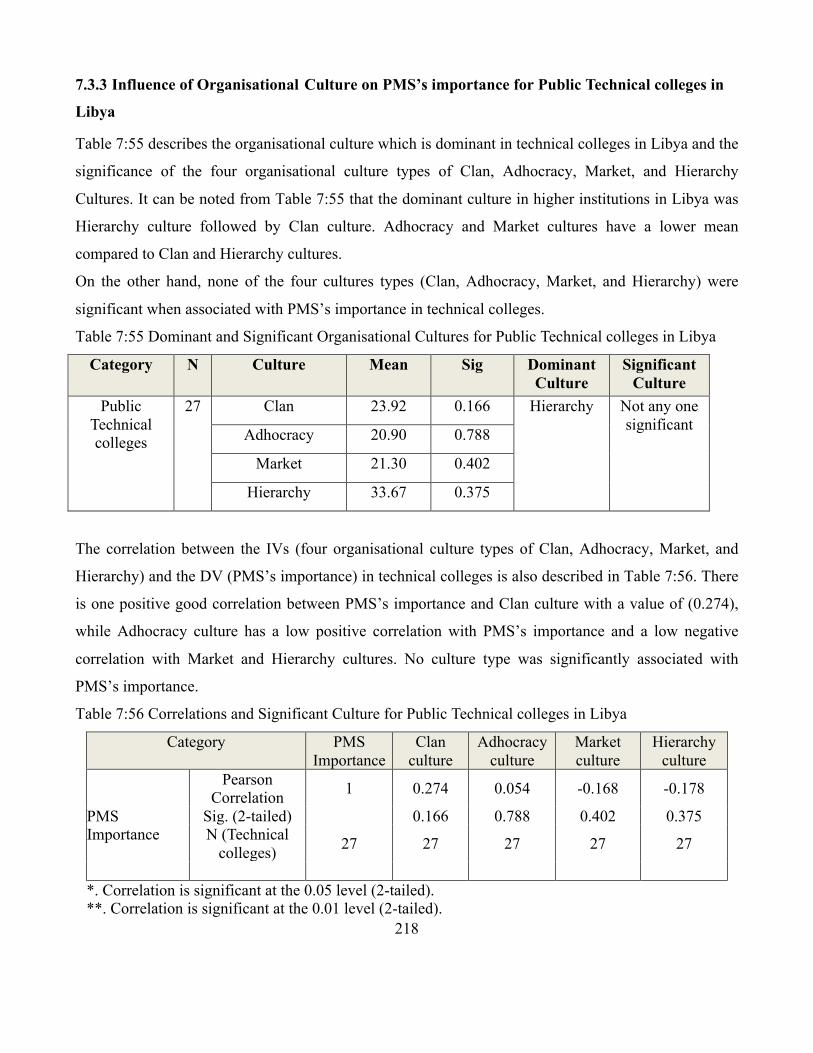
218
7.3.3 Influence of Organisational Culture on PMS’s importance for Public Technical colleges in
Libya
Table 7:55 describes the organisational culture which is dominant in technical colleges in Libya and the
significance of the four organisational culture types of Clan, Adhocracy, Market, and Hierarchy
Cultures. It can be noted from Table 7:55 that the dominant culture in higher institutions in Libya was
Hierarchy culture followed by Clan culture. Adhocracy and Market cultures have a lower mean
compared to Clan and Hierarchy cultures.
On the other hand, none of the four cultures types (Clan, Adhocracy, Market, and Hierarchy) were
significant when associated with PMS’s importance in technical colleges.
Table 7:55 Dominant and Significant Organisational Cultures for Public Technical colleges in Libya
Category N Culture Mean Sig Dominant Culture
Significant Culture
Public Technical colleges
27 Clan 23.92 0.166 Hierarchy Not any one significant Adhocracy 20.90 0.788
Market 21.30 0.402
Hierarchy 33.67 0.375
The correlation between the IVs (four organisational culture types of Clan, Adhocracy, Market, and
Hierarchy) and the DV (PMS’s importance) in technical colleges is also described in Table 7:56. There
is one positive good correlation between PMS’s importance and Clan culture with a value of (0.274),
while Adhocracy culture has a low positive correlation with PMS’s importance and a low negative
correlation with Market and Hierarchy cultures. No culture type was significantly associated with
PMS’s importance.
Table 7:56 Correlations and Significant Culture for Public Technical colleges in Libya
Category PMS Importance
Clan culture
Adhocracy culture
Market culture
Hierarchy culture
PMS Importance
Pearson Correlation 1 0.274 0.054 -0.168 -0.178
Sig. (2-tailed) 0.166 0.788 0.402 0.375 N (Technical colleges) 27 27 27 27 27
*. Correlation is significant at the 0.05 level (2-tailed). **. Correlation is significant at the 0.01 level (2-tailed).
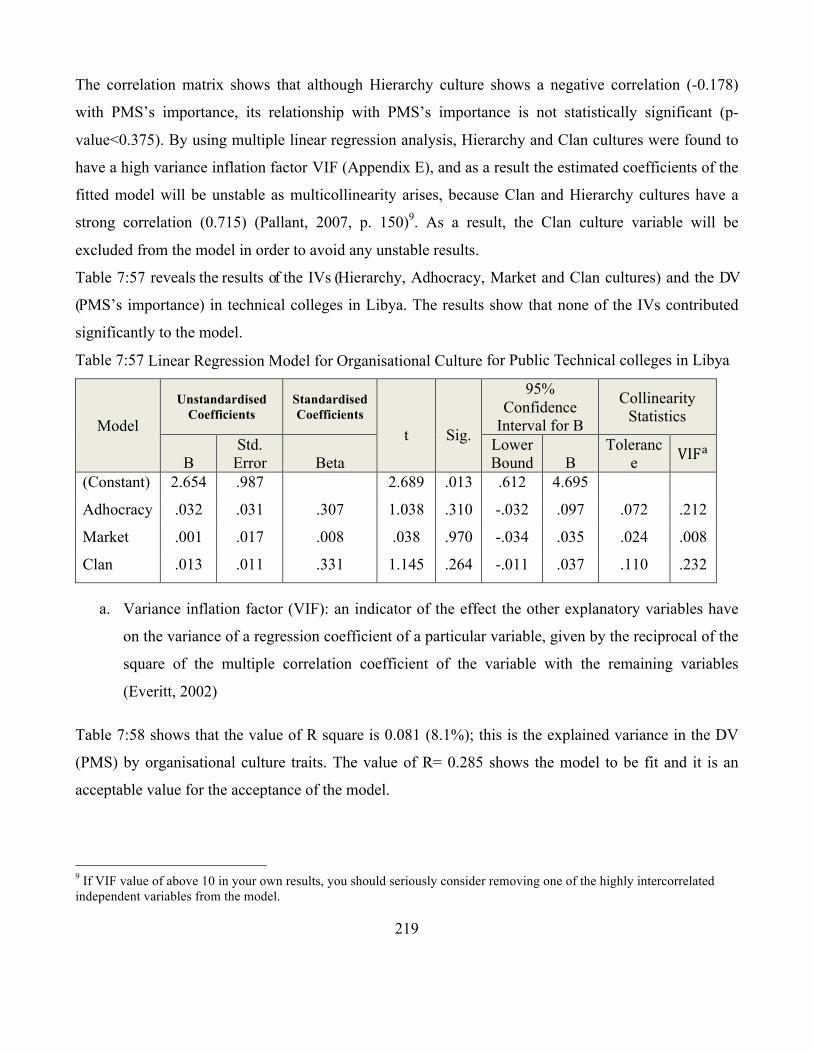
219
The correlation matrix shows that although Hierarchy culture shows a negative correlation (-0.178)
with PMS’s importance, its relationship with PMS’s importance is not statistically significant (p-
value<0.375). By using multiple linear regression analysis, Hierarchy and Clan cultures were found to
have a high variance inflation factor VIF (Appendix E), and as a result the estimated coefficients of the
fitted model will be unstable as multicollinearity arises, because Clan and Hierarchy cultures have a
strong correlation (0.715) (Pallant, 2007, p. 150)9. As a result, the Clan culture variable will be
excluded from the model in order to avoid any unstable results.
Table 7:57 reveals the results of the IVs (Hierarchy, Adhocracy, Market and Clan cultures) and the DV
(PMS’s importance) in technical colleges in Libya. The results show that none of the IVs contributed
significantly to the model.
Table 7:57 Linear Regression Model for Organisational Culture for Public Technical colleges in Libya
Model
Unstandardised Coefficients
Standardised Coefficients
t
Sig.
95% Confidence
Interval for B
Collinearity Statistics
B
Std. Error
Beta
Lower Bound
B
Tolerance VIF!
(Constant) 2.654 .987 2.689 .013 .612 4.695
Adhocracy .032 .031 .307 1.038 .310 -.032 .097 .072 .212
Market .001 .017 .008 .038 .970 -.034 .035 .024 .008
Clan .013 .011 .331 1.145 .264 -.011 .037 .110 .232
a. Variance inflation factor (VIF): an indicator of the effect the other explanatory variables have
on the variance of a regression coefficient of a particular variable, given by the reciprocal of the
square of the multiple correlation coefficient of the variable with the remaining variables
(Everitt, 2002)
Table 7:58 shows that the value of R square is 0.081 (8.1%); this is the explained variance in the DV
(PMS) by organisational culture traits. The value of R= 0.285 shows the model to be fit and it is an
acceptable value for the acceptance of the model.
9 If VIF value of above 10 in your own results, you should seriously consider removing one of the highly intercorrelated independent variables from the model.
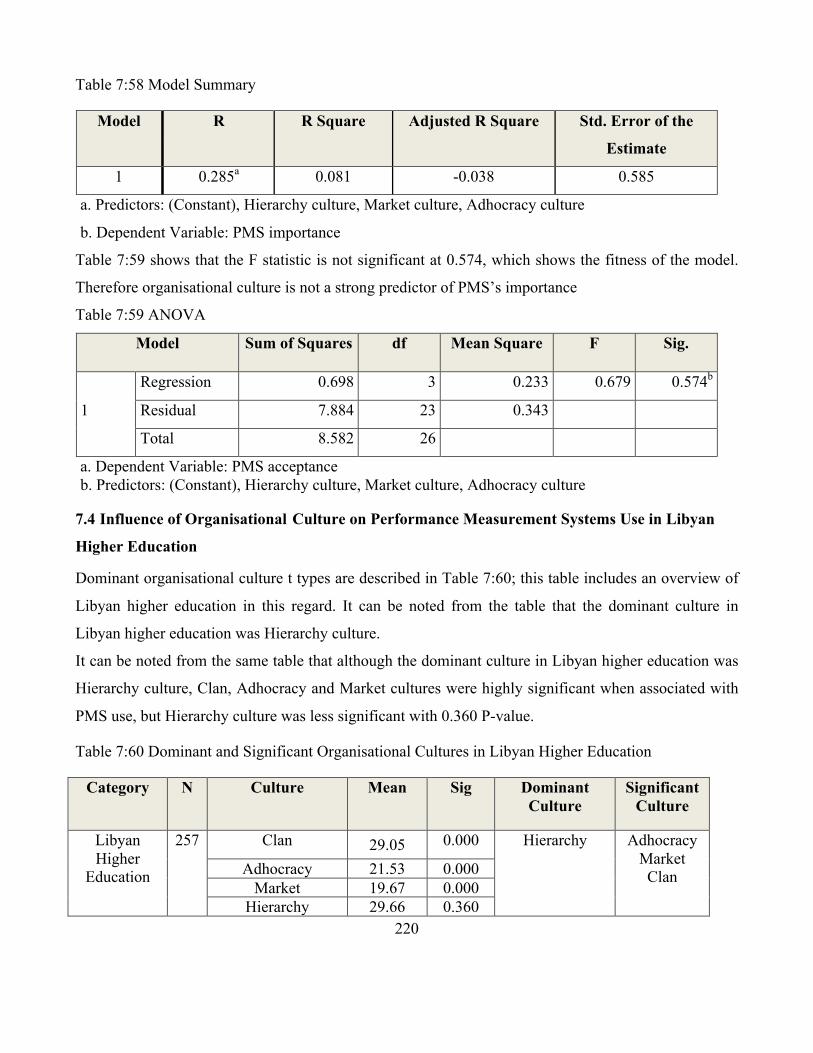
220
Table 7:58 Model Summary
Model R R Square Adjusted R Square Std. Error of the
Estimate
1 0.285a 0.081 -0.038 0.585
a. Predictors: (Constant), Hierarchy culture, Market culture, Adhocracy culture
b. Dependent Variable: PMS importance
Table 7:59 shows that the F statistic is not significant at 0.574, which shows the fitness of the model.
Therefore organisational culture is not a strong predictor of PMS’s importance
Table 7:59 ANOVA
Model Sum of Squares df Mean Square F Sig.
1
Regression 0.698 3 0.233 0.679 0.574b
Residual 7.884 23 0.343
Total 8.582 26
a. Dependent Variable: PMS acceptance b. Predictors: (Constant), Hierarchy culture, Market culture, Adhocracy culture
7.4 Influence of Organisational Culture on Performance Measurement Systems Use in Libyan
Higher Education
Dominant organisational culture t types are described in Table 7:60; this table includes an overview of
Libyan higher education in this regard. It can be noted from the table that the dominant culture in
Libyan higher education was Hierarchy culture.
It can be noted from the same table that although the dominant culture in Libyan higher education was
Hierarchy culture, Clan, Adhocracy and Market cultures were highly significant when associated with
PMS use, but Hierarchy culture was less significant with 0.360 P-value.
Table 7:60 Dominant and Significant Organisational Cultures in Libyan Higher Education
Category N Culture Mean Sig Dominant Culture
Significant Culture
Libyan Higher
Education
257 Clan 29.05 0.000 Hierarchy
Adhocracy Market Clan Adhocracy 21.53 0.000
Market 19.67 0.000 Hierarchy 29.66 0.360
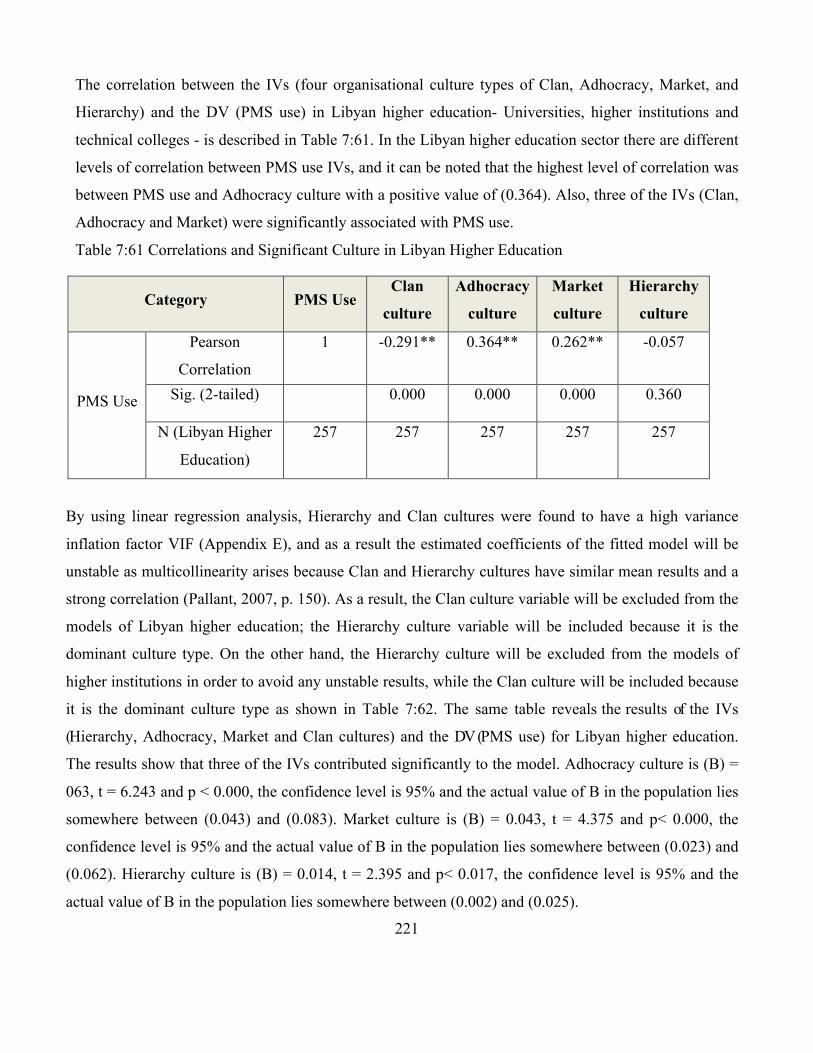
221
The correlation between the IVs (four organisational culture types of Clan, Adhocracy, Market, and
Hierarchy) and the DV (PMS use) in Libyan higher education- Universities, higher institutions and
technical colleges - is described in Table 7:61. In the Libyan higher education sector there are different
levels of correlation between PMS use IVs, and it can be noted that the highest level of correlation was
between PMS use and Adhocracy culture with a positive value of (0.364). Also, three of the IVs (Clan,
Adhocracy and Market) were significantly associated with PMS use.
Table 7:61 Correlations and Significant Culture in Libyan Higher Education
Category PMS Use Clan
culture
Adhocracy
culture
Market
culture
Hierarchy
culture
PMS Use
Pearson
Correlation
1 -0.291** 0.364** 0.262** -0.057
Sig. (2-tailed) 0.000 0.000 0.000 0.360
N (Libyan Higher
Education)
257 257 257 257 257
By using linear regression analysis, Hierarchy and Clan cultures were found to have a high variance
inflation factor VIF (Appendix E), and as a result the estimated coefficients of the fitted model will be
unstable as multicollinearity arises because Clan and Hierarchy cultures have similar mean results and a
strong correlation (Pallant, 2007, p. 150). As a result, the Clan culture variable will be excluded from the
models of Libyan higher education; the Hierarchy culture variable will be included because it is the
dominant culture type. On the other hand, the Hierarchy culture will be excluded from the models of
higher institutions in order to avoid any unstable results, while the Clan culture will be included because
it is the dominant culture type as shown in Table 7:62. The same table reveals the results of the IVs
(Hierarchy, Adhocracy, Market and Clan cultures) and the DV (PMS use) for Libyan higher education.
The results show that three of the IVs contributed significantly to the model. Adhocracy culture is (B) =
063, t = 6.243 and p < 0.000, the confidence level is 95% and the actual value of B in the population lies
somewhere between (0.043) and (0.083). Market culture is (B) = 0.043, t = 4.375 and p< 0.000, the
confidence level is 95% and the actual value of B in the population lies somewhere between (0.023) and
(0.062). Hierarchy culture is (B) = 0.014, t = 2.395 and p< 0.017, the confidence level is 95% and the
actual value of B in the population lies somewhere between (0.002) and (0.025).
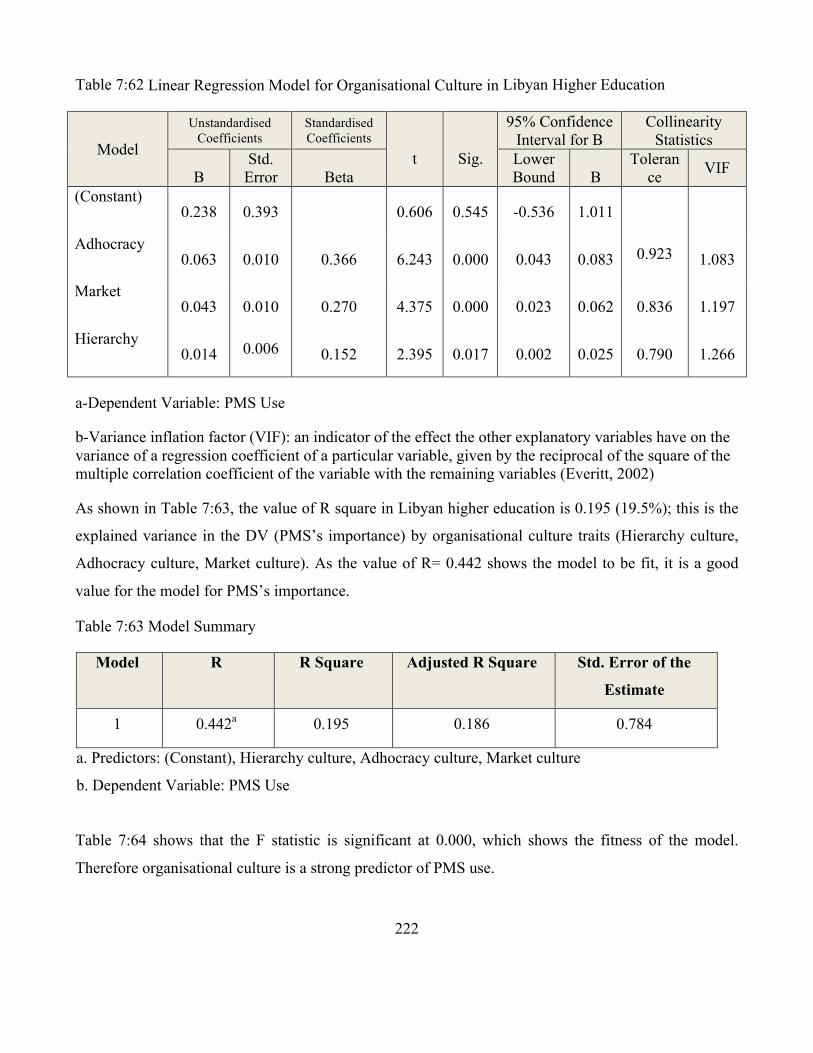
222
Table 7:62 Linear Regression Model for Organisational Culture in Libyan Higher Education
Model
Unstandardised Coefficients
Standardised Coefficients
t
Sig.
95% Confidence Interval for B
Collinearity Statistics
B
Std. Error
Beta
Lower Bound
B
Tolerance VIF
(Constant) 0.238 0.393
0.606 0.545 -0.536 1.011
Adhocracy 0.063 0.010 0.366 6.243 0.000 0.043 0.083 0.923 1.083
Market 0.043 0.010 0.270 4.375 0.000 0.023 0.062 0.836 1.197
Hierarchy 0.014 0.006 0.152 2.395 0.017 0.002 0.025 0.790 1.266
a-Dependent Variable: PMS Use
b-Variance inflation factor (VIF): an indicator of the effect the other explanatory variables have on the variance of a regression coefficient of a particular variable, given by the reciprocal of the square of the multiple correlation coefficient of the variable with the remaining variables (Everitt, 2002)
As shown in Table 7:63, the value of R square in Libyan higher education is 0.195 (19.5%); this is the
explained variance in the DV (PMS’s importance) by organisational culture traits (Hierarchy culture,
Adhocracy culture, Market culture). As the value of R= 0.442 shows the model to be fit, it is a good
value for the model for PMS’s importance.
Table 7:63 Model Summary
Model R R Square Adjusted R Square Std. Error of the
Estimate
1 0.442a 0.195 0.186 0.784
a. Predictors: (Constant), Hierarchy culture, Adhocracy culture, Market culture
b. Dependent Variable: PMS Use
Table 7:64 shows that the F statistic is significant at 0.000, which shows the fitness of the model.
Therefore organisational culture is a strong predictor of PMS use.
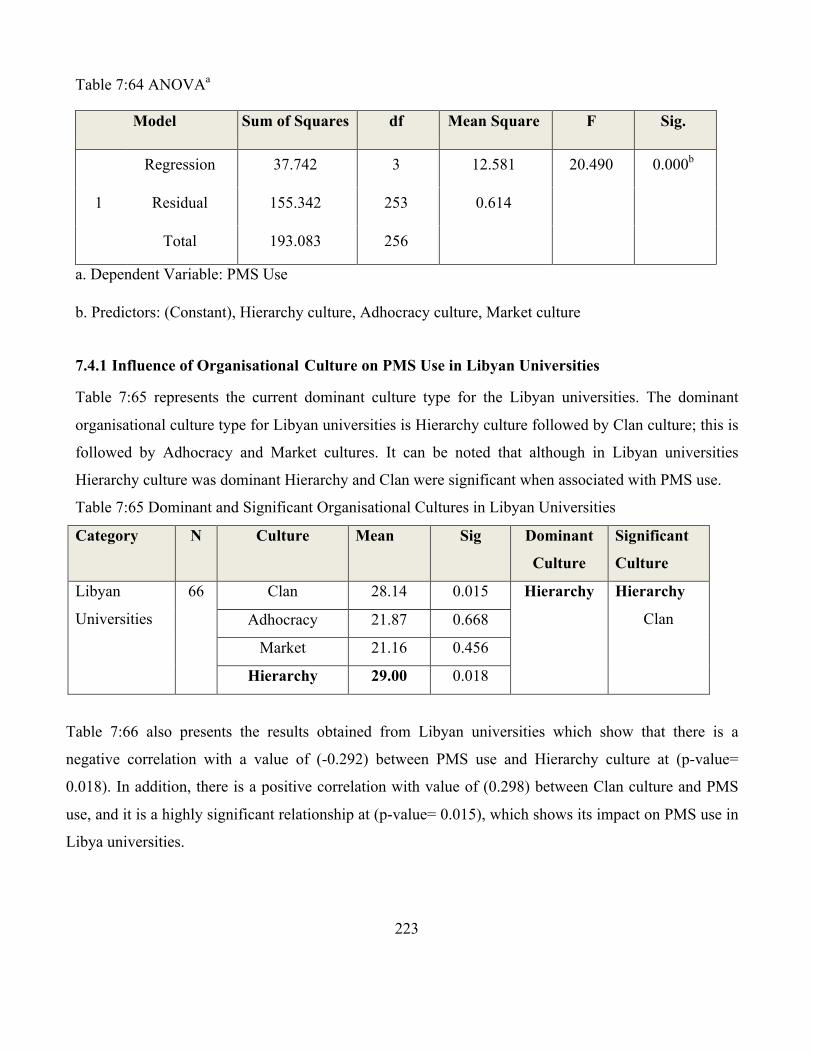
223
Table 7:64 ANOVAa
Model Sum of Squares df Mean Square F Sig.
1
Regression 37.742 3 12.581 20.490 0.000b
Residual 155.342 253 0.614
Total 193.083 256
a. Dependent Variable: PMS Use
b. Predictors: (Constant), Hierarchy culture, Adhocracy culture, Market culture
7.4.1 Influence of Organisational Culture on PMS Use in Libyan Universities
Table 7:65 represents the current dominant culture type for the Libyan universities. The dominant
organisational culture type for Libyan universities is Hierarchy culture followed by Clan culture; this is
followed by Adhocracy and Market cultures. It can be noted that although in Libyan universities
Hierarchy culture was dominant Hierarchy and Clan were significant when associated with PMS use.
Table 7:65 Dominant and Significant Organisational Cultures in Libyan Universities
Category N Culture Mean Sig Dominant
Culture
Significant
Culture
Libyan
Universities
66 Clan 28.14 0.015 Hierarchy Hierarchy
Clan Adhocracy 21.87 0.668
Market 21.16 0.456
Hierarchy 29.00 0.018
Table 7:66 also presents the results obtained from Libyan universities which show that there is a
negative correlation with a value of (-0.292) between PMS use and Hierarchy culture at (p-value=
0.018). In addition, there is a positive correlation with value of (0.298) between Clan culture and PMS
use, and it is a highly significant relationship at (p-value= 0.015), which shows its impact on PMS use in
Libya universities.
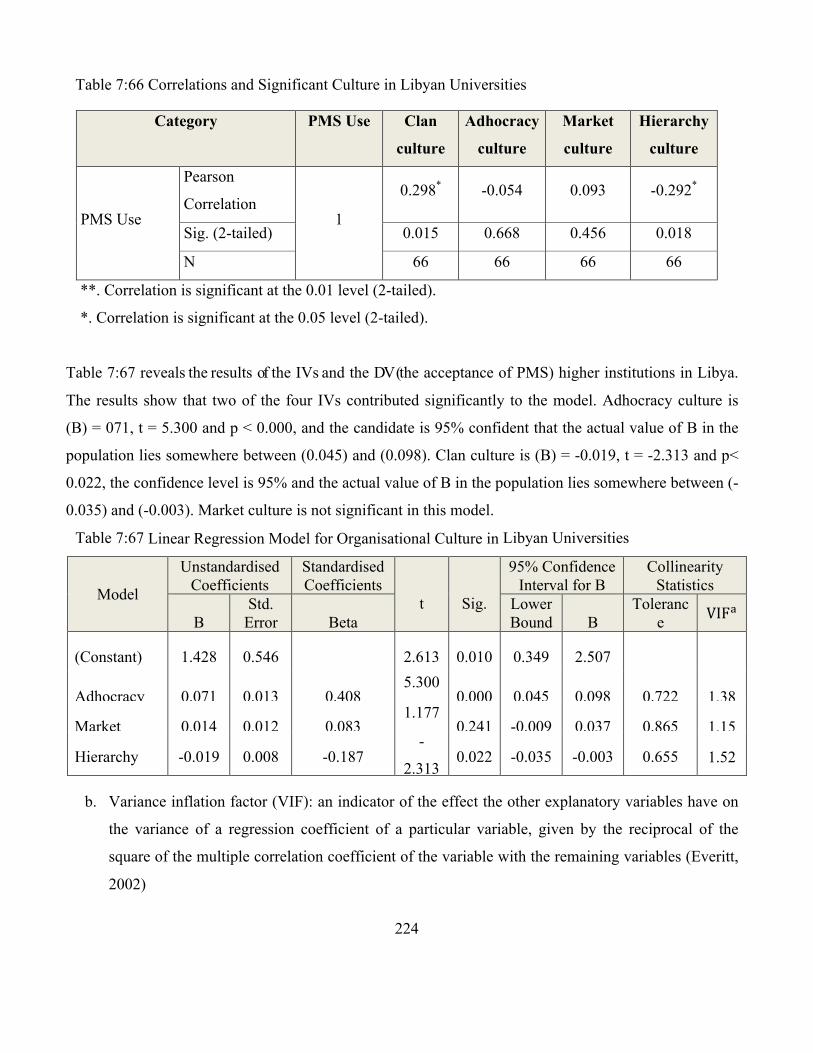
224
Table 7:66 Correlations and Significant Culture in Libyan Universities
Category PMS Use Clan
culture
Adhocracy
culture
Market
culture
Hierarchy
culture
PMS Use
Pearson
Correlation 1
0.298* -0.054 0.093 -0.292*
Sig. (2-tailed) 0.015 0.668 0.456 0.018
N 66 66 66 66
**. Correlation is significant at the 0.01 level (2-tailed).
*. Correlation is significant at the 0.05 level (2-tailed).
Table 7:67 reveals the results of the IVs and the DV (the acceptance of PMS) higher institutions in Libya.
The results show that two of the four IVs contributed significantly to the model. Adhocracy culture is
(B) = 071, t = 5.300 and p < 0.000, and the candidate is 95% confident that the actual value of B in the
population lies somewhere between (0.045) and (0.098). Clan culture is (B) = -0.019, t = -2.313 and p<
0.022, the confidence level is 95% and the actual value of B in the population lies somewhere between (-
0.035) and (-0.003). Market culture is not significant in this model.
Table 7:67 Linear Regression Model for Organisational Culture in Libyan Universities
Model
Unstandardised Coefficients
Standardised Coefficients
t
Sig.
95% Confidence Interval for B
Collinearity Statistics
B
Std. Error
Beta
Lower Bound
B
Tolerance VIF!
(Constant) 1.428 0.546
2.613 0.010 0.349 2.507
Adhocracy 0.071 0.013 0.408 5.300
0.000 0.045 0.098 0.722 1.38
5 Market 0.014 0.012 0.083 1.177
0.241 -0.009 0.037 0.865 1.15
6 Hierarchy -0.019 0.008 -0.187 -
2.313 0.022 -0.035 -0.003 0.655 1.52
6 b. Variance inflation factor (VIF): an indicator of the effect the other explanatory variables have on
the variance of a regression coefficient of a particular variable, given by the reciprocal of the
square of the multiple correlation coefficient of the variable with the remaining variables (Everitt,
2002)
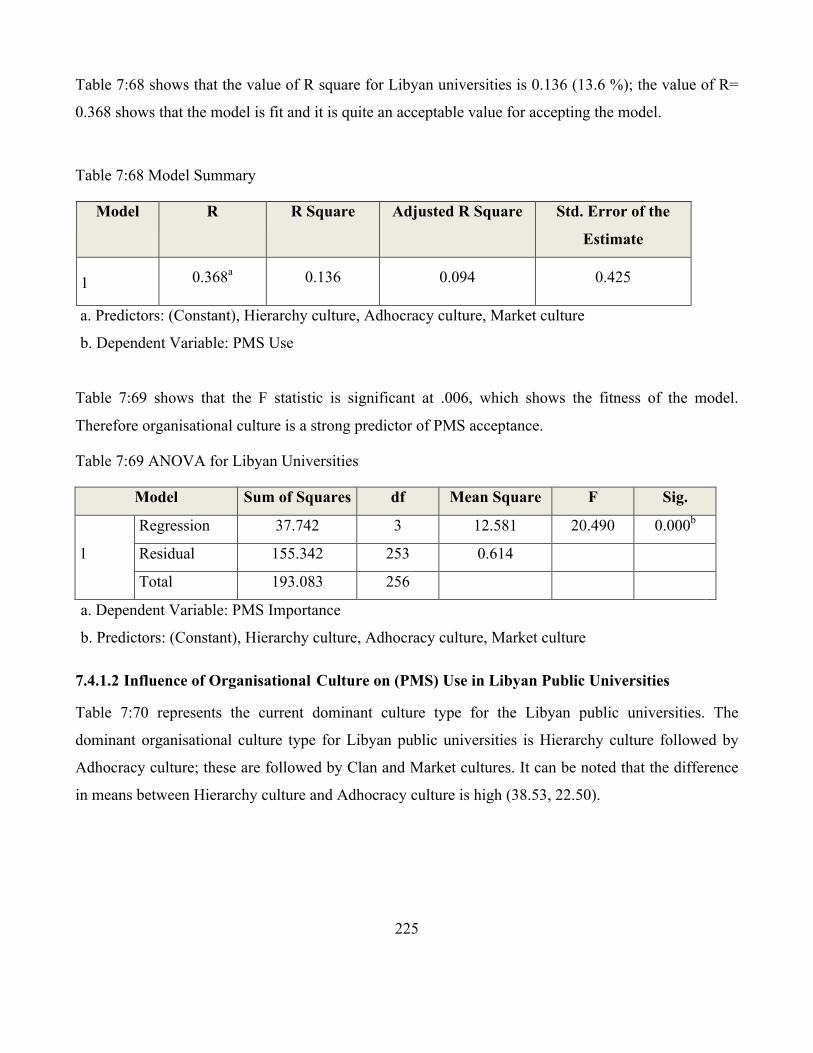
225
Table 7:68 shows that the value of R square for Libyan universities is 0.136 (13.6 %); the value of R=
0.368 shows that the model is fit and it is quite an acceptable value for accepting the model.
Table 7:68 Model Summary
Model R R Square Adjusted R Square Std. Error of the
Estimate
7.4.1.1.1.1.1.1 1 0.368a 0.136 0.094 0.425
a. Predictors: (Constant), Hierarchy culture, Adhocracy culture, Market culture
b. Dependent Variable: PMS Use
Table 7:69 shows that the F statistic is significant at .006, which shows the fitness of the model.
Therefore organisational culture is a strong predictor of PMS acceptance.
Table 7:69 ANOVA for Libyan Universities
Model Sum of Squares df Mean Square F Sig.
1
Regression 37.742 3 12.581 20.490 0.000b
Residual 155.342 253 0.614
Total 193.083 256
a. Dependent Variable: PMS Importance
b. Predictors: (Constant), Hierarchy culture, Adhocracy culture, Market culture
7.4.1.2 Influence of Organisational Culture on (PMS) Use in Libyan Public Universities
Table 7:70 represents the current dominant culture type for the Libyan public universities. The
dominant organisational culture type for Libyan public universities is Hierarchy culture followed by
Adhocracy culture; these are followed by Clan and Market cultures. It can be noted that the difference
in means between Hierarchy culture and Adhocracy culture is high (38.53, 22.50).
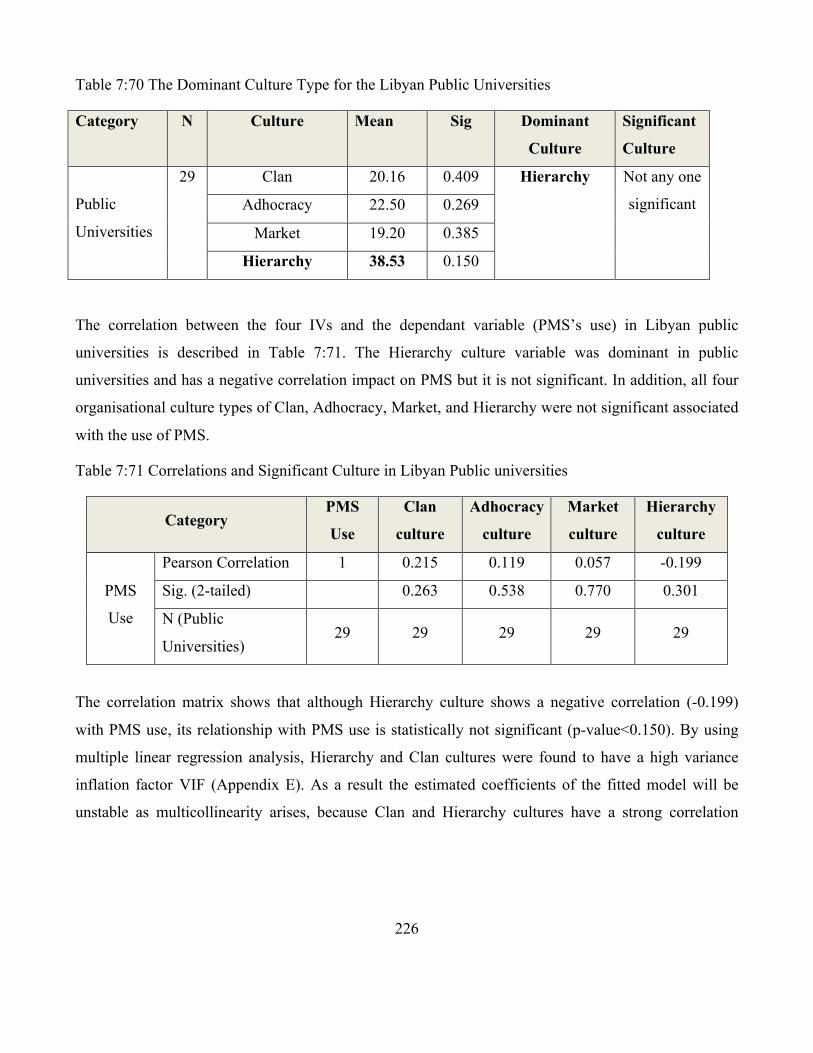
226
Table 7:70 The Dominant Culture Type for the Libyan Public Universities
Category N Culture Mean Sig Dominant
Culture
Significant
Culture
Public
Universities
29 Clan 20.16 0.409 Hierarchy Not any one
significant Adhocracy 22.50 0.269
Market 19.20 0.385
Hierarchy 38.53 0.150
The correlation between the four IVs and the dependant variable (PMS’s use) in Libyan public
universities is described in Table 7:71. The Hierarchy culture variable was dominant in public
universities and has a negative correlation impact on PMS but it is not significant. In addition, all four
organisational culture types of Clan, Adhocracy, Market, and Hierarchy were not significant associated
with the use of PMS.
Table 7:71 Correlations and Significant Culture in Libyan Public universities
Category PMS
Use
Clan
culture
Adhocracy
culture
Market
culture
Hierarchy
culture
PMS
Use
Pearson Correlation 1 0.215 0.119 0.057 -0.199
Sig. (2-tailed) 0.263 0.538 0.770 0.301
N (Public
Universities) 29 29 29 29 29
The correlation matrix shows that although Hierarchy culture shows a negative correlation (-0.199)
with PMS use, its relationship with PMS use is statistically not significant (p-value<0.150). By using
multiple linear regression analysis, Hierarchy and Clan cultures were found to have a high variance
inflation factor VIF (Appendix E). As a result the estimated coefficients of the fitted model will be
unstable as multicollinearity arises, because Clan and Hierarchy cultures have a strong correlation
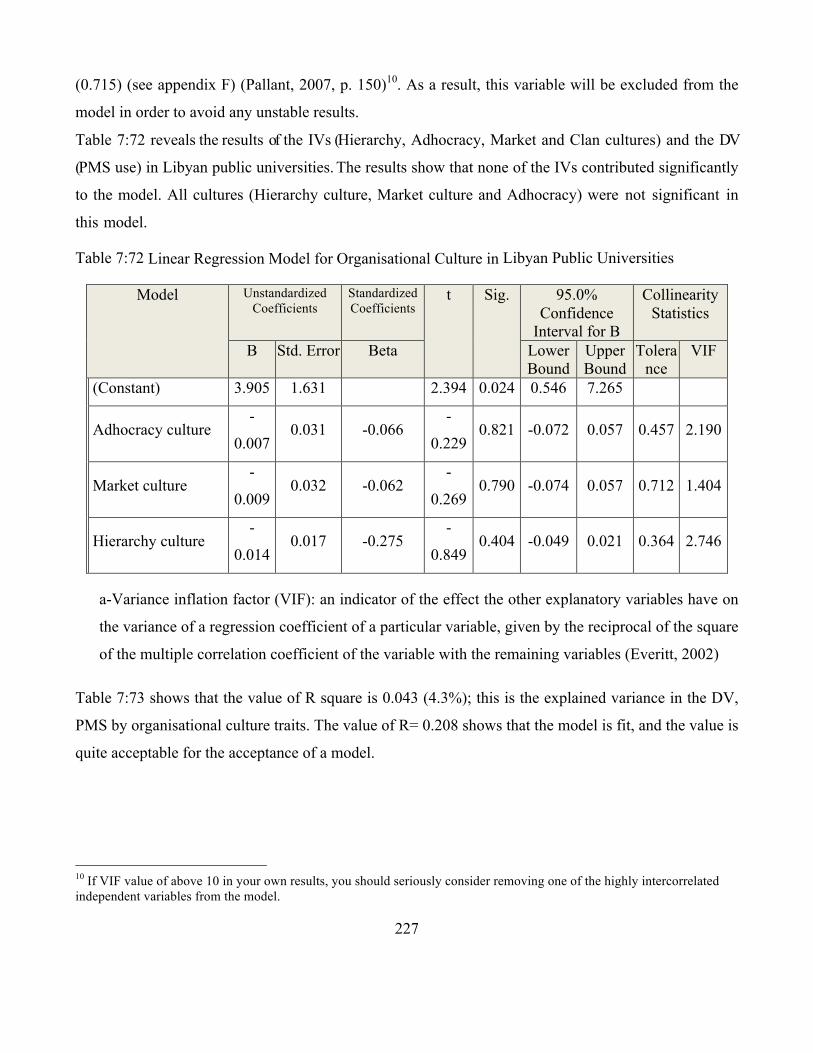
227
(0.715) (see appendix F) (Pallant, 2007, p. 150)10. As a result, this variable will be excluded from the
model in order to avoid any unstable results.
Table 7:72 reveals the results of the IVs (Hierarchy, Adhocracy, Market and Clan cultures) and the DV
(PMS use) in Libyan public universities. The results show that none of the IVs contributed significantly
to the model. All cultures (Hierarchy culture, Market culture and Adhocracy) were not significant in
this model.
Table 7:72 Linear Regression Model for Organisational Culture in Libyan Public Universities
Model Unstandardized Coefficients
Standardized Coefficients
t Sig. 95.0% Confidence
Interval for B
Collinearity Statistics
B Std. Error Beta Lower Bound
Upper Bound
Tolerance
VIF
(Constant) 3.905 1.631 2.394 0.024 0.546 7.265
Adhocracy culture -
0.007 0.031 -0.066
-
0.229 0.821 -0.072 0.057 0.457 2.190
Market culture -
0.009 0.032 -0.062
-
0.269 0.790 -0.074 0.057 0.712 1.404
Hierarchy culture -
0.014 0.017 -0.275
-
0.849 0.404 -0.049 0.021 0.364 2.746
a-Variance inflation factor (VIF): an indicator of the effect the other explanatory variables have on
the variance of a regression coefficient of a particular variable, given by the reciprocal of the square
of the multiple correlation coefficient of the variable with the remaining variables (Everitt, 2002)
Table 7:73 shows that the value of R square is 0.043 (4.3%); this is the explained variance in the DV,
PMS by organisational culture traits. The value of R= 0.208 shows that the model is fit, and the value is
quite acceptable for the acceptance of a model.
10 If VIF value of above 10 in your own results, you should seriously consider removing one of the highly intercorrelated independent variables from the model.
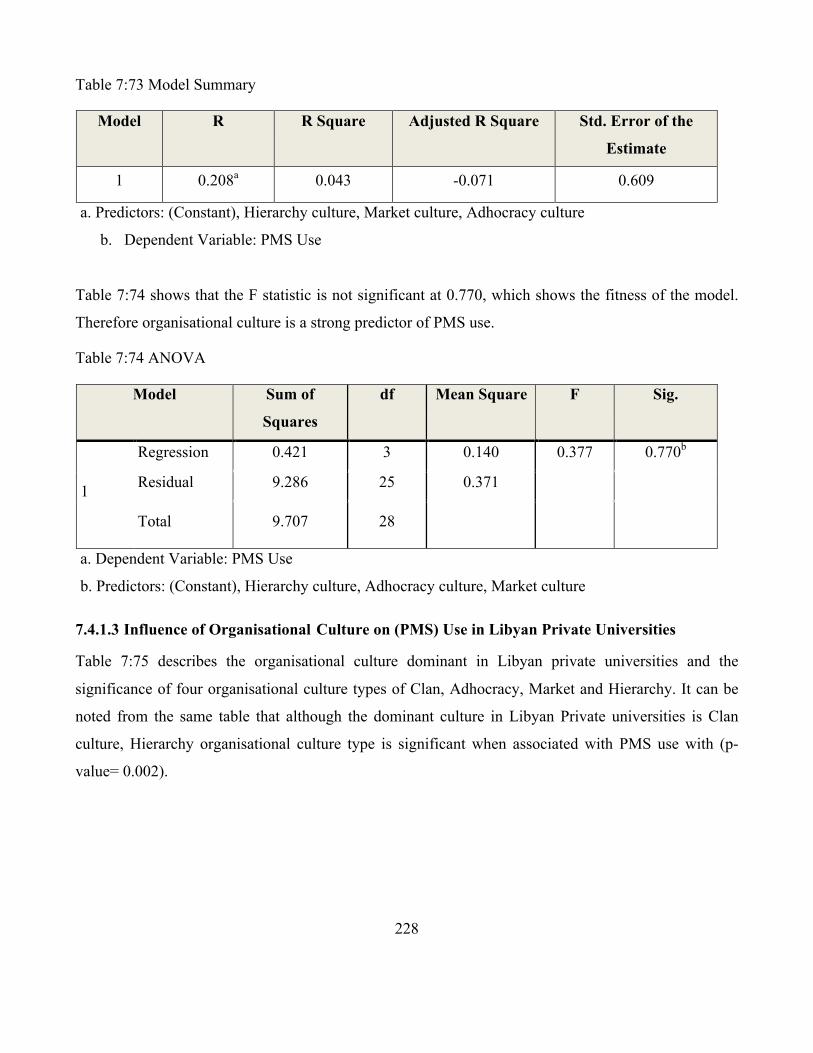
228
Table 7:73 Model Summary
Model R R Square Adjusted R Square Std. Error of the
Estimate
1 0.208a 0.043 -0.071 0.609
a. Predictors: (Constant), Hierarchy culture, Market culture, Adhocracy culture
b. Dependent Variable: PMS Use
Table 7:74 shows that the F statistic is not significant at 0.770, which shows the fitness of the model.
Therefore organisational culture is a strong predictor of PMS use.
Table 7:74 ANOVA
Model Sum of
Squares
df Mean Square F Sig.
1
Regression 0.421 3 0.140 0.377 0.770b
Residual 9.286 25 0.371
Total 9.707 28
a. Dependent Variable: PMS Use
b. Predictors: (Constant), Hierarchy culture, Adhocracy culture, Market culture
7.4.1.3 Influence of Organisational Culture on (PMS) Use in Libyan Private Universities
Table 7:75 describes the organisational culture dominant in Libyan private universities and the
significance of four organisational culture types of Clan, Adhocracy, Market and Hierarchy. It can be
noted from the same table that although the dominant culture in Libyan Private universities is Clan
culture, Hierarchy organisational culture type is significant when associated with PMS use with (p-
value= 0.002).

229
Table 7:75 Dominant and Significant Organisational Cultures in Libyan Private Universities
Category N Culture Mean Sig Dominant
Culture
Significant
Culture
Private
Universities
37 Clan 34.39 0.101 Clan Hierarchy
Adhocracy 21.37 0.190
Market 22.70 0.098
Hierarchy 21.53 0.002
The correlation between the IVs (four organisational culture types of Clan, Adhocracy, Market, and
Hierarchy) and the DV (PMS use) in Libyan private universities is described in Table 7:76. The Clan
culture variable was dominant and has a negative correlation impact on PMS; although it is not
significant. On the other hand, the Hierarchy variable has a good positive correlation impact on PMS
with a value of 0.470, and it has a significance of relations at (p-value = .003) associated with PMS use.
Table 7:76 Correlations and Significant Culture in Libyan Private Universities
Category Clan
culture
Adhocracy
culture
Market culture Hierarchy
culture
PMS
Use
Pearson
Correlation -0.215 -0.149 -0.218 0.470
Sig. (2-tailed) 0.202 0.380 0.195 0.003
N 37 37 37 37
The correlation matrix shows that although Clan culture shows a negative correlation (-0.215) with
PMS use, its relationship with PMS use is statistically not significant (p-value<0.101). By using
multiple linear regression analysis, Hierarchy and Clan cultures were found to have a high variance
inflation factor VIF (Appendix E), and as a result the estimated coefficients of fitted model will be
unstable as multicollinearity arises, because Clan and Hierarchy cultures have a strong correlation
(0.715) (Pallant, 2007, p. 150)11. As a result, this variable will be excluded from the model in order to
avoid any unstable results.
11 If VIF value of above 10 in your own results, you should seriously consider removing one of the highly intercorrelated independent variables from the model.
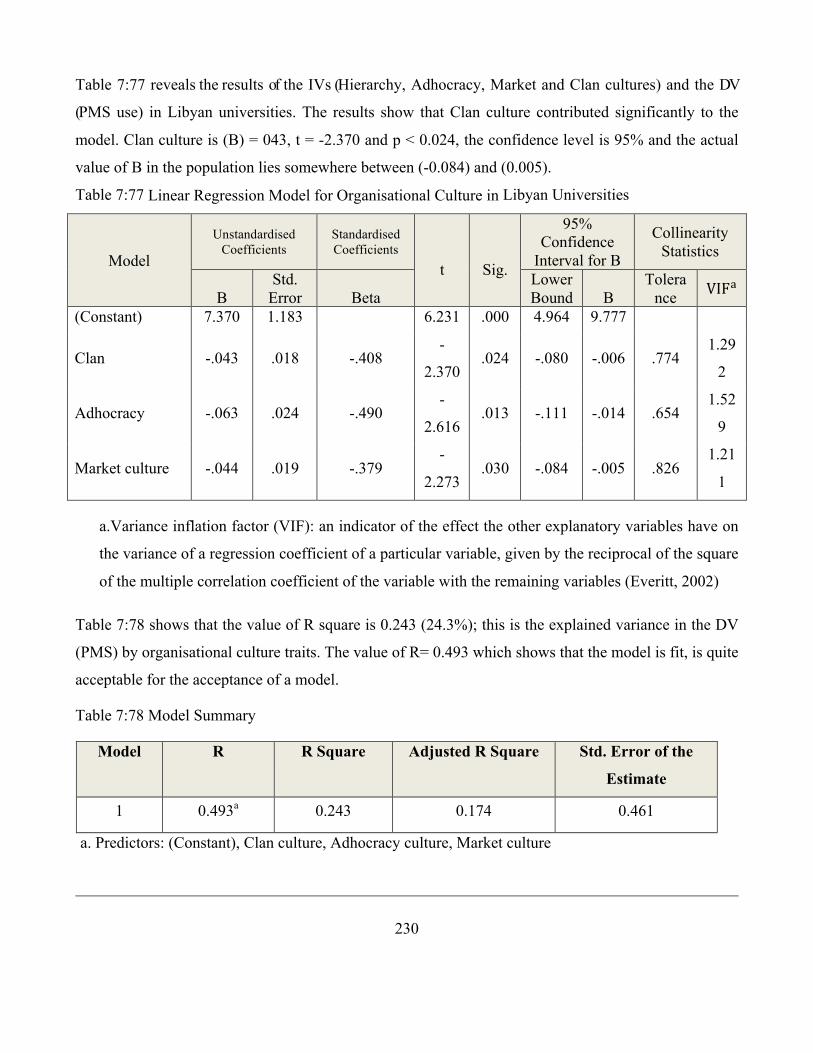
230
Table 7:77 reveals the results of the IVs (Hierarchy, Adhocracy, Market and Clan cultures) and the DV
(PMS use) in Libyan universities. The results show that Clan culture contributed significantly to the
model. Clan culture is (B) = 043, t = -2.370 and p < 0.024, the confidence level is 95% and the actual
value of B in the population lies somewhere between (-0.084) and (0.005).
Table 7:77 Linear Regression Model for Organisational Culture in Libyan Universities
Model
Unstandardised Coefficients
Standardised Coefficients
t
Sig.
95% Confidence
Interval for B
Collinearity Statistics
B
Std. Error
Beta
Lower Bound
B
Tolerance VIF!
(Constant) 7.370 1.183 6.231 .000 4.964 9.777
Clan -.043 .018 -.408 -
2.370 .024 -.080 -.006 .774
1.29
2
Adhocracy -.063 .024 -.490 -
2.616 .013 -.111 -.014 .654
1.52
9
Market culture -.044 .019 -.379 -
2.273 .030 -.084 -.005 .826
1.21
1
a.Variance inflation factor (VIF): an indicator of the effect the other explanatory variables have on
the variance of a regression coefficient of a particular variable, given by the reciprocal of the square
of the multiple correlation coefficient of the variable with the remaining variables (Everitt, 2002)
Table 7:78 shows that the value of R square is 0.243 (24.3%); this is the explained variance in the DV
(PMS) by organisational culture traits. The value of R= 0.493 which shows that the model is fit, is quite
acceptable for the acceptance of a model.
Table 7:78 Model Summary
Model R R Square Adjusted R Square Std. Error of the
Estimate
1 0.493a 0.243 0.174 0.461
a. Predictors: (Constant), Clan culture, Adhocracy culture, Market culture

231
b. Dependent Variable: PMS Use
Table 7:79 shows that the F statistic is significant at 0.025, which shows the fitness of the model.
Therefore organisational culture is a strong predictor PMS use.
Table 7:79 ANOVA
Model Sum of
Squares
df Mean Square F Sig.
1
Regression 2.254 3 .751 3.529 .025b
Residual 7.026 33 .213
Total 9.281 36
7.4.2 Influence of Organisational Culture on PMS Use for Higher Institutions in Libya
Table 7:80 describes the organisational culture which is dominant in higher institutions in Libya and
the significance of the four organisational culture types of Clan, Adhocracy, Market, and Hierarchy. It
can be noted from Table 7:80 that the dominant culture in higher institutions in Libya was Clan culture,
followed by Hierarchy culture. Adhocracy and Market cultures have a lower mean compared to Clan
and Hierarchy cultures.
On the other hand, three (Clan, Adhocracy, Market) of the four cultures types were significant when
associated with PMS use in higher institutions.
Table 7:80 Dominant and Significant Organisational Cultures for Higher Institutions in Libya
Category N Culture Mean Sig Dominant
Culture
Significant
Culture
Higher
Institutions
146 Hierarchy 29.27 0.000 Clan Clan
Adhocracy
Market
Clan 30.26 0.000
Adhocracy 21.49 0.002
Market 18.80 0.764
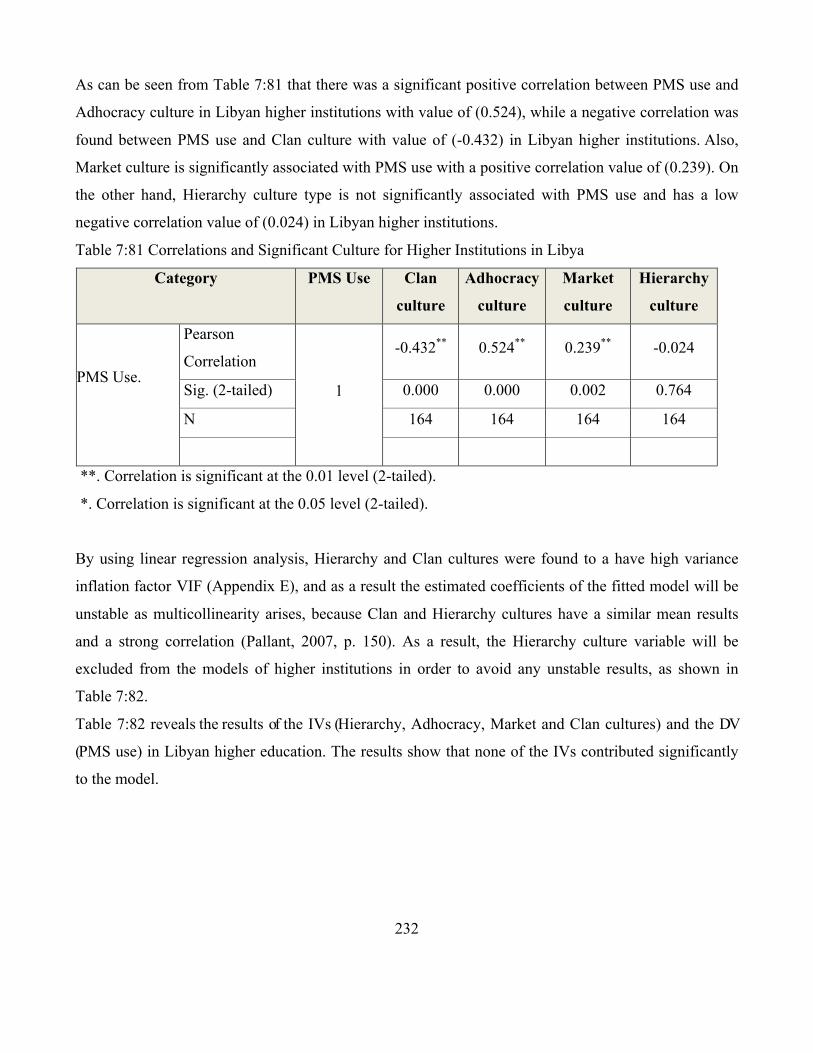
232
As can be seen from Table 7:81 that there was a significant positive correlation between PMS use and
Adhocracy culture in Libyan higher institutions with value of (0.524), while a negative correlation was
found between PMS use and Clan culture with value of (-0.432) in Libyan higher institutions. Also,
Market culture is significantly associated with PMS use with a positive correlation value of (0.239). On
the other hand, Hierarchy culture type is not significantly associated with PMS use and has a low
negative correlation value of (0.024) in Libyan higher institutions.
Table 7:81 Correlations and Significant Culture for Higher Institutions in Libya
Category PMS Use Clan
culture
Adhocracy
culture
Market
culture
Hierarchy
culture
PMS Use.
Pearson
Correlation
1
-0.432** 0.524** 0.239** -0.024
Sig. (2-tailed) 0.000 0.000 0.002 0.764
N 164 164 164 164
**. Correlation is significant at the 0.01 level (2-tailed).
*. Correlation is significant at the 0.05 level (2-tailed).
By using linear regression analysis, Hierarchy and Clan cultures were found to a have high variance
inflation factor VIF (Appendix E), and as a result the estimated coefficients of the fitted model will be
unstable as multicollinearity arises, because Clan and Hierarchy cultures have a similar mean results
and a strong correlation (Pallant, 2007, p. 150). As a result, the Hierarchy culture variable will be
excluded from the models of higher institutions in order to avoid any unstable results, as shown in
Table 7:82.
Table 7:82 reveals the results of the IVs (Hierarchy, Adhocracy, Market and Clan cultures) and the DV
(PMS use) in Libyan higher education. The results show that none of the IVs contributed significantly
to the model.

233
Table 7:82 Linear Regression Model for Organisational Culture for Higher Institutions in Libya
Model Unstandardized Coefficients
Standardized Coefficients
t Sig. 95.0% Confidence Interval for B
Collinearity Statistics
B Std. Error
Beta Lower Bound
Upper Bound
Tolerance VIF!
(Constant)
Adhocracy
Market
Clan
1.428 0.546 2.613 0.010 0.349 2.507
0.071 0.013 0.408 5.300 0.000 0.045 0.098 0.722 1.385
0.014 0.012 0.083 1.177 0.241 -0.009 0.037 0.865 1.156
-0.019 0.008 -0.187 -
2.313 0.022 -0.035 -0.003 0.655 1.526
a.Variance inflation factor (VIF): an indicator of the effect the other explanatory variables have on
the variance of a regression coefficient of a particular variable, given by the reciprocal of the square
of the multiple correlation coefficient of the variable with the remaining variables (Everitt, 2002)
It can be seen from Table 7:83 that in Libya higher institutions the R square is 0.315 (31.5%); this is
the explained variance in the DV (PMS use) by organisational culture traits (Clan, Adhocracy, and
Market). The value of R= 0.561 shows the model fit, as it is a low enough value for a model of PMS
use.
Table 7:83 Model Summary
Category Model R R
Square
Adjusted R
Square
Std. Error of the
Estimate
Higher Institutions 1 0.561a 0.315 0.302 0.760
a. Predictors: (Constant), Clan culture, Adhocracy culture, Market culture
b. Dependent Variable: PMS Use
Table 7:84 shows that the F statistic is highly significant at 0.000, which shows the fitness of the
model. Therefore organisational culture is a strong predictor of PMS use.

234
Table 7:84 ANOVA
Model Sum of Squares df Mean Square F Sig.
1
Regression 42.479 3 14.160 24.492 0.000b
Residual 92.500 160 0.578
Total 134.978 163
a. Dependent Variable: PMS Use
b. Predictors: (Constant), Market culture, Adhocracy culture, Clan culture
7.4.3 Influence of Organisational Culture on PMS Acceptance for Public Technical colleges in
Libya
Table 7:85 describes the organisational culture which is dominant in technical colleges in Libya and the
significance of the four organisational culture types of Clan, Adhocracy, Market, and Hierarchy
Cultures. It can be noted from Table 7:85 that the dominant culture in technical colleges was Hierarchy
culture, while the significant culture associated with PMS use with values of (p-value= 0.074) was Clan
culture.
On the other hand, none of the four cultures types (Clan, Adhocracy, Market, and Hierarchy) were
significant when associated with PMS use in technical colleges.
Table 7:85 Dominant and Significant Organisational Cultures for Public Technical colleges in Libya
Category N Culture Mean Sig Dominant
Culture
Significant
Culture
Public
Technical
colleges
27 Clan 23.92 0.074 Hierarchy Not any one
significant Adhocracy 20.90 0.956
Market 21.30 0.216
Hierarchy 33.67 0.393
The correlation between the IVs (four organisational culture types of Clan, Adhocracy, Market, and
Hierarchy) and the DV (PMS use) in technical colleges is also described in Table 7:86. There is a good
negative correlation between PMS use and Clan culture with a value of (0.349), and it has not a
significantly relationship between PMS use and Clan culture with p-value= 0.074. Adhocracy culture
has a low positive correlation (0.011) with PMS use, and a low negative correlation with Market and
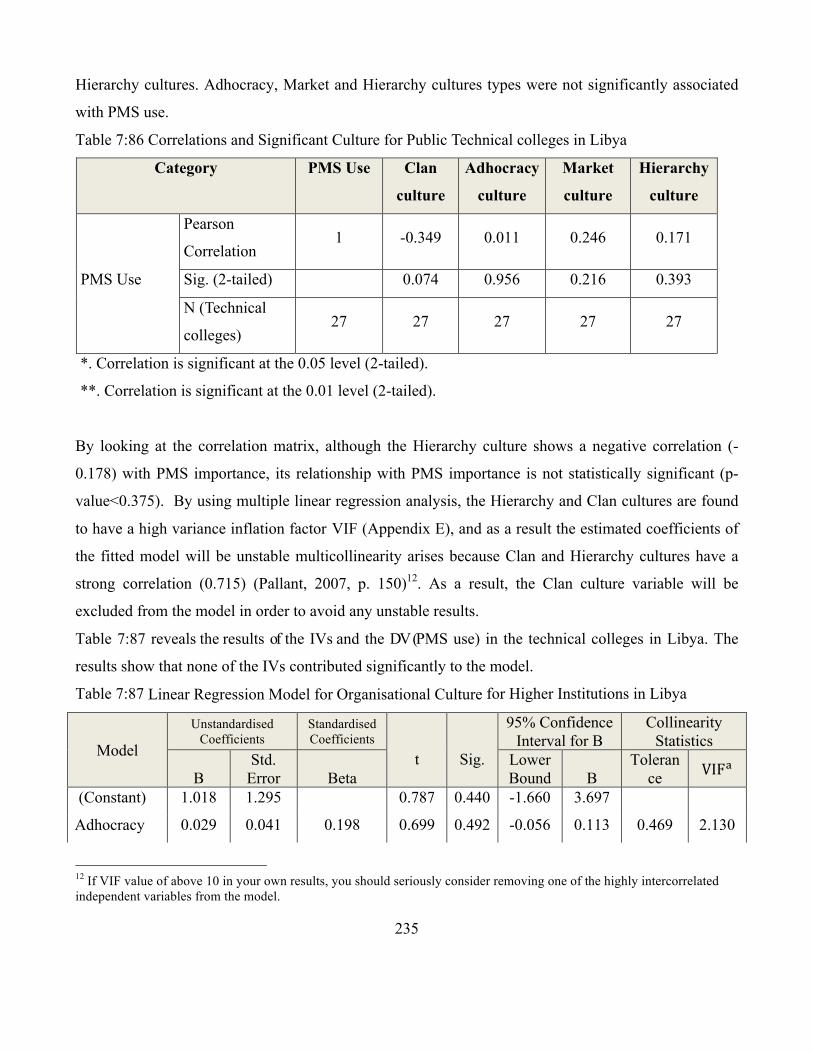
235
Hierarchy cultures. Adhocracy, Market and Hierarchy cultures types were not significantly associated
with PMS use.
Table 7:86 Correlations and Significant Culture for Public Technical colleges in Libya
Category PMS Use Clan
culture
Adhocracy
culture
Market
culture
Hierarchy
culture
PMS Use
Pearson
Correlation 1 -0.349 0.011 0.246 0.171
Sig. (2-tailed) 0.074 0.956 0.216 0.393
N (Technical
colleges) 27 27 27 27 27
*. Correlation is significant at the 0.05 level (2-tailed).
**. Correlation is significant at the 0.01 level (2-tailed).
By looking at the correlation matrix, although the Hierarchy culture shows a negative correlation (-
0.178) with PMS importance, its relationship with PMS importance is not statistically significant (p-
value<0.375). By using multiple linear regression analysis, the Hierarchy and Clan cultures are found
to have a high variance inflation factor VIF (Appendix E), and as a result the estimated coefficients of
the fitted model will be unstable multicollinearity arises because Clan and Hierarchy cultures have a
strong correlation (0.715) (Pallant, 2007, p. 150)12. As a result, the Clan culture variable will be
excluded from the model in order to avoid any unstable results.
Table 7:87 reveals the results of the IVs and the DV (PMS use) in the technical colleges in Libya. The
results show that none of the IVs contributed significantly to the model.
Table 7:87 Linear Regression Model for Organisational Culture for Higher Institutions in Libya
Model
Unstandardised Coefficients
Standardised Coefficients
t
Sig.
95% Confidence Interval for B
Collinearity Statistics
B
Std. Error
Beta
Lower Bound
B
Tolerance VIF!
(Constant) 1.018 1.295 0.787 0.440 -1.660 3.697
Adhocracy 0.029 0.041 0.198 0.699 0.492 -0.056 0.113 0.469 2.130
12 If VIF value of above 10 in your own results, you should seriously consider removing one of the highly intercorrelated independent variables from the model.
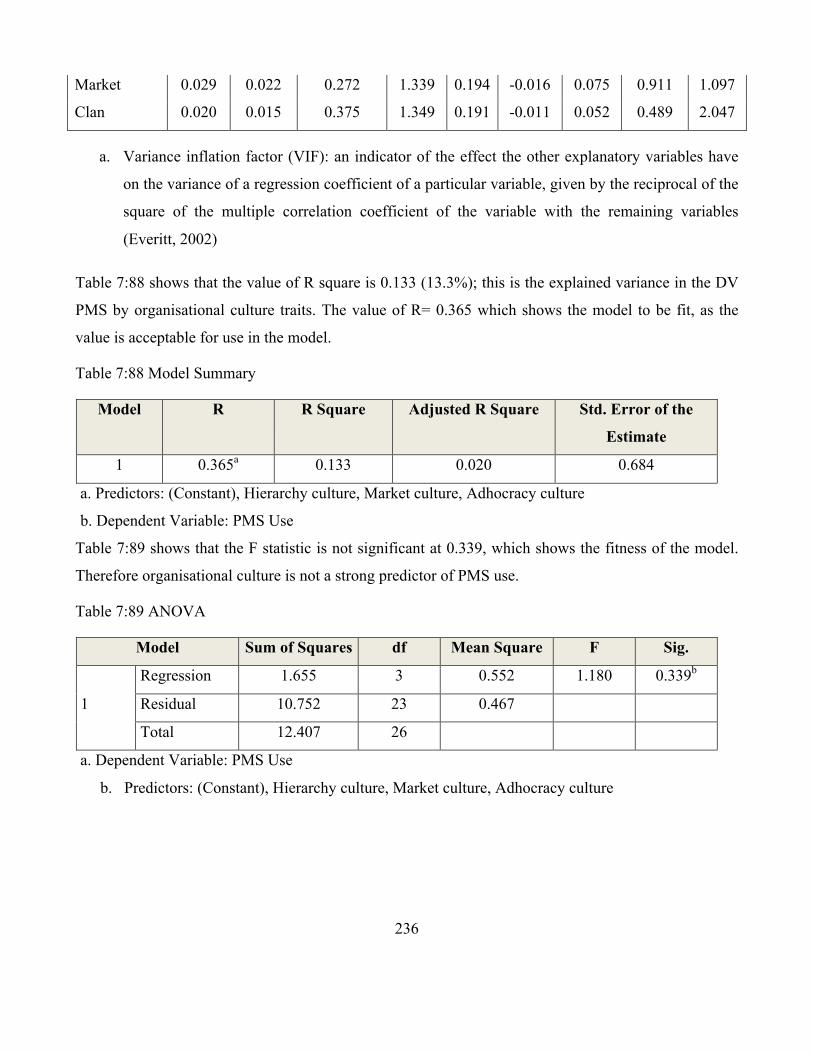
236
Market 0.029 0.022 0.272 1.339 0.194 -0.016 0.075 0.911 1.097
Clan 0.020 0.015 0.375 1.349 0.191 -0.011 0.052 0.489 2.047
a. Variance inflation factor (VIF): an indicator of the effect the other explanatory variables have
on the variance of a regression coefficient of a particular variable, given by the reciprocal of the
square of the multiple correlation coefficient of the variable with the remaining variables
(Everitt, 2002)
Table 7:88 shows that the value of R square is 0.133 (13.3%); this is the explained variance in the DV
PMS by organisational culture traits. The value of R= 0.365 which shows the model to be fit, as the
value is acceptable for use in the model.
Table 7:88 Model Summary
Model R R Square Adjusted R Square Std. Error of the
Estimate
1 0.365a 0.133 0.020 0.684
a. Predictors: (Constant), Hierarchy culture, Market culture, Adhocracy culture
b. Dependent Variable: PMS Use
Table 7:89 shows that the F statistic is not significant at 0.339, which shows the fitness of the model.
Therefore organisational culture is not a strong predictor of PMS use.
Table 7:89 ANOVA
Model Sum of Squares df Mean Square F Sig.
1
Regression 1.655 3 0.552 1.180 0.339b
Residual 10.752 23 0.467
Total 12.407 26
a. Dependent Variable: PMS Use
b. Predictors: (Constant), Hierarchy culture, Market culture, Adhocracy culture
237
7.5 Summary
This chapter has the presented questionnaire survey results, which included the influence of
organisational culture types on the acceptance, importance and use of performance measurement
systems. The purpose of this chapter was to explore the dominant type of organisational culture in
Libyan higher education in general and in its branches in particular, on the basis of the type of higher
education (such as universities, higher institutions and technical colleges) and ownership (private or
public). In addition, the influential relationship of the four types of organisational culture on the
acceptance, importance and use of performance measurement systems was found in the results. The
data was analysed using SPSS version 20 and a descriptive analysis for Libyan higher education was
conducted by using a multiple linear regression. The next chapter will discuss the findings and results
of the quantitative and qualitative aspects of this research study.

238
Chapter 8: Discussion of Research main findings
8.1 Introduction
The main aim of this chapter is to discuss the key findings from the quantitative and qualitative
analyses. It is structured into six sections: the first section is the introduction, and the second section
provides key findings from the research survey. The third section reviews the research objectives of
this study, Key findings in relation to the research objectives are discussed in section four, five and six.
The fourth section discusses the results related to the acceptance, importance and use of performance
measurement systems in Libyan higher education. The fifth section discusses the influence of the four
types of organisational culture on the acceptance, importance and use of performance measurement
systems. The sixth section discusses the organisational culture types that vary according to the
differences in the job title and position and level of education.
The aim of this study is to provide a better understanding of the relationships between organisational
culture and performance measurement systems developed for top management. A number of theoretical
contributions and practical implications can be derived from the results. First of all, this study attempts
to fill a part of the gap in the literature by identifying the different types of organisational culture within
the Libyan higher education sector. Secondly, this study has produced results based on contingency
theory in this sector, and its influence on the acceptance, importance and use of PMS, providing a
theoretical contribution to this research by expanding the concept of organisational culture to answer
the research question. Thirdly, this study is perhaps the first to compare three higher education types
with regard to the acceptance, importance and use of performance measurement systems, and the four
organisational culture variables. Fourthly, this study found that even in the same sector organisational
culture types were different, when previous studies in Libyan context found that different sectors have
the same organisational culture type. Finally, the study supports the contingency theory that there is no
universally appropriate system applying equally to all organisations in all circumstances and the
influence of organisational culture as a contingency with regard to the acceptance, importance and use
of performance measurement systems acceptance, which can be different according to different
circumstances.
From a theoretical point of view, this study extends prior literature on performance measurement
systems that use a contingency approach and previous research on performance measurement systems
(PMS). No other studies were found that incorporate organisational culture and PMS acceptance,

239
importance and use. This study examines the influence of organisational culture (by using the Cameron
Quinn model) on the acceptance of PMS. Despite the knowledge evident from previous investigations,
the relationships between organisational culture and the attributes of PMS have been overlooked in
these studies. Without neglecting the importance of previously studied contingent factors (e.g.,
environmental uncertainty, strategy, size), it is important to see culture as an omnipresent factor that
affects virtually all aspects of organisational interactions.
Understanding this contingent factor (organisational culture) is necessary to examine and understand
PMS from a holistic perspective. Moreover, this is one of the few studies of performance measurement
systems that have examined organisational culture while using a cross-sectional and large sample
approach in the higher education sector.
8.2 Descriptive of the Survey Sample
The sample of this study consists of three types of Libyan higher education institutions (universities,
higher institutions and technical collages). The participant lists covered the entire population of all
groups (universities, higher institutions and technical collages) in Libyan higher education.
To have an overview about the survey findings, this section provides a summary of the demographic
information obtained from the survey, which showed that the presidents and vice presidents of
organisations comprised 37% of the respondents, and the chiefs/assistant chiefs/vice chiefs of
administrative departments made up 10%. Others with different job titles and positions (such as a
former employee in the financial department and a faculty member in the business school) were about
13%, and about 40% occupied senior accounting and financial management positions in their
organisations (Chief/Assistant Chief/Vice Chief of Finance Department /Assistant/ Vice or Financial
Controller). The results also revealed that (58%) of the respondents had Post-graduate qualifications
(e.g. MSc, MBA, Ph.D.), and 26% had a Bachelor’s degree. Rated third were holders of professional
qualifications (13%), while the smallest group of ‘others’ (3%) included those with qualifications other
than these. In addition, 35.8% of the respondents had –1 – 5 years’ experience in the current job; this is
a result of the new appointments made after the regime change in Libya in 2012. 33.9% had 6 – 10
years’ experience with the current organisation and 26.8 % had more than 10 years’ experience. The
respondents were highly experienced in terms of how long they had been in their current organisation
(10 years or more) as well as in accounting and finance in general.

240
The distribution of the sample population showed that 56.4 % of the organisations where the
respondents worked were between 11-20 years old, 31.9% of them were more than 20 years old, 11.7
% were between 5-11 years old, while none of the organisations in question was less than 5 years old.
As mentioned earlier in chapter five, Libyan higher education consists of three types of higher
education institutions (universities, institutions and technical colleges). More than a half of Libyan
higher education respondents (64%) were from the higher education institutions because the Libyan
higher education sector has about 107 institutions, of which universities constitute 26% and technical
colleges 11%. More than a half of the respondents (64%), who were from higher institutions, were
dominated by Clan culture; Libyan higher education over all was dominated by Hierarchy culture.
8.3 Research Questions, Objectives and Discussion
The study adopted an exploratory research approach to understand the impact of four organisational
culture types (Hierarchy, Clan, Adhocracy and Market) on the acceptance, importance and use of
performance measurement systems (PMS) in Libyan higher education. The research questions and
sub- questions arose from gaps existing in the literature concerning the relationships between
organisational culture and PMS acceptance, their importance and use in Libyan higher education in
general and in each type of Libyan higher education in particular. This leads us to the following main
research question:
What influence does organisational culture have on the acceptance, importance and use of
performance measurement systems in Libyan higher education?
This section reviews the research aim and related objectives and addresses the research questions and
hypothesis. The study set out four specific aims and objectives as follows:
Objective 1: To identify the organisational culture types in Libyan higher education.
1- What types of organisational culture are dominant in Libya’s higher education system?
2- What types of organisational performance are found in Libya’s higher education system?
Objective 2: To identify the use of performance measurement systems in Libyan higher education.
3- To what extent are the performance measurement systems (financial, non-financial and
advanced) acceptable in Libyan education system?

241
4- To what extent are the performance measurement systems considered important in Libyan
education system?
5- To what extent are the performance measurement systems used in Libyan education system?
Objective 3: To investigate the role of organisational culture in the use of performance measurement
systems in Libyan higher education.
6- What influence does organisational culture have on the acceptance of performance
measurement systems (PMS) in Libyan higher education system?
7- What influence does organisational culture have on the importance of performance
measurement systems (PMS) in Libyan higher education system?
8- What influence does organisational culture have on the use of performance measurement
systems (PMS) in Libyan higher education system?
9- Do culture types differ for different job titles and positions and levels of education?
8.3.1 Research objective one: Organisational Culture Types
The first objective with the first two questions in this study was to investigate the organisational culture
types that dominant in Libya’s higher education system in general and in its branches in particular,
depending on the type of higher education and ownership. To achieve this first objective, the
organisational culture assessment instrument (OCAI) developed by Cameron and Quinn (1999, 2006)
which is based on the Competing Values Framework (CVF) of Quinn and Rohrbaugh (1981), is used to
describe and categorize types of cultures in Libyan higher education organisations.
From the results, the current dominant organisational culture type for the education sector in Libya is
Hierarchy culture which scores the highest mean (as shown in table 8:1 below)
Table 8:1 The Dominating of Organisational Culture type in Libyan Higher Education
Culture Type N Mean Std. Deviation Rank Clan culture 257 29.05 9.45 2 Adhocracy culture 257 21.53 5.02 3 Market culture 257 19.67 5.51 4 Hierarchy culture 257 29.66 9.65 1

242
The organisational performance for this type is characterised by stability and control with internal focus
and integration, which appears on the lower left hand side in the Competing Values Framework (CVF),
and this to answer question number two.
Table 8:2 Organisational Performance Type in Libyan Higher Education
Organisational Performance Type N Mean Std. Deviation
Flexibility and Discretion 257 25.26 4.60 Stability and Control 257 24.66 4.49
Internal Focus and Integration 257 29.33 3.97 External Focus and Differentiation 257 20.60 3.99
Hierarchy is the dominant organisational culture type in Libyan higher education in general, Libyan
public universities and Libyan Technical colleges (Table 8:3).
Table 8:3 Dominant Organisational Culture Type in Different Higher Education Organisations
Culture Private
Universities
Public
Universities
Higher institutions Technical
colleges
N Mean Rank N Mean Rank N Mean Rank N Mean Rank
Clan 37 34.39 1 29 20.16 3 164 30.26 1 27 23.92 2
Adhocracy 37 21.37 4 29 22.50 2 164 21.49 3 27 20.90 4
Market 37 22.70 2 29 19.20 4 164 18.80 4 27 21.30 3
Hierarchy 37 21.53 4 29 38.53 1 164 29.27 2 27 33.67 1
Dominant
culture
type
Clan Hierarchy Clan Hierarchy
The finding of the case study of the University of Tripoli found that the Hierarchy culture is the
dominant organisational culture type (Table 8:4).

243
Table 8:4 Dominant Organisational Culture Type for University of Tripoli
Culture Type N of
Interviewees
.
% Mean Std. Deviation Rank
Clan culture 0 0% 21.77 10.878 3 Adhocracy culture 1 12.5% 22.50 7.015 2 Market culture 0 0% 20.00 6.156 4 Hierarchy culture 7 87.5% 35.73 19.187 1 Total 8 100%
Overall, all interviews answers were consistent with the hierarchy culture characteristics which state
that the relationships between staff and employees are very formal. There are no or limited friendly
relationships between the staff and the relationships are according to hierarchical cultural
characteristics of their job positions in the organisation. In addition, the organisations follow the
decisions, laws and regulations of the higher authority, such as the Ministry of Higher education.
These findings are consistent with the study of Twati & Gammack (2006), which explored the impact
of organisational culture innovation on the acceptance of information systems. This study found that
the organisational culture profiles of both the oil and gas and banking sectors of Libyan industry fit
predominantly in the lower left quadrant, or the Hierarchy culture. Similarly, Zahari & Shurbagi (2012)
studied the effect of organisational culture and the relationship between transformational leadership and
job satisfaction in the petroleum sector of Libya and found that the Hierarchy culture type was the
dominant culture in the Libyan Oil sector.
Even though Twati & Gammaack (2006) and Zahari & Shurbagi (2012) studied different sectors, their
findings are consistent with this study, and this suggests that their studies and this study were in the
same environment (Libyan environment), and that respondents’ organisations shared values, belief, and
assumptions and practices that shape and guide the members’ attitudes and behaviour.
In addition (Parker & Bradley, 2000) in their study of the organisational culture in the public sector,
found evidence from six organisations in the Queensland University that four out of six departments
were dominated by a Hierarchy culture. Trivellas & Dargenidou (2009), in their study on a sample of
faculty and administration members at the Technological Educational Institution of Larissa, found that
the Hierarchy culture proved to be the most prevalent among administrative staff, while Clan and
Hierarchy cultures dominated among faculty members.
The studies of (Parker & Bradley, 2000)and of Trivellas & Dargenidou (2009) were about education
sector and they both found that the dominant organisational culture type was a Hierarchy culture, even

244
though their studies were in different countries. Their findings are consistent with this study, and this
suggests that in the same sector, researchers could find the same results.
Cameron & Quinn (2011) in their research on hundreds of organisations have shown that Hierarchy and
Clan cultures appear more frequently in organisations than Adhocracy or Market cultures. A Hierarchy
culture is typical in governmental and well-established organisations with many levels of structure and
large numbers of employees (K. Cameron & Quinn, 2011).
A Hierarchy culture focuses on the internal maintenance and strives for internal stability and control
through the establishment of clear tasks and compliance with strict rules. It follows a formal
relationship approach in which leaders have to be good organizer and coordinator. Great value to the
economy, formality, rationality, order and obedience is given. Cameron and Quinn (1999, 2006) stated
that government agencies fit very well in a Hierarchy culture, which confirms this study’s findings.
Moreover, organisations in a Hierarchy culture are characterised by a formalised and structured
workplace—governed by formal rules, policies and procedures, with efficiency-minded leaders valuing
coordination and smooth organisation—where stability, dependability, predictability and employment
security are highlighted (Cameron and Quinn, 1999).
The findings of this study did not find measurable differences between Libyan public universities and
Libyan Technical colleges. The researcher concludes that there are no great differences between these
two different types of Libyan higher education organisations (public universities, Technical colleges) in
terms of organisational culture, especially because these two types of institutions are located in big
cities, and characterised by Hierarchy culture more than other organisational culture types.
The acceptance and use of new PMS can also vary according to different social and cultural contexts.
However, in different countries there are different organisational types that do not consistent with this
study, the organisational culture type undertaken in previous studies were in developed countries. For
example, the results of the application of OCAI by Igo & Skitmore (2006) indicated that companies in
Australian engineering consultancy had a dominant market-oriented culture. Zu et al (2010)
investigated how organisational culture influences the implementation of different practices
incorporated in the recent Six Sigma approach as well as those associated with traditional total quality
management (TQM), using survey data collected from 226 US manufacturing plants. The relationships
between four culture types and 10 TQM/Six Sigma practices were examined, and the results revealed

245
that the dominant culture type was a Market culture. Zu, et al (2010) were not consistent in this study
because it was in one of the developed countries (USA) and also in manufacturing plants sector which
is a different environment, where the focus is on market product diversity and taking advantage of
opportunities in the market environment, profit making and product improvement. Organisations in
this study are within the education system and most of them are public and funded by government;
therefore, market culture is not expected to be one of the dominant cultures in Libyan higher education.
The dominant culture in the Libyan public universities is Hierarchy, while in the private universities it
is Clan, with discretionary and flexible organisational performance type. This type appears in the upper
left hand side of the Competing Values Framework (CVF). This result is consistent with the previous
study of Ramachandran et al. (2011) who found that the Clan culture got the highest mean score in
public higher educational institutions in Malaysia, while the private universities were dominanted by
Hierarchy culture. In contrast, the Libyan public universities were dominated by a Hierarchy culture
and the private universities were dominated by a Clan culture.
In addition, the dominant organisational culture type for higher institutions in Libyan higher education
is a Clan culture, which scored the highest mean of the organisational culture types. This result is
consistent with previous studies, such as that of Abousaber & Papazafeiropoulou (2011), which shows
that Small and Medium Enterprises (SMEs) in Saudi Arabia are clearly dominated by a Clan culture.
Florida and Kenney (1991) have established that the culture type is Clan in Japanese organisations and
Henri (2006), after his analysis of a population of 2175 Canadian manufacturing firms, concluded that
top managers of firms reflect a Clan type culture. Thomas et al (2002) found in a study of the
relationship between project cultures, as assessed by Quinn’s Competing Values Framework and the
quality of outcomes on thirteen construction sites, that the Clan type culture was found to correlate with
improved quality outcomes, whereas Market culture was more common for construction projects.
There are 107 higher institutions in Libya, which are distributed in large and small cities. In small
cities, most of the people know each other, and clan and tribal attitudes are still strong. Libyan higher
institutions with a Clan culture are characterized as friendly workplaces, with shared values, beliefs,
goals, unity and participation. This type of culture focuses on internal issues, flexible values and
carefulness rather than stability (Cameron and Quinn, 1999).

246
In conclusion, the Hierarchy culture is the dominant organisational culture type in the Libyan higher
education sector in general. On the other hand, the dominant organisational culture type was different
between the different types of organisations (Libyan higher education in general and its branches in
particular) this study explored, even though they are in the same sector, education. Libyan public
universities and Libyan Technical colleges are dominated by a Hierarchy culture, while Libyan higher
institutions and private universities are dominated by a Clan culture. This result is not consistent with
the previous study of Twati & Gammack (2006), who found that the organisational culture profiles of
both the oil and gas and banking sectors of Libya was a Hierarchy culture. Twati & Gammack (2006)
investigated about 15 government and public organisations in these sectors, while this study
investigated 122 organisations in Libyan higher education (see table 4:6); this may explain the
inconsistency.
8.3.2 Research objective two: The Use of PMS
The second objective with questions 3, 4, and 5 are discusses the acceptance, importance and use of
performance measurement systems, which is reported by respondents in Libyan higher education. It
discusses views on the importance of using PMS, and determines the currently existing use of PMS in
Libyan higher education. The study investigated the influence of organisational culture on PMS
acceptance, and as well as the use of multiple performance measurement in order to understand the
extent of the acceptance, importance and use of financial and non-financial performance measurement
systems in Libyan higher education. Moreover, the use of the advanced technique of the balanced
scorecard was investigated for its effectiveness and usefulness in organisational performance.
8.3.2.1 PMS Acceptance
In order to measure the PMS in Libyan higher education, a fixed set of PMS categories were developed
which include financial, non-financial and advanced techniques, as well the effectiveness and useful of
using PMS to evaluate performance. The respondents were asked about the following:
1- The use of financial performance measurement systems to evaluate organisational performance.
2- The use of non-financial performance measurement systems to evaluate organisational
performance.
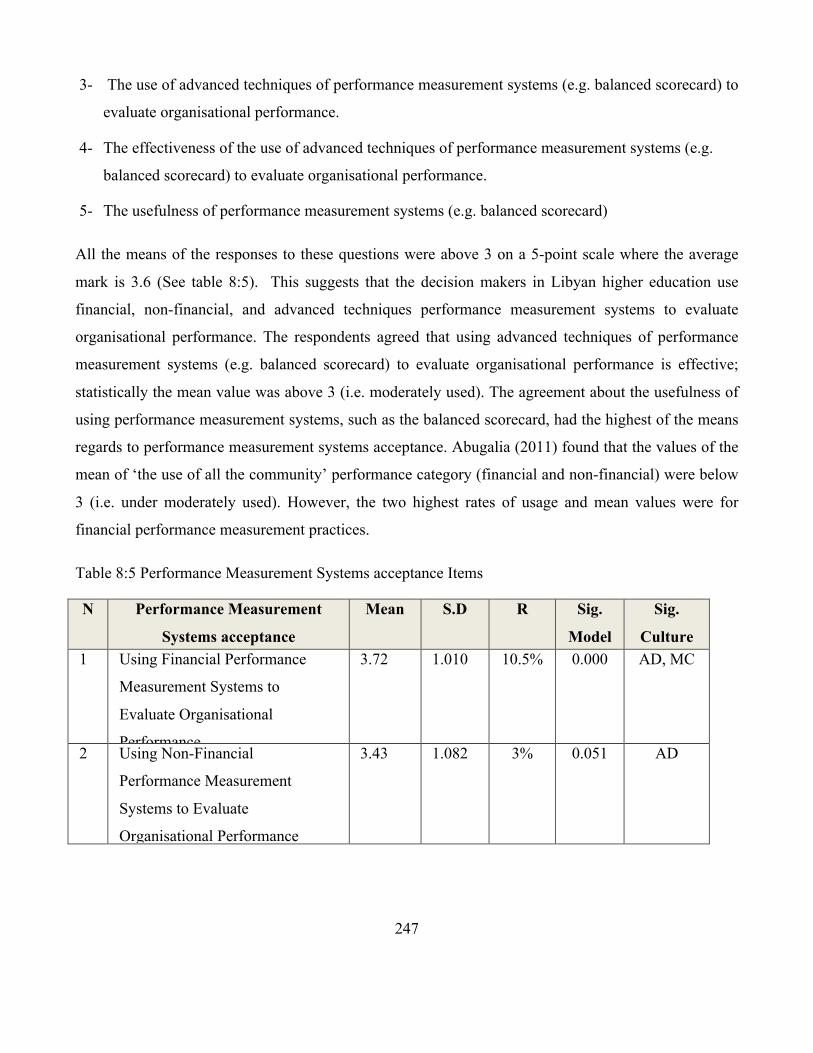
247
3- The use of advanced techniques of performance measurement systems (e.g. balanced scorecard) to
evaluate organisational performance.
4- The effectiveness of the use of advanced techniques of performance measurement systems (e.g.
balanced scorecard) to evaluate organisational performance.
5- The usefulness of performance measurement systems (e.g. balanced scorecard)
All the means of the responses to these questions were above 3 on a 5-point scale where the average
mark is 3.6 (See table 8:5). This suggests that the decision makers in Libyan higher education use
financial, non-financial, and advanced techniques performance measurement systems to evaluate
organisational performance. The respondents agreed that using advanced techniques of performance
measurement systems (e.g. balanced scorecard) to evaluate organisational performance is effective;
statistically the mean value was above 3 (i.e. moderately used). The agreement about the usefulness of
using performance measurement systems, such as the balanced scorecard, had the highest of the means
regards to performance measurement systems acceptance. Abugalia (2011) found that the values of the
mean of ‘the use of all the community’ performance category (financial and non-financial) were below
3 (i.e. under moderately used). However, the two highest rates of usage and mean values were for
financial performance measurement practices.
Table 8:5 Performance Measurement Systems acceptance Items
N Performance Measurement
Systems acceptance
Mean S.D R Sig.
Model
Sig.
Culture 1 Using Financial Performance
Measurement Systems to
Evaluate Organisational
Performance
3.72 1.010 10.5% 0.000 AD, MC
2 Using Non-Financial
Performance Measurement
Systems to Evaluate
Organisational Performance
3.43 1.082 3% 0.051 AD

248
3 Using Advanced Techniques of
Performance Measurement
Systems (e.g. Balanced
Scorecard) to Evaluate
Organisational Performance
3.60 1.015 3.8% 0.019 AD, HC
4 Effectiveness of Using Advanced
Techniques of Performance
Measurement Systems (e.g.
Balanced Scorecard) to Evaluate
Organisational Performance
3.50 1.072 3.1% 0.047 HC
5 Usefulness of Using Performance
Measurement Systems (e.g.
Balanced Scorecard) to Evaluate
Organisational Performance
3.77 0.886 4.1% 0.015 AD, HC
Adhocracy= AC / Hierarchy= HC / Market=MC
A similar method has been applied in previous studies about the diversity of PMS (Eker & Eker, 2009;
Henri, 2006; Hoque et al., 2001; Pedersen & Sudzina, 2012). Hoque et al (2001) examined the
relationships among an organisation’s market competition, computer-aided manufacturing processes
and multiple performance measurement usage. The results suggest that a greater emphasis on multiple
measures for performance evaluation is associated with businesses facing high levels of competition
and greater use of the processes of computer aided manufacturing. Eker & Eker (2009) state that in a
flexible culture (Clan or Adhocracy types), multiple performance measures can be seen as the most
important concepts in a dynamic and changing environment. Because of their structural features,
flexible firms prefer to use multiple performance measures, including financial and non-financial
activities and measures.
In this study the researcher separated out the financial and non-financial measures for PMS acceptance,
and run more regressions to support the PMS results from the questionnaire where was found some
elements were more important for others. The performance measurement systems acceptance has five
elements, and by the mean analysis it can be note (See table 8:5) that the first and the fifth elements
have the highest mean. Moreover, by running the regressions to investigate the culture influence, the
249
study found that the same elements have the highest R square and significant and they were the most
important elements.
Table 8:5 shows that the value of R square in item one (Using Financial Performance Measurement
Systems to Evaluate Organisational Performance) is (10.5%); this is the explained variance in the DV
PMS by organisational culture traits. The value of R shows that the model is fit and this value is of low
enough for the acceptance of the model, F statistic is significant at 0.000, which shows the fitness of
the model. Therefore organisational culture types (AD, MC) are a strong predictor of using financial
PMS to evaluate organisational performance. Those results showed that the external focus cultures like
(Adhocracy and marcket types, See figure 2:7) were the most important concepts Libyan higher
education.
8.3.2.2 Performance Measurement Systems Importance and Use
To achieve this objective, the financial and non-financial performance measures were ranked according
to the mean of the extent to which respondents from Libyan higher education rank them as important to
long term success of the long term, and the extent to which they are being used in the aforementioned
practices. In addition to investigating the acceptance of performance measurement systems in Libyan
higher education, this study investigated the importance and use of performance measurement systems
(financial, non-financial, advanced techniques) to discover to what extent the performance
measurement systems are important, and to what extent Libyan higher education uses performance
measurement systems as drivers of long-term success.
The importance of financial performance measurement systems, such as annual earnings, return on
assets, cost reduction, general administrative expenditures per student, tuition and fee levels, were
investigated to understand the importance level and use of financial PMS to evaluate organisational
performance.
1- Financial Performance Measurement Systems (e.g. annual earnings, return on assets, cost
reduction, general administrative expenditures per student, tuition and fee levels etc.).
The non-financial performance measurement systems whose importance and use were studied include:
2- Non-Financial Performance Measurement Systems /Customer (student and staff), (e.g. customer
satisfaction, customer retention, etc.).

250
3- Non-Financial Performance Measurement Systems /Innovation (e.g. courses or educational
programs).
4- Non-Financial Performance Measurement Systems /Employee (e.g. employee satisfaction,
workforce capabilities, etc.).
5- Non-Financial Performance Measurement Systems /Quality (e.g. academic quality awards,
etc.).
6- Non-Financial Performance Measurement Systems /Community (e.g. public image, community
involvement, etc.).
Non-financial performance measurement systems /innovation (e.g. courses or educational programs)
got the highest mean and the same rank in both the importance and use of performance measurement
systems (table 8:6). The employees (e.g. employee satisfaction, workforce capabilities, etc.) got the
second rank in importance, while the financial performance measurement systems got the second rank
in the use. The third rank was for non-financial performance measurement systems /customer and non-
financial performance measurement systems /quality in the performance measurement systems
importance category, while non-financial performance measurement systems /employee were in the
third rank in the performance measurement systems use category. The fourth rank in PMS importance
was for financial performance measurement systems and the fifth was for non-financial performance
measurement systems /community. On the other hand, in PMS use, the fourth rank was for non-
financial performance measurement systems /customer, the fifth was for non-financial performance
measurement systems /community. Finally the sixth rank went to Non-Financial Performance
Measurement Systems /Quality.
Table 8:6 accounts for the overall diverse measurements; the last two columns highlight this indicator,
which is calculated by the average standardised rating of importance and use for each category
(financial and non-financial measures). This indicator shows that if the level of overall diverse
measurements is up to 3, then it means Libyan higher education uses diverse sets of performance
measures at a high level. However if the rate is less than 3, it means that diverse sets of PMS do not
receive use of a high level. From the table 8:5, it can be noted clearly that in Libyan higher education,
non-financial performance measurement systems /innovation got the highest mean and the rank in both
the importance and use of PMS. On the other hand, institutions still rely on using financial performance
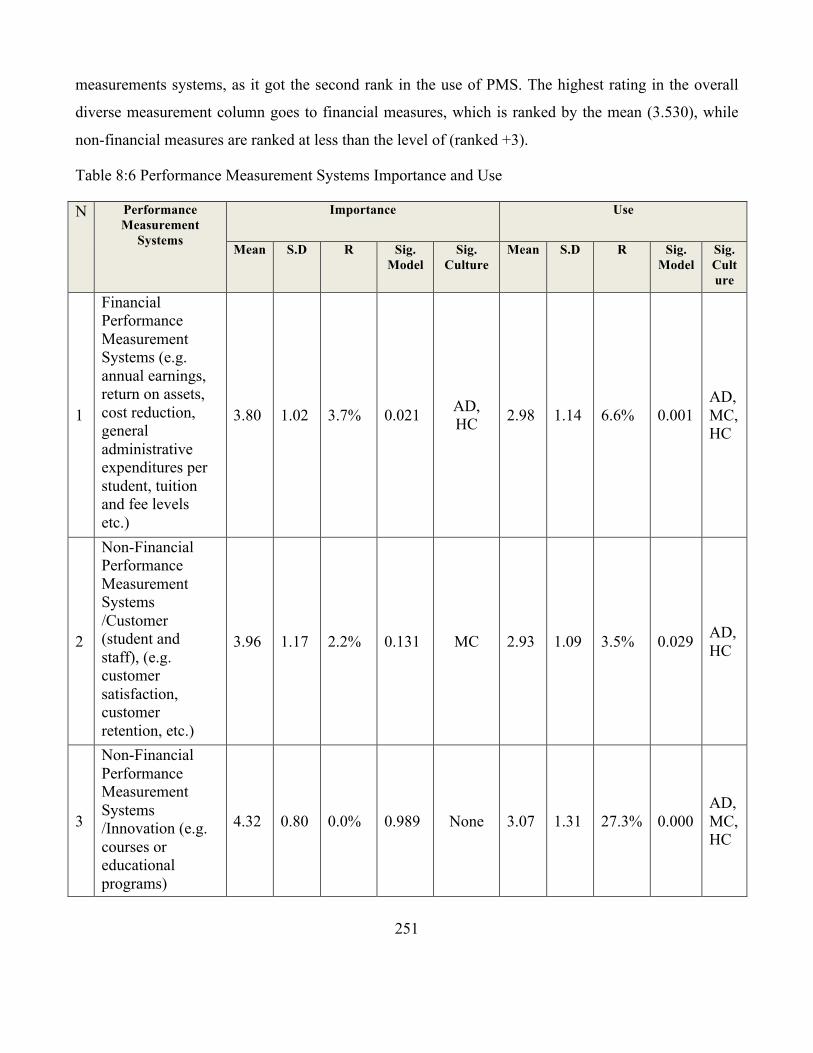
251
measurements systems, as it got the second rank in the use of PMS. The highest rating in the overall
diverse measurement column goes to financial measures, which is ranked by the mean (3.530), while
non-financial measures are ranked at less than the level of (ranked +3).
Table 8:6 Performance Measurement Systems Importance and Use
N Performance Measurement
Systems
Importance Use
Mean
S.D R Sig. Model
Sig. Culture
Mean
S.D R Sig. Model
Sig. Culture
1
Financial Performance Measurement Systems (e.g. annual earnings, return on assets, cost reduction, general administrative expenditures per student, tuition and fee levels etc.)
3.80 1.02 3.7% 0.021 AD, HC 2.98 1.14 6.6% 0.001
AD, MC, HC
2
Non-Financial Performance Measurement Systems /Customer (student and staff), (e.g. customer satisfaction, customer retention, etc.)
3.96 1.17 2.2% 0.131 MC 2.93 1.09 3.5% 0.029 AD, HC
3
Non-Financial Performance Measurement Systems /Innovation (e.g. courses or educational programs)
4.32 0.80 0.0% 0.989 None 3.07 1.31 27.3% 0.000 AD, MC, HC
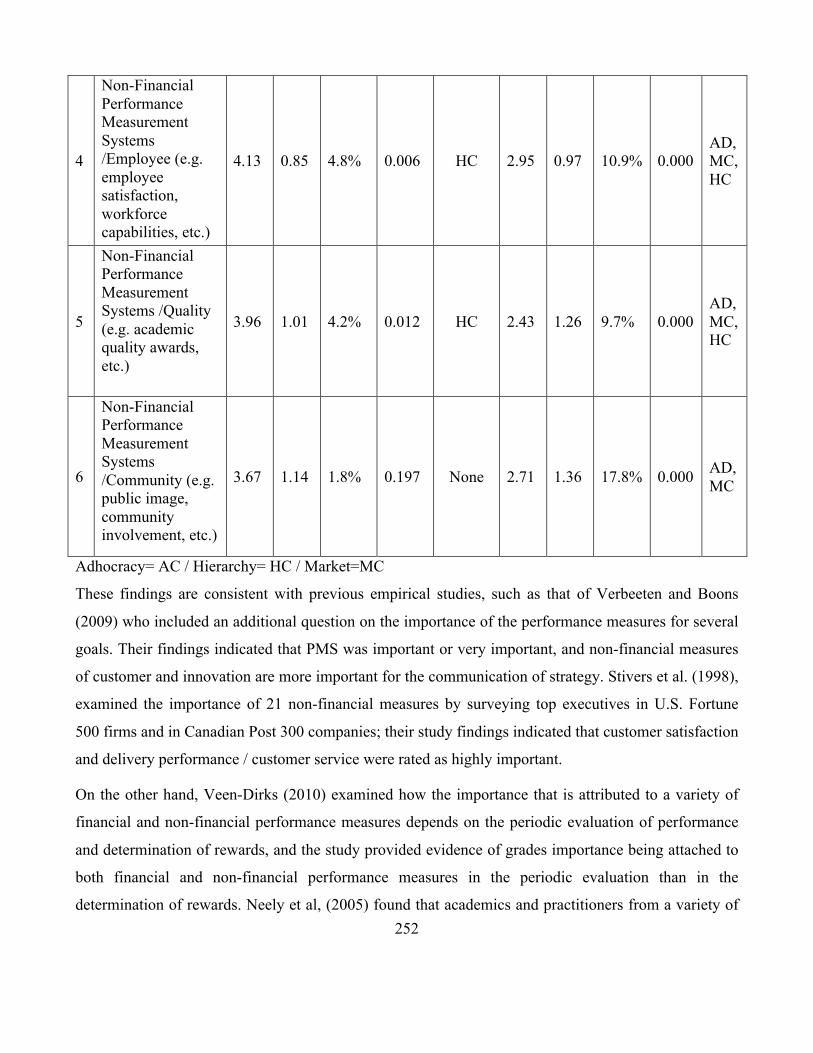
252
4
Non-Financial Performance Measurement Systems /Employee (e.g. employee satisfaction, workforce capabilities, etc.)
4.13 0.85 4.8% 0.006 HC 2.95 0.97 10.9% 0.000 AD, MC, HC
5
Non-Financial Performance Measurement Systems /Quality (e.g. academic quality awards, etc.)
3.96 1.01 4.2% 0.012 HC 2.43 1.26 9.7% 0.000 AD, MC, HC
6
Non-Financial Performance Measurement Systems /Community (e.g. public image, community involvement, etc.)
3.67 1.14 1.8% 0.197 None 2.71 1.36 17.8% 0.000 AD, MC
Adhocracy= AC / Hierarchy= HC / Market=MC
These findings are consistent with previous empirical studies, such as that of Verbeeten and Boons
(2009) who included an additional question on the importance of the performance measures for several
goals. Their findings indicated that PMS was important or very important, and non-financial measures
of customer and innovation are more important for the communication of strategy. Stivers et al. (1998),
examined the importance of 21 non-financial measures by surveying top executives in U.S. Fortune
500 firms and in Canadian Post 300 companies; their study findings indicated that customer satisfaction
and delivery performance / customer service were rated as highly important.
On the other hand, Veen-Dirks (2010) examined how the importance that is attributed to a variety of
financial and non-financial performance measures depends on the periodic evaluation of performance
and determination of rewards, and the study provided evidence of grades importance being attached to
both financial and non-financial performance measures in the periodic evaluation than in the
determination of rewards. Neely et al, (2005) found that academics and practitioners from a variety of

253
functional disciplines have long recognized the importance of performance measurement. Medori
(1998) states that performance measurement systems are one of the most important areas of
management accounting that play a major role in evaluating the achievement of organisational
objectives. In addition, performance measurement systems play a key role in organisations not only
because of their importance as a source of information about financial transactions and internal
activities, but also because of their effect on the monetary success of organisations (M. I. K. Zuriekat,
2005).
Amir et al (2010) explain the importance of PMS as a source of information to guide management
decisions and the choice of actions. Al Sawalqa (2011, p. 280) found that multiple measures of
performance are important to support not only financial performance but also non-financial
performance in several areas such as customer satisfaction and innovation.
Zuriekat et al (2011), in their study of the participation in performance measurement systems and levels
of satisfaction, indicate the importance of financial and non-financial performance categories as drivers
of long-term organisational success; they found that financial measures are the most important
category. In terms of non-financial performance measures, the results show that customer measures are
the only non-financial measures that are significantly used to evaluate managerial performance, reward
managers and to identify problems, improve opportunities and develop action plans. The results also
show that on average, operational innovation and quality tend to be moderately used for these purposes.
Finally, supplier and employee performance measures tend not to be used extensively in the
management accounting processes. Ittner, Larcker and Randall (2003) reported that the community
performance category received relatively great importance as a driver of long-term organisational
success.
A survey of data gathered from 122 manufacturers of the top 500 firms in Turkey found that financial
performance measures are used more than non-financial performance measures, and financial and non-
financial performance measures are at an above medium level (Eker & Eker, 2009)
Fakhri (2012), in his study of the application of financial and non-financial performance measures in
the Libyan banking sector, which was to assess the extent to which Libyan banks adopt modern
performance measurement techniques, found that they are still rely on financial
In this study the researcher separated out the financial and non-financial measures for PMS important
and use, and run more regressions to support the PMS results from the questionnaire where was found

254
some elements were more important for others. The results of the performance measurement systems
importance and use show that the non-financial performance measurement systems (innovation) got the
highest mean in both importance and use of PMS (See table 8:6). Therefore, by running the regressions
to investigate the influence of OC types on separated elements of the PMS importance and the PMS
use.
Table 8:6 shows that the highest values of R square in PMS use on the item of non-financial
performance measurement systems (innovation), which were (27.3%). The value of R shows that the
model is fit and this value is of low enough for the acceptance of the model, F statistic is significant at
0.000, which shows the fitness of the model. Therefore organisational culture types (AD, MC, and HC)
are a strong predictor of using non-financial PMS (innovation), and a particular organisational culture
driving this. Those results showed that three of OC types are influenced by the non-financial PMS
(innovation). One the other hand, none of OC types influenced the importance of non-financial PMS
(innovation), see appendix F.
In addition, it can be note in table 8:6 that the OC types influence the all elements of PMS use, and the
F statistic is significant, which shows the fitness of the model, while the OC types do not influence the
all elements of PMS importance.
8.3.3 Research objective Three: Influence and role of Organisational Culture on Performance
Measurement Systems
The third objective, and questions 6, 7, and 8 is to discuss the relationships between the four
organisational culture types of Clan, Adhocracy, Market and Hierarchy Cultures as independent
variables, and their influence on PMS acceptance, importance and use as the dependent variables were
tested by using a multiple linear regression.
8.3.3.1 Results of the Testing Research of Hypotheses
Research hypotheses were designed to be measures to answer the research questions and meet the
research objectives. Seven hypotheses were tested, with the results shown in Table 8:7. The first three
hypotheses considered the dominant organisational culture type with the three variables (PMS
acceptance, importance and use), while the rest of the hypotheses examined the main variables of the
organisational culture types; the research hypotheses (H1- H7) were supported by the empirical test.

255
Table 8:7 Summary of Results of the Research Hypothesis Test
N Hypothesis Results
1 H1: A particular dominating organisational culture type exhibited a
significant positive direct relationship associated with the acceptance
of performance measurement systems in Libyan higher education.
Supported in UNIs
and INSTs.
2 H2: A particular dominating organisational culture type exhibited a
significant positive direct relationship associated with the importance
of performance measurement systems in Libyan higher education.
Supported in UNIs
Only
3 H3: A particular dominating organisational culture type exhibited a
significant positive direct relationship associated with the use
performance measurement systems in Libyan higher education.
Supported in
INSTs Only
4 H4: A Hierarchy culture type will exhibit a significant negative
direct relationship associated with the acceptance, importance and
use of PMS.
Supported in LHEs
in PMS
importance and
use, in UNIs with
PMS acceptance,
importance and
use. In PrUNIs
with PMS use, and
in TCs with PMS
importance
5 H5: A Clan culture type will exhibit a significant positive direct
relationship associated with acceptance, importance and use of PMS.
Supported in with
PMS acceptance,
importance and
use.
6 H6: An Adhocracy culture type will exhibit significant positive Supported in LHEs

256
direct relationship associated with acceptance, importance and use of
PMS.
and PuUNIs with
PMS acceptance
and use, in UNIs
with PMS use.
Supported in
INSTs with PMS
acceptance.
7 H7: A Market culture type will exhibit a significant positive direct
relationship associated with acceptance, importance and use of PMS.
Supported in LHEs
and UNIs with
PMS use, and
supported in
INSTs and PrUNIs
with PMS
importance.
LHEs= Higher education in general, UNIs= Universities, PuUNIs= Public Universities, PrUNIs=
Private Universities, INSTs= Institutions, TCs= Technical colleges
8.3.3.2 Findings Related to the Research Hypotheses of Organisational Culture
The following section will discuss the outcomes arising from the hypotheses tests regarding
organisational culture, which evolved from the research objectives and the internal variables. Table 8:8
shows the findings related to the research hypotheses regarding organisational culture in relation to
PMS acceptance, importance and use. Table 8:8 shows the findings of the relationship between the
dominant organisational culture types and the PMS acceptance (H1), PMS importance (H2) and PMS
use (H3).
Table 8:8 Findings Related to the Research Hypotheses
Category Dominated
culture
Relationshi
p
PMS acceptance
H1
PMS Importance
H2
PMS Use
H3
Higher
education in
general
Hierarchy Correlation 0.115 - 0.036 - 0.057 Significant 0.065 0.566 0.360 Hypothesis Not Supported Not Supported Not Supported Model fit
(R2)
8.3% 0.8% 19.5% Universities Hierarchy Correlation - 0.360 - 0.266 - 0.292

257
Significant 0.003 0.040 0.360 Hypothesis Supported Supported Not Supported Model fit
(R2)
8% 13.6% 12.6% Public
Universities
Hierarchy Correlation -0.238 -0.254 -0.199 Significant 0.107 0.183 0.150 Hypothesis Not Supported Not Supported Not Supported Model fit
(R2)
9.4% 14.6% 4.3% Private
Universities
Clan Correlation 0.258 -0.254 -0.215 Significant 0.088 0.129 0.101 Hypothesis Not Supported Not Supported Not Supported Model fit
(R2)
18% 21.4% 24.3% Institutions Clan
Correlation - 0.347 - 0.095 - 0.432 Significant 0.000 0.228 0.000 Hypothesis Supported Not Supported Supported Model fit
(R2)
30% 3.1% 31.5% Technical
colleges
Hierarchy Correlation 0.110 - 0.178 0.171 Significant 0.583 0.375 0.393 Hypothesis Not Supported Not Supported Not Supported Model fit
(R2)
5.9% 12.6% 13.3%
H1: A particular dominant organisational culture type exhibits a significant positive direct
relationship with the acceptance of performance measurement systems in Libyan higher
education.
The H1 hypothesis is not supported and the dominant organisational culture type does not show a
significant relationship with the acceptance of PMS in Libyan higher education in general. A positive
correlation means that as one variable increases so does the other; therefore when organisational culture
increases so should the PMS acceptance. Since this was not the case, the dominant organisational
culture type, Hierarchy, has a low positive influence on PMS acceptance in Libyan higher education in
general.
Culture has an influence on the acceptance of new systems in organisations; this study explored such
influences on the acceptance, importance and use of PMS in the Libyan context. The acceptance and
use of new PMS can also vary according to different social and cultural contexts, as shown in previous
discussion. In this study, they varied even within the same sector. Thus, organisational culture is
considered to be an important vehicle for implementing organisational change.
A range of studies in the existing literature has indicated a significant positive relationship between
organisational culture and performance measurement systems. The findings of this study are in line
258
with those of the study by Eker & Eker (2009) who found a noticeably positive and significant
relationship between organisational culture and the design and use of performance measurement
systems. Eker & Eker (2009) state that the results of a survey reveal that top managers of Canadian
firms reflecting a flexibility dominant type (Clan) tend to use more performance measures and to use
PMS to focus organisational attention and to support strategic decision-making and legitimate actions
to a greater extent than top managers of firms reflecting a dominant control type.
Ehtesham & Shakil (2011) state that the results of their study indicate that there is a significant positive
relationship between elements of organisational culture and performance management practices.
Ehtesham (2011) reveals that there is a statistically significant difference in the mean for all the OC
types between public and private higher education institutions HEIs, and that the differences are highly
significant.
Lim (1995) found that after a critical review of methodologies and the results of recent research, that
there is a link between culture and performance. Academics and practitioners suggested that the
performance of an organisation depends on the degree to which values of the culture are widely shared
(D. R. Denison, 1990).
Shurbagi and Zahari (2013) found a significant positive relationship between organisational culture and
the use of Management Information Systems (MIS). Shahzad et al, (2012) in their study found that the
results do not show positive correlations between culture and employees’ performance. In their study
the Hierarchy culture shows more dominance in the organisational culture dimensions of the competing
values framework in higher education, especially with regard to most dimensions (dominant
characteristics, organisational leadership, organisation glue and strategic emphases), while the r two
other dimensions (management of employees and criteria of success) reflected Clan culture.
The current study showed that Hierarchy culture is the dominant organisational culture in the Libyan
higher education sector, but the low PMS acceptance rate shows that a hierarchical culture is not
sufficient to ensure this acceptance. This low rate of acceptance is seen as a result of many
organisational culture barriers in this sector. Some organisations deal with highly confidential
information and only a few employees in the organisations have the right to use this information. This
in turn reduces the benefits of sharing information among various levels of management in the
organisation. Some organisations favour structure and control and stress order, standardisation,
efficiency, certainty, and stability, thus reflecting internally oriented and formalised values. Therefore,

259
most of the organisations in the sector will not be keen to adopt PMS. The organisations in this sector
are highly respect rules and resist any changes that may affect the structure and hierarchy of the
organisation. This also contributes negatively to the acceptance of PMS in the sector.
Resistance to change is not always just due to human factors, but may be related to the existing
infrastructure of the organisation (both human and physical). The acceptance of PMS in this sector
faces resistance from people who lack the basic infrastructure needed for PMS acceptance. This sector
suffers from insufficient personnel and expertise to successfully manage and implement PMS. Many
senior executives and decision makers lack the experience and the ability to use sophisticated
computer-based accounting programs for implementing PMS. This limits their understanding of and
enthusiasm for PMS acceptance, (Twati & Gammack, 2006) state that the low rates of computer
literacy at the executive level senior management limit the ability to use computers for daily tasks.
Most employees, including senior executives, resist using computers to generate the necessary
information. Many senior executives prefer, and rely on, old manual systems instead of computerised
systems. Therefore, a systemic relationship between literacy, experience and attitudes strengthens a
slow acceptance rate.
H2: A particular dominant organisational culture type exhibits a significant positive direct
relationship with the importance of performance measurement systems in Libyan higher
education.
The H2 hypothesis is not supported and none of the dominant cultural types (Clan and Hierarchy) are
shown to have a positive relationship with the importance of performance measurement systems (PMS)
in Libyan higher education, Libyan universities, Libyan higher institutions and Libyan technical
colleges (see table 6:4). This means that Clan and Hierarchy have a negative influence on the
importance of PMS, which indicates that when these culture types increase, the importance attached to
PMS in these institutions decrease.
H3: A particular dominant organisational culture type exhibits a significant positive direct
relationship with the use of performance measurement systems in Libyan higher education.
The H3 hypothesis is not supported and the dominant organisational culture type does not show a
positive significant relationship with the use of performance measurement systems in Libyan higher
education (see table 8:8). This means that these types of dominant organisational cultures (Clan and
260
Hierarchy) have a negative influence on the use of performance measurement systems in Libyan higher
education, Libyan universities and Libyan higher institutions, which indicates that when the traits
related to these culture types increase, the use of the performance measurement systems of these
institutions decrease. On the other hand, in Libyan technical collages the dominant organisational
culture type shows a positive but not significant relationship with the use of performance measurement
systems. This finding is in line with the findings of (Ehtesham, 2011; Shurbagi & Zahari, 2013; Twati
& Gammack, 2006), who found that organisational culture did not exhibit a significant positive direct
relationship with the acceptance and use of MIS applications in Libyan oil and bank sectors.
Particularly, both studies found that the Hierarchy culture was the dominant organisational culture.
On the other hand, this finding is not in line with other findings of (Ehtesham, 2011; Shurbagi &
Zahari, 2013; Twati & Gammack, 2006). Ehtesham (2011) pointed out a significant positive
relationship between organisational culture and performance management practices (PMP) in the
University of Pakistan. Shurbagi and Zahari (2013) found that the relationship between
transformational leadership and organisational culture was positive and significant while the dominant
culture in National Oil Corporation NOC of Libya was Hierarchy.
Hoque, et al (2001) in their study based on a sample of 71 business units located in New Zealand's
manufacturing industry, examined the effect of market competition and the implementation of
processes in computer aided manufacturing using multiple performance measures. That study is
relevant to the body of research on contingency theory. The results presented in Hoque et al’s paper
indicate a positive and significant relationship between the intensity of competition in the market and
the use of multiple measures of performance evaluation.
Ji-Young, et al (2011) investigated the correlations and predictors of organisational effectiveness,
focusing on organisational culture and quality of work life using a convenience sample of 145 nurses
working in Korean university hospitals who responded to a self-administered questionnaire; their
findings showed that there were significant correlations between organisational culture, quality of work
life, and organisational effectiveness.
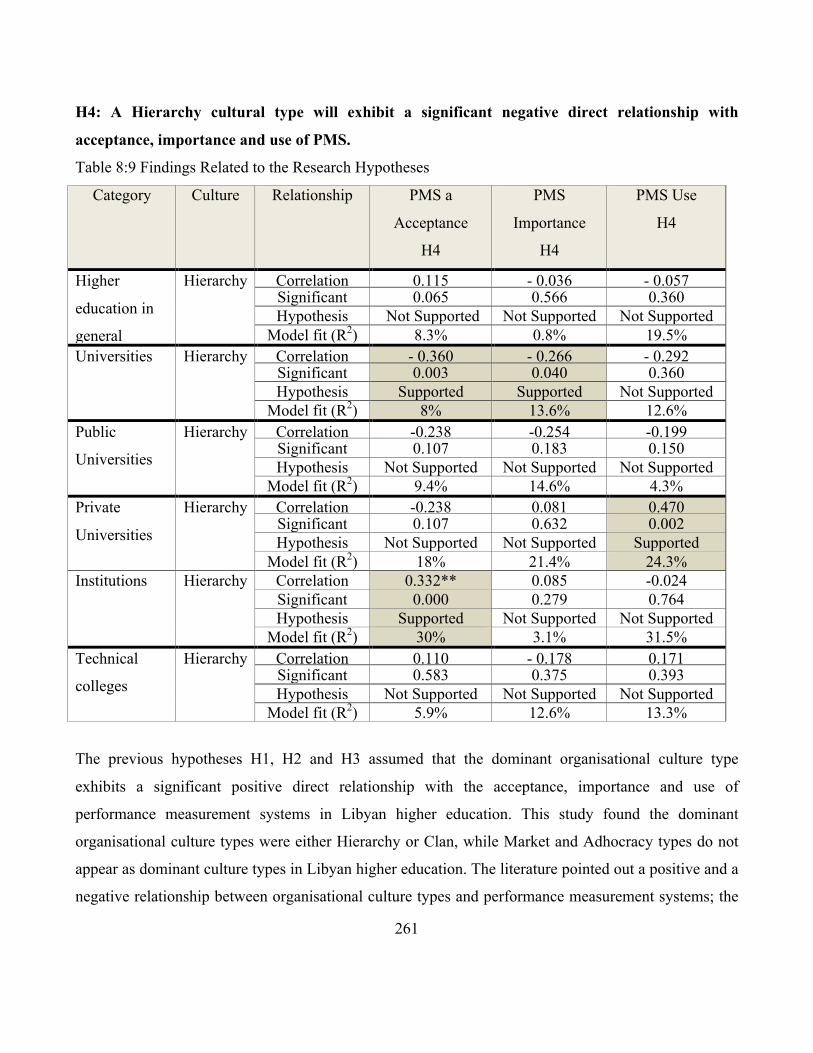
261
H4: A Hierarchy cultural type will exhibit a significant negative direct relationship with
acceptance, importance and use of PMS.
Table 8:9 Findings Related to the Research Hypotheses
Category Culture Relationship PMS a
Acceptance
H4
PMS
Importance
H4
PMS Use
H4
Higher
education in
general
Hierarchy Correlation 0.115 - 0.036 - 0.057 Significant 0.065 0.566 0.360 Hypothesis Not Supported Not Supported Not Supported
Supported Model fit (R2) 8.3% 0.8% 19.5% Universities Hierarchy Correlation - 0.360 - 0.266 - 0.292
Significant 0.003 0.040 0.360 Hypothesis Supported Supported Not Supported
Supported Model fit (R2) 8% 13.6% 12.6% Public
Universities
Hierarchy Correlation -0.238 -0.254 -0.199 Significant 0.107 0.183 0.150 Hypothesis Not Supported Not Supported Not Supported
Model fit (R2) 9.4% 14.6% 4.3% Private
Universities
Hierarchy Correlation -0.238 0.081 0.470 Significant 0.107 0.632 0.002 Hypothesis Not Supported Not Supported Supported
Model fit (R2) 18% 21.4% 24.3% Institutions Hierarchy Correlation 0.332** 0.085 -0.024
Significant 0.000 0.279 0.764 Hypothesis Supported Not Supported Not Supported
Model fit (R2) 30% 3.1% 31.5% Technical
colleges
Hierarchy Correlation 0.110 - 0.178 0.171 Significant 0.583 0.375 0.393 Hypothesis Not Supported Not Supported Not Supported
Model fit (R2) 5.9% 12.6% 13.3%
The previous hypotheses H1, H2 and H3 assumed that the dominant organisational culture type
exhibits a significant positive direct relationship with the acceptance, importance and use of
performance measurement systems in Libyan higher education. This study found the dominant
organisational culture types were either Hierarchy or Clan, while Market and Adhocracy types do not
appear as dominant culture types in Libyan higher education. The literature pointed out a positive and a
negative relationship between organisational culture types and performance measurement systems; the
262
first three hypotheses tested the positive relationship, while H4 and H5 tested the negative relationship
between the variables.
The Hierarchy culture type is the dominant in Libyan higher education in general—in Libyan
universities and in Libyan technical colleges—but it is not dominant in Libyan higher institutions. Thus
H4 is supported and Hierarchy shows a significant negative relationship (p-value<0.003 and correlation
-0.360 and R2 = 8%) with the acceptance of PMS in Libyan universities (see table 6:5).
In addition, the Hierarchy culture type shows a negative relationship with the importance of PMS in
Libyan universities with (p-value<0.040, correlation -0.266 and R2 = 13.6%) as shown in table 6:5.
A significant negative relationship between Hierarchy and PMS use was supported in Libyan higher
education in general; this relationship was positive as regards PMS acceptance but positive and not
supported in PMS importance/ use. In Libyan universities a significant negative correlation relationship
between a Hierarchy culture type and the PMS was supported with PMS acceptance, importance and
use. In Libyan universities the hypothesis is also supported and the dominating organisational culture
type shows a significant negative relationship (p-value<0.003 and correlation -0.360) with PMS
acceptance. A negative correlation is when one variable increases as the other decreases, therefore
when the OC increased, PMS acceptance decreased and the correlation was high and significant.
Therefore, the dominating organisational culture type, which was Hierarchy, has a negative influence
on the PMS acceptance in Libyan universities.
On the other hand, in Libyan technical colleges this hypothesis was not supported in the case of PMS
acceptance, importance and use.
Twati (2006) found that organisations dominated by a Hierarchy culture exhibited a significant
negative direct relationship with the acceptance and use of MIS applications. On the other hand,
(Naranjo-Valencia et al., 2011), in their study of a sample of 471 Spanish companies to analyse the
organisational culture that fosters or inhibits organisational innovation and imitation strategy, found
that Hierarchy culture had a positive effect on imitative orientation.
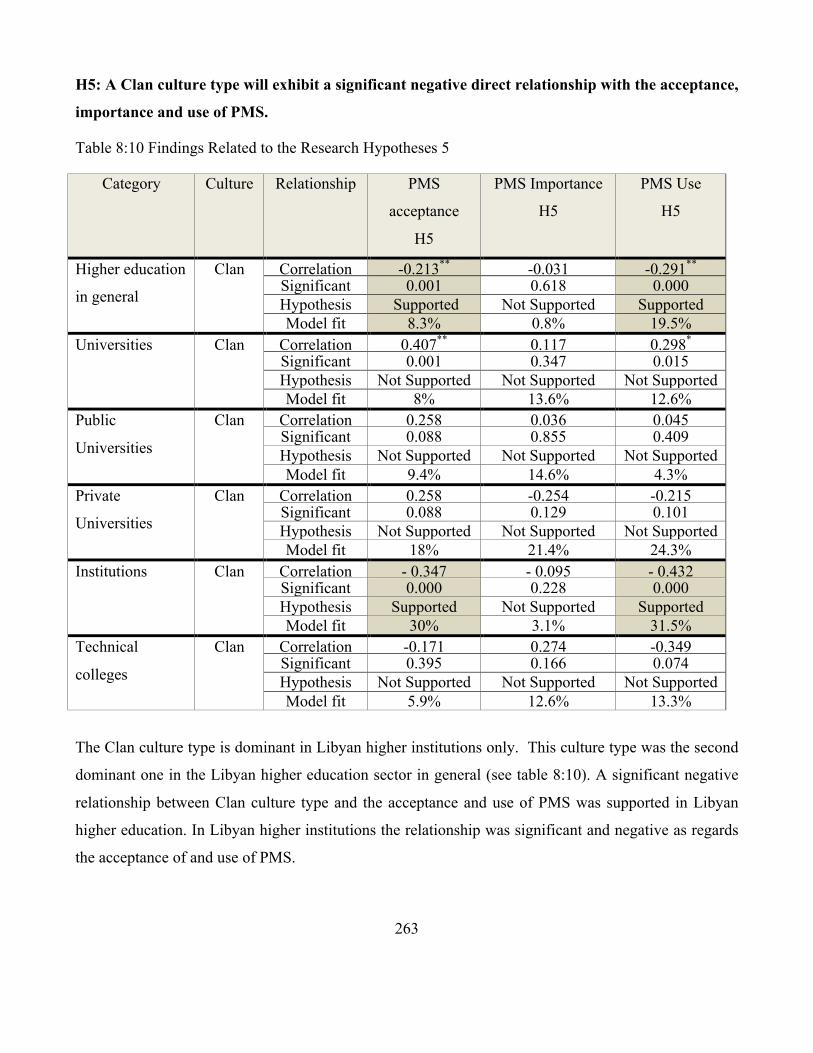
263
H5: A Clan culture type will exhibit a significant negative direct relationship with the acceptance,
importance and use of PMS.
Table 8:10 Findings Related to the Research Hypotheses 5
Category Culture Relationship PMS
acceptance
H5
PMS Importance
H5
PMS Use
H5
Higher education
in general
Clan Correlation -0.213** -0.031 -0.291** Significant 0.001 0.618 0.000 Hypothesis Supported Not Supported Supported Model fit
(R2)
8.3% 0.8% 19.5% Universities Clan Correlation 0.407** 0.117 0.298*
Significant 0.001 0.347 0.015 Hypothesis Not Supported Not Supported Not Supported Model fit
(R2)
8% 13.6% 12.6% Public
Universities
Clan Correlation 0.258 0.036 0.045 Significant 0.088 0.855 0.409 Hypothesis Not Supported Not Supported Not Supported Model fit
(R2)
9.4% 14.6% 4.3% Private
Universities
Clan Correlation 0.258 -0.254 -0.215 Significant 0.088 0.129 0.101 Hypothesis Not Supported Not Supported Not Supported Model fit
(R2)
18% 21.4% 24.3% Institutions Clan Correlation - 0.347 - 0.095 - 0.432
Significant 0.000 0.228 0.000 Hypothesis Supported Not Supported Supported Model fit
(R2)
30% 3.1% 31.5% Technical
colleges
Clan Correlation -0.171 0.274 -0.349 Significant 0.395 0.166 0.074 Hypothesis Not Supported Not Supported Not Supported Model fit
(R2)
5.9% 12.6% 13.3%
The Clan culture type is dominant in Libyan higher institutions only. This culture type was the second
dominant one in the Libyan higher education sector in general (see table 8:10). A significant negative
relationship between Clan culture type and the acceptance and use of PMS was supported in Libyan
higher education. In Libyan higher institutions the relationship was significant and negative as regards
the acceptance of and use of PMS.

264
In other words, Clan culture has an influence on the acceptance and use of performance measurement
systems, but has no influence on the importance of performance measurement systems. The findings of
this study support one part of the hypothesis H5 and this is consistent with Twati (2006), whose study
did not support the hypothesis that the organisations dominated by a Clan culture type exhibit a
significant positive direct relationship with the acceptance and use of management information system
(MIS) applications. Henri (2006) stated that the results of his structural model study suggest that
flexibility values are associated with greater diversity of measurement, which brings support for the
hypothesis that the top management teams of firms reflecting a flexibility dominant type tend to be
associated with a greater diversity of measurement than firms reflecting a control dominant type.
Moreover, this relationship has been described as direct and indirect through the use of PMS, which is
supported by the indirect effect through the use of PMS.
H6: An Adhocracy culture type will exhibit a significant positive direct relationship with the
acceptance, importance and use of PMS.
Table 8:11 Findings Related to the Research Hypotheses 6
Category Culture Relationship PMS
Acceptance
H6
PMS
Importance
H6
PMS Use
H6
Libyan
Higher
Education
Adhocracy Correlation 0.222** 0.086 0.364** Significant 0.000 0.169 0.000 Hypothesis Supported Not Supported Supported Model fit
(R2)
8.3% 0.8% 19.5% Universities Adhocracy Correlation -0.065 0.085 0.054**
Significant 0.603 0.281 0.000 Hypothesis Not Supported Not Supported Supported Model fit
(R2)
8% 13.6% 12.6% Public
Universities
Adhocracy Correlation 0.059 0.308 0.119 Significant 0.762 0.104 0.538 Hypothesis Not Supported Not Supported Not Supported Model fit
(R2)
9.4% 14.6% 4.3% Private
Universities
Adhocracy Correlation -.112 -.152 -0.215 Significant 0.508 0.368 0.380 Hypothesis Not Supported Not Supported Not Supported Model fit
(R2)
18% 21.4% 24.3% Institutions Adhocracy Correlation 0.328** 0.088 -0.054
Significant 0.000 0.483 0.668

265
Hypothesis Supported Not Supported Not Supported Model fit
(R2)
30% 3.1% 31.5% Technical
colleges
Adhocracy Correlation 0.072 0.054 0.011 Significant 0.722 0.788 0.956 Hypothesis Not Supported Not Supported Not Supported Model fit
(R2)
5.9% 12.6% 13.3%
Adhocracy culture type, this culture has shown a significant relationship with some of the Libyan
higher education organisations. The characteristics of the ‘Adhocracy’ culture are focus on external
issues and the value given to flexibility and carefulness. Rather than looking for stability and control,
they value creativity and risk taking. Such organisations have an informal organisational structure.
Moreover, the Adhocracy culture is characterised by an active, entrepreneurial, and creative workplace.
People are enthusiastic about taking risks. The aspect that keeps the organisation together is an
enthusiasm to innovate, and the emphasis is on being at the leading edge of new knowledge,
technology and products, with a willingness to change and accept new challenges that are important for
success.
Libyan higher education in general and its branches in particular were not dominated by Adhocracy
culture. Adhocracy culture is significant and has a direct relationship associated with PMS acceptance
in Libyan higher education and Libyan higher institutions, and a significant relationship with PMS use
in Libyan higher education in general in its branches in particular. This means that Adhocracy culture
is a strong culture and has a positive influence on the acceptance and use of PMS.
H7: A Market culture type will exhibit a significant positive direct relationship associated with
PMS acceptance, importance and use.
Table 8:12 Findings Related to the Research Hypotheses 7
Category Culture Relationship PMS
Acceptance
H7
PMS Importance
H7
PMS Use
H7
Libyan
Higher
Education
Market Correlation -0.041 0.012 0.364** Significant 0.517 0.851 0.000 Hypothesis Not Supported Not Supported Supported
Model fit (R2) 8.3% 0.8% 19.5% Universities Market Correlation 0.137 -0.097 0.524**

266
Significant 0.271 0.216 0.000 Hypothesis Not Supported Not Supported Supported
Model fit (R2) 8% 13.6% 12.6% Public
Universities
Market Correlation 0.053 0.258 0.057 Significant 0.787 0.176 0.770 Hypothesis Not Supported Not Supported Not Supported
Model fit (R2) 9.4% 14.6% 4.3% Private
Universities
Market Correlation -0.056 0.318 -0.218 Significant 0.742 0.055 0.195 Hypothesis Not Supported Supported Not Supported
Model fit (R2) 18% 21.4% 24.3% Institutions Market Correlation -0.229** 0.339** -0.054
Significant 0.003 0.005 0.668 Hypothesis Not Supported Supported Not Supported
Model fit (R2) 30% 3.1% 31.5% Technical
colleges
Market Correlation 0.024 -0.168 0.011 Significant 0.905 0.402 0.956 Hypothesis Not Supported Not Supported Not Supported
Model fit (R2) 5.9% 12.6% 13.3%
Market culture has shown a significant relationship with the use of PMS in Libyan higher education
and in Libyan universities. Moreover, it has a significant direct relationship with PMS importance in
Libyan higher institutions.
As has been explained earlier in this thesis the word Market in this term does not the characteristics of
a marketplace. It is a type of work culture that focuses on the market, product diversity and taking
advantage of opportunities in the market environment. The organisations in this type of culture are also
oriented towards the external environment instead of internal relations. They focus on profit making,
product improvement, the strength of their market position, and customer product bases (K. Cameron
& Quinn, 2011). Most of the organisations in this study are government funded public insitutions;
therefore Market culture, which is more common in private profit-oriented organisations, cannot be
seen in Libyan higher education in general.
In addition, the organisational culture types according to the difference of the job title, position and
level of education have been investigated in this study. Since this questionnaire was aimed at decision
makers who were using performance measurement systems in their organisations, it was important to
understand those characteristics of the respondents that depended on their job title and position, as their
work experience and levels of education level that varied according to these titles and positions.

267
Therefore, this study investigated employees in different job levels of management in organisations
with the same or different organisational culture types.
8.3.3.3 Results of Research Hypotheses Tests The highest level of the job title and position (The President of Organisation, Vice President) share the
same Clan culture type, indicating that they hold similar attitudes, values, and beliefs. On the other
hand, other levels of job title and position (Chief/Assistant Chief/Vice Chief of Finance Department,
Chief/Assistant Chief/Vice Chief of Administrative Department, Financial Controller and Others) share
the same Hierarchy culture. These results are consistent with those of Twati (2006), who states that
employees in different job levels of management have different organisational culture types. However,
this researcher found that senior and middle management share a Clan culture while middle and low
management share a Market culture at Arab Gulf region’s organisational culture profile. While Libya’s
organisational culture profile for the oil and gas sector as well as for the banking sector shows that
employees in different job levels of management have the same organisational culture type, which is
Hierarchy, this research found different results.
The research hypotheses H8, H9, H10 are about the organisational culture types according to the
difference of the job title and position and level of education.
Table 8:13 Summary of Results of the Research Hypothesis Test
N Hypothesis Results
1 H8: The type of organisational culture dominant is different
depending on the type of higher education system.
Supported
2 H9: The type of organisational culture dominant is different
depending on job title and position.
Supported
3 H10: The type of dominant organisational culture is different
depending on level of education and experience.
Supported

268
8.3.3.4 Findings Related to the Research Hypotheses of Organisational Culture in Different Job
Titles, Positions and Levels of Education
Hypothesis 8 was to test whether the dominant organisational culture type differed, according to the
type of higher education system.
H8: The dominant organisational culture is different depending on the type of higher education.
This hypothesis was supported because the type of organisational culture that was dominant varied
according to the type of higher education. The Hierarchy type is dominant in Libyan higher education
in general, that is, in Libyan public universities and Libyan Technical colleges, while the private
universities are dominated by Clan culture. On the other hand, the results show that the dominant
organisational culture types in the institutions in Libyan higher education are the Clan and Hierarchy
cultures.
The study found that the dominant organisational culture was different in Libyan higher education, and
this result is consistent with the previous study of Ramachandran et al. (2011), who found that the
dominant culture was different in private and public Malaysian universities. By contrast, this result is
not consistent with that of Twati & Gammack (2006), who found that the organisational culture profiles
of both the oil and gas and banking sectors of Libyan industry was a Hierarchy culture.
These differences in OC types between the Libyan higher education universities and institutions are as
a result of differences in their objectives, geographical location in the cities or villages and the
university age. In this study has been noted that the public university has different OC type with the
private university, and old universities, institutions have different OC type with the new ones. Public
universities and institutions have a Hierarchy culture type while private universities and institutions
have a Clan culture type. Old universities and institutions, which located in cities, have a Hierarchy
culture type while new institutions, which located in small cities have a Clan culture type (see Table
6:10). The dominant characteristics in all organisational culture types are different for example the
organisation with clan culture type is a very personal place and it is like an extended family. While the
organisation in a hierarchy culture type is a very controlled and structured place and formal procedures
generally govern what people do.
269
H9 was to answer question number 9 which was about whether the culture types differ for different job
titles and positions and levels of education
H9: The type of dominant organisational culture is different depending on job title and position.
Hypothesis 9 was to test whether the employees in different levels of management have different
organisational culture types. Job titles and positions in Libyan higher education tested in this study are:
President, vice president, chief of finance department, assistant / vice chief of administrative
department and assistant/vice financial controller.
This hypothesis was supported, and employees in different levels of management have different
organisational culture types. The highest level as regards job title and position (The President of
Organisation, Vice President) shares the Clan culture type, indicating that they hold similar attitudes,
values, and beliefs. On the other hand, other levels of job title and position (Chief/Assistant Chief/Vice
Chief of Finance Department, Chief/Assistant Chief/Vice Chief of Administrative Department,
Financial Controller and Others) share the Hierarchy culture type.
Some results of this study concur with those Twati (2006) who found that in the Arab Gulf region there
were a differences in OC type according to the job level of oil sector employees, while in the same
study it was found that the employees in the North Africa region share the same organisational culture
type. Also, Henri (2006) who’s his analysis of a population consisting of 2175 Canadian manufacturing
firms concluded that top managers of firms reflect a Clan type culture. The literature has shown the
relationship between the organisational culture, its performance and its leaders. Schein (1992) argues
that organisational leaders create and enforce the culture of the organisation. In many organisations in
this culture, a vast majority of senior management executives who are the creators of organisational
culture impose and prefer a Hierarchy culture. Hierarchy Culture provides them with the authority over
their subordinates in a formal relationship.
H10: The type of dominant organisational culture is different depending on the level of education
and experience.
Hypothesis 10 was to test whether the employees in different levels of management education an
experience have different organisational culture types. Libyan higher education levels tested were
Bachelor’s degree, Post-graduate degree and professional qualifications.
This hypothesis was supported, and there are some differences in the OC type with respect to the level
of education. Employees with Bachelor’s degree qualifications, professional qualifications and other
270
qualifications share a Hierarchy culture. However, those with post-graduate (e.g. MSc, MBA, Ph.D.)
qualifications share a Clan culture and almost all of them are in the highest job titles and positions (The
President, Vice President). In this respect, the results of this study concur with those of Twati (2006),
who found that in the Arab Gulf region there were differences in the OC types among the oil sector
employees according to their education, while the same study found that the employees in the North
Africa region share the same organisational culture type at different educational levels.
Also, employees with different levels of experience have different organisational culture types, and
employees who have been in an organisation for less than one year or for 6-10 years share a Hierarchy
culture, while those who have been in the organisation for 1-5 years and for more than 10 years share a
Clan culture type. This finding does not concur with that of Twati (2006), who found that employees in
different levels of experience in the Arab Gulf region and the North African region share the same
organisational culture types.
8.4 Summary
The quantitative and qualitative results of this study have been discussed in this chapter in relation to
the literature and according to the research aims and objectives that investigated the following:
1- The organisational culture and organisational performance types in higher education in general
and in its branches in particular, depending on the type of higher education.
2- PMS acceptance, importance and use in Libyan higher education.
3- The influential and significance relationships of organisational culture in the acceptance,
importance and use of PMS in both public and private universities and institutions in Libyan
higher education.
4- The organisational culture types according to the difference in the job title and position and
level of education.
It was demonstrated that organisational cultures and the role played by it have affected the acceptance,
importance and use of PMS in Libyan higher education. From the discussions in this chapter, it is
concluded that organisational culture plays a vital role in the acceptance, importance and use of PMS.
Most of the findings of this research support the existing literature, but some specific differences have
also been found. The next chapter presents the conclusions from these findings, their future
implications, and their contribution to theory and practice

271
Chapter 9: Conclusion
9.1 Introduction
This chapter provides a summary of the main findings of the research that relate to the research main
question, and puts forward the conclusions, which may be drawn from these findings.
The first section contains the findings of the research which are presented in ways that show how these
findings meet the research objectives, and the research questions that the researcher proposed at the
beginning of the thesis; the second section identifies and discusses the contribution of this research to
existing knowledge; in the third section the limitations of this research are presented; and finally, in the
fourth section there are some proposals for future research.
The aim of this study was to provide a better understanding of the relationships between organisational
culture and the acceptance, importance and use of performance measurement systems developed for top
management.
The conclusion of this study focuses on the research aim and related objectives and provides answers to
the research questions and hypotheses.
The next section discusses the way in which the aim and the objectives have been achieved. Answers to
the research questions are also provided.
9.2 Research Aim, Objectives and Conclusions
To meet the aim and the objectives, all organisations were selected from Libyan higher education. The
questionnaire survey and the interviews were carried out to gain an understanding of organisational
culture as a contingency theory factor affecting the acceptance, importance and use of PMS within
these institutions. The findings from the survey, and the interviews were compared with the literature to
verify whether what had been predicted was similar to or different from what was illustrated in the
theoretical framework.
The aim of this research was “to investigate the influence of organisational culture on the
acceptance, importance and use of performance measurement systems in Libyan higher education”.
Organisational culture as a factor of contingency theory was applied in this research, and a contingency
theory theoretical framework of performance measurement was adopted to investigate the contingent
272
relationships between different factors in organisational culture and in the acceptance, importance and
use of performance measurement systems.
The contingency theory of performance measurement systems is based on the assumption that there is
no universally appropriate use of performance measurement systems that applies equally to all
organisations in all circumstances, and the findings of this research is consistent with contingency
theory. Therefore, organisational culture as a factor of contingency theory has influence on some
variables of performance measurement systems and does not influence others, and it depends on
organisational circumstances.
Moreover, the aim has been achieved by addressing the research objectives as follows:
The first objective was to identify the dominant organisational culture and organisational performance
types in Libya’s higher education system in general and in its branches in particular, depending on the
type of higher education and ownership. This objective was achieved by using the organisational
culture assessment instrument (OCAI) developed by Cameron and Quinn (1999, 2006), which is based
on the Competing Values Framework (CVF) of Quinn and Rohrbaugh (1981) to investigate the
dominant organisational culture and organisational performance type.
The current dominant organisational culture type for the education sector, public universities, technical
colleges, is a Hierarchy culture type that carried out from the questionnaire survey. Moreover, the
University of Tripoli has a Hierarchy culture type, which the interview method confirm that. These
findings are consistent with those of the studies of (Parker & Bradley, 2000); Trivellas & Dargenidou,
(2009); Twati & Gammack, (2006) and Zahari & Shurbagi, (2012). A Hierarchy culture focuses on
internal maintenance and strives for stability and control in organisational performance through the
establishment of clear tasks and compliance with strict rules. Therefore, it tends to adopt a formal
approach to relationships within the organisation, in which leaders have to be good organiser and
coordinator. Thus, they will not be keen to change. This is especially relevant since there is no
competition between organisations in Libya, where the government owns everything.
The dominant organisational culture type for higher institutions and private universities in Libyan
higher education is Clan culture. Clan culture is typical of organisations that focus on internal
maintenance with flexibility of organisational performance, concern for people, and sensitivity to
customers. Emphasis is placed on human relations and the acceptance of flexible operating procedures
regarding internal relationships. The core values include cooperation, consideration, agreement, justice
273
and social equality. Such an organisation is generally a very pleasant place to work where people share
a lot of themselves. It is like a big family where leaders are seen as mentors, and where loyalty and
tradition keep the organisation together. This result is consistent with the previous studies of Abousaber
& Papazafeiropoulou, (2011); Florida & Kenney, (1991); Henri, (2006); (Abousaber &
Papazafeiropoulou, 2011; Florida & Kenney, 1991; Henri, 2006; Thomas et al., 2002).
On the other hand, none of the Libyan higher education organisations were dominated by Market or
Adhocracy cultures, and these cultures got the third and fourth mean results rank after the Clan and
Hierarchy (see table 6:9). Respondents in Libyan higher education organisations did not show the in
their organisations of Adhocracy culture, which focuses on external issues and values creativity,
flexibility and risk taking, rather than stability and control. Such organisations have an informal
organisational structure. Moreover, Adhocracy culture is characterised by an active, entrepreneurial,
and creative workplace. People are enthusiastic about taking risks. The ideal that keeps the organisation
together is an enthusiasm to innovate, and the emphasis is on being at the leading edge of new
knowledge, technology and products, and on being willing to change and accept that new challenges
are important for success (K. Cameron & Quinn, 2011).
Libyan higher education organisations do not have the characteristics of a Market culture, which is seen
in organisations that focus on the market, product diversity and opportunities in the market
environment. This design is known as a form of Market organisation. The organisations with this type
of culture are also oriented towards the external environment instead of internal relations. They focus
on profit-making, product improvement, the strength of their market position, and customer product
bases (K. Cameron & Quinn, 2011).
Most Libyan education is public and uses government funding; therefore, the Market culture is not
likely to be one of the dominant cultures in Libyan higher education.
The second objective was to identify the extent of the acceptance, importance and use of performance
measurement systems. This objective was achieved by using a fixed set of PMS categories (financial,
non-financial and advanced techniques) as well as the effectiveness and usefulness of using PMS to
evaluate performance.
The respondents were asked about the use of (and the effectiveness of) financial, non-financial, and
advanced techniques (like the balanced scorecard) as PMS categories to evaluate organisational

274
performance. The respondents agreed that the balanced scorecard is useful in Libyan higher education;
it was considered to be a successful tool for use for higher education with mean value above 3 (i.e.
moderately used) in the questionnaires. On the other hand, ‘using financial PMS to evaluate
organisational performance’ got the second rank even though the most of the Libyan educational
institutions are non profit, government-funded organistions. In the ‘importance’-related questions, the
second rank went to ‘non-financial performance measurement systems /employee’ (e.g. employee
satisfaction, workforce capabilities, etc.), and employee satisfaction appears to be the second most
important criterion for assessing organisational performance in non-financial terms.
To sum up, it can be noted that what is considered important, though not necessarily used. Only in the
case of ‘non-financial performance measurement systems /innovation’ both ‘importance’ and ‘used’
got the same rank. As for ‘PMS importance’, the first three ranks were for non-financial PMS and the
fourth rank was for financial, while in case of ‘PMS use’, financial PMS got the second rank (see table
6:2).
More investigation has been done for PMS importance and use, by running a regression test for
separated elements. The results shows that the highest values of R square in PMS use on the item of
non-financial PMS (innovation), that mean the OC types (see table 8:5) have an influence on the use of
PMS. Organisational culture types (AD, MC, and HC) are a strong predictor of using non-financial
PMS (innovation), and a particular organisational culture driving this. These results showed that the
three types of OC are influenced the non-financial PMS (innovation). One the other hand, none of OC
types influenced the importance of non-financial PMS (innovation). To sum up the OC types have
more influence on the PMS use than on the PMS importance, and the Libyan higher education use less
PMS than what they agree are important to their organisation these results could be related to the
following reasons:
1- PMS has been seen as an increasingly bureaucratic process. Organisations should make their
systems more aligned to their companies’ culture and strategy and improving how they engage
their employees to choose the most important PMS.
2- The nature of work has changed after the new Libyan revolution because of the change of
regime. The workforce should be evolving as employees, to get the opportunity for
development and coaching and organisations should use technology to use the PMS effectively.
275
3- Embedding cultural change and rebuilding trust in some sectors to change aspects of their
organisational culture. Performance management can support this change by making sure that
the desired behaviours and goals are mapped into the PMS.
Libyan higher education administration must identify the barriers to the use of PMS even though there
are fewer PMS used that are agreed to be important
The third objective was to investigate the influence and relationships between the four organisational
culture types of Clan, Adhocracy, Market and Hierarchy, and the (PMS) acceptance, importance and
use of performance measurement systems. This thesis extends previous management accounting
literature using a contingency approach and prior research on PMS, by examining the influence of
organisational culture on the acceptance, importance and use of one component of management control
systems, namely performance measurement.
A particular dominant organisational culture type (Hierarchy and Clan) exhibited a significant positive
direct relationship with performance measurement systems acceptance in Libyan higher education,
Libyan universities and Libyan higher institutions. It showed no influence in the case of Libyan
technical colleges, and influenced ‘performance measurement systems (importance)’ only in Libyan
universities. In the case of ‘performance measurement systems (use)’, it showed influence in Libyan
universities and Libyan higher institutions, while not influencing Libyan technical colleges and Libyan
higher education in general. Based upon the results of the hypothesis testing, which showed in the case
of PMS acceptance, Hierarchy seemed to significantly influence the Libyan education sector in general
and the other two types of Libyan higher education. On the other hand, this dominant culture type does
not have a significant relationship with all Libyan higher education types in the case of PMS
importance and use. Such findings could encourage higher education to accelerate its efforts to adopt
such tools, in order to increase its effectiveness and global competitiveness.
Cameron and Quinn (1999) stated that most organisations progress from an initial Clan culture to a
Hierarchy culture. Some organisations look for stability and control, and focus more on the internal
issues to keep their organisation going; thus, they will not be keen to change. This is especially relevant
since there is no competition between organisations in Libya, where the government owns everything.
Overall, this study shows different results in Libyan higher education organisations in terms of the
acceptance, importance and use of PMS. When PMS related literature is reviewed, it is seen that
different cultural environments could require a different PMS to increase organisational success.
276
Therefore, managers have to define organisational culture and design PMS convenient to the existing
organisational culture, because if there is an incompatibility between PMS and organisational culture, a
designed system can never achieve any success for business. Thus, top management must provide PMS
appropriate to the needs of decision-making and organisational culture. Moreover, the results suggest
that the behaviour and attitude of the respondents are influenced by the dominate organisational culture
types (Clan and Hierarchy), and organisations should shift from the Clan and Hierarchy cultures types
to other cultures types that have a positive influence on PMS acceptance, importance and use to
evaluate the organisational performance of their institutions.
Also, this objective was to investigate the employees in different levels of management, who have the
same or different organisational culture types. The hypotheses were tested, and the results showed that
the type of organisational culture that is dominant varies depending on various factors: the type of
higher education system, job title and position, and level of education and experience.
The Hierarchy type is dominant in Libyan higher education in general, and in Libyan public
universities and Libyan Technical colleges, while the private universities are dominated by the Clan
culture. On the other hand, Clan culture is dominant in higher institutions in Libyan higher education.
The dominant organisational culture depends on job title and position, and different levels of
management have different organisational culture types. The highest level (The President of the
Organisation, Vice President) shares the Clan culture type. On the other hand, other levels
(Chief/Assistant Chief/Vice Chief of Finance, Chief/Assistant Chief/Vice Chief of Administrative
Department, Financial Controller and Others) share the Hierarchy culture type.
The dominant organisational culture is different depending on level of education and experience.
Employees with Bachelor’s degree qualifications, professional qualifications and other qualifications
share a Hierarchy culture. However, those with post-graduate (e.g. MSc, MBA, Ph.D.) qualifications
share a Clan culture and almost all of them are at the highest level of job title and position (The
President of Organisation, Vice President) and share a Clan culture. Also, employees with different
levels of experience have different organisational culture types, and employees who have an experience
of less than one year and of 6-10 years share a Hierarchy culture while those with an experience of 1-5
years and of more than 10 years share a Clan culture.
277
9.3 Research contributions
The research contribution has two perspectives: theory and knowledge; and empirical and practical.
The main contributions of this study are as follows:
9.3.1 Contributions to Knowledge and Theory
Research on cultural influences on performance measurement systems to date has been very limited
for developing countries. Moreover, no previous studies incorporate organisational culture and PMS
acceptance, importance and use. Therefore, this study has generally contributed to the literature on
management accounting in general and to the performance measurement systems gap in particular; it
also has specific implications for researchers and practitioners.
Firstly, there is a the scarcity of literature in organisational culture and performance measurement
systems studies throughout the developing countries, and throughout the higher education sector; this
study attempts to fill part of this gap by identifying the different types of organisational culture within
the higher education sector, either neglected or conflated in previous studies. Secondly, this study has
produced results based on contingency theory and a defined conceptual model of organisational culture,
employing it in the Libyan education sector to understand the influence of OC on PMS acceptance,
importance and use, this study has thus provided a theoretical contribution to existing knowledge by
expanding the concept of organisational culture to answer the research questions. Thirdly, this study is
perhaps the first to compare three higher education types in relation to PMS acceptance, importance
and use, and four organisational culture variables. Fourthly, this study found that even in the same
sector organisational culture types were different, when previous studies in the Libyan context found
that different sectors have the same organisational culture type. Finally, the study supports the
contingency theory that there is no universally appropriate system applying equally to all organisations
in all circumstances; it has demonstrated that the influence of organisational culture on PMS
acceptance, importance and use of performance differed according to different circumstances.
The findings could be used to design a PMS framework according to organisational culture type for
each type of higher education. For example Libyan universities have hierarchy culture type which is
controlled and structured place, while the Libyan institutions have a clan culture type which has
flexibility and discretion because of these different types of characteristics, therefore these findings
could be used to design a PMS framework and this relate to contingency theory in that there is no
universally appropriate system applying equally to all organisations in all circumstances.

278
9.3.2 Empirical and Practical Contributions
One of the advantages of the study is that it has investigated the Libyan education sector by using a
contingency theory factor.
Firstly, this study has applied this theory to the education sector in Libya, a developing country that has
context and culture different from those in which most previous studies have been conducted; these
previous studies have all been in developed and western countries, and in sectors other than education.
Secondly, this study is an empirical test of the contingency theory, as it achieved results in an
investigation of the influence of a contingency theory factor (organisational culture) on the acceptance,
importance and use of performance measurement systems in Libyan higher education. Thirdly, the
study investigated financial and non-financial performance measurement systems that can be applied in
higher education. Fourthly, this research study may draw attention to the influence of organisational
culture on performance measurement systems; Culture, regardless of how powerfully it may be
established, it is not stable or fixed, but may be changed and affected by its environment. Finally, this
study being the most recent to investigate the organisational culture profile within Libya, it contributes
to the most contemporary insight into which cultural values are operating within this society; the
findings of this study could be used for designing a PMS framework to be implemented in Libyan
higher education.
9.4 Limitations
There are several limitations in this research study: they should be taken into account in any schema for
further research. These limitations can be summarized as follows:
1- The respondents were Libyans, so the findings are limited only to the context of Libya, and
reflect only the views of the participants residing in Libya. These views are affected by the
culture, rules and structure of the country. Consequently, the results cannot be extended or
generalised to other countries; studies of originations operating in different social, political and
economic environments may obtain other results.
2- The sample was composed of only top managers of Libyan higher education sector. Therefore,
a more comprehensive sample may be useful for future studies.
3- The absence of similar studies in Libyan higher education prevented the researcher from
assimilating thesis findings of this research with those of other studies. Although this is a

279
restriction, it is at the same time one of the assets of this study; as mentioned earlier this may be
the first attempt to explore the influence of OC on PMS in Libyan higher education. Therefore,
the findings of this study invite other researchers to use and extend them.
4- The current study adopted a cross-sectional design, and was conducted at one point in time.
This cross-departmental study therefore represents only one timeframe.
9.5 Future Studies
This study could point to many interesting areas that could be explored in further research, and as such
it represents a beginning rather than an end. Clearly, more research on PMS in the service sectors is
needed. The suggestions are as follows:
1- As this study concentrated only on the Libyan higher education sector, it is recommended that
future efforts should involve other sectors in order to learn whether a generalisation of the
findings is possible beyond their setting.
2- As this study focused on the Libyan higher education sector, it is recommended that the
methodology be used with other higher education institutions in countries with a similar culture
(i.e. other Arab countries) in order to conduct a comparative analysis and facilitate the
development of a deeper understanding of the topic in the Arab world.
3- In this context, future research may test how sub dimensions of BSC and the use of PMS affect
organisational performance, depending on four different types of organisational culture.
4- Future research may be designed to compare the findings in this study with findings that relate
to organisations in other countries.
5- This outlook suggests that organisations can implement management practices that foster job
security and internal career development in order to keep turnover low, and maintain those
social phenomena that comprise organisational culture (values, beliefs, norms, assumptions)
within the organisation, and thus form a strong organisational culture.
280
Reference:
Abousaber, Inam, & Papazafeiropoulou, Anastasia. (2011). The Impact of Organisational Culture on Wimax Adoption by Saudi SMEs. Paper presented at the European, Mediterranean & Middle Eastern Conference on Information Systems (EMCIS2011), Athens, Greece.
Abouzar, Zangoueinezhad, & Asghar, Moshabaki. (2011). Measuring university performance using a knowledge-based balanced scorecard. International Journal of Productivity and Performance Management, 60(8), 824-843. doi: 10.1108/17410401111182215
Abraham, Y. Nahm, Mark, A. Vonderembse, & Xenophon, A. Koufteros. (2004). The Impact of Organizational Culture on Time-Based Manufacturing and Performance. Decision Sciences, 35(4), 579-607. doi: 10.1111/j.1540-5915.2004.02660.x
Abugalia, Muftah S. (2011). The Influence of Business Environment on the Effectiveness of Management Accounting Practices Evidence from Libyan Companies AuthorCombined. University of Huddersfield Huddersfield.
Adler, Nancy J. (1983). Cross-Cultural Management Research: The Ostrich and the Trend. The Academy of Management Review, 8(2), 226-232.
Adler, Nancy J., & Graham, John L. (1989). Cross-Cultural Interaction: The International Comparison Fallacy? Journal of International Business Studies, 20(3), 515-537. doi: 10.1057/palgrave.jibs.8490367
Adriana, Rejc. (2004). Toward Contingency Theory of performance measurement. Journal for East European Management Studies, 9(3), 243.
Agnaia, Almehdi A. (1997). Management training and development within its environment: the case of Libyan industrial companies. Journal of European Industrial Training, 21(3), 117-123.
Al Sawalqa, Fawzi Ata Hamdan. (2011). The Changing Role of Management Accounting: Assessment of the Impact of Financial and Non-Financial Performance Measures Usage on Organizational Performance in Jordan. (PhD), Murdoch University, Perth, Western Australia.
Al-Hussari, Huda. (2006). The influence of contextual factors on cost system design and pricing decisions : a study of UK companies in the food processing and other industries. Dissertation/Thesis.
Al-Turki, U., & Duffuaa, S. (2003). Performance Measures for Academic Departments. The International Journal Education Management, 17(7), 330-338.
Ali, Balnoor Aldokaly. (2006). The reality of higher education and the requirements of development in Libya. Daar Alkotb Awatania, 185-215.
Ali Mohammad Mosadegh, Rad. (2006). The impact of organizational culture on the successful implementation of total quality management. The TQM Magazine, 18(6), 606-625. doi: 10.1108/09544780610707101
Aljaz, Stare. (2011). The Impact Of The Organisational Structure And Project Organisational Culture On Project Performance In Slovenian Enterprises. Management : Journal of Contemporary Management Issues, 16(2), 1.
Aljaz, Stare. (2012). The impact of a project organisational culture and team rewarding on project performance. Journal for East European Management Studies, 17(1), 40.
Amaratunga, Dilanthi, & Baldry, David. (2003). A conceptual framework to measure facilities management performance. Property Management 21(2), 171-189.
American, Accounting Association. (1975). Report of the Committee on Non-Financial Measures of Effectiveness, American Accounting Association. Sarasota,Flo.
281
Amir, Amizawati Mohd, Ahmad, Nik Nazli Nik, & Mohamad, Muslim Har Sani. (2010). An investigation on PMS attributes in service organisations in Malaysia. International Journal of Productivity and Performance Management, 59(8), 734-756.
Archambault, Marie E., & Archambault, Jeffrey J. (2003). A multinational test of determinants of corporate disclosure. International Journal of Accounting, 38(2), 173-194. doi: 10.1016/S0020-7063(03)00021-9
Armstrong, Michael, & Baron, Angela. (2000). Strategic HRM : the key to improved business performance London: Chartered Institute of Personnel and Development.
Awasthi, V. N., Chow, C. W., & Wu, A. (1998). Performance measure and resource expenditure choices in a teamwork environment: the effects of national culture. Management Accounting Research, 9(2), 119-119.
Babbie, Earl. (1998). The practice of social research. London: Wadsworth. Beard, Deborah F. (2009). Successful Applications of the Balanced Scorecard in Higher Education.
Journal of Education for Business, 84(5), 275-282. Belasen, A. (2007). The theory and practice of corporate communication; a competing values
perspective. Reference and Research Book News, 22(4). Belasen, A, & Frank, N. (2004). The perceptions of human resource managers of the shifting
importance of managerial roles in downsizing organisations. International Journal of Human Resources Development and Management, 4(2), 144-144. doi: 10.1504/IJHRDM.2004.004976
Belasen, A, & Rufer, R. (2007). Building A Competency-Based Mba From The Ground Up: Curriculum Design And Program Delivery. Academy of Management Annual Meeting Proceedings 8(1), 1-6. doi: 10.5465/AMBPP.2007.26508154
Belkaoui, Ahmed. (1992). Accounting theory. London: Academic Press. Belkaoui, Ahmed. (1997). Research perspectives in accounting. Westport, Conn: Quorum. Berrio, Angel A. (2003). An Organizational Culture Assessment Using the Competing Values
Framework: A Profile of Ohio State University Extension. Journal of Extension, 41(2). Bititci, Umit S., Mendibil, Kepa, Nudurupati, Sai, Garengo, Patrizia, & Turner, Trevor. (2006).
Dynamics of performance measurement and organisational culture. International Journal of Operations & Production Management, 26(12), 1325-1350. doi: 10.1108/01443570610710579
Bititci, Umit S., Turner, U Trevor, & Begemann, Carsten. (2000). Dynamics of performance measurement systems. International Journal of Operations & Production Management, 20(6), 692-704.
Boglarsky, Cheryl A., & Kwantes, Catherine T. (2007). Perceptions of organizational culture, leadership effectiveness and personal effectiveness across six countries. Journal of international management, 13(2), 204-230.
Bourne, Mike, Kennerley, Mike, & Franco-Santos, Monica. (2005). Managing through measures: a study of impact on performance. Journal of Manufacturing Technology Management, 16(4), 373-395. doi: 10.1108/17410380510594480
Bourne, Mike, Mills, John, Wilcox, Mark, Neely, Andy, & Platts, Ken. (2000). Designing, implementing and updating performance measurement systems. International Journal of Operations & Production Management, 20(7), 754-771.
Bresnen, M, & Marshall, N. (2000). Problems in construction: a critical review of issues, problems and dilemmas. . Construction Management and Economics 18, 229-237.
282
Broad, Martin, & Goddard, Andrew. (2010). Internal performance management with UK higher education: an amorphous system? Measuring Business Excellence, 14(1), 60-66. doi: 10.1108/13683041011027454
Brookes, Ian A. (2001). Aeolian erosional lineations in the Libyan Desert, Dakhla Region, Egypt. Geomorphology, 39(3), 189-209.
Brown, Andrew D. (1995). Organisational culture. London: Pitman. Bruns, William J., & Waterhouse, John H. (1975). Budgetary Control and Organization Structure.
Journal of Accounting Research, 13(2), 177-203. Bryman, Alan, & Bell, Emma. (2007). Business research methods. Oxford: Oxford University Press. Bryman, Alan, & Bell, Emma. (2011). Business research methods. Oxford: Oxford University Press. Bryman, Alan, & Cramer, Duncan. (2005). Quantitative data analysis with SPSS 12 and 13: a guide
for social scientists. London: Routledge. Burgess, T. F., Ong, T. S., & Shaw, N. E. (2007). Traditional or contemporary? The prevalence of
performance measurement system types. International Journal of Productivity and Performance Management, 56(7), 583-602.
Burns, Tom E. , & Stalker, G.M. (1961). The Management of Innovation University of Illinois at Urbana-Champaign's Academy for Entrepreneurial Leadership Historical Research Reference in Entrepreneurship.
Burrell, Gibson, & Morgan, Gareth. (1979). Sociological Paradigms and Organizational Analysis Elements of the Sociology of Corporate Life. Rahmatri Mardiko & Albert Kurniawan, 1(3), 1-5. Buttermann, Garry, Germain, Richard, & Iyer, Karthik N. S. (2008). Contingency theory "fit" as
gestalt: An application to supply chain management. Transportation Research Part E, 44(6), 955-969.
Cameron , K, & Quinn, R. (1999). Diagnosing and Changing Organizational Culture: Based on the Competing Values Framework: Jossey-Bass A Wiley Imprint.
Cameron , K, & Quinn, R. (2006). Diagnosing and Changing Organizational Culture: Based on the Competing Values Farmework (Revised Edition ed.). New York: Jossey-Bass.
Cameron, K, & Quinn, R. (2011). Diagnosing and Changing Organizational Culture: Based on the Competing Values Farmework: John Wiley & Sons.
Cameron, Kim S., & Quinn, Robert E. (1991). Cultural Congruence, Strength, and Type: Relationships to Effecteness. Research in Organisational Change and Development by JAI Press Inc, 5, 23-58.
Campbell, John P, Brownas, Edward A, Peterson, N. G, Dunnette, Marvin, & D. P, Norton. (1974). The Measurement of Organizational Effectiveness: A Review of Relevant Research and Opinion. Minneapolis: Navy Personnel Research and Development Center, Personnel Decisions, .
Cartwright, Sue, & Cooper, Cary L. (1996). Managing mergers, acquisitions and strategic alliances: integrating people and cultures. Oxford: Butterworth Heinemann.
Chan, Yee-Ching Lilian. (2004). Performance measurement and adoption of balanced scorecards: A survey of municipal governments in the USA and Canada. International Journal of Public Sector Management, 17(3), 204-221. doi: 10.1108/09513550410530144
Chee, W. Chow, Tim, M. Lindquist, & Anne, Wu. (2001). National Culture and the Implementation of High‚ÄêStretch Performance Standards: An Exploratory Study. Behavioral Research In Accounting, 13(1), 85-109. doi: 10.2308/bria.2001.13.1.85

283
Chen, Shun-Hsing, Yang, Ching-Chow, & Shiau, Jiun-Yan. (2006). The application of balanced scorecard in the performance evaluation of higher education. The TQM Magazine, 18(2), 190-205.
Chenhall, R. H., & Langfield-Smith, K. (1998). Adoption and benefits of management accounting practices: an Australian study. Management Accounting Research, 9(1), 1-1.
Chenhall, Robert H. (2003). Management control systems design within its organizational context: findings from contingency-based research and directions for the future. Accounting, Organizations and Society, 28(2), 127-168. doi: 10.1016/s0361-3682(01)00027-7
Child, John. (2008). Culture, contingency and capitalism in the cross-national study of organizations. (Journal Article), 227-269.
Cho, Eunseong, & Lee, Mushin. (2005). An exploratory study on contingency factors affecting R&D performance measurement. International Journal of Manpower, 26(6).
Chow, C. (2002). The organizational culture of public accounting firms: evidence from Taiwanese local and US affiliated firms. Accounting, Organizations and Society, 27(4-5), 347-360.
Cohen, Sandra, Thiraios, Dimitris, & Kandilorou, Myrto. (2008). Performance parameters interrelations from a balanced scorecard perspective. Managerial Auditing Journal 27(5), 485-503.
Collis, Jill , & Hussey, Roger. (2009). Business research: a practical guide for undergraduate & postgraduate students. Basingstoke: Palgrave Macmillan.
Collis, Jill, & Hussey, Roger. (2003). Business research: a practical guide to undergraduate and postgraduate students. Basingstoke: Palgrave Macmillan.
Cooper, Donald R., & Schindler, Pamela S. (2008). Business research methods. New York: McGraw-Hill/Irwin.
Covaleski, Mark A., Dirsmith, Mark W., & Samuel, Sajay. (1996). Managerial accounting research: The contributions of organizational and sociological theories. Journal of Management Accounting Research, 8(Journal Article), 1.
Cravens, Karen S., & Oliver, Elizabeth Goad. (2000). The influence of culture on pension plans. International Journal of Accounting, 35(4), 521-537.
Creswell, John W. (2009). Research design: qualitative, quantitative, and mixed methods approaches. Los Angeles, Calif: SAGE.
Daft, Richard L. (2001). Organization theory and design: South-Western College Publishing. Davis, Fred D. (1986). A technology acceptance model for empirically testing new end-user
information systems: Theory and results ((Doctoral dissertation, Massachusetts Institute of Technology).).
Davis, Fred D. (1989). Perceived Usefulness, Perceived Ease of Use, and User Acceptance of Information Technology. MIS Quarterly, 13(3), 319-340.
De Vaus, D. A. (2002). Surveys in social research. Abingdon: Routledge. Deal, Terrence E., & Kennedy, Allan A. (1983). Corporate cultures: The rites and rituals of corporate
life (Vol. 26, pp. 82-85): Elsevier Inc. Debusk, Gerald k., & Crabtree, Aaron D. (2006). Does the Balanced Scorecard Improve Performance?
Management Accounting Quarterly, 8(1), 44-48. DeLong, D.W, & Fahey, Liam. (2000). Diagnosing Cultural Barriers to Knowledge Management. The
Academy of Management Executive, 14(4), 113-127.
284
Denison, Daniel , Haaland, Stephanie, & Goelzer, Paulo. (2003). Corporate Culture And Organizational Effectiveness: Is There A Similar Pattern Around The World? (Vol. 3, pp. 205-227): Emerald Group Publishing Limited.
Denison, Daniel R. (1984). Bringing Corporate Culture to the Bottom Line. Organizational Dynamics, 13(2), 4.
Denison, Daniel R. (1990). Corporate Culture and Organisational Effectiveness. New York: Wiley. Denison, Daniel R. (2000). Organizational Culture: Can it be a Key Lever for Driving Organizational
Change? Denzin, Norman K, & Lincoln, Yvonna S. (2005). The Sage handbook of qualitative research.
Thousand Oaks, Calif: Sage. Deshpande, Rohit, Farley, John U., & Webster, Frederick E. (1993). Corporate Culture, Customer
Orientation, and Innovativeness in Japanese Firms: A Quadrad Analysis. Journal of Marketing, 57(1), 23-37.
Detert, James R., Schroeder, Roger G., & Mauriel, John J. (2000). A Framework for Linking Culture and Improvement Initiatives in Organizations. The Academy of Management Review, 25(4), 850-863.
Dixon, J. Robb, Nanni, Alfred J., & Vollmann, Thomas E. (1990). The new performance challenge: measuring operations for world-class competition. Homewood, Ill: Dow Jones-Irwin.
Douglas, M. (1989). Culture and collective action In The Relevance of Culture. New York: Bergin & Garvey.
Doupnik, Timothy S., & Salter, Stephen B. (1995). External environment, culture and accounting practice: A preliminary test of a general model of international accounting development. The International Journal of Accounting, 30(3), 189.
Druckman, Daniel, Singer, Jerome E., & Harold Van Cott. (1997). Enhancing Organizational Performance: National Academies Press.
Easterby-Smith, Mark, Thorpe, Richard, & Jackson, Paul R. (2008). Management research. London: SAGE.
Easterby-Smith, Mark, Thorpe, Richard, & R.Janckson, Paul. (2002). Management research. London: SAGE.
Education, Ministry of Higher. (2011). Higher Education in Libya, statistics and indicators Information and Documentation Center: Ministry of Higher Education.
Ehtesham, U. M., Muhammad, T. M., & Muhammad, S. A. (2011). Relationship between Organizational Culture and Performance Management Practices. A Case of University in Pakistan. Journal of Competitiveness.
Ehtesham ul, Mujeeb, & Muhammad Shakil, Ahmad. (2011). Impact of Organizational Culture on Performance Management Practices in Pakistan. International Management Review, 7(2), 52.
Eker, Melek, & Eker, Semih. (2009). An Empirical Analysis of the Association between the Organizational Culture and Performance Measurement Systems in the Turkish Manufacturing Sector. Journal of Economic and Social Research, 11(2), 43-76.
El-Fathaly, O. (1977). The Social, Economic, and Historical Milieus. Elferjani, M., Ruddock, L., Khashkhush, A., & Elmsallati, N. . (2011). Evaluation of Training
Programmes Provided for the Academic Staff of Libyan Universities (Case Study: Tripoli University Tripoli, Libya. Paper presented at the Methodological Perspective. In Salford Postgraduate Annual Research Conference

285
Elmore, Patricia B., & Beggs, Donald L. (1975). Salience of concepts and commitment to extreme judgments in the response patterns of teachers. Education, 95(4), 325-334.
Emmanuel, Clive R., Merchant, Kenneth, & Otley, David T. (1990). Accounting for management control: Chapman and Hall.
Everitt, Brian S. . (2002). Variance Inflation Factor (pp. 389). Cambridge, United Kingdom: Cambridge University Press.
Fakhri, Gumma. (2012). The Impact of Contingent Factors on the Use of Performance Measurement System in the Banking Industry in Developing Countries. Journal of Performance Management, 24(2), 45.
Field, Andy P. (2009). Discovering statistics using SPSS: and sex and drugs and rock 'n' roll. Los Angeles, [Calif.]: SAGE.
Florida, Richard, & Kenney, Martin. (1991). Transplanted Organizations: The Transfer of Japanese Industrial Organization to the U.S. American Sociological Review, 56(3), 381-398.
Foster, Jeremy. (2002). Data Analysis Using SPSS for Windows. Fryer, Karen, Antony, Jiju, & Ogden, Susan. (2009). Performance management in the public sector.
International Journal of Public Sector Management, 22(6), 478-498. doi: 10.1108/09513550910982850
Garengo, Patrizia, & Bititci, Umit. (2007). Towards a contingency approach to performance measurement: an empirical study in Scottish SMEs. International Journal of Operations & Production Management, 27(8), 802-825.
Gaster, L. (1995). Quality in Public Services. Buckingham: Open University Press. General Authority information. (2008). Ghalayini, Alaa. M, & Noble, James. S. (1996). The changing basis of performance measurement.
International Journal of Operations & Production Management, 16(8), 63-80. Ghauri, Pervez N., & GrnÃúhaug, Kjell. (2006). Research methods in business studies: a practical
guide. Harlow: Financial Times Prentice Hall. Glenn, Jerome Clayton. (2010). Handbook of Research Methods. New Delhi: Oxford Book Co. Globerson, Shlomo. (1985). Issues in developing a performance criteria system for an organization.
International Journal of Production Research, 23(4), 639-646. doi: 10.1080/00207548508904734
Goodman, Eric A., Zammuto, Raymond F., & Gifford, Blair D. (2001). The competing values framework: Understanding the impact of organizational culture on the quality of work life. Organization Development Journal, 19(3), 58.
Gosselin, Maurice. (2005). An empirical study of performance measurement in manufacturing firms. International Journal of Productivity and Performance Management, 54(5/6), 419-437.
Green, Sebastian. (1988). Strategy, organizational culture and symbolism. Long range planning, 21(4), 121-129. doi: 10.1016/0024-6301(88)90016-7
Greener, Sue. (2008). Business Research Methods. Retrieved from bookboon.com Grifel, Stuart S. (1994). Organizational culture: Its importance in performance measurement. PM.
Public Management, 76(9), S19. Guba, E. G., & Lincoln, Y. S. . (1989). Fourth generation evaluation. Newbury Park, Calif: Sage
Publications. Guba , E.G, & Lincoln , Y.S. (1994). "Competing paradigms in qualitative research", in Denzin,
Norman K. , Lincoln, Yvonna S. (Eds) Handbook of qualitative research. Thousand Oaks, Calif: Sage.
286
Hair, Joseph F. (1998). Multivariate data analysis. Upper Saddle River, N.J: Prentice Hall. Hair, Joseph F. (2011). Essentials of business research methods. Armonk, N.Y: M.E. Sharpe. Haldma, Toomas, & Lääts, Kertu. (2002). Contingencies influencing the management accounting
practices of Estonian manufacturing companies. Management Accounting Research, 13(4), 379-379. doi: 10.1006/mare.2002.0197
Hamid, Shaari, Craig, Russell, & Clarke, Frank. (1993). Religion: A Confounding Cultural Element in the International Harmonization of Accounting? Abacus, 29(2), 131-148. doi: 10.1111/j.1467-6281.1993.tb00427.x
Haniffa, R., & Hudaib, M. (2002). An empirical investigation of audit perceptions gap in Saudi Arabia. 2, 3.
Haniffa, R. M. Cooke T. E. (2002). Culture, Corporate Governance and Disclosure in Malaysian Corporations. Abacus U6 38(3), 317.
Harris, Stanley G., & Mossholder, Kevin W. (1996). The affective implications of perceived congruence with culture dimensions during organizational transformation. Journal of Management, 22(4), 527-547. doi: 10.1016/S0149-2063(96)90023-9
Harrison, Roger, & Stokes, Herb. (1992). Diagnosing organizational culture. San Francisco, Calif: Pfeiffer.
Helfrich, Christian D., Li, Yu-Fang, Mohr, David C., Meterko, Mark, & Sales, Anne E. (2007). Assessing an organizational culture instrument based on the Competing Values Framework: exploratory and confirmatory factor analyses. Implementation science : IS, 2(1), 13-13. doi: 10.1186/1748-5908-2-13
Hellriegel, D, Jackson, S. E, Slocum, J.W, Staude, G, Amos, T, Klopper, H.B, . . . Oosthuizen, T. (2004). "Management". Second South African Edition, Oxford University Press, Cape Town, Southern Africa.
Henri, Jean-Francois. (2004). Organizational culture and performance measurement systems. Accounting, Organizations and Society, 31(1), 77-103.
Henri, Jean-Francois. (2006). Organizational culture and performance measurement systems. Accounting, Organizations and Society, 31(1), 77-103. doi: 10.1016/j.aos.2004.10.003
Henry, L.Tosi Jr., & John W. Slocum, Jr. (1984). Contingency Theory: Some Suggested Directions. Journal of Management 10(1), 9-26.
Hofstede, Geert. (1980). Culture's consequences: international differences in work-related values. Beverly Hills: Sage.
Hofstede, Geert. (1984). Culture's consequences: international differences in work-related values. London: Sage.
Hofstede, Geert. (1991). Cultures and organizations: software of the mind. London: McGraw-Hill. Hofstede, Geert. (1993). Cultural constraints in management theories. Academy of Management
Executive, 7(1), 81. Hofstede, Geert. (1997). Cultures and organizations: software of the mind. New York: McGraw-Hill. Hofstede, Geert. (2001). Culture's consequences: comparing values, behaviors, institutions, and
organizations across nations. Thousand Oaks, Calif: SAGE. Hofstede, Geert, Neuijen, Bram, Ohayv, Denise Daval, & Sanders, Geert. (1990). Measuring
Organizational Cultures: A Qualitative and Quantitative Study Across Twenty Cases. Administrative Science Quarterly, 35(2), 286-316.
Holden, Mary T., & Lynch, Patrick. (2004). Choosing the Appropriate Methodology: Understanding Research Philosophy. The Marketing Review, 4(4), 397-397. doi: 10.1362/1469347042772428
287
Hoque, Zahirul, Mia, Lokman, & Alam, Manzurul. (2001). Market competition, computer-aided manufacturing and use of multiple performance measures: an empirical study. The British Accounting Review, 33(1), 23-45.
Howard, Larry W. (1998). Validating the competing values model as a representation of organizational cultures. International Journal of Organizational Analysis, 6(3), 231.
Hussain, Md. Mostaque, & Gunasekaran, A. (2002). Non-financial management accounting measures in Finnish financial institutions. European Business Review, 14(3), 210-229.
Hyvonen, J. (2005). Adoption and Benefits of Management Accounting Systems: Evidence from Finland and Australia. Advances in International Accounting, 18(Journal Article), 97-120.
Igo, Tony, & Skitmore, Martin. (2006). Diagnosing the organizational culture of an Australian engineering consultancy using the competing values framework. Construction Innovation, 6(2), 121-121. doi: 10.1191/1471417506ci610oa
Inaam, M. Al-Zwyalif. (2012). The Possibility of Implementing Balanced Scorecard in Jordanian Private Universities. International Business Research, 5(11), 113.
Inianty, Sudirman. (2012). Implementing Balanced Scorecard in Higher Education Management. International Journal of Business and Social Science, 3(18).
Jaaskelainen, Aki, Laihonen, Harri, Lonnqvist, Antti, Palvalin, Miikka, Sillanpaa, Virpi, Pekkola, Sanna, & Ukko, Juhani. (2012). A contingency approach to performance measurement in service operations. Measuring Business Excellence, 16(1), 43-52. doi: 10.1108/13683041211204662
Jaeger, Alfred M. (1986). Organization development and national culture: where's the fit? The Academy of Management review, 11(1), 178-190.
Jaggi, Bikki, & Low, Pek Yee. (2000). Impact of culture, market forces, and legal system on financial disclosures. International Journal of Accounting, 35(4), 495-519.
Ji-Young, An, Young-Hee, Yom, & S., Ruggiero Jeanne. (2011). Organizational culture, quality of work life, and organizational effectiveness in Korean university hospitals. Journal of transcultural nursing : official journal of the Transcultural Nursing Society / Transcultural Nursing Society, 22(1), 22-30.
Jofreh, Manouchehr, & Masoumi, Elahe Sadat. (2013). Diagnosing organizational culture: An empirical investigation. Management Science Letters, 3(2013), 2461-2466.
Johnson, C. C. . (2007). Introduction to the balanced scorecard and performance measurement systems. Balanced Scorecard for State-Owned Enterprises: Driving Performance and Corporate Governance, ADB.
Jones, K., & Chen, C. C. . (2009). Are employees buying the balanced scorecard? . Management Accounting Quarterly, 11(1), 36.
Kalliath, Thomas J, Bluedorn, Allen C., & Gillespie, David F. (1999). A confirmatory factor analysis of the competing values instrument. Educational and Psychological Measurement, 59(1), 143-158.
Kandula, S. R. (2006). Performance Management: Strategies, Interventions, Drivers: PHI Learning Pvt. Ltd..
Kaplan, & Norton. (1996c). The balanced scorecard: translating strategy into action: Harvard Business School Press.
Kaplan, R, & Norton, D. (1992). The balanced scorecard – measures that drive performance. 70(1), 71-79.

288
Kaplan, Robert, & Norton, David. (1996). Using the balanced scorecard as a strategic management system. Harvard Business Review, 74(1), 75-75.
Kaplan, Robert S. (1984). The Evolution of Management Accounting. The Accounting Review, 59(3), 390-418.
Karathanos, Demetrius, & Karathanos, Patricia. (2005). Applying the Balanced Scorecard to Education. Journal of Education for Business, 80(4), 222-230. doi: 10.3200/joeb.80.4.222-230
Karathanos, Patricia, & Karathanos, Demetrius. (2005). Applying the Balanced Scorecard to Education. Journal of Education for Business, 80(4), 222-230.
Kennerley, Mike, Neely, A. D., & Adams, Chris. (2002). The performance prism: the scorecard for measuring and managing business success. London: Financial Times Prentice Hall.
Keskin, Halit, Akgün, Ali E., Günsel, Aysüe, & Imamoglu, Salih Zeki. (2005). The Relationships Between Adhocracy and Clan Cultures and Tacit Oriented KM Strategy. Journal of Transnational Management, 10(3), 39-53.
Kevin, Baird, Kristal Jia, Hu, & Robert, Reeve. (2011). The relationships between organizational culture, total quality management practices and operational performance. International Journal of Operations & Production Management, 31(7), 789-814. doi: 10.1108/01443571111144850
Khorwatt, Esamaddin (2006). The attitude of Libyan auditors to inherent and control risk assessments. (Doctor of philosophy), The Manchester Metropolitan University, Manchester.
King, Robyn, Clarkson, Peter M., & Wallace, Sandra. (2010). Budgeting practices and performance in small healthcare businesses. Management Accounting Research, 21(1), 40-55.
Kotter, John P., & Heskett, James L. (1992). Corporate culture and performance. Oxford; New York: Free Press.
Kreitner, R. (1998). Management (7 ed.). Boston: Houghton Mifflin. Kurt, Schobel, & Cam, Scholey. (2012). Balanced Scorecards in education: focusing on financial
strategies (Vol. 16, pp. 17-28). Bradford: Emerald Group Publishing, Limited. Kuwaiti, M.E. (2004). Performance measurement process: definition and ownership. International
Journal of Operations & Production Management, 24(1), 55-78. Lancaster, Geoffrey. (2005). Research methods in management: a concise introduction to research in
management and business consultancy. Oxford: Elsevier Butterworth-Heinemann. Lawrence, Paul R., Lorsch, Jay W., & Harvard University. Graduate School of Business,
Administration. (1967). Organization and environment: managing differentiation and integration. Boston, Mass: Division of Research, Graduate School of Business Administration, Harvard University.
Lebas, M. (1995). Performance measurement and performance management. International Journal of Production Economics, 41(1-3), 23-35. doi: 10.1016/0925-5273(95)00081-x
Leen Yu , May, Hamid, Suraya, Taha Ijab, Mohamad, & Pei Soo, Hsaio. (2009). The e-balanced scorecard (e-BSC) for measuring academic staff performance excellence. Higher Education, 57(6), 813-828.
Lewis, J. P. (1995). Fundamentals of project management. New York: Amacom.: New York: Amacom. Lim, Bernard. (1995). Examining the organizational culture and organizational performance link.
Leadership & Organization Development Journal, 16(5), 16-21. doi: 10.1108/01437739510088491
Lisiecka, K., & Czyż-Gwiazda, E. (2013). Performance Measurement Models – Comparative Review. Quality Renaissance - Co-creating a Viable Future, 17(20).
289
Lok, Peter, & Crawford, John. (2004). The effect of organisational culture and leadership style on job satisfaction and organisational commitment: A cross-national comparison. The Journal of Management Development, 23(3/4), 321-338. doi: 10.1108/02621710410529785
Maddala, G.S. (1977). Econometrics. McGRAW-HILL KOGAKUSHA, LTD. Magee, K.C. (2002). The impact of organizational culture on the implementation of performance
management (Doctoral dissertation). Mangione, Thomas W. (1995). Mail surveys: improving the quality (Vol. 40). Thousand Oaks: Sage. Marchand, M., & Raymond, L. (2008). Researching Performance Measurement Systems an
Information Systems Perspective. International Journal of Operations &Production Management, 28(7), 663-383.
Marginson, David, McAulary, Laurie, Roush, Melivin, & Zijl, Tony Van. (2010). Performance measures and short-termism: an exploratory study. Accounting and Businrss Research, 40(4), 353-370.
Marginson, David, & McAulay, Laurie. (2008). Exploring the Debate on Short-Termism: A Theoretical and Empirical Analysis. Strategic Management Journal, 29(3), 273-292. doi: 10.1002/smj.657
Maria Manuela, Pereira, & Nuno Filipe, Mel√£o. (2012). The implementation of the balanced scorecard in a school district. International Journal of Productivity and Performance Management, 61(8), 919-939. doi: 10.1108/17410401211277156
Martinez, V, & Kennerley, M. (2005). How do performance measurement and management systems impact business performance?
an UK cross-regional comparison Paper presented at the Conference Proceedings Strategic Management Society, Orlando, Florida, US.
McDevitt, R., Giapponi, C. , & Solomon, N. (2008). Strategy revitalization in academe: a balanced scorecard approach. International Journal of Educational Management, 22(1), 32-47.
Medori, David, & Steeple, Derek. (2000). A framework for auditing and enhancing performance measurement systems. International Journal of Operations & Production Management, 20(5), 520-533. doi: 10.1108/01443570010318896
Medori, G. M. D. (1998). Establishment of Non-financial Performance Measures in Medium to Large-sized Manufacturing Organisations Consistent with World Class Manufacturing Objectives: Coventry University.
Mendoza, C, & Zrihen, R. (2001). Measuring up: While the Balanced Scorecard has taken off in the US, the Performance Scorecard is winning fans in France. . Financial Management, 26.
Meng, Xianhai, & Minogue, Michael. (2011). Performance measurement models in facility management: a comparative study. Facilities, 29(11/12), 472-484.
Micheli, Pietro, & Manzoni, Jean-Francois. (2010). Strategic Performance Measurement: Benefits, Limitations and Paradoxes. Long Range Planning 43, 465-476.
Moore, C. (2002). Best Practices in Workflow. Giga Information Group, http://www.gigaweb.com. Morgan, Chris. (2007). Supply network performance measurement: future challenges? The
International Journal of Logistics Management, 18(2), 255-273. doi: 10.1108/09574090710816968
Moser, Sir Claus, & Kalton, Graham. (1985). Survey methods in social investigation. Aldershot: Gower.
Moullin, M. (2002). Delivering Excellence in Health and Social Care. Buckingham: Open University Press.

290
Moullin, Max. (2007). Performance measurement definitions: linking performance measurement and organisational excellence: Linking performance measurement and organisational excellence. International Journal of Health Care Quality Assurance, 20(2-3), 181-183.
Moxham, Claire. (2009). Performance measurement: Examining the applicability of the existing body of knowledge to nonprofit organisations. International Journal of Operations & Production Management, 29(7), 740-763. doi: 10.1108/01443570910971405
Murphy, Kevin R., & Cleveland, Jeanette N. (1995). Understanding performance appraisal: social, organizational, and goal-based perspectives: Sage Publications.
Mutch, Carol, & New Zealand Council for Educational Research. (2005). Doing educational research : a practitioner's guide to getting started. Wellington, N.Z.: NZCER Press.
NAPA. (1996). Information Management Performance Measures: Developing Performance Measures and Management Controls for Migration Systems, Data Standards, and Process Improvements Report by a Panel of the National Academy of Public, Administration for US Dept. of Defence.
Naqi, Sayed. (2013). Ratify, reject or revise: balanced scorecard and universities (Vol. 27, pp. 203-220). Bradford: Emerald Group Publishing, Limited.
Naranjo-Valencia, Julia C., Jiménez-Jiménez, Daniel, & Sanz-Valle, Raquel. (2011). Innovation or imitation? The role of organizational culture. Management Decision, 49(1), 55-72. doi: 10.1108/00251741111094437
NCETR. (1996). (National Centre for Education and Training Research), A glance on Alfatah accomplishments in education and training. Tripoli: National Centre for Education and Training Research (Arabic text).
Neely, A. (1998). Measuring business performance. London: Economist. Neely, A (1999). The performance measurement revolution: why now and what next? International
Journal of Operations & Production Management, 19(2), 205-228. doi: 10.1108/01443579910247437
Neely, A (2002). Business Performance Management Theory and Practice. Cambridge: Cambridge University Press.
Neely, A , Gregory, M, & Platts, K. (1995). Performance measurement system design: A literature review and research agenda. International Journal of Operations & Production Management, 15(4), 80-116. doi: 10.1108/01443579510083622
Neely, A, Gregory, M, & Platts, K. (2005). Performance measurement system design: A literature review and research agenda. International Journal of Operations & Production Management, 25(12), 1228-1263.
Neely, A., Adams, C. , & Kennerley, M. . (2002). The Performance Prism: The Scorecard for Measuring and Managing Stakeholder Relationships. Financial Times.
Neely, A. D., Adams, Chris, & Kennerley, Mike. (2002). The performance prism: the scorecard for measuring and managing business success. London: Financial Times Prentice Hall.
Neely , Andy, Gregory , Mike, & Platts , Ken. (1995). Performance measurement system design: A literature review and research agenda. International Journal of Operations & Production Management, 15(4), 80-116. doi: 10.1108/01443579510083622
O'Reilly, Charles A., Chatman, Jennifer, & Caldwell, David F. (1991). People and Organizational Culture: A Profile Comparison Approach to Assessing Person-Organization Fit. The Academy of Management Journal, 34(3), 487-516.
Oppenheim, A. N. (1992). Questionnaire design, interviewing and attitude measurement. London: Continuum.
291
Othman, Rozhan. (2006). Balanced scorecard and causal model development: preliminary findings. Management Decision, 44(5), 690-702.
Otley, D. (1980). The contingency Theory oh Management Accounting: Achievement and PrognosisAccounting Organisation and Society. Accounting Organisation and Society, 5(4), 413- 428.
Otley, D. (1999). Performance management: a framework for management control systems research. Management Accounting Research, 10(4), 363-382.
Pallant, Julie. (2007). SPSS survival manual: a step by step guide to data analysis using SPSS for Windows. Maidenhead: Open University Press.
Panayotopoulou, Leda, Bourantas, Dimitris, & Papalexandris, Nancy. (2003). Strategic human resource management and its effects on firm performance: An implementation of the competing values framework. International Journal of Human Resource Management, 14(4), 680-699. doi: 10.1080/0958519032000057781
Paparone, Christopher R. . (2003). Applying the competing values framework to study organizational subcultures and system-wide planning efforts in a military university. The Pennsylvania State University.
Pargeter, Alison. (2006). Libya: Reforming the Impossible? Review of African Political Economy, 33(108), 219-235. doi: 10.1080/03056240600842685
Parker, Rachel, & Bradley, Lisa. (2000). Organisational culture in the public sector: evidence from six organisations. International Journal of Public Sector Management, 13(2), 125-141. doi: 10.1108/09513550010338773
Pedersen, Gjerdrum, & Sudzina, Frantisek. (2012). Which firms use measures?: Internal and external factors shaping the adoption of performance measurement systems in Danish firms. International Journal of Operations & Production Management, 32(1), 4-27.
Perry, Chad. (1998). Processes of a case study methodology for postgraduate research in marketing. European Journal of Marketing, 32(9/10), 785-802. doi: 10.1108/03090569810232237
Pettigrew, A. (1979). On Studying Organizational Culture. Administrative Science Quarterly, 24:570–81.
Porter, M., E. , & Yergin, D. (2006). National Economic Strategy: An Assessment of the Competitiveness of Libya. .
Putu, Mimba, & Helden, G. Jan. (2007). Public sector performance measurement in developing countries: a literature review and research agenda. Journal of accounting & organizational change, 3(3), 192-208. doi: 10.1108/18325910710820265
Quinn, Robert E., & Cameron, Kim. (1983). Organizational Life Cycles and Shifting Criteria of Effectiveness: Some Preliminary Evidence. Management Science, 29(1), 33-51. doi: 10.1287/mnsc.29.1.33
Quinn, Robert E., & Rohrbaugh, John. (1983). A Spatial Model of Effectiveness Criteria: Towards a Competing Values Approach to Organizational Analysis. Management Science, 29(3), 363-377. doi: 10.1287/mnsc.29.3.363
Quinn, Robert, & Rohrbaugh, John. (1981). A Competing Values Approach to Organizational Effectiveness. Public Productivity Review, 5(2), 122-140.
Radnor, Zoe J., & Barnes, David. (2007). Historical analysis of performance measurement and management in operations management. International Journal of Productivity and Performance Management, 56(5/6), 384-396.

292
Ramachandran, Devi Sharimllah, Choy Chong, Siong, & Ismail, Hishamuddin. (2011). Organisational culture: An exploratory study comparing faculties' perspectives within public and private universities in Malaysia. International Journal of Educational Management, 25(6), 615-634. doi: 10.1108/09513541111159086
Rashid, Md. Zabid Abdul, Sambasivan, Murali, & Johari, Juliana. (2003). The influence of corporate culture and organisational commitment on performance. Journal of Management Development, 22(8), 708-728.
Rejc, Adriana. (2004). Toward contingency theory of performance measurement. Journal of East European Management Studies, 9(3), 243-264.
Remenyi, D. (1998). Doing research in business and management: an introduction to process and method. London: SAGE.
Rhema, Amal, & Miliszewska, Iwona. (2010). Towards e-learning in higher education in Libya. Issues in Informing Science & Information Technology, 7(Journal Article), 423.
Robert, Kaplan , & David, Norton. (2001). Transforming the Balanced Scorecard from Performance Measurement to Strategic Management: Part I. Accounting Horizons, 15(1), 87-104.
Robert, Kaplan, & David, Norton. (2001). Transforming the Balanced Scorecard from Performance Measurement to Strategic Management: Part I. . Accounting Horizons, 15(1), 87-104.
Robson, C. (2002). Real world research: A resource of social scientists and practitioner researchers. Oxford: Black well Publishing.
Rompho, N. (2006). An Economic Value Added and Balanced Scorecard For University In Thailand., University Of Glasgow.
Rowe, A.J, Mason, R.O, Dickel, K.E, Mann, R.B, & Mockler, R.J. (1994). Strategic management: a methodological approach. New York: Addison-Wesley.
Said, Amal, HassabElnaby, Hassan, & Wier, Benson. (2003). An Empirical Investigation of the Performance Consequences of Nonfinancial Measures. Journal of management accounting research, 15, 193-223.
Saleh, Soleman. (2013). Study of Critical Success Factors in Adopting Knowledge Management Systems for the Libyan Public Oil Sector. (Doctor of Philosophy), Manchesyer.
Saunders, Mark, Lewis, Philip, & Thornhill, Adrian. (2007). Research methods for business students. Harlow: Financial Times Prentice Hall.
Saunders, Mark, Lewis, Philip, & Thornhill, Adrian. (2009). Research methods for business students. Harlow: Financial Times Prentice Hall.
Schein, Edgar H. (1985). Organizational culture and leadership: Jossey-Bass. Schein, Edgar H. (1990). Organizational Culture, American Psychologist. 45, 2, 109-119. Schein, Edgar H. (1992). Organizational culture and leadership: Jossey-Bass. Schein, Edgar H. (2010). Organizational culture and leadership. (Book, Whole). Schneider, B. (2000). The psychological life of organisations, in Ashkanasy, N., Wilderom, C. and
Peterson, M Schneider, Susan C. (1989). Strategy Formulation: The Impact of National Culture. Organization
Studies, 10(2), 149-168. doi: 10.1177/017084068901000202 Sekaran, Uma. (2003). Research methods for business: a skill-building approach. New York: Wiley. Self, J. . (2004). Metrics And Management: Applying The Results of the Balanced Scorecard. .
Performance Measurement and Metrics Journal, 5(3). Shafei, Reza, Ghaderzadeh, Hamed, Salavati, Adel, & Lavei, Shabnam. (2011). Survey of Relationship
between Knowledge Management and Organizational Culture Dimensions in Public

293
Organizations "A case of Iranian Public Organizations". Interdisciplinary Journal of Contemporary Research In Business, 2(11), 355.
Shahzad, Fakhar, Luqman, Rana Adeel, Khan, Ayesha Rashid, & Shabbir, Lalarukh. (2012). Impact of Organizational Culture on Organizational Performance: An Overview. Interdisciplinary Journal of Contemporary Research In Business, 3(9), 975.
Sharma, Ashok. (2008). Problems of Survey Research in Developing Countries. Jaipur, India: University of Rajasthan.
Shrivastava, P. (1985). Integrating strategy formulation with organizational culture. The Journal of business strategy, 5(3), 103-110.
Shurbagi, Adel Mohamed Ali, & Zahari, Ibrahim Bin. (2013). The Relationship between Transformational Leadership and Organizational Culture in National Oil Corporation of Libya. International Journal of Business Administration, 4(4), 26.
Silverman, David. (2010). Doing qualitative research: a practical handbook. London: SAGE. Silverthorne, Colin. (2004). The impact of organizational culture and person-organization fit on
organizational commitment and job satisfaction in Taiwan. Leadership & Organization Development Journal, 25(7), 592-599. doi: 10.1108/01437730410561477
Sink, D. (1985). Productivity Management Planning Measurement and Evaluation Control and Improvement Wiley, New York, NY.
Slocum, John W., & Tosi, Henry L. (1984). Contingency Theory: Some Suggested Directions. Journal of Management, 10(1), 9-26.
Smart, John C., & St. John, Edward P. (1996). Organizational Culture and Effectiveness in Higher Education: A Test of the "Culture Type" and "Strong Culture" Hypotheses. Educational Evaluation and Policy Analysis, 18(3), 219-241. doi: 10.2307/1164261
Smith, J. A., & Reid, G. C. (2000). The impact of contingencies on management accounting system development. Management Accounting Research, 11(4), 427-427.
Stivers, Bonnie P., Covin, Teresa Joyce, Hall, Nancy Green, & Smalt, Steve. (1998). How nonfinancial performance measures are used. Management Accounting Research, 79(4), 44-48.
Tarter, C. John, & Wayne, K. Hoy. (1998). Toward a contingency theory of decision making. Journal of Educational Administration, 36(3), 212-228.
The National Committee for Libyan Universities. (2010). The activities and programmes of the National Committee for Libyan Universities during first quarter of 2010.
Thietart, Raymond-Alain, & Wauchope, Samantha. (2001). Doing management research: a comprehensive guide. GB: Sage Publications Ltd.
Thomas, R., Marosszeky, Marton, Karim, Khalid, Davis, S., & McGeorge, D. (2002). The importance of project culture in achieving quality outcomes in construction. Proceedings IGLC, 10, Aug, Gamado, Brasil.
Tillema, Sandra. (2005). Towards an integrated contingency framework for MAS sophistication. Management Accounting Research, 16(1), 101-129.
Trivellas, Panagiotis, & Dargenidou, Dimitra. (2009). Organisational culture, job satisfaction and higher education service quality: The case of Technological Educational Institute of Larissa. The TQM Journal, 21(4), 382-399.
Tung, Amy, Baird, Kevin, & Schoch, Herbert P. (2011). Factors influencing the effectiveness of performance measurement systems. 31(12), 1287-1310. doi:10.1108/01443571111187457

294
Twati, Jamal. (2006). Societal and Organisational Culture and the Adoption of Management Information Systems in Arab Countries. (Doctor of Philosophy), Griffith Business School, Brisbane.
Twati, Jamal, & Gammack, J. (2006). The impact of organisational culture innovation on the adoption of IS/IT: the case of Libya. Journal of Enterprise Information Management, 19(2), 175-191.
Umashankar, Venkatesh, & Dutta, Kirti. (2007). Balanced scorecards in managing higher education institutions: an Indian perspective. International Journal of Educational Management, 21(1), 54-67.
Vakkuri, Jarmo, & Meklin, Pentti. (2003). The impact of culture on the use of performance measurement information in the university setting. Management Decision, 41(8), 751.
Van de, Jansen, Wilhelmus, Paulus Gerardus, & Anderson, Neil. (2004). Guide to management research methods. Oxford: Blackwell.
Van den Bosch, Frans A. J., Volberda, Henk W., & de Boer, Michiel. (1999). Coevolution of Firm Absorptive Capacity and Knowledge Environment: Organizational Forms and Combinative Capabilities. Organization Science, 10(5), 551-568. doi: 10.1287/orsc.10.5.551
Van der Stede, Wim A. (2000). The relationship between two consequences of budgetary controls: budgetary slack creation and managerial short-term orientation. Accounting, Organizations and Society, 25(6), 609-622. doi: 10.1016/s0361-3682(99)00058-6
VanderStoep, Scott W., & Johnson, Deidre D. (2009). Research Methods for Everyday Life: Blending Qualitative and Quantitative Approaches: Wiley.
Veen-Dirks, P. M. G. van. (2010). Different uses of performance measures : the evaluation versus reward of production managers. Accounting, 35(2), 141-164.
Venkatesh, Alladi, & Vitalari, Nicholas P. (1991). Longitudinal Surveys in Information Systems Research: An Examination of Issues, Methods, and Applications. In K. L. Kraemer, J. I. Cash & J. F. Nunamaker (Eds.), The information Systems Research Challenge: Survey Research Methods (Vol. 3, pp. 115-143). Boston: Harvard Business School.
Venkatesh, Umashankar, & Kirti, Dutta. (2007). Balanced scorecards in managing higher education institutions: an Indian perspective. International Journal of Educational Management, 21(1), 54-67.
Verbeeten, Frank H. M., & Boons, Arnick N. A. M. (2009). Strategic priorities, performance measures and performance: an empirical analysis in Dutch firms. European Management Journal, 27(2), 113-128.
Walliman, Nicholas, & Baiche, Bousmaha (2001). Your research project : a step-by-step guide for the first-time researcher: London : SAGE
Waterman, Robert H., Peters, Thomas J., & Phillips, Julien R. (1980). Structure is not organization (Vol. 23, pp. 14-26). Greenwich: Elsevier Inc.
Watson, D. (1975). Contingency formulations of organisational structure: Implications for management accountin. In J. Livingstone (Ed.),Managerial Accounting: The Behavioral Foundations. Columbus, Ohio: Grid Publicatio.
Wildavsky, A. (1989). Frames of reference come from cultures: a predictive theory. In M.Freilich (Ed.), The Relevance of Culture. New York: Bergin & Garvey.
Wilkins, Alan L., & Ouchi, William G. (1983). Efficient Cultures: Exploring the Relationship Between Culture and Organizational Performance. Administrative Science Quarterly, 28(3), 468-481.
Wisner, Joel D., & Fawcett, Stanley E. (1991). Linking Firm Strategy to Operating Decisions Through Performance Measurement. Production and Inventory Management Journal, 32(3), 5.

295
Woodward, Joan. (1965). Industrial organization: theory and practice. Oxford: Oxford University Press.
World Forum. (2013). The Global Competitiveness Report. Wu, Hung-Yi, Lin, Yi-Kuei, & Chang, Chi-Hsiang. (2011). Performance evaluation of extension
education centers in universities based on the balanced scorecard. Evaluation and Program Planning, 34(1), 37-50. doi: 10.1016/j.evalprogplan.2010.06.001
Yeniyurt, Sengun. (2003). A literature review and integrative performance measurement framework for multinational companies. Marketing Intelligence & Planning, 21(3), 134-142. doi: 10.1108/02634500310474957
Yilmaz, Cengiz, & Ergun, Ercan. (2008). Organizational culture and firm effectiveness: an examination of relative effects of culture traits and the balanced culture hypothesis in an emerging economy. Journal of world business, 43(3), 290-306. doi: 10.1016/j.jwb.2008.03.019
Yin, Robert K. (2003). Case study research: design and methods (Vol. 5). Thousand Oaks, Calif: Sage Publications.
Yu, May Leen, Hamid, Suraya, Ijab, Mohamad Taha, & Soo, Hsaio Pei. (2009). The e-balanced scorecard (e-BSC) for measuring academic staff performance excellence. Higher Education, 57(6), 813-828.
Zahari, Ibrahim Bin, & Shurbagi, Adel Mohamed Ali. (2012). The Effect of Organizational Culture and the Relationship between Transformational Leadership and Job Satisfaction in Petroleum Sector of Libya. International Business Research, 5(9), 89.
Zahirul, Hoque. (2004). A contingency model of the association between strategy, environmental uncertainty and performance measurement: impact on organizational performance. International Business Review, 13(4), 485-502.
Zu, Xingxing, Robbins, Tina L., & Fredendall, Lawrence D. (2010). Mapping the critical links between organizational culture and TQM/Six Sigma practices. International Journal of Production Economics, 123(1), 86-106.
Zu, Xingxing, Zhou, Huaming, Zhu, Xiaowei, & Yao, Dongqing. (2011). Quality management in China: the effects of firm characteristics and cultural profile. International Journal of Quality & Reliability Management, 28(8), 800-821. doi: 10.1108/02656711111162497
Zuriekat, Majdy Issa KhaIiI. (2005). Performance Measurement Systems: An Examination of the Influence of the Contextual Factors and their Impact on Performance with a Specific Emphasis on the Balanced Scorecard Approach. Business School, Ph.D.
Zuriekat, Majdy, Salameh, Rafat, & Alrawashdeh, Salah. (2011). Participation In Performance Measurement Systems And Level Of Satisfaction. International Journal of Business and Social Science, 2(8).
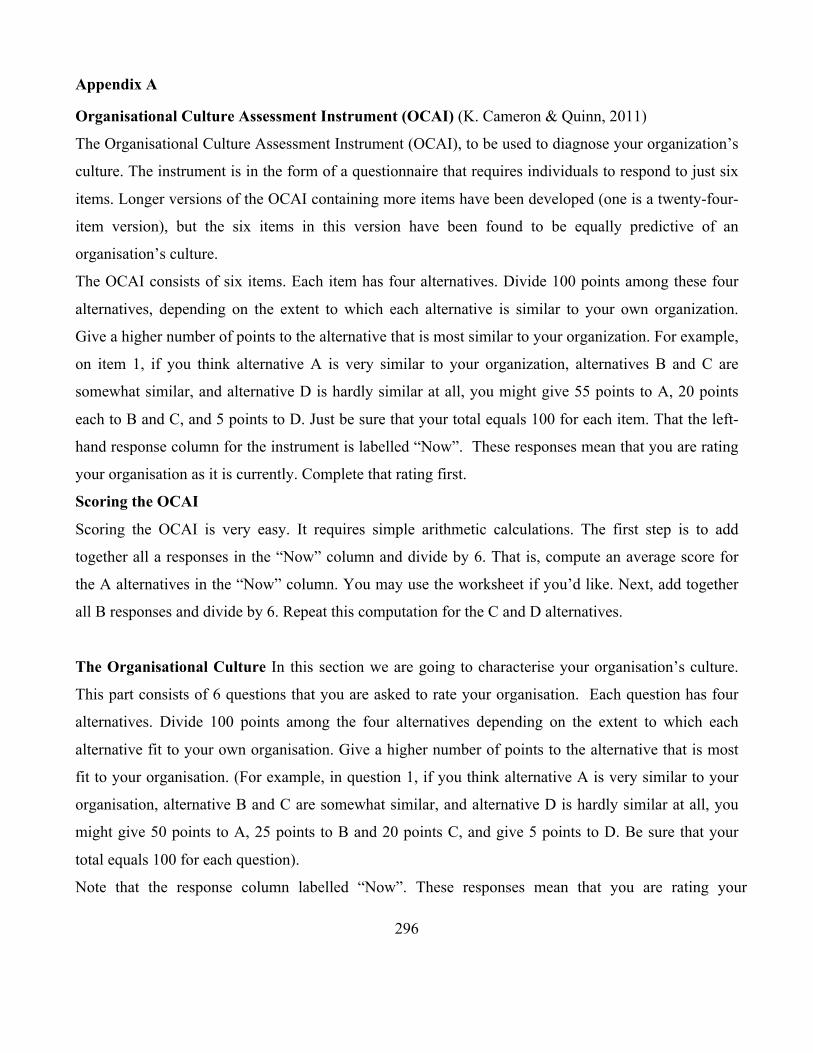
296
Appendix A
Organisational Culture Assessment Instrument (OCAI) (K. Cameron & Quinn, 2011)
The Organisational Culture Assessment Instrument (OCAI), to be used to diagnose your organization’s
culture. The instrument is in the form of a questionnaire that requires individuals to respond to just six
items. Longer versions of the OCAI containing more items have been developed (one is a twenty-four-
item version), but the six items in this version have been found to be equally predictive of an
organisation’s culture.
The OCAI consists of six items. Each item has four alternatives. Divide 100 points among these four
alternatives, depending on the extent to which each alternative is similar to your own organization.
Give a higher number of points to the alternative that is most similar to your organization. For example,
on item 1, if you think alternative A is very similar to your organization, alternatives B and C are
somewhat similar, and alternative D is hardly similar at all, you might give 55 points to A, 20 points
each to B and C, and 5 points to D. Just be sure that your total equals 100 for each item. That the left-
hand response column for the instrument is labelled “Now”. These responses mean that you are rating
your organisation as it is currently. Complete that rating first.
Scoring the OCAI
Scoring the OCAI is very easy. It requires simple arithmetic calculations. The first step is to add
together all a responses in the “Now” column and divide by 6. That is, compute an average score for
the A alternatives in the “Now” column. You may use the worksheet if you’d like. Next, add together
all B responses and divide by 6. Repeat this computation for the C and D alternatives.
The Organisational Culture In this section we are going to characterise your organisation’s culture.
This part consists of 6 questions that you are asked to rate your organisation. Each question has four
alternatives. Divide 100 points among the four alternatives depending on the extent to which each
alternative fit to your own organisation. Give a higher number of points to the alternative that is most
fit to your organisation. (For example, in question 1, if you think alternative A is very similar to your
organisation, alternative B and C are somewhat similar, and alternative D is hardly similar at all, you
might give 50 points to A, 25 points to B and 20 points C, and give 5 points to D. Be sure that your
total equals 100 for each question).
Note that the response column labelled “Now”. These responses mean that you are rating your

297
organisation as it is currently.
C1. Dominant Characteristics Score A The organisation is a very personal place. It is like an extended family.
People seem to share a lot of themselves.
B The organisation is a very dynamic and entrepreneurial place. People
are willing to stick their necks out and take risks.
C The organisation is very results oriented. A major concern is with
getting the job done. People are very competitive and achievement
oriented.
D The organisation is very controlled and structured place. Formal
procedures generally govern what people do.
Total 100 C2. Organisational Leadership Score A The leadership in the organisation is generally considered to exemplify
mentoring, facilitating, or nurturing.
B The leadership in the organisation is generally considered to exemplify
entrepreneurship, innovating, or risk taking.
C The leadership in the organisation is generally considered to exemplify
a no-nonsense, aggressive, results-oriented focus.
D The leadership in the organisation is generally considered to exemplify
coordinating, organising, or smooth-running efficiency.
Total 100 C3. Management of Employees Score A The management style in the organisation is characterised by teamwork,
consensus, and participation.
B The management style in the organisation is characterised by individual
risk-taking, innovation, freedom, and uniqueness.

298
C The management style in the organisation is characterised by hard-
driving competitiveness, high demands, and achievement.
D The management style in the organisation is characterised by security of
employment, conformity, predictability, and stability in relationships.
Total 100 C4. Organisation Glue Score A The glue that holds the organisation together is loyalty and mutual
trust. Commitment to this organisation runs high.
B The glue that holds the organisation together is commitment to innovation
and development. There is an emphasis on being on the cutting edge.
C The glue that holds the organisation together is the emphasis on
achievement and goal accomplishment. Aggressiveness and winning are
common themes.
D The glue that holds the Maintaining a smooth-running organisation is
important organisation together is formal rules and policies.
Total 100 C5. Strategic Emphases Score A The organisation emphasises human development. High trust,
openness, and participation persist.
B The organisation emphasises acquiring new resources and
creating new challenges. Trying new things and prospecting for
opportunities are valued.
C The organisation emphasises competitive actions and achievement.
Hitting stretch targets and winning in the marketplace are dominant.

299
D The organisation emphasises permanence and stability. Efficiency, control
and smooth operations are important.
Total 100 C6. Criteria of Success Score A The organisation defines success on the basis of the development of
human resources, teamwork, employee commitment, and concern for
people.
B The organisation defines success on the basis of having the most
unique or newest products. It is a product leader and innovator.
C The organisation defines success on the basis of the winning
in the marketplace and outpacing the competition. Competitive market
leadership is key.
D The organisation defines success on the basis of efficiency.
Dependable delivery, smooth scheduling, and low-cost production are
critical.
Total 100
300
Appendix B: Thesis Questionnaire
Dear Participant
I am a Ph.D. student at the University of Huddersfield, UK, currently preparing my doctoral project on
the:
The Influence of Organisational Culture on Performance Measurement Systems in Libyan
Higher Education
This research aims to explore and investigate the dominant type of organisational culture on the
acceptance of financial, non-financial performance measurement systems, and their impact on
organisations performance. The final results of this study will be available to all those who
participated in the study upon request.
This questionnaire is aimed at decision makers who are using financial and non-financial performance
measurement system in their organisations. Your assistance in completing the attached questionnaire
would be greatly appreciated. Please remember that it is important to complete the survey according to
the instructions provided for each part.
I would like to reassure you that your response will be treated as strictly confidential and will only be
used for the purposes of this research. It will not be disclosed to third parties under any circumstances
Should you need further information or clarification regarding this research study, please do not
hesitate to contact me or my main supervisor at the addresses below.
Thank you for your co-operation in completing this questionnaire.
Yours sincerely
Samia Aboajela
Dr John R Anchor Director of Emerging Markets Research Group Business School University of Huddersfield Huddersfield/UK E-mail [email protected] Tel: (+44)-(0)-1484-472462 Fax:(+44)-(0)-1484-473148
Dr Olu Aluko Business School University of Huddersfield Huddersfield/UK E-mail:[email protected] Tel: (+44)-(0)- 1484 471592
Mrs Samia Aboajela Ph.D. Candidate Business School University of Huddersfield Huddersfield/UK E-mail:[email protected] or: [email protected] Tel: (+44)-(0)-7428-786503 Tel:(+218)-(0)-91-7778399

301
Glossary
1. Organisational Culture (OC)
Organisational culture refers to a set of shared values, belief, and assumptions and practices that shape
and guide member’s attitudes and behaviour in the organisation.
2. Performance Measurement System (PMS)
Process of assessing progress toward achieving predetermined goals, including information on the
efficiency and can be defined as a metric used to quantify the efficiency and/or effectiveness of action.
3. Balanced Scorecard (BSC)
The Balanced Scorecard (BSC) is a strategic performance management framework that allows
organisations to manage and measure the delivery of their strategy, it consists of four perspectives that
are mixed between financial and non-financial metrics (Financial perspective, Customer perspective,
Learning and growth perspective, Internal business process perspective) to evaluate and improve the
performances
4. Organisational Performance (OP)
The organisational performance is the ability of the organisation to achieve its goals and objectives.

302
Section A- General Information about Your Self
For questions A1 to A3 below please tick [ü] relevant answers to indicate:
Job title an position
[ ] The President Of Organisation
[ ] Vice President
[ ] Chief of Finance Department /Assistant/ Vice
[ ] Chief of Administrative Department /Assistant/ Vice
[ ] Financial Controller
[ ] Other (please specify) …………………..
Experience Less than one
year
1-5 years 6-10 years More than 10
years
In the current job [ ] [ ] [ ] [ ]
With the current
organisation
[ ] [ ] [ ] [ ]
Qualification
[ ] Bachelor’s degree
[ ] Post-graduate (e.g. MSc, MBA, Ph.D.)
[ ] Professional qualifications (please
specify)…………………………………………………………………..
[ ] Other (please
specify)…………………………………………………………………………………………………….
Section B- General Information about Your Organisation
Organisational age
[ ] Less than 5 years [ ] 5- Less than 11 years
[ ] 11-20 years [ ] More than 20 years

303
Type of higher education
Ownership:
Public [ ]
Private [ ]
Type of higher education:
University
Higher institution
Technical colleges
[ ]
[ ]
[ ]
Section C - Organisational Culture
In this section we are going to characterise your organisation’s culture. This part consists of 6 questions
that you are asked to rate your organisation. Each question has four alternatives, which refer to four
types of culture. Divide 100 points among the four alternatives depending on the extent to which each
alternative fit to your own organisation. Give a higher number of points to the alternative that is most
fit to your organisation. (For example, in question 1, if you think alternative A is very similar to your
organisation, alternative B and C are somewhat similar, and alternative D is hardly similar at all, you
might give 50 points to A, 25 point to B and 20 points C, and give 5 points to D. Be sure that your total
equals 100 for each question).
These responses mean that you are rating your organisation as it is currently.
C1. Dominant Characteristics Score A The organisation is a very personal place. It is like an extended family.
People seem to share a lot of themselves.
B The organisation is a very dynamic and entrepreneurial place. People are
willing to stick their necks out and take risks.
C The organisation is very results oriented. A major concern is with getting
the job done. People are very competitive and achievement oriented.

304
D The organisation is very controlled and structured place. Formal
procedures generally govern what people do.
Total 100
C2. Organisational Leadership Score A The leadership in the organisation is generally considered to exemplify
mentoring, facilitating, or nurturing.
B The leadership in the organisation is generally considered to exemplify
entrepreneurship, innovating, or risk taking.
C The leadership in the organisation is generally considered to exemplify a
no-nonsense, aggressive, results-oriented focus.
D The leadership in the organisation is generally considered to exemplify
coordinating, organising, or smooth-running efficiency.
Total 100
C3. Management of Employees Score A The management style in the organisation is characterised by teamwork,
Consensus and participation.
B The management style in the organisation is characterised by individual
risk-taking, innovation, freedom and uniqueness.
C The management style in the organisation is characterised by hard-
driving competitiveness, high demands, and achievement.
D The management style in the organisation is characterised by security of
employment, conformity, predictability, and stability in relationships.
Total 100
C4. Organisation Glue Score
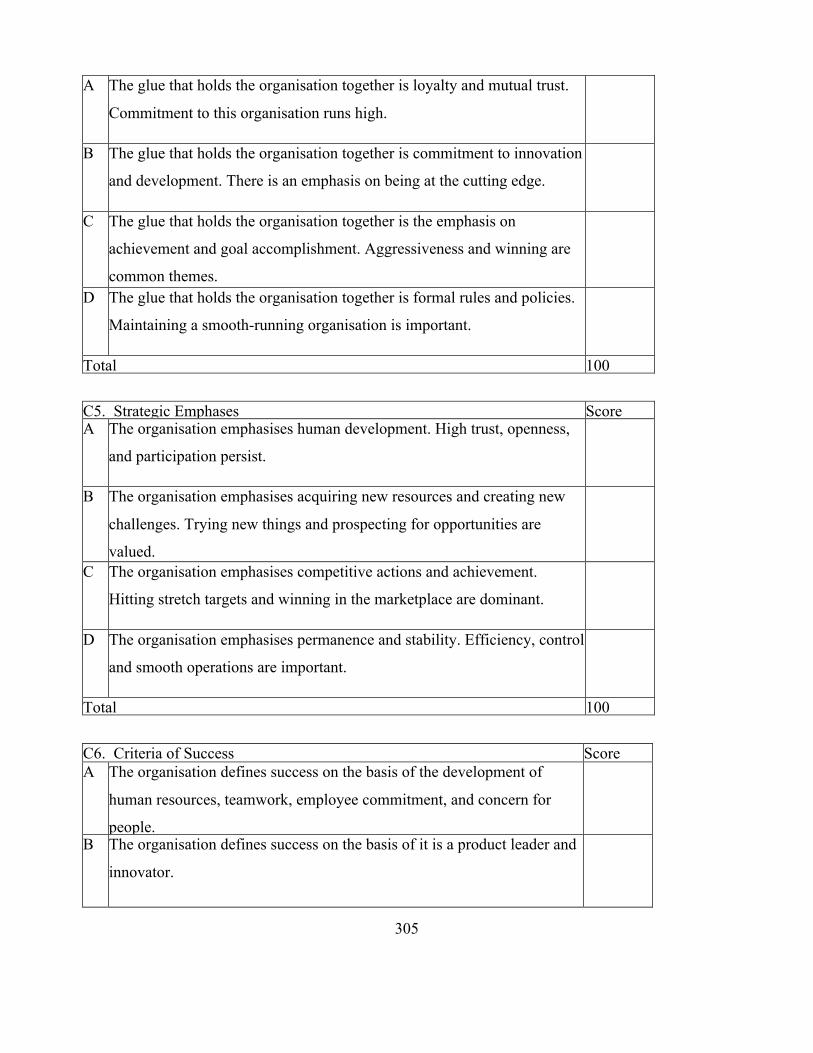
305
A The glue that holds the organisation together is loyalty and mutual trust.
Commitment to this organisation runs high.
B The glue that holds the organisation together is commitment to innovation
and development. There is an emphasis on being at the cutting edge.
C The glue that holds the organisation together is the emphasis on
achievement and goal accomplishment. Aggressiveness and winning are
common themes.
D The glue that holds the organisation together is formal rules and policies.
Maintaining a smooth-running organisation is important.
Total 100
C5. Strategic Emphases Score A The organisation emphasises human development. High trust, openness,
and participation persist.
B The organisation emphasises acquiring new resources and creating new
challenges. Trying new things and prospecting for opportunities are
valued.
C The organisation emphasises competitive actions and achievement.
Hitting stretch targets and winning in the marketplace are dominant.
D The organisation emphasises permanence and stability. Efficiency, control
and smooth operations are important.
Total 100
C6. Criteria of Success Score A The organisation defines success on the basis of the development of
human resources, teamwork, employee commitment, and concern for
people.
B The organisation defines success on the basis of it is a product leader and
innovator.
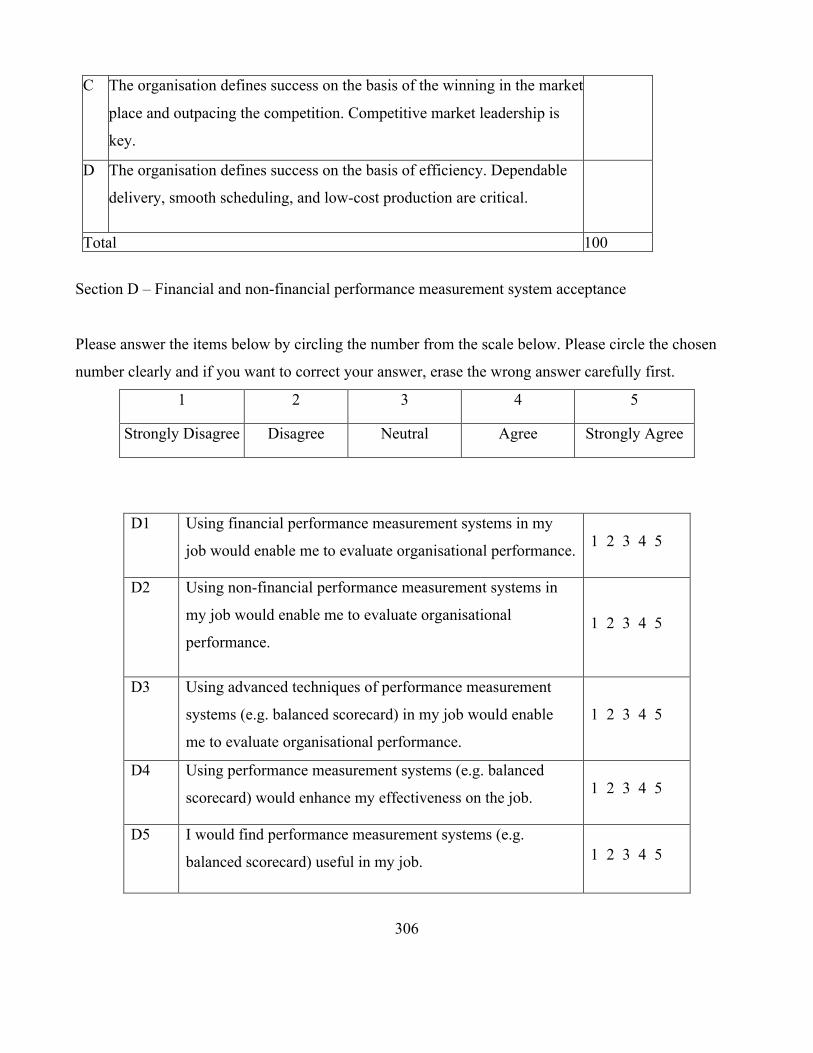
306
C The organisation defines success on the basis of the winning in the market
place and outpacing the competition. Competitive market leadership is
key.
D The organisation defines success on the basis of efficiency. Dependable
delivery, smooth scheduling, and low-cost production are critical.
Total 100
Section D – Financial and non-financial performance measurement system acceptance
Please answer the items below by circling the number from the scale below. Please circle the chosen
number clearly and if you want to correct your answer, erase the wrong answer carefully first.
1 2 3 4 5
Strongly Disagree Disagree Neutral Agree Strongly Agree
D1 Using financial performance measurement systems in my
job would enable me to evaluate organisational performance. 1 2 3 4 5
D2 Using non-financial performance measurement systems in
my job would enable me to evaluate organisational
performance. 1 2 3 4 5
D3 Using advanced techniques of performance measurement
systems (e.g. balanced scorecard) in my job would enable
me to evaluate organisational performance.
1 2 3 4 5
D4 Using performance measurement systems (e.g. balanced
scorecard) would enhance my effectiveness on the job. 1 2 3 4 5
D5 I would find performance measurement systems (e.g.
balanced scorecard) useful in my job. 1 2 3 4 5
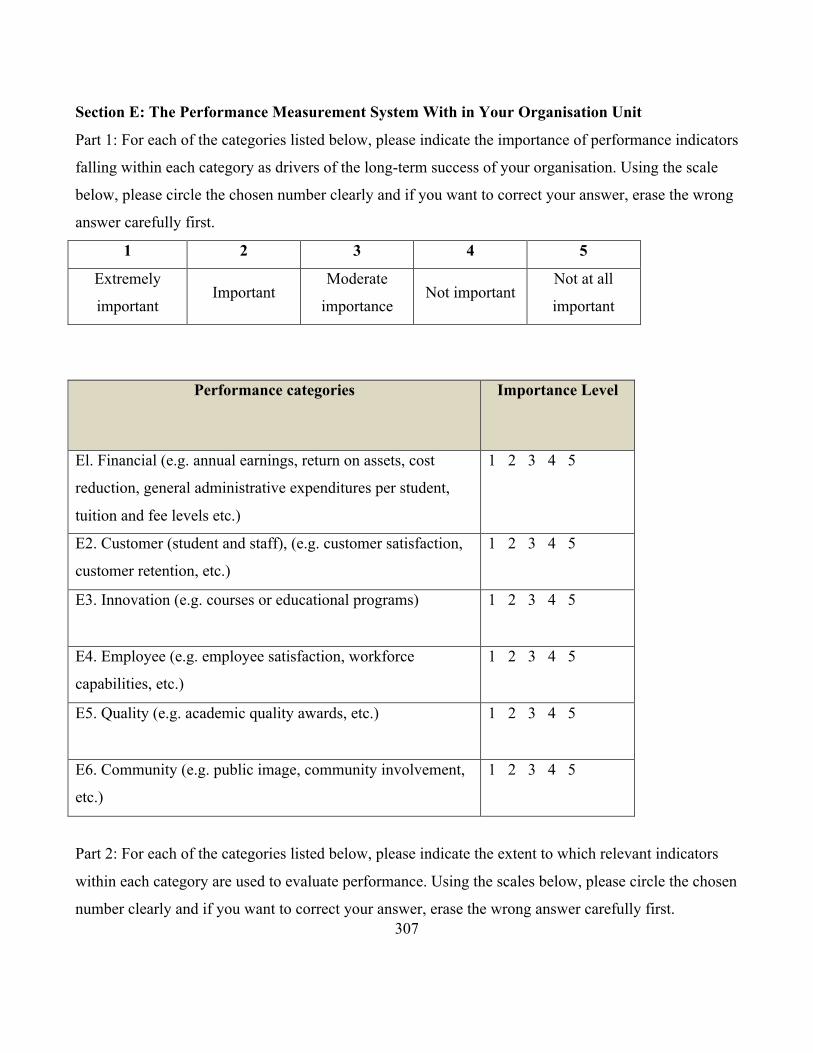
307
Section E: The Performance Measurement System With in Your Organisation Unit
Part 1: For each of the categories listed below, please indicate the importance of performance indicators
falling within each category as drivers of the long-term success of your organisation. Using the scale
below, please circle the chosen number clearly and if you want to correct your answer, erase the wrong
answer carefully first.
1 2 3 4 5
Extremely
important Important
Moderate
importance Not important
Not at all
important
Performance categories Importance Level
El. Financial (e.g. annual earnings, return on assets, cost
reduction, general administrative expenditures per student,
tuition and fee levels etc.)
1 2 3 4 5
E2. Customer (student and staff), (e.g. customer satisfaction,
customer retention, etc.)
1 2 3 4 5
E3. Innovation (e.g. courses or educational programs) 1 2 3 4 5
E4. Employee (e.g. employee satisfaction, workforce
capabilities, etc.)
1 2 3 4 5
E5. Quality (e.g. academic quality awards, etc.) 1 2 3 4 5
E6. Community (e.g. public image, community involvement,
etc.)
1 2 3 4 5
Part 2: For each of the categories listed below, please indicate the extent to which relevant indicators
within each category are used to evaluate performance. Using the scales below, please circle the chosen
number clearly and if you want to correct your answer, erase the wrong answer carefully first.
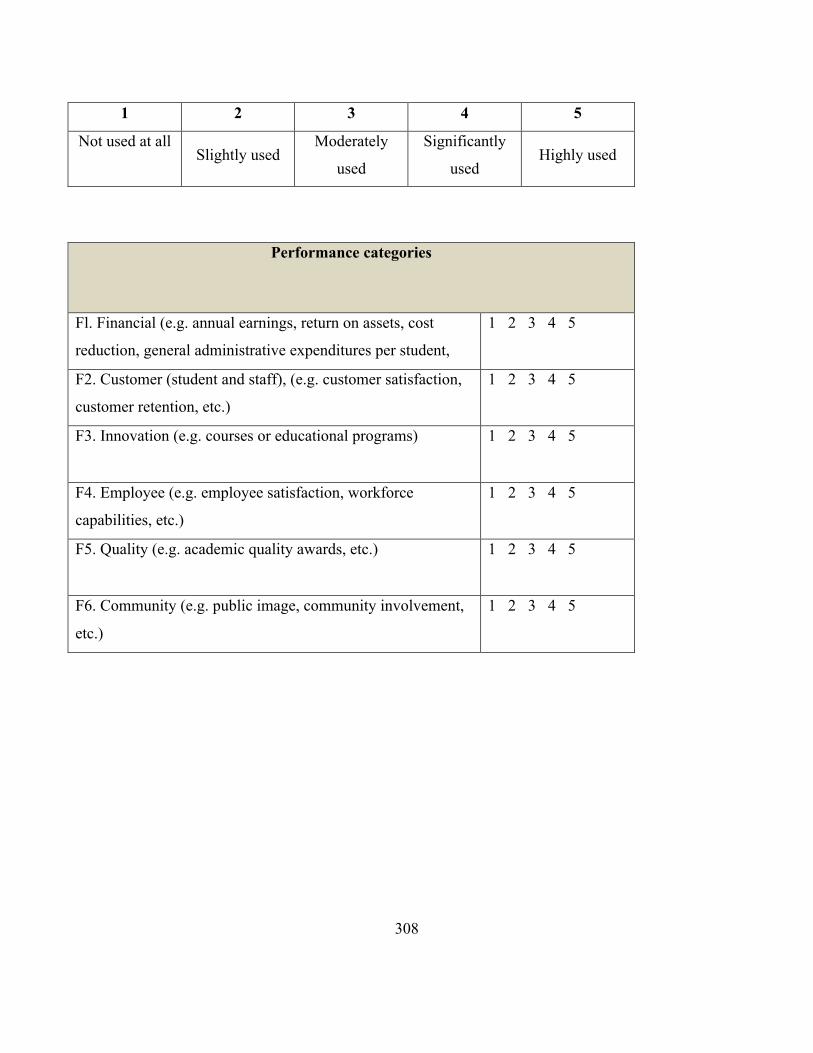
308
1 2 3 4 5
Not used at all
Slightly used
Moderately
used
Significantly
used Highly used
Performance categories
Fl. Financial (e.g. annual earnings, return on assets, cost
reduction, general administrative expenditures per student,
tuition and fee levels etc.)
1 2 3 4 5
F2. Customer (student and staff), (e.g. customer satisfaction,
customer retention, etc.)
1 2 3 4 5
F3. Innovation (e.g. courses or educational programs) 1 2 3 4 5
F4. Employee (e.g. employee satisfaction, workforce
capabilities, etc.)
1 2 3 4 5
F5. Quality (e.g. academic quality awards, etc.) 1 2 3 4 5
F6. Community (e.g. public image, community involvement,
etc.)
1 2 3 4 5

309
Appendix C: An interview guide
I am conducting a research on organisational cultural studies in Libyan higher education. This
interview does not seek to conduct for commercial purpose, in which the information contributed
during the interview sessions are to be remaining strictly confidential and will be used for this PhD
thesis and is in the academic purpose only.
To ensure anonymity, both name and position of the participant are not being included in any parts of
the thesis.
As a material, this interview guide gives an introductory of the two main parts each interview session is
to be engaged.
Part 1: Getting to know the organisation
This part is associated with the information on organisation’s background and other general areas
relevant to the work with Libyan higher education.
Part 2: Diagnosing organisational culture
This part is associated with the actual picture of the organisational culture of the Libyan public and
private universities to support the questionnaire survey results.
Section 1- General Information about Your Self
Job title an position
[ ] The President Of Organisation
[ ] Vice President
[ ] Chief of Finance Department /Assistant/ Vice
[ ] Chief of Administrative Department /Assistant/ Vice
[ ] Financial Controller
[ ] Other (please specify) …………………..
Experience Less than one
year
1-5 years 6-10 years More than 10
years
In the current job [ ] [ ] [ ] [ ]
With the current
organisation
[ ] [ ] [ ] [ ]
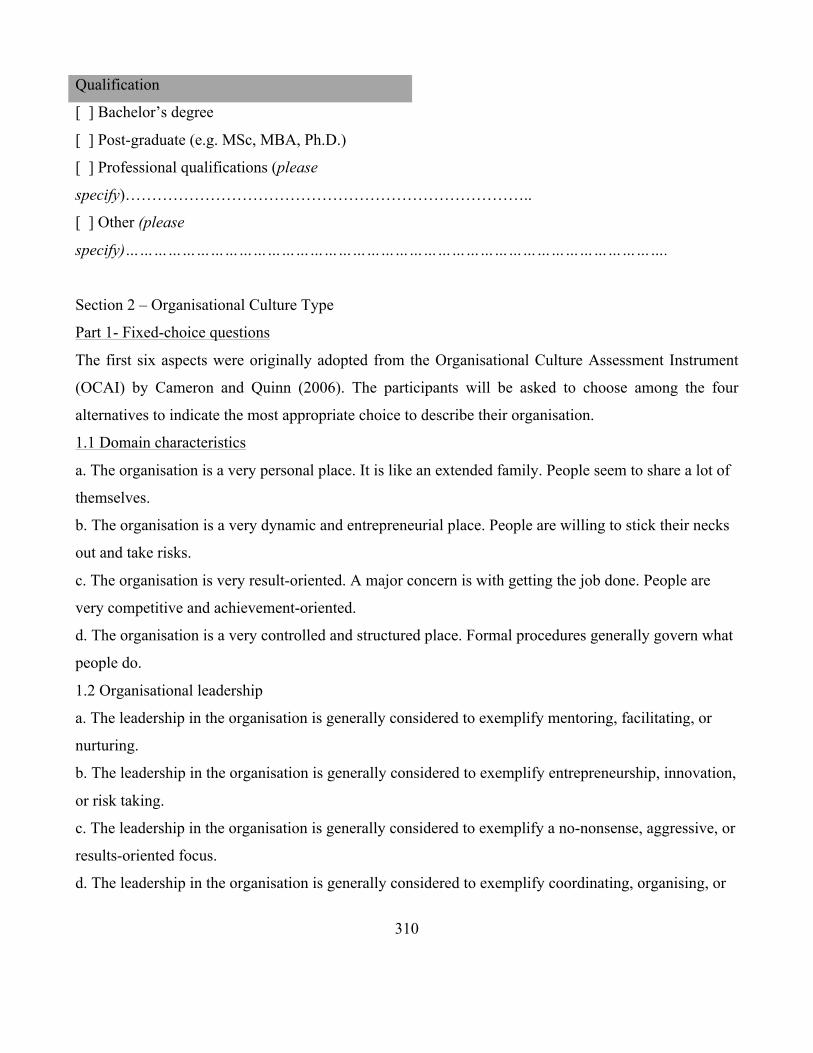
310
Qualification
[ ] Bachelor’s degree
[ ] Post-graduate (e.g. MSc, MBA, Ph.D.)
[ ] Professional qualifications (please
specify)…………………………………………………………………..
[ ] Other (please
specify)…………………………………………………………………………………………………….
Section 2 – Organisational Culture Type
Part 1- Fixed-choice questions
The first six aspects were originally adopted from the Organisational Culture Assessment Instrument
(OCAI) by Cameron and Quinn (2006). The participants will be asked to choose among the four
alternatives to indicate the most appropriate choice to describe their organisation.
1.1 Domain characteristics
a. The organisation is a very personal place. It is like an extended family. People seem to share a lot of
themselves.
b. The organisation is a very dynamic and entrepreneurial place. People are willing to stick their necks
out and take risks.
c. The organisation is very result-oriented. A major concern is with getting the job done. People are
very competitive and achievement-oriented.
d. The organisation is a very controlled and structured place. Formal procedures generally govern what
people do.
1.2 Organisational leadership
a. The leadership in the organisation is generally considered to exemplify mentoring, facilitating, or
nurturing.
b. The leadership in the organisation is generally considered to exemplify entrepreneurship, innovation,
or risk taking.
c. The leadership in the organisation is generally considered to exemplify a no-nonsense, aggressive, or
results-oriented focus.
d. The leadership in the organisation is generally considered to exemplify coordinating, organising, or
311
smooth-running efficiency.
1.3 Management of employees
a. The management style in the organisation is characterised by teamwork, consensus, and
participation.
b. The management style in the organisation is characterised by individual risk taking, innovation,
freedom, and uniqueness.
c. The management style in the organisation is characterised by hard-driving competitiveness, high
demands, and achievement.
d. The management style in the organisation is characterised by security of employment, conformity,
predictability, and stability in relationships.
1.4 Organisation glue/cohesion
a. The glue that holds organisation together is loyalty and mutual trust.
Commitment to this organisation runs high.
b. The glue that holds organisation together is commitment to innovation and development. There is an
emphasis on being on the cutting edge.
c. The glue that holds organisation together is the emphasis on achievement and goal accomplishment.
d. The glue that holds organisation together is formal rules and policies.
Maintaining a smooth-running organisation is important.
1.5 Strategic emphasis
a. The organisation emphasizes human development. High trust, openness, and participation persist.
b. The organisation emphasizes acquiring new resources and creating new challenges. Trying new
things and prospecting for opportunities are valued.
c. The organisation emphasizes competitive actions and achievement. Hitting stretch targets and
winning in the marketplace are dominant.
d. The organisation emphasizes permanence and stability. Efficiency, control, and smooth operations
are important.
1.6 Criteria of success
a. The organisation defines success on the basis of the development of human resources, teamwork,
employee commitment, and concern for people.
b. The organisation defines success on the basis of having the most unique or newest products. It is a
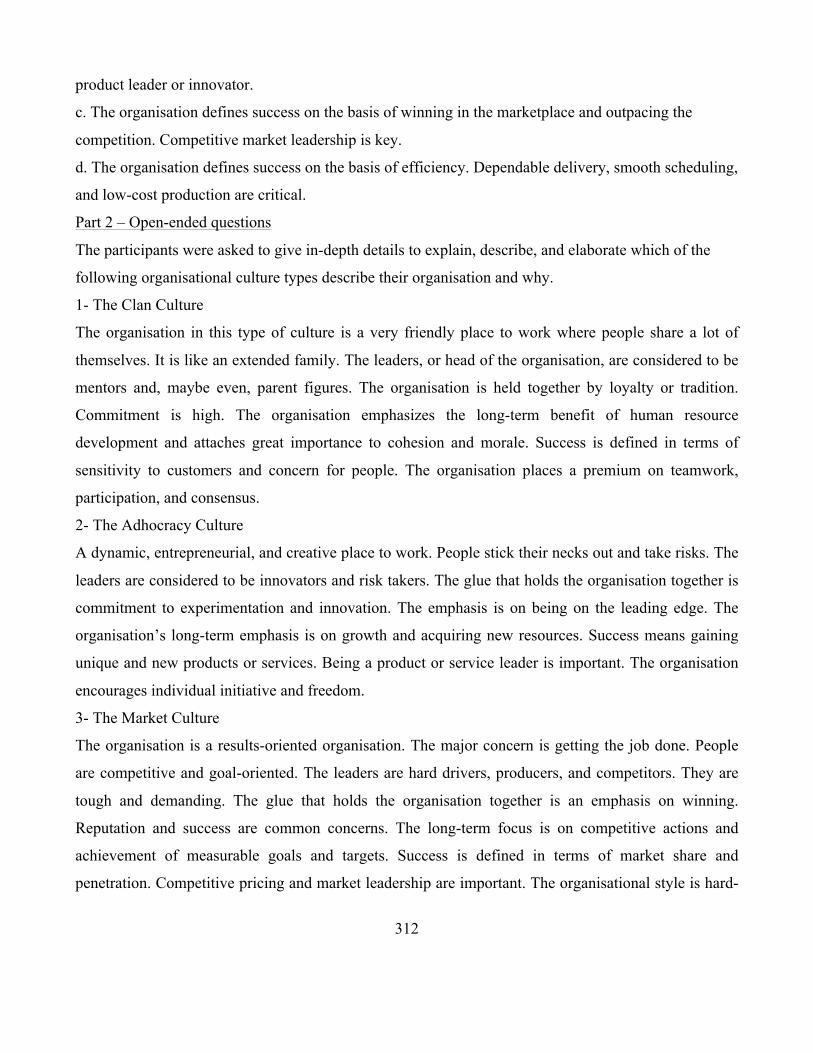
312
product leader or innovator.
c. The organisation defines success on the basis of winning in the marketplace and outpacing the
competition. Competitive market leadership is key.
d. The organisation defines success on the basis of efficiency. Dependable delivery, smooth scheduling,
and low-cost production are critical.
Part 2 – Open-ended questions
The participants were asked to give in-depth details to explain, describe, and elaborate which of the
following organisational culture types describe their organisation and why.
1- The Clan Culture
The organisation in this type of culture is a very friendly place to work where people share a lot of
themselves. It is like an extended family. The leaders, or head of the organisation, are considered to be
mentors and, maybe even, parent figures. The organisation is held together by loyalty or tradition.
Commitment is high. The organisation emphasizes the long-term benefit of human resource
development and attaches great importance to cohesion and morale. Success is defined in terms of
sensitivity to customers and concern for people. The organisation places a premium on teamwork,
participation, and consensus.
2- The Adhocracy Culture
A dynamic, entrepreneurial, and creative place to work. People stick their necks out and take risks. The
leaders are considered to be innovators and risk takers. The glue that holds the organisation together is
commitment to experimentation and innovation. The emphasis is on being on the leading edge. The
organisation’s long-term emphasis is on growth and acquiring new resources. Success means gaining
unique and new products or services. Being a product or service leader is important. The organisation
encourages individual initiative and freedom.
3- The Market Culture
The organisation is a results-oriented organisation. The major concern is getting the job done. People
are competitive and goal-oriented. The leaders are hard drivers, producers, and competitors. They are
tough and demanding. The glue that holds the organisation together is an emphasis on winning.
Reputation and success are common concerns. The long-term focus is on competitive actions and
achievement of measurable goals and targets. Success is defined in terms of market share and
penetration. Competitive pricing and market leadership are important. The organisational style is hard-
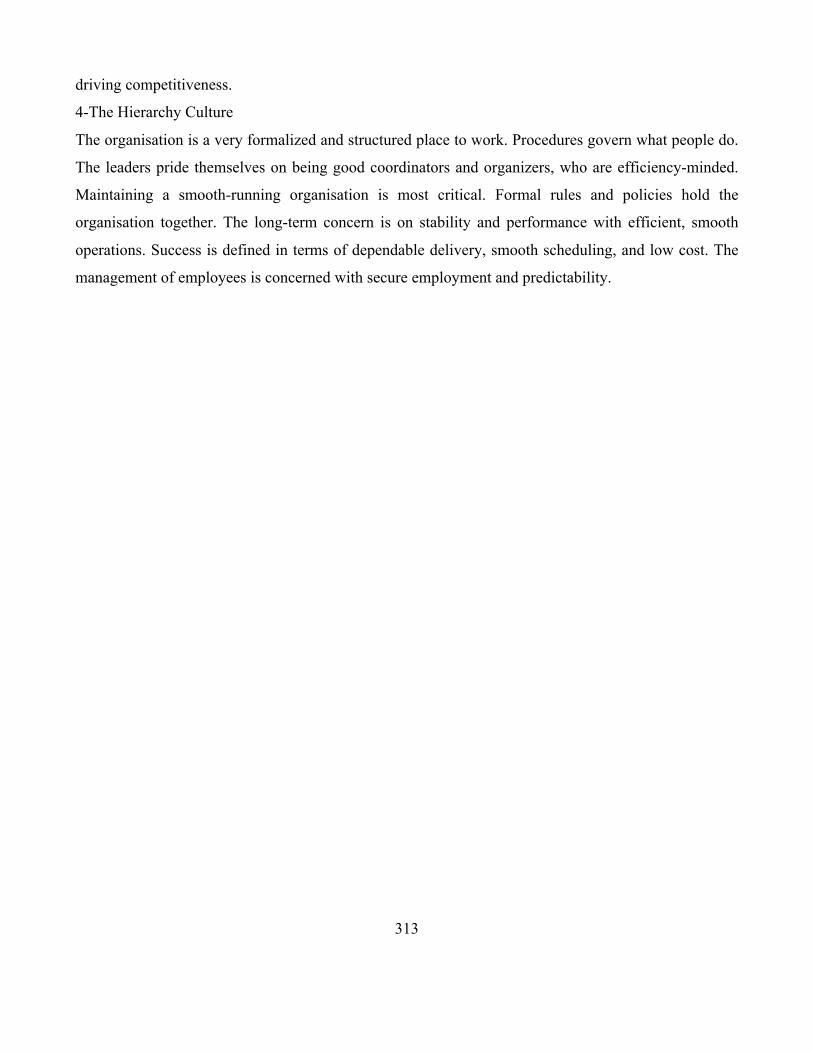
313
driving competitiveness.
4-The Hierarchy Culture
The organisation is a very formalized and structured place to work. Procedures govern what people do.
The leaders pride themselves on being good coordinators and organizers, who are efficiency-minded.
Maintaining a smooth-running organisation is most critical. Formal rules and policies hold the
organisation together. The long-term concern is on stability and performance with efficient, smooth
operations. Success is defined in terms of dependable delivery, smooth scheduling, and low cost. The
management of employees is concerned with secure employment and predictability.
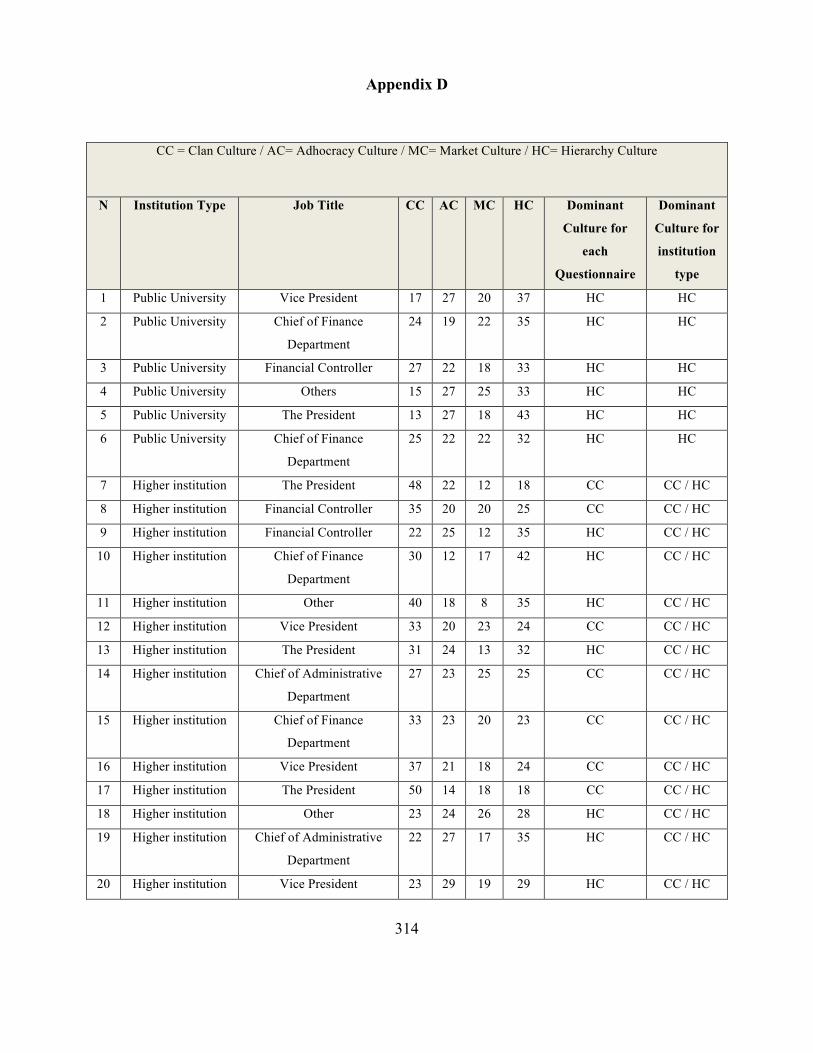
314
Appendix D
CC = Clan Culture / AC= Adhocracy Culture / MC= Market Culture / HC= Hierarchy Culture
N Institution Type Job Title CC AC MC HC Dominant
Culture for
each
Questionnaire
Dominant
Culture for
institution
type
1 Public University Vice President 17 27 20 37 HC HC
2 Public University Chief of Finance
Department
24 19 22 35 HC HC
3 Public University Financial Controller 27 22 18 33 HC HC
4 Public University Others 15 27 25 33 HC HC
5 Public University The President 13 27 18 43 HC HC
6 Public University Chief of Finance
Department
25 22 22 32 HC HC
7 Higher institution The President 48 22 12 18 CC CC / HC
8 Higher institution Financial Controller 35 20 20 25 CC CC / HC
9 Higher institution Financial Controller 22 25 12 35 HC CC / HC
10 Higher institution Chief of Finance
Department
30 12 17 42 HC CC / HC
11 Higher institution Other 40 18 8 35 HC CC / HC
12 Higher institution Vice President 33 20 23 24 CC CC / HC
13 Higher institution The President 31 24 13 32 HC CC / HC
14 Higher institution Chief of Administrative
Department
27 23 25 25 CC CC / HC
15 Higher institution Chief of Finance
Department
33 23 20 23 CC CC / HC
16 Higher institution Vice President 37 21 18 24 CC CC / HC
17 Higher institution The President 50 14 18 18 CC CC / HC
18 Higher institution Other 23 24 26 28 HC CC / HC
19 Higher institution Chief of Administrative
Department
22 27 17 35 HC CC / HC
20 Higher institution Vice President 23 29 19 29 HC CC / HC
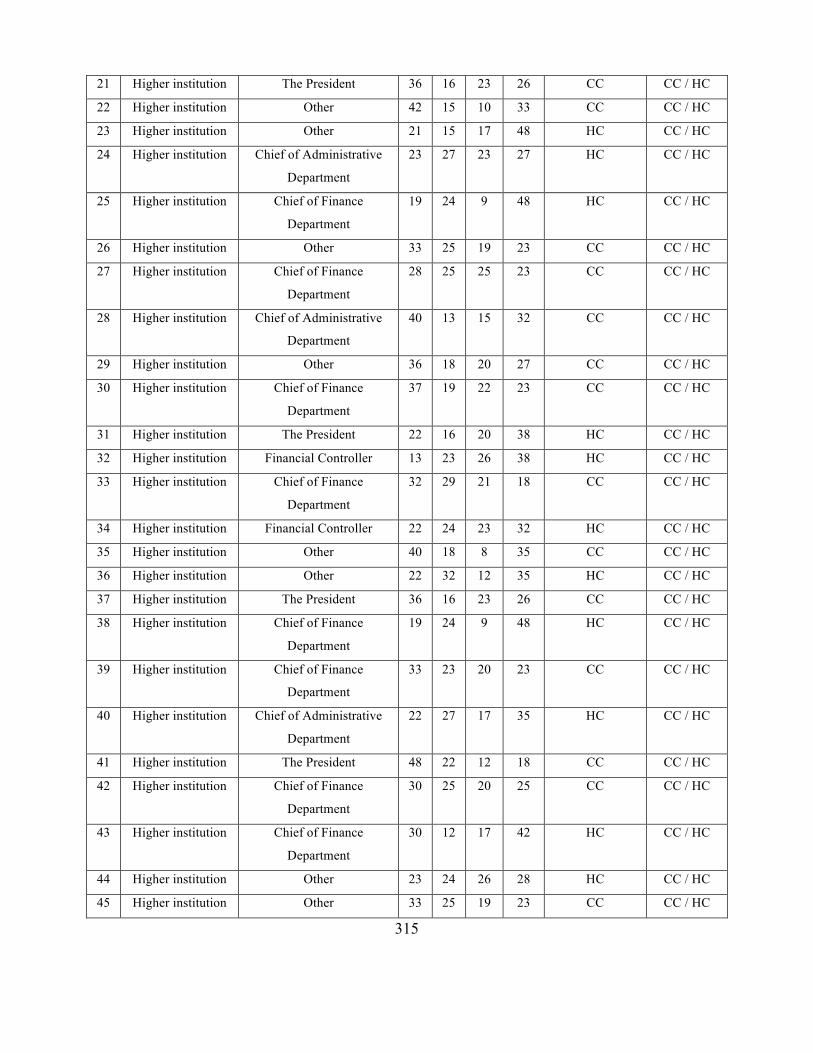
315
21 Higher institution The President 36 16 23 26 CC CC / HC
22 Higher institution Other 42 15 10 33 CC CC / HC
23 Higher institution Other 21 15 17 48 HC CC / HC
24 Higher institution Chief of Administrative
Department
23 27 23 27 HC CC / HC
25 Higher institution Chief of Finance
Department
19 24 9 48 HC CC / HC
26 Higher institution Other 33 25 19 23 CC CC / HC
27 Higher institution Chief of Finance
Department
28 25 25 23 CC CC / HC
28 Higher institution Chief of Administrative
Department
40 13 15 32 CC CC / HC
29 Higher institution Other 36 18 20 27 CC CC / HC
30 Higher institution Chief of Finance
Department
37 19 22 23 CC CC / HC
31 Higher institution The President 22 16 20 38 HC CC / HC
32 Higher institution Financial Controller 13 23 26 38 HC CC / HC
33 Higher institution Chief of Finance
Department
32 29 21 18 CC CC / HC
34 Higher institution Financial Controller 22 24 23 32 HC CC / HC
35 Higher institution Other 40 18 8 35 CC CC / HC
36 Higher institution Other 22 32 12 35 HC CC / HC
37 Higher institution The President 36 16 23 26 CC CC / HC
38 Higher institution Chief of Finance
Department
19 24 9 48 HC CC / HC
39 Higher institution Chief of Finance
Department
33 23 20 23 CC CC / HC
40 Higher institution Chief of Administrative
Department
22 27 17 35 HC CC / HC
41 Higher institution The President 48 22 12 18 CC CC / HC
42 Higher institution Chief of Finance
Department
30 25 20 25 CC CC / HC
43 Higher institution Chief of Finance
Department
30 12 17 42 HC CC / HC
44 Higher institution Other 23 24 26 28 HC CC / HC
45 Higher institution Other 33 25 19 23 CC CC / HC
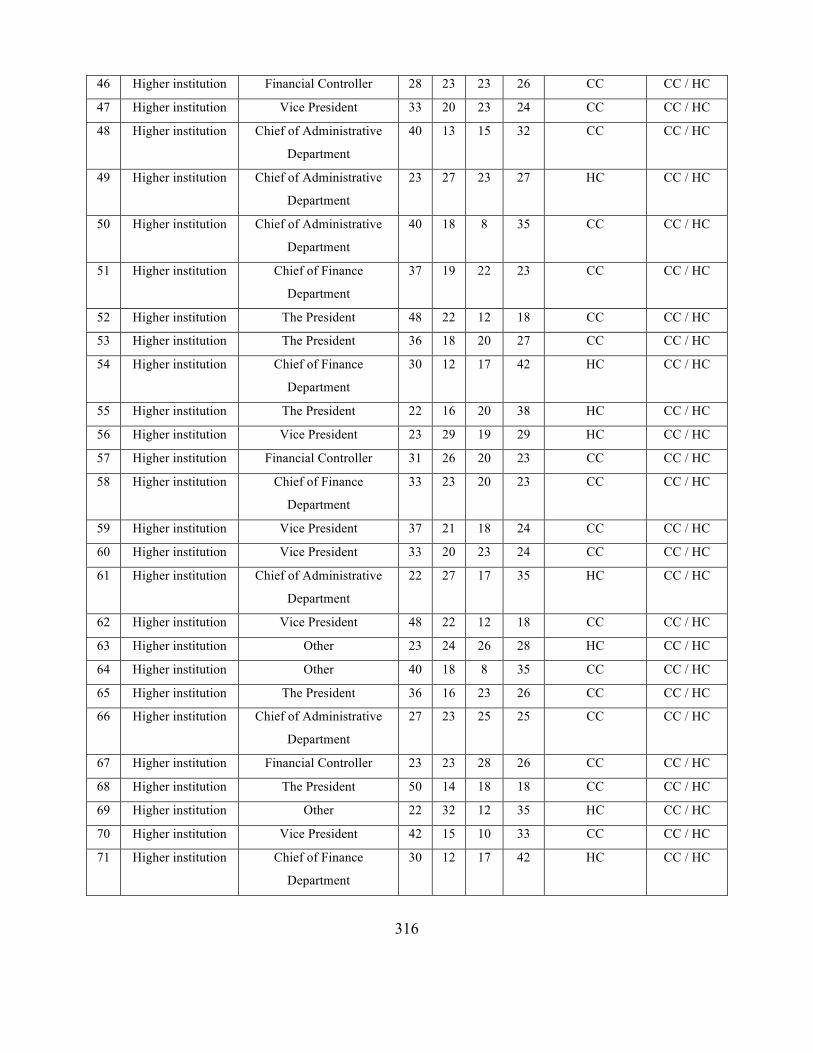
316
46 Higher institution Financial Controller 28 23 23 26 CC CC / HC
47 Higher institution Vice President 33 20 23 24 CC CC / HC
48 Higher institution Chief of Administrative
Department
40 13 15 32 CC CC / HC
49 Higher institution Chief of Administrative
Department
23 27 23 27 HC CC / HC
50 Higher institution Chief of Administrative
Department
40 18 8 35 CC CC / HC
51 Higher institution Chief of Finance
Department
37 19 22 23 CC CC / HC
52 Higher institution The President 48 22 12 18 CC CC / HC
53 Higher institution The President 36 18 20 27 CC CC / HC
54 Higher institution Chief of Finance
Department
30 12 17 42 HC CC / HC
55 Higher institution The President 22 16 20 38 HC CC / HC
56 Higher institution Vice President 23 29 19 29 HC CC / HC
57 Higher institution Financial Controller 31 26 20 23 CC CC / HC
58 Higher institution Chief of Finance
Department
33 23 20 23 CC CC / HC
59 Higher institution Vice President 37 21 18 24 CC CC / HC
60 Higher institution Vice President 33 20 23 24 CC CC / HC
61 Higher institution Chief of Administrative
Department
22 27 17 35 HC CC / HC
62 Higher institution Vice President 48 22 12 18 CC CC / HC
63 Higher institution Other 23 24 26 28 HC CC / HC
64 Higher institution Other 40 18 8 35 CC CC / HC
65 Higher institution The President 36 16 23 26 CC CC / HC
66 Higher institution Chief of Administrative
Department
27 23 25 25 CC CC / HC
67 Higher institution Financial Controller 23 23 28 26 CC CC / HC
68 Higher institution The President 50 14 18 18 CC CC / HC
69 Higher institution Other 22 32 12 35 HC CC / HC
70 Higher institution Vice President 42 15 10 33 CC CC / HC
71 Higher institution Chief of Finance
Department
30 12 17 42 HC CC / HC
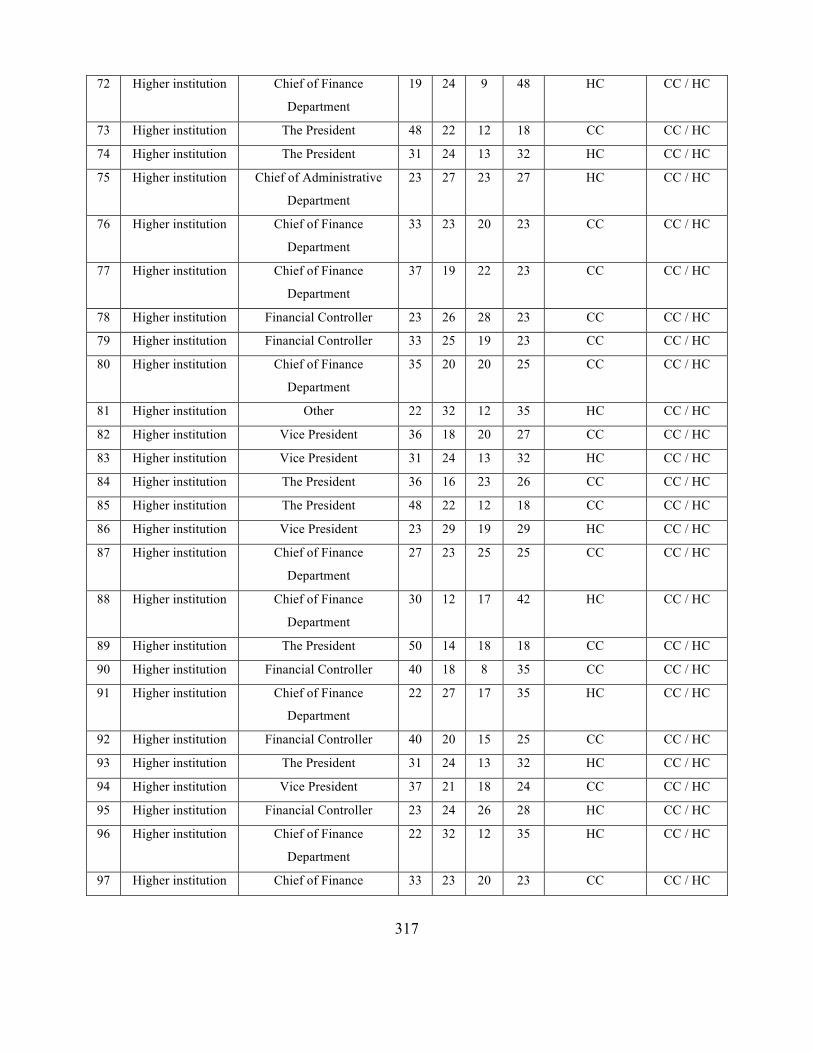
317
72 Higher institution Chief of Finance
Department
19 24 9 48 HC CC / HC
73 Higher institution The President 48 22 12 18 CC CC / HC
74 Higher institution The President 31 24 13 32 HC CC / HC
75 Higher institution Chief of Administrative
Department
23 27 23 27 HC CC / HC
76 Higher institution Chief of Finance
Department
33 23 20 23 CC CC / HC
77 Higher institution Chief of Finance
Department
37 19 22 23 CC CC / HC
78 Higher institution Financial Controller 23 26 28 23 CC CC / HC
79 Higher institution Financial Controller 33 25 19 23 CC CC / HC
80 Higher institution Chief of Finance
Department
35 20 20 25 CC CC / HC
81 Higher institution Other 22 32 12 35 HC CC / HC
82 Higher institution Vice President 36 18 20 27 CC CC / HC
83 Higher institution Vice President 31 24 13 32 HC CC / HC
84 Higher institution The President 36 16 23 26 CC CC / HC
85 Higher institution The President 48 22 12 18 CC CC / HC
86 Higher institution Vice President 23 29 19 29 HC CC / HC
87 Higher institution Chief of Finance
Department
27 23 25 25 CC CC / HC
88 Higher institution Chief of Finance
Department
30 12 17 42 HC CC / HC
89 Higher institution The President 50 14 18 18 CC CC / HC
90 Higher institution Financial Controller 40 18 8 35 CC CC / HC
91 Higher institution Chief of Finance
Department
22 27 17 35 HC CC / HC
92 Higher institution Financial Controller 40 20 15 25 CC CC / HC
93 Higher institution The President 31 24 13 32 HC CC / HC
94 Higher institution Vice President 37 21 18 24 CC CC / HC
95 Higher institution Financial Controller 23 24 26 28 HC CC / HC
96 Higher institution Chief of Finance
Department
22 32 12 35 HC CC / HC
97 Higher institution Chief of Finance 33 23 20 23 CC CC / HC
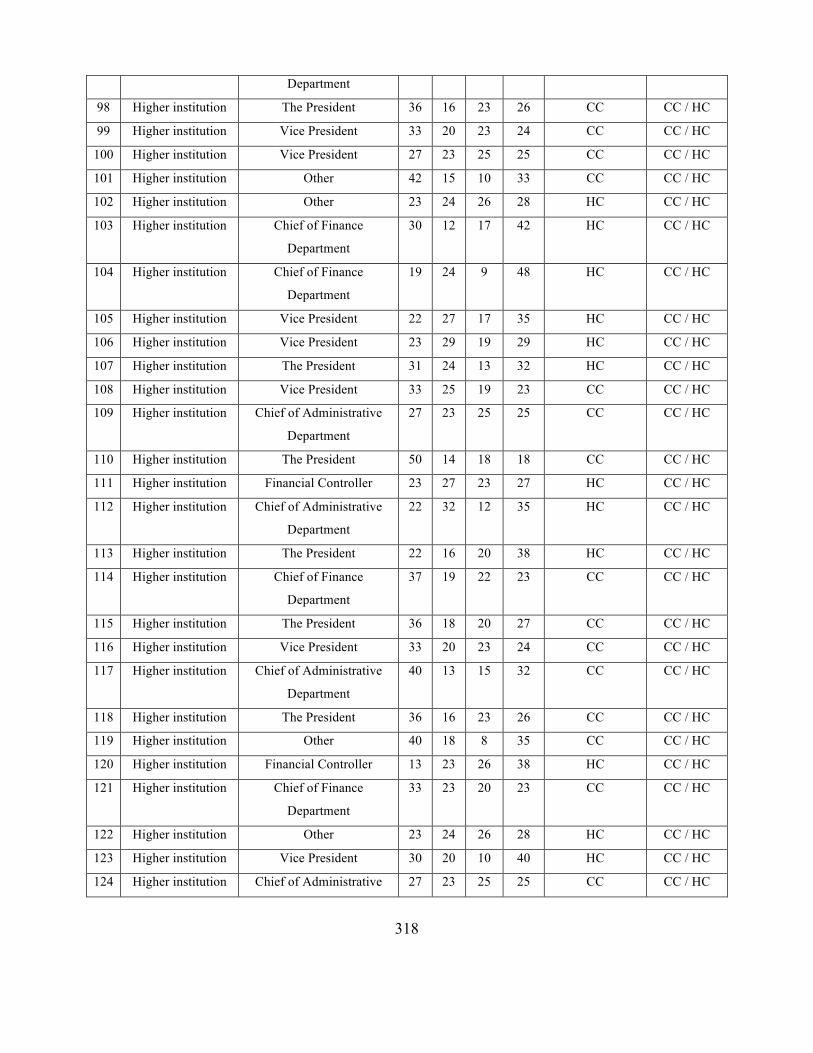
318
Department
98 Higher institution The President 36 16 23 26 CC CC / HC
99 Higher institution Vice President 33 20 23 24 CC CC / HC
100 Higher institution Vice President 27 23 25 25 CC CC / HC
101 Higher institution Other 42 15 10 33 CC CC / HC
102 Higher institution Other 23 24 26 28 HC CC / HC
103 Higher institution Chief of Finance
Department
30 12 17 42 HC CC / HC
104 Higher institution Chief of Finance
Department
19 24 9 48 HC CC / HC
105 Higher institution Vice President 22 27 17 35 HC CC / HC
106 Higher institution Vice President 23 29 19 29 HC CC / HC
107 Higher institution The President 31 24 13 32 HC CC / HC
108 Higher institution Vice President 33 25 19 23 CC CC / HC
109 Higher institution Chief of Administrative
Department
27 23 25 25 CC CC / HC
110 Higher institution The President 50 14 18 18 CC CC / HC
111 Higher institution Financial Controller 23 27 23 27 HC CC / HC
112 Higher institution Chief of Administrative
Department
22 32 12 35 HC CC / HC
113 Higher institution The President 22 16 20 38 HC CC / HC
114 Higher institution Chief of Finance
Department
37 19 22 23 CC CC / HC
115 Higher institution The President 36 18 20 27 CC CC / HC
116 Higher institution Vice President 33 20 23 24 CC CC / HC
117 Higher institution Chief of Administrative
Department
40 13 15 32 CC CC / HC
118 Higher institution The President 36 16 23 26 CC CC / HC
119 Higher institution Other 40 18 8 35 CC CC / HC
120 Higher institution Financial Controller 13 23 26 38 HC CC / HC
121 Higher institution Chief of Finance
Department
33 23 20 23 CC CC / HC
122 Higher institution Other 23 24 26 28 HC CC / HC
123 Higher institution Vice President 30 20 10 40 HC CC / HC
124 Higher institution Chief of Administrative 27 23 25 25 CC CC / HC

319
Department
125 Higher institution Vice President 23 29 19 29 HC CC / HC
126 Higher institution Chief of Finance
Department
33 25 19 23 CC CC / HC
127 Higher institution The President 31 24 13 32 HC CC / HC
128 Higher institution Chief of Administrative
Department
23 27 23 27 HC CC / HC
129 Higher institution Chief of Finance
Department
32 29 21 18 CC CC / HC
130 Higher institution Other 21 15 17 48 HC CC / HC
131 Higher institution Vice President 37 21 18 24 CC CC / HC
132 Higher institution Financial Controller 22 24 23 32 HC CC / HC
133 Higher institution Vice President 42 15 10 33 CC CC / HC
134 Higher institution Vice President 22 16 20 38 HC CC / HC
135 Higher institution The President 50 14 18 18 CC CC / HC
136 Higher institution Chief of Administrative
Department
22 27 17 35 HC CC / HC
137 Higher institution Vice President 23 29 19 29 HC CC / HC
138 Higher institution Financial Controller 22 24 23 32 HC CC / HC
139 Higher institution Vice President 37 21 18 24 CC CC / HC
140 Higher institution Chief of Finance
Department
32 29 21 18 CC CC / HC
141 Higher institution Financial Controller 23 24 26 28 HC CC / HC
142 Higher institution Financial Controller 22 24 23 32 HC CC / HC
143 Higher institution Vice President 33 20 23 24 CC CC / HC
144 Higher institution Financial Controller 13 23 26 38 HC CC / HC
145 Higher institution Chief of Finance
Department
30 10 10 50 HC CC / HC
146 Higher institution Financial Controller 19 24 9 48 HC CC / HC
147 Higher institution The President 50 14 18 18 CC CC / HC
148 Higher institution Financial Controller 33 25 19 23 CC CC / HC
149 Higher institution Vice President 37 21 18 24 CC CC / HC
150 Higher institution Other 21 15 17 48 HC CC / HC
151 Higher institution Vice President 37 19 22 23 CC CC / HC
152 Higher institution Other 42 15 10 33 CC CC / HC

320
153 Higher institution The President 22 16 20 38 HC CC / HC
154 Higher institution Chief of Administrative
Department
40 13 15 32 CC CC / HC
155 Higher institution Other 21 15 17 48 HC CC / HC
156 Higher institution Chief of Finance
Department
32 29 21 18 CC CC / HC
157 Higher institution Financial Controller 36 18 20 27 CC CC / HC
158 Higher institution Financial Controller 22 24 23 32 HC CC / HC
159 Higher institution Chief of Finance
Department
20 10 10 60 HC CC / HC
160 Higher institution Chief of Finance
Department
13 23 26 38 HC CC / HC
161 Higher institution Chief of Administrative
Department
23 27 23 27 HC CC / HC
162 Higher institution Financial Controller 21 15 17 48 HC CC / HC
163 Higher institution The President 22 16 20 38 HC CC / HC
164 Higher institution Chief of Administrative
Department
40 13 15 32 CC CC / HC
165 Higher institution Chief of Finance
Department
19 24 9 48 HC CC / HC
166 Higher institution Chief of Finance
Department
37 19 22 23 CC CC / HC
167 Higher institution Financial Controller 42 15 10 33 CC CC / HC
168 Higher institution Vice President 36 18 20 27 CC CC / HC
169 Higher institution Other 33 25 19 23 CC CC / HC
170 Higher institution Chief of Administrative
Department
40 13 15 32 CC CC / HC
171 Technical colleges The President 18 18 26 38 HC HC
172 Technical colleges Chief of Finance
Department
32 23 17 28 CC HC
173 Technical colleges Financial Controller 8 20 21 52 HC HC
174 Technical colleges Vice President 35 17 20 28 CC HC
175 Technical colleges Chief of Administrative
Department
40 20 10 30 CC HC
176 Technical colleges Financial Controller 53 20 15 12 CC HC
177 Technical colleges The President 18 18 26 38 HC HC
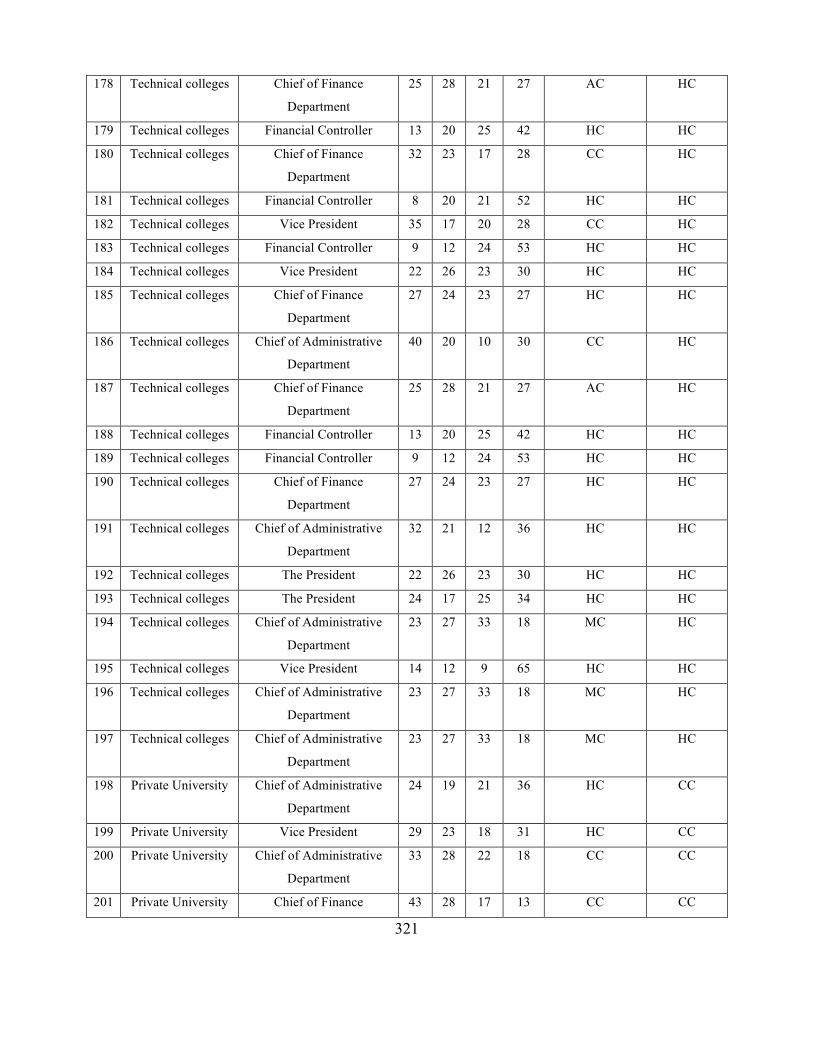
321
178 Technical colleges Chief of Finance
Department
25 28 21 27 AC HC
179 Technical colleges Financial Controller 13 20 25 42 HC HC
180 Technical colleges Chief of Finance
Department
32 23 17 28 CC HC
181 Technical colleges Financial Controller 8 20 21 52 HC HC
182 Technical colleges Vice President 35 17 20 28 CC HC
183 Technical colleges Financial Controller 9 12 24 53 HC HC
184 Technical colleges Vice President 22 26 23 30 HC HC
185 Technical colleges Chief of Finance
Department
27 24 23 27 HC HC
186 Technical colleges Chief of Administrative
Department
40 20 10 30 CC HC
187 Technical colleges Chief of Finance
Department
25 28 21 27 AC HC
188 Technical colleges Financial Controller 13 20 25 42 HC HC
189 Technical colleges Financial Controller 9 12 24 53 HC HC
190 Technical colleges Chief of Finance
Department
27 24 23 27 HC HC
191 Technical colleges Chief of Administrative
Department
32 21 12 36 HC HC
192 Technical colleges The President 22 26 23 30 HC HC
193 Technical colleges The President 24 17 25 34 HC HC
194 Technical colleges Chief of Administrative
Department
23 27 33 18 MC HC
195 Technical colleges Vice President 14 12 9 65 HC HC
196 Technical colleges Chief of Administrative
Department
23 27 33 18 MC HC
197 Technical colleges Chief of Administrative
Department
23 27 33 18 MC HC
198 Private University Chief of Administrative
Department
24 19 21 36 HC CC
199 Private University Vice President 29 23 18 31 HC CC
200 Private University Chief of Administrative
Department
33 28 22 18 CC CC
201 Private University Chief of Finance 43 28 17 13 CC CC

322
Department
202 Private University Vice President 33 23 23 22 CC CC
203 Private University Others 39 18 21 23 CC CC
204 Private University The President 41 22 17 21 CC CC
205 Private University Chief of Finance
Department
28 30 23 20 AC CC
206 Private University The President 29 25 23 23 CC CC
207 Private University Vice President 31 23 21 26 CC CC
208 Private University The President 33 19 31 18 CC CC
209 Private University Chief of Finance
Department
30 23 18 28 CC CC
210 Private University Vice President 36 20 29 15 CC CC
211 Private University Chief of Finance
Department
31 21 19 29 CC CC
212 Private University Other 37 23 27 14 CC CC
213 Private University Vice President 35 23 24 18 CC CC
214 Private University Chief of Finance
Department
32 21 28 19 CC CC
215 Private University Vice President 31 21 19 29 CC CC
216 Private University Chief of Administrative
Department
40 20 22 18 CC CC
217 Private University The President 32 18 35 16 CC CC
218 Private University Other 35 19 18 28 CC CC
219 Private University Chief of Finance
Department
42 13 30 15 CC CC
220 Private University Vice President 36 17 29 18 CC CC
221 Private University Chief of Finance
Department
33 26 22 20 CC CC
222 Private University The President 43 17 25 15 CC CC
223 Private University Vice President 46 13 23 18 CC CC
224 Private University Chief of Finance
Department
33 24 24 19 CC CC
225 Private University The President 34 23 23 19 CC CC
226 Private University Chief of Administrative
Department
38 21 24 18 CC CC

323
227 Private University Chief of Administrative
Department
38 13 22 27 CC CC
228 Private University Chief of Finance
Department
27 27 18 29 HC CC
229 Private University Other 31 24 22 23 CC CC
230 Private University Vice President 35 20 21 24 CC CC
231 Private University Chief of Finance
Department
33 21 27 19 CC CC
232 Private University Vice President 37 23 19 21 CC CC
233 Private University The President 33 19 18 29 CC CC
234 Private University Chief of Administrative
Department
36 26 19 19 CC CC
235 Private University Other 23 27 14 5 AC CC
236 Public University Vice President 23 24 18 4 AC HC
237 Public University Chief of Finance
Department
0 17 17 67 HC HC
238 Public University Chief of Administrative
Department
22 23 24 32 HC HC
239 Public University Chief of Finance
Department
25 32 13 30 AC HC
240 Public University The President 27 33 22 18 AC HC
241 Public University Vice President 22 18 20 42 HC HC
242 Public University Financial Controller 35 33 18 14 CC HC
243 Public University Chief of Finance
Department
8 22 21 50 HC HC
244 Public University Chief of Finance
Department
28 21 15 37 HC HC
245 Public University Financial Controller 21 24 22 33 HC HC
246 Public University Chief of Finance
Department
24 12 12 53 HC HC
247 Public University The President 27 23 28 24 MC HC
248 Public University Vice President 28 26 17 30 HC HC
249 Public University The President 19 28 23 30 HC HC
250 Public University Vice President 18 17 21 43 HC HC
251 Public University Chief of Finance
Department
13 27 13 47 HC HC

324
252 Public University Chief of Finance
Department
13 17 26 42 HC HC
253 Public University Financial Controller 20 17 20 43 HC HC
254 Public University The President 19 20 23 38 HC HC
255 Public University Vice President 10 26 18 46 HC HC
256 Public University Chief of Finance
Department
23 22 16 40 HC HC
257 Public University Chief of Administrative
Department
17 23 14 45 HC HC
Institution
Type
Usable
Questionnaires
Hierarchy
culture
Clan
Culture
Market
culture
Adhocracy
culture
Dominant
Culture
for
institution
type
Percentage
of Who
Have the
Dominant
Culture
Type
Private
Universities
37 3 32 0 2 Clan
Culture
%86
Public
Universities
29 24 1 1 3 Hierarchy
culture
%83
Higher
Institutions
164 73 91 0 0 Clan
Culture
%55
Technical
colleges
27 18 6 1 2 Hierarchy
culture
%59

325
N Institution
Type
Job Title Clan
culture
Adhocracy
culture
Market
culture
Hierarchy
culture
Dominant
Culture for
each
Questionnaire
Dominant
Culture
for
institution
type
1 Public
University
Vice
President
17 27 20 37 Hierarchy
culture
Hierarchy
culture
2 Public
University
Chief of
Finance
Department
24 19 22 35 Hierarchy
culture
Hierarchy
culture
3 Public
University
Financial
Controller
27 22 18 33 Hierarchy
culture
Hierarchy
culture
4 Public
University
Others 15 27 25 33 Hierarchy
culture
Hierarchy
culture
5 Public
University
The
President
13 27 18 43 Hierarchy
culture
Hierarchy
culture
6 Public
University
Chief of
Finance
Department
25 22 22 32 Hierarchy
culture
Hierarchy
culture
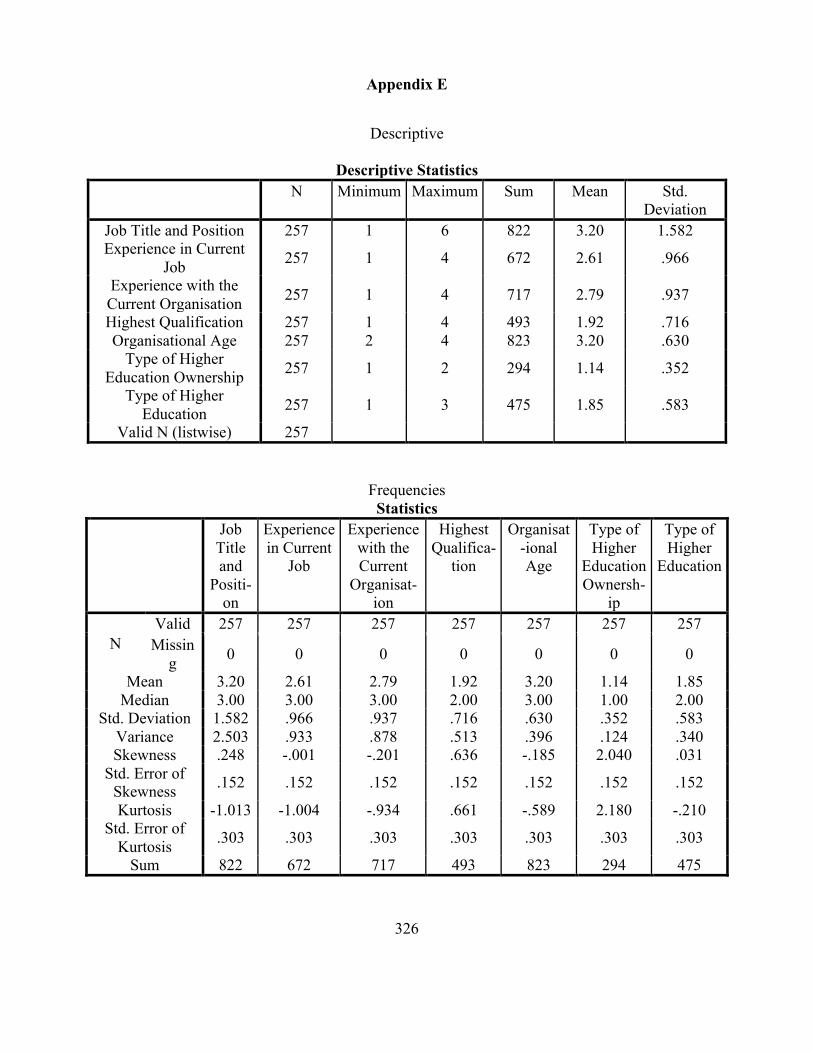
326
Appendix E
Descriptive
Descriptive Statistics N Minimum Maximum Sum Mean Std.
Deviation Job Title and Position 257 1 6 822 3.20 1.582 Experience in Current
Job 257 1 4 672 2.61 .966
Experience with the Current Organisation 257 1 4 717 2.79 .937
Highest Qualification 257 1 4 493 1.92 .716 Organisational Age 257 2 4 823 3.20 .630
Type of Higher Education Ownership 257 1 2 294 1.14 .352
Type of Higher Education 257 1 3 475 1.85 .583
Valid N (listwise) 257
Frequencies Statistics
Job Title and
Positi-on
Experience in Current
Job
Experience with the Current
Organisat-ion
Highest Qualifica-
tion
Organisat-ional Age
Type of Higher
Education Ownersh-
ip
Type of Higher
Education
N Valid 257 257 257 257 257 257 257
Missing 0 0 0 0 0 0 0
Mean 3.20 2.61 2.79 1.92 3.20 1.14 1.85 Median 3.00 3.00 3.00 2.00 3.00 1.00 2.00
Std. Deviation 1.582 .966 .937 .716 .630 .352 .583 Variance 2.503 .933 .878 .513 .396 .124 .340 Skewness .248 -.001 -.201 .636 -.185 2.040 .031
Std. Error of Skewness .152 .152 .152 .152 .152 .152 .152
Kurtosis -1.013 -1.004 -.934 .661 -.589 2.180 -.210 Std. Error of
Kurtosis .303 .303 .303 .303 .303 .303 .303
Sum 822 672 717 493 823 294 475

327
Frequency Table
Job Title and Position Frequency Percent Valid Percent Cumulative
Percent
Valid
President 45 17.5 17.5 17.5 Vice President 49 19.1 19.1 36.6
Chief of Finance Department/Assistant/ Vice 63 24.5 24.5 61.1
Chief of Administrative Department/Assistant/ Vice 36 14.0 14.0 75.1
Financial Controller 38 14.8 14.8 89.9 Others 26 10.1 10.1 100.0 Total 257 100.0 100.0
Experience in Current Job Frequency Percent Valid Percent Cumulative
Percent
Valid
Less than one year 32 12.5 12.5 12.5 1-5 years 92 35.8 35.8 48.2 6-10 years 76 29.6 29.6 77.8
More than 10 years 57 22.2 22.2 100.0 Total 257 100.0 100.0
Experience with the Current Organisation Frequency Percent Valid Percent Cumulative
Percent
Valid
Less than one year 22 8.6 8.6 8.6 1-5 years 79 30.7 30.7 39.3 6-10 years 87 33.9 33.9 73.2
More than 10 years 69 26.8 26.8 100.0 Total 257 100.0 100.0
Highest Qualification Frequency Percent Valid Percent Cumulative
Percent
Valid Bachelor’s degree 69 26.8 26.8 26.8
Post-graduate (e.g. MSc, MBA, Ph.D.) 148 57.6 57.6 84.4
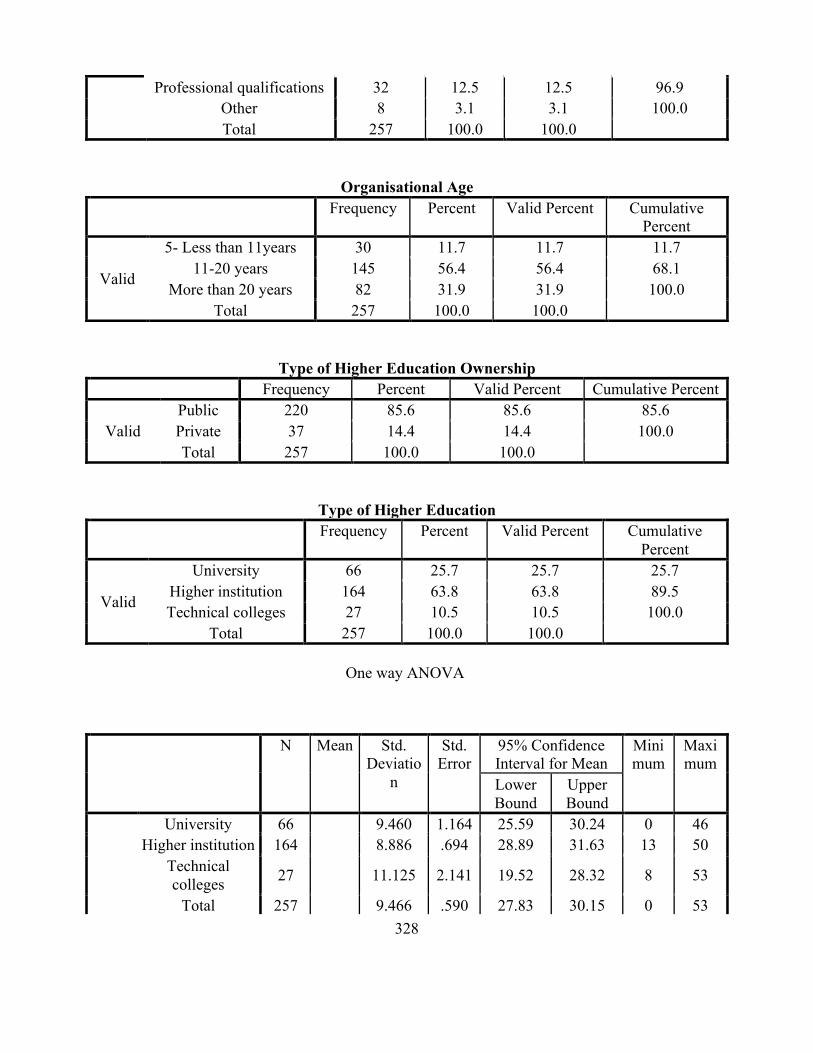
328
Professional qualifications 32 12.5 12.5 96.9 Other 8 3.1 3.1 100.0 Total 257 100.0 100.0
Organisational Age Frequency Percent Valid Percent Cumulative
Percent
Valid
5- Less than 11years 30 11.7 11.7 11.7 11-20 years 145 56.4 56.4 68.1
More than 20 years 82 31.9 31.9 100.0 Total 257 100.0 100.0
Type of Higher Education Ownership Frequency Percent Valid Percent Cumulative Percent
Valid Public 220 85.6 85.6 85.6 Private 37 14.4 14.4 100.0 Total 257 100.0 100.0
Type of Higher Education Frequency Percent Valid Percent Cumulative
Percent
Valid
University 66 25.7 25.7 25.7 Higher institution 164 63.8 63.8 89.5 Technical colleges 27 10.5 10.5 100.0
Total 257 100.0 100.0
One way ANOVA
N Mean Std. Deviatio
n
Std. Error
95% Confidence Interval for Mean
Minimum
Maximum
Lower Bound
Upper Bound
University 66 9.460 1.164 25.59 30.24 0 46 Higher institution 164 8.886 .694 28.89 31.63 13 50
Technical colleges 27 11.125 2.141 19.52 28.32 8 53
Total 257 9.466 .590 27.83 30.15 0 53

329
University 66 4.675 .576 20.72 23.02 12 33 Higher institution 164 5.207 .407 20.69 22.30 12 32
Technical colleges 27 4.792 .922 19.00 22.79 12 28
Total 257 5.022 .313 20.91 22.14 12 33
University 66 4.636 .571 20.02 22.30 10 35 Higher institution 164 5.526 .431 17.94 19.65 8 28
Technical colleges 27 6.394 1.231 18.77 23.83 9 33
Total 257 5.513 .344 18.99 20.34 8 35
University 66 11.964 1.473 26.06 31.94 13 67 Higher institution 164 7.768 .607 28.07 30.47 18 48
Technical colleges 27 12.727 2.449 28.64 38.71 12 65
Total 257 9.650 .602 28.48 30.85 12 67
Test of Homogeneity of Variances Levene Statistic df1 df2 Sig.
Clan culture .415 2 254 .661 Adhocracy culture 2.568 2 254 .079
Market culture 2.575 2 254 .078 Hierarchy culture 10.360 2 254 .000
Alpha Alpha Sum of
Squares df Mean
Square F Sig.
Alpha
Between Groups
(Combined) 1034.294 2 517.147 5.997 .003
Linear Term
Unweighted 306.108 1 306.108 3.549 .061
Weighted 50.015 1 50.015 .580 .447
Deviation 984.279 1 984.279 11.413 .001
Within Groups 21905.049 254 86.240 Total 22939.343 256
Alpha
Between Groups
(Combined) 18.667 2 9.334 .368 .692
Linear Term
Unweighted 18.164 1 18.164 .717 .398
Weighted 18.012 1 18.012 .711 .400

330
Deviation .656 1 .656 .026 .872
Within Groups 6436.753 254 25.342 Total 6455.420 256
Alpha
Between Groups
(Combined) 343.604 2 171.802 5.868 .003
Linear Term
Unweighted .348 1 .348 .012 .913
Weighted 34.349 1 34.349 1.173 .280
Deviation 309.254 1 309.254 10.562 .001
Within Groups 7436.757 254 29.279 Total 7780.361 256
Alpha
Between Groups
(Combined) 488.469 2 244.235 2.657 .072
Linear Term
Unweighted 417.943 1 417.943 4.546 .034
Weighted 264.785 1 264.785 2.880 .091
Deviation 223.685 1 223.685 2.433 .120
Within Groups 23351.749 254 91.936 Total 23840.218 256
Descriptives
N Mean Std. Deviatio
n
Std. Error
95% Confidence Interval for Mean
Minimum
Maximum
Lower Bound
Upper Bound
Clan culture
Public Universities 29 19.66 7.195 1.336 16.92 22.39 0 35
Private Universities 37 34.39 4.822 .793 32.78 36.00 24 46
Total 66 27.92 9.460 1.164 25.59 30.24 0 46
Adhocracy culture
Public Universities 29 22.50 5.446 1.011 20.43 24.57 12 33

331
Private Universities 37 21.37 3.978 .654 20.05 22.70 13 30
Total 66 21.87 4.675 .576 20.72 23.02 12 33
Market culture
Public Universities 29 19.20 4.281 .795 17.57 20.82 10 28
Private Universities 37 22.70 4.359 .717 21.25 24.16 17 35
Total 66 21.16 4.636 .571 20.02 22.30 10 35
Hierarchy culture
Public Universities 29 38.53 11.215 2.083 34.27 42.80 14 67
Private Universities 37 21.53 5.484 .902 19.70 23.36 13 36
Total 66 29.00 11.964 1.473 26.06 31.94 13 67
Test of Homogeneity of Variances Levene Statistic df1 df2 Sig.
Clan culture 3.588 1 64 .063 Adhocracy culture 2.736 1 64 .103
Market culture .016 1 64 .900 Hierarchy culture 8.599 1 64 .005
ANOVA Sum of
Squares df Mean
Square F Sig.
Clan culture
Between Groups
(Combined) 3530.672 1 3530.672 98.832 .000
Linear Term
Unweighted 3530.672 1 3530.672 98.832 .000
Weighted 3530.672 1 3530.672 98.832 .000 Within Groups 2286.342 64 35.724
Total 5817.014 65
Adhocracy culture
Between Groups
(Combined) 20.617 1 20.617 .942 .335 Linear Term
Unweighted 20.617 1 20.617 .942 .335

332
Weighted 20.617 1 20.617 .942 .335 Within Groups 1400.300 64 21.880
Total 1420.918 65
Market culture
Between Groups
(Combined) 199.987 1 199.987 10.692 .002
Linear Term
Unweighted 199.987 1 199.987 10.692 .002
Weighted 199.987 1 199.987 10.692 .002 Within Groups 1197.067 64 18.704
Total 1397.054 65
Hierarchy culture
Between Groups
(Combined) 4700.071 1 4700.071 65.330 .000
Linear Term
Unweighted 4700.071 1 4700.071 65.330 .000
Weighted 4700.071 1 4700.071 65.330 .000 Within Groups 4604.401 64 71.944
Total 9304.472 65
Robust Tests of Equality of Means Statistica df1 df2 Sig.
Clan culture Welch 89.990 1 46.685 .000 Brown-Forsythe 89.990 1 46.685 .000
Adhocracy culture Welch .874 1 49.572 .354 Brown-Forsythe .874 1 49.572 .354
Market culture Welch 10.739 1 60.776 .002 Brown-Forsythe 10.739 1 60.776 .002
Hierarchy culture Welch 56.137 1 38.428 .000 Brown-Forsythe 56.137 1 38.428 .000
a. Asymptotically F distributed.
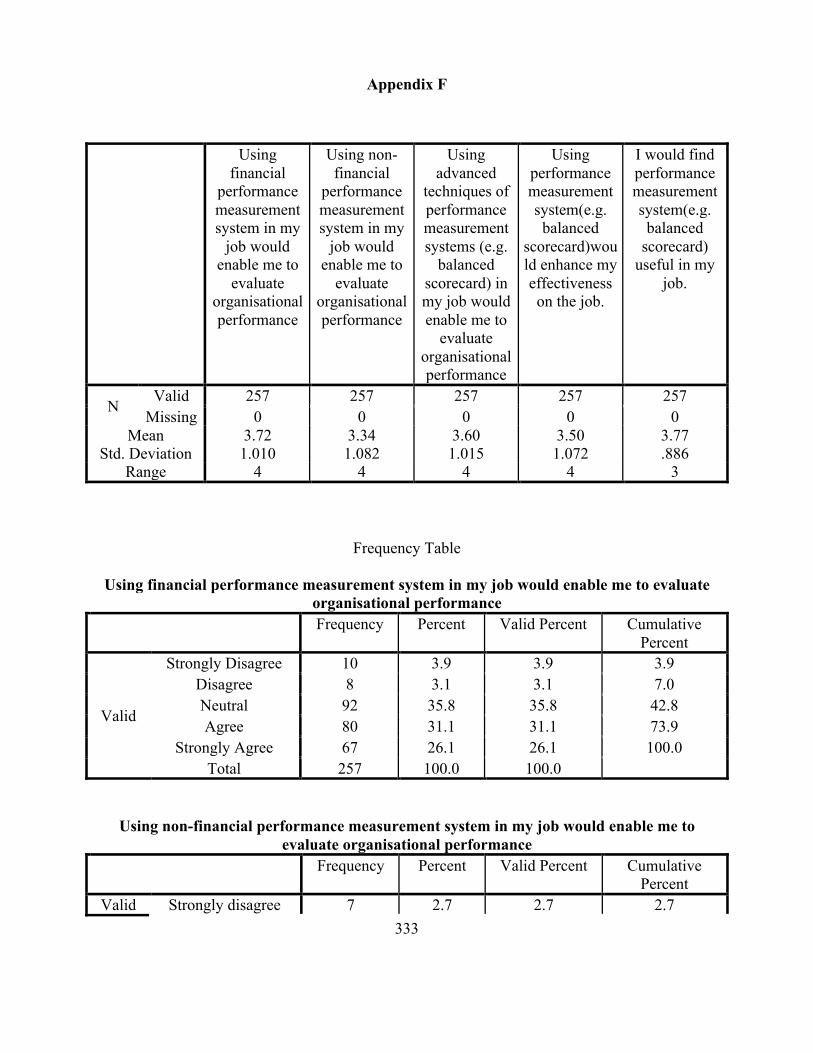
333
Appendix F
Using
financial performance measurement system in my
job would enable me to
evaluate organisational performance
Using non-financial
performance measurement system in my
job would enable me to
evaluate organisational performance
Using advanced
techniques of performance measurement systems (e.g.
balanced scorecard) in my job would enable me to
evaluate organisational performance
Using performance measurement system(e.g.
balanced scorecard)would enhance my effectiveness on the job.
I would find performance measurement system(e.g.
balanced scorecard)
useful in my job.
N Valid 257 257 257 257 257 Missing 0 0 0 0 0
Mean 3.72 3.34 3.60 3.50 3.77 Std. Deviation 1.010 1.082 1.015 1.072 .886
Range 4 4 4 4 3
Frequency Table
Using financial performance measurement system in my job would enable me to evaluate organisational performance
Frequency Percent Valid Percent Cumulative Percent
Valid
Strongly Disagree 10 3.9 3.9 3.9 Disagree 8 3.1 3.1 7.0 Neutral 92 35.8 35.8 42.8 Agree 80 31.1 31.1 73.9
Strongly Agree 67 26.1 26.1 100.0 Total 257 100.0 100.0
Using non-financial performance measurement system in my job would enable me to evaluate organisational performance
Frequency Percent Valid Percent Cumulative Percent
Valid Strongly disagree 7 2.7 2.7 2.7
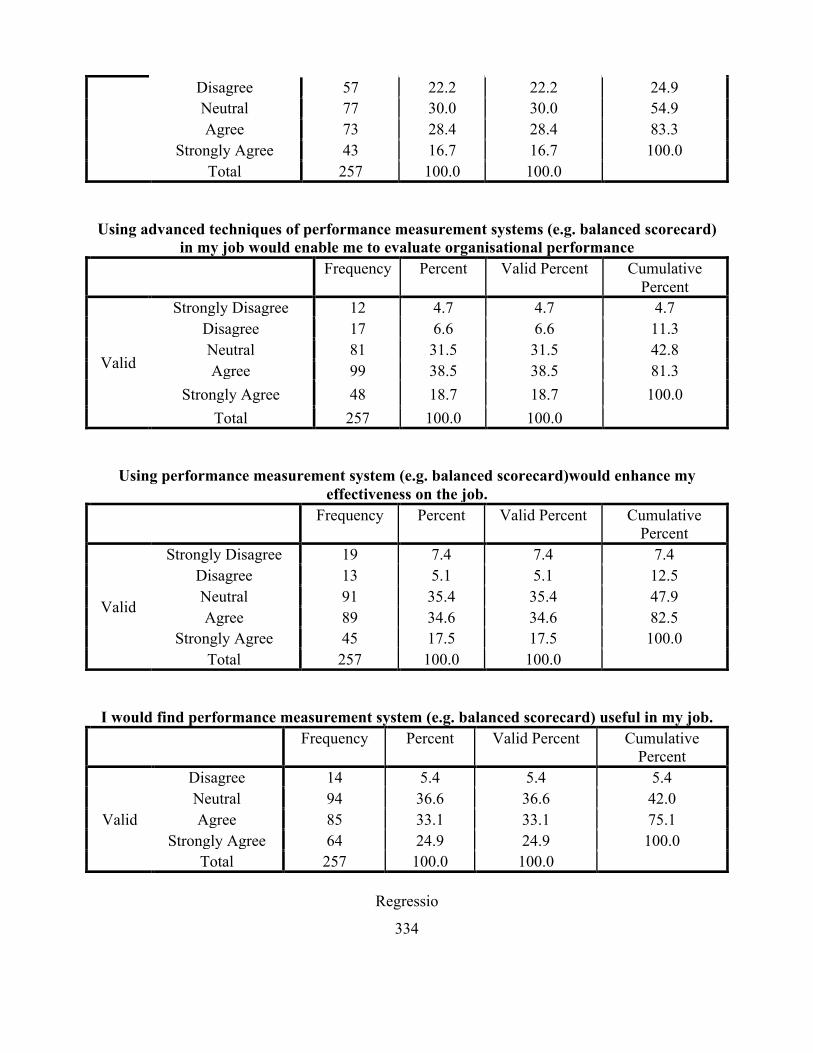
334
Disagree 57 22.2 22.2 24.9 Neutral 77 30.0 30.0 54.9 Agree 73 28.4 28.4 83.3
Strongly Agree 43 16.7 16.7 100.0 Total 257 100.0 100.0
Using advanced techniques of performance measurement systems (e.g. balanced scorecard) in my job would enable me to evaluate organisational performance
Frequency Percent Valid Percent Cumulative Percent
Valid
Strongly Disagree 12 4.7 4.7 4.7 Disagree 17 6.6 6.6 11.3 Neutral 81 31.5 31.5 42.8 Agree 99 38.5 38.5 81.3
Strongly Agree 48 18.7 18.7 100.0 Total 257 100.0 100.0
Using performance measurement system (e.g. balanced scorecard)would enhance my effectiveness on the job.
Frequency Percent Valid Percent Cumulative Percent
Valid
Strongly Disagree 19 7.4 7.4 7.4 Disagree 13 5.1 5.1 12.5 Neutral 91 35.4 35.4 47.9 Agree 89 34.6 34.6 82.5
Strongly Agree 45 17.5 17.5 100.0 Total 257 100.0 100.0
I would find performance measurement system (e.g. balanced scorecard) useful in my job. Frequency Percent Valid Percent Cumulative
Percent
Valid
Disagree 14 5.4 5.4 5.4 Neutral 94 36.6 36.6 42.0 Agree 85 33.1 33.1 75.1
Strongly Agree 64 24.9 24.9 100.0 Total 257 100.0 100.0
Regressio

335
Descriptive Statistics Mean Std. Deviation N
Using financial performance measurement system in my job would enable me to evaluate organisational performance 3.72 1.010 257
Adhocracy culture 21.53 5.022 257 Market culture 19.67 5.513 257
Hierarchy culture 29.66 9.650 257
Correlations
Using financial performance
measurement system in my job would
enable me to evaluate organisational performance
Adhocracy culture
Market culture
Hierarchy culture
Pearson Correlati
on
Using financial performance measurement
system in my job would enable me to evaluate
organisational performance
1.000 .291 .139 -.021
Adhocracy culture .291 1.000 .146 -.274 Market culture .139 .146 1.000 -.404
Hierarchy culture -.021 -.274 -.404 1.000 Sig. (1-tailed)
Using financial performance measurement
system in my job would enable me to evaluate
organisational performance
. .000 .013 .367
Adhocracy culture .000 . .009 .000 Market culture .013 .009 . .000
Hierarchy culture .367 .000 .000 . N Using financial
performance measurement system in my job would enable me to evaluate
organisational performance
257 257 257 257
Adhocracy culture 257 257 257 257 Market culture 257 257 257 257
Hierarchy culture 257 257 257 257

336
Model Summaryb
Model R R
Square Adjusted R
Square
Std. Error of the
Estimate
Change Statistics R Square Change
F Change df1 df2
Sig. F Change
1 .325a .105 .095 .961 .105 9.932 3 253 .000 a. Predictors: (Constant), Hierarchy culture, Adhocracy culture, Market culture
b. Dependent Variable: Using financial performance measurement system in my job would enable me to evaluate organisational performance
ANOVAa
Model Sum of Squares df Mean Square F Sig. 1 Regression 27.540 3 9.180 9.932 .000b
Residual 233.845 253 .924 Total 261.385 256
a. Dependent Variable: Using financial performance measurement system in my job would enable me to evaluate organisational performance
b. Predictors: (Constant), Hierarchy culture, Adhocracy culture, Market culture
Coefficientsa
Model
Unstandardized Coefficients
Standardized
Coefficients
t Sig.
95.0% Confidence Interval for B
B Std. Error Beta Lower Bound
Upper Bound
1 (Constant) 1.526 .482 3.166 .002 .577 2.475 Adhocracy
culture .061 .012 .302 4.887 .000 .036 .085
Market culture .026 .012 .143 2.204 .028 .003 .050 Hierarchy
culture .013 .007 .119 1.785 .075 -.001 .026
a. Dependent Variable: Using financial performance measurement system in my job would enable me to evaluate organisational performance
Residuals Statisticsa Minimum Maximum Mean Std. Deviation N
Predicted Value 3.08 4.35 3.72 .328 257 Std. Predicted Value -1.971 1.919 .000 1.000 257
Standard Error of Predicted Value .061 .247 .115 .035 257

337
Adjusted Predicted Value 3.10 4.36 3.72 .327 257
Residual -2.800 1.872 .000 .956 257 Std. Residual -2.912 1.948 .000 .994 257 Stud. Residual -2.939 1.964 .000 1.003 257
Deleted Residual -2.852 1.905 -.001 .973 257 Stud. Deleted Residual -2.985 1.976 -.001 1.007 257
Mahal. Distance .041 15.910 2.988 2.536 257 Cook's Distance .000 .040 .004 .008 257
Centered Leverage Value .000 .062 .012 .010 257
a. Dependent Variable: Using financial performance measurement system in my job would enable me to evaluate organisational performance
Regression
Descriptive Statistics
Mean Std.
Deviation N Using non-financial performance measurement system in my job would enable me to evaluate organisational performance 3.34 1.082 257
Adhocracy culture 21.53 5.022 257 Market culture 19.67 5.513 257
Hierarchy culture 29.66 9.650 257
Correlations
Using non-financial performance measurement
system in my job would enable me to evaluate
organisational performance
Adhocracy culture
Market culture
Hierarchy culture
Pearson Correlation
Using non-financial performance
measurement system in my job would enable me
to evaluate organisational performance
1.000 .124 -.084 .061
Adhocracy culture .124 1.000 .146 -.274 Market culture -.084 .146 1.000 -.404
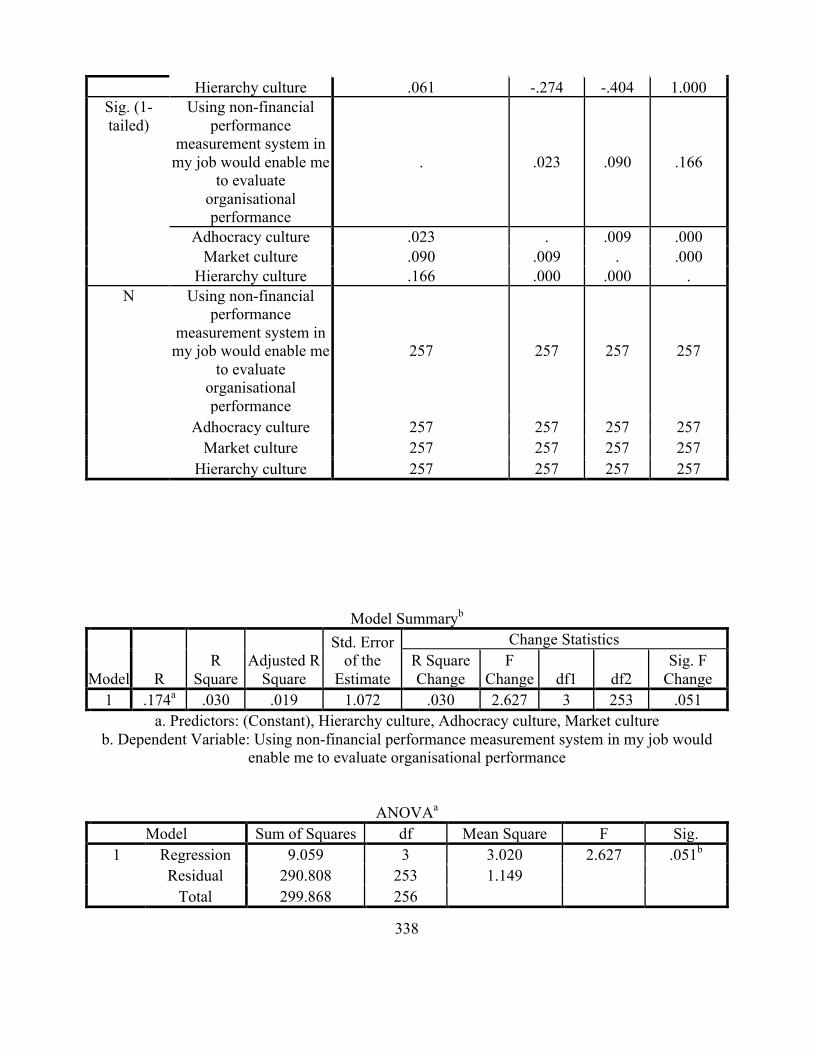
338
Hierarchy culture .061 -.274 -.404 1.000 Sig. (1-tailed)
Using non-financial performance
measurement system in my job would enable me
to evaluate organisational performance
. .023 .090 .166
Adhocracy culture .023 . .009 .000 Market culture .090 .009 . .000
Hierarchy culture .166 .000 .000 . N Using non-financial
performance measurement system in
my job would enable me to evaluate
organisational performance
257 257 257 257
Adhocracy culture 257 257 257 257 Market culture 257 257 257 257
Hierarchy culture 257 257 257 257
Model Summaryb
Model R R
Square Adjusted R
Square
Std. Error of the
Estimate
Change Statistics R Square Change
F Change df1 df2
Sig. F Change
1 .174a .030 .019 1.072 .030 2.627 3 253 .051 a. Predictors: (Constant), Hierarchy culture, Adhocracy culture, Market culture
b. Dependent Variable: Using non-financial performance measurement system in my job would enable me to evaluate organisational performance
ANOVAa Model Sum of Squares df Mean Square F Sig.
1 Regression 9.059 3 3.020 2.627 .051b Residual 290.808 253 1.149
Total 299.868 256

339
a. Dependent Variable: Using non-financial performance measurement system in my job would enable me to evaluate organisational performance
b. Predictors: (Constant), Hierarchy culture, Adhocracy culture, Market culture
Coefficientsa
Model
Unstandardized Coefficients
Standardized
Coefficients
t Sig.
95.0% Confidence Interval for B
B Std. Error Beta Lower Bound
Upper Bound
1 (Constant) 2.681 .537 4.989 .000 1.623 3.740 Adhocracy
culture .034 .014 .155 2.413 .017 .006 .061
Market culture -.015 .013 -.078 -1.145 .253 -.041 .011 Hierarchy
culture .008 .008 .072 1.032 .303 -.007 .023
a. Dependent Variable: Using non-financial performance measurement system in my job would enable me to evaluate organisational performance
Residuals Statisticsa Minimum Maximum Mean Std. Deviation N
Predicted Value 2.79 3.85 3.34 .188 257 Std. Predicted Value -2.925 2.682 .000 1.000 257
Standard Error of Predicted Value .068 .276 .128 .039 257
Adjusted Predicted Value 2.77 3.83 3.34 .189 257
Residual -2.415 2.138 .000 1.066 257 Std. Residual -2.253 1.994 .000 .994 257 Stud. Residual -2.261 2.037 .001 1.001 257
Deleted Residual -2.433 2.230 .002 1.081 257 Stud. Deleted Residual -2.280 2.049 .001 1.004 257
Mahal. Distance .041 15.910 2.988 2.536 257 Cook's Distance .000 .045 .003 .005 257
Centered Leverage Value .000 .062 .012 .010 257
a. Dependent Variable: Using non-financial performance measurement system in my job would enable me to evaluate organisational performance
Regression

340
Descriptive Statistics
Mean Std. Deviation N Using advanced techniques of performance measurement systems (e.g. balanced scorecard) in my job would enable
me to evaluate organisational performance 3.60 1.015 257
Adhocracy culture 21.53 5.022 257 Market culture 19.67 5.513 257
Hierarchy culture 29.66 9.650 257
Correlations
Using advanced techniques of performance measurement systems (e.g.
balanced scorecard) in my
job would enable me to
evaluate organisational performance
Adhocracy culture
Market culture
Hierarchy culture
Pearson Correlatio
n
Using advanced techniques of performance measurement systems (e.g. balanced scorecard) in my job
would enable me to evaluate organisational performance
1.000 .118 -.065 .116
Adhocracy culture .118 1.000 .146 -.274 Market culture -.065 .146 1.000 -.404
Hierarchy culture .116 -.274 -.404 1.000 Sig. (1-tailed)
Using advanced techniques of performance measurement systems (e.g. balanced scorecard) in my job
would enable me to evaluate organisational performance
. .029 .148 .032
Adhocracy culture .029 . .009 .000 Market culture .148 .009 . .000
Hierarchy culture .032 .000 .000 .

341
N Using advanced techniques of performance measurement systems (e.g. balanced scorecard) in my job
would enable me to evaluate organisational performance
257 257 257 257
Adhocracy culture 257 257 257 257 Market culture 257 257 257 257
Hierarchy culture 257 257 257 257
Model Summaryb
Model R R
Square Adjusted R
Square
Std. Error of the
Estimate
Change Statistics R Square Change
F Change df1 df2
Sig. F Change
1 .196a .038 .027 1.001 .038 3.363 3 253 .019 a. Predictors: (Constant), Hierarchy culture, Adhocracy culture, Market culture
b. Dependent Variable: Using advanced techniques of performance measurement systems (e.g. balanced scorecard) in my job would enable me to evaluate organisational performance
ANOVAa Model Sum of Squares df Mean Square F Sig.
1 Regression 10.112 3 3.371 3.363 .019b Residual 253.608 253 1.002
Total 263.720 256 a. Dependent Variable: Using advanced techniques of performance measurement systems (e.g.
balanced scorecard) in my job would enable me to evaluate organisational performance b. Predictors: (Constant), Hierarchy culture, Adhocracy culture, Market culture
Coefficientsa
Model
Unstandardized Coefficients
Standardized
Coefficients
t Sig.
95.0% Confidence Interval for B
B Std. Error Beta Lower Bound
Upper Bound
1 (Constant) 2.532 .502 5.045 .000 1.543 3.520 Adhocracy
culture .033 .013 .163 2.540 .012 .007 .058
Market culture -.005 .012 -.029 -.432 .666 -.030 .019 Hierarchy
culture .016 .007 .149 2.143 .033 .001 .030
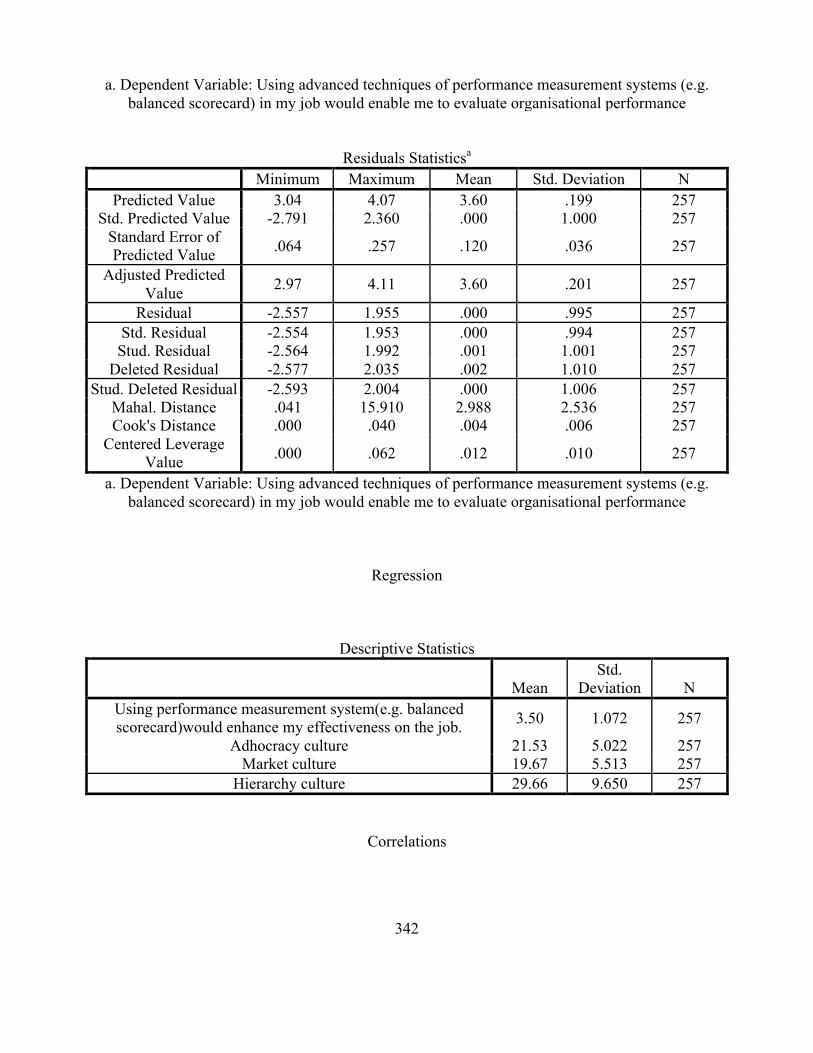
342
a. Dependent Variable: Using advanced techniques of performance measurement systems (e.g. balanced scorecard) in my job would enable me to evaluate organisational performance
Residuals Statisticsa Minimum Maximum Mean Std. Deviation N
Predicted Value 3.04 4.07 3.60 .199 257 Std. Predicted Value -2.791 2.360 .000 1.000 257
Standard Error of Predicted Value .064 .257 .120 .036 257
Adjusted Predicted Value 2.97 4.11 3.60 .201 257
Residual -2.557 1.955 .000 .995 257 Std. Residual -2.554 1.953 .000 .994 257 Stud. Residual -2.564 1.992 .001 1.001 257
Deleted Residual -2.577 2.035 .002 1.010 257 Stud. Deleted Residual -2.593 2.004 .000 1.006 257
Mahal. Distance .041 15.910 2.988 2.536 257 Cook's Distance .000 .040 .004 .006 257
Centered Leverage Value .000 .062 .012 .010 257
a. Dependent Variable: Using advanced techniques of performance measurement systems (e.g. balanced scorecard) in my job would enable me to evaluate organisational performance
Regression
Descriptive Statistics
Mean Std.
Deviation N Using performance measurement system(e.g. balanced scorecard)would enhance my effectiveness on the job. 3.50 1.072 257
Adhocracy culture 21.53 5.022 257 Market culture 19.67 5.513 257
Hierarchy culture 29.66 9.650 257
Correlations
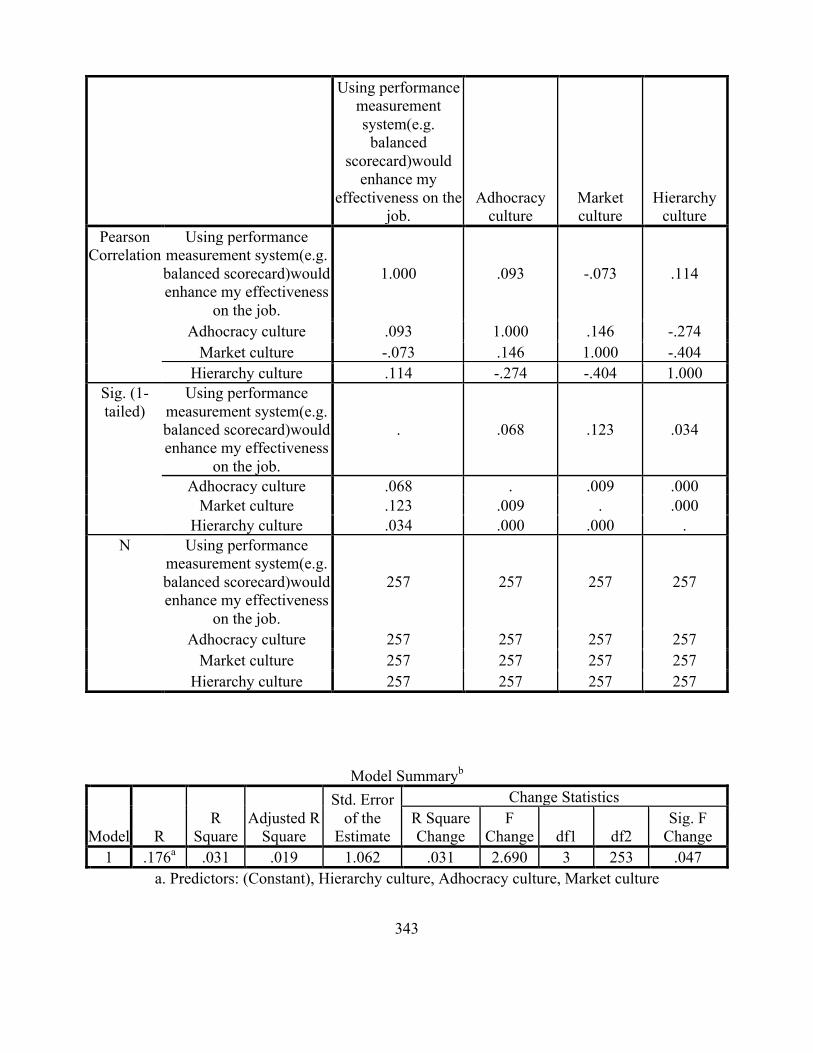
343
Using performance measurement system(e.g.
balanced scorecard)would
enhance my effectiveness on the
job. Adhocracy
culture Market culture
Hierarchy culture
Pearson Correlation
Using performance measurement system(e.g. balanced scorecard)would enhance my effectiveness
on the job.
1.000 .093 -.073 .114
Adhocracy culture .093 1.000 .146 -.274 Market culture -.073 .146 1.000 -.404
Hierarchy culture .114 -.274 -.404 1.000 Sig. (1-tailed)
Using performance measurement system(e.g. balanced scorecard)would enhance my effectiveness
on the job.
. .068 .123 .034
Adhocracy culture .068 . .009 .000 Market culture .123 .009 . .000
Hierarchy culture .034 .000 .000 . N Using performance
measurement system(e.g. balanced scorecard)would enhance my effectiveness
on the job.
257 257 257 257
Adhocracy culture 257 257 257 257 Market culture 257 257 257 257
Hierarchy culture 257 257 257 257
Model Summaryb
Model R R
Square Adjusted R
Square
Std. Error of the
Estimate
Change Statistics R Square Change
F Change df1 df2
Sig. F Change
1 .176a .031 .019 1.062 .031 2.690 3 253 .047 a. Predictors: (Constant), Hierarchy culture, Adhocracy culture, Market culture
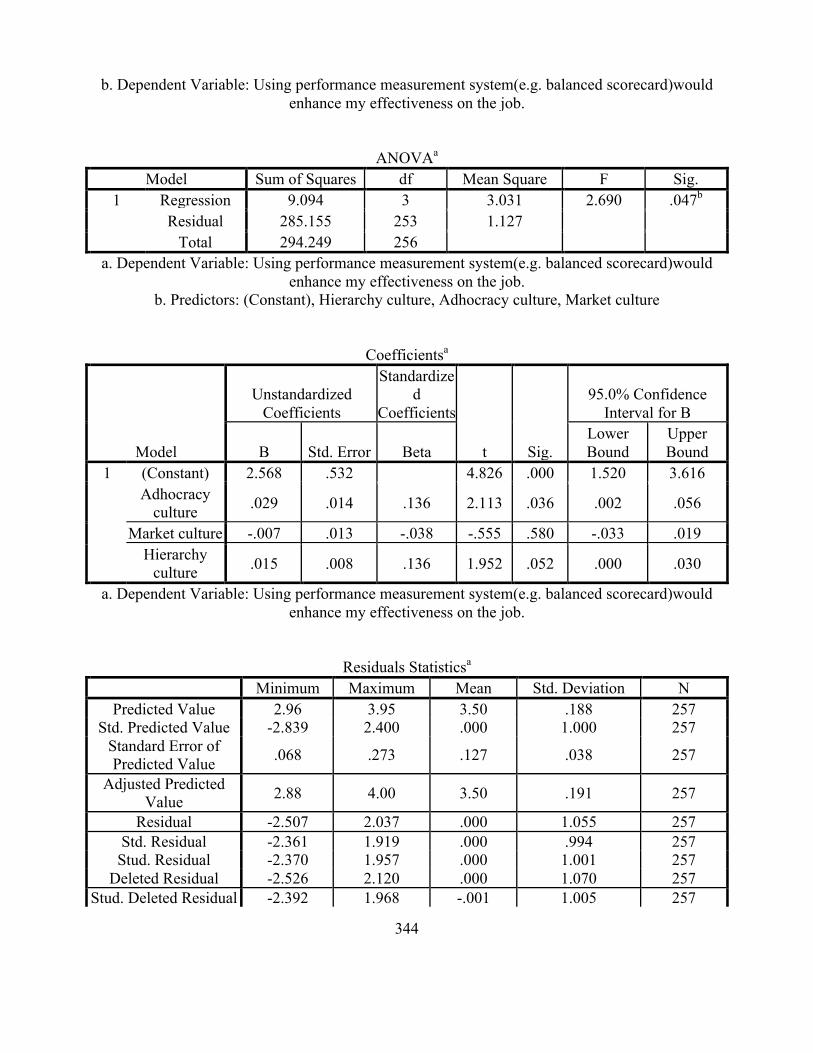
344
b. Dependent Variable: Using performance measurement system(e.g. balanced scorecard)would enhance my effectiveness on the job.
ANOVAa Model Sum of Squares df Mean Square F Sig.
1 Regression 9.094 3 3.031 2.690 .047b Residual 285.155 253 1.127
Total 294.249 256 a. Dependent Variable: Using performance measurement system(e.g. balanced scorecard)would
enhance my effectiveness on the job. b. Predictors: (Constant), Hierarchy culture, Adhocracy culture, Market culture
Coefficientsa
Model
Unstandardized Coefficients
Standardized
Coefficients
t Sig.
95.0% Confidence Interval for B
B Std. Error Beta Lower Bound
Upper Bound
1 (Constant) 2.568 .532 4.826 .000 1.520 3.616 Adhocracy
culture .029 .014 .136 2.113 .036 .002 .056
Market culture -.007 .013 -.038 -.555 .580 -.033 .019 Hierarchy
culture .015 .008 .136 1.952 .052 .000 .030
a. Dependent Variable: Using performance measurement system(e.g. balanced scorecard)would enhance my effectiveness on the job.
Residuals Statisticsa Minimum Maximum Mean Std. Deviation N
Predicted Value 2.96 3.95 3.50 .188 257 Std. Predicted Value -2.839 2.400 .000 1.000 257
Standard Error of Predicted Value .068 .273 .127 .038 257
Adjusted Predicted Value 2.88 4.00 3.50 .191 257
Residual -2.507 2.037 .000 1.055 257 Std. Residual -2.361 1.919 .000 .994 257 Stud. Residual -2.370 1.957 .000 1.001 257
Deleted Residual -2.526 2.120 .000 1.070 257 Stud. Deleted Residual -2.392 1.968 -.001 1.005 257
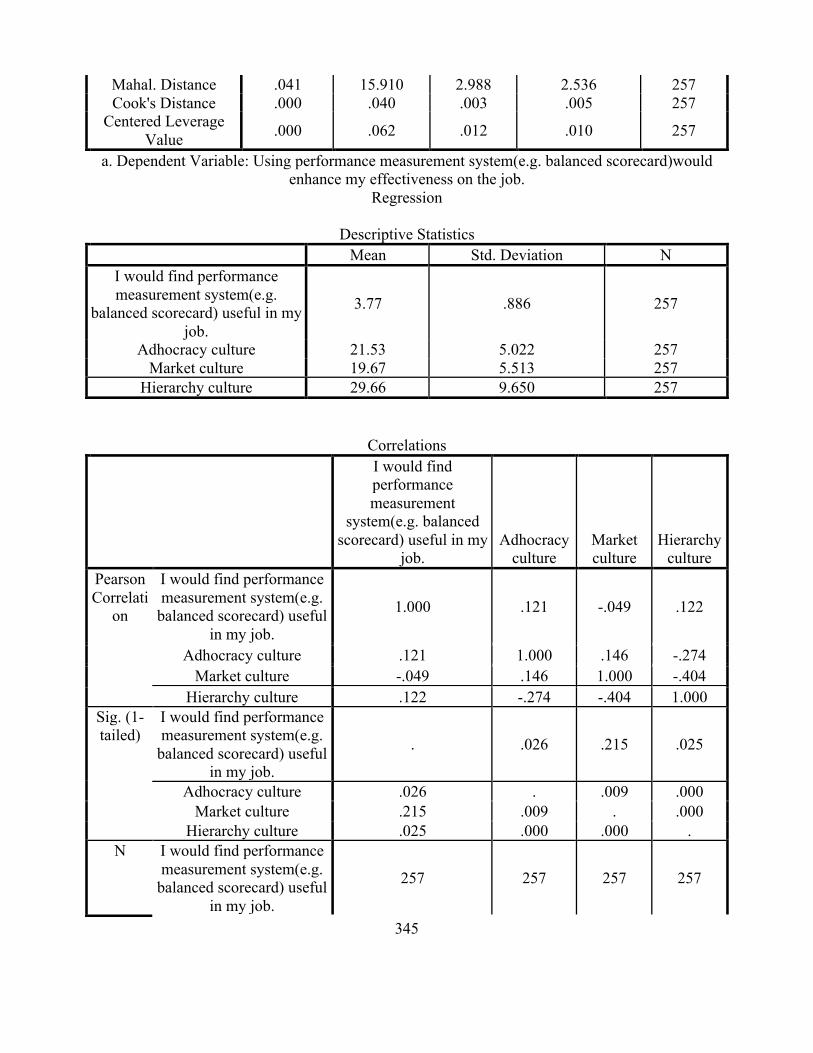
345
Mahal. Distance .041 15.910 2.988 2.536 257 Cook's Distance .000 .040 .003 .005 257
Centered Leverage Value .000 .062 .012 .010 257
a. Dependent Variable: Using performance measurement system(e.g. balanced scorecard)would enhance my effectiveness on the job.
Regression
Descriptive Statistics Mean Std. Deviation N
I would find performance measurement system(e.g.
balanced scorecard) useful in my job.
3.77 .886 257
Adhocracy culture 21.53 5.022 257 Market culture 19.67 5.513 257
Hierarchy culture 29.66 9.650 257
Correlations
I would find performance measurement
system(e.g. balanced scorecard) useful in my
job. Adhocracy
culture Market culture
Hierarchy culture
Pearson Correlati
on
I would find performance measurement system(e.g.
balanced scorecard) useful in my job.
1.000 .121 -.049 .122
Adhocracy culture .121 1.000 .146 -.274 Market culture -.049 .146 1.000 -.404
Hierarchy culture .122 -.274 -.404 1.000 Sig. (1-tailed)
I would find performance measurement system(e.g.
balanced scorecard) useful in my job.
. .026 .215 .025
Adhocracy culture .026 . .009 .000 Market culture .215 .009 . .000
Hierarchy culture .025 .000 .000 . N I would find performance
measurement system(e.g. balanced scorecard) useful
in my job.
257 257 257 257

346
Adhocracy culture 257 257 257 257 Market culture 257 257 257 257
Hierarchy culture 257 257 257 257
Model Summaryb
Model R R
Square Adjusted R
Square
Std. Error of the
Estimate
Change Statistics R Square Change
F Change df1 df2
Sig. F Change
1 .202a .041 .029 .873 .041 3.579 3 253 .015 a. Predictors: (Constant), Hierarchy culture, Adhocracy culture, Market culture
b. Dependent Variable: I would find performance measurement system(e.g. balanced scorecard) useful in my job.
ANOVAa Model Sum of Squares df Mean Square F Sig.
1 Regression 8.179 3 2.726 3.579 .015b Residual 192.732 253 .762
Total 200.911 256 a. Dependent Variable: I would find performance measurement system(e.g. balanced scorecard)
useful in my job. b. Predictors: (Constant), Hierarchy culture, Adhocracy culture, Market culture
Coefficientsa
Model
Unstandardized Coefficients
Standardized
Coefficients
t Sig.
95.0% Confidence Interval for B
B Std. Error Beta Lower Bound
Upper Bound
1 (Constant) 2.714 .438 6.203 .000 1.852 3.575 Adhocracy
culture .029 .011 .167 2.609 .010 .007 .052
Market culture -.001 .011 -.007 -.109 .913 -.023 .020 Hierarchy
culture .015 .006 .165 2.379 .018 .003 .028
a. Dependent Variable: I would find performance measurement system(e.g. balanced scorecard) useful in my job.
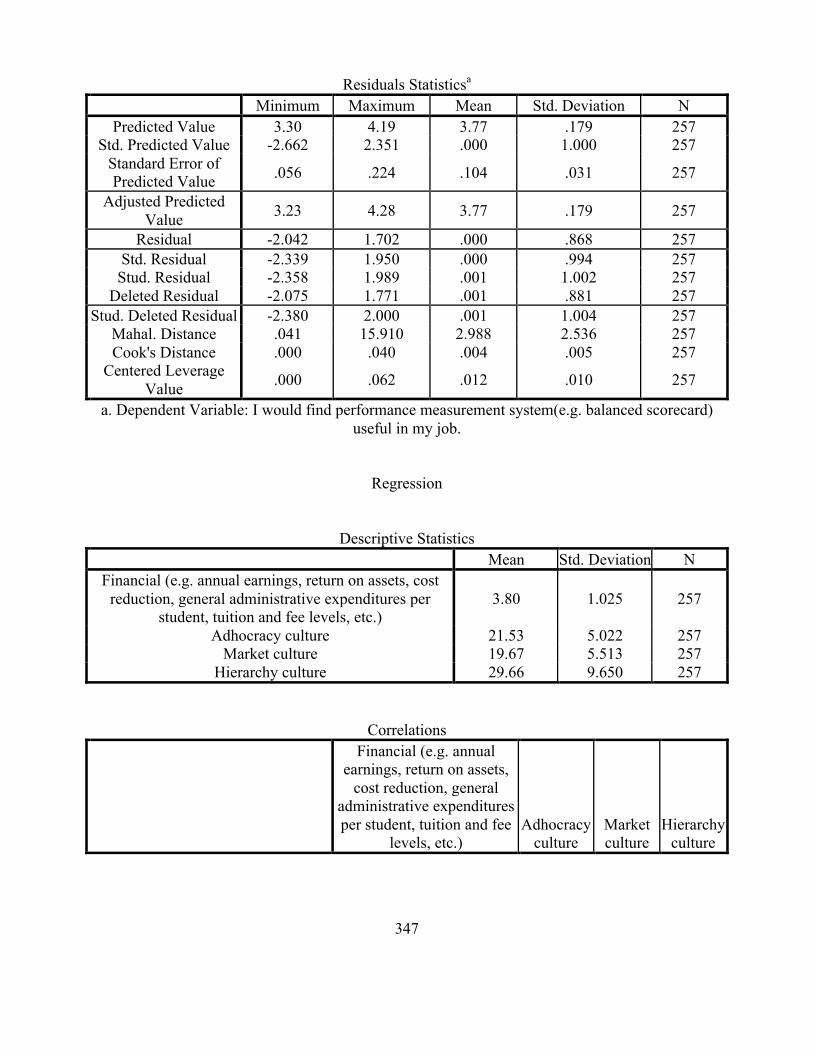
347
Residuals Statisticsa Minimum Maximum Mean Std. Deviation N
Predicted Value 3.30 4.19 3.77 .179 257 Std. Predicted Value -2.662 2.351 .000 1.000 257
Standard Error of Predicted Value .056 .224 .104 .031 257
Adjusted Predicted Value 3.23 4.28 3.77 .179 257
Residual -2.042 1.702 .000 .868 257 Std. Residual -2.339 1.950 .000 .994 257 Stud. Residual -2.358 1.989 .001 1.002 257
Deleted Residual -2.075 1.771 .001 .881 257 Stud. Deleted Residual -2.380 2.000 .001 1.004 257
Mahal. Distance .041 15.910 2.988 2.536 257 Cook's Distance .000 .040 .004 .005 257
Centered Leverage Value .000 .062 .012 .010 257
a. Dependent Variable: I would find performance measurement system(e.g. balanced scorecard) useful in my job.
Regression
Descriptive Statistics Mean Std. Deviation N
Financial (e.g. annual earnings, return on assets, cost reduction, general administrative expenditures per
student, tuition and fee levels, etc.) 3.80 1.025 257
Adhocracy culture 21.53 5.022 257 Market culture 19.67 5.513 257
Hierarchy culture 29.66 9.650 257
Correlations
Financial (e.g. annual earnings, return on assets,
cost reduction, general administrative expenditures per student, tuition and fee
levels, etc.) Adhocracy
culture Market culture
Hierarchy culture

348
Pearson Correlation
Financial (e.g. annual earnings, return on
assets, cost reduction, general administrative
expenditures per student, tuition and fee levels,
etc.)
1.000 .177 .098 -.100
Adhocracy culture .177 1.000 .146 -.274 Market culture .098 .146 1.000 -.404
Hierarchy culture -.100 -.274 -.404 1.000 Sig. (1-tailed)
Financial (e.g. annual earnings, return on
assets, cost reduction, general administrative
expenditures per student, tuition and fee levels,
etc.)
. .002 .059 .056
Adhocracy culture .002 . .009 .000 Market culture .059 .009 . .000
Hierarchy culture .056 .000 .000 . N Financial (e.g. annual
earnings, return on assets, cost reduction, general administrative
expenditures per student, tuition and fee levels,
etc.)
257 257 257 257
Adhocracy culture 257 257 257 257 Market culture 257 257 257 257
Hierarchy culture 257 257 257 257
Model Summaryb
Model R R
Square Adjusted R
Square
Std. Error of the
Estimate
Change Statistics R Square Change
F Change df1 df2
Sig. F Change
1 .194a .037 .026 1.011 .037 3.284 3 253 .021 a. Predictors: (Constant), Hierarchy culture, Adhocracy culture, Market culture
b. Dependent Variable: Financial (e.g. annual earnings, return on assets, cost reduction, general administrative expenditures per student, tuition and fee levels, etc.)
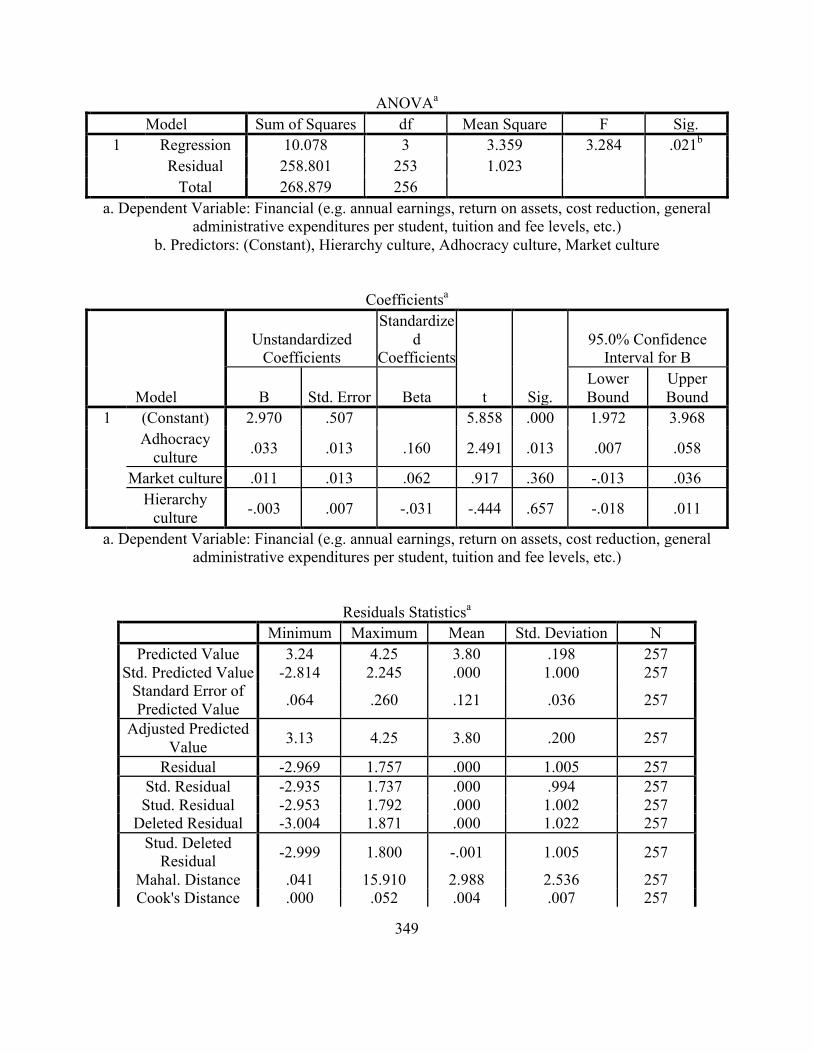
349
ANOVAa
Model Sum of Squares df Mean Square F Sig. 1 Regression 10.078 3 3.359 3.284 .021b
Residual 258.801 253 1.023 Total 268.879 256
a. Dependent Variable: Financial (e.g. annual earnings, return on assets, cost reduction, general administrative expenditures per student, tuition and fee levels, etc.)
b. Predictors: (Constant), Hierarchy culture, Adhocracy culture, Market culture
Coefficientsa
Model
Unstandardized Coefficients
Standardized
Coefficients
t Sig.
95.0% Confidence Interval for B
B Std. Error Beta Lower Bound
Upper Bound
1 (Constant) 2.970 .507 5.858 .000 1.972 3.968 Adhocracy
culture .033 .013 .160 2.491 .013 .007 .058
Market culture .011 .013 .062 .917 .360 -.013 .036 Hierarchy
culture -.003 .007 -.031 -.444 .657 -.018 .011
a. Dependent Variable: Financial (e.g. annual earnings, return on assets, cost reduction, general administrative expenditures per student, tuition and fee levels, etc.)
Residuals Statisticsa Minimum Maximum Mean Std. Deviation N
Predicted Value 3.24 4.25 3.80 .198 257 Std. Predicted Value -2.814 2.245 .000 1.000 257
Standard Error of Predicted Value .064 .260 .121 .036 257
Adjusted Predicted Value 3.13 4.25 3.80 .200 257
Residual -2.969 1.757 .000 1.005 257 Std. Residual -2.935 1.737 .000 .994 257 Stud. Residual -2.953 1.792 .000 1.002 257
Deleted Residual -3.004 1.871 .000 1.022 257 Stud. Deleted
Residual -2.999 1.800 -.001 1.005 257
Mahal. Distance .041 15.910 2.988 2.536 257 Cook's Distance .000 .052 .004 .007 257

350
Centered Leverage Value .000 .062 .012 .010 257
a. Dependent Variable: Financial (e.g. annual earnings, return on assets, cost reduction, general administrative expenditures per student, tuition and fee levels, etc.)
Regression
Descriptive Statistics Mean Std. Deviation N
Customer (student and staff), (e.g. customer satisfaction, customer retention, etc.) 3.96 1.173 257
Adhocracy culture 21.53 5.022 257 Market culture 19.67 5.513 257
Hierarchy culture 29.66 9.650 257
Correlations
Customer (student and staff), (e.g. customer satisfaction, customer
retention, etc.) Adhocracy
culture Market culture
Hierarchy culture
Pearson Correlation
Customer (student and staff), (e.g. customer satisfaction, customer
retention, etc.)
1.000 .095 .048 -.135
Adhocracy culture .095 1.000 .146 -.274 Market culture .048 .146 1.000 -.404
Hierarchy culture -.135 -.274 -.404 1.000 Sig. (1-tailed)
Customer (student and staff), (e.g. customer satisfaction, customer
retention, etc.)
. .064 .221 .015
Adhocracy culture .064 . .009 .000 Market culture .221 .009 . .000
Hierarchy culture .015 .000 .000 . N Customer (student and
staff), (e.g. customer satisfaction, customer
retention, etc.)
257 257 257 257
Adhocracy culture 257 257 257 257 Market culture 257 257 257 257
Hierarchy culture 257 257 257 257
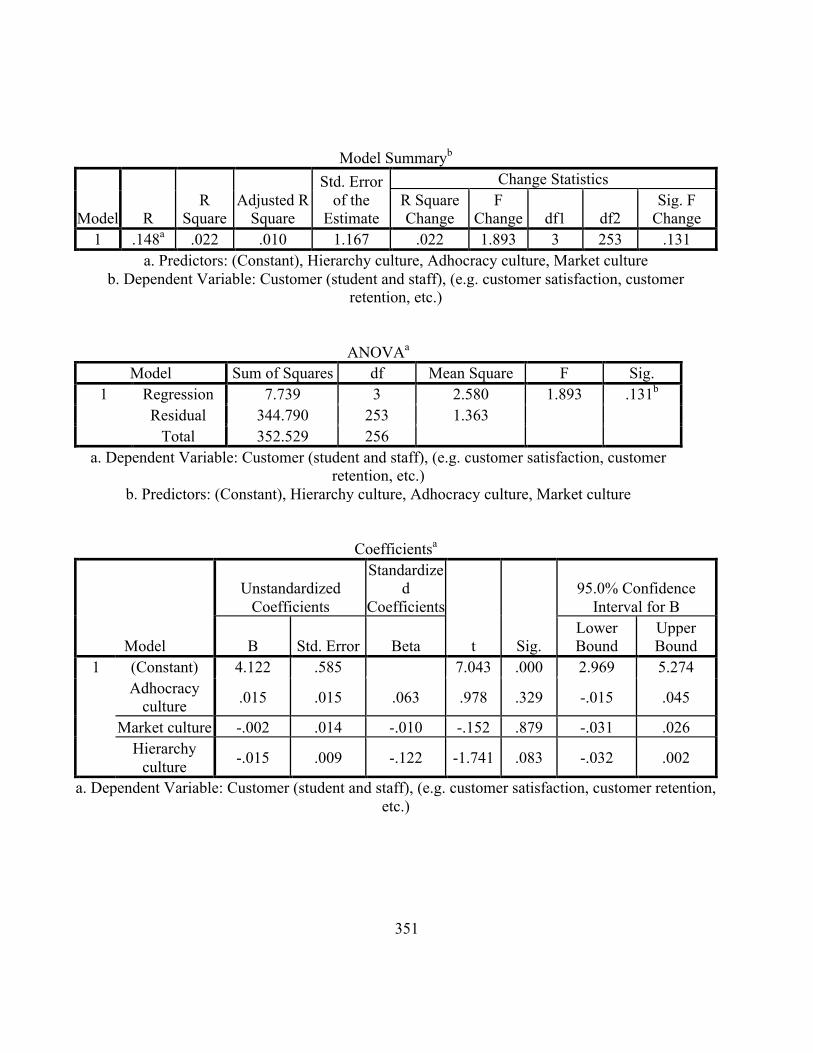
351
Model Summaryb
Model R R
Square Adjusted R
Square
Std. Error of the
Estimate
Change Statistics R Square Change
F Change df1 df2
Sig. F Change
1 .148a .022 .010 1.167 .022 1.893 3 253 .131 a. Predictors: (Constant), Hierarchy culture, Adhocracy culture, Market culture
b. Dependent Variable: Customer (student and staff), (e.g. customer satisfaction, customer retention, etc.)
ANOVAa Model Sum of Squares df Mean Square F Sig.
1 Regression 7.739 3 2.580 1.893 .131b Residual 344.790 253 1.363
Total 352.529 256 a. Dependent Variable: Customer (student and staff), (e.g. customer satisfaction, customer
retention, etc.) b. Predictors: (Constant), Hierarchy culture, Adhocracy culture, Market culture
Coefficientsa
Model
Unstandardized Coefficients
Standardized
Coefficients
t Sig.
95.0% Confidence Interval for B
B Std. Error Beta Lower Bound
Upper Bound
1 (Constant) 4.122 .585 7.043 .000 2.969 5.274 Adhocracy
culture .015 .015 .063 .978 .329 -.015 .045
Market culture -.002 .014 -.010 -.152 .879 -.031 .026 Hierarchy
culture -.015 .009 -.122 -1.741 .083 -.032 .002
a. Dependent Variable: Customer (student and staff), (e.g. customer satisfaction, customer retention, etc.)
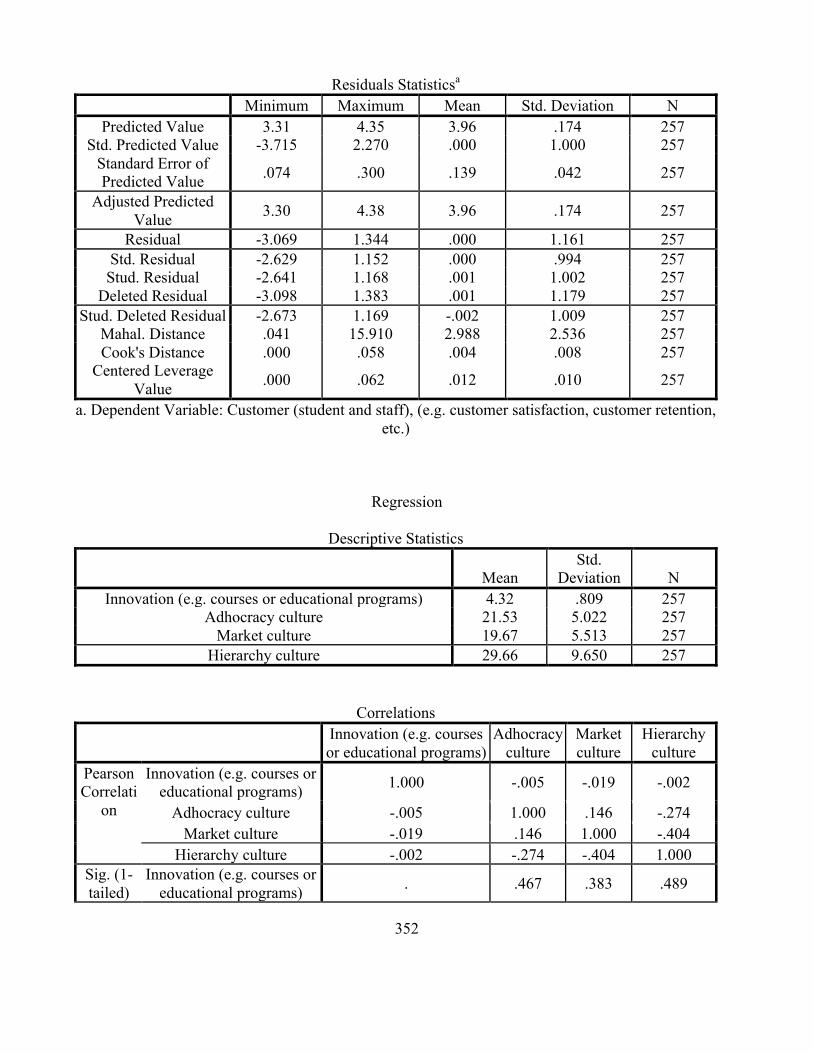
352
Residuals Statisticsa Minimum Maximum Mean Std. Deviation N
Predicted Value 3.31 4.35 3.96 .174 257 Std. Predicted Value -3.715 2.270 .000 1.000 257
Standard Error of Predicted Value .074 .300 .139 .042 257
Adjusted Predicted Value 3.30 4.38 3.96 .174 257
Residual -3.069 1.344 .000 1.161 257 Std. Residual -2.629 1.152 .000 .994 257 Stud. Residual -2.641 1.168 .001 1.002 257
Deleted Residual -3.098 1.383 .001 1.179 257 Stud. Deleted Residual -2.673 1.169 -.002 1.009 257
Mahal. Distance .041 15.910 2.988 2.536 257 Cook's Distance .000 .058 .004 .008 257
Centered Leverage Value .000 .062 .012 .010 257
a. Dependent Variable: Customer (student and staff), (e.g. customer satisfaction, customer retention, etc.)
Regression
Descriptive Statistics
Mean Std.
Deviation N Innovation (e.g. courses or educational programs) 4.32 .809 257
Adhocracy culture 21.53 5.022 257 Market culture 19.67 5.513 257
Hierarchy culture 29.66 9.650 257
Correlations
Innovation (e.g. courses or educational programs)
Adhocracy culture
Market culture
Hierarchy culture
Pearson Correlati
on
Innovation (e.g. courses or educational programs) 1.000 -.005 -.019 -.002
Adhocracy culture -.005 1.000 .146 -.274 Market culture -.019 .146 1.000 -.404
Hierarchy culture -.002 -.274 -.404 1.000 Sig. (1-tailed)
Innovation (e.g. courses or educational programs) . .467 .383 .489

353
Adhocracy culture .467 . .009 .000 Market culture .383 .009 . .000
Hierarchy culture .489 .000 .000 . N Innovation (e.g. courses or
educational programs) 257 257 257 257
Adhocracy culture 257 257 257 257 Market culture 257 257 257 257
Hierarchy culture 257 257 257 257
Model Summaryb
Model R R
Square Adjusted R
Square
Std. Error of the
Estimate
Change Statistics R Square Change
F Change df1 df2
Sig. F Change
1 .022a .000 -.011 .813 .000 .040 3 253 .989 a. Predictors: (Constant), Hierarchy culture, Adhocracy culture, Market culture
b. Dependent Variable: Innovation (e.g. courses or educational programs)
ANOVAa Model Sum of Squares df Mean Square F Sig.
1 Regression .080 3 .027 .040 .989b Residual 167.391 253 .662
Total 167.471 256 a. Dependent Variable: Innovation (e.g. courses or educational programs)
b. Predictors: (Constant), Hierarchy culture, Adhocracy culture, Market culture
Coefficientsa
Model
Unstandardized Coefficients
Standardized
Coefficients
t Sig.
95.0% Confidence Interval for B
B Std. Error Beta Lower Bound
Upper Bound
1 (Constant) 4.430 .408 10.866 .000 3.627 5.233 Adhocracy
culture -.001 .011 -.005 -.080 .936 -.022 .020
Market culture -.003 .010 -.023 -.333 .739 -.023 .017 Hierarchy
culture -.001 .006 -.012 -.176 .861 -.013 .011
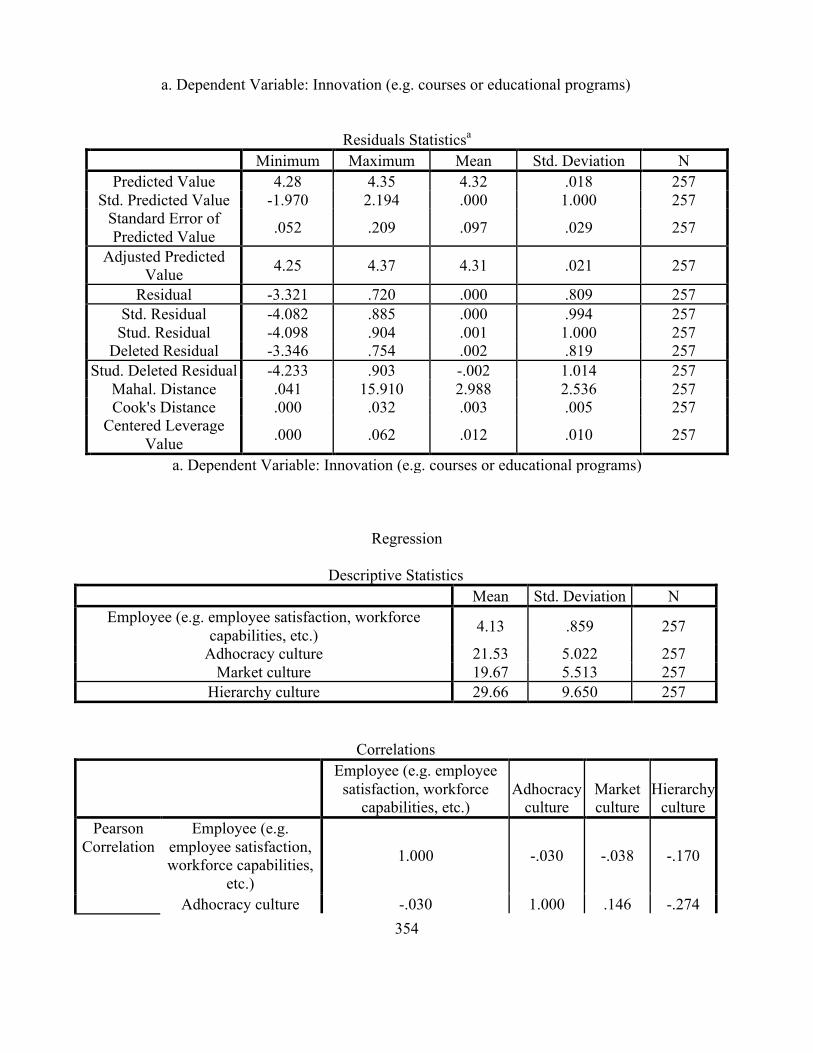
354
a. Dependent Variable: Innovation (e.g. courses or educational programs)
Residuals Statisticsa Minimum Maximum Mean Std. Deviation N
Predicted Value 4.28 4.35 4.32 .018 257 Std. Predicted Value -1.970 2.194 .000 1.000 257
Standard Error of Predicted Value .052 .209 .097 .029 257
Adjusted Predicted Value 4.25 4.37 4.31 .021 257
Residual -3.321 .720 .000 .809 257 Std. Residual -4.082 .885 .000 .994 257 Stud. Residual -4.098 .904 .001 1.000 257
Deleted Residual -3.346 .754 .002 .819 257 Stud. Deleted Residual -4.233 .903 -.002 1.014 257
Mahal. Distance .041 15.910 2.988 2.536 257 Cook's Distance .000 .032 .003 .005 257
Centered Leverage Value .000 .062 .012 .010 257
a. Dependent Variable: Innovation (e.g. courses or educational programs)
Regression
Descriptive Statistics Mean Std. Deviation N
Employee (e.g. employee satisfaction, workforce capabilities, etc.) 4.13 .859 257
Adhocracy culture 21.53 5.022 257 Market culture 19.67 5.513 257
Hierarchy culture 29.66 9.650 257
Correlations
Employee (e.g. employee satisfaction, workforce
capabilities, etc.) Adhocracy
culture Market culture
Hierarchy culture
Pearson Correlation
Employee (e.g. employee satisfaction, workforce capabilities,
etc.)
1.000 -.030 -.038 -.170
Adhocracy culture -.030 1.000 .146 -.274
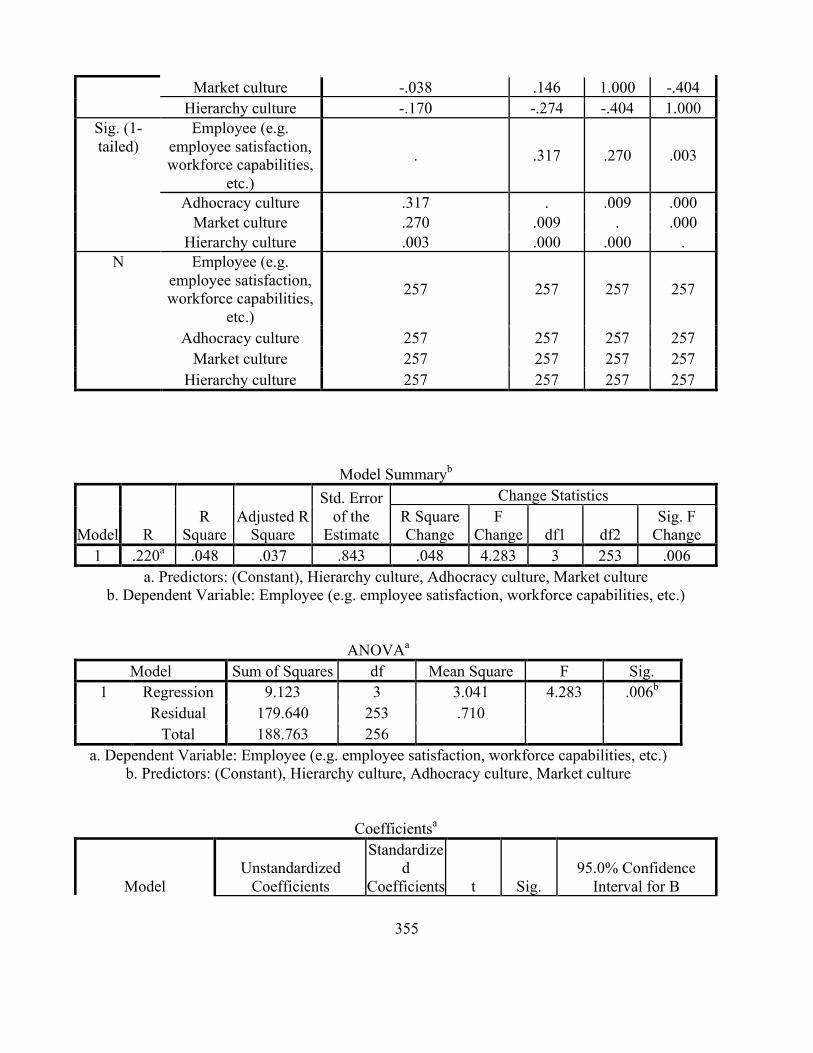
355
Market culture -.038 .146 1.000 -.404 Hierarchy culture -.170 -.274 -.404 1.000
Sig. (1-tailed)
Employee (e.g. employee satisfaction, workforce capabilities,
etc.)
. .317 .270 .003
Adhocracy culture .317 . .009 .000 Market culture .270 .009 . .000
Hierarchy culture .003 .000 .000 . N Employee (e.g.
employee satisfaction, workforce capabilities,
etc.)
257 257 257 257
Adhocracy culture 257 257 257 257 Market culture 257 257 257 257
Hierarchy culture 257 257 257 257
Model Summaryb
Model R R
Square Adjusted R
Square
Std. Error of the
Estimate
Change Statistics R Square Change
F Change df1 df2
Sig. F Change
1 .220a .048 .037 .843 .048 4.283 3 253 .006 a. Predictors: (Constant), Hierarchy culture, Adhocracy culture, Market culture
b. Dependent Variable: Employee (e.g. employee satisfaction, workforce capabilities, etc.)
ANOVAa Model Sum of Squares df Mean Square F Sig.
1 Regression 9.123 3 3.041 4.283 .006b Residual 179.640 253 .710
Total 188.763 256 a. Dependent Variable: Employee (e.g. employee satisfaction, workforce capabilities, etc.)
b. Predictors: (Constant), Hierarchy culture, Adhocracy culture, Market culture
Coefficientsa
Model Unstandardized
Coefficients
Standardized
Coefficients t Sig. 95.0% Confidence
Interval for B

356
B Std. Error Beta Lower Bound
Upper Bound
1 (Constant) 5.436 .422 12.869 .000 4.604 6.268 Adhocracy
culture -.013 .011 -.078 -1.220 .224 -.035 .008
Market culture -.019 .010 -.125 -1.858 .064 -.040 .001 Hierarchy
culture -.022 .006 -.242 -3.507 .001 -.034 -.009
a. Dependent Variable: Employee (e.g. employee satisfaction, workforce capabilities, etc.)
Residuals Statisticsa Minimum Maximum Mean Std. Deviation N
Predicted Value 3.45 4.63 4.13 .189 257 Std. Predicted Value -3.570 2.641 .000 1.000 257
Standard Error of Predicted Value .054 .217 .101 .030 257
Adjusted Predicted Value 3.42 4.61 4.13 .188 257
Residual -2.787 1.334 .000 .838 257 Std. Residual -3.307 1.583 .000 .994 257 Stud. Residual -3.341 1.606 .000 1.002 257
Deleted Residual -2.844 1.372 .000 .850 257 Stud. Deleted Residual -3.410 1.611 -.001 1.005 257
Mahal. Distance .041 15.910 2.988 2.536 257 Cook's Distance .000 .062 .004 .007 257
Centered Leverage Value .000 .062 .012 .010 257
a. Dependent Variable: Employee (e.g. employee satisfaction, workforce capabilities, etc.)
Regression
Descriptive Statistics Mean Std. Deviation N
Quality (e.g. academic quality awards, etc.) 3.96 1.017 257 Adhocracy culture 21.53 5.022 257
Market culture 19.67 5.513 257 Hierarchy culture 29.66 9.650 257
Correlations
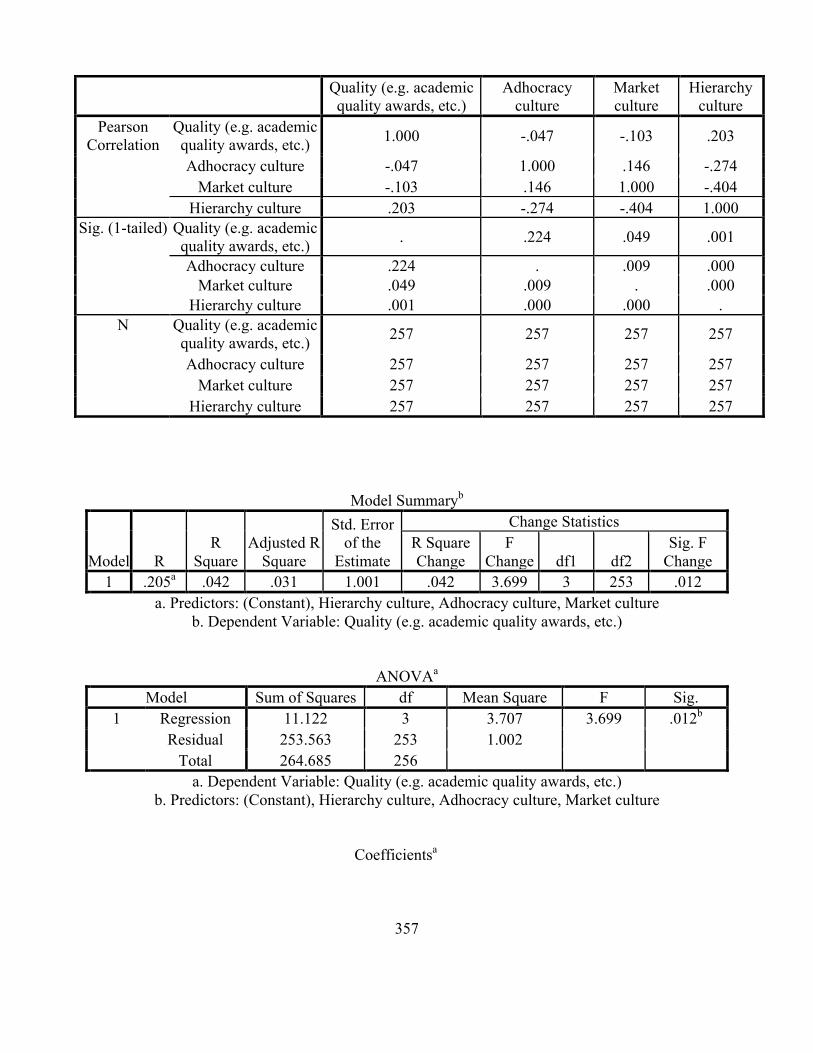
357
Quality (e.g. academic quality awards, etc.)
Adhocracy culture
Market culture
Hierarchy culture
Pearson Correlation
Quality (e.g. academic quality awards, etc.) 1.000 -.047 -.103 .203
Adhocracy culture -.047 1.000 .146 -.274 Market culture -.103 .146 1.000 -.404
Hierarchy culture .203 -.274 -.404 1.000 Sig. (1-tailed) Quality (e.g. academic
quality awards, etc.) . .224 .049 .001
Adhocracy culture .224 . .009 .000 Market culture .049 .009 . .000
Hierarchy culture .001 .000 .000 . N Quality (e.g. academic
quality awards, etc.) 257 257 257 257
Adhocracy culture 257 257 257 257 Market culture 257 257 257 257
Hierarchy culture 257 257 257 257
Model Summaryb
Model R R
Square Adjusted R
Square
Std. Error of the
Estimate
Change Statistics R Square Change
F Change df1 df2
Sig. F Change
1 .205a .042 .031 1.001 .042 3.699 3 253 .012 a. Predictors: (Constant), Hierarchy culture, Adhocracy culture, Market culture
b. Dependent Variable: Quality (e.g. academic quality awards, etc.)
ANOVAa Model Sum of Squares df Mean Square F Sig.
1 Regression 11.122 3 3.707 3.699 .012b Residual 253.563 253 1.002
Total 264.685 256 a. Dependent Variable: Quality (e.g. academic quality awards, etc.)
b. Predictors: (Constant), Hierarchy culture, Adhocracy culture, Market culture
Coefficientsa
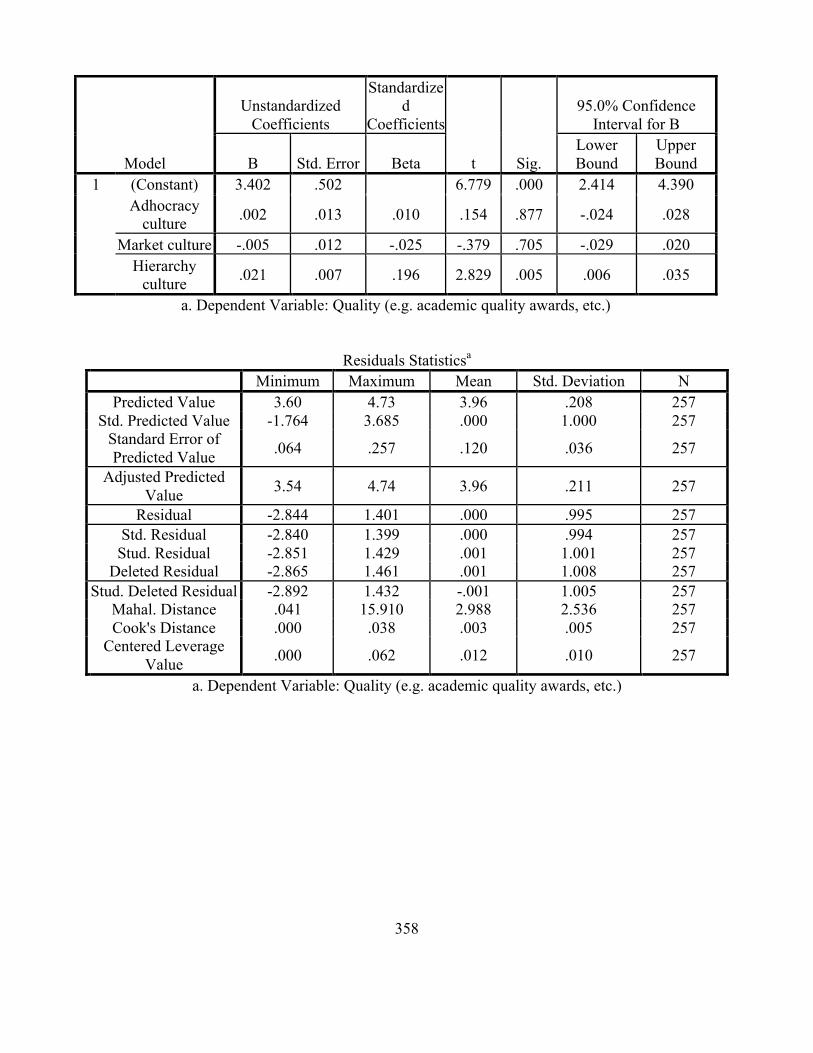
358
Model
Unstandardized Coefficients
Standardized
Coefficients
t Sig.
95.0% Confidence Interval for B
B Std. Error Beta Lower Bound
Upper Bound
1 (Constant) 3.402 .502 6.779 .000 2.414 4.390 Adhocracy
culture .002 .013 .010 .154 .877 -.024 .028
Market culture -.005 .012 -.025 -.379 .705 -.029 .020 Hierarchy
culture .021 .007 .196 2.829 .005 .006 .035
a. Dependent Variable: Quality (e.g. academic quality awards, etc.)
Residuals Statisticsa Minimum Maximum Mean Std. Deviation N
Predicted Value 3.60 4.73 3.96 .208 257 Std. Predicted Value -1.764 3.685 .000 1.000 257
Standard Error of Predicted Value .064 .257 .120 .036 257
Adjusted Predicted Value 3.54 4.74 3.96 .211 257
Residual -2.844 1.401 .000 .995 257 Std. Residual -2.840 1.399 .000 .994 257 Stud. Residual -2.851 1.429 .001 1.001 257
Deleted Residual -2.865 1.461 .001 1.008 257 Stud. Deleted Residual -2.892 1.432 -.001 1.005 257
Mahal. Distance .041 15.910 2.988 2.536 257 Cook's Distance .000 .038 .003 .005 257
Centered Leverage Value .000 .062 .012 .010 257
a. Dependent Variable: Quality (e.g. academic quality awards, etc.)

359
Regression
Descriptive Statistics Mean Std. Deviation N
Community (e.g. public image, community involvement, etc.) 3.67 1.143 257
Adhocracy culture 21.53 5.022 257 Market culture 19.67 5.513 257
Hierarchy culture 29.66 9.650 257
Correlations
Community (e.g. public image, community involvement, etc.)
Adhocracy culture
Market culture
Hierarchy culture
Pearson Correlation
Community (e.g. public image, community involvement, etc.)
1.000 .082 .034 .063
Adhocracy culture .082 1.000 .146 -.274 Market culture .034 .146 1.000 -.404
Hierarchy culture .063 -.274 -.404 1.000 Sig. (1-tailed)
Community (e.g. public image, community involvement, etc.)
. .095 .295 .158
Adhocracy culture .095 . .009 .000 Market culture .295 .009 . .000
Hierarchy culture .158 .000 .000 . N Community (e.g. public
image, community involvement, etc.)
257 257 257 257
Adhocracy culture 257 257 257 257 Market culture 257 257 257 257
Hierarchy culture 257 257 257 257
Model Summaryb
Model R R
Square Adjusted R
Square
Std. Error of the
Estimate
Change Statistics R Square Change
F Change df1 df2
Sig. F Change
1 .135a .018 .007 1.139 .018 1.571 3 253 .197 a. Predictors: (Constant), Hierarchy culture, Adhocracy culture, Market culture
b. Dependent Variable: Community (e.g. public image, community involvement, etc.)
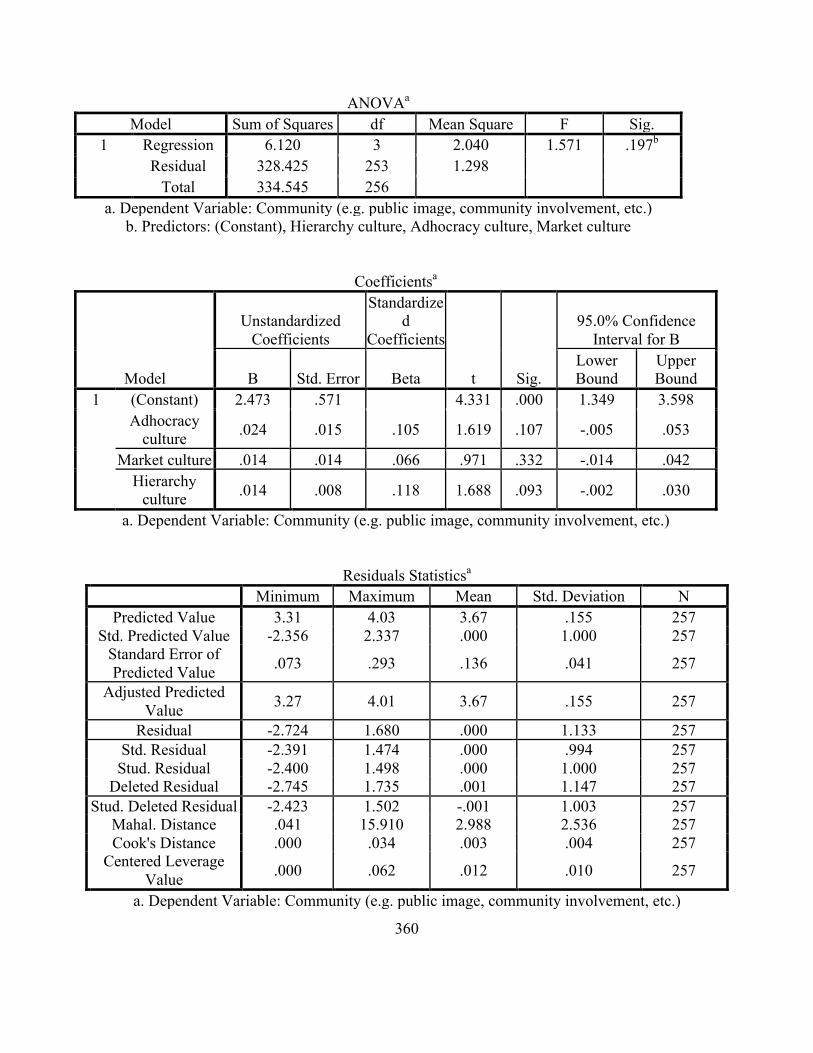
360
ANOVAa
Model Sum of Squares df Mean Square F Sig. 1 Regression 6.120 3 2.040 1.571 .197b
Residual 328.425 253 1.298 Total 334.545 256
a. Dependent Variable: Community (e.g. public image, community involvement, etc.) b. Predictors: (Constant), Hierarchy culture, Adhocracy culture, Market culture
Coefficientsa
Model
Unstandardized Coefficients
Standardized
Coefficients
t Sig.
95.0% Confidence Interval for B
B Std. Error Beta Lower Bound
Upper Bound
1 (Constant) 2.473 .571 4.331 .000 1.349 3.598 Adhocracy
culture .024 .015 .105 1.619 .107 -.005 .053
Market culture .014 .014 .066 .971 .332 -.014 .042 Hierarchy
culture .014 .008 .118 1.688 .093 -.002 .030
a. Dependent Variable: Community (e.g. public image, community involvement, etc.)
Residuals Statisticsa Minimum Maximum Mean Std. Deviation N
Predicted Value 3.31 4.03 3.67 .155 257 Std. Predicted Value -2.356 2.337 .000 1.000 257
Standard Error of Predicted Value .073 .293 .136 .041 257
Adjusted Predicted Value 3.27 4.01 3.67 .155 257
Residual -2.724 1.680 .000 1.133 257 Std. Residual -2.391 1.474 .000 .994 257 Stud. Residual -2.400 1.498 .000 1.000 257
Deleted Residual -2.745 1.735 .001 1.147 257 Stud. Deleted Residual -2.423 1.502 -.001 1.003 257
Mahal. Distance .041 15.910 2.988 2.536 257 Cook's Distance .000 .034 .003 .004 257
Centered Leverage Value .000 .062 .012 .010 257
a. Dependent Variable: Community (e.g. public image, community involvement, etc.)

361
Regression
Descriptive Statistics Mean Std. Deviation N
Financial (e.g. annual earnings, return on assets, cost reduction, general administrative expenditures per
student, tuition and fee levels, etc.) 2.98 1.149 257
Adhocracy culture 21.53 5.022 257 Market culture 19.67 5.513 257
Hierarchy culture 29.66 9.650 257
Correlations
Financial (e.g. annual earnings, return on assets,
cost reduction, general administrative expenditures per student, tuition and fee
levels, etc.) Adhocracy
culture Market culture
Hierarchy culture
Pearson Correlatio
n
Financial (e.g. annual earnings, return on assets,
cost reduction, general administrative expenditures per student, tuition and fee
levels, etc.)
1.000 .240 .103 -.145
Adhocracy culture .240 1.000 .146 -.274 Market culture .103 .146 1.000 -.404
Hierarchy culture -.145 -.274 -.404 1.000 Sig. (1-tailed)
Financial (e.g. annual earnings, return on assets,
cost reduction, general administrative expenditures per student, tuition and fee
levels, etc.)
. .000 .050 .010
Adhocracy culture .000 . .009 .000 Market culture .050 .009 . .000
Hierarchy culture .010 .000 .000 . N Financial (e.g. annual
earnings, return on assets, cost reduction, general
administrative expenditures per student, tuition and fee
levels, etc.)
257 257 257 257
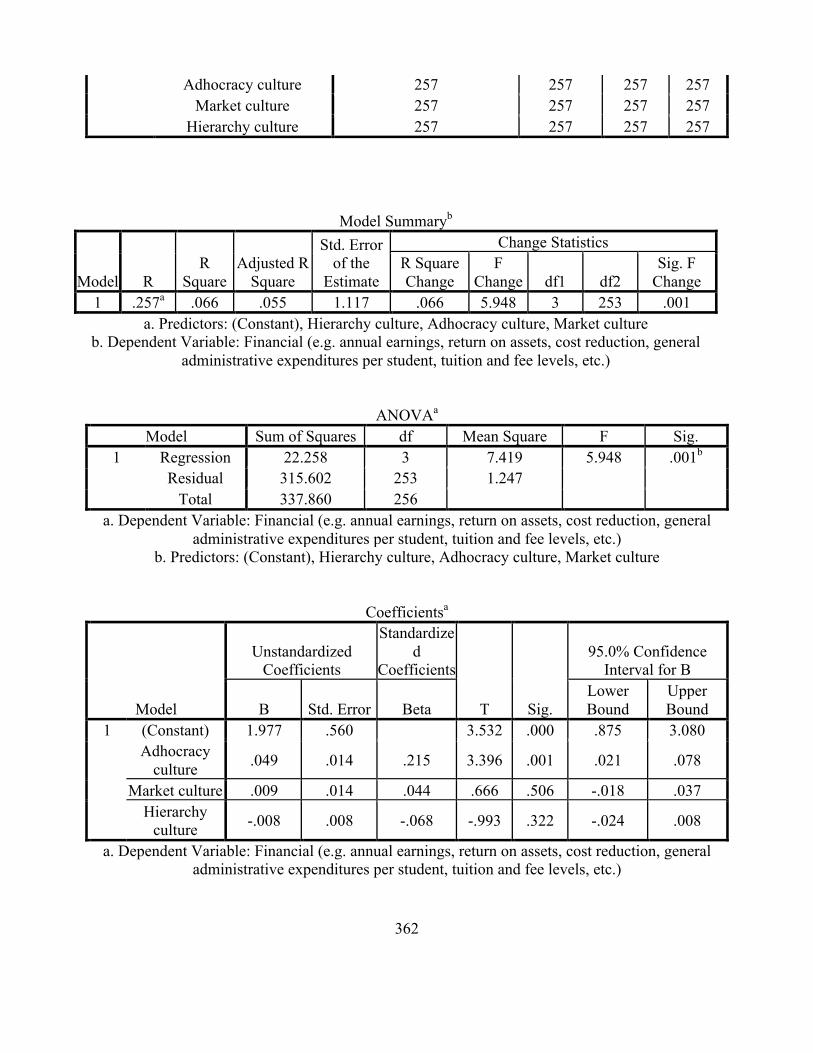
362
Adhocracy culture 257 257 257 257 Market culture 257 257 257 257
Hierarchy culture 257 257 257 257
Model Summaryb
Model R R
Square Adjusted R
Square
Std. Error of the
Estimate
Change Statistics R Square Change
F Change df1 df2
Sig. F Change
1 .257a .066 .055 1.117 .066 5.948 3 253 .001 a. Predictors: (Constant), Hierarchy culture, Adhocracy culture, Market culture
b. Dependent Variable: Financial (e.g. annual earnings, return on assets, cost reduction, general administrative expenditures per student, tuition and fee levels, etc.)
ANOVAa Model Sum of Squares df Mean Square F Sig.
1 Regression 22.258 3 7.419 5.948 .001b Residual 315.602 253 1.247
Total 337.860 256 a. Dependent Variable: Financial (e.g. annual earnings, return on assets, cost reduction, general
administrative expenditures per student, tuition and fee levels, etc.) b. Predictors: (Constant), Hierarchy culture, Adhocracy culture, Market culture
Coefficientsa
Model
Unstandardized Coefficients
Standardized
Coefficients
T Sig.
95.0% Confidence Interval for B
B Std. Error Beta Lower Bound
Upper Bound
1 (Constant) 1.977 .560 3.532 .000 .875 3.080 Adhocracy
culture .049 .014 .215 3.396 .001 .021 .078
Market culture .009 .014 .044 .666 .506 -.018 .037 Hierarchy
culture -.008 .008 -.068 -.993 .322 -.024 .008
a. Dependent Variable: Financial (e.g. annual earnings, return on assets, cost reduction, general administrative expenditures per student, tuition and fee levels, etc.)
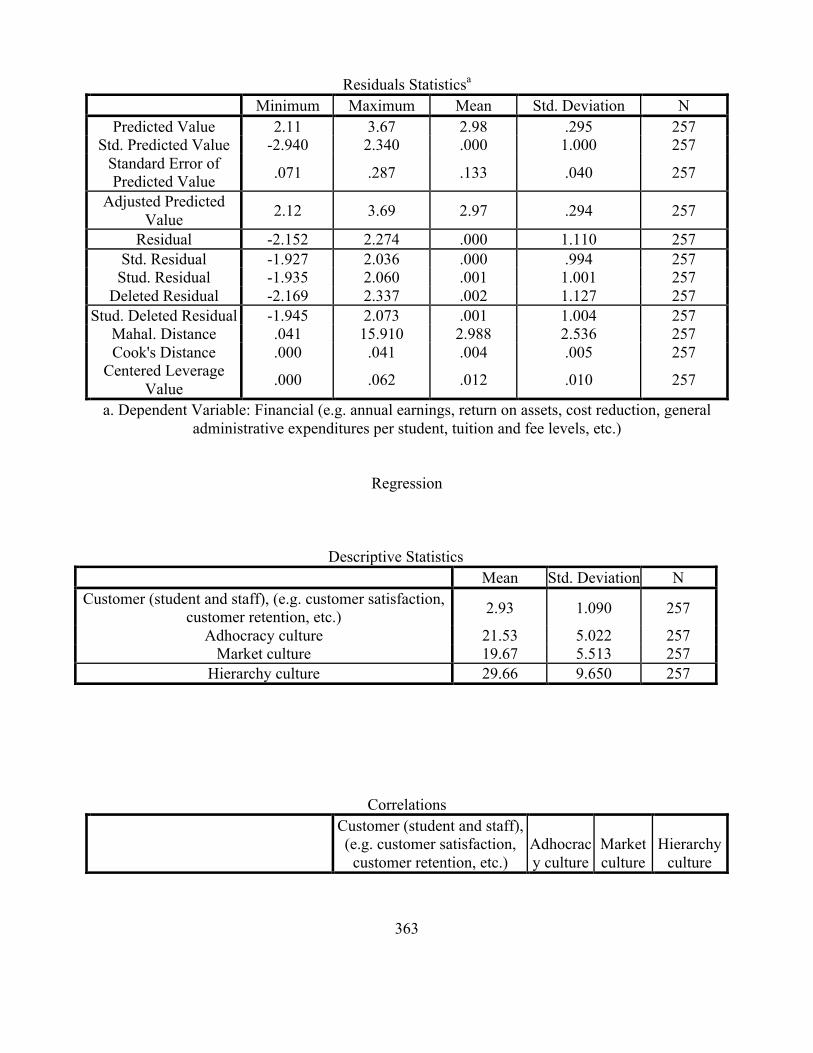
363
Residuals Statisticsa Minimum Maximum Mean Std. Deviation N
Predicted Value 2.11 3.67 2.98 .295 257 Std. Predicted Value -2.940 2.340 .000 1.000 257
Standard Error of Predicted Value .071 .287 .133 .040 257
Adjusted Predicted Value 2.12 3.69 2.97 .294 257
Residual -2.152 2.274 .000 1.110 257 Std. Residual -1.927 2.036 .000 .994 257 Stud. Residual -1.935 2.060 .001 1.001 257
Deleted Residual -2.169 2.337 .002 1.127 257 Stud. Deleted Residual -1.945 2.073 .001 1.004 257
Mahal. Distance .041 15.910 2.988 2.536 257 Cook's Distance .000 .041 .004 .005 257
Centered Leverage Value .000 .062 .012 .010 257
a. Dependent Variable: Financial (e.g. annual earnings, return on assets, cost reduction, general administrative expenditures per student, tuition and fee levels, etc.)
Regression
Descriptive Statistics Mean Std. Deviation N
Customer (student and staff), (e.g. customer satisfaction, customer retention, etc.) 2.93 1.090 257
Adhocracy culture 21.53 5.022 257 Market culture 19.67 5.513 257
Hierarchy culture 29.66 9.650 257
Correlations
Customer (student and staff), (e.g. customer satisfaction,
customer retention, etc.) Adhocracy culture
Market culture
Hierarchy culture

364
Pearson Correlation
Customer (student and staff), (e.g. customer satisfaction, customer
retention, etc.)
1.000 .150 .001 .064
Adhocracy culture .150 1.000 .146 -.274 Market culture .001 .146 1.000 -.404
Hierarchy culture .064 -.274 -.404 1.000 Sig. (1-tailed)
Customer (student and staff), (e.g. customer satisfaction, customer
retention, etc.)
. .008 .492 .153
Adhocracy culture .008 . .009 .000 Market culture .492 .009 . .000
Hierarchy culture .153 .000 .000 . N Customer (student and
staff), (e.g. customer satisfaction, customer
retention, etc.)
257 257 257 257
Adhocracy culture 257 257 257 257 Market culture 257 257 257 257
Hierarchy culture 257 257 257 257
Model Summaryb
Model R R
Square Adjusted R
Square
Std. Error of the
Estimate
Change Statistics R Square Change
F Change df1 df2
Sig. F Change
1 .187a .035 .024 1.077 .035 3.058 3 253 .029 a. Predictors: (Constant), Hierarchy culture, Adhocracy culture, Market culture
b. Dependent Variable: Customer (student and staff), (e.g. customer satisfaction, customer retention, etc.)
ANOVAa Model Sum of Squares df Mean Square F Sig.
1 Regression 10.632 3 3.544 3.058 .029b Residual 293.244 253 1.159
Total 303.875 256 a. Dependent Variable: Customer (student and staff), (e.g. customer satisfaction, customer retention,
etc.) b. Predictors: (Constant), Hierarchy culture, Adhocracy culture, Market culture
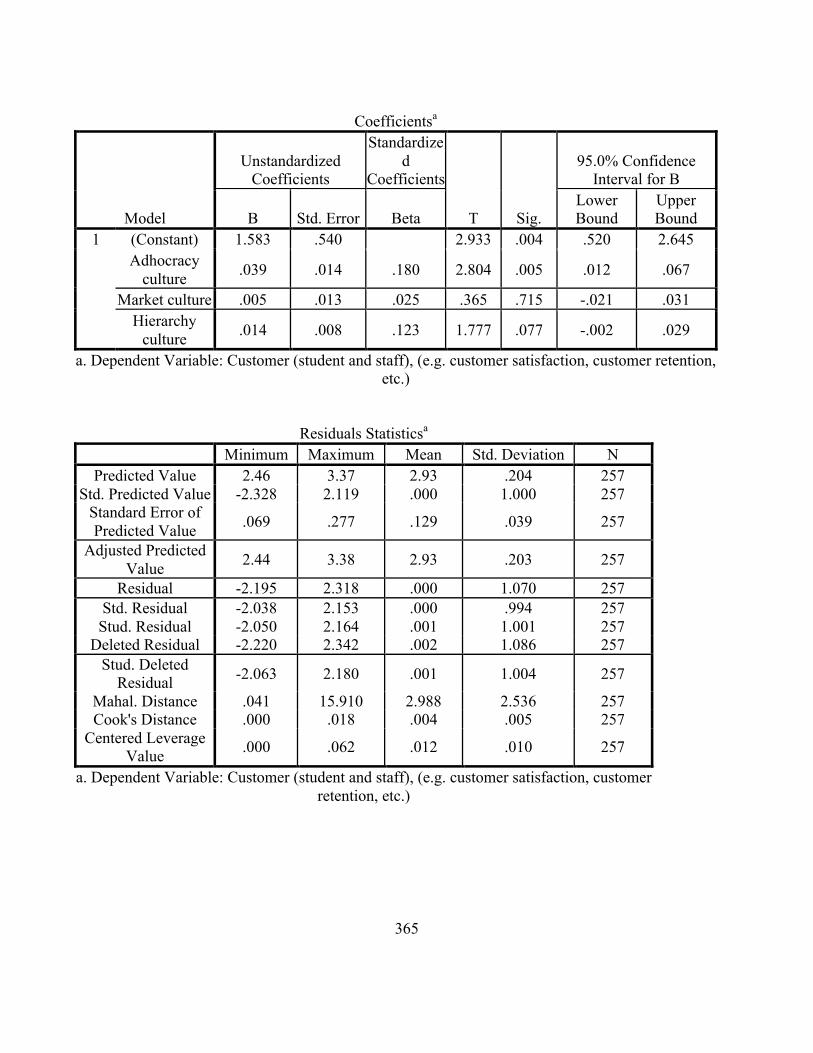
365
Coefficientsa
Model
Unstandardized Coefficients
Standardized
Coefficients
T Sig.
95.0% Confidence Interval for B
B Std. Error Beta Lower Bound
Upper Bound
1 (Constant) 1.583 .540 2.933 .004 .520 2.645 Adhocracy
culture .039 .014 .180 2.804 .005 .012 .067
Market culture .005 .013 .025 .365 .715 -.021 .031 Hierarchy
culture .014 .008 .123 1.777 .077 -.002 .029
a. Dependent Variable: Customer (student and staff), (e.g. customer satisfaction, customer retention, etc.)
Residuals Statisticsa Minimum Maximum Mean Std. Deviation N
Predicted Value 2.46 3.37 2.93 .204 257 Std. Predicted Value -2.328 2.119 .000 1.000 257
Standard Error of Predicted Value .069 .277 .129 .039 257
Adjusted Predicted Value 2.44 3.38 2.93 .203 257
Residual -2.195 2.318 .000 1.070 257 Std. Residual -2.038 2.153 .000 .994 257 Stud. Residual -2.050 2.164 .001 1.001 257
Deleted Residual -2.220 2.342 .002 1.086 257 Stud. Deleted
Residual -2.063 2.180 .001 1.004 257
Mahal. Distance .041 15.910 2.988 2.536 257 Cook's Distance .000 .018 .004 .005 257
Centered Leverage Value .000 .062 .012 .010 257
a. Dependent Variable: Customer (student and staff), (e.g. customer satisfaction, customer retention, etc.)
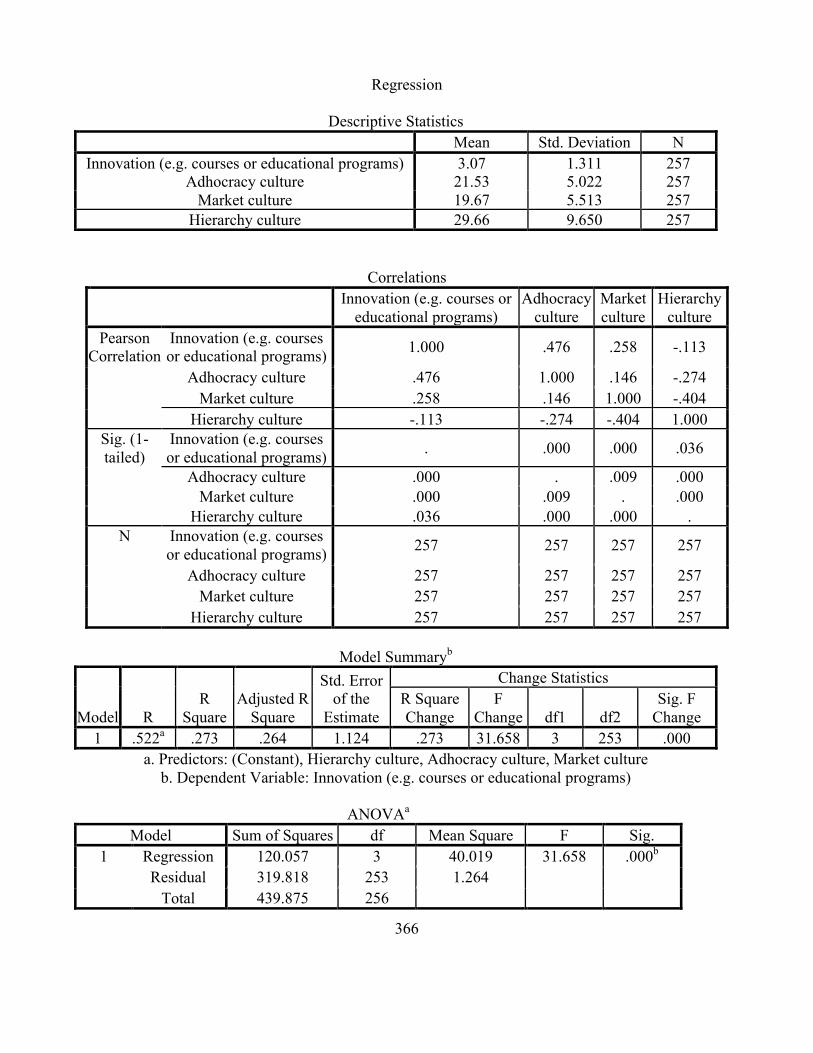
366
Regression
Descriptive Statistics Mean Std. Deviation N
Innovation (e.g. courses or educational programs) 3.07 1.311 257 Adhocracy culture 21.53 5.022 257
Market culture 19.67 5.513 257 Hierarchy culture 29.66 9.650 257
Correlations
Innovation (e.g. courses or
educational programs) Adhocracy
culture Market culture
Hierarchy culture
Pearson Correlation
Innovation (e.g. courses or educational programs) 1.000 .476 .258 -.113
Adhocracy culture .476 1.000 .146 -.274 Market culture .258 .146 1.000 -.404
Hierarchy culture -.113 -.274 -.404 1.000 Sig. (1-tailed)
Innovation (e.g. courses or educational programs) . .000 .000 .036
Adhocracy culture .000 . .009 .000 Market culture .000 .009 . .000
Hierarchy culture .036 .000 .000 . N Innovation (e.g. courses
or educational programs) 257 257 257 257
Adhocracy culture 257 257 257 257 Market culture 257 257 257 257
Hierarchy culture 257 257 257 257
Model Summaryb
Model R R
Square Adjusted R
Square
Std. Error of the
Estimate
Change Statistics R Square Change
F Change df1 df2
Sig. F Change
1 .522a .273 .264 1.124 .273 31.658 3 253 .000 a. Predictors: (Constant), Hierarchy culture, Adhocracy culture, Market culture
b. Dependent Variable: Innovation (e.g. courses or educational programs)
ANOVAa Model Sum of Squares df Mean Square F Sig.
1 Regression 120.057 3 40.019 31.658 .000b Residual 319.818 253 1.264
Total 439.875 256
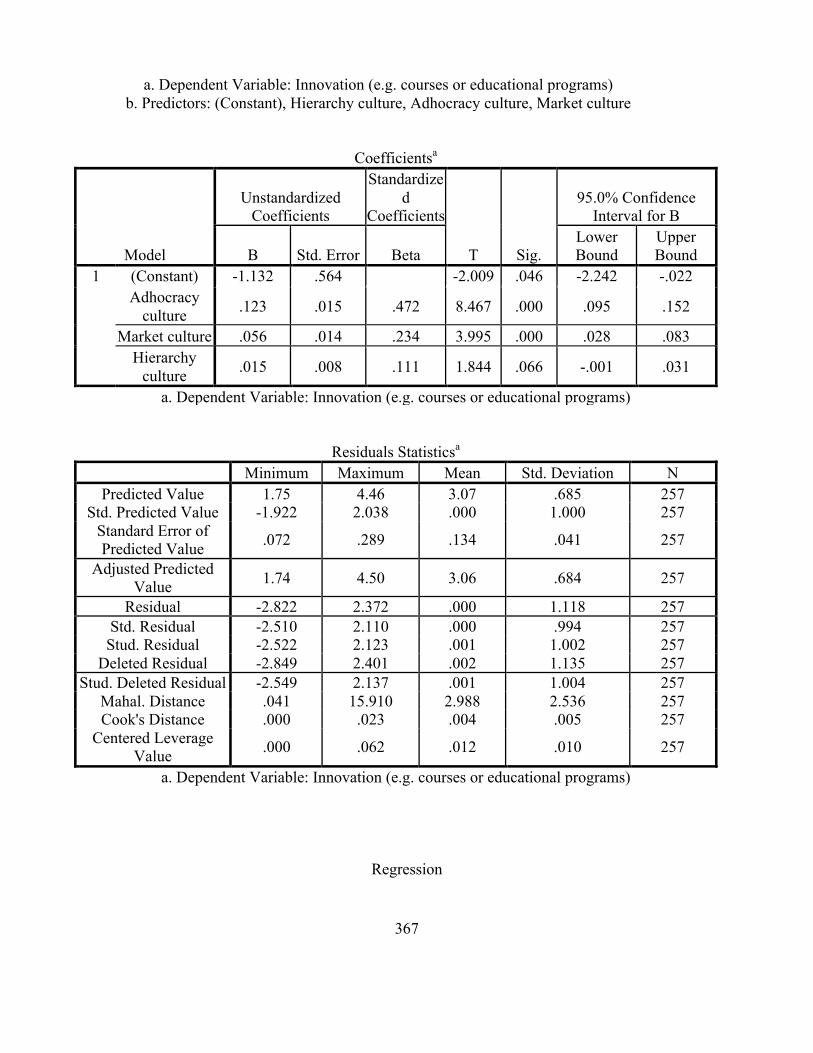
367
a. Dependent Variable: Innovation (e.g. courses or educational programs) b. Predictors: (Constant), Hierarchy culture, Adhocracy culture, Market culture
Coefficientsa
Model
Unstandardized Coefficients
Standardized
Coefficients
T Sig.
95.0% Confidence Interval for B
B Std. Error Beta Lower Bound
Upper Bound
1 (Constant) -1.132 .564 -2.009 .046 -2.242 -.022 Adhocracy
culture .123 .015 .472 8.467 .000 .095 .152
Market culture .056 .014 .234 3.995 .000 .028 .083 Hierarchy
culture .015 .008 .111 1.844 .066 -.001 .031
a. Dependent Variable: Innovation (e.g. courses or educational programs)
Residuals Statisticsa Minimum Maximum Mean Std. Deviation N
Predicted Value 1.75 4.46 3.07 .685 257 Std. Predicted Value -1.922 2.038 .000 1.000 257
Standard Error of Predicted Value .072 .289 .134 .041 257
Adjusted Predicted Value 1.74 4.50 3.06 .684 257
Residual -2.822 2.372 .000 1.118 257 Std. Residual -2.510 2.110 .000 .994 257 Stud. Residual -2.522 2.123 .001 1.002 257
Deleted Residual -2.849 2.401 .002 1.135 257 Stud. Deleted Residual -2.549 2.137 .001 1.004 257
Mahal. Distance .041 15.910 2.988 2.536 257 Cook's Distance .000 .023 .004 .005 257
Centered Leverage Value .000 .062 .012 .010 257
a. Dependent Variable: Innovation (e.g. courses or educational programs)
Regression
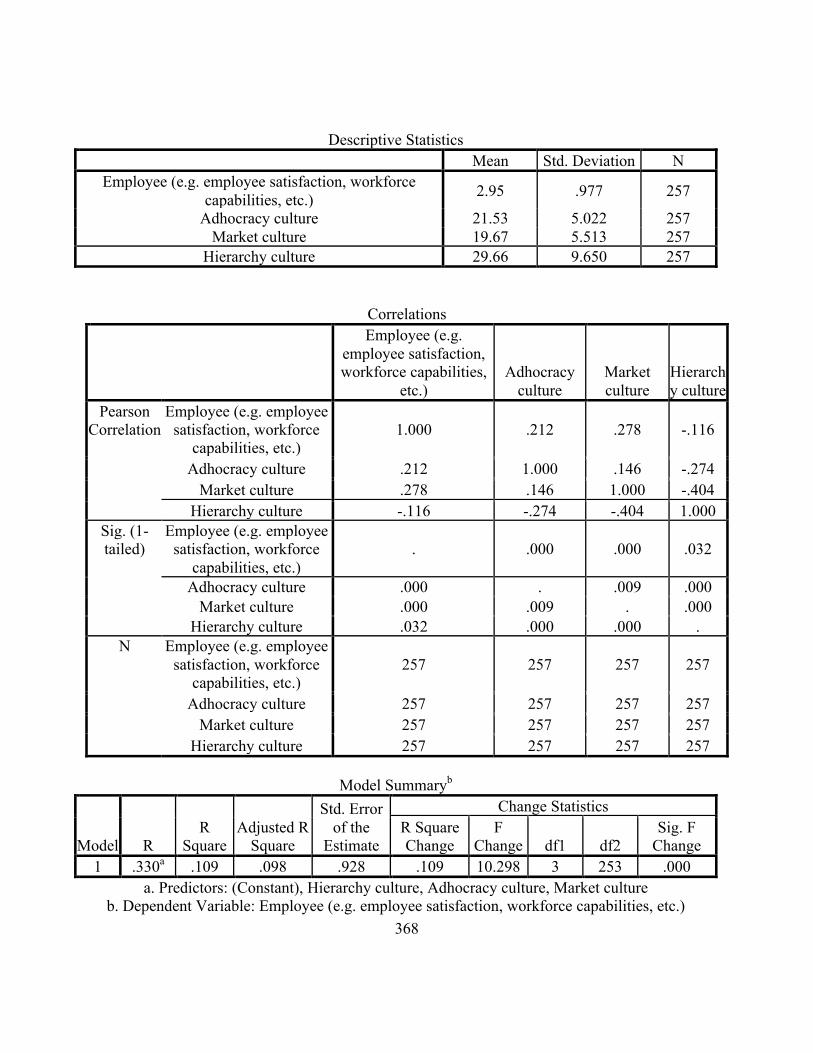
368
Descriptive Statistics Mean Std. Deviation N
Employee (e.g. employee satisfaction, workforce capabilities, etc.) 2.95 .977 257
Adhocracy culture 21.53 5.022 257 Market culture 19.67 5.513 257
Hierarchy culture 29.66 9.650 257
Correlations
Employee (e.g. employee satisfaction, workforce capabilities,
etc.) Adhocracy
culture Market culture
Hierarchy culture
Pearson Correlation
Employee (e.g. employee satisfaction, workforce
capabilities, etc.) 1.000 .212 .278 -.116
Adhocracy culture .212 1.000 .146 -.274 Market culture .278 .146 1.000 -.404
Hierarchy culture -.116 -.274 -.404 1.000 Sig. (1-tailed)
Employee (e.g. employee satisfaction, workforce
capabilities, etc.) . .000 .000 .032
Adhocracy culture .000 . .009 .000 Market culture .000 .009 . .000
Hierarchy culture .032 .000 .000 . N Employee (e.g. employee
satisfaction, workforce capabilities, etc.)
257 257 257 257
Adhocracy culture 257 257 257 257 Market culture 257 257 257 257
Hierarchy culture 257 257 257 257
Model Summaryb
Model R R
Square Adjusted R
Square
Std. Error of the
Estimate
Change Statistics R Square Change
F Change df1 df2
Sig. F Change
1 .330a .109 .098 .928 .109 10.298 3 253 .000 a. Predictors: (Constant), Hierarchy culture, Adhocracy culture, Market culture
b. Dependent Variable: Employee (e.g. employee satisfaction, workforce capabilities, etc.)
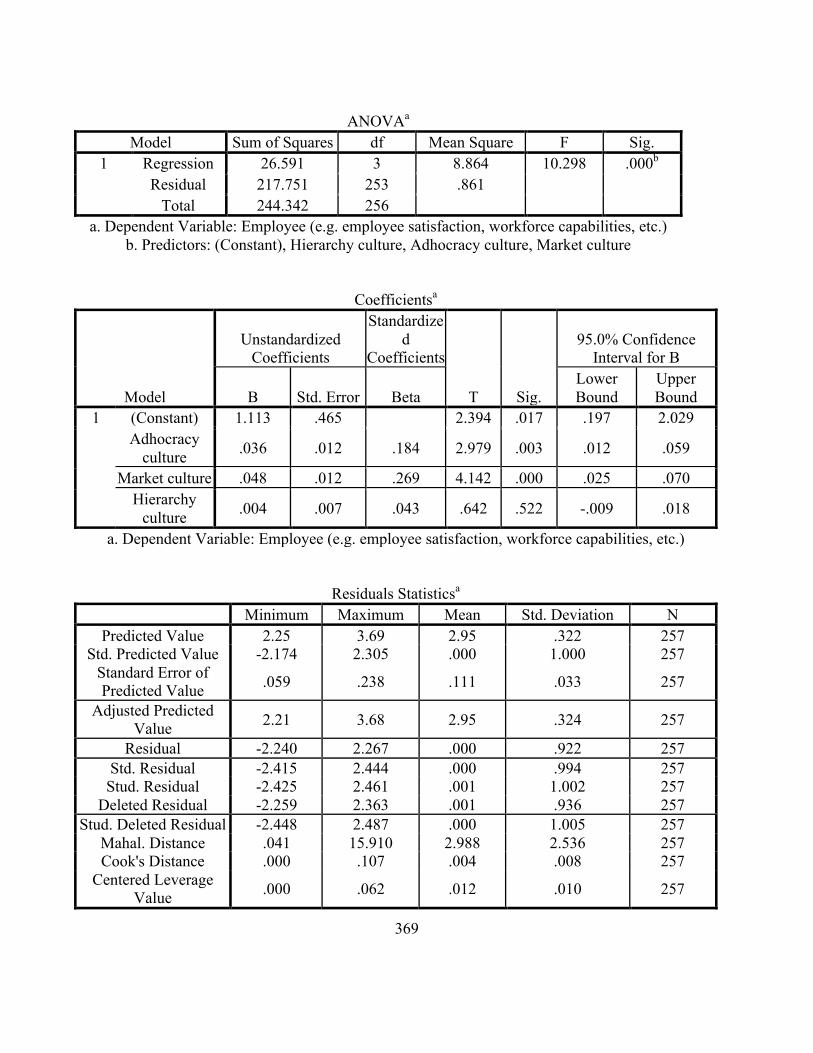
369
ANOVAa Model Sum of Squares df Mean Square F Sig.
1 Regression 26.591 3 8.864 10.298 .000b Residual 217.751 253 .861
Total 244.342 256 a. Dependent Variable: Employee (e.g. employee satisfaction, workforce capabilities, etc.)
b. Predictors: (Constant), Hierarchy culture, Adhocracy culture, Market culture
Coefficientsa
Model
Unstandardized Coefficients
Standardized
Coefficients
T Sig.
95.0% Confidence Interval for B
B Std. Error Beta Lower Bound
Upper Bound
1 (Constant) 1.113 .465 2.394 .017 .197 2.029 Adhocracy
culture .036 .012 .184 2.979 .003 .012 .059
Market culture .048 .012 .269 4.142 .000 .025 .070 Hierarchy
culture .004 .007 .043 .642 .522 -.009 .018
a. Dependent Variable: Employee (e.g. employee satisfaction, workforce capabilities, etc.)
Residuals Statisticsa Minimum Maximum Mean Std. Deviation N
Predicted Value 2.25 3.69 2.95 .322 257 Std. Predicted Value -2.174 2.305 .000 1.000 257
Standard Error of Predicted Value .059 .238 .111 .033 257
Adjusted Predicted Value 2.21 3.68 2.95 .324 257
Residual -2.240 2.267 .000 .922 257 Std. Residual -2.415 2.444 .000 .994 257 Stud. Residual -2.425 2.461 .001 1.002 257
Deleted Residual -2.259 2.363 .001 .936 257 Stud. Deleted Residual -2.448 2.487 .000 1.005 257
Mahal. Distance .041 15.910 2.988 2.536 257 Cook's Distance .000 .107 .004 .008 257
Centered Leverage Value .000 .062 .012 .010 257

370
a. Dependent Variable: Employee (e.g. employee satisfaction, workforce capabilities, etc.)
Regression
Descriptive Statistics Mean Std. Deviation N
Quality (e.g. academic quality awards, etc.) 2.43 1.267 257 Adhocracy culture 21.53 5.022 257
Market culture 19.67 5.513 257 Hierarchy culture 29.66 9.650 257
Correlations
Quality (e.g. academic quality awards, etc.)
Adhocracy culture
Market culture
Hierarchy culture
Pearson Correlatio
n
Quality (e.g. academic quality awards, etc.) 1.000 .218 .180 .032
Adhocracy culture .218 1.000 .146 -.274 Market culture .180 .146 1.000 -.404
Hierarchy culture .032 -.274 -.404 1.000 Sig. (1-tailed)
Quality (e.g. academic quality awards, etc.) . .000 .002 .307
Adhocracy culture .000 . .009 .000 Market culture .002 .009 . .000
Hierarchy culture .307 .000 .000 . N Quality (e.g. academic
quality awards, etc.) 257 257 257 257
Adhocracy culture 257 257 257 257 Market culture 257 257 257 257
Hierarchy culture 257 257 257 257
Model Summaryb
Model R R
Square Adjusted R
Square
Std. Error of the
Estimate
Change Statistics R Square Change
F Change df1 df2
Sig. F Change
1 .312a .097 .086 1.211 .097 9.066 3 253 .000 a. Predictors: (Constant), Hierarchy culture, Adhocracy culture, Market culture
b. Dependent Variable: Quality (e.g. academic quality awards, etc.)
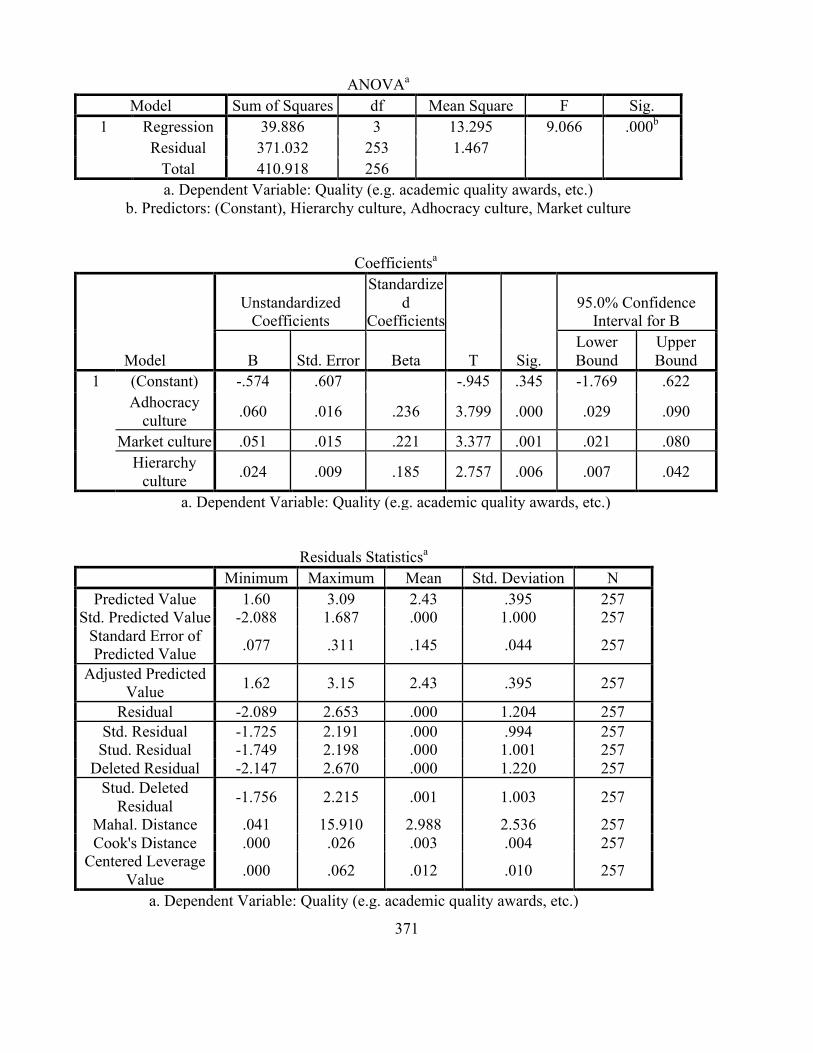
371
ANOVAa Model Sum of Squares df Mean Square F Sig.
1 Regression 39.886 3 13.295 9.066 .000b Residual 371.032 253 1.467
Total 410.918 256 a. Dependent Variable: Quality (e.g. academic quality awards, etc.)
b. Predictors: (Constant), Hierarchy culture, Adhocracy culture, Market culture
Coefficientsa
Model
Unstandardized Coefficients
Standardized
Coefficients
T Sig.
95.0% Confidence Interval for B
B Std. Error Beta Lower Bound
Upper Bound
1 (Constant) -.574 .607 -.945 .345 -1.769 .622 Adhocracy
culture .060 .016 .236 3.799 .000 .029 .090
Market culture .051 .015 .221 3.377 .001 .021 .080 Hierarchy
culture .024 .009 .185 2.757 .006 .007 .042
a. Dependent Variable: Quality (e.g. academic quality awards, etc.)
Residuals Statisticsa Minimum Maximum Mean Std. Deviation N
Predicted Value 1.60 3.09 2.43 .395 257 Std. Predicted Value -2.088 1.687 .000 1.000 257
Standard Error of Predicted Value .077 .311 .145 .044 257
Adjusted Predicted Value 1.62 3.15 2.43 .395 257
Residual -2.089 2.653 .000 1.204 257 Std. Residual -1.725 2.191 .000 .994 257 Stud. Residual -1.749 2.198 .000 1.001 257
Deleted Residual -2.147 2.670 .000 1.220 257 Stud. Deleted
Residual -1.756 2.215 .001 1.003 257
Mahal. Distance .041 15.910 2.988 2.536 257 Cook's Distance .000 .026 .003 .004 257
Centered Leverage Value .000 .062 .012 .010 257
a. Dependent Variable: Quality (e.g. academic quality awards, etc.)
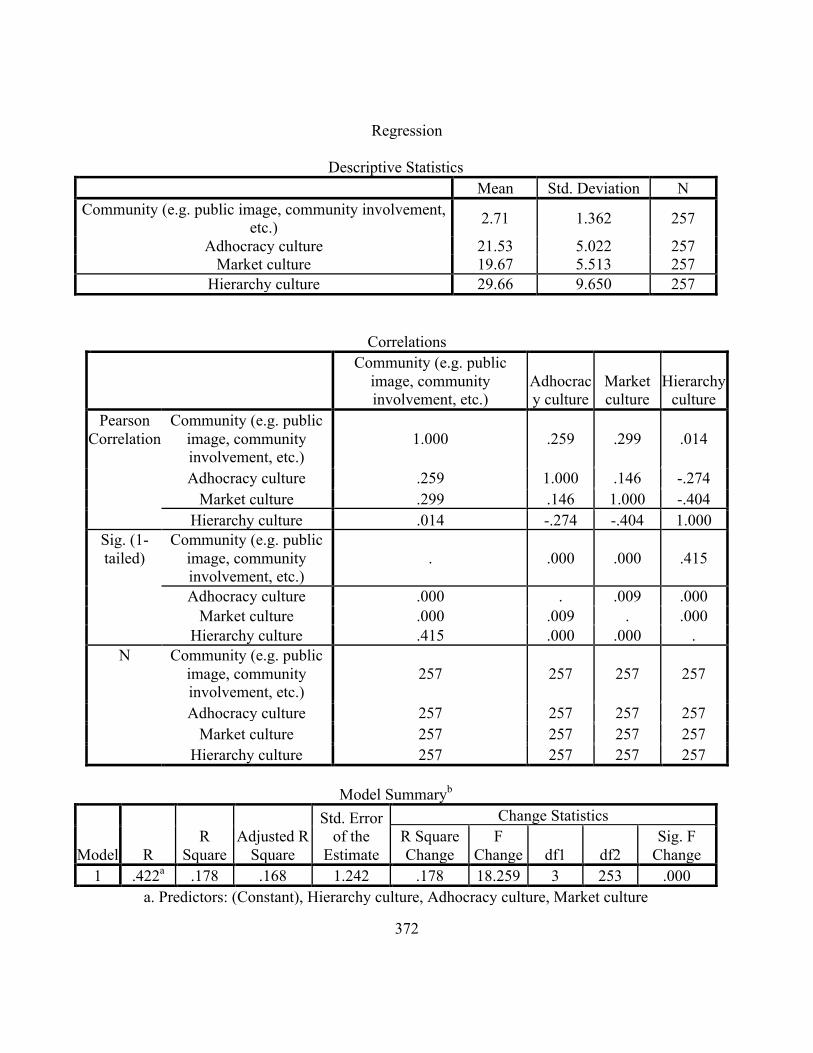
372
Regression
Descriptive Statistics Mean Std. Deviation N
Community (e.g. public image, community involvement, etc.) 2.71 1.362 257
Adhocracy culture 21.53 5.022 257 Market culture 19.67 5.513 257
Hierarchy culture 29.66 9.650 257
Correlations
Community (e.g. public image, community involvement, etc.)
Adhocracy culture
Market culture
Hierarchy culture
Pearson Correlation
Community (e.g. public image, community involvement, etc.)
1.000 .259 .299 .014
Adhocracy culture .259 1.000 .146 -.274 Market culture .299 .146 1.000 -.404
Hierarchy culture .014 -.274 -.404 1.000 Sig. (1-tailed)
Community (e.g. public image, community involvement, etc.)
. .000 .000 .415
Adhocracy culture .000 . .009 .000 Market culture .000 .009 . .000
Hierarchy culture .415 .000 .000 . N Community (e.g. public
image, community involvement, etc.)
257 257 257 257
Adhocracy culture 257 257 257 257 Market culture 257 257 257 257
Hierarchy culture 257 257 257 257
Model Summaryb
Model R R
Square Adjusted R
Square
Std. Error of the
Estimate
Change Statistics R Square Change
F Change df1 df2
Sig. F Change
1 .422a .178 .168 1.242 .178 18.259 3 253 .000 a. Predictors: (Constant), Hierarchy culture, Adhocracy culture, Market culture
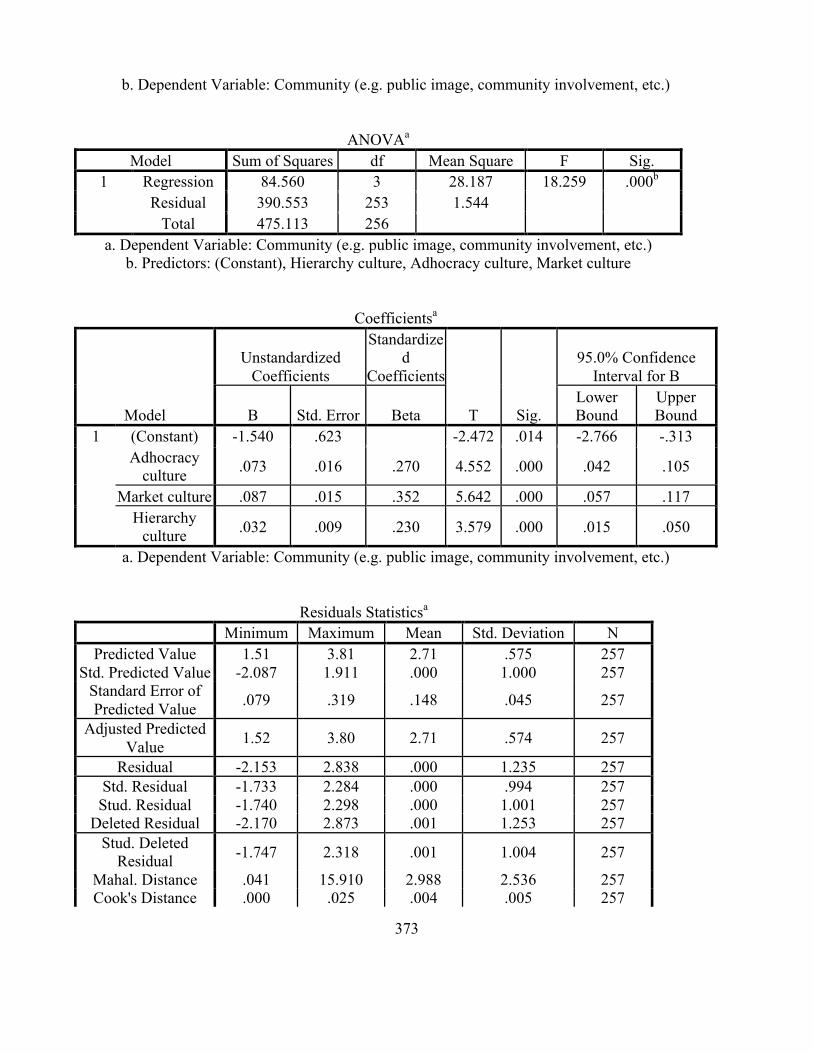
373
b. Dependent Variable: Community (e.g. public image, community involvement, etc.)
ANOVAa Model Sum of Squares df Mean Square F Sig.
1 Regression 84.560 3 28.187 18.259 .000b Residual 390.553 253 1.544
Total 475.113 256 a. Dependent Variable: Community (e.g. public image, community involvement, etc.)
b. Predictors: (Constant), Hierarchy culture, Adhocracy culture, Market culture
Coefficientsa
Model
Unstandardized Coefficients
Standardized
Coefficients
T Sig.
95.0% Confidence Interval for B
B Std. Error Beta Lower Bound
Upper Bound
1 (Constant) -1.540 .623 -2.472 .014 -2.766 -.313 Adhocracy
culture .073 .016 .270 4.552 .000 .042 .105
Market culture .087 .015 .352 5.642 .000 .057 .117 Hierarchy
culture .032 .009 .230 3.579 .000 .015 .050
a. Dependent Variable: Community (e.g. public image, community involvement, etc.)
Residuals Statisticsa Minimum Maximum Mean Std. Deviation N
Predicted Value 1.51 3.81 2.71 .575 257 Std. Predicted Value -2.087 1.911 .000 1.000 257
Standard Error of Predicted Value .079 .319 .148 .045 257
Adjusted Predicted Value 1.52 3.80 2.71 .574 257
Residual -2.153 2.838 .000 1.235 257 Std. Residual -1.733 2.284 .000 .994 257 Stud. Residual -1.740 2.298 .000 1.001 257
Deleted Residual -2.170 2.873 .001 1.253 257 Stud. Deleted
Residual -1.747 2.318 .001 1.004 257
Mahal. Distance .041 15.910 2.988 2.536 257 Cook's Distance .000 .025 .004 .005 257

374
Centered Leverage Value .000 .062 .012 .010 257
a. Dependent Variable: Community (e.g. public image, community involvement, etc.)

375
Appendix G Regression
E.A: Regression for Libyan Higher Education acceptance
Descriptive Statistics Mean Std. Deviation N
Clan culture 29.05 9.446 257 Adhocracy culture 21.53 5.022 257
Market culture 19.67 5.513 257 Hierarchy culture 29.66 9.650 257 PMS acceptance
3.59 .679 257
Correlations Clan
culture Adhocracy
culture Market culture
Hierarchy culture
PMS acceptance
Clan culture
Pearson Correlation 1 -.322** -.251** -.649** -.213** Sig. (2-tailed) .000 .000 .000 .001
N 257 257 257 257 257
Adhocracy culture
Pearson Correlation -.322** 1 .146* -.274** .222** Sig. (2-tailed) .000 .019 .000 .000
N 257 257 257 257 257
Market culture
Pearson Correlation -.251** .146* 1 -.404** -.041 Sig. (2-tailed) .000 .019 .000 .517
N 257 257 257 257 257
Hierarchy culture
Pearson Correlation -.649** -.274** -.404** 1 .115 Sig. (2-tailed) .000 .000 .000 .065
N 257 257 257 257 257 PMS
acceptance
Pearson Correlation -.213** .222** -.041 .115 1 Sig. (2-tailed) .001 .000 .517 .065
N 257 257 257 257 257
**. Correlation is significant at the 0.01 level (2-tailed). *. Correlation is significant at the 0.05 level (2-tailed).

376
Descriptive Statistics Mean Std. Deviation N
PMS acceptance 3.59 .679 257
Clan culture 29.05 9.446 257 Adhocracy culture 21.53 5.022 257
Market culture 19.67 5.513 257 Hierarchy culture 29.66 9.650 257
Correlations
PMS acceptance
Hierarchy culture
Market culture
Clan culture
Adhocracy culture
Pearson Correlation
PMS acceptance 1.000 .115 -.041 -.213 .222 Hierarchy culture .115 1.000 -.404 -.649 -.274
Market culture -.041 -.404 1.000 -.251 .146 Clan culture -.213 -.649 -.251 1.000 -.322
Adhocracy culture .222 -.274 .146 -.322 1.000
Sig. (1-tailed)
PMS acceptance
. .032 .259 .000 .000
Hierarchy culture .032 . .000 .000 .000 Market culture .259 .000 . .000 .009 Clan culture .000 .000 .000 . .000
Adhocracy culture .000 .000 .009 .000 .
N
PMS acceptance
257 257 257 257 257
Hierarchy culture 257 257 257 257 257 Market culture 257 257 257 257 257 Clan culture 257 257 257 257 257
Adhocracy culture 257 257 257 257 257
Model Summaryb Model R R Square Adjusted R
Square Std. Error of the Estimate
Durbin-Watson
1 .289a .084 .069 .655 1.556 a. Predictors: (Constant), Adhocracy culture, Market culture, Clan culture,
Hierarchy culture b. Dependent Variable: PMS acceptance

377
ANOVAa
Model Sum of Squares
df Mean Square F Sig.
1 Regression 9.878 4 2.470 5.749 .000b Residual 108.242 252 .430
Total 118.120 256 a. Dependent Variable: PMS acceptance
b. Predictors: (Constant), Adhocracy culture, Market culture, Clan culture, Hierarchy
culture
Coefficientsa Model Unstandardi
zed Coefficients
Standardized Coefficients
t Sig. 95.0% Confidence
Interval for B
Correlations Collinearity Statistics
B Std. Error
Beta Lower
Bound
Upper Bound
Zero-order
Partial
Part Tolerance
VIF
(Constant) 3.691 3.347
1.103 .271 -
2.901
10.284
Hierarchy culture .000 .034 .004 .009 .993 -.067 .067 .11
5 .001 .001 .016 64.067
Market culture -.014 .035 -.111 -.392 .696 -.082 .055
-.041
-.025
-.024 .046 21.89
1
Clan culture -.013 .033 -.179 -.386 .699 -.079 .053
-.213
-.024
-.023 .017 59.24
4
Adhocracy culture .025 .034 .182 .734 .464 -.041 .091 .22
2 .046 .044 .059 16.929
a. Dependent Variable: PMS acceptance
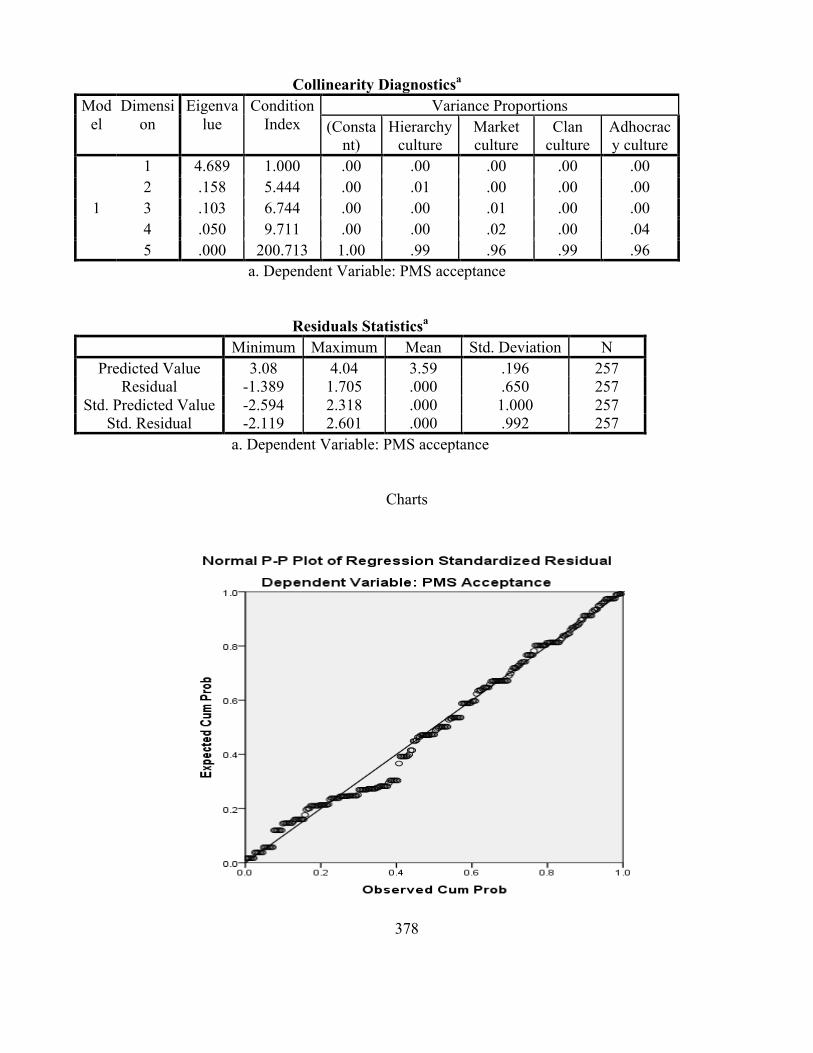
378
Collinearity Diagnosticsa Mod
el Dimensi
on Eigenva
lue Condition
Index Variance Proportions
(Constant)
Hierarchy culture
Market culture
Clan culture
Adhocracy culture
1
1 4.689 1.000 .00 .00 .00 .00 .00 2 .158 5.444 .00 .01 .00 .00 .00 3 .103 6.744 .00 .00 .01 .00 .00 4 .050 9.711 .00 .00 .02 .00 .04 5 .000 200.713 1.00 .99 .96 .99 .96
a. Dependent Variable: PMS acceptance
Residuals Statisticsa
Minimum Maximum Mean Std. Deviation N Predicted Value 3.08 4.04 3.59 .196 257
Residual -1.389 1.705 .000 .650 257 Std. Predicted Value -2.594 2.318 .000 1.000 257
Std. Residual -2.119 2.601 .000 .992 257 a. Dependent Variable: PMS acceptance
Charts

379
Descriptive Statistics Mean Std. Deviation N
PMS acceptance 3.59 .679 257
Market culture 19.67 5.513 257 Clan culture 29.05 9.446 257
Adhocracy culture 21.53 5.022 257
Correlations PMS
acceptance
Market culture
Clan culture
Adhocracy culture
Pearson Correlation
PMS acceptance 1.000 -.041 -.213 .222
Market culture -.041 1.000 -.251 .146 Clan culture -.213 -.251 1.000 -.322 Adhocracy
culture .222 .146 -.322 1.000

380
Sig. (1-tailed)
PMS acceptance . .259 .000 .000
Market culture .259 . .000 .009 Clan culture .000 .000 . .000 Adhocracy
culture .000 .009 .000 .
N
PMS acceptance 257 257 257 257
Market culture 257 257 257 257 Clan culture 257 257 257 257 Adhocracy
culture 257 257 257 257
Variables Entered/Removeda Model Variables
Entered Variables Removed
Method
1
Adhocracy culture, Market culture, Clan
cultureb
. Enter
a. Dependent Variable: PMS acceptance
b. All requested variables entered.
Model Summaryb Model R R Square Adjusted R
Square Std. Error of the Estimate
Durbin-Watson
1 .289a .084 .073 .654 1.556 a. Predictors: (Constant), Adhocracy culture, Market culture, Clan culture
b. Dependent Variable: PMS acceptance
ANOVAa Model Sum of
Squares df Mean Square F Sig.
1 Regression 9.878 3 3.293 7.696 .000b Residual 108.242 253 .428
Total 118.120 256 a. Dependent Variable: PMS acceptance

381
b. Predictors: (Constant), Adhocracy culture, Market culture, Clan culture
Coefficientsa Model Unstandardiz
ed Coefficients
Standardize
d Coefficients
t Sig. 95.0% Confidence Interval for
B
Correlations Collinearity Statistics
B Std. Error
Beta Lower
Bound
Upper Boun
d
Zero-
order
Partial
Part Toleranc
e
VIF
(Constant) Clan culture Adhocracy
culture Market culture
3.720 .312 11.921 .000 3.10
5 4.334
-.013 .005 -.183 -2.815 .005 -
.022 -.004 -.213
-.174
-.169
.854 1.171
.024 .009 .180 2.825 .005 .007 .041 .222 .175
.170 .892 1.121
-.014 .008 -.113 -1.811 .071 -
.029 .001 -.041
-.113
-.109
.932 1.073
a. Dependent Variable: PMS acceptance
Collinearity Diagnosticsa Mode
l Dimensio
n Eigenval
ue Condition
Index Variance Proportions
(Constant)
Market culture
Clan culture
Adhocracy culture
1
1 3.818 1.000 .00 .00 .01 .00 2 .117 5.724 .00 .12 .47 .05 3 .053 8.463 .00 .63 .02 .42 4 .013 17.449 1.00 .24 .51 .53
a. Dependent Variable: PMS acceptance
Residuals Statisticsa Minimum Maximum Mean Std. Deviation N
Predicted Value 3.08 4.04 3.59 .196 257 Residual -1.389 1.705 .000 .650 257
Std. Predicted Value -2.594 2.319 .000 1.000 257 Std. Residual -2.123 2.606 .000 .994 257

382
a. Dependent Variable: PMS acceptance
Charts

383
Descriptive Statistics
Mean Std. Deviation N PMS acceptance
3.59 .679 257
Market culture 19.67 5.513 257 Adhocracy culture 21.53 5.022 257 Hierarchy culture 29.66 9.650 257
Correlations PMS
acceptance
Market culture
Adhocracy culture
Hierarchy culture
Pearson Correlation
PMS acceptance 1.000 -.041 .222 .115 Market culture -.041 1.000 .146 -.404
Adhocracy culture .222 .146 1.000 -.274
Hierarchy culture .115 -.404 -.274 1.000
Sig. (1-tailed)
PMS acceptance . .259 .000 .032 Market culture .259 . .009 .000
Adhocracy culture .000 .009 . .000
Hierarchy culture .032 .000 .000 .
N
PMS acceptance 257 257 257 257 Market culture 257 257 257 257
Adhocracy culture 257 257 257 257
Hierarchy culture 257 257 257 257
Variables Entered/Removeda Model Variables
Entered Variables Removed
Method
1
Hierarchy culture,
Adhocracy culture, Market
cultureb
. Enter
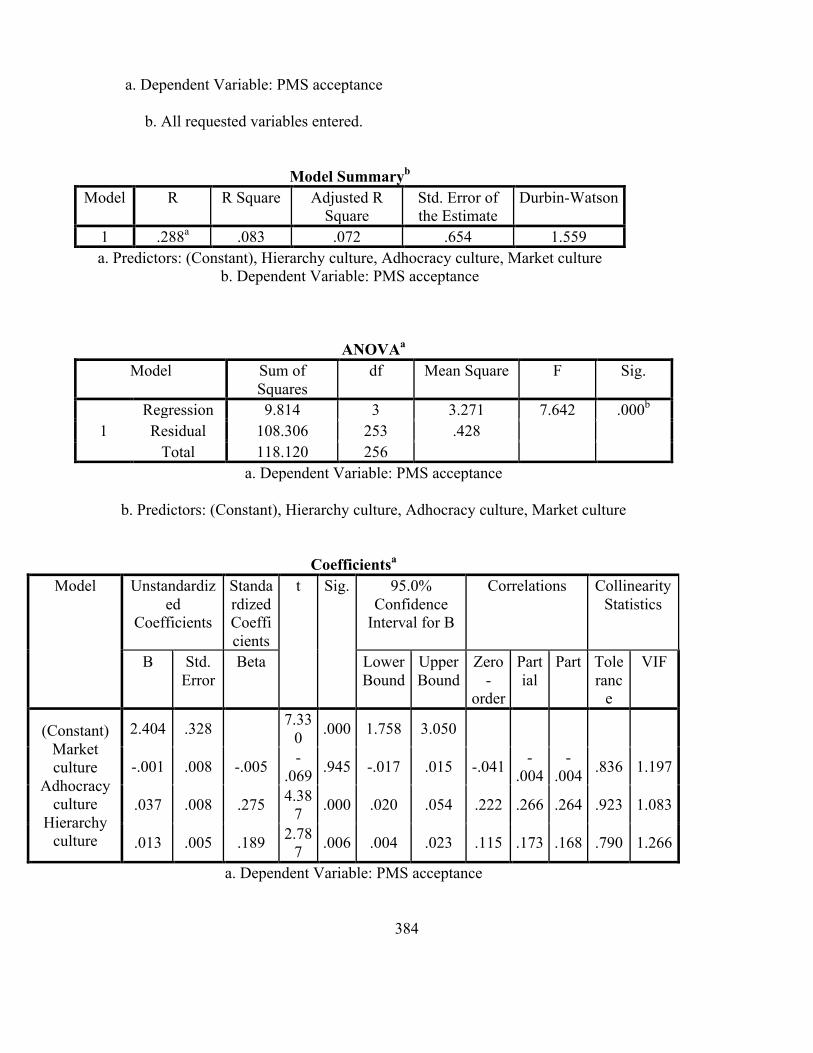
384
a. Dependent Variable: PMS acceptance
b. All requested variables entered.
Model Summaryb Model R R Square Adjusted R
Square Std. Error of the Estimate
Durbin-Watson
1 .288a .083 .072 .654 1.559 a. Predictors: (Constant), Hierarchy culture, Adhocracy culture, Market culture
b. Dependent Variable: PMS acceptance
ANOVAa Model Sum of
Squares df Mean Square F Sig.
1 Regression 9.814 3 3.271 7.642 .000b Residual 108.306 253 .428
Total 118.120 256 a. Dependent Variable: PMS acceptance
b. Predictors: (Constant), Hierarchy culture, Adhocracy culture, Market culture
Coefficientsa Model Unstandardiz
ed Coefficients
Standardized Coefficients
t Sig. 95.0% Confidence
Interval for B
Correlations Collinearity Statistics
B Std. Error
Beta Lower Bound
Upper Bound
Zero-
order
Partial
Part Toleranc
e
VIF
(Constant) Market culture
Adhocracy culture
Hierarchy culture
2.404 .328 7.330 .000 1.758 3.050
-.001 .008 -.005 -.069 .945 -.017 .015 -.041 -
.004 -
.004 .836 1.197
.037 .008 .275 4.387 .000 .020 .054 .222 .266 .264 .923 1.083
.013 .005 .189 2.787 .006 .004 .023 .115 .173 .168 .790 1.266
a. Dependent Variable: PMS acceptance

385
Collinearity Diagnosticsa
Model
Dimension
Eigenvalue
Condition Index
Variance Proportions (Constan
t) Market culture
Adhocracy culture
Hierarchy culture
1
1 3.813 1.000 .00 .00 .00 .00 2 .125 5.517 .00 .14 .03 .39 3 .050 8.711 .00 .47 .55 .04 4 .011 18.240 1.00 .38 .43 .56
a. Dependent Variable: PMS acceptance
Residuals Statisticsa Minimum Maximum Mean Std. Deviation N
Predicted Value 3.08 4.04 3.59 .196 257 Residual -1.390 1.706 .000 .650 257
Std. Predicted Value -2.580 2.310 .000 1.000 257 Std. Residual -2.124 2.607 .000 .994 257
a. Dependent Variable: PMS acceptance
Charts

386

387
Regression
Descriptive Statistics Mean Std. Deviation N
PMS acceptance 3.79 .505 27
Adhocracy culture 20.90 4.792 27 Market culture 21.30 6.394 27 Clan culture 23.92 11.125 27
Correlations PMS
acceptance
Adhocracy culture
Market culture
Clan culture
Pearson Correlation
PMS acceptance 1.000 .072 .024 -.171
Adhocracy culture .072 1.000 .297 .228
Market culture .024 .297 1.000 -.464 Clan culture -.171 .228 -.464 1.000
Sig. (1-tailed)
PMS acceptance . .361 .453 .197
Adhocracy culture .361 . .066 .126
Market culture .453 .066 . .007
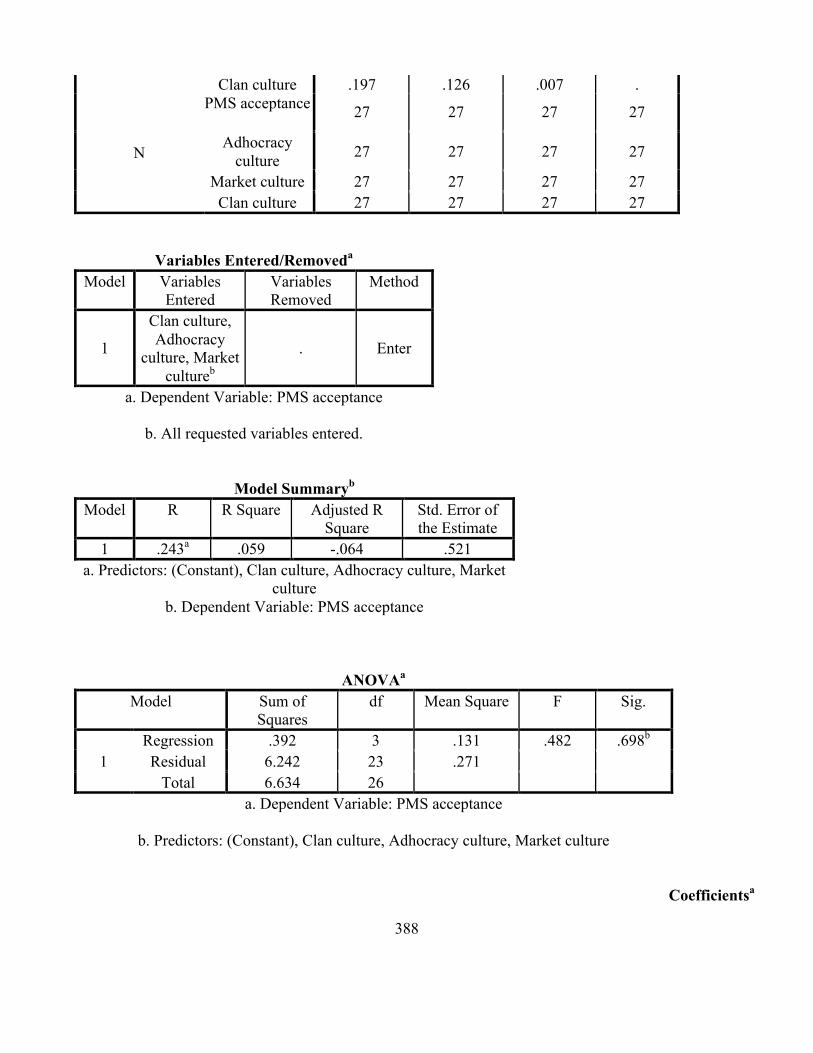
388
Clan culture .197 .126 .007 .
N
PMS acceptance 27 27 27 27
Adhocracy culture 27 27 27 27
Market culture 27 27 27 27 Clan culture 27 27 27 27
Variables Entered/Removeda Model Variables
Entered Variables Removed
Method
1
Clan culture, Adhocracy
culture, Market cultureb
. Enter
a. Dependent Variable: PMS acceptance
b. All requested variables entered.
Model Summaryb Model R R Square Adjusted R
Square Std. Error of the Estimate
1 .243a .059 -.064 .521 a. Predictors: (Constant), Clan culture, Adhocracy culture, Market
culture b. Dependent Variable: PMS acceptance
ANOVAa Model Sum of
Squares df Mean Square F Sig.
1 Regression .392 3 .131 .482 .698b Residual 6.242 23 .271
Total 6.634 26 a. Dependent Variable: PMS acceptance
b. Predictors: (Constant), Clan culture, Adhocracy culture, Market culture
Coefficientsa

389
Model Unstandardized Coefficients Standardized Coefficients
T Sig. 95.0% Confidence Interval for B Correlations Collinearity Statistics
B Std. Error Beta Lower Bound Upper Bound Zero-order Partial Part Tolerance VIF
1
(Constant) 3.968 .588 6.749 .000 2.752 5.184 Adhocracy culture .020 .025 .188 .799 .432 -.031 .071 .072 .164 .162 .741 1.350
Market culture -.013 .020 -.167 -.646 .525 -.055 .029 .024 -.133 -.131 .613 1.630 Clan culture -.013 .011 -.291 -1.148 .263 -.037 .011 -.171 -.233 -.232 .638 1.568
a. Dependent Variable: PMS acceptance
Collinearity Diagnosticsa Model Dimension Eigenvalue Condition
Index Variance Proportions
(Constant) Adhocracy culture
Market culture Clan culture
1
1 3.765 1.000 .00 .00 .00 .01 2 .188 4.471 .00 .00 .09 .37 3 .026 11.975 .10 1.00 .25 .19 4 .021 13.474 .90 .00 .65 .43
a. Dependent Variable: PMS acceptance
Residuals Statisticsa Minimum Maximum Mean Std. Deviation N
Predicted Value 3.46 3.99 3.79 .123 27 Residual -.697 1.538 .000 .490 27
Std. Predicted Value -2.632 1.671 .000 1.000 27 Std. Residual -1.338 2.952 .000 .941 27
a. Dependent Variable: PMS acceptance
Charts

390
Descriptive Statistics Mean Std. Deviation N
PMS acceptance 3.79 .505 27
Adhocracy culture 20.90 4.792 27 Market culture 21.30 6.394 27
Hierarchy culture 33.67 12.727 27
Correlations

391
PMS acceptance
Adhocracy culture
Market culture Hierarchy culture
Pearson Correlation
PMS acceptance 1.000 .072 .024 .110
Adhocracy culture .072 1.000 .297 -.715 Market culture .024 .297 1.000 -.227
Hierarchy culture .110 -.715 -.227 1.000
Sig. (1-tailed)
PMS acceptance . .361 .453 .292
Adhocracy culture .361 . .066 .000 Market culture .453 .066 . .128
Hierarchy culture .292 .000 .128 .
N
PMS acceptance 27 27 27 27
Adhocracy culture 27 27 27 27 Market culture 27 27 27 27
Hierarchy culture 27 27 27 27
Variables Entered/Removeda Model Variables
Entered Variables Removed
Method
1
Hierarchy culture, Market
culture, Adhocracy
cultureb
. Enter
a. Dependent Variable: PMS acceptance
b. All requested variables entered.
Model Summaryb Model R R Square Adjusted R
Square Std. Error of the Estimate
1 .243a .059 -.064 .521 a. Predictors: (Constant), Hierarchy culture, Market culture,
Adhocracy culture b. Dependent Variable: PMS acceptance
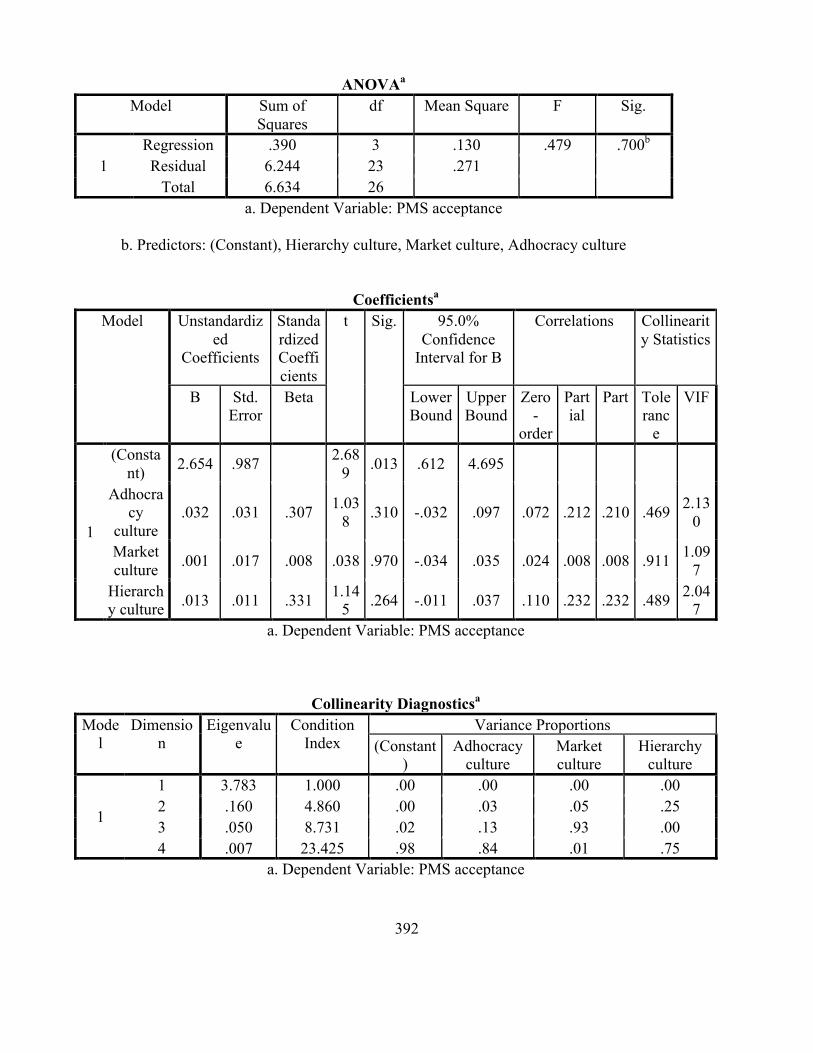
392
ANOVAa Model Sum of
Squares df Mean Square F Sig.
1 Regression .390 3 .130 .479 .700b Residual 6.244 23 .271
Total 6.634 26 a. Dependent Variable: PMS acceptance
b. Predictors: (Constant), Hierarchy culture, Market culture, Adhocracy culture
Coefficientsa Model Unstandardiz
ed Coefficients
Standardized Coefficients
t Sig. 95.0% Confidence
Interval for B
Correlations Collinearity Statistics
B Std. Error
Beta Lower Bound
Upper Bound
Zero-
order
Partial
Part Toleranc
e
VIF
1
(Constant) 2.654 .987 2.68
9 .013 .612 4.695
Adhocracy
culture .032 .031 .307 1.03
8 .310 -.032 .097 .072 .212 .210 .469 2.130
Market culture .001 .017 .008 .038 .970 -.034 .035 .024 .008 .008 .911 1.09
7 Hierarchy culture .013 .011 .331 1.14
5 .264 -.011 .037 .110 .232 .232 .489 2.047
a. Dependent Variable: PMS acceptance
Collinearity Diagnosticsa Mode
l Dimensio
n Eigenvalu
e Condition
Index Variance Proportions
(Constant)
Adhocracy culture
Market culture
Hierarchy culture
1
1 3.783 1.000 .00 .00 .00 .00 2 .160 4.860 .00 .03 .05 .25 3 .050 8.731 .02 .13 .93 .00 4 .007 23.425 .98 .84 .01 .75
a. Dependent Variable: PMS acceptance

393
Residuals Statisticsa
Minimum Maximum Mean Std. Deviation N Predicted Value 3.46 3.99 3.79 .123 27
Residual -.697 1.537 .000 .490 27 Std. Predicted Value -2.631 1.693 .000 1.000 27
Std. Residual -1.338 2.950 .000 .941 27 a. Dependent Variable: PMS acceptance
Charts
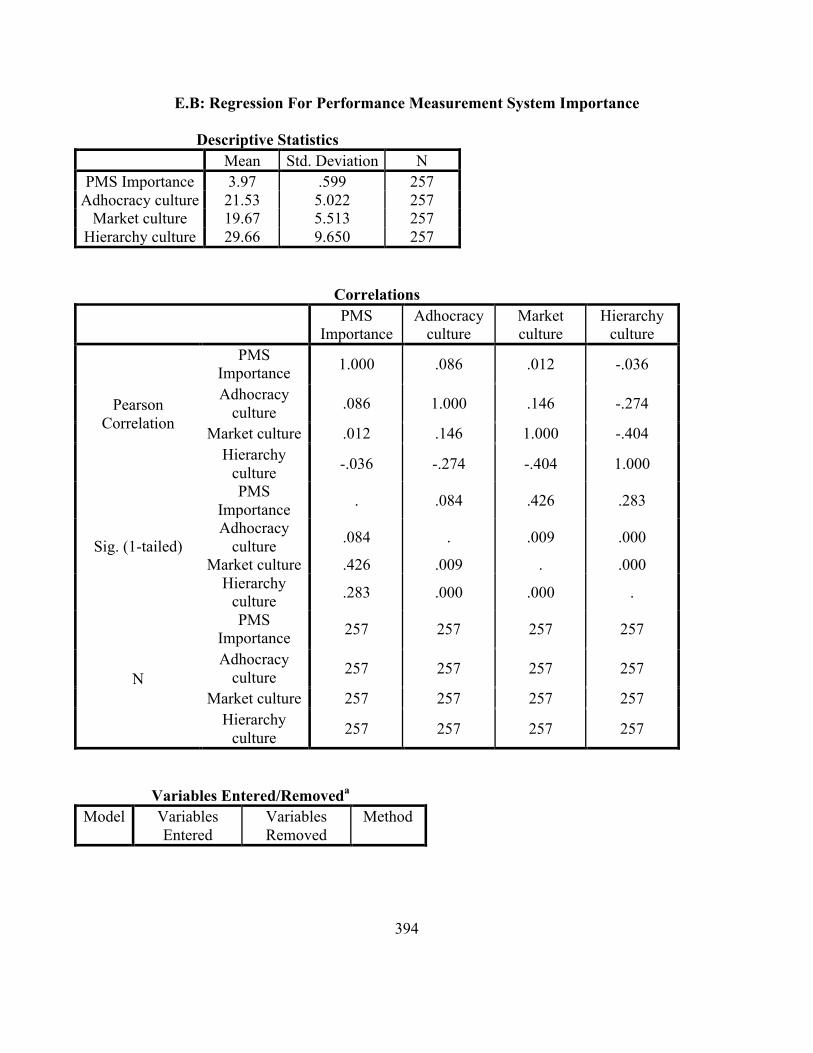
394
E.B: Regression For Performance Measurement System Importance
Descriptive Statistics
Mean Std. Deviation N PMS Importance 3.97 .599 257
Adhocracy culture 21.53 5.022 257 Market culture 19.67 5.513 257
Hierarchy culture 29.66 9.650 257
Correlations PMS
Importance Adhocracy
culture Market culture
Hierarchy culture
Pearson Correlation
PMS Importance 1.000 .086 .012 -.036
Adhocracy culture .086 1.000 .146 -.274
Market culture .012 .146 1.000 -.404 Hierarchy
culture -.036 -.274 -.404 1.000
Sig. (1-tailed)
PMS Importance . .084 .426 .283
Adhocracy culture .084 . .009 .000
Market culture .426 .009 . .000 Hierarchy
culture .283 .000 .000 .
N
PMS Importance 257 257 257 257
Adhocracy culture 257 257 257 257
Market culture 257 257 257 257 Hierarchy
culture 257 257 257 257
Variables Entered/Removeda Model Variables
Entered Variables Removed
Method

395
1
Hierarchy culture,
Adhocracy culture, Market
cultureb
. Enter
a. Dependent Variable: PMS Importance b. All requested variables entered.
Model Summaryb Model R R Square Adjusted R
Square Std. Error of the Estimate
1 .087a .008 -.004 .600 a. Predictors: (Constant), Hierarchy culture, Adhocracy culture,
Market culture b. Dependent Variable: PMS Importance
ANOVAa Model Sum of
Squares df Mean Square F Sig.
1 Regression .699 3 .233 .647 .586b Residual 91.147 253 .360
Total 91.846 256 a. Dependent Variable: PMS Importance
b. Predictors: (Constant), Hierarchy culture, Adhocracy culture, Market culture
Coefficientsa Model Unstandardiz
ed Coefficients
Standardize
d Coefficients
t Sig. 95.0% Confidence
Interval for B
Correlations Collinearity
Statistics
B Std. Error
Beta Lower Boun
d
Upper Boun
d
Zero-
order
Partial
Part Toleranc
e
VIF
1
(Constant) 3.806 .301 12.
648 .000 3.213 4.398
Adhocracy
culture .010 .008 .083 1.2
68 .206 -.005 .025 .086 .07
9 .079 .923 1.0
83

396
Market culture -.001 .007 -.007
-.100
.921 -.015 .014 .012
-.006
-.006
.836 1.197
Hierarchy
culture -.001 .004 -.016
-.229
.819 -.010 .008 -
.036
-.014
-.014
.790 1.266
a. Dependent Variable: PMS Importance
Collinearity Diagnosticsa Mod
el Dimensio
n Eigenval
ue Condition
Index Variance Proportions
(Constant)
Adhocracy culture
Market culture
Hierarchy culture
1
1 3.813 1.000 .00 .00 .00 .00 2 .125 5.517 .00 .03 .14 .39 3 .050 8.711 .00 .55 .47 .04 4 .011 18.240 1.00 .43 .38 .56
a. Dependent Variable: PMS Importance
Residuals Statisticsa Minimum Maximum Mean Std. Deviation N
Predicted Value 3.85 4.10 3.97 .052 257 Residual -2.103 1.005 .000 .597 257
Std. Predicted Value -2.387 2.415 .000 1.000 257 Std. Residual -3.504 1.674 .000 .994 257
a. Dependent Variable: PMS Importance
Charts
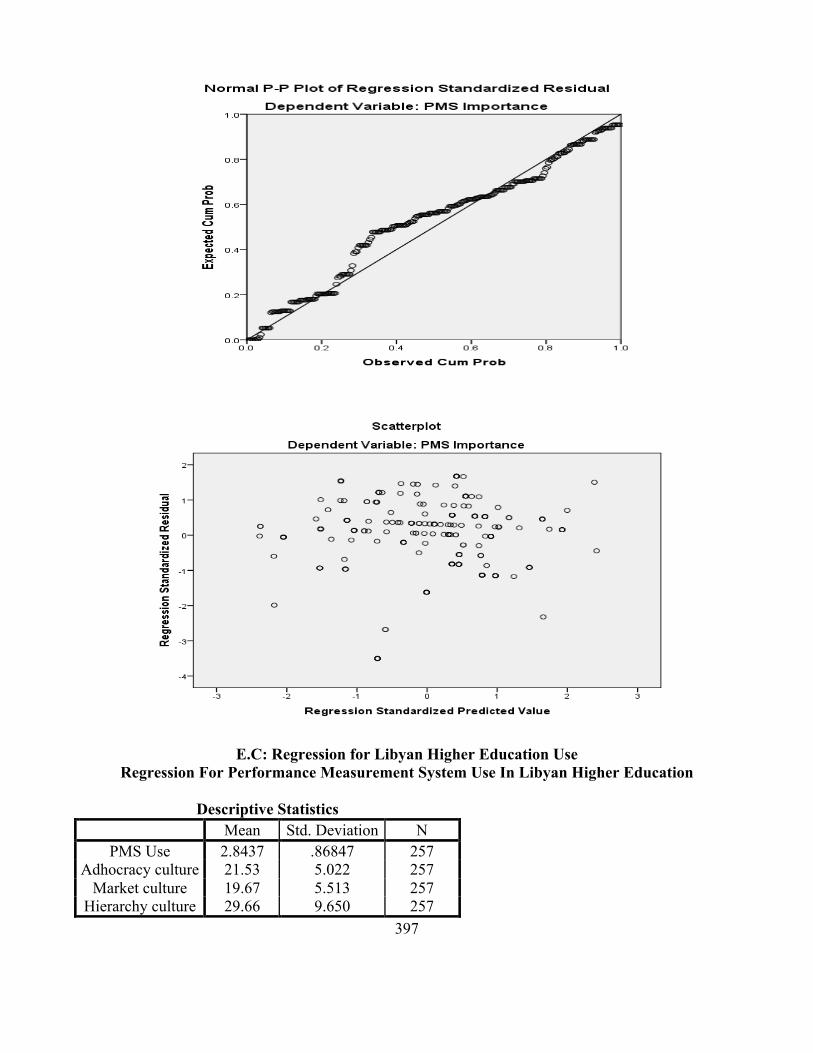
397
E.C: Regression for Libyan Higher Education Use Regression For Performance Measurement System Use In Libyan Higher Education
Descriptive Statistics
Mean Std. Deviation N PMS Use 2.8437 .86847 257
Adhocracy culture 21.53 5.022 257 Market culture 19.67 5.513 257
Hierarchy culture 29.66 9.650 257
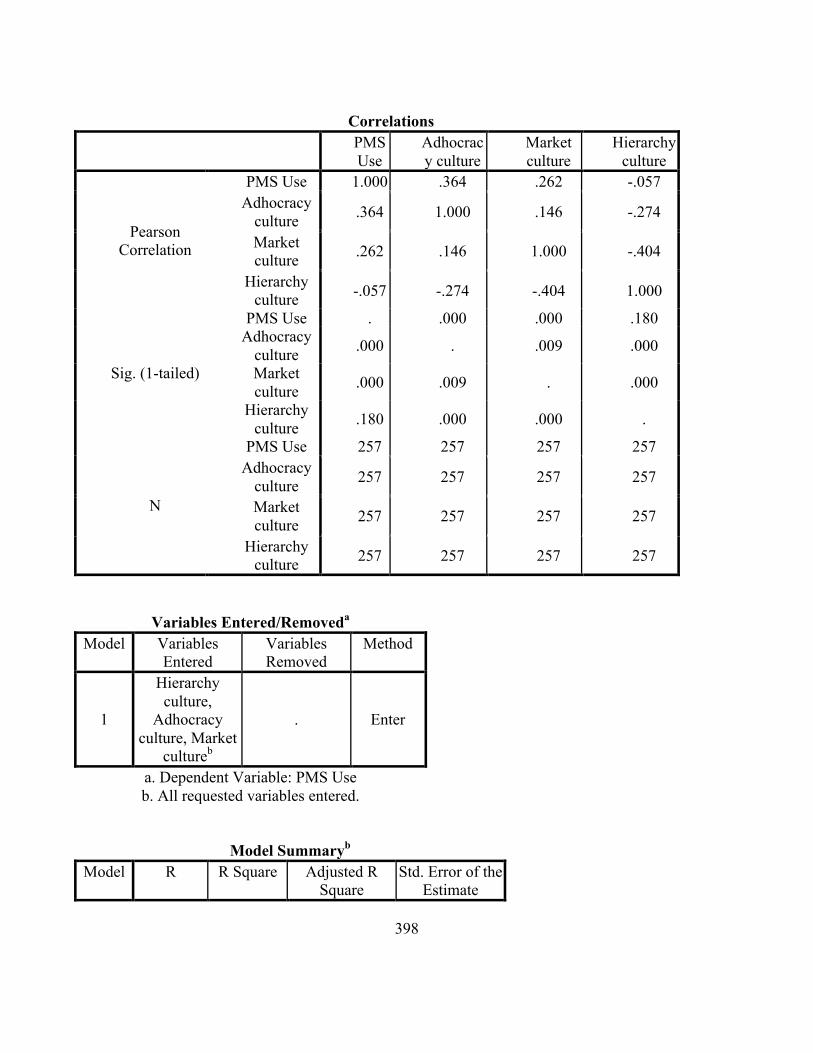
398
Correlations PMS
Use Adhocracy culture
Market culture
Hierarchy culture
Pearson Correlation
PMS Use 1.000 .364 .262 -.057 Adhocracy
culture .364 1.000 .146 -.274
Market culture .262 .146 1.000 -.404
Hierarchy culture -.057 -.274 -.404 1.000
Sig. (1-tailed)
PMS Use . .000 .000 .180 Adhocracy
culture .000 . .009 .000
Market culture .000 .009 . .000
Hierarchy culture .180 .000 .000 .
N
PMS Use 257 257 257 257 Adhocracy
culture 257 257 257 257
Market culture 257 257 257 257
Hierarchy culture 257 257 257 257
Variables Entered/Removeda Model Variables
Entered Variables Removed
Method
1
Hierarchy culture,
Adhocracy culture, Market
cultureb
. Enter
a. Dependent Variable: PMS Use b. All requested variables entered.
Model Summaryb Model R R Square Adjusted R
Square Std. Error of the
Estimate
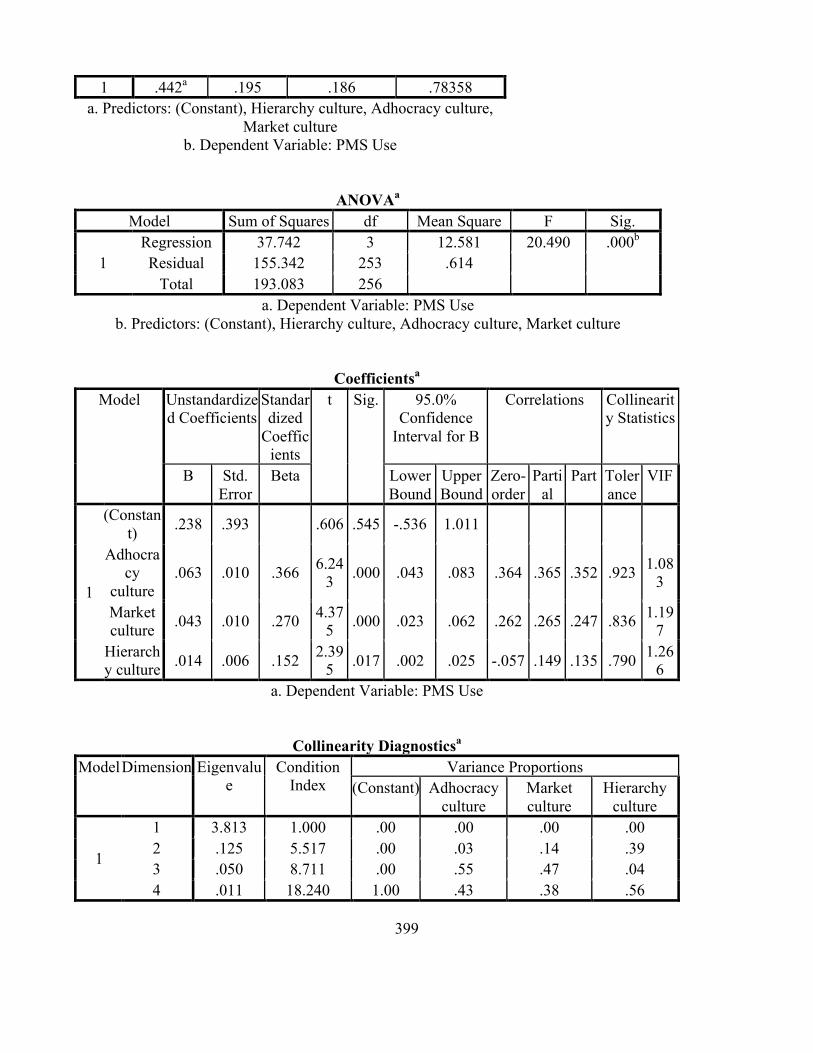
399
1 .442a .195 .186 .78358 a. Predictors: (Constant), Hierarchy culture, Adhocracy culture,
Market culture b. Dependent Variable: PMS Use
ANOVAa Model Sum of Squares df Mean Square F Sig.
1 Regression 37.742 3 12.581 20.490 .000b Residual 155.342 253 .614
Total 193.083 256 a. Dependent Variable: PMS Use
b. Predictors: (Constant), Hierarchy culture, Adhocracy culture, Market culture
Coefficientsa Model Unstandardize
d Coefficients Standardized
Coefficients
t Sig. 95.0% Confidence
Interval for B
Correlations Collinearity Statistics
B Std. Error
Beta Lower Bound
Upper Bound
Zero-order
Partial
Part Tolerance
VIF
1
(Constant) .238 .393 .606 .545 -.536 1.011
Adhocracy
culture .063 .010 .366 6.24
3 .000 .043 .083 .364 .365 .352 .923 1.083
Market culture .043 .010 .270 4.37
5 .000 .023 .062 .262 .265 .247 .836 1.197
Hierarchy culture .014 .006 .152 2.39
5 .017 .002 .025 -.057 .149 .135 .790 1.266
a. Dependent Variable: PMS Use
Collinearity Diagnosticsa Model Dimension Eigenvalu
e Condition
Index Variance Proportions
(Constant) Adhocracy culture
Market culture
Hierarchy culture
1
1 3.813 1.000 .00 .00 .00 .00 2 .125 5.517 .00 .03 .14 .39 3 .050 8.711 .00 .55 .47 .04 4 .011 18.240 1.00 .43 .38 .56
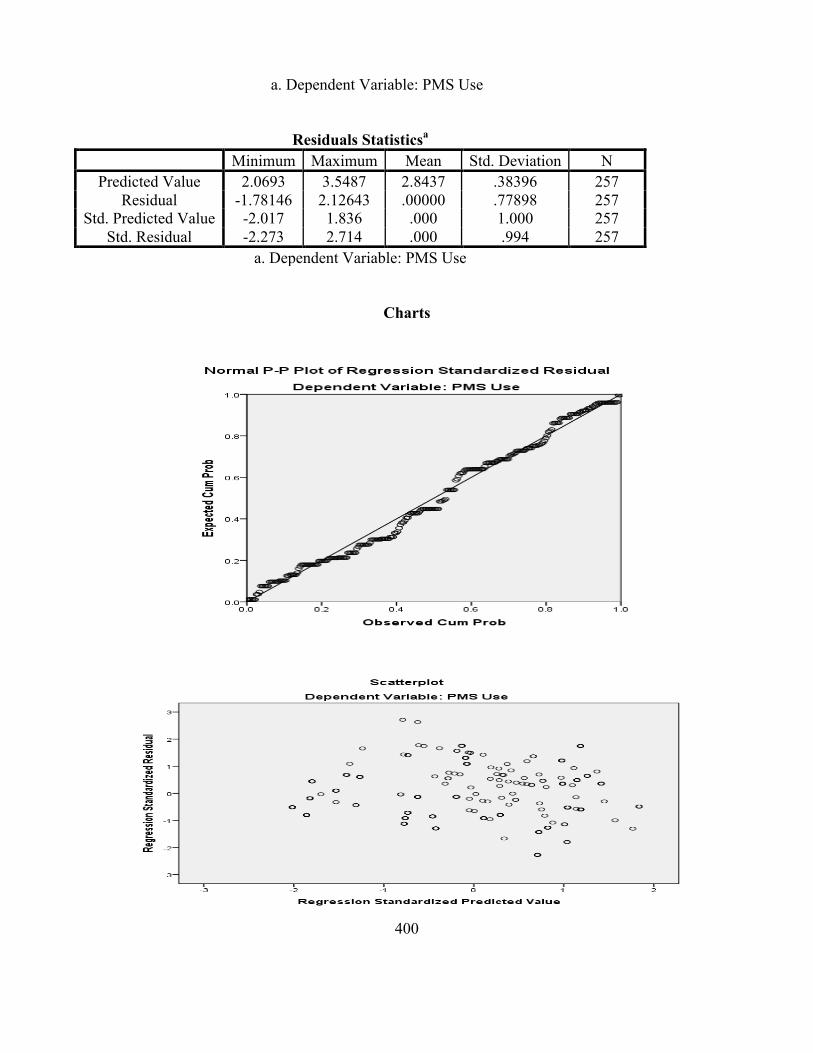
400
a. Dependent Variable: PMS Use
Residuals Statisticsa Minimum Maximum Mean Std. Deviation N
Predicted Value 2.0693 3.5487 2.8437 .38396 257 Residual -1.78146 2.12643 .00000 .77898 257
Std. Predicted Value -2.017 1.836 .000 1.000 257 Std. Residual -2.273 2.714 .000 .994 257
a. Dependent Variable: PMS Use
Charts

401
Regression
Descriptive Statistics Mean Std. Deviation N
PMS Use 2.8437 .86847 257 Adhocracy culture 21.53 5.022 257
Market culture 19.67 5.513 257 Clan culture 28.99 9.466 257
Correlations PMS Use Adhocracy
culture Market culture Clan culture
Pearson Correlation
PMS Use 1.000 .364 .262 -.282 Adhocracy
culture .364 1.000 .146 -.319
Market culture .262 .146 1.000 -.253 Clan culture -.282 -.319 -.253 1.000
Sig. (1-tailed)
PMS Use . .000 .000 .000 Adhocracy
culture .000 . .009 .000
Market culture .000 .009 . .000 Clan culture .000 .000 .000 .
N
PMS Use 257 257 257 257 Adhocracy
culture 257 257 257 257
Market culture 257 257 257 257 Clan culture 257 257 257 257
Variables Entered/Removeda Model Variables
Entered Variables Removed
Method
1
Clan culture, Market culture,
Adhocracy cultureb
. Enter
a. Dependent Variable: PMS Use b. All requested variables entered.
Model Summaryb
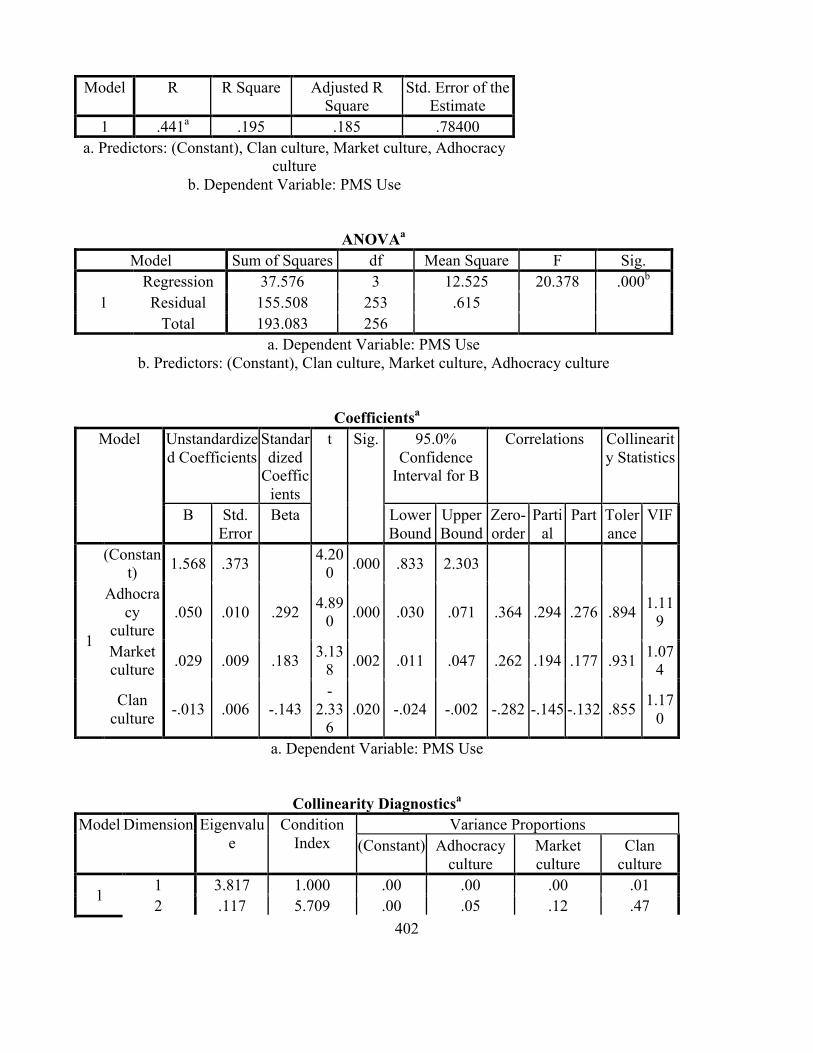
402
Model R R Square Adjusted R Square
Std. Error of the Estimate
1 .441a .195 .185 .78400 a. Predictors: (Constant), Clan culture, Market culture, Adhocracy
culture b. Dependent Variable: PMS Use
ANOVAa Model Sum of Squares df Mean Square F Sig.
1 Regression 37.576 3 12.525 20.378 .000b Residual 155.508 253 .615
Total 193.083 256 a. Dependent Variable: PMS Use
b. Predictors: (Constant), Clan culture, Market culture, Adhocracy culture
Coefficientsa Model Unstandardize
d Coefficients Standardized
Coefficients
t Sig. 95.0% Confidence
Interval for B
Correlations Collinearity Statistics
B Std. Error
Beta Lower Bound
Upper Bound
Zero-order
Partial
Part Tolerance
VIF
1
(Constant) 1.568 .373 4.20
0 .000 .833 2.303
Adhocracy
culture .050 .010 .292 4.89
0 .000 .030 .071 .364 .294 .276 .894 1.119
Market culture .029 .009 .183 3.13
8 .002 .011 .047 .262 .194 .177 .931 1.074
Clan culture -.013 .006 -.143
-2.33
6 .020 -.024 -.002 -.282 -.145 -.132 .855 1.17
0
a. Dependent Variable: PMS Use
Collinearity Diagnosticsa Model Dimension Eigenvalu
e Condition
Index Variance Proportions
(Constant) Adhocracy culture
Market culture
Clan culture
1 1 3.817 1.000 .00 .00 .00 .01 2 .117 5.709 .00 .05 .12 .47
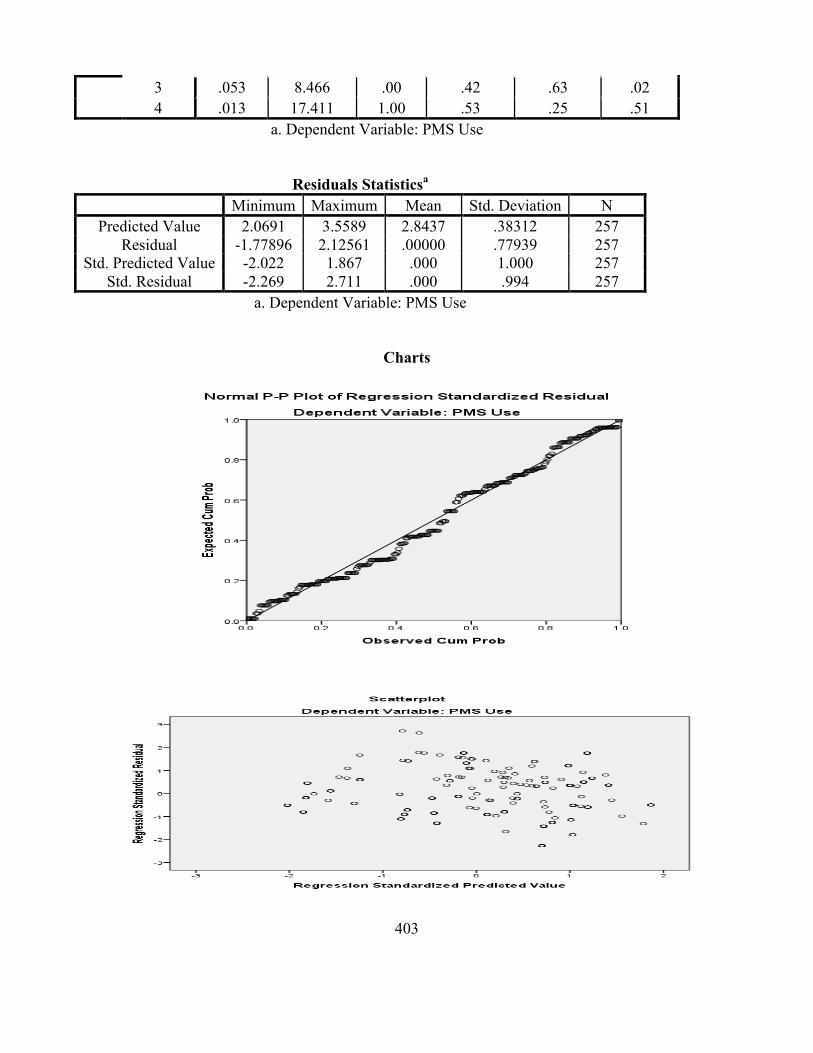
403
3 .053 8.466 .00 .42 .63 .02 4 .013 17.411 1.00 .53 .25 .51
a. Dependent Variable: PMS Use
Residuals Statisticsa Minimum Maximum Mean Std. Deviation N
Predicted Value 2.0691 3.5589 2.8437 .38312 257 Residual -1.77896 2.12561 .00000 .77939 257
Std. Predicted Value -2.022 1.867 .000 1.000 257 Std. Residual -2.269 2.711 .000 .994 257
a. Dependent Variable: PMS Use
Charts

404
Regression For Performance Measurement System Use in Libyan Public Universities
Descriptive Statistics Mean Std. Deviation N
PMS Use 3.0230 .58879 29 Adhocracy culture 22.50 5.446 29
Market culture 19.20 4.281 29 Clan culture 19.66 7.195 29
Correlations PMS Use Adhocracy
culture Market culture Clan culture
Pearson Correlation
PMS Use 1.000 .119 .057 .215 Adhocracy
culture .119 1.000 .147 .279
Market culture .057 .147 1.000 .023 Clan culture .215 .279 .023 1.000
Sig. (1-tailed)
PMS Use . .269 .385 .131 Adhocracy
culture .269 . .224 .071
Market culture .385 .224 . .453 Clan culture .131 .071 .453 .
N
PMS Use 29 29 29 29 Adhocracy
culture 29 29 29 29
Market culture 29 29 29 29 Clan culture 29 29 29 29
Variables Entered/Removeda Model Variables
Entered Variables Removed
Method
1
Clan culture, Market culture,
Adhocracy cultureb
. Enter
a. Dependent Variable: PMS Use b. All requested variables entered.

405
Model Summaryb
Model R R Square Adjusted R Square
Std. Error of the Estimate
1 .228a .052 -.062 .60673 a. Predictors: (Constant), Clan culture, Market culture, Adhocracy
culture b. Dependent Variable: PMS Use
ANOVAa Model Sum of Squares df Mean Square F Sig.
1 Regression .504 3 .168 .456 .715b Residual 9.203 25 .368
Total 9.707 28 a. Dependent Variable: PMS Use
b. Predictors: (Constant), Clan culture, Market culture, Adhocracy culture
Coefficientsa Model Unstandardize
d Coefficients Standardized
Coefficients
t Sig. 95.0% Confidence
Interval for B
Correlations Collinearity Statistics
B Std. Error
Beta Lower Bound
Upper Bound
Zero-order
Partial
Part Tolerance
VIF
1
(Constant) 2.449 .691 3.54
3 .002 1.025 3.873
Adhocracy
culture .006 .022 .057 .280 .782 -.039 .052 .119 .056 .055 .902 1.10
8
Market culture .006 .027 .044 .223 .826 -.050 .062 .057 .044 .043 .978 1.02
2 Clan
culture .016 .017 .198 .976 .338 -.018 .050 .215 .192 .190 .922 1.085
a. Dependent Variable: PMS Use
Collinearity Diagnosticsa Model Dimension Eigenvalu
e Condition
Index Variance Proportions
(Constant) Adhocracy culture
Market culture
Clan culture
1 1 3.853 1.000 .00 .00 .00 .01
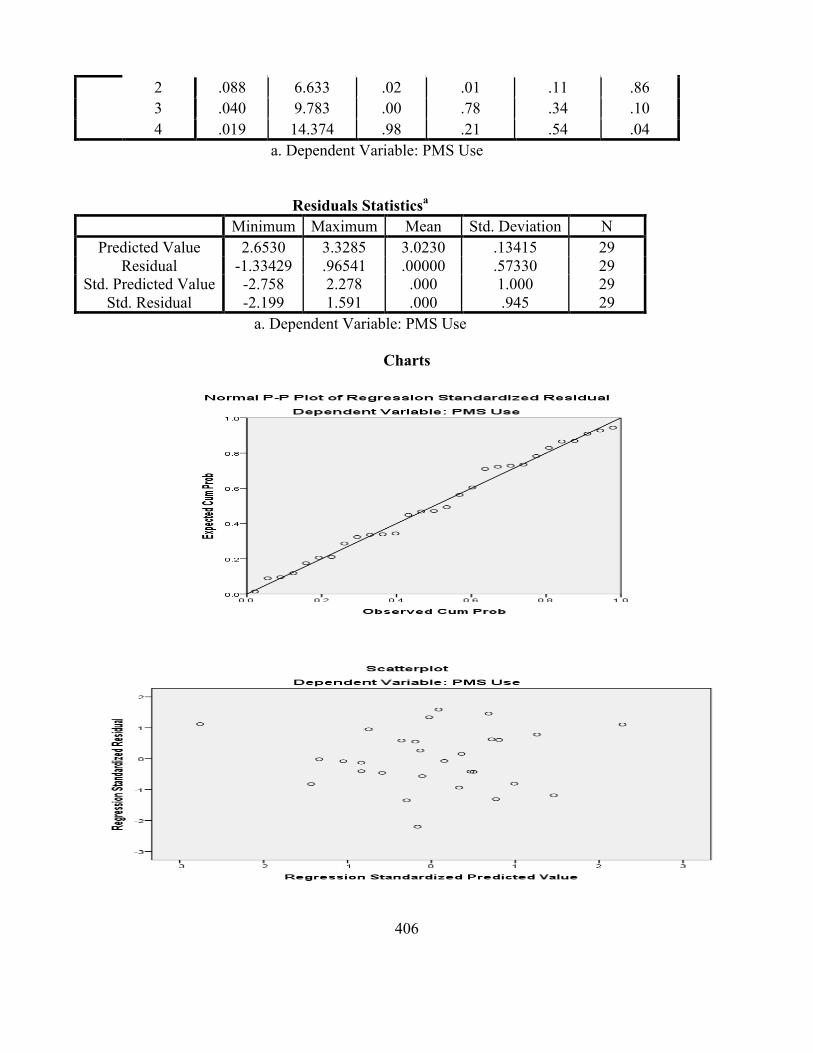
406
2 .088 6.633 .02 .01 .11 .86 3 .040 9.783 .00 .78 .34 .10 4 .019 14.374 .98 .21 .54 .04
a. Dependent Variable: PMS Use
Residuals Statisticsa Minimum Maximum Mean Std. Deviation N
Predicted Value 2.6530 3.3285 3.0230 .13415 29 Residual -1.33429 .96541 .00000 .57330 29
Std. Predicted Value -2.758 2.278 .000 1.000 29 Std. Residual -2.199 1.591 .000 .945 29
a. Dependent Variable: PMS Use
Charts

407
Regression
Descriptive Statistics
Mean Std. Deviation N PMS Use 3.0230 .58879 29
Adhocracy culture 22.50 5.446 29 Market culture 19.20 4.281 29
Hierarchy culture 38.53 11.215 29
Correlations PMS Use Adhocracy
culture Market culture
Hierarchy culture
Pearson Correlation
PMS Use 1.000 .119 .057 -.199 Adhocracy
culture .119 1.000 .147 -.707
Market culture .057 .147 1.000 -.469 Hierarchy culture -.199 -.707 -.469 1.000
Sig. (1-tailed)
PMS Use . .269 .385 .150 Adhocracy
culture .269 . .224 .000
Market culture .385 .224 . .005 Hierarchy culture .150 .000 .005 .
N
PMS Use 29 29 29 29 Adhocracy
culture 29 29 29 29
Market culture 29 29 29 29 Hierarchy culture 29 29 29 29
Variables Entered/Removeda Model Variables
Entered Variables Removed
Method
1
Hierarchy culture, Market
culture, Adhocracy
cultureb
. Enter
a. Dependent Variable: PMS Use b. All requested variables entered.

408
Model Summaryb Model R R Square Adjusted R
Square Std. Error of the
Estimate 1 .208a .043 -.071 .60947 a. Predictors: (Constant), Hierarchy culture, Market culture,
Adhocracy culture b. Dependent Variable: PMS Use
ANOVAa Model Sum of Squares df Mean Square F Sig.
1 Regression .421 3 .140 .377 .770b Residual 9.286 25 .371
Total 9.707 28 a. Dependent Variable: PMS Use
b. Predictors: (Constant), Hierarchy culture, Market culture, Adhocracy culture
Coefficientsa Model Unstandardize
d Coefficients Standardized
Coefficients
t Sig. 95.0% Confidence
Interval for B
Correlations Collinearity Statistics
B Std. Error
Beta Lower Bound
Upper Bound
Zero-order
Partial
Part Tolerance
VIF
1
(Constant) 3.905 1.631 2.39
4 .024 .546 7.265
Adhocracy
culture -.007 .031 -.066 -.229 .821 -.072 .057 .119 -.046 -.045 .457 2.19
0
Market culture -.009 .032 -.062 -.269 .790 -.074 .057 .057 -.054 -.053 .712 1.40
4 Hierarchy culture -.014 .017 -.275 -.849 .404 -.049 .021 -.199 -.167 -.166 .364 2.74
6 a. Dependent Variable: PMS Use
Collinearity Diagnosticsa Model Dimension Eigenvalu
e Condition
Index Variance Proportions
(Constant) Adhocracy culture
Market culture
Hierarchy culture
1 1 3.836 1.000 .00 .00 .00 .00 2 .120 5.660 .00 .06 .02 .15

409
3 .041 9.717 .00 .23 .49 .01 4 .004 32.911 1.00 .72 .49 .84
a. Dependent Variable: PMS Use
Residuals Statisticsa Minimum Maximum Mean Std. Deviation N
Predicted Value 2.6802 3.3107 3.0230 .12255 29 Residual -1.33184 .99933 .00000 .57590 29
Std. Predicted Value -2.797 2.348 .000 1.000 29 Std. Residual -2.185 1.640 .000 .945 29
a. Dependent Variable: PMS Use
Charts

410
Regression For Performance Measurement System Use
Descriptive Statistics Mean Std. Deviation N
PMS Use 3.5541 .50774 37 Adhocracy culture 21.37 3.978 37
Market culture 22.70 4.359 37 Hierarchy culture 21.53 5.484 37
Correlations PMS Use Adhocracy
culture Market culture
Hierarchy culture
Pearson Correlation
PMS Use 1.000 -.149 -.218 .470 Adhocracy
culture -.149 1.000 -.403 .002
Market culture -.218 -.403 1.000 -.581 Hierarchy culture .470 .002 -.581 1.000
Sig. (1-tailed)
PMS Use . .190 .098 .002 Adhocracy
culture .190 . .007 .496
Market culture .098 .007 . .000 Hierarchy culture .002 .496 .000 .
N
PMS Use 37 37 37 37 Adhocracy
culture 37 37 37 37
Market culture 37 37 37 37 Hierarchy culture 37 37 37 37
Variables Entered/Removeda Model Variables
Entered Variables Removed
Method
1
Hierarchy culture,
Adhocracy culture, Market
cultureb
. Enter
a. Dependent Variable: PMS Use b. All requested variables entered.
Model Summaryb

411
Model R R Square Adjusted R Square
Std. Error of the Estimate
1 .493a .243 .174 .46143 a. Predictors: (Constant), Hierarchy culture, Adhocracy culture,
Market culture b. Dependent Variable: PMS Use
ANOVAa Model Sum of Squares df Mean Square F Sig.
1 Regression 2.254 3 .751 3.529 .025b Residual 7.026 33 .213
Total 9.281 36 a. Dependent Variable: PMS Use
b. Predictors: (Constant), Hierarchy culture, Adhocracy culture, Market culture
Coefficientsa Model Unstandardize
d Coefficients Standardized
Coefficients
t Sig. 95.0% Confidence
Interval for B
Correlations Collinearity Statistics
B Std. Error
Beta Lower Bound
Upper Bound
Zero-order
Partial
Part Tolerance
VIF
1
(Constant) 3.074 1.168 2.63
2 .013 .698 5.450
Adhocracy
culture -.020 .022 -.153 -.881 .385 -.065 .026 -.149 -.152 -.133 .757 1.32
2
Market culture -.001 .025 -.010 -.047 .963 -.052 .050 -.218 -.008 -.007 .502 1.99
4 Hierarchy culture .043 .018 .464 2.37
0 .024 .006 .080 .470 .381 .359 .599 1.671
a. Dependent Variable: PMS Use
Collinearity Diagnosticsa Model Dimension Eigenvalu
e Condition
Index Variance Proportions
(Constant) Adhocracy culture
Market culture
Hierarchy culture
1 1 3.885 1.000 .00 .00 .00 .00

412
2 .074 7.230 .00 .00 .11 .25 3 .038 10.165 .00 .44 .07 .17 4 .003 35.423 1.00 .55 .82 .58
a. Dependent Variable: PMS Use
Residuals Statisticsa Minimum Maximum Mean Std. Deviation N
Predicted Value 3.0368 4.2139 3.5541 .25025 37 Residual -1.05236 1.14128 .00000 .44179 37
Std. Predicted Value -2.067 2.637 .000 1.000 37 Std. Residual -2.281 2.473 .000 .957 37
a. Dependent Variable: PMS Use
Charts
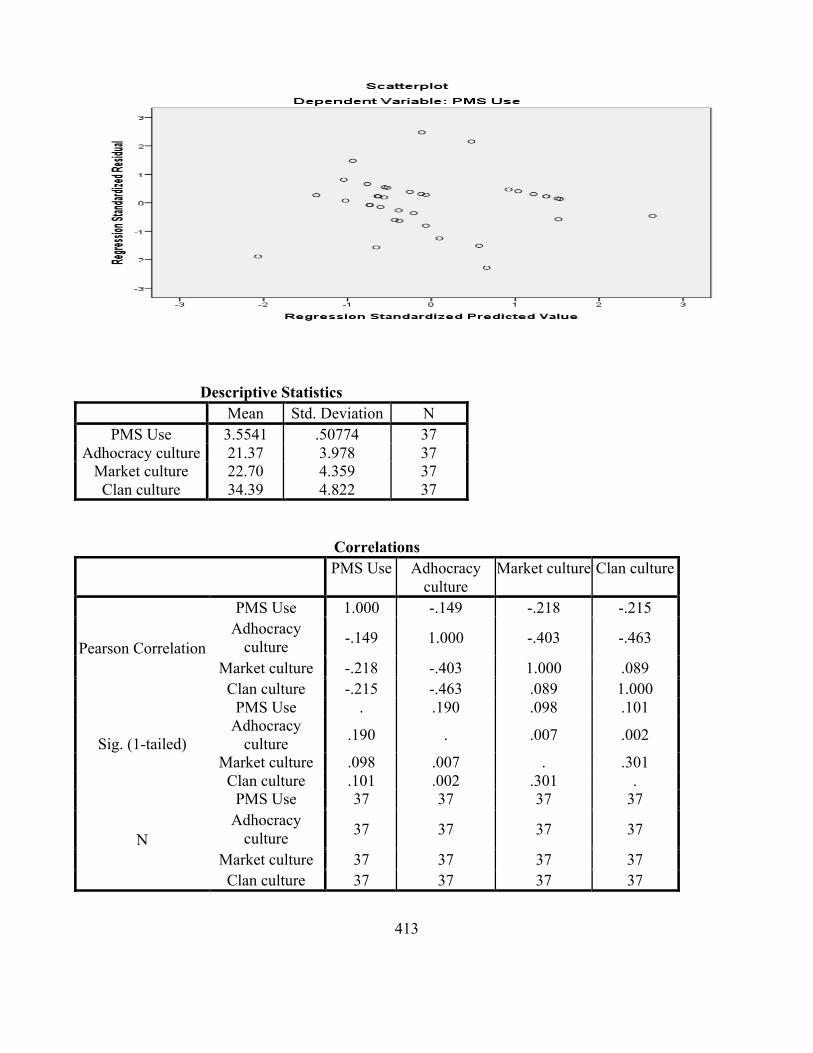
413
Descriptive Statistics Mean Std. Deviation N
PMS Use 3.5541 .50774 37 Adhocracy culture 21.37 3.978 37
Market culture 22.70 4.359 37 Clan culture 34.39 4.822 37
Correlations PMS Use Adhocracy
culture Market culture Clan culture
Pearson Correlation
PMS Use 1.000 -.149 -.218 -.215 Adhocracy
culture -.149 1.000 -.403 -.463
Market culture -.218 -.403 1.000 .089 Clan culture -.215 -.463 .089 1.000
Sig. (1-tailed)
PMS Use . .190 .098 .101 Adhocracy
culture .190 . .007 .002
Market culture .098 .007 . .301 Clan culture .101 .002 .301 .
N
PMS Use 37 37 37 37 Adhocracy
culture 37 37 37 37
Market culture 37 37 37 37 Clan culture 37 37 37 37

414
Variables Entered/Removeda
Model Variables Entered
Variables Removed
Method
1
Clan culture, Market culture,
Adhocracy cultureb
. Enter
a. Dependent Variable: PMS Use b. All requested variables entered.
Model Summaryb Model R R Square Adjusted R
Square Std. Error of the
Estimate 1 .493a .243 .174 .46143
a. Predictors: (Constant), Clan culture, Market culture, Adhocracy culture
b. Dependent Variable: PMS Use
ANOVAa Model Sum of Squares df Mean Square F Sig.
1 Regression 2.254 3 .751 3.529 .025b Residual 7.026 33 .213
Total 9.281 36 a. Dependent Variable: PMS Use
b. Predictors: (Constant), Clan culture, Market culture, Adhocracy culture
Coefficientsa Model Unstandardize
d Coefficients Standardized
Coefficients
t Sig. 95.0% Confidence
Interval for B
Correlations Collinearity Statistics
B Std. Error
Beta Lower Bound
Upper Bound
Zero-order
Partial
Part Tolerance
VIF
1
(Constant) 7.370 1.183 6.23
1 .000 4.964 9.777
Adhocracy
culture -.063 .024 -.490
-2.61
6 .013 -.111 -.014 -.149 -.414 -.396 .654 1.52
9
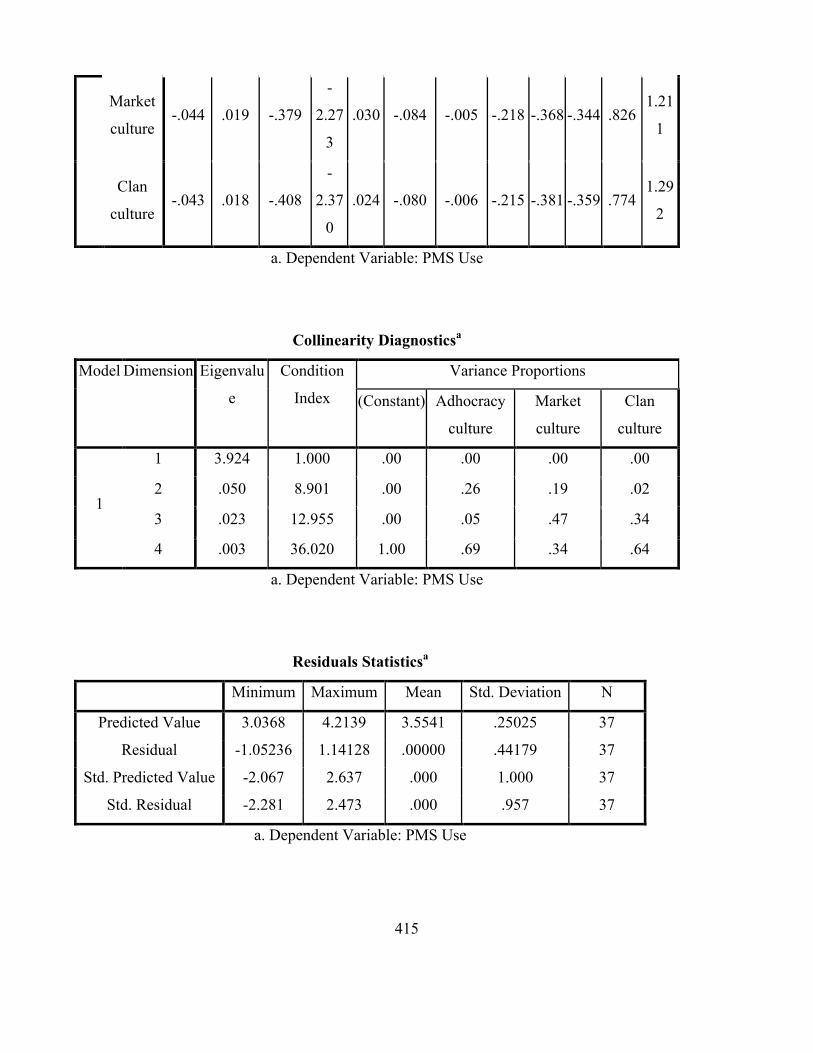
415
Market
culture -.044 .019 -.379
-
2.27
3
.030 -.084 -.005 -.218 -.368 -.344 .826 1.21
1
Clan
culture -.043 .018 -.408
-
2.37
0
.024 -.080 -.006 -.215 -.381 -.359 .774 1.29
2
a. Dependent Variable: PMS Use
Collinearity Diagnosticsa
Model Dimension Eigenvalu
e
Condition
Index
Variance Proportions
(Constant) Adhocracy
culture
Market
culture
Clan
culture
1
1 3.924 1.000 .00 .00 .00 .00
2 .050 8.901 .00 .26 .19 .02
3 .023 12.955 .00 .05 .47 .34
4 .003 36.020 1.00 .69 .34 .64
a. Dependent Variable: PMS Use
Residuals Statisticsa
Minimum Maximum Mean Std. Deviation N
Predicted Value 3.0368 4.2139 3.5541 .25025 37
Residual -1.05236 1.14128 .00000 .44179 37
Std. Predicted Value -2.067 2.637 .000 1.000 37
Std. Residual -2.281 2.473 .000 .957 37
a. Dependent Variable: PMS Use
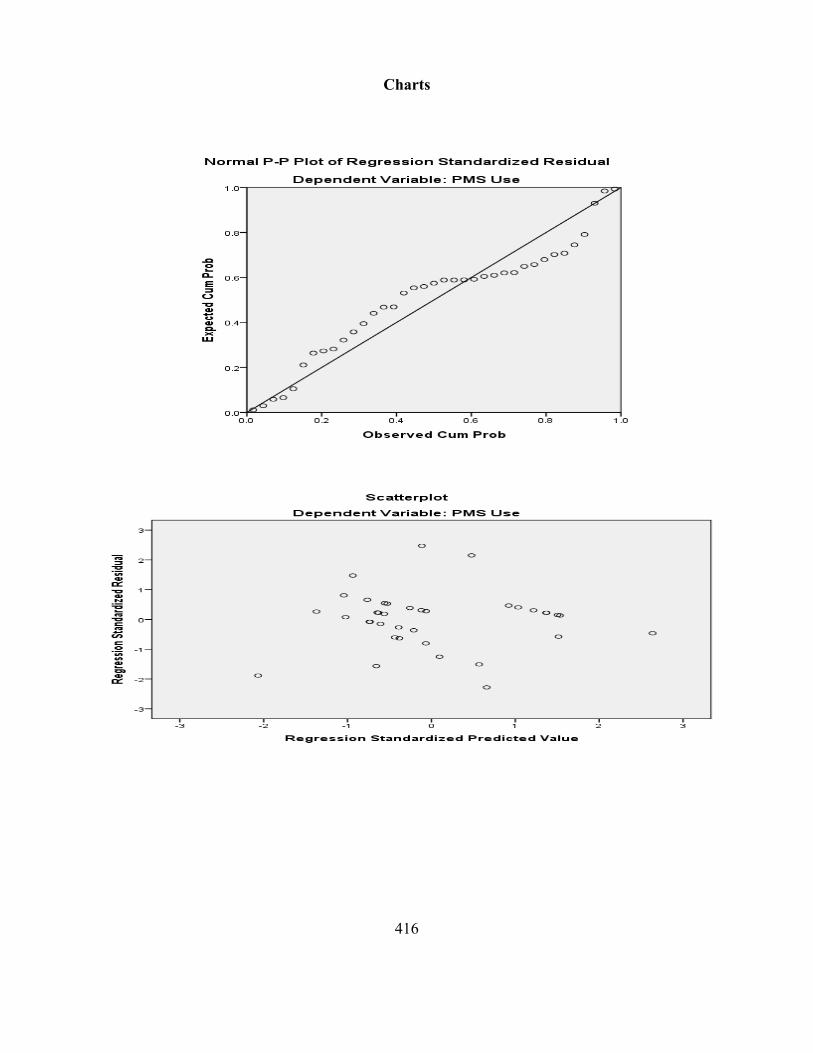
416
Charts

417
Regression For Performance Measurement System Use
Descriptive Statistics Mean Std. Deviation N
PMS Use 2.6382 .90999 164 Adhocracy culture 21.49 5.207 164
Market culture 18.80 5.526 164 Clan culture 30.26 8.886 164
Correlations PMS Use Adhocracy
culture Market culture Clan culture
Pearson Correlation
PMS Use 1.000 .524 .239 -.432 Adhocracy
culture .524 1.000 .215 -.527
Market culture .239 .215 1.000 -.367 Clan culture -.432 -.527 -.367 1.000
Sig. (1-tailed)
PMS Use . .000 .001 .000 Adhocracy
culture .000 . .003 .000
Market culture .001 .003 . .000 Clan culture .000 .000 .000 .
N
PMS Use 164 164 164 164 Adhocracy
culture 164 164 164 164
Market culture 164 164 164 164 Clan culture 164 164 164 164
Variables Entered/Removeda Model Variables
Entered Variables Removed
Method
1
Clan culture, Market culture,
Adhocracy cultureb
. Enter
a. Dependent Variable: PMS Use b. All requested variables entered.

418
Model Summaryb Model R R Square Adjusted R
Square Std. Error of the
Estimate 1 .561a .315 .302 .76034
a. Predictors: (Constant), Clan culture, Market culture, Adhocracy culture
b. Dependent Variable: PMS Use
ANOVAa Model Sum of Squares df Mean Square F Sig.
1 Regression 42.479 3 14.160 24.492 .000b Residual 92.500 160 .578
Total 134.978 163 a. Dependent Variable: PMS Use
b. Predictors: (Constant), Clan culture, Market culture, Adhocracy culture
Coefficientsa Model Unstandardize
d Coefficients Standardized
Coefficients
t Sig. 95.0% Confidence
Interval for B
Correlations Collinearity Statistics
B Std. Error
Beta Lower Bound
Upper Bound
Zero-order
Partial
Part Tolerance
VIF
1
(Constant) 1.428 .546 2.61
3 .010 .349 2.507
Adhocracy
culture .071 .013 .408 5.30
0 .000 .045 .098 .524 .386 .347 .722 1.385
Market culture .014 .012 .083 1.17
7 .241 -.009 .037 .239 .093 .077 .865 1.156
Clan culture -.019 .008 -.187
-2.31
3 .022 -.035 -.003 -.432 -.180 -.151 .655 1.52
6
a. Dependent Variable: PMS Use
Collinearity Diagnosticsa Model Dimension Eigenvalu
e Condition
Index Variance Proportions
(Constant) Adhocracy culture
Market culture
Clan culture
1 1 3.815 1.000 .00 .00 .00 .00
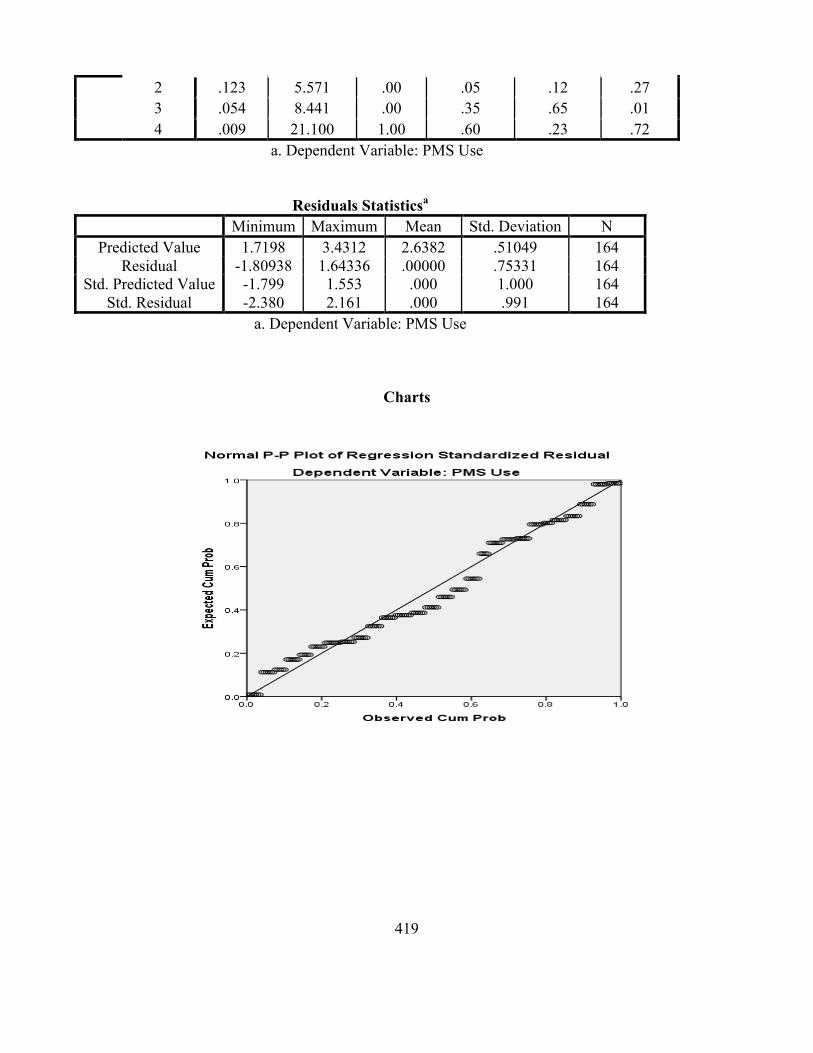
419
2 .123 5.571 .00 .05 .12 .27 3 .054 8.441 .00 .35 .65 .01 4 .009 21.100 1.00 .60 .23 .72
a. Dependent Variable: PMS Use
Residuals Statisticsa Minimum Maximum Mean Std. Deviation N
Predicted Value 1.7198 3.4312 2.6382 .51049 164 Residual -1.80938 1.64336 .00000 .75331 164
Std. Predicted Value -1.799 1.553 .000 1.000 164 Std. Residual -2.380 2.161 .000 .991 164
a. Dependent Variable: PMS Use
Charts

420
Regression For Performance Measurement System Use
Descriptive Statistics Mean Std. Deviation N
PMS Use 2.6382 .90999 164 Adhocracy culture 21.49 5.207 164
Market culture 18.80 5.526 164 Hierarchy culture 29.27 7.768 164
Correlations PMS Use Adhocracy
culture Market culture
Hierarchy culture
Pearson Correlation
PMS Use 1.000 .524 .239 -.024 Adhocracy
culture .524 1.000 .215 -.195
Market culture .239 .215 1.000 -.441 Hierarchy culture -.024 -.195 -.441 1.000
Sig. (1-tailed)
PMS Use . .000 .001 .382 Adhocracy
culture .000 . .003 .006
Market culture .001 .003 . .000 Hierarchy culture .382 .006 .000 .
N PMS Use 164 164 164 164
Adhocracy culture 164 164 164 164

421
Market culture 164 164 164 164 Hierarchy culture 164 164 164 164
Variables Entered/Removeda Model Variables
Entered Variables Removed
Method
1
Hierarchy culture,
Adhocracy culture, Market
cultureb
. Enter
a. Dependent Variable: PMS Use b. All requested variables entered.
Model Summaryb Model R R Square Adjusted R
Square Std. Error of the
Estimate 1 .560a .314 .301 .76095
a. Predictors: (Constant), Hierarchy culture, Adhocracy culture, Market culture
b. Dependent Variable: PMS Use
ANOVAa Model Sum of Squares df Mean Square F Sig.
1 Regression 42.332 3 14.111 24.369 .000b Residual 92.647 160 .579
Total 134.978 163 a. Dependent Variable: PMS Use
b. Predictors: (Constant), Hierarchy culture, Adhocracy culture, Market culture
Coefficientsa Model Unstandardize
d Coefficients Standardized
Coefficients
t Sig. 95.0% Confidence
Interval for B
Correlations Collinearity Statistics
B Std. Error
Beta Lower Bound
Upper Bound
Zero-order
Partial
Part Tolerance
VIF
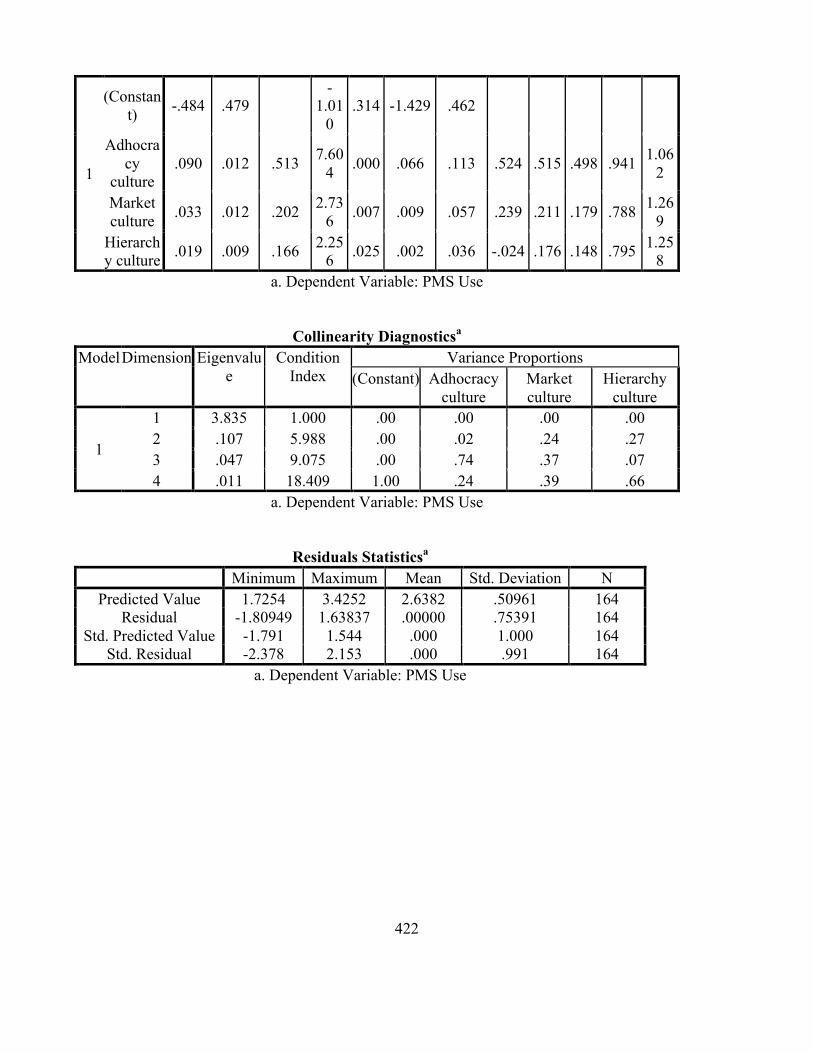
422
1
(Constant) -.484 .479
-1.01
0 .314 -1.429 .462
Adhocracy
culture .090 .012 .513 7.60
4 .000 .066 .113 .524 .515 .498 .941 1.062
Market culture .033 .012 .202 2.73
6 .007 .009 .057 .239 .211 .179 .788 1.269
Hierarchy culture .019 .009 .166 2.25
6 .025 .002 .036 -.024 .176 .148 .795 1.258
a. Dependent Variable: PMS Use
Collinearity Diagnosticsa Model Dimension Eigenvalu
e Condition
Index Variance Proportions
(Constant) Adhocracy culture
Market culture
Hierarchy culture
1
1 3.835 1.000 .00 .00 .00 .00 2 .107 5.988 .00 .02 .24 .27 3 .047 9.075 .00 .74 .37 .07 4 .011 18.409 1.00 .24 .39 .66
a. Dependent Variable: PMS Use
Residuals Statisticsa Minimum Maximum Mean Std. Deviation N
Predicted Value 1.7254 3.4252 2.6382 .50961 164 Residual -1.80949 1.63837 .00000 .75391 164
Std. Predicted Value -1.791 1.544 .000 1.000 164 Std. Residual -2.378 2.153 .000 .991 164
a. Dependent Variable: PMS Use

423
Charts
Regression For Performance Measurement System Use

424
Descriptive Statistics
Mean Std. Deviation N PMS Use 2.9259 .69080 27
Adhocracy culture 20.90 4.792 27 Market culture 21.30 6.394 27
Hierarchy culture 33.67 12.727 27
Correlations PMS Use Adhocracy
culture Market culture
Hierarchy culture
Pearson Correlation
PMS Use 1.000 .011 .246 .171 Adhocracy
culture .011 1.000 .297 -.715
Market culture .246 .297 1.000 -.227 Hierarchy culture .171 -.715 -.227 1.000
Sig. (1-tailed)
PMS Use . .478 .108 .197 Adhocracy
culture .478 . .066 .000
Market culture .108 .066 . .128 Hierarchy culture .197 .000 .128 .
N
PMS Use 27 27 27 27 Adhocracy
culture 27 27 27 27
Market culture 27 27 27 27 Hierarchy culture 27 27 27 27
Variables Entered/Removeda Model Variables
Entered Variables Removed
Method
1
Hierarchy culture, Market
culture, Adhocracy
cultureb
. Enter
a. Dependent Variable: PMS Use b. All requested variables entered.
Model Summaryb

425
Model R R Square Adjusted R Square
Std. Error of the Estimate
1 .365a .133 .020 .68372 a. Predictors: (Constant), Hierarchy culture, Market culture,
Adhocracy culture b. Dependent Variable: PMS Use
ANOVAa Model Sum of Squares df Mean Square F Sig.
1 Regression 1.655 3 .552 1.180 .339b Residual 10.752 23 .467
Total 12.407 26 a. Dependent Variable: PMS Use
b. Predictors: (Constant), Hierarchy culture, Market culture, Adhocracy culture
Coefficientsa Model Unstandardize
d Coefficients Standardized
Coefficients
t Sig. 95.0% Confidence
Interval for B
Correlations Collinearity Statistics
B Std. Error
Beta Lower Bound
Upper Bound
Zero-order
Partial
Part Tolerance
VIF
1
(Constant) 1.018 1.295 .787 .440 -1.660 3.697
Adhocracy
culture .029 .041 .198 .699 .492 -.056 .113 .011 .144 .136 .469 2.13
0
Market culture .029 .022 .272 1.33
9 .194 -.016 .075 .246 .269 .260 .911 1.097
Hierarchy culture .020 .015 .375 1.34
9 .191 -.011 .052 .171 .271 .262 .489 2.047
a. Dependent Variable: PMS Use
Collinearity Diagnosticsa Model Dimension Eigenvalu
e Condition
Index Variance Proportions
(Constant) Adhocracy culture
Market culture
Hierarchy culture
1 1 3.783 1.000 .00 .00 .00 .00 2 .160 4.860 .00 .03 .05 .25

426
3 .050 8.731 .02 .13 .93 .00 4 .007 23.425 .98 .84 .01 .75
a. Dependent Variable: PMS Use
Residuals Statisticsa Minimum Maximum Mean Std. Deviation N
Predicted Value 2.2678 3.2526 2.9259 .25233 27 Residual -1.19429 .98189 .00000 .64307 27
Std. Predicted Value -2.608 1.294 .000 1.000 27 Std. Residual -1.747 1.436 .000 .941 27
a. Dependent Variable: PMS Use Charts
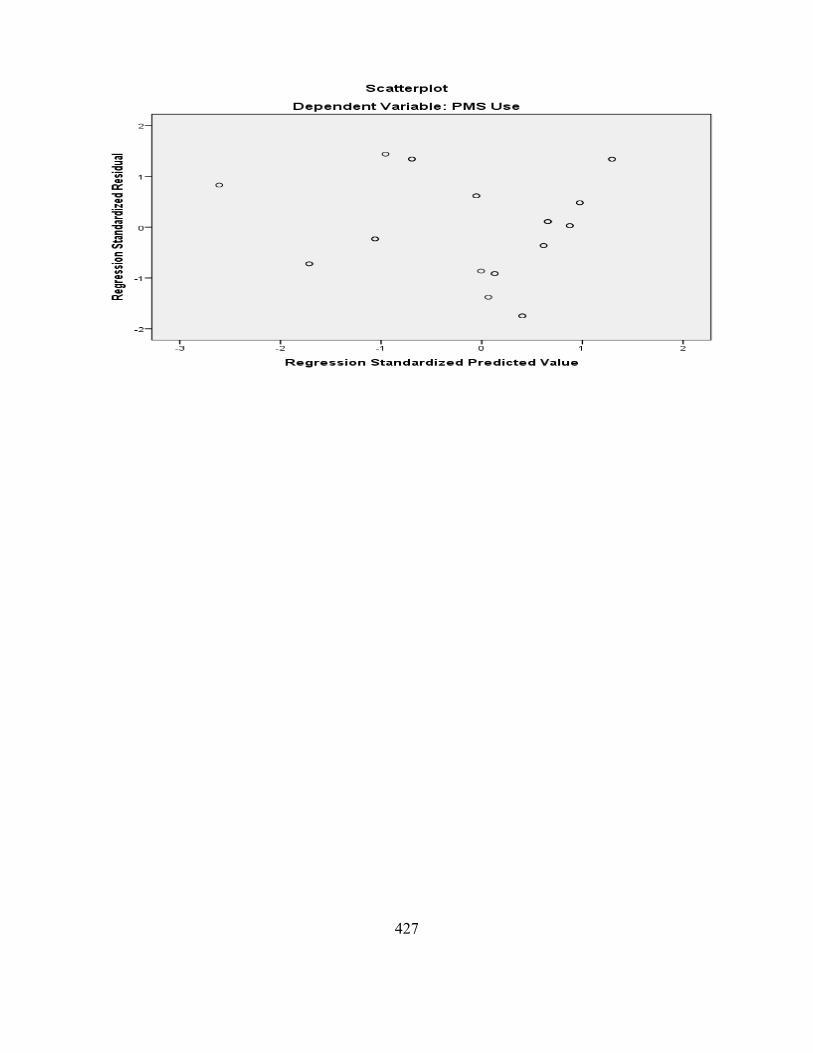
427

428
Appendix H
Correlations Clan
culture Adhocra
cy culture
Market culture
Hierarchy culture
PMS acceptanc
e
PMS Importan
ce
PMS Use
Clan culture
Pearson Correlation 1 -.319** -.253** -.654** -.214** -.035 -
.282** Sig. (2-tailed)
.000 .000 .000 .001 .579 .000
N 257 257 257 257 257 257 257
Adhocracy culture
Pearson Correlation -.319** 1 .146* -.274** .222** .086 .364**
Sig. (2-tailed) .000 .019 .000 .000 .169 .000
N 257 257 257 257 257 257 257
Market culture
Pearson Correlation -.253** .146* 1 -.404** -.041 .012 .262**
Sig. (2-tailed) .000 .019 .000 .517 .851 .000
N 257 257 257 257 257 257 257
Hierarchy culture
Pearson Correlation -.654** -.274** -.404** 1 .115 -.036 -.057
Sig. (2-tailed) .000 .000 .000 .065 .566 .360
N 257 257 257 257 257 257 257
PMS acceptance
Pearson Correlation -.214** .222** -.041 .115 1 .515** .529**
Sig. (2-tailed) .001 .000 .517 .065 .000 .000
N 257 257 257 257 257 257 257
PMS Importance
Pearson Correlation -.035 .086 .012 -.036 .515** 1 .307**
Sig. (2-tailed) .579 .169 .851 .566 .000 .000
N 257 257 257 257 257 257 257
PMS Use
Pearson Correlation -.282** .364** .262** -.057 .529** .307** 1
Sig. (2-tailed) .000 .000 .000 .360 .000 .000
N 257 257 257 257 257 257 257 **. Correlation is significant at the 0.01 level (2-tailed). *. Correlation is significant at the 0.05 level (2-tailed).
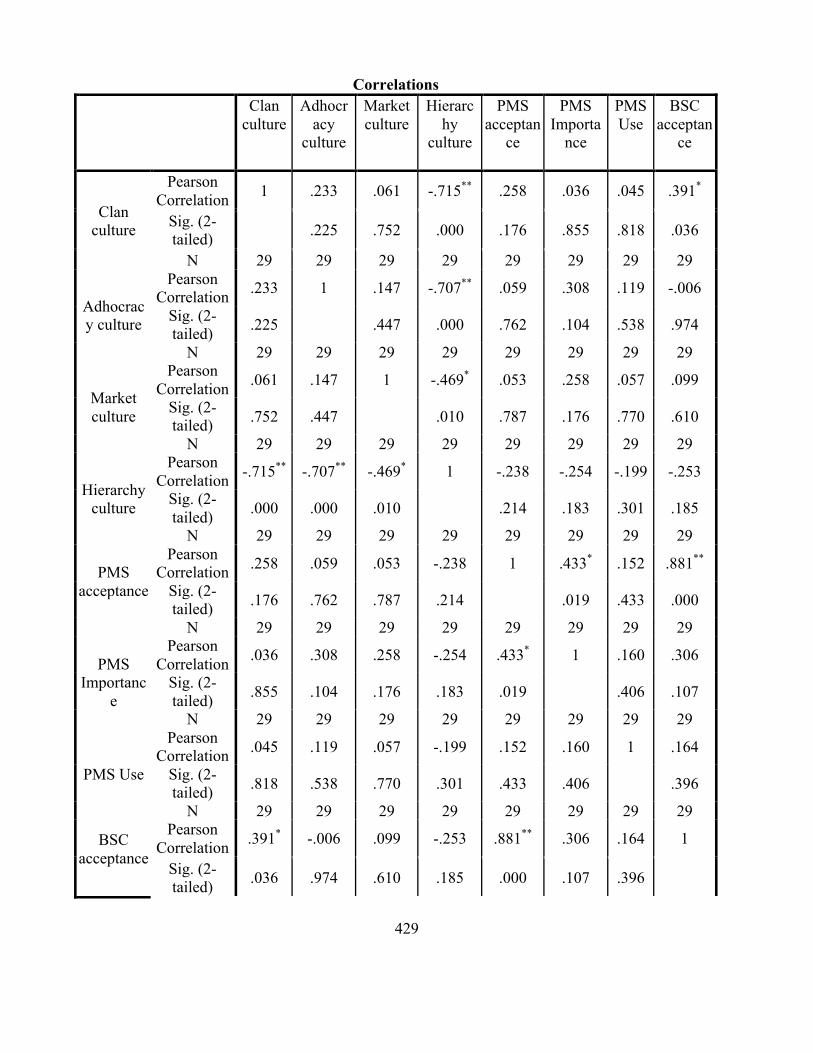
429
Correlations Clan
culture Adhocr
acy culture
Market culture
Hierarchy
culture
PMS acceptan
ce
PMS Importa
nce
PMS Use
BSC acceptan
ce
Clan culture
Pearson Correlation 1 .233 .061 -.715** .258 .036 .045 .391*
Sig. (2-tailed)
.225 .752 .000 .176 .855 .818 .036
N 29 29 29 29 29 29 29 29
Adhocracy culture
Pearson Correlation .233 1 .147 -.707** .059 .308 .119 -.006
Sig. (2-tailed) .225 .447 .000 .762 .104 .538 .974
N 29 29 29 29 29 29 29 29
Market culture
Pearson Correlation .061 .147 1 -.469* .053 .258 .057 .099
Sig. (2-tailed) .752 .447 .010 .787 .176 .770 .610
N 29 29 29 29 29 29 29 29
Hierarchy culture
Pearson Correlation -.715** -.707** -.469* 1 -.238 -.254 -.199 -.253
Sig. (2-tailed) .000 .000 .010 .214 .183 .301 .185
N 29 29 29 29 29 29 29 29
PMS acceptance
Pearson Correlation .258 .059 .053 -.238 1 .433* .152 .881**
Sig. (2-tailed) .176 .762 .787 .214 .019 .433 .000
N 29 29 29 29 29 29 29 29
PMS Importanc
e
Pearson Correlation .036 .308 .258 -.254 .433* 1 .160 .306
Sig. (2-tailed) .855 .104 .176 .183 .019 .406 .107
N 29 29 29 29 29 29 29 29
PMS Use
Pearson Correlation .045 .119 .057 -.199 .152 .160 1 .164
Sig. (2-tailed) .818 .538 .770 .301 .433 .406 .396
N 29 29 29 29 29 29 29 29
BSC acceptance
Pearson Correlation .391* -.006 .099 -.253 .881** .306 .164 1
Sig. (2-tailed) .036 .974 .610 .185 .000 .107 .396

430
N 29 29 29 29 29 29 29 29 **. Correlation is significant at the 0.01 level (2-tailed). *. Correlation is significant at the 0.05 level (2-tailed).
Correlations
Clan culture
Adhocracy
culture
Market culture
Hierarchy culture
PMS acceptanc
e
PMS Importan
ce
PMS Use
Clan culture
Pearson Correlation 1 -.463** .089 -.614** .129 -.254 -.215
Sig. (2-tailed)
.004 .602 .000 .448 .129 .202
N 37 37 37 37 37 37 37
Adhocracy culture
Pearson Correlation -.463** 1 -.403* .002 -.112 -.152 -.149
Sig. (2-tailed) .004 .014 .992 .508 .368 .380
N 37 37 37 37 37 37 37
Market culture
Pearson Correlation .089 -.403* 1 -.581** -.056 .318 -.218
Sig. (2-tailed) .602 .014 .000 .742 .055 .195
N 37 37 37 37 37 37 37
Hierarchy culture
Pearson Correlation -.614** .002 -.581** 1 .013 .081 .470**
Sig. (2-tailed) .000 .992 .000 .940 .632 .003
N 37 37 37 37 37 37 37
PMS acceptance
Pearson Correlation .129 -.112 -.056 .013 1 .108 -.012
Sig. (2-tailed) .448 .508 .742 .940 .523 .945
N 37 37 37 37 37 37 37
PMS Importance
Pearson Correlation -.254 -.152 .318 .081 .108 1 .462**
Sig. (2-tailed) .129 .368 .055 .632 .523 .004
N 37 37 37 37 37 37 37
PMS Use
Pearson Correlation -.215 -.149 -.218 .470** -.012 .462** 1
Sig. (2-tailed) .202 .380 .195 .003 .945 .004
N 37 37 37 37 37 37 37

431
**. Correlation is significant at the 0.01 level (2-tailed). *. Correlation is significant at the 0.05 level (2-tailed).
Correlations Clan
culture Adhocra
cy culture
Market culture
Hierarchy culture
PMS acceptanc
e
PMS Importan
ce
PMS Use
Clan culture
Pearson Correlation 1 -.527** -.367** -.507** -.347** -.095 -
.432** Sig. (2-tailed)
.000 .000 .000 .000 .228 .000
N 164 164 164 164 164 164 164
Adhocracy culture
Pearson Correlation -.527** 1 .215** -.195* .328** .085 .524**
Sig. (2-tailed) .000 .006 .012 .000 .281 .000
N 164 164 164 164 164 164 164
Market culture
Pearson Correlation -.367** .215** 1 -.441** -.229** -.097 .239**
Sig. (2-tailed) .000 .006 .000 .003 .216 .002
N 164 164 164 164 164 164 164
Hierarchy culture
Pearson Correlation -.507** -.195* -.441** 1 .332** .085 -.024
Sig. (2-tailed) .000 .012 .000 .000 .279 .764
N 164 164 164 164 164 164 164
PMS acceptance
Pearson Correlation -.347** .328** -.229** .332** 1 .509** .496**
Sig. (2-tailed) .000 .000 .003 .000 .000 .000
N 164 164 164 164 164 164 164
PMS Importance
Pearson Correlation -.095 .085 -.097 .085 .509** 1 .258**
Sig. (2-tailed) .228 .281 .216 .279 .000 .001
N 164 164 164 164 164 164 164
PMS Use
Pearson Correlation -.432** .524** .239** -.024 .496** .258** 1
Sig. (2-tailed) .000 .000 .002 .764 .000 .001
N 164 164 164 164 164 164 164

432
**. Correlation is significant at the 0.01 level (2-tailed). *. Correlation is significant at the 0.05 level (2-tailed).
Correlations Clan
culture Adhocra
cy culture
Market culture
Hierarchy culture
PMS acceptanc
e
PMS Importan
ce
PMS Use
Clan culture
Pearson Correlation 1 .228 -.464* -.713** -.171 .274 -.349
Sig. (2-tailed)
.252 .015 .000 .395 .166 .074
N 27 27 27 27 27 27 27
Adhocracy culture
Pearson Correlation .228 1 .297 -.715** .072 .054 .011
Sig. (2-tailed) .252 .132 .000 .722 .788 .956
N 27 27 27 27 27 27 27
Market culture
Pearson Correlation -.464* .297 1 -.227 .024 -.168 .246
Sig. (2-tailed) .015 .132 .256 .905 .402 .216
N 27 27 27 27 27 27 27
Hierarchy culture
Pearson Correlation -.713** -.715** -.227 1 .110 -.178 .171
Sig. (2-tailed) .000 .000 .256 .583 .375 .393
N 27 27 27 27 27 27 27
PMS acceptance
Pearson Correlation -.171 .072 .024 .110 1 .451* .463*
Sig. (2-tailed) .395 .722 .905 .583 .018 .015
N 27 27 27 27 27 27 27
PMS Importance
Pearson Correlation .274 .054 -.168 -.178 .451* 1 .033
Sig. (2-tailed) .166 .788 .402 .375 .018 .868
N 27 27 27 27 27 27 27
PMS Use
Pearson Correlation -.349 .011 .246 .171 .463* .033 1
Sig. (2-tailed) .074 .956 .216 .393 .015 .868
N 27 27 27 27 27 27 27 *. Correlation is significant at the 0.05 level (2-tailed). **. Correlation is significant at the 0.01 level (2-tailed).

433