university of groningen the adaptive value of migrations
TRANSCRIPT
University of Groningen
The adaptive value of migrations for the bivalve Macoma balthicaHiddink, Johan Gerrit
IMPORTANT NOTE: You are advised to consult the publisher's version (publisher's PDF) if you wish to cite fromit. Please check the document version below.
Document VersionPublisher's PDF, also known as Version of record
Publication date:2002
Link to publication in University of Groningen/UMCG research database
Citation for published version (APA):Hiddink, J. G. (2002). The adaptive value of migrations for the bivalve Macoma balthica. s.n.
CopyrightOther than for strictly personal use, it is not permitted to download or to forward/distribute the text or part of it without the consent of theauthor(s) and/or copyright holder(s), unless the work is under an open content license (like Creative Commons).
The publication may also be distributed here under the terms of Article 25fa of the Dutch Copyright Act, indicated by the “Taverne” license.More information can be found on the University of Groningen website: https://www.rug.nl/library/open-access/self-archiving-pure/taverne-amendment.
Take-down policyIf you believe that this document breaches copyright please contact us providing details, and we will remove access to the work immediatelyand investigate your claim.
Downloaded from the University of Groningen/UMCG research database (Pure): http://www.rug.nl/research/portal. For technical reasons thenumber of authors shown on this cover page is limited to 10 maximum.
Download date: 05-10-2021

Marine Ecology Progress Series 233:117-130
Changes in distribution and decrease in numbers during
migration of the bivalve Macoma balthica
J. G. HIDDINK & W.J.WOLFF
ABSTRACT
The population development of the 1998 year-class of the bivalve Macoma balthica wasstudied by repeated sampling of a tidal flat area in the eastern Dutch Wadden Sea from May1998 to August 2000. The juveniles migrated twice, once in mid-1998 from their primarysettlement locations in the low sandy intertidal to the nursery in the high intertidal (springmigration, 25 % of all juvenile M. balthica relocated from low to high intertidal) and once in late1998/early 1999 from the nursery to the low intertidal and the subtidal (winter migration,between 8 and 15% of all 0-group M. balthica relocated from high to low intertidal). Duringwinter, M. balthica migration was most intensive at the lowest temperatures. Relative to theabundance on the tidal flats, 1+ group M. balthica was rare in the tidal channels of the WaddenSea and was only slightly more common in the North Sea adjacent to the tidal inlet.During both the spring and winter migration, many bivalves disappeared from the tidal flatpopulation. This could partly be explained by normal mortality and by emigration to the subtidalchannels and the North Sea. The remaining mortality was probably due to the risks inherent inmigration; predation during pelagic floating or not reaching the right locations. The number ofbivalves that disappeared was very high. In spring, slightly more disappeared than relocated.In winter, more than four times more bivalves disappeared than relocated. Migration isobviously a very dangerous activity, therefore great advantages must be associated with thenursery use that makes such migrations necessary. An analysis of literature data on thedensity of M. balthica shows that in the eastern Dutch Wadden Sea, 90% of the populationlives in the intertidal, about 10% in the adjacent North Sea, and a negligible fraction in thesubtidal channels of the Wadden Sea.
CHAPTER 2

Chapter 2
32INTRODUCTION
Many intertidal benthic species in the Wadden Sea, a shallow coastal sea in TheNetherlands, Germany and Denmark, use nurseries in the high intertidal (Beukema1993a; Flach & Beukema 1994). A nursery is an area inhabited by many juveniles butfew adults of a species. This is typical, for example, for the lugworm Arenicola marina(Farke et al. 1979), the shore crab Carcinus maenas (Klein Breteler 1976; Beukema1991), the shrimp Crangon crangon (Kuipers & Dapper 1984) and the bivalve Macomabalthica (Beukema 1993a).It is assumed that these nurseries provide juveniles of these benthic species withprotection against predation by marine organisms such as shrimps, crabs and smallfish (Beukema 1993a), that physical disturbance is less (Flach 1992b) and that perhapsfeeding conditions are better (Armonies & Hellwig-Armonies 1992). However, whennurseries are spatially separated from the locations inhabited by adults, juveniles mustmigrate to and from the nurseries. Many marine benthic animals (including M. balthica)migrate by drifting on the current while suspended in the water column (Sigurdsson etal. 1976; Forward & Tankersley 2001). This migration to and from the nursery is aphase with potentially very large risks: the animals are easy victims for pelagic andepibenthic predators such as fishes and risk ending up in the wrong locations.
For benthic animals, the risks of migration have not been studied, but there are someindications that they do have costs. Migrating lugworms, Arenicola marina, are eaten bythe pelagic fish Osmerus eperlanus, which is unable to dig out deep-living polychaetes(Kühl 1970). The tube-dwelling amphipod Corophium volutator suffers enhancedmortality from predation by shrimps when disturbance by A. marina and Cerastodermaedule causes it to leave the sediment (Flach & De Bruin 1994). In M. balthica in theBaltic Sea, physical disturbance increased mortality due to predation by the isopodSaduria entomon, while physical disturbance alone did not have any influence onmortality (Bonsdorff et al. 1995). Thus, leaving their burrow in the presence ofpredators may be dangerous for bivalves, polychaetes and crustaceans.There are no studies on the fate of benthic animals that migrate from a suitable habitat.The fact that there is a large variation in growth and mortality rates between locationsfor many benthic species may be an indication that many individuals fail to migrate tothe optimal location (Beukema 1993a).
M. balthica is one of the most common and widespread bivalves in the Wadden Sea.Its early life history includes 2 migrations. M. balthica spawns in late March and April(Honkoop & Van der Meer 1997). The eggs and larvae are pelagic for a short period; inthe Wadden Sea larvae settle mainly on the low tidal flats at a length of 190 to 300 µm(Günther 1991; Armonies & Hellwig-Armonies 1992). This settlement on low tidal flatsis probably dictated by hydrography (Armonies & Hellwig-Armonies 1992). In May thepostlarvae (300 µm) migrate to the nurseries (spring migration) on high, silty tidal flats(Armonies & Hellwig-Armonies 1992). After the first growth season, the juvenile M.balthica undertake a winter migration between December and March, from the

Distribution changes during Macoma migrations33
nurseries to the low intertidal flats and the subtidal of the Wadden Sea and North Sea(Beukema & De Vlas 1989). However, migration patterns in the Westerschelde estuary(outside the Wadden Sea) showed different migration patterns, with primary settlementon the high-tidal flats and migration to low-tidal flats during the summer (Bouma et al.2001).
M. balthica migrates by byssus drifting. Byssus drifting has been described for mostcommon bivalves of the Wadden Sea, such as the blue mussel Mytilus edulis (De Blok& Tan-Maas 1977; Lane et al. 1982; Lane et al. 1985; Caceres Martinez et al. 1994)and the cockle Cerastoderma edule (De Montaudouin 1997). The byssus drifting of M.balthica has been described by Sörlin (1988) and Beukema and De Vlas (1989). Due toan increase in drag force by a byssus thread, the sinking rate of juvenile molluscsdecreases greatly. Sinking rates for small bivalves with a byssus thread can be up to 5times slower than of those without, and are dependent on shell size and thread length(Sörlin 1988; Beukema & De Vlas 1989; Beaumont & Barnes 1992; De Montaudouin1997). Current velocities of 0.1 cm s-1 are sufficient to enable ascent from the sedimentsurface (Lane et al. 1985).
For M. balthica, some of the factors that may promote nursery use have beenidentified. Beukema (1993a) concluded that juvenile M. balthica avoid the low intertidalbecause of the high abundance of epibenthic predators such as shrimp and crabs,which select for small shellfish (Reise 1978; Kaiser et al. 1990). Adult M. balthica arepredominantly eaten by birds, which can forage for longer daily periods in the high thanin the low intertidal (Hulscher 1982). Growth rates have been studied at manylocations, but no distinction between 0-group and older animals was made in moststudies (Wanink & Zwarts 1993; Harvey et al. 1993; Beukema 1993a). Further,maximum growth rates were found in the high intertidal in some studies, while in otherstudies the highest growth rates were found in the low intertidal. However, whether themigration to and from the nursery itself has any negative fitness consequences hasnever been investigated. Therefore, the total costs and benefits of nursery use for theM. balthica population cannot be evaluated.
Metapopulation ecology stresses the importance of migrations between populations forthe survival of the metapopulation (Hanski 1999). The theory stresses the importanceof estimating the costs of migrations, as the cost of migration is equivalent to the costof living in a metapopulation. Further, it leads to some interesting questions, such aswhether subtidal M. balthica represent a population, because it is not clear if thespecies can survive without intertidal nurseries. On the other hand, the subtidalpopulation may be important for the survival of the intertidal population in the case ofextreme physical harshness, such as extremely cold winters. Metapopulation theorywas largely developed in terrestrial habitats and still has to demonstrate its validity inthe marine environment. This paper contributes to the latter aim, by describing amigration pattern not encountered on land.

Chapter 2
34The present paper presents the costs and benefits of nursery use by a M. balthicapopulation in the Groninger Wad, eastern Dutch Wadden Sea, focussing on thepopulation consequences of migration. We describe the migration from the lowintertidal to the nursery in spring and from the nursery to the low intertidal and subtidalin the next winter for 1 year-class of M. balthica. We try to quantify the migration flowsof M. balthica as it migrates to and from the nursery. Further, we attempt to estimatethe additional mortality caused by these migrations.
METHODS
Study area
Our study was carried out at the Groninger Wad, which is part of the Lauwers basin, inthe eastern Dutch Wadden Sea (6° 31’ E, 53° 27’ N) (see Figure 1). The average tidalrange is 2.4 m. The tidal flat area ranges from –1.4 to +1.0 m NAP (Dutch Ordnancelevel, which is close to mean tidal level); saltmarshes occur at the higher levels. Meanhigh water (MHW) is at +1.0 m, mean low water (MLW) at –1.4 m NAP. At the saltmarsh side, brushwood groynes of former land reclamation works enclose the tidal flatarea above +0.3 m NAP. Sediments range from fine sand to fine silt. The study area(7.9 km2) is enclosed by salt marsh on the south side, the shallow shipping gully toNoordpolderzijl on the eastern side, the deep (10 m) tidal channel Zuidoost-Lauwers onthe northern side and partly by another shallow tidal channel on the western side.Additional density data were collected in the tidal channels of the Lauwers basin andadjacent North Sea. The mouths of the main tidal channels Lauwers and Eilanderbalgare close to each other. It is impossible to deduce the origin of M. balthica (Zuidoost-Lauwers or Eilanderbalg) in the North Sea from their geographical position in the area.Therefore, Wadden Sea data for these areas were also combined. Figure 5 gives theboundaries of these tidal basins based on De Boer (1978), Ridderinkhof et al. (1990)and Louters and Gerritsen (1994). The North Sea area considered is defined by thearea enclosed by lines heading straight north-west of the centres of the barrier islandsof Schiermonnikoog and Rottumerplaat to 14 km offshore. The area extends more tothe west than to the east because ebb currents from the Wadden Sea are directedwestwards in this area (De Boer 1978). Residual currents are directed eastwards in thesouthern North Sea, but are of little importance to migrating M. balthica as thesebivalves are probably mainly present in the water column during ebb tides. The tidalbasin consists of 139 km2 of tidal flats and 48 km2 of tidal channels. Tidal channelsreach a maximum depth of 18 m below NAP. The studied part of the North Sea has anarea of 265 km2 and a maximum depth of 20 m.
Our study required that there was no net migration to or from other tidal flat areas thatwere not sampled, because this could lead to either an over- or an underestimate ofmortality. We assumed that the net displacement of M. balthica across the western andeastern boundaries of this area was negligible since the currents over the tidal flats are
Distribution changes during Macoma migrations35
mainly directed north-south and vice versa (Essink 1978) and because this assumptionwas a prerequisite for making estimates at all. We also assumed that net exchangeacross the major tidal channel, Zuidoost-Lauwers, was negligible since this channelhas strong tidal currents running west-east and vice versa.
Set-up
The density of Macoma balthica of the 1998 year-class was monitored at the tidal flatarea studied from May 1998 to August 2000. During this period, the density of M.balthica was estimated 21 times at 57 intertidal stations. Mortality was estimated fromthe rate of decrease in population size. By comparing mortality, or ratherdisappearance, before, during and after the migration, the amount of additional‘mortality’ caused by the migration can be estimated. Subtidal densities of 1998 and1999 year-class M. balthica were examined in October 1999.
Intertidal benthic sampling
The size of the M. balthica-spat population on the tidal flat was estimated from 7 May1998 to 16 August 2000 by repeated sampling of 57 stations (Figure 1). Of these 57stations, 25 were located in the high intertidal (between 0.3 and 1.2 m above NAP) and32 were located in the low intertidal (between 0.5 m below and 0.2 m above NAP). Theheight levels of stations and all areas were obtained from Rijkswaterstaat depth chartsof the Wadden Sea surveyed in 1994. Although MLW was 1.4 m below NAP and somestations were horizontally close to MLW, the height of the lowest stations was 0.5 mbelow NAP. This is because the transition of the Zuidoost-Lauwers tidal channel to theadjacent tidal flats has a relatively steep slope (1:20).Table 1 gives the dates on which the stations were sampled. Sampling started in earlyMay, because at this time, further settlement of postlarvae was assumed to be rare andtherefore the population had become ‘closed’, a prerequisite for our calculations. Withdecreasing densities and increasing size of M. balthica, the sample size and sievemesh size were increased from 13 cm2 and 125 µm on 7 May 1998 to 415 cm2 and1000 µm at the end of the study (Table 1). On some of the sampling dates, 1 or 2 ofthe lowest stations could not be sampled due to high water levels at low tide. We didnot correct for these missing values.The samples were stored at -25°C until sorting. Samples were sieved through 1000,500, 300 and 125 µm mesh (only those mesh sizes equal or larger than the mesh sizeused in the field on a date were used). The fractions were sorted at 6 to 25 xmagnification under a binocular dissecting microscope. The shellfish were classified inyear-classes by counting year-rings on the shells and the number of M. balthica in the1998 year-class per sample was counted.

Chapter 2
36
Subtidal benthic sampling
Since M. balthica can also migrate to and from the subtidal, subtidal densities of M.balthica spat and newly migrated adults were examined. On 5 October 1999, M.balthica were sampled in the subtidal tidal channels, just north of the study area (Figure1). At 17 stations, 3 or 4 0.2 m2 Van Veen-grabs per station were taken, sieved over 2mm, and pooled per station. Samples were sorted in the laboratory. The depths ofthese stations range from 1.5 to 10 m below NAP (= 0.1 to 8.6 m below MLW).Samples were stored at –20°C until sorting. For each pooled sample, the numbers of1998 and 1999 year-class M. balthica were counted. In the same week, densities of the1998 and 1999 year-classes in the intertidal were estimated as described in thepreceding subsection (6 October 1999: see Table 1).
Figure 1. Sampling stations at the Groninger Wad, eastern Dutch Wadden Sea. The locationsof plankton nets (200 µm, a single net per location) in spring and summer 1998 are indicatedwith a dotted circle. The locations of the coarse plankton nets (2000 µm, two nets per location)in winter and spring (1998-1999) are indicated with a square. MLW = Mean low water level.

Distribution changes during Macoma migrations37
Pelagic sampling
The timing of migration by M. balthica-spat was estimated from samples obtained withplankton nets in the intertidal during high tide. The net opening had a diameter of 19cm and the net could rotate freely on a pole (see figure 1E in Armonies 1994a). Thebottom side of the opening of the net was placed 5 cm above the sediment surface. Onevery sampling date, the plankton nets were placed on the tidal flats for 24 h, startingat low water. Nets fished passively on the current during the immersion periods(approximately 2 x 4 h). In spring a mesh size of 200 µm was used, in winter a meshsize of 2000 µm (Table 1). From May to October 1998, single nets were used at 3locations (-0.3, 0.0 and 0.8 m above NAP) (Figure 1). From October 1998 to October1999, 2 nets were used at 2 locations (both at 0.0 m NAP). The number of M. balthica-spat per net was counted in the laboratory on the same day.
Analysis
The period from May 1998 to October 1999 was divided in 4 periods: spring migrationperiod, first summer period, winter migration period and second summer onwards(Table 2), based on the number of migrating M. balthica caught in the plankton netsand the changes in distribution on the tidal flats. A period of migration was defined as a
Date Number ofstations
Areasampled
(cm2)
Mesh size smallestsieve(µm)
Watertemperature
(°C)
Mesh size plankton nets(µm)
7-May-98 55 13 125 200
19-May-98 57 13 125 200
3-Jun-98 57 13 125 200
18-Jun-98 56 22 300 200
7-Jul-98 56 22 300 200
21-Jul-98 57 22 300 200
4-Aug-98 56 22 300 200
19-Aug-98 56 22 300 200
14-Oct-98 56 43 300 200
2-Dec-98 57 83 500 -1.0 2000
15-Dec-98 56 83 500 8.0 2000
13-Jan-99 56 83 500 1.5 2000
28-Jan-99 56 83 500 4.0 2000
10-Feb-99 56 83 500 -1.5 2000
25-Feb-99 56 83 500 5.0 2000
11-Mar-99 57 83 500 3.5 2000
30-Mar-99 56 83 500 12.0 2000
11-May-99 56 83 500 17.0 2000
6-Oct-99 56 249 1000 12.5 2000
10-Apr-00 57 415 1000 No fishing
16-Aug-00 57 83 1000 No fishing
Table 1. Intertidal benthic and plankton sampling of M. balthica. Sampling dates, number ofstations, area sampled, mesh sizes of sieves and plankton nets and the water temperature forthe sampling dates in winter are listed.

Chapter 2
38period with both numerous migrating M. balthica and a change in distribution on thetidal flats. We could not distinguish between active migration and passive dislocation(due to strong currents) with our methods. For each of these periods, the rate ofdisappearance could be estimated, assuming an exponential population decrease,according to the formula:
where Z is the instantaneous disappearance rate, t is time, N0 the original populationsize, and Nt population size at time t. Disappearance could be estimated by rewritingthe formula as -Z.t = Ln(Nt/N0) and doing a regression of ln(Nt/N0) on t. The differencesin disappearance rate between these periods were tested by comparing the slopes (Zvalues) of the regressions.In periods without migration, all bivalves that disappear will have died; thus,disappearance equals mortality. In periods with migration, disappearance is equal tomortality plus emigration or minus immigration. In this study, ‘disappearance’ indicatesthat bivalves died or otherwise disappeared. ‘Mortality’ is used only in cases were it canbe safely assumed that the shellfish actually died. The additional mortality anddisappearance caused by the migration was estimated by subtracting the averagedisappearance before and after migration from the disappearance during migration.
Order-of-magnitude calculations
We made an order-of magnitude-calculation on the population size of M. balthicaduring the migration period (Table 3) based on: initial population size - final populationsize = normal mortality + additional mortality ± migration. As we assumed a closedpopulation, bivalves could only migrate within the study area. The final and initialpopulation sizes were calculated by multiplying density by the total tidal-flat area.Normal mortality is the mortality that would have occurred without migration. For thespring migration, we assumed that this was equal to the mortality of the followingsummer. Additional mortality is the difference between the disappearance measuredduring migration and the assumed normal mortality. Both disappearance rates (normaland additional) were calculated for the whole population. The difference between thecalculated number after normal and additional mortality at a location (based on themortality of the whole population) and the actual number found must be migration(within the study area). 95% confidence intervals of population sizes were calculatedfrom the low and upper confidence intervals for the density estimates.As our sampling comprised only 1 year-class during 2 years and only a small tidal flatand channel area close to the mainland, additional density data of M. balthica from thesubtidal and intertidal of the Lauwers tidal basin and the adjacent North Sea wereobtained from earlier investigations.
eNNtZ
t
.
0.
-
=

Distribution changes during Macoma migrations39
RESULTS
Intertidal density
Figure 2 shows the time course in densities of M. balthica (1998 year-class) on high-and low-tidal flats. Initial settlement occurred mainly in the low intertidal, on the sandyflats close to the main tidal channel. This is reflected by much higher densities on 7May 1998 in the low intertidal (22 098 m-2) than in the high intertidal (8244 m-2). M.balthica undertook a spring migration in May and June 1998. At that time densitiesincreased in the high intertidal and decreased greatly in the low intertidal. The densityof M. balthica-spat in the high intertidal was significantly higher on 3 June than on 7May (ANOVA, p = 0.05). Settlement after 7 May 1998 can largely be excluded, sinceafter this date, few newly-settled M. balthica <300 µm were found in all samples. Thedensity of M. balthica <300 µm was 433 m-2 on 7 May, 76 m-2 on 19 May and 13 m-2 on3 June. After 3 June no M. balthica <300 µm was found on the tidal flats. This indicatesthat after the first sampling date, hardly any new settlement of M. balthica larvaeoccurred in the study area, and implies a migration from the low to the high intertidal.During summer of 1998, densities in the high intertidal remained higher than in the lowintertidal (ANOVA, p = 0.000).
A second migration occurred in winter, between December and February. In this periodM. balthica migrate from the high tidal flats to the low tidal flats. This is visible on Figure2 as the crossing of the lines of densities for the high- and low-intertidal stationsbetween 15 December 1998 and 13 January 1999. Density in the low intertidal did notincrease significantly between these dates (ANOVA, p = 0.45), but the density in thehigh intertidal did decrease significantly (ANOVA, p = 0.05). After the migration (fromFebruary 1999 onwards), densities in the low intertidal stayed higher than in the high
Date
De
nsity
(n.m
-2)
100
1000
10000
Ratio
low
-hig
h
0
1
2
3
4
5
6
7
8
Low tidal flat (-0.5 - 0.2 m, n=32
High tidal flat (0.3 - 1.2 m), n=25
Ratio low-high
a m j j a s o n d j f m a m j j a s o n d j f m a m j j a
1998 1999 2000
* *
* **
*
*
Figure 2. Density of M.balthica-spat (1998 year-class) (left axis) ±95%confidence limits at highand low tidal flats of theGroninger Wad from May1998 to August 2000. Fastchanges in ratio (rigth axis)of the densities on the lowand the high tidal flats pointto migration. An asterisk (*)indicates that the densitydiffered significantlybetween high and low tidalflats at a date (t-test on log-transformed data, p<0.05).

Chapter 2
40intertidal (ANOVA, p = 0.003). A 2-factor ANOVA on the log-transformed densities forall sample dates, with date and tidal level as factors shows that the interaction betweenthese 2 factors was significant (2-way ANOVA, date x tidal level, p = 0.000); thus thespatial distribution changed significantly over time.
Subtidal density
Densities of M. balthica in the subtidal channels, for both the 1998 and the 1999 year-class in October 1999, were much lower than in the intertidal. The 1999 spat had adensity of 0.2 m-2 in the subtidal, while the average density in the intertidal at this timewas 980 m-2. The 1998 group (1.5 year old) had an average density of 15 m-2 in thesubtidal and 400 m-2 in the intertidal at that time. The density of 1998 M. balthica in theshallow North Sea off the Lauwers (see Figure 5) in March 1999 was 30 ± 74 (SD) m-2
(M. F. Leopold, pers. comm.).
Plankton catches, determination of migration periods and disappearance perperiod
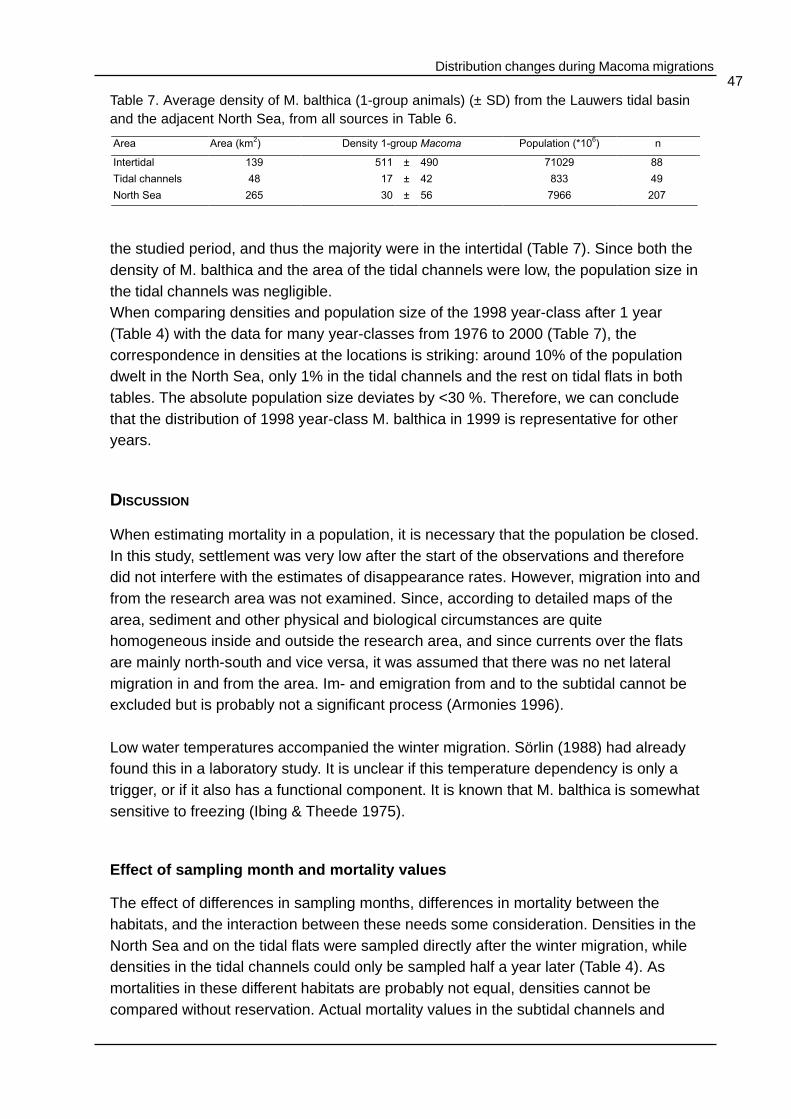
The numbers of M. balthica-spat caught in spring and summer 1998 in the 200 µmplankton nets (Figure 3), were very low compared to the benthic densities at that time.At 4 June, the highest numbers were found in the nets (13 net-1). The number ofmigrating M. balthica in winter reached the highest value of 1055 net-1 on 10 February1999. Only 1 individual of another bivalve species, a 1 year old Scrobicularia plana,was caught. The numbers of M. balthica caught in the plankton nets in winter weresignificantly negatively correlated with the water temperature (R2= 0.48, p = 0.04,Figure 4) indicating that M. balthica migrates in winter. However, during winter,temperatures vary widely with temperatures of -1 and +8°C recorded in December(Table 1). Thus, the bivalves responded to water temperature.
The times of start and end of the migrations were estimated from the changes indistribution pattern (Figure 2) and the time course of the plankton catches (Figure 3).Figure 2 shows the ratio of densities on the low and the high tidal flats. A fast-changingratio in May and June 1998 and in January and February 1999 suggests a fast-changing distribution pattern in these months. These periods also showed the highestplanktonic catches, but these catches suggest a longer migration period (Figure 3).Table 2 gives the dates of the approximate start and end of the migration andintervening periods. For each period, the disappearance rate (including immigrationand emigration) of the whole M. balthica population (1998 year-class) was estimatedfrom the decrease in densities over the entire (low + high) tidal flat area. It is likely thatmortality rates between high and low tidal flats differ. Nevertheless, disappearancerates were calculated for the whole tidal flat area with no distinction between high andlow tidal flats, because migrations make it impossible to calculate disappearance ratesotherwise.
Distribution changes during Macoma migrations41
The disappearance rate was significantly higher during the spring migration (0.0125 d-1)than during the subsequent first summer period (0.0084 d-1). Disappearance during thewinter migration was higher than during the first and second summer period (0.0107 vs0.0084 and 0.0020d-1 respectively). All disappearance rates were significantly differentfrom each other.We found a few M. balthica in the plankton nets after the spring migration (7 July1998). It is not clear whether this was active migration or passive dislocation.
Order-of-magnitude calculations
SPRING MIGRATION
In the Groninger Wad, densities of juvenile M. balthica in summer, after the springmigration, were higher in the high intertidal than in the low intertidal, and were almostzero in the subtidal of the tidal channels. Because the area of low intertidal in the studyarea was larger than the area of high intertidal, the total number of juvenile M. balthicain the 2 areas was approximately equal (Table 3A: 29 x 109). The distribution andmigration of juvenile M. balthica in this study resembles the patterns described for theGerman Wadden Sea by Günther (1991), Armonies & Hellwig-Armonies (1992) and
Temperature (oC)
-5 0 5 10 15 20
Ma
co
ma
ne
t-1
0
250
500
750
1000
1250
Figure 4. The number ofM. balthica (1998 year-class) caught in aplankton net in 24 h atthe Groninger Wad, atvarious watertemperatures fromDecember 1998 to May1999. R2=0.48, p=0.04.
Date
Ma
co
ma
ne
t -1
(20
00
µm
)
0
5
10
15
20
25
30
35
0
500
1000
1500
2000
200 µm
2000 µm
Ma
co
ma
ne
t -1
(20
0µ
m)
a m j j a s o n d j f m a m j j a s o
19991998
Figure 3. Number of M.balthica-spat (1998 year-class) ± SD, caught in anintertidal plankton net in24 h at the GroningerWad, with a mesh widthof 200 µm (spring andsummer 1998) or 2000µm (winter 1998-1999).

Chapter 2
42
Armonies (1996), and in the western Dutch Wadden Sea by Beukema (1993a).
During the spring migration, the actual disappearance rate measured during migrationwas 0.0125 d-1, while the normal disappearance rate was 0.084 d-1 (Table 2). Hence,the additional disappearance rate was 0.0041 d-1. As the duration of the springmigration was 61 d, 25 % of the initial intertidal population disappeared duringmigration (either due to mortality during the migration period or emigration to thesubtidal). During this process, the normal disappearance (of 0.0084 d-1) of buried M.balthica also continued. In Table 3A, the numbers of migrating and disappearing M.balthica during the spring migration were calculated from the observed densitychanges. The number of normal disappearances was calculated from the normaldisappearance rate for the period of migration (61 d) and the initial population size. Thenumber of additional migration disappearances was calculated from the number afternormal disappearances and the additional disappearance rate for the period of
Period Approximate start date Approximate end date Disappearance rate
(d-1
)
Spring migration 7 May 1998 7 July 1998 0.0125
First summer 7 July 1998 2 December 1998 0.0084
Winter migration 2 December 1998 25 February 1999 0.0107
1+ group 25 February 1999 15 August 2000 0.0020
Average May 1998 15 August 2000 0.0052
Table 2. Disappearance rates of M. balthica (1998 year-class) during four periods in their first2.5 year.
A: Spring migration 7 May to 7 July 1998
Location Stations Area(km
2)
Initial populationsize
Pop. size afternormaldisappearance
Pop. size afteradditional migration‘disappearance’
Net numberofimmigrants
Final populationsize
Total 57 7.9 125 75 58 58
Highintertidal
26 3.6 29 17 13 15 29
Low intertidal 31 4.3 95 57 44 -15 29
B: Winter migration. 2 December 1998 to 25 February 1999
Total 57 7.9 14.0 8.9 5.6 5.6
Highintertidal
25 3.6 7.1 4.6 2.9 -0.8 2.1
Low intertidal 32 4.3 6.9 4.4 2.8 0.8 3.5
Subtidal 19 2.4 0.0+
0.0 0.0 0.0 0.0*
+Assumption, based on density of 1999-year-class in October 1999
* Stations sampled in October 1999
Table 3. The population size of M. balthica (1998 year-class, in 109 individuals) at the GroningerWad. Bold values were actually measured or come from calculation in other tables, other valueswere calculated from these bold figures (see text). The net number of migrants is the differencebetween the calculated number of M. balthica ‘After additional migration disappearance’ and theobserved ‘Final population size’ at a location. A: spring migration. B: winter migration.

Distribution changes during Macoma migrations43
migration (61 d). The difference between the number ‘After additional migrationdisappearance’ and the ‘Final population size’ is the number that migrated.
Table 3A gives the absolute numbers of M. balthica in the low- and high-tidal flatsbefore and after spring migration. Most M. balthica spat settled initially in the lowintertidal. Subsequently, about 12% of the initial numbers migrated from the low flats tothe high-tidal flat nurseries between May and July, while 23 % of the population stayedin the low intertidal. The rest of the population disappeared in this period. The numbersstaying in the low intertidal constitute 50% of the final numbers in the intertidal, so halfof all surviving bivalves continued to live in the low intertidal. The numbers of M.balthica in the high intertidal before and after the migration were equal, while thenumber in the low intertidal decreased greatly. 53 % of the initial numbers disappearedduring the migration period, including the normal mortality of 40%. The additional 13%(17 ± 5 x10⁹ individuals) mortality outnumbers the 15 ± 6 x 10⁹ that migrated from thelow- to the high-tidal flats. Since the bivalves probably did not settle in the subtidal inspring, this disappearance is presumably due to additional mortality during themigration.
WINTER MIGRATION
The order-of-magnitude calculation in Table 3B also show the number of migrating anddisappearing M. balthica during the winter migration. The total disappearance rateduring the winter migration was 0.0107 d-1. Parallel to normal disappearance, theadditional disappearance rate (due to mortality or emigration) of 0.0055 d-1 (see Table
AreaKm
2Initial population
size (x 109)
Pop. size afternormal
disappearance
Pop. size afteradditional migration
disappearance
Net number ofmigrants
Finalpopulation size
High intertidal 23 45 29 22 -9.3 13
Low intertidal 116 185 118 92 2.7 94
Tidal channel 48 0 0 0 0.7 1
North Sea 195 0 0 0 5.8 6
Table 5. Population size (in 109 individuals) of M. balthica (1998 year-class), in the Lauwerstidal basin and adjacent North Sea in winter 1998/1999. The net number of migrants is thedifference between the calculated number of M. balthica ‘After additional migrationdisappearance’ and the observed ‘Final population size’ at a location.
Location Area (km2) Month
1999Density 1998-Macoma (n.m
-2) Population (*10
9) N
Intertidal 139 March 684 ± 478 95.1 56
Intertidal 139 October 401 ± 218 55.7 56
Tidal channels 48 October 15 ± 27 0.7 19
North Sea 195 March 30 ± 74 5.8 62
Table 4. Average density (± SD) and population size of M. balthica 1998 year-class in theLauwers tidal basin and the adjacent North Sea in 1999. Data from North Sea from M.F.Leopold (pers. comm.).

Chapter 2
442, the difference in disappearance rate between the average of the first and secondsummer (0.0052) and during winter migration (0.0107)) over 85 days resulted in 36% ofthe initial intertidal population disappearing.Table 3B gives the absolute numbers of M. balthica on the low- and high-tidal flatsbefore and after winter migration. Most M. balthica spat lived in the high intertidalthroughout summer. Subsequently, about 21% of the initial numbers migrated from thehigh-tidal flat nurseries to the low-intertidal flats between December and February. Thiswas 13% of the initial population on the high tidal flats. 60% of the initial numbersdisappeared during the migration period, including the normal mortality of 36%. Theadditional 24% (3.4 ± 0.6 x 10⁹ individuals) mortality outnumbered the 0.8 x10⁹ thatmigrated from the high- to the low-tidal flats and subtidal channel. If all thedisappearing individuals from our study area alone migrate to the coastal North Sea (toa depth of 20 m, an area of 195 km2), this would result in an average density of 11bivalves m-2 in the North Sea outside the Lauwers tidal basin.
Winter migration of 1998 year-class in whole Lauwers tidal basin and adjacentNorth Sea
In order to calculate the actual density of the 1998 group of M. balthica in the NorthSea in 1999, we must consider the entire tidal basin of the Lauwers and Eilanderbalg.This basin consists of 139 km2 of tidal flats and 48 km2 of tidal channels. Density in theintertidal was about 20 times the density in the North Sea and tidal channels (Table 4),indicating that almost 95% of the M. balthica 1998-year-class was still in the intertidal in1999 at the end of the winter migration (Table 4).
Table 5 shows an order-of-magnitude calculation of the migration of M. balthica in theLauwers tidal basin during the winter migration, assuming that the sampled area ofsubtidal and intertidal area sampling in the Groninger Wad is representative of thewhole Lauwers basin. In these calculations, we used North Sea and tidal channeldensities from Table 4, ignoring differences in sampling month, since these densitieswere very low compared to intertidal densities.
Of the 9.3 x 10⁹ (7.8 to 10.6 x 10⁹ 95% CL) migrants that leave the high intertidal, 62%migrate to the North Sea and only 30% to the low intertidal. A small fraction of 7%migrates to the tidal channels. There are however still an additional 34x109 (28 to40x109 95% CL) individuals disappearing during migration. This is thus more than 9times the number arriving in the North Sea. Therefore, taking the North Sea populationinto the calculations does not explain a large proportion of disappearing M. balthica.Comparison of Table 3 and Table 5 changes our picture of the migration flowdrastically. Taking migration to the North Sea into the calculations reveals thatmigration from the high to the low intertidal is only of minor importance, with two-thirdsof the bivalves migrating to the North Sea.

Distribution changes during Macoma migrations45
Densities in thesubtidal Wadden Seaand adjacent NorthSea in other years
Additional density datafor M. balthica from thesubtidal and intertidal ofthe Lauwers tidal basinand the adjacent NorthSea from earlier studies(Figure 5) are given inTable 6. Thesedensities were used tocalculate the averagedensity percompartment (NorthSea, tidal channels andtidal flats). Wheneveravailable, densities of0-group, 1-group andolder individuals werecalculated separately.Together with the areaof each of thesecompartments, theaverage total populationsize of M. balthica perage-class wascalculated from thesedata.
Most studies sampledthe North Sea fromMarch to May.Postlarval M. balthicasettle in April and aresmall (<2 mm) untilearly June, andtherefore pass throughthe coarse sieves usedin subtidal sampling.Thus, few studiessampled in the NorthS
ourc
eH
abitat
Location
Sam
plin
gdate
Meth
od
Are
aper
sta
tion
(m2)
Num
ber
ofsta
tions
Density
(n.m
-2)
0-g
roup
1-g
roup
Tota
l
De
Vla
s(1
981)
Inte
rtid
al
Pie
terb
ure
nw
ad,
Andelb
ult
&W
antij
Rott
um
Ju
ly1981
Core
r0.0
60
23
10
82
438
Lin
deboom
et
al.,
(1996)
Inte
rtid
al
Boschw
ad
&M
oth
oek
July
1994
Core
r0.0
28
413
This
stu
dy
Inte
rtid
al
Gro
nin
ger
Wad
Marc
h1999
Core
r0.0
08
58
0684
556
This
stu
dy
Inte
rtid
al
Gro
nin
ger
Wad
Marc
h2000
Core
r0.0
42
90
173
395
This
stu
dy
Inte
rtid
al
Schie
rmonnik
oog
Marc
h2000
Core
r0.0
42
40
63
140
RIK
Z(p
ers
.com
m.)
Inte
rtid
al
Gro
nin
ger
Wad
1976
to1999
Core
r0.0
77
5,
atle
asttw
ice
ayear
279
675
Van
Scheppin
gen
and
Gro
ene
wold
(1990)
Nort
hS
ea
Whole
are
aM
ay
1989
Van
Veen-g
rab
0.0
68
19
118
Duin
eveld
(1992)
Nort
hS
ea
Offshore
sta
tion
May
1992
Boxcore
0.0
68
118
Duin
eveld
and
Belg
ers
(1993)
Nort
hS
ea
Offshore
sta
tion
May
1993
Boxcore
0.0
68
13
Holtm
ann
et
al.,(1
995)
Nort
hS
ea
Offshore
sta
tion
May
1994
Boxcore
0.0
68
13
Holtm
ann
et
al.,(1
996)
Nort
hS
ea
Offshore
sta
tions
May
1995
Boxcore
0.0
68
229
Holtm
ann
et
al.,(1
997)
Nort
hS
ea
Offshore
sta
tions
May
1996
Boxcore
0.0
68
2249
Holtm
ann
et
al.,(1
998)
Nort
hS
ea
Offshore
sta
tions
May
1997
Boxcore
0.0
68
2132
Leopold
(pers
.com
m.)
Nort
hS
ea
Whole
are
aJune
1997
Van
Veen-g
rab
0.2
00
62
03
10
Leopold
(pers
.com
m.)
Nort
hS
ea
Whole
are
aM
ay
1998
Van
Veen-g
rab
0.2
00
62
07
12
Holtm
ann
et
al.,(1
999)
Nort
hS
ea
Offshore
sta
tions
May
1998
Boxcore
0.0
68
259
Leopold
(pers
.com
m.)
Nort
hS
ea
Whole
are
aM
arc
h1999
Van
Veen-g
rab
0.2
00
62
030
61
De
Vla
s(1
981)
Tid
alchannels
Whole
Zuid
-Oost
Lauw
ers
July
1981
Van
Veen-g
rab
0.2
00
18
418
38
Lin
deboom
et
al.,
(1996)
Tid
alchannels
Spru
it&
Boschgat
July
1994
Boxcore
0.0
60
16
626
101
This
stu
dy
Tid
alchannels
South
ern
Zuid
-OostLauw
ers
Octo
ber
1999
Van
Veen-g
rab
0.6
-0.8
19
114
28
Tabl
e 6.
Sou
rces
giv
ing
dens
ities
of
M.
balth
ica
from
the
sub
tidal
and
inte
rtid
al o
f th
e La
uwer
s tid
al b
asin
(W
adde
n S
ea)
and
adja
cent
Nor
th S
ea.

Chapter 2
46
Sea in the months that 0-group M. balthica were present and large enough to beretained in the sieves. This can explain why in none of the studies in Table 6, 0-groupM. balthica was found in the North Sea. For older (and thus larger) age-classes, thesampling month was not so important, since between-year-class differences in densityare much larger than between-month differences (Beukema et al. 1996).Table 7 gives the average densities in the different habitats. In the North Sea, older M.balthica were found to a depth of 20 m. Densities of 1-group individuals were generallylow (densities of 0 to 790 m-2 at individual stations) in the subtidal of both the tidalchannels and the North Sea. In the intertidal M. balthica was more numerous, up to7300 m-2. Only 10% of the population of the Lauwers basin dwelt in the North Sea in
Wadden Sea
North Sea
Zuidoost-LauwersEila
nder
balg
Figure 5. Sampling stations from the sources giving densities of M. balthica from the subtidaland intertidal of the Lauwers tidal basins (Wadden Sea) and adjacent North Sea (See Table 6).The boundaries of the Lauwers and Eilanderbalg basin are indicated with dashed lines.
Distribution changes during Macoma migrations47
the studied period, and thus the majority were in the intertidal (Table 7). Since both thedensity of M. balthica and the area of the tidal channels were low, the population size inthe tidal channels was negligible.When comparing densities and population size of the 1998 year-class after 1 year(Table 4) with the data for many year-classes from 1976 to 2000 (Table 7), thecorrespondence in densities at the locations is striking: around 10% of the populationdwelt in the North Sea, only 1% in the tidal channels and the rest on tidal flats in bothtables. The absolute population size deviates by <30 %. Therefore, we can concludethat the distribution of 1998 year-class M. balthica in 1999 is representative for otheryears.
DISCUSSION
When estimating mortality in a population, it is necessary that the population be closed.In this study, settlement was very low after the start of the observations and thereforedid not interfere with the estimates of disappearance rates. However, migration into andfrom the research area was not examined. Since, according to detailed maps of thearea, sediment and other physical and biological circumstances are quitehomogeneous inside and outside the research area, and since currents over the flatsare mainly north-south and vice versa, it was assumed that there was no net lateralmigration in and from the area. Im- and emigration from and to the subtidal cannot beexcluded but is probably not a significant process (Armonies 1996).
Low water temperatures accompanied the winter migration. Sörlin (1988) had alreadyfound this in a laboratory study. It is unclear if this temperature dependency is only atrigger, or if it also has a functional component. It is known that M. balthica is somewhatsensitive to freezing (Ibing & Theede 1975).
Effect of sampling month and mortality values
The effect of differences in sampling months, differences in mortality between thehabitats, and the interaction between these needs some consideration. Densities in theNorth Sea and on the tidal flats were sampled directly after the winter migration, whiledensities in the tidal channels could only be sampled half a year later (Table 4). Asmortalities in these different habitats are probably not equal, densities cannot becompared without reservation. Actual mortality values in the subtidal channels and
Area Area (km2) Density 1-group Macoma Population (*10
6) n
Intertidal 139 511 ± 490 71029 88
Tidal channels 48 17 ± 42 833 49
North Sea 265 30 ± 56 7966 207
Table 7. Average density of M. balthica (1-group animals) (± SD) from the Lauwers tidal basinand the adjacent North Sea, from all sources in Table 6.

Chapter 2
48North Sea were not measured and are not reported in the literature.The ratio between individuals older than 1 year and 1-group individuals can give anidea of the mortality at a location: a low ratio suggests a high mortality and vice versa.In October 1999, we found 9% 2 year and older M. balthica in the tidal channels and17% of these animals in the intertidal. This suggests a higher mortality in the tidalchannels. The North Sea data do not allow an estimation of mortality. The densities ofsome year-classes at stations sampled in early spring in 3 consecutive years (1997,1998 and 1999) seemed to increase (M.F. Leopold, pers comm.). This suggests afurther migration of M. balthica to the North Sea at an older age. The origin andmigration mechanism of these older individuals still need to be clarified. Olderindividuals can also migrate pelagically: in January 2001, we found 5 1-group M.balthica together with 2241 migrating 0-group in a plankton net on the Groninger Wadtidal flats. Together, these differences in mortality and sampling month will have led toan (unquantifiable) underestimate of migration to the tidal channels and the North Sea.
Explaining disappearance
During both migration periods, many Macoma balthica disappeared from our studyarea. For the winter migration, part of this disappearance can be explained bymigration to the North Sea. This pattern of increased mortality during spring and winteris not found for non-migrating populations of M. balthica (for example in the Baltic Sea,Bonsdorff et al. 1993) or for non-migrating species like Cerastoderma edule (Jensen1992; Guillou & Tartu 1994). Therefore, the high disappearance rates during themigration period were probably not caused by a higher predation rate on buried M.balthica. The rest of the disappearing individuals were possibly a victim of predators,although many other factors co-varied. Laboratory experiments showed that M. balthicais indeed more vulnerable to epibenthic predators such as flatfish and the crabCarcinus maenas, during migration than when they remain buried (Chapter 3). It is,however, not clear whether this can quantitatively explain the disappearance of allmigrating M. balthica.
Densities of the shrimp Crangon crangon, the crab Carcinus maenas and the gobyPomatoschistus sp. on the tidal flats are generally lower during the spring and wintermigration, than before and after these migrations (Beukema 1991; Beukema 1992).The fact that disappearance is higher in a period when predators are scarce meansthat the actual impact of migration losses on the population size may be even largerthan the estimated it this study.
General
Macoma balthica spat were more abundant in high- than on low-tidal flats during theirfirst summer. Since there is more low- than high-tidal flat, half of the spat lived in thehigh intertidal while the other half lived in the low intertidal. Adults lived in both the high-

Distribution changes during Macoma migrations49
and low-tidal flats, but were more common on the low tidal flats. Therefore, nursery useis not obligatory for juvenile M. balthica, and adults can live in the nurseries. Still, M.balthica undertake migrations. As no juveniles were found in the North Sea, theWadden Sea tidal flats must serve as an exclusive nursery for the North Seapopulation.This study shows that there is a large risk associated with migration. Therefore, nurseryuse has to have a large advantage for the juvenile M. balthica. Beukema (1993a)summarised the knowledge on differences in growth and survival between juvenile andadult M. balthica. Many of these differences may indeed promote nursery use. Severalstudies have shown that circumstances are more favourable for juveniles in the highintertidal nurseries and in the low intertidal for adults.The advantages and disadvantages for adults and juveniles of living in the North Seahave not been investigated. It is difficult to evaluate the disadvantages for 0-group M.balthica in the North Sea, as these rarely occur outside the tidal flats. We assume that,for spat, environmental condition are not so good, as they do not occur there. Wehypothesise that this is caused by predation by flatfish, the shrimp Crangon crangonand the crab Carcinus maenas on small M. balthica, and that spat are thus forced tolive in the high intertidal, where these predators are scarce.The winter migration to the North Sea is especially dangerous, since the number ofindividuals disappearing during this migration is much higher than the number arrivingin the North Sea. This implies that living in the North Sea is of great advantage for theadults. The nature of this advantage has never been investigated. Possibly, survival ofadults is much higher in the North Sea, as very old adults are much more numerousthere than in the intertidal. In the long run, the North Sea population might ensuresurvival of the metapopulation in the case of extremely cold winters.However, most Macoma balthica either stay in the high intertidal or migrate to the lowintertidal. We cannot exclude the possibility that migration to the North Sea in winter isno more than a side effect of migration from the high to the low intertidal, whereby low-intertidal arrivals have the advantage of migration (Chapter 4 and 7), while the NorthSea individuals have passed the best places.
ACKNOWLEDGEMENTS
Rob Dekker (NIOZ), Suzanne Holtmann (NIOZ) and Jaap de Vlas (RIKZ) kindly provided dataon densities of Macoma balthica in the Wadden and North Sea. Mardik Leopold (Alterra)provided density data for the North Sea that were of great importance for our calculations. M.balthica densities on the Groninger Wad (provided by the RIKZ), were collected within theframework of the monitoring program of Rijkswaterstaat (MWTL) and made available by RIKZ-Haren. The anonymous referees are thanked for the valuable comments. All students andvolunteers are thanked for their help during the fieldwork.

Chapter 2
50