university of groningen on the neural mechanisms of
TRANSCRIPT

University of Groningen
On the neural mechanisms of reduced behavior in people with cognitive declineTumati, Shankar
IMPORTANT NOTE: You are advised to consult the publisher's version (publisher's PDF) if you wish to cite fromit. Please check the document version below.
Document VersionPublisher's PDF, also known as Version of record
Publication date:2017
Link to publication in University of Groningen/UMCG research database
Citation for published version (APA):Tumati, S. (2017). On the neural mechanisms of reduced behavior in people with cognitive decline.University of Groningen.
CopyrightOther than for strictly personal use, it is not permitted to download or to forward/distribute the text or part of it without the consent of theauthor(s) and/or copyright holder(s), unless the work is under an open content license (like Creative Commons).
The publication may also be distributed here under the terms of Article 25fa of the Dutch Copyright Act, indicated by the “Taverne” license.More information can be found on the University of Groningen website: https://www.rug.nl/library/open-access/self-archiving-pure/taverne-amendment.
Take-down policyIf you believe that this document breaches copyright please contact us providing details, and we will remove access to the work immediatelyand investigate your claim.
Downloaded from the University of Groningen/UMCG research database (Pure): http://www.rug.nl/research/portal. For technical reasons thenumber of authors shown on this cover page is limited to 10 maximum.
Download date: 04-02-2022

Chapter 3
70

Chapter 3
71
CHAPTER 3
Apathy in people with amnestic mild cognitive
impairment is associated with reduced choline and myo-
inositol in the right temporo-parietal cortex on 1H-MRS
Submitted as:
Tumati, S., Opmeer, E.M., Marsman, J.B.C., Martens, S., Reesink, F.E., De Deyn, P.P.,
Aleman A.
Lower choline and myo-inositol in temporo-parietal cortex associated with apathy in
amnestic MCI

Chapter 3
72
Abstract
Apathy is a common symptom in amnestic mild cognitive impairment (aMCI) patients.
The neural substrates of apathy in aMCI may involve multiple brain regions, including
the anterior cingulate cortex and the temporo-parietal region. Here we investigated
proton magnetic resonance spectroscopy (1H-MRS) in brain regions that may underlie
apathy in aMCI patients. Twenty-eight aMCI patients with varying degrees of apathy and
20 matched controls completed neuropsychological assessments and 1H-MRS. Spectra
were acquired from single voxels in the posterior cingulate cortex (PCC), dorsal anterior
cingulate cortex (DACC), right dorsolateral prefrontal cortex (DLPFC), and right temporo-
parietal cortex (TPC). Spearman partial correlations between metabolite concentrations
in each region and severity of apathy were determined. Additional analyses of
covariance were performed to determine whether metabolite changes differed between
patients with or without clinically diagnosed apathy. Degree of apathy was found to be
negatively correlated with choline and myo-inositol (mI) in the TPC. Additional
exploratory analyses suggested that N-acetyl aspartate (NAA)/mI was reduced in aMCI
without apathy group but not in the aMCI with apathy group. In the DACC, glutamate
and glutamine (Glx) levels tended to be higher in the aMCI with apathy group and
reduced in association with depression scores. Apathy in aMCI patients is associated with
neurometabolite changes indicative of altered membranal integrity and glial function in
the right TPC. We conclude that, in a clinically diagnosed aMCI cohort, apathy symptoms
may be suggestive of neural changes that are distinct from aMCI without apathy.

Chapter 3
73
1. Introduction
Alzheimer’s disease dementia (AD) is characterized by a progressive decline in
cognitive functions, leading to an inability to live independently (Albert et al., 2011). In
the preceding stage before AD, termed amnestic mild cognitive impairment (aMCI)
(Albert et al., 2011), the characteristic decline in memory function is accompanied by
apathy in approximately 15-20% of patients (Geda et al., 2008; Hwang et al., 2004;
Lyketsos et al., 2002). Apathy is characterized by reduced initiative and interest in
activities, and is associated with a decrease in daily functioning, increased caregivers’
burden, and increased risk for institutionalization (Bakker et al., 2013; Boyle et al., 2003;
Kaufer et al., 1998; Robert et al., 2009). With worsening cognitive decline, apathy
becomes more frequent, and is associated with an increased risk for disease progression
(Palmer et al., 2010; Richard et al., 2012; Teng, Lu and Cummings, 2007; Vicini Chilovi et
al., 2009). Given this adverse impact of apathy on the disease course, determining its
neural mechanisms may improve understanding of the processes that contribute to the
progression from the stage of aMCI to AD.
Previous imaging studies in MCI/AD patients with apathy found that apathy
was associated with changes in the dorsal anterior cingulate cortex (DACC) such as
reduced gray matter (Apostolova et al., 2007; Bruen et al., 2008), reduced integrity of
white matter tracts (Kim et al., 2011; Tighe et al., 2012), lower perfusion (Lanctôt et al.,
2007), reduced metabolism (Marshall et al., 2007), and higher pathologic burden
(Marshall et al., 2006; Tekin et al., 2001). Besides the DACC, apathy is also associated
with changes in the right temporo-parietal cortex (TPC) (Kos et al., 2016). These changes
include reduced perfusion (Ott, Noto and Fogel, 1996), atrophy (Donovan et al., 2014;
Guercio et al., 2015), reduced metabolism (Gatchel et al., 2017), and reduced functional
connectivity (as part of the fronto-parietal network) (Munro et al., 2015) in this region.
Though these studies associate apathy with neural changes on various modalities, it is
not known whether changes in neural metabolites are also associated with apathy in
these patients.

Chapter 3
74
The concentration of various metabolites in the brain can be quantified non-
invasively with proton magnetic resonance spectroscopy (1H-MRS) (Alger, 2010; Duarte
et al., 2012). In MCI and AD patients, 1H-MRS studies have found consistent metabolite
changes in the posterior cingulate cortex (PCC) (Adalsteinsson et al., 2000; García Santos
et al., 2008; Kantarci et al., 2000; Pilatus et al., 2009; Tumati, Martens and Aleman,
2013). In this region, the ratio of N-acetyl aspartate (NAA) to myo-inositol (mI) was found
to be reduced. In addition, changes in the level of choline-containing compounds (Cho)
have also been noted, although these findings are not consistent (Tumati, Martens and
Aleman, 2013). These changes have also been associated with various markers of AD
(Gomar et al., 2014; Kantarci et al., 2008; Murray et al., 2014; Voevodskaya et al., 2016).
These metabolites are markers for various neural functions as they are
selectively enriched in different cellular processes or compartments. For example, NAA
is primarily located in neurons and axons, and its concentration indicates neuronal
density and viability. Similarly, functioning of glial cells can be ascertained by the
concentration of mI, which when increased may indicate presence of inflammatory
changes (Duarte et al., 2012). The Cho signal comprises free forms of
glycerophosphocholine and phosphocholine, which are part of cell membranes. An
increase in breakdown of membranes releases these compounds leading to an increase
in the Cho signal (Öz et al., 2014). 1H-MRS also quantifies the concentration of the
excitatory neurotransmitter glutamate and its precursor, glutamine, which are termed
as Glx as both molecules form overlapping resonance peaks (Öz et al., 2014). These
metabolites are commonly expressed as a ratio, relative to the concentration of creatine
and phosphocreatine (Cr). Cr, which plays a role in energy metabolism, is assumed to
remain constant, and hence it is often used as an internal reference. However, this may
not always be the case and absolute quantification (relative to water) may improve
metabolite estimates (Jansen et al., 2006).
In the current study of aMCI patients, we sought to determine metabolite
changes that may be present in the various regions implicated in apathy. In addition to
the DACC and TPC which were empirically associated with apathy (Kos et al., 2016; Stella
et al., 2014; Theleritis et al., 2014), we also investigated the dorsolateral prefrontal

Chapter 3
75
cortex (DLPFC) as theoretical models have proposed that deficits in this region may
produce symptoms of apathy (Guimarães et al., 2008; Levy and Dubois, 2006; van
Reekum, Stuss and Ostrander, 2005). The PCC was also assessed as metabolite changes
in this region were expected in aMCI. We hypothesized that metabolite changes in the
DACC and TPC would be associated with apathy, in accordance with existing literature.
Specifically, reduced NAA/mI in the PCC and increased Cho and mI in the DACC and right
TPC were hypothesized to be associated with greater apathy.
2. Methods
2.1. Participants
The study was conducted at the Neuroimaging Center, the department of
Geriatrics, and Alzheimer Research Center of the University Medical Center Groningen
(UMCG), the Netherlands, with approval from the institutional medical ethics board.
Written informed consent was obtained from all study participants. In total, twenty-
eight subjects with aMCI and 20 healthy cognitively normal subjects between 60 to 80
years of age were included in this study. They were all assessed by a neurologist and
neuropsychologist for aMCI according to criteria by Petersen et al. (Petersen et al., 1999;
Winblad et al., 2004). Apathy was diagnosed clinically in eight subjects according to
criteria described by Robert et al. (Robert et al., 2009) and its severity was assessed with
the Apathy Evaluation Scale (AES) (Clarke et al., 2007). The cognitively healthy subjects
were matched with the aMCI group for age, gender and education and were required
to have a mini mental state examination (MMSE) score of 28 or higher and not to have
subjective memory complaints. Subjects were excluded if (i) any neurological or
psychiatric disorders (except symptoms of depression in aMCI subjects) were present
currently or in the past, (ii) medications that may affect cognition were being used, (iii)
a history of head injury accompanied by loss of consciousness was present, (iv) they were
unable to undergo a magnetic resonance imaging (MRI) scan, or (v) anatomical
abnormalities were found on the MRI scan. Two subjects with aMCI did not complete
the questionnaire to assess depression and hence were excluded from the analyses,
leaving a sample of 26 aMCI subjects and 20 controls.
2.2. Cognitive and behavioral assessment
Chapter 3
76
All subjects were evaluated with the Mini Mental State Examination (MMSE),
Global Deterioration scale, 30-item Geriatric Depression scale (GDS) (Yesavage, 1988)
and the clinician version of the AES (Clarke et al., 2007; Marin, Biedrzycki and
Firinciogullari, 1991). The AES is an 18-item ordinal scale, where each item is scored
between 1 and 4 based on the clinician’s assessment. The assessment yields a score
ranging from 18 to 72, with higher scores indicating greater apathy (Clarke et al., 2007).
Memory was assessed with the 15-word Rey auditory verbal learning task (RAVLT) for
encoding (immediate recall) and 20 to 30 minute delayed recall (Lezak, 2004).
2.3. MRI Acquisition
Participants underwent scanning in a 3T Philips Intera MRI scanner (Best, the
Netherlands) equipped with a 32-channel SENSE head coil. A whole-brain high-resolution
anatomical 3D T1-weighted scan was acquired for positioning of 1H-MRS voxels and for
separation of tissue classes within each spectroscopic voxel (repetition time (TR) 9 ms;
echo time (TE) 3.6 ms; flip angle (FA) 8°; field of view (FOV) 256 × 232; 170 slices; voxel
size 1 × 1 × 1 mm). Spectra were acquired from four locations sequentially, each with a
single voxel measuring 20 × 20 × 20 mm. Following automated first-order B0 shimming,
water unsuppressed and chemical shift water suppression (CHESS) spectra were
acquired using Point Resolved Spectroscopy (PRESS) sequence with a TR=2000 ms,
TE=35ms, 128 signal excitations and 1024 data points. Voxel locations are shown in
Figure 1. The first voxel was placed in the bilateral DACC, aligned to the callosal sulcus
inferiorly and the anterior border of the voxel was located ~7-10 mm posterior to the
genu of the corpus callosum while the superior border extended into the superior frontal
gyrus. The second voxel was placed midline in the PCC/ inferior precuneus as described
for 1H-MRS studies in AD (Kantarci et al., 2008). The third voxel was placed in the right
DLPFC, with the inferior border aligned with the corpus callosum, and superior to the
lateral fissure. The fourth voxel was placed in the right TPC, covering the posterior
ascending ramus of the sylvian fissure and surrounding supramarginal gyrus. The third
and fourth voxels also covered the underlying white matter considerably owing to the
size of the voxel and a necessity to minimize CSF within the voxel.
2.4. Analyses
Chapter 3
77
The metabolites NAA, Cho, mI, Cr, and Glx were quantified using LCModel software
package (Provencher, 2001). The acquired spectra were considered reliable if Cramer-
Rao lower bounds (CRLB), used for estimating model fitting error for each metabolite,
were less than 20% (Cavassila et al., 2001). Data not meeting this criterion were excluded
from analyses. Final group sizes for each metabolite are given in Table 2. Metabolite
values were referenced to internal water concentration obtained from a water-
unsuppressed 1H-MRS acquisition (Alger, 2010). In addition, NAA/mI ratios were
calculated. Tissue proportions of grey matter, white matter, and CSF in each voxel were
extracted from T1-weigthed images by masking the 1H-MRS voxel position using custom
scripts and subsequently segmented using SPM12 (http://www.fil.ion.ucl.ac.uk/).

Chapter 3
78
Figure 1: Voxel position on sagittal, coronal and tranverse sections. Bounding box of
the voxel is shown in yellow. (A: Anterior; P: posterior; R: Right; L: Left)
Chapter 3
79
Statistical analyses were performed in R (https://www.r-project.org/).
Demographic data and neuropsychological assessments between the groups were
compared with Mann-Whitney U tests or chi-squared tests (for gender). Significant
differences on the omnibus test were further evaluated with the Dunn test. Since GDS
scores differed significantly between controls and aMCI patients, we calculated a
subscore (GDS-non apathy) by leaving out six items of the GDS (no. 2, 12, 19, 20, 21, &
28) that were identified as an apathy component in a factor analysis of a large
independent sample of healthy older adults (Adams, Matto and Sanders, 2004).
Spearman correlations between the AES score, GDS scores, and neuropsychological
measures were calculated.
Partial correlations (Spearman) between metabolites and AES scores were
determined, after controlling for GDS-non apathy score, and proportion of white matter
and CSF content in the voxel as covariates. Additionally, analyses of covariance
(ANCOVA) were conducted for differences in metabolites between aMCI and control
groups. Results were considered significant at FDR-corrected two-tailed p < .05. Post hoc
exploratory analyses of covariance (ANCOVA) were conducted for differences between
aMCI with apathy, aMCI without apathy, and control group (uncorrected p-value
reported).
3. Results
3.1. Sample characteristics
Demographic and clinical characteristics of the sample are given in table 1. The
patient and control group were comparable except for significant group differences on
the 15-word RAVLT test (immediate and delayed), and the GDS total score. The GDS-non
apathy subscore, denoting depression independent of apathy was significantly higher in
both patient groups compared to controls. The AES score was significantly correlated
with the GDS total score (r= 0.32, p=.03) but not with the GDS-non apathy score (r= 0.23,
p=.13).
3.2. Associations between apathy and neurometabolites
Chapter 3
80
Partial correlations between metabolite levels and AES scores controlled for
proportion of white matter and CSF in the voxel, and GDS-non apathy score, showed that
higher AES scores were significantly correlated with lower Cho (r= -0.53, pfdr= .002, n=45)
and lower mI (r= -0.42, pfdr = .016, n=45) in the right TPC. Uncorrected for multiple
comparisons, there were also correlations seen between AES score and lower Cho (r= -
0.37, punc= .015, pfdr= .092, n=45) in the PCC and higher NAA/mI (r=0.33, punc= .033, pfdr=
.07, n=45) in the right TPC. These results did not survive correction for multiple
comparisons. No other significant associations were found between any metabolites and
AES score in the assessed brain regions (Table 2 and Figure 2).
The analyses also did not show neurometabolite differences in any region
between the aMCI and control group (Table 3). Notably, the NAA/mI ratio in the PCC did
not differ significantly between the two groups. In addition, given that apathy increases
the risk of progression to AD, we expected to find a significant association between AES
scores and metabolite levels in the PCC. This was not the case. To follow this up, we
conducted an exploratory
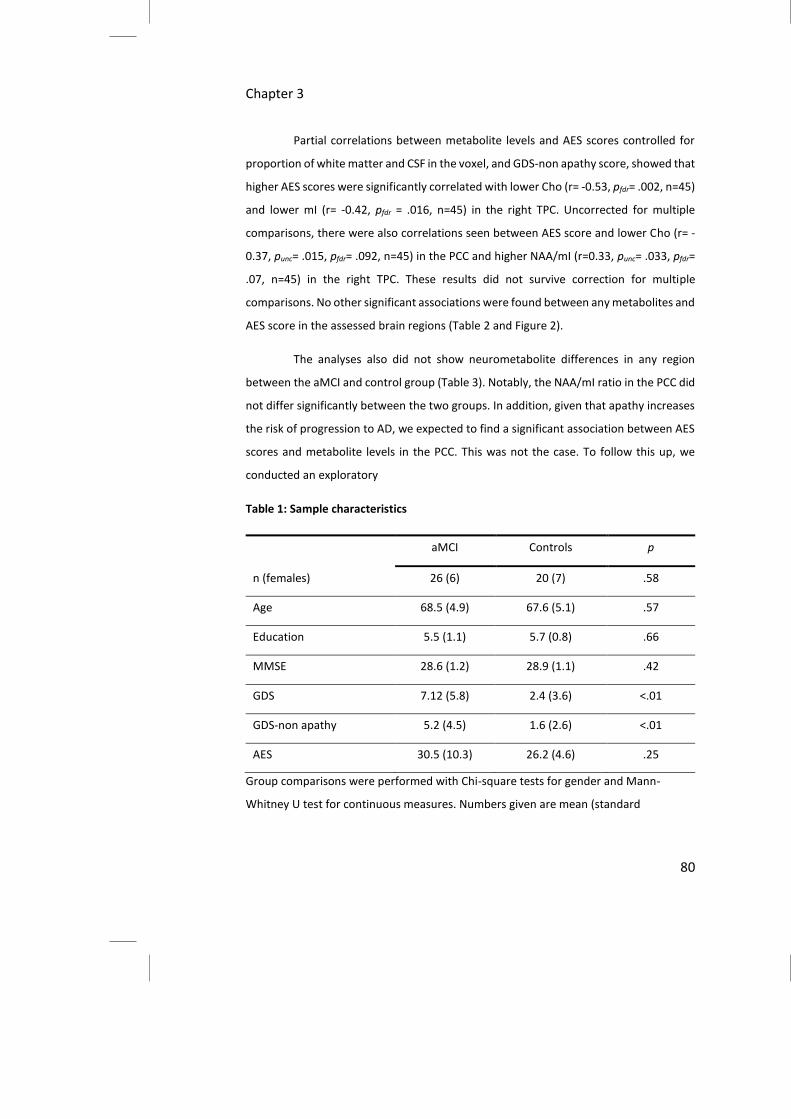
Table 1: Sample characteristics
aMCI Controls p
n (females) 26 (6) 20 (7) .58
Age 68.5 (4.9) 67.6 (5.1) .57
Education 5.5 (1.1) 5.7 (0.8) .66
MMSE 28.6 (1.2) 28.9 (1.1) .42
GDS 7.12 (5.8) 2.4 (3.6) <.01
GDS-non apathy 5.2 (4.5) 1.6 (2.6) <.01
AES 30.5 (10.3) 26.2 (4.6) .25
Group comparisons were performed with Chi-square tests for gender and Mann-
Whitney U test for continuous measures. Numbers given are mean (standard
Chapter 3
81
Right TPC Right TPC DACC DACC
deviation) except for sample size and gender. MMSE: Mini Mental State Examination;
GDS: Geriatric Depression Scale; AES: Apathy Evaluation Scale
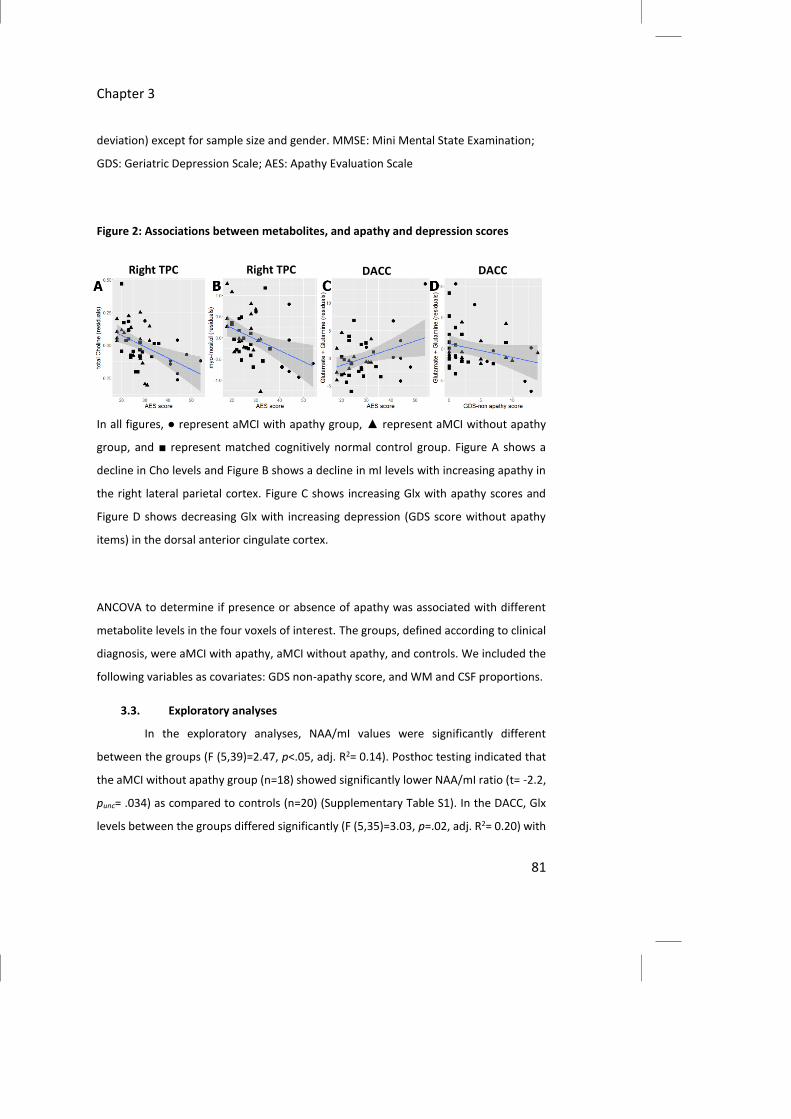
Figure 2: Associations between metabolites, and apathy and depression scores
In all figures, ● represent aMCI with apathy group, ▲ represent aMCI without apathy
group, and ■ represent matched cognitively normal control group. Figure A shows a
decline in Cho levels and Figure B shows a decline in mI levels with increasing apathy in
the right lateral parietal cortex. Figure C shows increasing Glx with apathy scores and
Figure D shows decreasing Glx with increasing depression (GDS score without apathy
items) in the dorsal anterior cingulate cortex.
ANCOVA to determine if presence or absence of apathy was associated with different
metabolite levels in the four voxels of interest. The groups, defined according to clinical
diagnosis, were aMCI with apathy, aMCI without apathy, and controls. We included the
following variables as covariates: GDS non-apathy score, and WM and CSF proportions.
3.3. Exploratory analyses
In the exploratory analyses, NAA/mI values were significantly different
between the groups (F (5,39)=2.47, p<.05, adj. R2= 0.14). Posthoc testing indicated that
the aMCI without apathy group (n=18) showed significantly lower NAA/mI ratio (t= -2.2,
punc= .034) as compared to controls (n=20) (Supplementary Table S1). In the DACC, Glx
levels between the groups differed significantly (F (5,35)=3.03, p=.02, adj. R2= 0.20) with

Chapter 3
82
posthoc testing indicating higher Glx levels in the aMCI with apathy group (n=8) (t= 2.6,
punc= .013) compared to controls (n=18). In the same model, GDS-non apathy scores were
associated with lower Glx (t= -2.2, punc= .035).
Table 2: Partial correlations (Spearman) between apathy scores (AES) and 1H-MRS
metabolites, controlling for depression scores (GDS-non apathy), and proportion of
white matter and CSF in the voxel.
N (aMCI_A/ aMCI_NA/ CN) R p (unc) p (fdr)
Posterior cingulate cortex
NAA 46 (8/ 18/ 20) 0.08 0.63 0.72
Cho 46 (8/ 18/ 20) -0.37 0.02 0.09
mI 45 (8/ 18/ 19) -0.17 0.27 0.53
Cr 46 (8/ 18/ 20) -0.17 0.29 0.53
Glx 46 (8/ 18/ 20) 0.06 0.72 0.72
NAA/mI 45 (8/ 18/ 19) 0.15 0.36 0.53
Dorsal anterior cingulate cortex
NAA 46 (8/ 18/ 20) 0.15 0.35 0.96
Cho 46 (8/ 18/ 20) 0.01 0.93 0.96
mI 42 (7/ 17/ 18) 0.07 0.68 0.96
Cr 46 (8/ 18/ 20) 0.09 0.56 0.96
Glx 41 (8/ 15/ 18) 0.35 0.03 0.2
NAA/mI 42 (7/ 17/ 18) -0.01 0.96 0.96
Right dorsolateral prefrontal cortex
NAA 43 (7/ 16/ 20) -0.07 0.65 0.99

Chapter 3
83
Cho 43 (7/ 16/ 20) -0.32 0.04 0.26
mI 38 (7/ 15/ 16) <-0.01 0.99 0.99
Cr 43 (7/ 16/ 20) 0.06 0.73 0.99
Glx 41 (7/ 15/ 19) 0.09 0.60 0.99
NAA/mI 38 (7/ 15/ 16) <-0.01 0.99 0.99
Right lateral parietal cortex
NAA 45 (8/ 18/ 19) -0.11 0.47 0.47
Cho 45 (8/ 18/ 19) -0.53 0.0003 0.002
mI 45 (8/ 18/ 19) -0.42 0.005 0.016
Cr 45 (8/ 18/ 19) -0.16 0.30 0.45
Glx 45 (8/ 18/ 19) -0.13 0.43 0.47
NAA/mI 45 (8/ 18/ 19) 0.33 0.03 0.07
N: sample size; aMCI_A: aMCI with apathy; aMCI_NA: aMCI without apathy; CN:
cognitively normal matched controls; NAA: N-acetylasparte & N-
acetylaspartylglutamate; Cho: Glycerophosphocholine & phosphocholine; mI: myo-
inositol; Cr: Creatine & phosphorcreatine; Glx: Glutamate & glutamine. Significant
values are highlighted. p (unc): Uncorrected p-values; p (fdr): False discovery rate
corrected p-values.
4. Discussion
This study aimed to determine associations between apathy in aMCI and
metabolite levels in four brain regions that have been hypothesized or previously
reported to be associated with apathy in aMCI/AD patients. Results showed that greater
apathy is associated with reduced Cho and mI in the right temporoparietal cortex (TPC)
in clinically diagnosed aMCI patients and matched control subjects. No other
associations were found. Metabolite levels in the aMCI and control groups were also not
Chapter 3
84
significantly different. Exploratory analyses suggested that reduced NAA/mI as
compared to controls, a consistent finding in previous studies in MCI/AD (Adalsteinsson
et al., 2000; García Santos et al., 2008; Kantarci et al., 2000, 2007; Pilatus et al., 2009;
Tumati, Martens and Aleman, 2013), was present only in aMCI without apathy group.
Overall, our findings i) support the association between apathy in aMCI and neural
changes in the right temporoparietal cortex, ii) suggest that the mechanisms for this
association involve changes in membrane structure (reduced Cho) and glial function
(reduced mI), and iii) indicate that neural changes in aMCI patients with and without
apathy may be distinct.
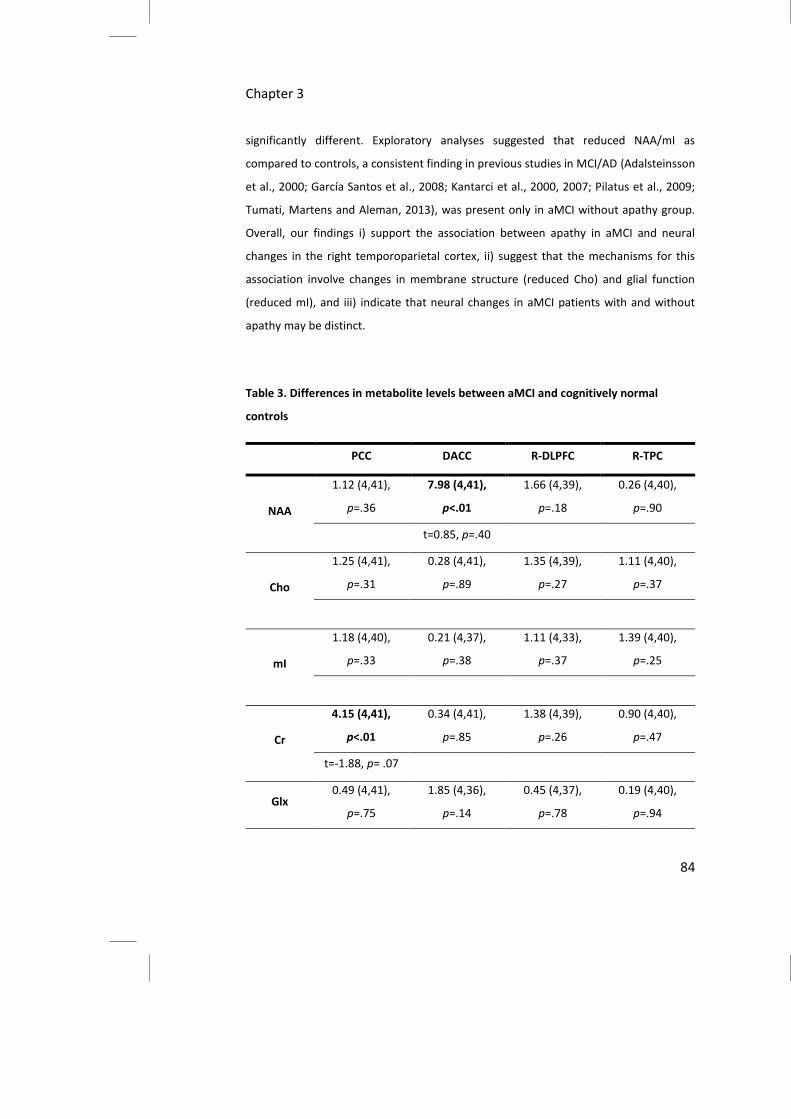
Table 3. Differences in metabolite levels between aMCI and cognitively normal
controls
PCC DACC R-DLPFC R-TPC
NAA
1.12 (4,41),
p=.36
7.98 (4,41),
p<.01
1.66 (4,39),
p=.18
0.26 (4,40),
p=.90
t=0.85, p=.40
Cho
1.25 (4,41),
p=.31
0.28 (4,41),
p=.89
1.35 (4,39),
p=.27
1.11 (4,40),
p=.37
mI
1.18 (4,40),
p=.33
0.21 (4,37),
p=.38
1.11 (4,33),
p=.37
1.39 (4,40),
p=.25
Cr
4.15 (4,41),
p<.01
0.34 (4,41),
p=.85
1.38 (4,39),
p=.26
0.90 (4,40),
p=.47
t=-1.88, p= .07
Glx 0.49 (4,41),
p=.75
1.85 (4,36),
p=.14
0.45 (4,37),
p=.78
0.19 (4,40),
p=.94

Chapter 3
85
NAA/mI
2.14 (4,40),
p=.09
0.27 (4,37),
p=.89
0.93 (4,33),
p=.46
1.23 (4,40),
p=.31
Numbers given are the value of F-test of ANCOVA for group differences and
(uncorrected) significance values with fraction of CSF and WM, and GDS-non apathy
score as covariates. When significant, the value of the t-test for difference between
aMCI and control groups is given along with significance.
4.1. Neural mechanisms of apathy
Apathy develops in a substantial proportion of patients with MCI (Lyketsos et
al., 2002; Peters et al., 2012; Di Iulio et al., 2010; Geda et al., 2008). Due to its influence
on the disease course and lack of adequate treatments, renewed emphasis has been laid
on understanding its neural mechanisms (Lanctôt et al., 2016; Rosenberg, Nowrangi and
Lyketsos, 2015). Previous studies have linked atrophy, reduced functional connectivity,
and reduced metabolism in the TPC with apathy (Donovan et al., 2014; Gatchell et al.,
2017; Munro et al., 2015). Findings from the current study support this association
between changes in TPC in aMCI patients and apathy. The DACC and adjacent medial
frontal regions, previously reported to be associated with apathy (Marshall et al., 2007;
Tekin et al., 2001) showed only a weak association in our exploratory analyses.
Furthermore, apathy scores were not correlated with metabolite levels in the DLPFC,
which is hypothesized to mediate cognitive subtype of apathy (Levy and Dubois, 2006),
or the PCC, in which consistent changes in metabolite levels in AD/MCI patients were
reported in previous studies (Catani et al., 2001; Kantarci et al., 2000). Thus, in this first
1H-MRS study of all cortical regions implicated in apathy, only neural changes in the TPC
were found to have a moderate-to-strong association with apathy in aMCI.
The reduction in Cho and mI levels in association with apathy may have
resulted from atrophy in the TPC. This interpretation is supported by studies that report
atrophy in the TPC to be a consistent feature in AD patients (Bell-McGinty et al., 2005;

Chapter 3
86
Chételat et al., 2005), and have also specifically associated atrophy in this region with
apathy symptoms (Donovan et al., 2014; Guercio et al., 2015). However, as the CSF and
white matter content in the voxels were controlled for in the analyses, this explanation
for the results may be less likely. Moreover, the concentration of NAA in this region,
which indicates neuronal viability, was also not reduced as compared to the control
group or correlated with the apathy score. Another possibility may be that lower Cho
levels are indicative of reduced cholinergic neurotransmission (Duarte et al., 2012). This
interpretation is in line with pharmacological studies where drugs that increase the
availability of acetylcholine were found to be beneficial for apathy in AD (Berman et al.,
2012). However, not all studies find such an effect (Harrison, Aerts and Brodaty, 2016).
The lack of unequivocal findings may be attributed to study limitations such as apathy
commonly being a secondary outcome measure and assessed with the neuropsychiatric
inventory (Harrison, Aerts and Brodaty, 2016), which has only a single item for assessing
apathy (Cummings et al., 1994). Nevertheless, atrophy of the nucleus basalis of Meynert,
which provides cholinergic innervation to the entire cortex, is known to occur early in
the course of AD (Bartus et al., 1982; Grothe, Heinsen and Teipel, 2012). However, it is
not clear if this atrophy is associated with specific behavioral symptoms of AD. Taken
together, multiple lines of evidence suggest cholinergic dysfunction as a putative
mechanism for apathy that should be evaluated especially in early stages of AD.
4.2. Early apathy: a distinct mechanism?
The ratio of NAA/mI in the PCC on 1H-MRS is a proposed biomarker for the
diagnoses of AD as it is found to be reduced in AD, MCI, and high risk cognitively normal
older adults, as compared with matched controls (Miller et al., 1993; Shonk et al., 1995;
Kantarci et al., 2007). Moreover, this ratio was found to gradually decline with disease
progression (Schott et al., 2010), and was also associated with neuropathological and
CSF features of AD (Kantarci et al., 2008; Murray et al., 2014; Gomar et al., 2014).
Although based on limited evidence, the TPC in AD may be incur changes on 1H-MRS
similar to that in the PCC (Bittner, Heinze and Kaufmann, 2013). However, in the current
study, the ratio of NAA/mI in the PCC as well as the TPC was neither significantly lower
in aMCI patients as compared to controls nor was associated with apathy. Only patients

Chapter 3
87
with aMCI but not apathy were found to have a lower NAA/mI ratio in the PCC
(Supplementary table S1). This suggests that in those with aMCI and apathy, different
neural mechanisms may be affected than in aMCI or AD. Future research should
elucidate this relationship between impairments in cognition and behavior.
Clinically diagnosed aMCI is considered to be a precursor stage for AD, though
the broad criteria may result in considerable heterogeneity in terms of progression to
AD (Petersen et al., 2009), and indeed a substantial number of cases do not progress to
AD (Mitchell and Shiri-Feshki, 2009). In cognitively normal older adults, development of
apathy confers an increased risk of developing AD (Geda et al., 2014; Onyike et al., 2007).
Our results raise the possibility that such individuals may harbor neural changes in the
TPC. In such cohorts, the underlying neuropathology may also differ (Saito, Yamamoto
and Ihara, 2015). Toledo and colleagues (Toledo et al., 2013) found that in those with
clinical diagnosis of AD or MCI, AD pathology was coincidental in about 40% of subjects
with other pathologies such as dementia with Lewy bodies, hippocampal sclerosis, TDP-
43 proteinopathy, argyrophilic grain disease and vascular pathology. Similar findings
were also reported in independent cohorts (White et al., 2016). In light of these reports,
associations between apathy and metabolites in the TPC but not in the PCC suggest that
apathy may emerge from pathologies other than those strictly limited to AD proper. This
interpretation would imply that in those with aMCI and apathy, memory decline occurs
due to impaired TPC function while PCC function remains intact. These suggestions need
to be evaluated in larger studies.
4.3. Assessment of apathy in aMCI
Our results also suggest that detailed evaluation of neuropsychiatric symptoms (NPS)
like apathy and depression is of value. The co-morbidity of depression vis-à-vis apathy
has been previously reported. Studies have also suggested that the neural correlates of
the two syndromes may differ. In the current study, the AES and GDS scores were found
to be correlated, and this correlation was reduced after excluding items on the GDS that
were previously found to be related to apathy. Moreover, the exploratory analyses,
while performed in a small sample, suggested that apathy and depression may be
associated with divergent changes in Glx levels in the DACC (Fig. 2C & 2D). Although this

Chapter 3
88
result needs to be replicated in a well-powered study, it suggests that the DACC may be
involved in apathy as well as depression. This finding provides a possible basis for
overlapping brain changes in the two behavioral syndromes. Furthermore, the results
also suggest that apathy may emerge from multiple routes (DACC and TPC) in AD.
Assessments with dimensional scales will be useful for analyzing links between the
subtypes of apathy and neural mechanisms. As NPS have a substantial influence on
disease progression, functional abilities, and need for care, understanding the neural
basis of individual NPS is required. The above findings demonstrate that detailed
assessments of NPS contribute towards understanding the neural changes in older adults
with memory deficits.
4.4. Limitations
While interpreting the results, the limitations of this study need to be
considered. CSF or PET markers of AD were not available in our sample of aMCI subjects.
As a result, we could not examine if the aMCI with and without apathy groups also had
different CSF and PET biomarker profiles. Such data could be used to evaluate our
interpretation that the two groups harbored distinct neural changes. The sample size of
the aMCI with apathy group was relatively small. However, the incidence of apathy in
very early stages of MCI (between 5-15%) makes inclusion of large samples with apathy
difficult (Geda et al., 2008; Onyike et al., 2007; Lyketsos et al., 2002; Peters et al., 2012).
Lastly, spectra were only acquired from the right side of the brain for the DLPFC and TPC.
Therefore, lateralization of brain changes in relation to apathy could not be evaluated.
Despite these limitations, this first MRS study of apathy in aMCI patients has provided
novel findings regarding the neural mechanisms of apathy. Furthermore, apathy was
assessed using the AES in cohort with relatively intact cognitive function, minimizing the
likelihood of other comorbid symptoms. This study also examined metabolite changes in
all regions hypothesized to be associated with apathy.
In conclusion, in a clinically diagnosed aMCI cohort, apathy symptoms may be
suggestive of distinct neural changes from those in aMCI without apathy. The TPC may
be a key region for the neural correlates of apathy as indicated by reduced Cho and mI
levels indicative of alterations in membranal and glial function. Our tentative finding

Chapter 3
89
suggesting different glutamatergic changes in the DACC for apathy versus depression
needs further investigation. MRS at higher field strengths (e.g., 7T) may also yield
additional insights into neurometabolite correlates of apathy.

Ch
apte
r 3
90
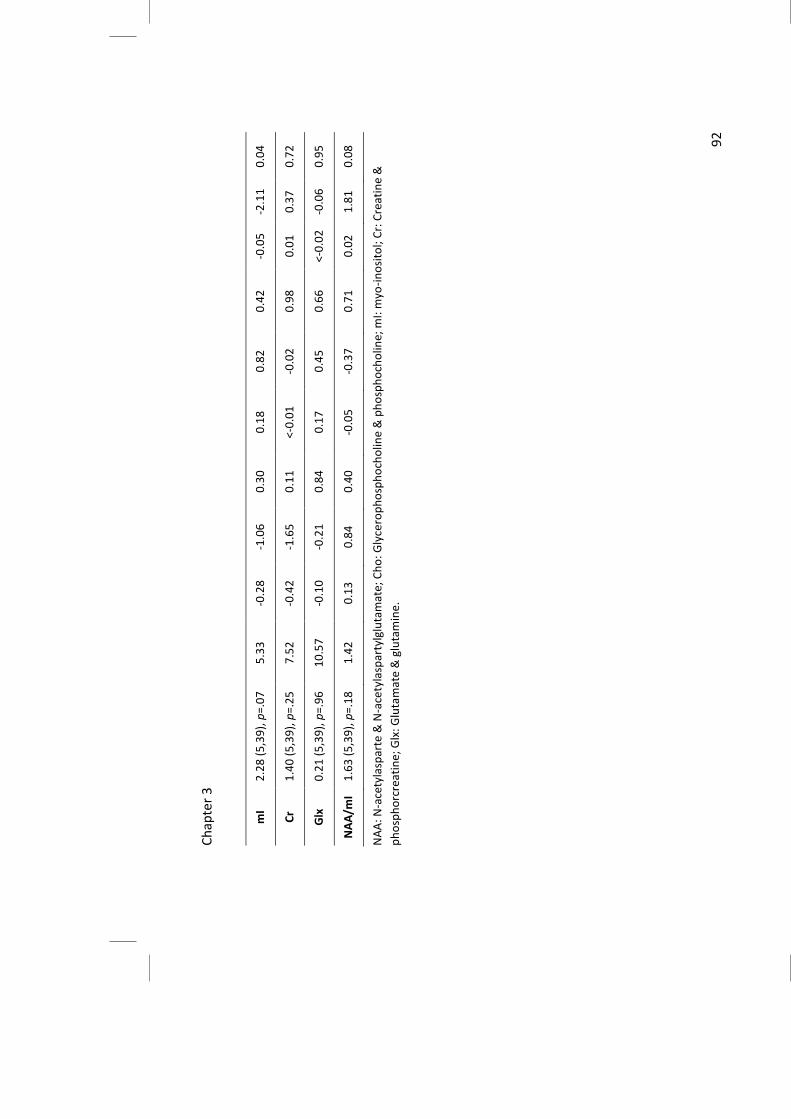
Su
pp
lem
en
tary
Ta
ble
S1
: R
esu
lts
of
exp
lora
tory
an
alys
es
of
me
tab
olit
es
in e
ach
re
gio
ns
and
dia
gno
stic
gro
up
s, d
ep
ress
ion
sco
res
(GD
S-
no
n a
pa
thy
sco
res)
, an
d p
rop
ort
ion
of
wh
ite
ma
tte
r an
d C
SF in
th
e v
oxe
l. T
ab
le s
ho
ws
ove
rall
test
fo
r m
od
el (
F (d
f), p
) an
d
un
sta
nd
ard
ize
d c
oe
ffic
ien
ts (β
), t
-val
ue
s an
d s
ign
ific
ance
val
ue
s fo
r va
ria
ble
s o
f in
tere
st.
aM
CI w
ith
ap
ath
y vs
co
ntr
ols
aM
CI w
ith
ou
t a
pat
hy
vs c
on
tro
ls
GD
S-n
on
ap
ath
y
F
(df)
, p
Inte
rce
pt
β
t p
β
t
p
β
t p
Po
ste
rio
r C
ingu
late
Co
rte
x
NA
A
0.9
0 (
5,4
0),
p=.
49
9
.82
-0
.19
-0
.59
0
.56
-0
.31
-1
.36
0
.18
0
.04
1
.40
0
.17
Ch
o
1.0
6 (
5,4
0),
p=.
39
1
.52
-0
.09
-1
.18
0
.25
-0
.04
-0
.80
0
.43
0
.01
1
.18
0
.25
mI
1.3
3 (
5,3
9),
p=.
27
5
.46
-0
.12
-0
.43
0
.67
0
.23
1
.15
0
.26
-0
.03
-1
.10
0
.28
Cr
3.2
4 (
5,4
0),
p=.
02
7
.35
-0
.25
-1
.28
0
.21
-0
.24
-1
.78
0
.08
0
.05
2
.96
<0
.01
*
Glx
0
.39
(5
,40
), p
=.8
5
12
.04
0
.10
0
.15
0
.88
-0
.03
-0
.06
0
.95
0
.05
0
.78
0
.44
NA
A/m
I 2
.47
(5
,39
), p
<.0
5
1.9
5
0.0
1
0.1
1
0.9
1
-0.1
9
-2.2
0
0.0
3*
0.0
2
2.2
0
0.0
3
Do
rsal
an
teri
or
cin
gula
te c
ort
ex
NA
A
6.3
2 (
5,4
0),
p<.
01
9
.32
0
.38
0
.91
0
.37
0
.19
0
.70
0
.49
-0
.02
-0
.44
0
.66

Ch
apte
r 3
91
Ch
o
0.4
2 (
5,4
0),
p=.
83
1
.94
-0
.08
-0
.34
0
.74
0
.14
0
.87
0
.39
-0
.01
-0
.37
0
.71
mI
0.1
9 (
5,3
6),
p=.
96
5
.67
0
.37
0
.27
0
.79
0
.86
0
.96
0
.35
-0
.03
-0
.29
0
.78
Cr
0.5
9 (
5,4
0),
p=.
70
6
.28
-0
.24
-0
.32
0
.75
0
.64
1
.30
0
.20
-0
.02
-0
.26
0
.80
Glx
3
.03
(5
,35
), p
=.0
2
16
.19
5
.09
2
.62
0
.01
* 0
.34
0
.26
0
.80
-0
.35
-0
.16
0
.03
*
NA
A/m
I 0
.26
(5
,36
), p
=.9
3
1.6
3
-0.1
6
-0.6
1
0.5
5
-0.0
5
-0.2
6
0.8
0
0.0
1
0.5
6
0.6
8
Rig
ht
do
rso
late
ral p
refr
on
tal c
ort
ex
NA
A
1.5
8 (
5,3
8),
p=.
19
1
1.8
3
-0.4
9
-0.6
7
0.5
1
0.1
8
0.3
6
0.7
2
-0.1
0
-1.6
4
0.1
1
Ch
o
1.5
4 (
5,3
8),
p=.
20
1
.70
-0
.29
-2
.01
0
.05
-0
.20
-1
.94
0
.06
0
.01
0
.70
0
.49
mI
0.5
1 (
5,3
2),
p=.
77
3
.25
-0
.27
-0
.47
0
.64
-0
.37
-0
.99
0
.33
<-
0.0
1
-0.0
8
0.9
4
Cr
1.1
6 (
5,3
8),
p=.
35
7
.56
-0
.72
-1
.81
0
.08
-0
.37
-1
.34
0
.19
0
.01
0
.23
0
.82
Glx
0
.62
(5
,36
), p
=.6
9
6.0
0
0.6
8
0.5
8
0.5
6
-0.6
0
-0.7
4
0.4
7
0.1
0
1.0
7
0.2
9
NA
A/m
I 0
.45
(5
,32
), p
=.8
1
3.0
7
0.1
9
0.6
9
0.5
1
0.2
0
1.0
9
0.2
9
<-0
.01
-0
.06
0
.95
Rig
ht
late
ral p
ari
eta
l co
rte
x
NA
A
0.4
0 (
5,3
9),
p=.
84
8
.69
-0
.13
-0
.46
0
.65
-0
.13
0
.62
0
.54
<0
.01
0
.06
0
.95
Ch
o
1.6
5 (
5,3
9),
p=.
17
1
.39
-0
.12
-1
.54
0
.13
0
.02
0
.29
0
.77
<0
.01
0
.44
0
.67
Ch
apte
r 3
92
N
AA
: N-a
cety
lasp
arte
& N
-ace
tyla
spar
tylg
luta
mat
e; C
ho
: Gly
cero
ph
osp
ho
cho
line
& p
ho
sph
och
olin
e; m
I: m
yo-i
no
sito
l; C
r: C
reat
ine
&
ph
osp
ho
rcre
atin
e; G
lx: G
luta
mat
e &
glu
tam
ine.
mI
2.2
8 (
5,3
9),
p=.
07
5
.33
-0
.28
-1
.06
0
.30
0
.18
0
.82
0
.42
-0
.05
-2
.11
0
.04
Cr
1.4
0 (
5,3
9),
p=.
25
7
.52
-0
.42
-1
.65
0
.11
<-
0.0
1
-0.0
2
0.9
8
0.0
1
0.3
7
0.7
2
Glx
0
.21
(5
,39
), p
=.9
6
10
.57
-0
.10
-0
.21
0
.84
0
.17
0
.45
0
.66
<-
0.0
2
-0.0
6
0.9
5
NA
A/m
I 1
.63
(5
,39
), p
=.1
8
1.4
2
0.1
3
0.8
4
0.4
0
-0.0
5
-0.3
7
0.7
1
0.0
2
1.8
1
0.0
8