university of groningen metabolomics and bioanalysis of ... · 209653-l-sub01-bw-muntendam 51...
TRANSCRIPT

University of Groningen
Metabolomics and bioanalysis of terpenoid derived secondary metabolitesMuntendam, Remco
IMPORTANT NOTE: You are advised to consult the publisher's version (publisher's PDF) if you wish to cite fromit. Please check the document version below.
Publication date:2015
Link to publication in University of Groningen/UMCG research database
Citation for published version (APA):Muntendam, R. (2015). Metabolomics and bioanalysis of terpenoid derived secondary metabolites:Analysis of Cannabis sativa L. metabolite production and prenylases for cannabinoid production.[Groningen].
CopyrightOther than for strictly personal use, it is not permitted to download or to forward/distribute the text or part of it without the consent of theauthor(s) and/or copyright holder(s), unless the work is under an open content license (like Creative Commons).
Take-down policyIf you believe that this document breaches copyright please contact us providing details, and we will remove access to the work immediatelyand investigate your claim.
Downloaded from the University of Groningen/UMCG research database (Pure): http://www.rug.nl/research/portal. For technical reasons thenumber of authors shown on this cover page is limited to 10 maximum.
Download date: 18-08-2019

209653-L-sub01-bw-Muntendam209653-L-sub01-bw-Muntendam209653-L-sub01-bw-Muntendam209653-L-sub01-bw-Muntendam
49
Chapter 4
Time-dependent metabolomics and
transcriptional analysis of cannabinoid
biosynthesis in Cannabis sativa var.
Bedrobinol and Bediol grown under
standardized condition and with genetic
homogeneity
Muntendam R., Happyana N., Erkelens T., Bruining F., Kayser O.: Online International
Journal of Medicinal Plants Research (2012) 1 (2): 31-40
http://www.onlineresearchjournals.org/OIJMPR

209653-L-sub01-bw-Muntendam209653-L-sub01-bw-Muntendam209653-L-sub01-bw-Muntendam209653-L-sub01-bw-Muntendam
50
Abstract
Cannabis sativa L. is mostly grown under non-standardized conditions resulting in high
fluctuations of cannabinoid contents. The exact measure of these metabolites is hampered as
most of the research has been conducted on seized, extracted or non-standardized cultivated
C. sativa L. material. In this report legal standardized cultivation of two C. sativa L.
chemotypes is investigated by HPLC-UV, qPCR and 1H-NMR, respectively during two
cultivation phases of 4 weeks each. Based on HPLC the cannabinoid spectrum over 4 week
cultivation period is monitored under specific light conditions and in correlation with the
expression profile of thca and cbda genes in both chemotypes. Cannabinoid accumulation is
observed specifically after shortening of the light period. Gene transcript based chemotyping
was only possible comparing the thca and cbda transcription level ratio at the middle of the
cultivation period, while at the end differences in gene transcription ratio diminished. 1H-
NMR results indicate a clear difference between both chemotypes and cultivation phases by
applying pattern recognition software.
The differences detected by using simple and non-destructive 1H-NMR were used to build a
model, which can be applied to chemotyping and cultivation phase separation using selective
1H-NMR signals.

209653-L-sub01-bw-Muntendam209653-L-sub01-bw-Muntendam209653-L-sub01-bw-Muntendam209653-L-sub01-bw-Muntendam
51
Introduction
Cannabis sativa L. is usually an annual, dioecious, herbaceous plant, even though records of
monoecious C. sativa L. do exist [140, 141]. For over a thousand years, C. sativa L. is
considered a multifunctional plant and, historically, it is used for the production of fiber and
nutritional oils [142-145]. It is suggested to be one of the oldest cultivars grown by mankind
[146]. More recently, the plant has been used and studied for medicinal purposes. Due to
abuse of the plant for recreational purposes, cultivation of C. sativa L. varieties has been
exclusively allowed to licensed cultivators.
Among the 109 cannabinoids known [59, 60], the biosynthetic pathway has only been
elucidated for the major cannabinoids. In Figure 1 the biosynthesis of cannabigerolic acid
(CBGA, 1.3), cannabidiolic acid (CBDA, 1.4), Δ9-tetrahydrocannabinolic acid (Δ
9-THCA,
1.6) and cannabichromenic acid (CBCA, 1.5) from the precursors geranyl diphosphate (GPP,
1.1) and olivetolic acid (OA, 1.2) is depicted [85, 94, 105, 110, 112, 114, 147-149]. The four
major cannabinoids (CBGA, CBDA, CBCA and Δ9-THCA) are naturally produced in their
acidic form and represent the dominant fraction of cannabinoids within C. sativa L.
Generally, CBDA and Δ9-THCA occur at higher concentrations than the others. Based on
these two metabolites, a chemotype separation for legal and agricultural purposes has been
proposed by the United Nations Office of Drugs and Crime (UNODC). Chemotype class I
contains typically plants with a high content of Δ9-THCA and a low content of CBDA, and is
considered the drug-type (ratio >>1). Chemotype class III encompasses plants with high
amounts of CBDA and a relatively low amount of Δ9-THCA (fiber-type plants, ratio <<1),
commonly referred to as hemp. Chemotype class II consists of plants with a near to equal
amount of Δ9-THCA and CBDA (ratio between 0.5-2) [141].
Recently, several groups worldwide have evaluated the pharmacological activity of the
cannabinoids present in all three chemotypes demonstrating their medicinal value. Whereas
metabolites isolated from class I and II (high content of Δ9-THCA), are effective in pain and
spasm reduction in multiple sclerosis patients [150, 151], metabolites from chemotype III
plants (high content of CBDA) display anxiolytic and antipsychotic effects [152-154]. Even
though proof on individual cannabinoids has been provided, the symmetric effect provided by
the usage of plant material (combined effect of all metabolites) seems to reduce most of the
side effects obtained with individual cannabinoids [155, 156].
Due to the pharmacological activities a large civilian movement is rising aiming to help
decriminalizing the medicinal use of C. sativa L. in an increasing number of countries over

209653-L-sub01-bw-Muntendam209653-L-sub01-bw-Muntendam209653-L-sub01-bw-Muntendam209653-L-sub01-bw-Muntendam
52
the world. Within The Netherlands, the medicinal use of C. sativa L. has been approved by
the government thereby, allowing its consumption upon prescription. Since 2005 the Ministry
of Health, Welfare and Sport has created an office for medicinal cannabis [157], which
appointed one single company for the controlled cultivation of C. sativa L. [73].
Their strictly controlled environment offers the perfect conditions to study cannabinoid
production within a genetically homogeneous plant population. Standardized parameters
enhance the reproducibility of the results in independent experiments allowing an excellent
comparison within C. sativa L. varieties. In this study, two C. sativa L. chemotype classes (I
and II), originated from clonal individuals, were chosen for analyses. This report investigates
the establishment of chemotype differences between these varieties during cultivation using
1H-NMR metabolomics and cbda / thca gene transcription profiles. Additionally, HPLC-UV
analyses were performed to further confirm 1H-NMR data and to compare our results with
previously reported chemotype differences.
Figure 1: Biosynthesis of the major cannabinoids found within C. sativa L. according to [94]. (a)
Cannabigerolic acid synthase (GOT) [105], (b) THCA synthase [85, 110, 127, 148, 149], (c) CBDA synthase
[114] and (d) CBCA synthase [112]. The numbers below the compounds can be found within the second
paragram of the introduction.

209653-L-sub01-bw-Muntendam209653-L-sub01-bw-Muntendam209653-L-sub01-bw-Muntendam209653-L-sub01-bw-Muntendam
53
Results and Discussion
Metabolome analysis for different chemotype varieties:
1H-NMR is intensively employed to discriminate between plant varieties on the basis of
metabolites [158-161]. Here 1H-NMR was applied to examine metabolic differences between
cultivation phase and chemotype on clones prepared from C. sativa var. Bedrobinol
(chemotype I) and var. Bediol (chemotype II). Each cultivation phase is characterized by a
difference in hours of light exposure. The first phase (week 1-4) represents long days (18h of
light), while the second (week 5-8) reflects short days (12h of light). To explore the potential
of 1H-NMR to discriminate between the different chemotypes, a Principal Component
Analysis (PCA) was performed. Identification of interesting signals occurred by using the
orthogonal partial least squares (OPLS) analysis. Prior to analysis, raw data were corrected
for the internal control (anthracene), followed by bucketing of the data and subsequently
scaled according to the Pareto procedure [162, 163].
The complete PCA model consisted in a total of seven principle compartments (PCs), with the
first three explaining 91.3 % of the variation within the data. The predictability of the model,
set by the goodness of the fit, was found to be reliable (87.1 %) when obtained for the first
three compartments. Visual analysis of the scatter plot (Figure 2A) revealed that PC1 and
PC2 alone were responsible for the differentiation between the two chemotypes and the two
cultivation phases. In particular, PC1 was responsible for the separation of cultivation phases
whereas PC2 was responsible for the chemotype separation. The two compartments (PC1 and
PC2) explained 85.2 % of the variation within the data, with a predictability of 82.3 %
demonstrating the reliability of the model.
A more detailed analysis using a supervised method of pattern recognition based on the
Orthogonal Partial Least Squares (OPLS) algorithm (Figure 2B), indicated buckets
responsible for the discrimination between both, chemotypes and cultivation phases. The first
model was produced using Y = chemotype. This model explained a total of 94.2 % of the
variation within the data and 98.3 % of variation within Y. The model had a total
predictability of 96.9 %, confirming the reliability of the model. Even though the model could
explain 94.2 % of the variation within the data, only 15.2 % was correlated to the chemotype.
Four orthogonal compartments explained the remaining 79.1 %. The first compartment (66.1
%) is most likely explained by the separation between cultivation phases within the individual
C. sativa L. chemotype (Figure 2B). With the help of S-plot analysis (Figure 2C) the buckets
with the highest magnitude and reliability were selected and compared to the data from the
209653-L-sub01-bw-Muntendam209653-L-sub01-bw-Muntendam209653-L-sub01-bw-Muntendam209653-L-sub01-bw-Muntendam
54
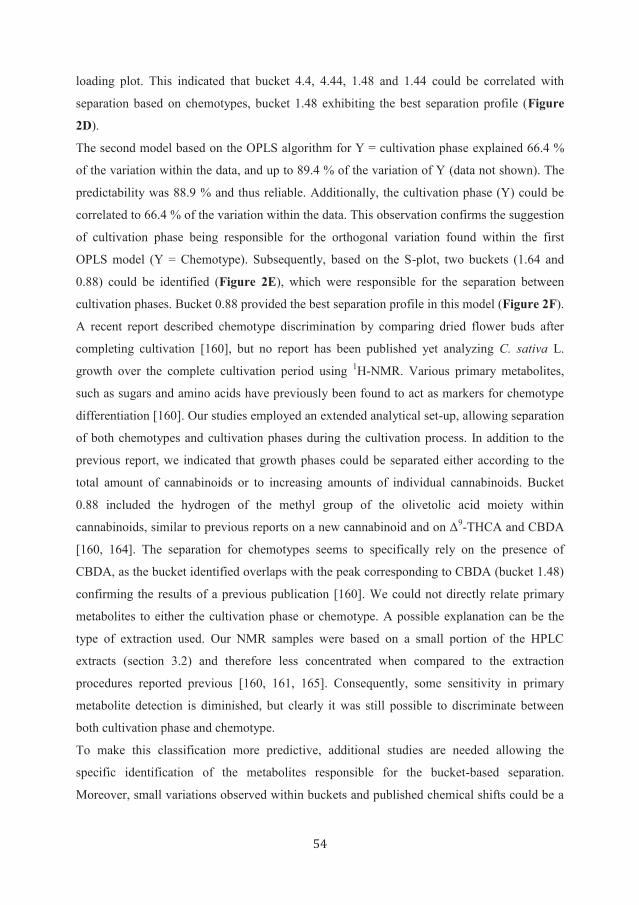
loading plot. This indicated that bucket 4.4, 4.44, 1.48 and 1.44 could be correlated with
separation based on chemotypes, bucket 1.48 exhibiting the best separation profile (Figure
2D).
The second model based on the OPLS algorithm for Y = cultivation phase explained 66.4 %
of the variation within the data, and up to 89.4 % of the variation of Y (data not shown). The
predictability was 88.9 % and thus reliable. Additionally, the cultivation phase (Y) could be
correlated to 66.4 % of the variation within the data. This observation confirms the suggestion
of cultivation phase being responsible for the orthogonal variation found within the first
OPLS model (Y = Chemotype). Subsequently, based on the S-plot, two buckets (1.64 and
0.88) could be identified (Figure 2E), which were responsible for the separation between
cultivation phases. Bucket 0.88 provided the best separation profile in this model (Figure 2F).
A recent report described chemotype discrimination by comparing dried flower buds after
completing cultivation [160], but no report has been published yet analyzing C. sativa L.
growth over the complete cultivation period using 1H-NMR. Various primary metabolites,
such as sugars and amino acids have previously been found to act as markers for chemotype
differentiation [160]. Our studies employed an extended analytical set-up, allowing separation
of both chemotypes and cultivation phases during the cultivation process. In addition to the
previous report, we indicated that growth phases could be separated either according to the
total amount of cannabinoids or to increasing amounts of individual cannabinoids. Bucket
0.88 included the hydrogen of the methyl group of the olivetolic acid moiety within
cannabinoids, similar to previous reports on a new cannabinoid and on Δ9-THCA and CBDA
[160, 164]. The separation for chemotypes seems to specifically rely on the presence of
CBDA, as the bucket identified overlaps with the peak corresponding to CBDA (bucket 1.48)
confirming the results of a previous publication [160]. We could not directly relate primary
metabolites to either the cultivation phase or chemotype. A possible explanation can be the
type of extraction used. Our NMR samples were based on a small portion of the HPLC
extracts (section 3.2) and therefore less concentrated when compared to the extraction
procedures reported previous [160, 161, 165]. Consequently, some sensitivity in primary
metabolite detection is diminished, but clearly it was still possible to discriminate between
both cultivation phase and chemotype.
To make this classification more predictive, additional studies are needed allowing the
specific identification of the metabolites responsible for the bucket-based separation.
Moreover, small variations observed within buckets and published chemical shifts could be a
209653-L-sub01-bw-Muntendam209653-L-sub01-bw-Muntendam209653-L-sub01-bw-Muntendam209653-L-sub01-bw-Muntendam
55
consequence of the differences in pH or solvents used during analysis and should
consequently be handled with caution in standardized procedures.
I
III
IV
II
I
II IV
III
I
III IV
II
A B
C
E
D
F
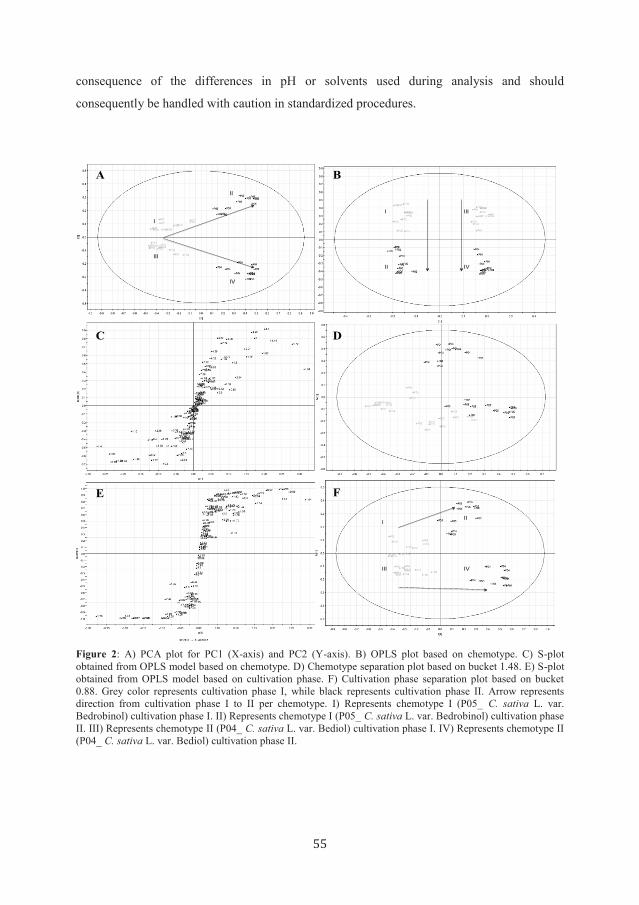
Figure 2: A) PCA plot for PC1 (X-axis) and PC2 (Y-axis). B) OPLS plot based on chemotype. C) S-plot
obtained from OPLS model based on chemotype. D) Chemotype separation plot based on bucket 1.48. E) S-plot
obtained from OPLS model based on cultivation phase. F) Cultivation phase separation plot based on bucket
0.88. Grey color represents cultivation phase I, while black represents cultivation phase II. Arrow represents
direction from cultivation phase I to II per chemotype. I) Represents chemotype I (P05_ C. sativa L. var.
Bedrobinol) cultivation phase I. II) Represents chemotype I (P05_ C. sativa L. var. Bedrobinol) cultivation phase
II. III) Represents chemotype II (P04_ C. sativa L. var. Bediol) cultivation phase I. IV) Represents chemotype II
(P04_ C. sativa L. var. Bediol) cultivation phase II.

209653-L-sub01-bw-Muntendam209653-L-sub01-bw-Muntendam209653-L-sub01-bw-Muntendam209653-L-sub01-bw-Muntendam
56
Cannabinoid profiling of selected C. sativa L. chemotype varieties:
The cannabinoid profile was quantified by employing HPLC-UV. The profile was recorded
during the cultivation period and for every sample individually. Although similar reports have
been published recently [166, 167], a difference exists between cultivation conditions and
genetic background of the analyzed plant varieties. Therefore it was needed to confirm both
the cannabinoid profile and the chemotype development.
Figure 3 represents the accumulation of all measured cannabinoids within both chemotypes
and during the complete cultivation (week 1-8). During the first cultivation phase (week 1-4)
the total cannabinoid content exhibited low variation as indicated by the absence of
significant differences within and between the two chemotypes. As predicted by the 1H-NMR
model provided above, the total amount of cannabinoids increased within both chemotype
varieties during the second cultivation phase. The variance however, was only significant
when comparing the first and second cultivation phase (p<<0.001). The observed results
reveal a higher cannabinoid content within the last weeks of cultivation and can be explained
by the previously reported increase in glandular trichome during flower development [87,
168-171]. It has been known that cannabinoid accumulate within the secretory cavity of the
glandular trichome, especially the capitate-stalked trichome, and therefore an increase in
trichome leads to an increase in cannabinoids.
Figure 3: Total measured cannabinoid accumulation over the complete cultivation period (per week). Grey bars
represent the chemotype II C. sativa L. var. Bediol and black bars represent chemotype I C. sativa L. var.
Bedrobinol. Percentage is calculated as mg total cannabinoid per 100 mg of dried C. sativa L. flower material
and represents the sum of all measured cannabinoids per week. Error bars for HPLC data are given as standard
deviation.
The chemotype varieties were further analyzed to spot time-dependent differences on the
pattern of individual cannabinoids. Only Δ9-THCA and CBDA (Figure 4A and B) were
209653-L-sub01-bw-Muntendam209653-L-sub01-bw-Muntendam209653-L-sub01-bw-Muntendam209653-L-sub01-bw-Muntendam
57
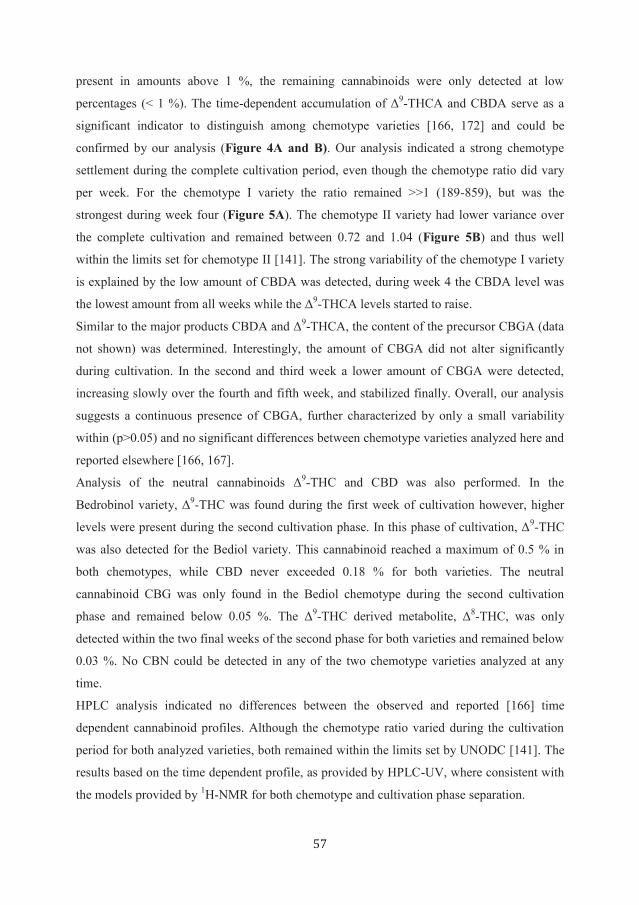
present in amounts above 1 %, the remaining cannabinoids were only detected at low
percentages (< 1 %). The time-dependent accumulation of Δ9-THCA and CBDA serve as a
significant indicator to distinguish among chemotype varieties [166, 172] and could be
confirmed by our analysis (Figure 4A and B). Our analysis indicated a strong chemotype
settlement during the complete cultivation period, even though the chemotype ratio did vary
per week. For the chemotype I variety the ratio remained >>1 (189-859), but was the
strongest during week four (Figure 5A). The chemotype II variety had lower variance over
the complete cultivation and remained between 0.72 and 1.04 (Figure 5B) and thus well
within the limits set for chemotype II [141]. The strong variability of the chemotype I variety
is explained by the low amount of CBDA was detected, during week 4 the CBDA level was
the lowest amount from all weeks while the Δ9-THCA levels started to raise.
Similar to the major products CBDA and Δ9-THCA, the content of the precursor CBGA (data
not shown) was determined. Interestingly, the amount of CBGA did not alter significantly
during cultivation. In the second and third week a lower amount of CBGA were detected,
increasing slowly over the fourth and fifth week, and stabilized finally. Overall, our analysis
suggests a continuous presence of CBGA, further characterized by only a small variability
within (p>0.05) and no significant differences between chemotype varieties analyzed here and
reported elsewhere [166, 167].
Analysis of the neutral cannabinoids Δ9-THC and CBD was also performed. In the
Bedrobinol variety, Δ9-THC was found during the first week of cultivation however, higher
levels were present during the second cultivation phase. In this phase of cultivation, Δ9-THC
was also detected for the Bediol variety. This cannabinoid reached a maximum of 0.5 % in
both chemotypes, while CBD never exceeded 0.18 % for both varieties. The neutral
cannabinoid CBG was only found in the Bediol chemotype during the second cultivation
phase and remained below 0.05 %. The Δ9-THC derived metabolite, Δ
8-THC, was only
detected within the two final weeks of the second phase for both varieties and remained below
0.03 %. No CBN could be detected in any of the two chemotype varieties analyzed at any
time.
HPLC analysis indicated no differences between the observed and reported [166] time
dependent cannabinoid profiles. Although the chemotype ratio varied during the cultivation
period for both analyzed varieties, both remained within the limits set by UNODC [141]. The
results based on the time dependent profile, as provided by HPLC-UV, where consistent with
the models provided by 1H-NMR for both chemotype and cultivation phase separation.

209653-L-sub01-bw-Muntendam209653-L-sub01-bw-Muntendam209653-L-sub01-bw-Muntendam209653-L-sub01-bw-Muntendam
58
0.0000001
0.000001
0.00001
0.0001
0.001
0.01
0.1
1
10
0
5
10
15
20
25
30
1 2 3 4 5 6 7 8
Rela
tiv
e e
xp
ressio
n(L
og
!C
t)
% o
f D
ry w
eig
ht
Week
Bediol THCA
Bedrobinol THCA
mRNA thca Bediol
mRNA thca
Bedrobinol
0.0000001
0.000001
0.00001
0.0001
0.001
0.01
0.1
1
10
0
5
10
15
20
25
30
1 2 3 4 5 6 7 8
Rela
tiv
e e
xp
ressio
n(L
og
!C
t)
% o
f D
ry w
eig
ht
Week
Bediol CBDA
Bedrobinol
CBDA
mRNA cbda
Bediol
mRNA cbda
Bedrobinol
A B
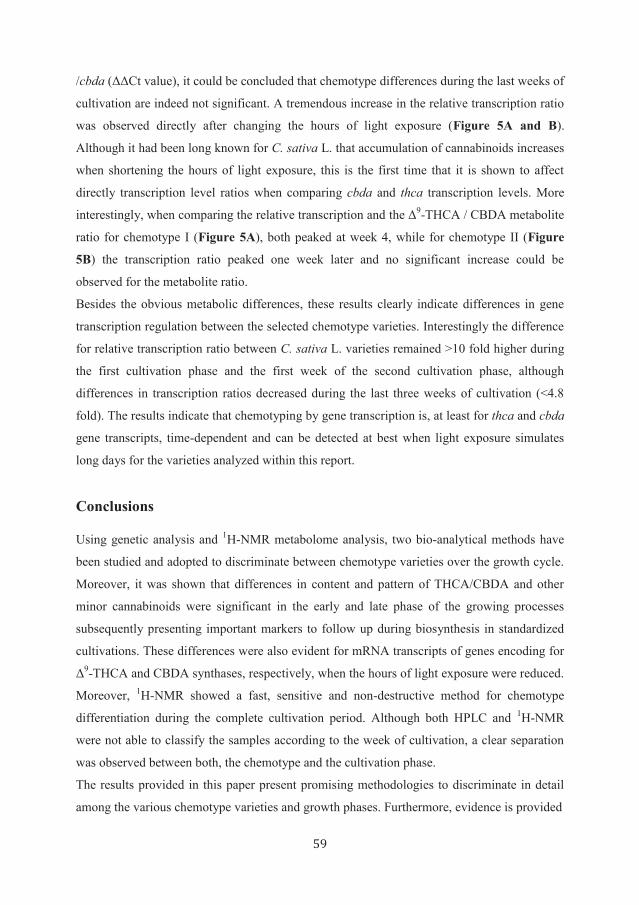
Figure 4: A) Representative data for Δ9-THCA metabolite and gene. B) Represent data for CBDA metabolite
and gene. Grey bars represent the chemotype II C. sativa L. var. Bediol and black bars represent chemotype I C.
sativa L. var. Bedrobinol. The percentage is calculated as mg of cannabinoid per 100 mg of dried C. sativa L.
flower material per week. The relative expression (2-Ct
) is calculated by correcting the measured Ct values to S18
RNA using the ΔCt method. No thca transcription was detected in C. sativa L. var. Bedrobinol week 2 and no
cbda within same variety for week 2 and 3. Error bars for HPLC data are given as standard deviation, while error
bars for qPCR are represented by upper and lower limits.
Transcript analysis:
The analysis described in above, indicated that total cannabinoids, for the analyzed varieties,
are dominated by both Δ9-THCA and CBDA content. Consequently, these metabolites are
used in chemotyping of the C. sativa L. varieties [141]. Previously, it has been reported that
C. sativa L. chemotype profiles are dependent on the genomic Bt / Bd loci [124, 140, 173],
representing the thca and cbda gene location, respectively. Here we report the transcript
analysis of these two loci for the selected chemotype varieties during the complete cultivation.
Gene transcription varied tremendously between the weeks of cultivation, as shown in Figure
4A and 4B. Overall, gene transcription of cbda was lower than that of the thca gene, a
surprising fact taking the chemotype differences obtained by HPLC-UV and 1H-NMR into
consideration. Although a very low relative transcription levels of the cbda gene was
predicted for chemotype I, a near to equal transcription level was expected for the chemotype
II variety. Transcription of cbda in chemotype I was both lower than cbda transcription in
chemotype II and than thca transcription levels in chemotype I. Nevertheless within both
varieties the gene transcription profiles followed the same course, but differ between the two
varieties. These observations indicate the presence of both the Bt and the Bd loci, and suggest
that the chemotype dependent gene transcription for both thca and cbda is controlled by
transcriptional regulation for, at least, the analyzed varieties.
In a recent report, a similar analysis was conducted [174]. Here the authors analyzed thca
transcription levels in C. sativa L. flower material after cultivation ended. No chemotype
differences were observed even when comparing to various endogenous controls (i.e.
chalcone synthase, rubisco and 26S rRNA) [174]. Our analysis provides the possibility to
analyze the transcription ratio per week. By obtaining the relative transcription between thca
209653-L-sub01-bw-Muntendam209653-L-sub01-bw-Muntendam209653-L-sub01-bw-Muntendam209653-L-sub01-bw-Muntendam
59
/cbda (ΔΔCt value), it could be concluded that chemotype differences during the last weeks of
cultivation are indeed not significant. A tremendous increase in the relative transcription ratio
was observed directly after changing the hours of light exposure (Figure 5A and B).
Although it had been long known for C. sativa L. that accumulation of cannabinoids increases
when shortening the hours of light exposure, this is the first time that it is shown to affect
directly transcription level ratios when comparing cbda and thca transcription levels. More
interestingly, when comparing the relative transcription and the Δ9-THCA / CBDA metabolite
ratio for chemotype I (Figure 5A), both peaked at week 4, while for chemotype II (Figure
5B) the transcription ratio peaked one week later and no significant increase could be
observed for the metabolite ratio.
Besides the obvious metabolic differences, these results clearly indicate differences in gene
transcription regulation between the selected chemotype varieties. Interestingly the difference
for relative transcription ratio between C. sativa L. varieties remained >10 fold higher during
the first cultivation phase and the first week of the second cultivation phase, although
differences in transcription ratios decreased during the last three weeks of cultivation (<4.8
fold). The results indicate that chemotyping by gene transcription is, at least for thca and cbda
gene transcripts, time-dependent and can be detected at best when light exposure simulates
long days for the varieties analyzed within this report.
Conclusions
Using genetic analysis and 1H-NMR metabolome analysis, two bio-analytical methods have
been studied and adopted to discriminate between chemotype varieties over the growth cycle.
Moreover, it was shown that differences in content and pattern of THCA/CBDA and other
minor cannabinoids were significant in the early and late phase of the growing processes
subsequently presenting important markers to follow up during biosynthesis in standardized
cultivations. These differences were also evident for mRNA transcripts of genes encoding for
Δ9-THCA and CBDA synthases, respectively, when the hours of light exposure were reduced.
Moreover, 1H-NMR showed a fast, sensitive and non-destructive method for chemotype
differentiation during the complete cultivation period. Although both HPLC and 1H-NMR
were not able to classify the samples according to the week of cultivation, a clear separation
was observed between both, the chemotype and the cultivation phase.
The results provided in this paper present promising methodologies to discriminate in detail
among the various chemotype varieties and growth phases. Furthermore, evidence is provided

209653-L-sub01-bw-Muntendam209653-L-sub01-bw-Muntendam209653-L-sub01-bw-Muntendam209653-L-sub01-bw-Muntendam
60
Figure 5: Ratio analysis of the metabolites (Δ9-THCA/CBDA) and the relative transcription between cbda and
thca (2-(ΔΔCt)
shown per C. sativa L. variety. Y-axis (right) in logarithmic scale). A) Ratio analysis of chemotype I
C. sativa L. var. Bedrobinol. B) Ratio analysis of chemotype II C. sativa L. var. Bediol. No detectable
transcription ratio could be obtained for the chemotype I C. sativa L. var. Bedrobinol in week 2 and 3 due to an
absence of cbda transcripts. Error bars are defined by upper and lower limits for gene transcription and by SD
for metabolites.
for difference in transcriptional regulation between the analyzed chemotypes with different
genotype backgrounds. By changing light exposure hours, it is suggested that transcriptional
regulation is responsible for the differences occurring between chemotype varieties. Besides
the direct applicability of the reported methods by governmental institutions, our results
provide insights into the role of transcriptional gene regulation on the chemotype differences.
Material and methods
Chemicals and Reagents:
Cannabinoid reference compounds for delta-9-tetrahydrocannabinol (Δ9-THC), delta-8-
tetrahydrocannabinol (Δ8-THC), cannabigerol (CBG), cannabidiol (CBD), cannabichromene
(CBC), cannabinol (CBN), cannabinolic acid (CBNA), Δ-9-tetrahydrocannabinolic acid (Δ9-
THCA), cannabigerolic acid (CBGA) and cannabidiolic acid (CBDA) were purchased from
Prisna BV (Leiden, The Netherlands). All chemicals were purchased at Merck Biosolve Ltd
(Valkenswaard, The Netherlands) except for anthracene (Sigma Aldrich).
A
B

209653-L-sub01-bw-Muntendam209653-L-sub01-bw-Muntendam209653-L-sub01-bw-Muntendam209653-L-sub01-bw-Muntendam
61
Plant origin, cultivation and sampling:
Cannabis flos var. Bediol®
(P04_2008_1-24) and Cannabis flos var. Bedrobinol®
(P05_2008_1-24) were cultivated on Rockwool at Bedrocan BV (Veendam, The
Netherlands), under standardized conditions without using pesticides or heavy metals. All
plants grown were at the same room and exposed to equal conditions. All plants were exposed
to High Pressure Sodium (HPS) light and given an average of 20,550 lm/m2. When lights
were on, relative humidity was kept between 35-60 %, whereas without light, relative
humidity increased to 45-80 %. Humidity and temperature were controlled by an automated
climate control system. An automated watering system, employing a top dripping mechanism
was used to supply water and basic fertilizing nutrients to the plants. Clean air was used to
provide movement to the plants; the climate was tightly controlled. Air was taken from the
outdoor environment and filtered before being brought inside the cultivation room.
A standardized process of cutting rooting and stress recovery was applied for all plants,
followed by 4 weeks (Cultivation phase I) of long day (18h day, 6h night) and subsequently 4
weeks (Cultivation phase II) of short day simulation (12h day and night). Only cultivation
phase II and I were used for analysis. Sampling occurred once a week for over 8 weeks.
Plants were randomly chosen within the plant cultivation room and taken from the fourth
branch from the top. During cultivation phase I the young developing flowers were separated
and directly frozen in liquid nitrogen. During cultivation phase II, the flower buds were
separated in a similar manner as described for cultivation phase I. Flower development was
scored according to a previous report [175], flower during cultivation phase I scored 1- 4
[175]. Plant material was stored at -80°C until analysis.
Sample extraction for HPLC-UV and NMR analysis:
Plant specimens were crushed and homogenized in liquid nitrogen using a pestle and a
mortar. The pestle and the mortar were rinsed thoroughly between each sample. Samples were
divided for metabolite extraction and RNA extraction. Samples for RNA extraction were
stored at -80°C until further processing whereas samples for metabolite extraction were
exposed to 24h of freeze drying, allowing a reduction of 78.23 % ± 1.48 % (W/W). For
metabolite extractions about 100 mg of plant specimen was taken and 5 ml of HPLC grade
methanol was added. Samples were exposed to the following treatment for four times:
Methanol exposed samples were incubated for 10 min at room temperature under slight
shaking, followed by 10 min in a sonication bath (Branson 5210 Ultrasonic Bath, Gemini BV,
The Netherlands) and short centrifugation to collect plant specimen at the bottom of the tube.

209653-L-sub01-bw-Muntendam209653-L-sub01-bw-Muntendam209653-L-sub01-bw-Muntendam209653-L-sub01-bw-Muntendam
62
Methanol fractions were pooled for each sample in a volumetric flask and the total volume
adjusted to 25 mL after addition of 1 mg of anthracene as internal control. Extracts were
homogenized by shaking and stored at -20 °C. Before analysis extracts were allowed to warm
up to room temperature and filtered using a syringe filter (0.22 µm). The first 8 mL of the
filtered flow-through were discarded and only the last ± 2 mL used for HPLC analysis.
Samples were kept in the dark during the whole procedure.
HPLC-UV analysis:
HPLC analysis was performed using a Shimadzu-VP system (Shimadzu, ‘s-Hertogenbosch,
The Netherlands) consisting of a LC-10ATvp pump, a Kontron 360 auto sampler, a SPD-
M10Avp DAD detector, a DGU-20A5 degasser, a FCV-10ALvp low pressure gradient mixer,
a SCL-10Avp system controller, a FIAtron system CH-30 column heater (USA) and CLASS-
VP software, Version 6.12SP4. For separation a Gemini-NX C18 (4.6x150 mm, 3 µm,
Phenomenex) column combined with an Agilent Technologies Guard column C18 (4.6x12.5
mm, 5 µm) was used. An injection volume of 25 µL was used for all samples. When the
cannabinoid area under the curve (AUC) exceeded the linear range, set by external calibration
curves, injection was repeated using a smaller volume (5 µL). The mobile phase consisted of
Milli-Q (5% acetonitrile, phase A) and 95% acetonitrile (phase B), both acidified with 0.1 %
trifluoroacetic acid. The employed method consisted of 50 % phase B, increasing linearly
over 40 min to 60 % phase B. Thereafter, the gradient increased from 60 % to 80 % of phase
B in 10 min. The method ended with an equilibration step that returned the parameters to the
starting conditions within 2 min, and was maintained for 10 min before the next injection. All
peaks were analyzed at 225 nm and column temperature was kept constant at 35°C.
1H-NMR analysis:
For 1H-NMR analysis, 10 mL of extract was dried under a stream of nitrogen while keeping
samples on ice. The total weight was determined before suspension of the samples in 1 mL of
MeOH-d4. 1H-NMR spectra were recorded at 25°C on a 500 MHz Bruker DMX-600
spectrometer (Bruker, Karlsruhe, Germany) operating at a proton NMR frequency of 500.13
MHz. MeOH-d4 was used as the internal lock. Each 1H-NMR spectrum consisted of 128
scans requiring 10 min and 26 sec acquisition time using the following parameters: 0.16
Hz/point, pulse width (PW) = 30° (11.3 ms), and relaxation delay (RD) = 1.5 sec. A
presaturation sequence was used to suppress the residual H2O signal with low power selective
irradiation at the H2O frequency during the recycling delay. FIDs were Fourier transformed
209653-L-sub01-bw-Muntendam209653-L-sub01-bw-Muntendam209653-L-sub01-bw-Muntendam209653-L-sub01-bw-Muntendam
63
with LB = 0.3 Hz. The resulting spectra were manually phased and baseline corrected, and
calibrated using anthracene at 8.43 ppm (s), using R statistical software (version 2.14.0).
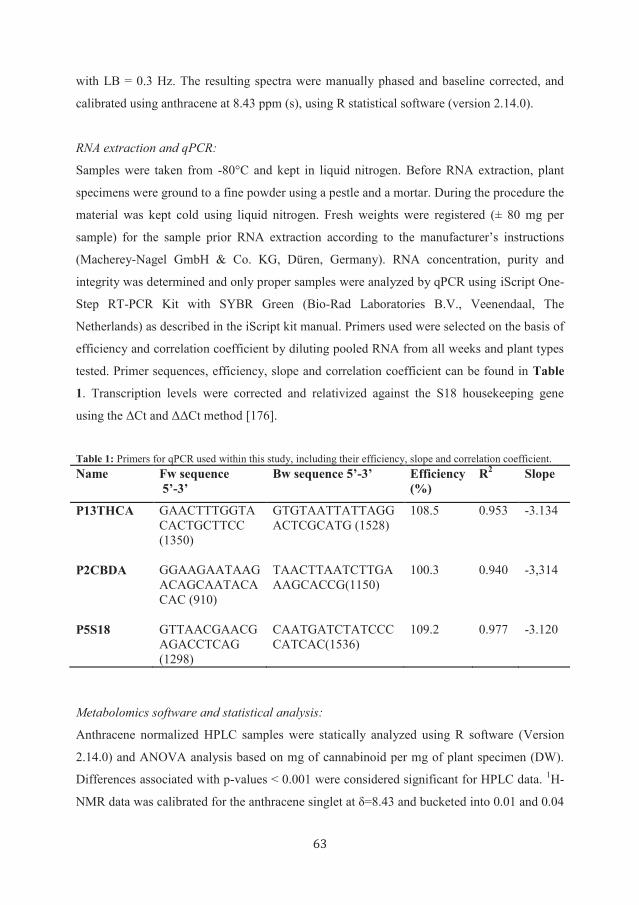
RNA extraction and qPCR:
Samples were taken from -80°C and kept in liquid nitrogen. Before RNA extraction, plant
specimens were ground to a fine powder using a pestle and a mortar. During the procedure the
material was kept cold using liquid nitrogen. Fresh weights were registered (± 80 mg per
sample) for the sample prior RNA extraction according to the manufacturer’s instructions
(Macherey-Nagel GmbH & Co. KG, Düren, Germany). RNA concentration, purity and
integrity was determined and only proper samples were analyzed by qPCR using iScript One-
Step RT-PCR Kit with SYBR Green (Bio-Rad Laboratories B.V., Veenendaal, The
Netherlands) as described in the iScript kit manual. Primers used were selected on the basis of
efficiency and correlation coefficient by diluting pooled RNA from all weeks and plant types
tested. Primer sequences, efficiency, slope and correlation coefficient can be found in Table
1. Transcription levels were corrected and relativized against the S18 housekeeping gene
using the ΔCt and ΔΔCt method [176].
Table 1: Primers for qPCR used within this study, including their efficiency, slope and correlation coefficient.
Name Fw sequence
5’-3’
Bw sequence 5’-3’ Efficiency
(%)
R2 Slope
P13THCA GAACTTTGGTA
CACTGCTTCC
(1350)
GTGTAATTATTAGG
ACTCGCATG (1528)
108.5 0.953 -3.134
P2CBDA GGAAGAATAAG
ACAGCAATACA
CAC (910)
TAACTTAATCTTGA
AAGCACCG(1150)
100.3 0.940 -3,314
P5S18 GTTAACGAACG
AGACCTCAG
(1298)
CAATGATCTATCCC
CATCAC(1536)
109.2 0.977 -3.120
Metabolomics software and statistical analysis:
Anthracene normalized HPLC samples were statically analyzed using R software (Version
2.14.0) and ANOVA analysis based on mg of cannabinoid per mg of plant specimen (DW).
Differences associated with p-values < 0.001 were considered significant for HPLC data. 1H-
NMR data was calibrated for the anthracene singlet at δ=8.43 and bucketed into 0.01 and 0.04

209653-L-sub01-bw-Muntendam209653-L-sub01-bw-Muntendam209653-L-sub01-bw-Muntendam209653-L-sub01-bw-Muntendam
64
ppm buckets. The area within 3-4 ppm was deleted due to the presence of the solvent peak
and other highly overlapping peaks. Data with chemical shifts bigger than 8.45 ppm was
discarded. Data was analyzed using Principal Component Analysis (PCA) and Orthogonal
Partial Least Squares (OPLS) algorithms using the SIMCA-P+ software (version 12.0.1). The
OPLS analysis was based on chemotype (Y1) and cultivation phase (Y2). Confidence limits
were set using Hotelling T2 (0.95) procedure according to SIMCA-P+ procedures.

209653-L-sub01-bw-Muntendam209653-L-sub01-bw-Muntendam209653-L-sub01-bw-Muntendam209653-L-sub01-bw-Muntendam
65

209653-L-sub01-bw-Muntendam209653-L-sub01-bw-Muntendam209653-L-sub01-bw-Muntendam209653-L-sub01-bw-Muntendam
66
“It is during our darkest moments that we must focus to see the light.”
- Aristotle Onassis