university of dundee bubble structure, stability and
TRANSCRIPT

University of Dundee
Bubble Structure, Stability and Rheology of Foamed Concrete
Jones, Martyn; Zheng, Li; Mohammad, Maziah
Published in:The 9th International Concrete Conference 2016
Publication date:2016
Document VersionPeer reviewed version
Link to publication in Discovery Research Portal
Citation for published version (APA):Jones, M., Zheng, L., & Mohammad, M. (2016). Bubble Structure, Stability and Rheology of Foamed Concrete.In M. R. Jones, M. D. Newlands, J. E. Halliday, L. J. Csetenyi, L. Zheng, M. J. McCarthy, & T. D. Dyer (Eds.),The 9th International Concrete Conference 2016: Environment, Efficiency and Economic Challenges forConcrete (pp. 682-694). University of Dundee.
General rightsCopyright and moral rights for the publications made accessible in Discovery Research Portal are retained by the authors and/or othercopyright owners and it is a condition of accessing publications that users recognise and abide by the legal requirements associated withthese rights.
• Users may download and print one copy of any publication from Discovery Research Portal for the purpose of private study or research. • You may not further distribute the material or use it for any profit-making activity or commercial gain. • You may freely distribute the URL identifying the publication in the public portal.
Take down policyIf you believe that this document breaches copyright please contact us providing details, and we will remove access to the work immediatelyand investigate your claim.
Download date: 24. Nov. 2021

BUBBLE STRUCTURE, STABILITY AND RHEOLOGY OF FOAMED CONCRETE
M R Jones L Zheng
University of Dundee United Kingdom M Mohammad
Public Works Department Malaysia
ABSTRACT: Foamed concrete has been identified as a versatile construction material with excellent properties that include being highly flowable, light, and durable, which are mainly own to its large volume of spherical bubbles. However, improper bubble structure in foamed concrete could result in stability problem unexpectedly on-site during its application and cause it to collapse. In this study, the bubble structure of foamed concrete was examined to establish links with its stability and rheology properties. Mixes with plastic densities ranging from 300 to 1400 kg/m³ were produced with CEM I, CSA and fine fly ash cement combinations. Water-cement (w/c) ratios varied from 0.4 to 0.8 and two types of surfactant were used. The bubble size of foamed concrete was found to be a function of its density, w/c ratio, the material fineness and surfactant types. The bubble diameters were shown to range between 0.1 to 0.5 mm. The stability was improved with increase in density. Reducing w/c ratio and fineness of constituent materials was also beneficial. The hardening time had a significant effect for stability of low density mixes and stable mixes with 300 kg/m³ density were achieved by using cement combinations of CSA with CEM I R or CSA with fine fly ash. A relationship was also established between bubble structures and the rheological values. Bubble sizes reduced when the yield stress increased. Changing the densities exhibited significant variance in the rheological values due to the changes in total bubble content. Altering the w/c ratio also had a considerable variation in the rheological values due to the changes in consistence of base mixes. Keywords: Foamed Concrete, Bubble Structure, Stability, Rheology. Professor M Rod Jones is the Director of the Concrete Technology Unit at the University of Dundee. A renowned practitioner in the field of concrete technology, he is a member of numerous national and international technical committees and has published extensively on many aspects of concrete technology, cement science and sustainable construction. Dr Li Zheng is a Research Fellow in the Concrete Technology Unit, University of Dundee. Dr Maziah Mohammad is the senior principal assistant director in the Public Works Department (JKR), Malaysia, heading the structural forensic division.

Bubble Structure, Stability and Rheology 683
INTRODUCTION
Foamed concrete has been identified as a versatile construction material with excellent properties that include being light, durable, simple to use, environmentally sustainable and versatile without being restricted by factory requirements [1]. It has the advantage of high flowability with its capacity to flow readily to fill restricted and irregular cavities, and its ability to be pumped successfully over vertical and horizontal distances [2]. This is mainly own to its large volume of spherical bubbles which provide the ball bearing effect. Air content of the foamed concrete are typically varying from 40 to 80 % of the total volume while size of the bubbles varying from 0.1 mm to 1.5 mm in diameter [3]. Ideal bubble structure provides foamed concrete with not only a good flowability, but also improved strength and reduced thermal conductivity [3, 4]. It also endows foamed concrete excellent anti-impact property [5]. However, improper bubble structure in formed concrete could result in stability problem unexpectedly on-site during its application and cause it to collaps [6, 7]. Hypothesis of stability and instability of foamed concrete based on laboratory studies and site observations was proposed to develop an empirical understanding of the factors that have been identified as being critical to bubble stability [8]. It was concluded that the underlying cause of instability is considered to be the buoyancy force of the bubbles and the use of rapid-setting cement combinations is the best method of overcoming this. The study presented in this paper was carried out with an effort to understand in-depth the effects of the constituent materials and mix proportions on the bubble structure of foamed concrete and its relationships to its stability and rheology. For the study, foamed concrete mixes with plastic densities ranging from 300 to 1400 kg/m³ were produced with CEM I, CSA and fine fly ash cement combinations. Water-cement ratios varied from 0.4 to 0.8 and two types of surfactant were used.
INTRODUCTION
The aim of this study was to examine the bubble structure in relation to constituent materials, densities, water-cement (w/c) ratios and surfactant admixtures. Stability in foamed concrete was examined with the record of the drop after 24 hours in the surface level of the specimen for each mix. The hardened specimens were split open and the digital images were taken and analysed. The rheology was studied in terms of the empirical values of yield stress and plastic viscosity of different mixes using a Brookfield Viscometer. Details of materials, foamed concrete mixes and test methods are described as follows. Materials and Foamed Concrete Mixes
The cements used for foamed concrete mixes were:
(i) Portland cement (CEM I, BS EN 197-1). CEM I, 42.5N grade was used for all mixes with densities above 600 kg/m³ while CEM I, 52.5R used for 300 kg/m³ mixes.
(ii) Calcium sulphoaluminate (CSA) cement, labelled QuickCem from Castle cement Ltd. It was used for 300 kg/m³ mixes.
(iii) Fine fly ash (FAf, BS EN 450-1) with 45 µm sieve retention of 7.5% and loss on ignition of 5.0%. It was used to replace CEM I 42.5N at 30% by mass in 600 and 1000 kg/m³ mixes and to replace CSA at 40%, 50% and 60% by mass in 300 kg/m³ mixes.
The chemical compositions of cements are given in Table 1.

684 Jones et al
Table 1 Chemical composition of cements, % by mass
COMPOUND CEM I CSA FAf 42.5N 52.5R CaO 62.7 66.7 42.25 7.19 SiO2 21.3 19.9 10.96 51.22
Al2O3 5.9 4.8 29.93 27.30 Fe2O3 3.6 3.1 3.01 3.60 MgO 2.4 1.1 1.45 1.35 TiO2 0.3 - - 1.38 K2O 0.7 0.7 1.02 1.55 Na2O 0.2 0.3 0.23 0.58 SO3 2.99 2.7 8.82 1.30
The fine aggregate conforming to BS EN 12620 was used for 600, 1000 and 1400 kg/m³ mixes, which was natural sand and sieved through a 2.36 mm sieve. In the study of rheology, a finer size, sieved through a 1 mm sieve was used to accommodate the apparatus used. In addition, coarse fly ash (FAc) with a 45µm sieve retention of 36.0% and conforming to BS EN 450-1 was used as 50% and 100% replacement for sand. The foam added to the base mortar-mixes (or paste for 300 kg/m³ mixes) was produced by commercial protein-based and synthetic surfactants diluted with water using a laboratory-scale foam generator. The concentration of the surfactant solution used for the production of foam was typically 60 g per litre of water to produce foam of 50 ± 5 kg/m³ density. The mix design, described in [1], gave foamed concrete with plastic densities of 300, 600, 1000 and 1400 kg/m³ was produced with different w/c ratios varying from 0.4 to 0.8. A cement content of 300 kg/m³ was maintained for all mixes with densities above 600 kg/m³. Table 2 gives the foamed concrete mixes for 600, 1000 and 1400 kg/m³ densities and Table 3 for 300 kg/m³ mixes.
Table 2 Foamed Concrete Mix Proportions for 600, 1000 and 1400 kg/m³ mixes
TARGET PLASTIC DENSITY, kg/m3 w/c
MIX CONSTITUENT PROPORTIONS*, kg/m3 AIR %,
Vol Free Water Sand Foam
600 0.40 120 180 55.9 71.6 0.50 150 150 54.4 69.8 0.60 180 120 53.0 67.9
1000**
0.40 120 580 44.0 56.4 0.50 150 550 42.6 54.6 0.60 180 520 41.1 52.7 0.70 210 490 39.6 50.8 0.80 240 460 38.2 49.0
1400 0.40 120 980 32.1 41.2 0.50 150 950 30.7 39.4 0.60 180 920 29.2 37.5
* CEM I 42.5 N = 300 kg/m3. ** For 1000 kg/m³ mixes, additional CEM I/FA mix was made with 30% FAf used to replace CEM I.
Bubble Structure, Stability and Rheology 685
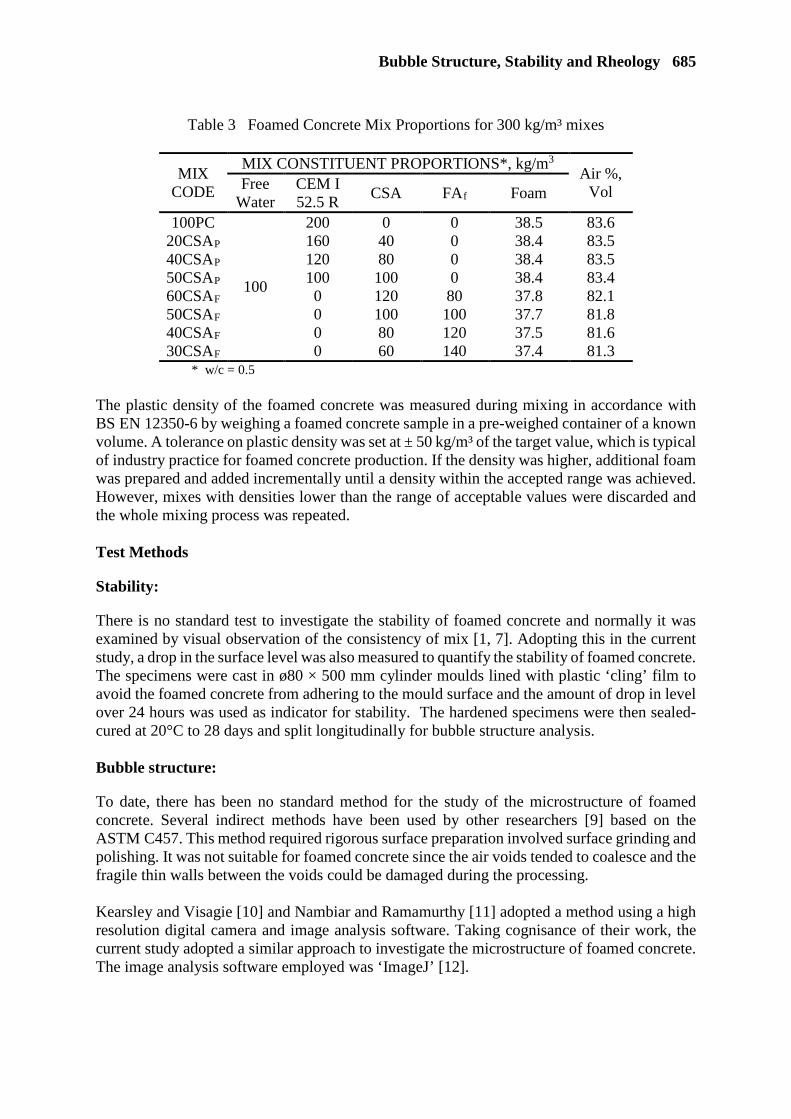
Table 3 Foamed Concrete Mix Proportions for 300 kg/m³ mixes
MIX CODE
MIX CONSTITUENT PROPORTIONS*, kg/m3 Air %, Vol Free
Water CEM I 52.5 R CSA FAf Foam
100PC
100
200 0 0 38.5 83.6 20CSAP 160 40 0 38.4 83.5 40CSAP 120 80 0 38.4 83.5 50CSAP 100 100 0 38.4 83.4 60CSAF 0 120 80 37.8 82.1 50CSAF 0 100 100 37.7 81.8 40CSAF 0 80 120 37.5 81.6 30CSAF 0 60 140 37.4 81.3
* w/c = 0.5 The plastic density of the foamed concrete was measured during mixing in accordance with BS EN 12350-6 by weighing a foamed concrete sample in a pre-weighed container of a known volume. A tolerance on plastic density was set at ± 50 kg/m³ of the target value, which is typical of industry practice for foamed concrete production. If the density was higher, additional foam was prepared and added incrementally until a density within the accepted range was achieved. However, mixes with densities lower than the range of acceptable values were discarded and the whole mixing process was repeated. Test Methods
Stability:
There is no standard test to investigate the stability of foamed concrete and normally it was examined by visual observation of the consistency of mix [1, 7]. Adopting this in the current study, a drop in the surface level was also measured to quantify the stability of foamed concrete. The specimens were cast in ø80 × 500 mm cylinder moulds lined with plastic ‘cling’ film to avoid the foamed concrete from adhering to the mould surface and the amount of drop in level over 24 hours was used as indicator for stability. The hardened specimens were then sealed-cured at 20°C to 28 days and split longitudinally for bubble structure analysis. Bubble structure:
To date, there has been no standard method for the study of the microstructure of foamed concrete. Several indirect methods have been used by other researchers [9] based on the ASTM C457. This method required rigorous surface preparation involved surface grinding and polishing. It was not suitable for foamed concrete since the air voids tended to coalesce and the fragile thin walls between the voids could be damaged during the processing. Kearsley and Visagie [10] and Nambiar and Ramamurthy [11] adopted a method using a high resolution digital camera and image analysis software. Taking cognisance of their work, the current study adopted a similar approach to investigate the microstructure of foamed concrete. The image analysis software employed was ‘ImageJ’ [12].

686 Jones et al
From the longitudinal specimens, the cylinder was ‘divided’ into four sections which enabled the study of microstructure varying along the height. After split, the specimens were cleaned with compressed air to remove loose deposits. Only the specimens with an excellent quality surface were subjected to the image analysis. A total of two clear images were selected from each section of the specimen. The parameters obtained from the image analysis included bubble counts over a fixed area (5 × 6.7 mm), equivalent mean bubble diameter (=d50), as shown in Figure 1, and bubble size distribution, expressed as d10, d50 and d90.
Figure 1 Image analysis of bubble structures of foamed concrete
Rheological properties:
Since foamed concrete behaves more Bingham-like in nature, the rheological properties can be characterised with two parameters, i.e. yield stress and plastic viscosity. In this study, Brookfield Viscometer was used to determine the empirical values of yield stress and plastic viscosity, following the method developed by Domone et al [13]. The freshly mixed foamed concrete was put into a beaker to half fill and the torque was measured with T-bar spindles and a Helipath stand at different rotational speeds. The results of torque against rotational speed were then plotted and a best fit line was drawn. T = g + hN (1) Where, T = torque (viscometer reading), N.mm g = empirical value of yield stress (function of yield value τ0) h = empirical value of plastic viscosity (function of plastic viscosity η) N = rotational speed, rev/s The empirical values of yield stress g and plastic viscosity h were determined from the intercept value and slope of the line and used in this study. Please note that g and h are functions of yield value τ0, N.mm, and plastic viscosity η, N.mm.s. However, the units for g and h are unknown.
1 mm
1 2 3
…… Bubble Counts
Bubble diameter,
mm Measured
area, 5 × 6.7mm

Bubble Structure, Stability and Rheology 687
RESULTS AND DISCUSSION
Bubble Structure
Figure 2 shows the bubble counts and bubble diameter varying with densities at w/c ratios of 0.4, 0.5 and 0.6. It can be seen that there was an increase in bubble count with increase in density (Figure 2a). However, the bubble count decreased with increase in w/c ratio. In Figure 2b, the (mean) diameter decreased with increase in density. For each density, the diameter reduced with decreased in w/c ratio. However, in any density, the variation in bubble diameter is not clearly defined, which accounts for the small variation in Figure 2b. Increase in density is related to increase in solids for the same volume. The higher volume of solids reduced the spaces for the bubble size increasing and amalgamation, hence small bubble diameter was observed. The average diameter of mixes in the higher w/c ratio was bigger than that in the mixes of lower w/c ratio. This trend was similar to all the densities. The bubbles in density 1400 kg/m³ were very small, the smallest being the lowest w/c ratio at 0.4. This bubble density accounts for the stable mix.
Figure 2 Bubble counts and bubble diameter varying with densities of foamed concrete
Figure 3 shows bubble diameter varying with w/c ratio for 1000 kg/m³ CEM I and CEM I/30%FAf foamed concrete. Again it illustrates an increase in bubble size with w/c ratio for both mixes. It can be seen that CEM I/30%FAf mixes had smaller bubble sizes than correspond CEM I mixes, which mainly due to the fineness improvement. It has been observed that bubbles less than 0.35 mm in diameter corresponded to stable mix.
Figure 3 Bubble diameter varying with w/c ratio for CEM I and CEM I/30%FAf foamed
concrete (Plastic density = 1000 kg/m³).
a:Bubble counts b:Bubble diameter

688 Jones et al
Results for FAc replacing sand filler also indicate the similar tendency as shown Figure 4. Bubble size distribution for 600 kg/m³ mixes with w/c =c 0.50 was analysed in this case, which again indicates that bubble size reduced with fineness of the mixes and the reduction is mainly in the large bubble range (d90) and few changes in small bubbles (d10). With 50% fine aggregate replacement, the d90 value was reduced to more than half and with 100% total replacement, to a third compared to the sand only mix.
Figure 4 Bubble size distribution varying with FAc replacing sand in foamed concrete (Plastic density = 600 kg/m³ and w/c = 0.50).
The comparisons in bubble count and diameter between the top and bottom sections of a specimen are shown in Figure 5. The difference in bubble count was not distinctive in all densities, as shown in Figure 5a as well as bubble diameter in Figure 5b. Only a slight increase in bubble size from top to bottom for 600 kg/m³ was observed.
Figure 5 Bubble counts and diameter varying with height of specimens (T=Top, B=Bottom) All the above results were obtained from the specimens, which were produced using protein-based surfactant. When synthetic-based surfactant was used, large size open bubbles were produced as compared with protein-based surfactant in Figure 6. The bubbles appear to have ‘holes’ or ‘bubbles inside the bubbles’ for specimens produced with synthetic-based surfactant (Figure 6b). Bubble count and diameter calculation using image analysis were impossible for these specimens.
a:Bubble counts b:Bubble diameter

Bubble Structure, Stability and Rheology 689
Figure 6 Comparison of the bubble structures of foamed concretes produced with different types of surfactants. (a) protein-based surfactant and (b) synthetic-based surfactant
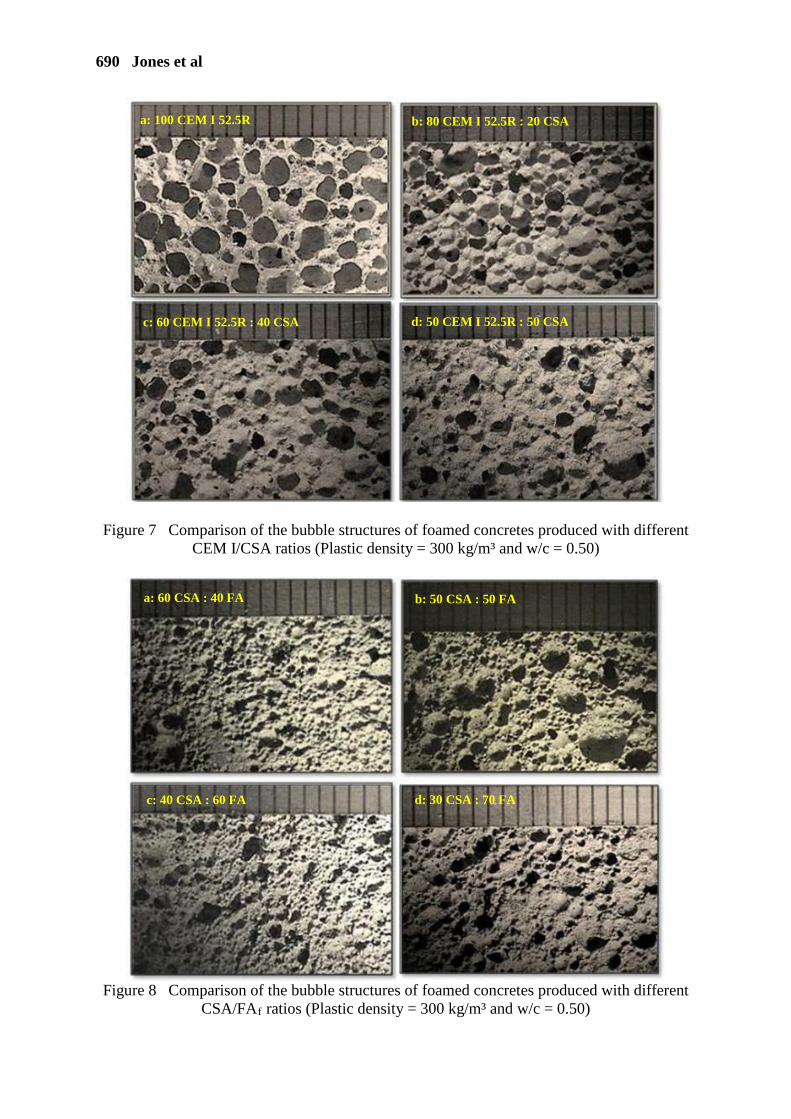
(Plastic density = 600 kg/m³ and w/c = 0.50) For ultra-light foamed concrete with 300 kg/m³, only visual observation was carried out in current study as shown in Figures 7 and 8. Figure 7 shows bubble structure varying with different CEM I/CSA ratios. In the 100% CEM I 52.5R, the bubbles were clearly defined and spherical (Figure 7a). With 20% CSA replacement, the bubbles became smaller in size, although the sphericity was still obvious (Figure 7b). The bubbles became less distinctive with additional replacement of CSA; a total of 40% (Figure 7c). With further replacement totalling to 50% of CSA, the bubbles appeared to have reduced in number and seemed less spherical (Figure 7d). However, in all four cement combinations, the foamed concrete mixes remained stable, which will be discussed in the following section. Figure 8 shows bubble structure for CSA/FAf combinations at different proportions. The CSA/FAf at ratios of 60:40 to 30:70 was found to have produced stable foamed concrete mixes. On their microstructural characteristics, there was no distinct characteristic difference in the various proportions of the mixes (Figures 8a to d). In all the mixes, the bubbles appear small and barely spherical. These were repeated in all w/c ratios. Stability
Instable foam causes the bubbles to collapse which alters the density of the concrete, and consequently, affects both the fresh and the hardened properties. Except the external environmental factors, e.g. temperature, humidity, alkalinity or acidity, a number of internal factors can affect the stability of foamed concrete, such as its density and the type of surfactant used, chemical admixtures, w/c ratios and other constituent materials like fly ash [3]. Since these internal factors affected the bubble structure as discussed above, relationship between bubble structure and stability of foamed concrete can be established. Figure 9 shows a relationship between stability and bubble size of foamed concrete. The decrease in drop in level indicates an increase in stability, which corresponds to smaller bubble diameters. The drop in level was less in higher densities means the stability increasing with density of foamed concrete. Correspondingly, the bubble sizes reduced with increased density. The stability also increased with the reduction of w/c ratio especially for the low density foamed concrete but less significant for high density specimens.
a: Protein-based surfactant b: Synthetic-based surfactant
690 Jones et al
Figure 7 Comparison of the bubble structures of foamed concretes produced with different CEM I/CSA ratios (Plastic density = 300 kg/m³ and w/c = 0.50)
Figure 8 Comparison of the bubble structures of foamed concretes produced with different
CSA/FAf ratios (Plastic density = 300 kg/m³ and w/c = 0.50)
a: 100 CEM I 52.5R b: 80 CEM I 52.5R : 20 CSA
c: 60 CEM I 52.5R : 40 CSA d: 50 CEM I 52.5R : 50 CSA
a: 60 CSA : 40 FA b: 50 CSA : 50 FA
c: 40 CSA : 60 FA d: 30 CSA : 70 FA

Bubble Structure, Stability and Rheology 691
Figure 9 Relationship between stability and bubble size of foamed concrete
Figure 10 shows drop in level varying with w/c ratio for 1000 kg/m³ CEM I and CEM I/30%FAf foamed concrete. It can be seen that the stability reduced with w/c ratio for both mixes. The CEM I/30%FAf mixes were more stable than correspond CEM I mixes (Figure 10a), due to the reduced bubble size as indicated in Figure 3. When coarse fly ash used to replace sand, stability was also improved for mixes with w/c ≤ 0.5 (Figure 10b) in relation to the reduction in bubble size as shown in Figure 4. However, for w/c ≥ 0.6, 100% replacement mixes had reduced stability compared to 50% replacement mixes.
Figure 10 Stability varying with w/c ratio for foamed concrete (a) FAf replacing CEM I; and
(b) FAc replacing sand. (Plastic density = 1000 kg/m³). Stability of foamed concretes produced with two different types of surfactants is compared in Figure 11. There is no significant difference for 1400 kg/m³ mixes and all of them exhibited stable with drop in level less than 1%. Stability was much improved for low density mixes with w/c ratios ≤ 0.5 by using protein-based surfactant, which also attributed the bubble structure difference as indicated in Figure 6. For foamed concrete with very low densities, e.g. 300 kg/m³, it required a rapid hardening cement to obtain a stable mix and then CEM I 52.5R and CSA cement were used. Two sets of cement combinations were explored. The first was CEM I 52.5R with CSA and the second was CSA with FAf. All combinations had 0 to 5 % drop in level and indicated stable mixes, while the same density mix with CEM I 42.5N was collapsed with more than 50% drop in level.

692 Jones et al
Figure 11 Comparison of the stability of foamed concretes produced with different types of
surfactants. (a) protein-based surfactant; and (b) synthetic-based surfactant Rheology
Rheological properties in the fresh state of foamed concrete play a critical role in the maintenance of the ideal bubble structures and stability as well as the development of foamed concrete in the hardened state. Significant changes to the rheological behaviour were found when using different constituent materials [1]. The rheological properties of foamed concrete were also found varying with air content (i.e. density of foamed concrete) and w/c ratio [14]. The empirical values of yield stress and plastic viscosity, together with their bubble sizes, are given in Table 4 and schematic shown in Figure 12. In general, increase in yield stress and plastic viscosity reduced the bubble sizes although the effect of yield stress is more significant. Large volume of ideal spherical bubbles provided the ball bearing effect, which significantly improved the rheological properties of foamed concrete and, therefore, yield stress and plastic viscosity reduced with the density of foamed concrete (via increasing bubble volume). Reduced bubble size could increase the total bubble numbers and enhance stability of the bubbles and therefore improve the rheology. However, it was not the case when the bubble size reduced due to reducing w/c ratio, which reduced consistence of base mixes. An increasing in w/c ratios could improve rheological properties, which, was through the improvement of consistence of base mixes. Figure 13 shows yield stress varying with w/c ratio for 1000 kg/m³ CEM I and CEM I/30%FAf foamed concrete. It indicates that the yield stress reduced with w/c ratio for both mixes. The CEM I/30%FAf mixes had smaller values than correspond CEM I mixes, due to the reduced bubble size as indicated in Figure 3. However, Figure 3 also indicates an increase in bubble size with w/c ratio and stability was also reduced with w/c ratio as shown in Figure 10. All of these indicate that foamed concrete is a complex system.
Table 4 Relationship between bubble sizes and rheological properties
w/c ratio
PLASTIC DENSITY, kg/m3 600 1000 1400
Yield stress,
empirical value
Plastic viscosity, empirical
value
Bubble diameter,
mm
Yield stress,
empirical value
Plastic viscosity, empirical
value
Bubble diameter,
mm
Yield stress,
empirical value
Plastic viscosity, empirical
value
Bubble diameter,
mm
0.4 7.6 0.11 0.41 16.8 0.66 0.23 52.8 1.18 0.16 0.5 3.7 0.09 0.43 11.0 0.33 0.28 43.6 1.07 0.18 0.6 1.8 0.08 0.47 2.6 0.29 0.33 21.8 0.85 0.21

Bubble Structure, Stability and Rheology 693
Figure 12 Schematic bubble sizes for varying yield stress and plastic viscosity
Figure 13 Yield stress varying with w/c ratio for CEM I and CEM I/30%FAf foamed
concrete (Plastic density = 1000 kg/m³).
CONCLUSIONS
• The bubble size of foamed concrete was found to be a function of its density, w/c ratio, the material fineness and surfactant types. The bubble diameters were shown to range between 0.1 to 0.5 mm. Bubbles less than 0.35 mm in diameter corresponded to stable mix with a drop in level of less than 15% in height in densities of 1000 kg/m3 and higher and the big bubbles linked to unstable mixes.
• In examining the stability, it was found that it improved markedly with increase in
density. Reducing w/c ratio and fineness of constituent materials was also beneficial to the stability of foamed concrete. The hardening time had a significant effect for stability of low density mixes, as it was evidenced by the use of CSA compared to CEM I 42.5N cement. Stable mixes with 300 kg/m3 density were achieved by using cement combinations of CSA with CEM I 52.5R or CSA with fine fly ash.
• A relationship was also established between bubble structure and the rheological
values. Bubble sizes reduced when the yield stress increased. Changing the densities exhibited significant variance in the rheological values due to the changes in total bubble content. Altering the w/c ratio also had a considerable variation in the rheological values due to the changes in consistence of base mixes.

694 Jones et al
It was found that the three aspects, i.e. bubble structures, stability and rheology of foamed concrete, in this study were correlated and constrained mutually. For example, reduced bubble size could be beneficial to both stability and rheology. However, if this was simply done by reducing air content (i.e. increasing density) or w/c ratio, stability could be improved but rheology would tend to worse. Using fly ash to partially replace CEM I or sand filler to reduce the bubble size could improve both stability and rheology.
ACKNOWLEDGEMENTS
The support and technical advice is gratefully acknowledged from Propump Engineering Ltd and CALTRA Nederland BV are thanked for their support with the supply of CSA.
REFERENCES
1. JONES, M R, MCCARTHY, A. Preliminary views on the potential of foamed concrete as a structural material, Magazine of Concrete Research, Vol. 57, No. 1, 2005, pp 21-31.
2. JONES, M R, MCCARTHY, A, KHARIDU, S, NICOL, L. Foamed Concrete – Development and applications, Concrete, Vol. 39, No. 8, 2005, pp 41-43.
3. BRADY, K C, WATTS, G R A, JONES, M R. Specification for Foamed Concrete, Prepared for Quality Services, Civil Engineering, Highway Agency, Application Guide AG39, Transport Research Laboratory (TRL) Limited, 2001, p 62.
4. JONES, M R, GIANNAKOU, A. Thermally Insulating Foundations and Ground Slabs Using Highly-Foamed Concrete, Journal of ASTM International, Vol. 1, No. 6, 2004, DOI: 10.1520/JAI11879.
5. JONES, M R, ZHENG, L. Energy absorption of foamed concrete from low velocity impacts, Magazine of Concrete Research, Vol. 65, No. 4, 2013, pp 209-219.
6. JONES, M R, MCCARTHY, A. Heat of hydration in foamed concrete: Effect of mix constituents and plastic density, Cement and Concrete Research, Vol. 36, No. 6, 2006, pp 1032-1041.
7. NAMBIAR, E K K, RAMAMURTHY, K. Fresh state characteristics of foam concrete, Journal of Materials in Civil Engineering, Vol. 20, No. 2, 2008, pp 111-117.
8. JONES, M R, OZLUTAS, K, ZHENG, L. Stability and instability of foamed concrete, Magazine of Concrete Research, 2015, DOI: 10.1680/macr.15.00097.
9. ALIGIZAKI, K K. Pore Structure of Cement-based Materials, Taylor and Francis, 2006, pp 286-331.
10. KEARSLEY, E P, VISAGIE, M. Micro-properties of foamed concrete, Specialist techniques and materials for concrete construction, Proceedings of the International Conference ‘Creating with concrete’ (Ed R K Dhir and N A Henderson), University of Dundee, Scotland, 1999, Thomas Telford, pp. 173-184.
11. NAMBIAR, E K K, RAMAMURTHY, K. Air-void characterisation of foam concrete, Cement and Concrete Research, Vol. 37, No. 2, 2007, pp 221-230.