university of birmingham politically induced board
TRANSCRIPT

University of Birmingham
Politically induced board turnover, ownershiparrangements, and performance of SOEsKuzman, Tanja; Talavera, Oleksandr; Bellos, Sotirios K.
DOI:10.1111/corg.12238
License:None: All rights reserved
Document VersionPeer reviewed version
Citation for published version (Harvard):Kuzman, T, Talavera, O & Bellos, SK 2018, 'Politically induced board turnover, ownership arrangements, andperformance of SOEs', Corporate Governance: An International Review, vol. 26, no. 3, pp. 160-179.https://doi.org/10.1111/corg.12238
Link to publication on Research at Birmingham portal
Publisher Rights Statement:Checked for eligibility: 15/05/2019This is the peer reviewed version of the following article:Kuzman, T, Talavera, O, Bellos, SK. Politically induced board turnover, ownershiparrangements, and performance of SOEs. Corp Govern Int Rev. 2018; 26: 160– 179. , which has been published in final form athttps://doi.org/10.1111/corg.12238. This article may be used for non-commercial purposes in accordance with Wiley Terms and Conditionsfor Use of Self-Archived Versions.
General rightsUnless a licence is specified above, all rights (including copyright and moral rights) in this document are retained by the authors and/or thecopyright holders. The express permission of the copyright holder must be obtained for any use of this material other than for purposespermitted by law.
•Users may freely distribute the URL that is used to identify this publication.•Users may download and/or print one copy of the publication from the University of Birmingham research portal for the purpose of privatestudy or non-commercial research.•User may use extracts from the document in line with the concept of ‘fair dealing’ under the Copyright, Designs and Patents Act 1988 (?)•Users may not further distribute the material nor use it for the purposes of commercial gain.
Where a licence is displayed above, please note the terms and conditions of the licence govern your use of this document.
When citing, please reference the published version.
Take down policyWhile the University of Birmingham exercises care and attention in making items available there are rare occasions when an item has beenuploaded in error or has been deemed to be commercially or otherwise sensitive.
If you believe that this is the case for this document, please contact [email protected] providing details and we will remove access tothe work immediately and investigate.
Download date: 23. Nov. 2021
Politically Induced Board Turnover, Ownership Arrangements
and Performance of SOEs
Tanja Kuzman1*, Oleksandr Talavera2, Sotirios K. Bellos3
University of Sheffield, Swansea University, University of Sheffield
1 Management School, University of Sheffield, Conduit Road, Sheffield S10 1FL, United Kingdom 2 School of Management, Swansea University, Bay Campus, Swansea SA1 8EN, United Kingdom 3 International Faculty-CITY College, University of Sheffield, Leontos Sofou 3, Thessaloniki 546 26, Greece
*Author for correspondence: Tanja Kuzman, Management School, University of Sheffield, Conduit Road, Sheffield S10
1FL, United Kingdom. E-mail: [email protected].
ABSTRACT
Manuscript Type: Empirical
Research Question/Issue: This study investigates the impact of elections on board member
changes and its relationship with profit-oriented performance of state-owned enterprises
(SOEs), thus providing new insights on political tie heterogeneity.
Research Findings/Insights: Using a unique hand-collected dataset of 200 SOEs in six
countries of the former Socialist Federal Republic of Yugoslavia (SFRY) from 2010 till 2014,
we find that board member changes within SOEs, unlike for private enterprises, are
politically motivated rather than performance induced. We reveal that SOEs with higher
levels of board member changes encounter lower productivity and profitability levels. These
findings suggest that political interference via board member changes causes organizational
inefficiencies and poor SOE performance. Moreover, the results show that board member
changes are insignificant for performance of large SOEs and SOEs governed by independent
government body.
Theoretical/Academic Implications: This study reveals an indirect channel for political
interference, thus contributing to greater understanding of political tie heterogeneity.
Moreover, our study is the first to link political interference and performance of SOEs
through introduction of election cycles into the board member changes-performance
relationship.
Practitioner/Policy Implications: The results of this study provide insights for policymakers
who are interested in enhancement of SOEs’ performance. They suggest ways in which board
appointment procedures should be altered as to be insulated from political interference. In

2
addition, they show boards how they can lower the negative consequences of frequent board
member changes.
Keywords: Corporate Governance, Performance of SOEs, Election Cycles, Politically
Induced Board Turnover, Ownership Arrangement
ACKNOWLEDGEMENTS
The authors would like to thank the Editor Professor Praveen Kumar, the Associate Editor
Professor Chris Florackis, two anonymous reviewers, Professor Yuriy Gorodnichenko and Dr
Chaudhry M. Ghafran for their valuable comments and suggestions.
3
Politically Induced Board Turnover, Ownership Arrangements
and Performance of SOEs
ABSTRACT
Manuscript Type: Empirical
Research Question/Issue: This study investigates the impact of elections on board member
changes and its relationship with profit-oriented performance of state-owned enterprises
(SOEs), thus providing new insights on political tie heterogeneity.
Research Findings/Insights: Using a unique hand-collected dataset of 200 SOEs in six
countries of the former Socialist Federal Republic of Yugoslavia (SFRY) from 2010 till 2014,
we find that board member changes within SOEs, unlike for private enterprises, are
politically motivated rather than performance induced. We reveal that SOEs with higher
levels of board member changes encounter lower productivity and profitability levels. These
findings suggest that political interference via board member changes causes organizational
inefficiencies and poor SOE performance. Moreover, the results show that board member
changes are insignificant for performance of large SOEs and SOEs governed by independent
government body.
Theoretical/Academic Implications: This study reveals an indirect channel for political
interference, thus contributing to greater understanding of political tie heterogeneity.
Moreover, our study is the first to link political interference and performance of SOEs
through introduction of election cycles into the board member changes-performance
relationship.
Practitioner/Policy Implications: The results of this study provide insights for policymakers
who are interested in enhancement of SOEs’ performance. They suggest ways in which board
appointment procedures should be altered as to be insulated from political interference. In
addition, they show boards how they can lower the negative consequences of frequent board
member changes.
Keywords: Corporate Governance, Performance of SOEs, Election Cycles, Politically
Induced Board Turnover, Ownership Arrangement

4
INTRODUCTION
The political view of state ownership asserts that political ties are established through
appointments of politically like-minded individuals or bureaucrats that follow certain political
interests (Boycko, Shleifer, & Vishny, 1996). The primary goal of these appointees is
fulfilment of their personal and/or political interests that are not in line with the enterprise
value maximization objective (La Porta, Lopez-de-Silanes, Shleifer, & Vishny, 2002; Shleifer
& Vishny, 1994, 1997). Moreover, these appointees might lack the appropriate knowledge,
competences and experience for carrying out board responsibilities (Vagliasindi, 2008; World
Bank, 2014). In that way, governments constitute SOE boards to ensure that they fulfil their
interests even when this may cause negative performance (World Bank, 2014).
The main focus of the past empirical research on this topic is related to personal level
political ties and government ownership ties within SOEs. Researchers use political
connections of CEOs (e.g., Wu, Wu, Zhou, & Wu, 2012), percentage of
politicians/government officials on boards (e.g., Menozzi, Gutierrez Urtiaga, & Vannoni,
2011; Okhmatovskiy, 2010), or unlawful discharge of a board chairman or CEO (e.g., Ding,
Jia, Wu, & Zhang, 2014) as political interference proxies. These proxies neglect the existence
of political ties heterogeneity. Sun, Mellahi, Wright, and Xu (2015) explain that the past
research has failed to recognize the informal linkages that might exist between business
people and politicians. Therefore, the main question is whether political interference goes
beyond the establishment of formal political ties and, if so, what kind of informal channels
might exist.

5
Vickers and Yarrow (1988) suggest that for SOEs, board member changes comply with
political rather than market forces. Government officials and political appointees are replaced
whenever a new government representative or ruling political party is elected (Kernaghan,
1986). In that way, political establishments distance themselves from individuals connected
to the previous political administration (Sun et al., 2015), who are unlikely to show loyalty
and impartiality for the new political party in power (Kernaghan, 1986). Consequently, board
member changes are triggered by election cycles, which thus represent a hidden channel for
political interference. In addition, board members without direct political ties could suffer
from “guilt by association”. This refers to punishment of individuals or organizations because
of their prior relationship with illegitimate, disadvantaged, or undesirable individuals or
networks (Labianca & Brass, 2006). Hence, even non-politically connected board members
might be replaced.
Politically induced board member changes might indicate that the likelihood of board
member discharge due to poor performance is much lower for SOEs. Nevertheless, political
interference via board member changes may lead to operational inefficiencies and poor SOE
performance. The nonexistence of perfect substitution for individual board members creates a
time lag before an efficient decision-making process is re-established (Sharma, 1985).
Moreover, new board members need time to adapt in order to be able to positively contribute
to the decision-making processes (Smith et al., 1994). Recognizing that performance depends
on board decisions, politically motivated board member changes might have negative effects
on SOE performance. The magnitude of these effects could be influenced by the interplay of
the SOE’s political importance and the government ownership ties.
In this study we examine the relationship between election cycles and board member changes
and we analyse how that relationship impacts the performance of SOEs in six countries of the

6
former Socialist Federal Republic of Yugoslavia (SFRY) - Bosnia and Herzegovina, Croatia,
FYR Macedonia, Montenegro, Serbia, and Slovenia. Our hand-collected dataset has financial
and board member information for 200 SOEs from 2010 to 2014. We examine election‒board
member changes and board member changes‒performance relationship using panel data fixed
effects and a panel data instrumental variable (IV) estimator, respectively.
The decision to investigate SOEs in countries of the former SFRY is based on several
reasons. First, these countries had similar legal frameworks, market rules and ways in which
they govern state ownership (Horvat, 1971). Coherent patterns could be depicted by looking
at the level of state ownership, their number, and the sectors in which they operate (Bicanic,
2010). Even though each of these countries chose its own path after achieving independence,
all of them still face similar problems (e.g., level of indebtedness, staggered economic
activity, and political instability). Second, in spite of privatization efforts during the past 20
to 30 years, the degree of state ownership in these countries is still high. Despite the fact that
absolute numbers of SOEs in each of these countries might indicate that the degree of state
ownership is quite distinctive, when we take into account the employment percentage for
which SOEs are accountable, similarities become apparent.1 Third, our data reveal that
countries within our sample have analogous levels of board member changes. Therefore, the
six countries of the former SFRY provide a unique set-up for examining the influence of
board member changes on performance of SOEs.
The results show that board member changes within SOEs are politically motivated rather
than performance induced. We also uncover the hidden channel of political interference via
board member changes. Furthermore, we find a negative and significant relationship between
politically induced board member changes and performance of SOEs. The relationship is
stronger for operating than for financial performance. Our estimates also indicate a greater

7
presence of political interference in small and medium size SOEs. Additionally, we reveal
that board member changes are insignificant for the performance of SOEs governed by
independent government body.
This research contributes to the existing literature in several important aspects. First, we
respond to a recent call by Grosman, Okhmatovskiy, and Wright (2016) to fill in the gap
regarding the nature and drivers of board turnover within SOEs. We offer a detailed analysis
and empirical evidence for Vickers and Yarrow’s (1988) theoretical standing that board
member changes within SOEs comply with election cycles (political force) rather than poor
performance results (market force). Second, we introduce politically induced board member
changes as a new proxy for political interference within SOEs. With this proxy we recognize
that political interference goes beyond personal political ties of CEOs, board chairmen, or a
portion of board members and takes into account the dynamics of the entire board. Third, we
complement research studies on the political view of state ownership (e.g., Krueger, 1990;
Shleifer & Vishny, 1997) and the political embeddedness perspective (e.g., Michelson, 2007)
with our novel empirical approach to political interference. More specifically, we investigate
the link between political interference and performance of SOEs by introducing the election
cycles into the board‒performance relationship. Fourth, we contribute to the literature about
the factors that influence SOE performance. We show that political interference via unstable
board membership engenders poor performance. Frequent board member changes disrupt
board dynamics, thus creating numerous operational inefficiencies (Sharma, 1985). Finally,
our findings provide solid grounds for policy changes suggesting ways in which SOE
performance can be improved.
The rest of the paper is organized as follows. The next section reviews the literature and
develops hypotheses. Section three explains data and empirical strategy. Section four presents
8
empirical results and discussion. Section five concludes and provides implications for future
research.
LITERATURE REVIEW AND HYPOTHESIS DEVELOPMENT
Politically induced board member changes
The primary goal of politicians is attainment, exploitation and maintenance of power
(Buchanan & Tullock, 1962). In order to accomplish that, politicians use SOEs for personal
or political gains that are not in line with the profit maximization objective as implied by the
political view of state ownership (Chong & Lopez-de-Silanes, 2005; Krueger, 1990; Shleifer
& Vishny, 1997). Consequently, board positions are reserved for politically loyal and
obedient individuals (World Bank, 2006) or bureaucrats who are ready to pursue certain
political interests (Boycko et al., 1996). The practice of appointing board members on the
basis of their political allegiance and not qualifications and business acumen is one of the
most profound forms of political interference (Barberis, Shleifer, & Vishny, 1998; Greene,
2014; Wong, 2004).
Politically construed board appointments enable politicians to influence and control the
decision-making processes within SOEs. For that reason, government officials do not have an
incentive to appoint the best candidates for board membership as these decisions need to have
a political justification (Hu & Leung, 2012). Opper, Nee, and Brehm (2015) argue that
political connections and political evaluations are the only parameters for selection of
government officials and managers. They explain that political leaders tend to allocate key
positions to like-minded individuals with whom they can associate their interests.
Furthermore, politicians and individuals with alike interests dominate SOE boards
(Yoshikawa, Zhu, & Wang, 2014). Hence, the shift of political power or even substitution of
9
political leaders triggers replacements of government officials and political appointees
(Kernaghan, 1986).
Along those lines, Vickers and Yarrow (1988) argue that within SOEs, board turnover
complies with political rather than market forces. They suggest that board member changes
within SOEs are caused by political disagreement/lack of political obedience/election cycles
rather than poor performance results. Shleifer and Vishny (1994) find that Greek elections
won by an opposing party result in the overturn of top managers within SOEs. With board
member changes, politicians want to avert any likelihood that their power might be
destabilized and ensure a network of loyal individuals in key positions (Dittmer & Wu, 1995;
Li & Bachman, 1989). Consequently, change of politically connected board members due to
election cycles can be observed as a hidden channel for political interference. To gain
additional insights, we propose the following hypothesis:
Hypothesis 1. Board member changes within SOEs are politically motivated rather
than performance induced.
Performance and political interference via board member changes
Political interference via boards and political connections can create both, benefits and costs,
as suggested by the political embeddedness perspective. On the one hand, political ties are
considered to be a relational asset that provides enterprises with access to valuable
governmental resources, thus leading to a better enterprise performance (Boubakri, Cosset, &
Saffar, 2012; Faccio, 2006; Pfeffer & Salancik, 1978). Several studies demonstrate that
enterprises benefit from political connections through preferential access to financing (e.g.,
Chen, Shen, & Lin, 2014; Dinc, 2005; Inoue, Lazzarini, & Musacchio, 2013; Khwaja &
Mian, 2005), increased probability for getting government contracts (e.g., Goldman, Rocholl,

10
& So, 2009; Goldman, So, & Rocholl, 2013) or subsidies (e.g., Wu & Cheng, 2011), payment
of lower taxes (e.g., Adhikari, Derashid, & Zhang, 2006), lower regulatory enforcement (e.g.,
Agrawal & Knoeber, 2001), possibilities for influencing regulatory policies (e.g., Hillman,
2005), and provision of bail-out for financially troubled enterprises (e.g., Faccio, 2006). On
the other hand, political ties enable government representatives to manipulate SOEs’
resources to promote political or personal interests with negative consequences on SOE
performance (Krueger, 1990; Shleifer & Vishny, 1994). Political ties in those cases cause
excessive employment levels (e.g., Menozzi et al., 2011), distorted investment efficiency, and
lower capital allocation efficiency (e.g., Chen, Sun, Tang, & Wu, 2011). The costs of political
ties might outweigh the benefits with presence of government officials on boards
(Okhmatovskiy, 2010).
Unlike for private enterprises, governance of SOEs is in the hands of three different interest
groups: citizens as principals and ultimate owners, governments as fiduciary agents, and
boards as direct agents (Capobianco & Christiansen, 2011; Musacchio, Pineda Ayerbe, &
Garcia, 2015). The agency theory asserts that fiduciary and direct agents may choose to
pursue some private benefits at the expense of wealth maximization for principals (Fama &
Jensen, 1983; Jensen & Meckling, 1976). Fear of dismissal is one of the main tools for
alignment of interests of agents and principals, which ensures that managers work in the best
interest of the owners (Holstrom, 1979; Ross, 1973).
Politically motivated board member changes imply that one of the main tools for alignment
of interests of agents and principals, fear of dismissal, might not be effectuated in the case of
SOEs. Several authors explain that SOE boards lack the managerial incentives for pursuance
of efficiency and profitability objectives (Boardman & Vining, 1989; Boubakri, Cosset, &
Saffar, 2008; Vickers & Yarrow, 1988). This is due to political interference, which lowers the

11
likelihood of discharge because of poor performance results. Therefore, the question in the
case of SOEs is whether politically induced board member changes might cause a negative
effect on their performance. Sharma (1985) argues that frequent board member changes cause
inconsistent decision-making processes that result in organizational inefficiencies and poor
performance. An enterprise’s performance depends on board decisions, while board decisions
rely on collective judgment and deliberation, which alters with board member changes.
Hence, decisions are kept in a state of flux and away from real implementation, which in the
end impinges on the enterprise’s performance (Sharma, 1985). Crutchley, Garner, and
Marshall (2002) find that greater board stability is associated with enhanced enterprise
performance. We therefore propose the following hypothesis:
Hypothesis 2. Politically induced board member changes are negatively associated
with SOE performance.
In addition to what is noted above, the literature indicates that politicians might use the
economic power of large enterprises to improve the likelihood of their re-election (Bertrand,
Kramarz, Schoar, & Thesmar, 2007). Moreover, they might influence the corporate decisions
of large SOEs in order to preserve their political power (Bertrand et al., 2007). For those
reasons, large SOEs are considered to be one of the essential trophies in the aftermath of
elections. The previous research studies suggest that politically experienced directors are
prevalent in large enterprises (Faccio, 2006; Su & Fung, 2013). The greater number of
politically connected directors is found within large SOEs, due to their political importance
(Menozzi et al., 2011). Contrary to that, small and medium SOEs are less important because
of their limited market power and curtailed influence on the re-election outcome. Considering
that politicians appoint like-minded individuals to key positions (Opper et al., 2015) and that
political appointees are replaced after elections (Kernaghan, 1986), greater numbers of board
12
member changes are expected among large SOEs. Consequently, unstable boards of large
SOEs might endanger their performance as a result of a considerable number of short-term
decisions beneficial for politicians. However, as media are more likely to investigate large
SOEs (O’Connell, 1995), politicians might opt to interfere with boards of small and medium
size SOEs. In order to investigate these implications of the literature, we propose:
Hypothesis 3a. Politically induced board member changes are negatively associated
with the performance of large SOEs.
Hypothesis 3b. Politically induced board member changes are less negatively
associated with the performance of small and medium SOEs than of large SOEs.
Government ownership ties and political interference via ownership models
The research studies on government ownership ties analyse how state ownership affects
performance (e.g., Ding et al., 2014), how government-business networks operate in cases of
minority state ownership (e.g., Inoue et al., 2013; Wang, Hong, Kafouros, & Wright, 2012),
and whether interaction of personal and ownership ties produces some differentiating effects
(e.g., Sun et al., 2015). Furthermore, researchers recognize that political connections to local
and central governments can have distinct effects on enterprise performance (e.g., Fan,
Wong, & Zhang, 2007; Zheng, Singh, & Mitchell, 2015). Zheng et al. (2015) found that
political ties to local governments improve enterprise performance because of the closer
alignment between SOEs’ and politicians’ interests.
Governments can exercise their political or personal interests via interference of ownership
entities in day-to-day SOEs’ operations and/or board nomination procedures (World Bank,
2006). The property-rights theory explains that non-transferability of SOEs’ ownership leads
13
to the lack of incentives for government entities to perform their monitoring function
comprehensively (De Alessi, 1969, 1973). Furthermore, Wong (2004) argues that politicians
and bureaucrats who sit on these governmental bodies are poor overseers of state ownership.
Therefore, the level of political interference depends on the ownership model adopted by
governments as well as its structure.
Governments can choose between three different ownership models. They can opt for a
decentralized model where line ministries are accountable for SOEs (Musacchio et al., 2015;
OECD, 2012). As the second option they have a dual model in which line ministry and
“central” ministry (usually Ministry of Finance) jointly exercise ownership rights (OECD,
2012). Governments can also decide to adopt a centralized model where an independent
government body is responsible for ownership function over all or a vast majority of SOEs
(PwC, 2015; World Bank, 2014). Table 1 reveals that countries within our sample have
distinctive governing models for state ownership. In Slovenia and Croatia, an independent
government body governs SOEs, while in Bosnia and Herzegovina and FYR Macedonia line
ministries bear the responsibility of managing state ownership. The government de facto
plays the key role in governing SOEs in Serbia and Montenegro (government ownership
model), despite the fact that this responsibility is de jure in hands of line ministries.
The theory and literature clearly indicate that a centralized model should be adopted by
governments as it curtails opportunities for political interference (World Bank, 2014).
Contrary to that, several government bodies in decentralized and dual models can compete
for influence over SOEs, creating contradictory and conflicting goals that can undermine
their performance (Musacchio et al., 2015; World Bank, 2006). Furthermore, board member
nomination and appointment procedures within centralized ownership models are insulated
from political pressures since they are based on professional criteria - expertise and
14
knowledge of individuals (World Bank, 2014). For all other ownership models, ministry
cabinets interfere in these processes, thus enabling appointments of politically connected
individuals. The nomination procedures as well as criteria for board membership outlined in
Table 1 imply that politicians in Slovenia and Croatia have a rather limited space for
interference. The independent government body conducts public calls for board members on
the basis of predetermined criteria. Serbia and Montenegro follow completely opposite
procedures within their quasi decentralized model. The nomination procedure in these
countries is led by the governmental committee or office for appointments, which enables
direct political interference. Therefore, SOEs in countries with centralized ownership models
should experience a lower level of political interference, and thus a limited effect on their
performance. In accordance with the previous literature and implications regarding different
models adopted by countries within our sample, we introduce our last hypothesis:
Hypothesis 4. The performance of SOEs in countries with government ownership
models suffers more from politically induced board member changes than does the
performance of SOEs in countries with centralized ownership models.
_ _ _ _ _ _ _ _ _ _ _ _ _ _ _ _
Insert Table 1 about here
_ _ _ _ _ _ _ _ _ _ _ _ _ _ _ _
15
DATA AND METHODOLOGY
Sample and Data Collection
Our sample contains financial and board membership data about 200 SOEs from six countries
of the former SFRY for the period 2010-2014. We construct our sample through extraction of
data from the Amadeus database on the basis of two criteria. The first criterion is that the
enterprise operates in one of the six former SFRY’s countries. The second criterion is that the
ultimate owner of the enterprise is public authority, state, or government with a minimum
50.01% of direct or indirect ownership. We use this cut-off point for three main reasons.
First, OECD (2015) in its guidelines on SOEs’ corporate governance, defines a SOE as an
enterprise with 100% or majority state ownership. Second, this cut-off point conveys
effective government control. Third, prior empirical research demonstrates that enterprises
with minority state ownership have a lower number of political connections, thus implying a
lower level of political interference (e.g., Wu et al., 2012).
Based on the country and ownership criteria, 556 enterprises are identified as state-owned.
From that sample we exclude all enterprises that declared bankruptcy, as their real
performance could not be observed. Moreover, we delimit our sample by removing
enterprises from the financial sector (e.g., banks, insurance enterprises), since they have
distinct financial reporting and higher levels of corporate governance due to legal
requirements (e.g,. Goldeng, Grunfeld, & Benito, 2004; Haniffa & Hudaib, 2006). In
addition, we remove all providers of health, social, and cultural services since they are
established in order to achieve some non-commercial objectives (e.g., Bozec, Breton, & Cote,
2002). Lastly, we exclude enterprises for which data are not available (e.g., Faccio, 2010).
After applying all of these restrictions, our final sample encompasses 200 SOEs. Even though
it may be argued that this sample is small, several facts need to be taken into account. First,
16
we exclude SOEs whose inclusion might lead to misleading results following the implications
of previous research studies mentioned above. Second, availability of data for SOEs
worldwide is rather scarce, and we include all SOEs for which data are available. Third, our
sample is larger or comparable to the sample sizes of similar studies (e.g., Menozzi et al.
(2011) employ a sample of 114 Italian SOEs).
We download standardized balance sheet and profit and loss items, ownership data, industry
code, date of incorporation, number of employees, and board membership information from
the database. We fill in any missing financial data with data from SOE annual reports. For
enterprises that do not report their financial data in EUR we make a conversion using
exchange rates applied by Amadeus to ensure data standardization.
Due to limited availability of board member data in the database, we hand-collect data on
numerous board member characteristics (e.g., names, dates of appointment and resignation,
political connectedness, level of education, previous/current position, subsequent position) to
complement the missing data. The collection of board level data is based on the
predetermined definition of boards. As already noted, SOEs can have two-tier boards
(supervisory and management board) or one-tier boards with or without the presence of
managing directors. In our research we follow the definition of OECD (2015) and World
Bank (2014), and we define “board” as an enterprise body that monitors management and
governs enterprise. Table 2 shows that the vast majority of SOEs within our sample have
two-tier boards. In Montenegro, all SOEs follow a one-tier board system due to legal
stipulations, while in FYR Macedonia SOEs can have one-tier or two-tier board systems
depending on the category of SOEs to which they belong.

17
_ _ _ _ _ _ _ _ _ _ _ _ _ _ _ _
Insert Table 2 about here
_ _ _ _ _ _ _ _ _ _ _ _ _ _ _ _
For the extraction of the board-level missing data we use official financial and annual reports
of enterprises, databases of official enterprise registry agencies, data published on stock
exchanges, and individual decisions of shareholder assemblies on the appointment and
resignation of board members. Overall, we have data on 2,120 board members, which makes
our dataset the first of its kind for this part of Europe.
Variables and Measures
In our study we employ two performance measures, following the approach taken in previous
research studies (e.g., Boardman & Vining, 1989; Boubakri et al., 2008; Bozec et al., 2002;
Dewenter & Malatesta, 2001; Ding et al., 2014; Hu & Leung, 2012; Menozzi et al., 2011;
O’Connell & Cramer, 2010). We use return on equity (ROE) as a profitability measure and
Sales per employee as an operating and productivity measure. ROE, which is a proxy of
return on shareholders’ investments, is computed as the ratio of net income to average total
equity. Sales per employee is the natural logarithm of the sales over the total number of
employees. It is a well-established fact that accounting based measures may suffer from
financial manipulations. However, employment of standardized audited financial data
provides sufficient reliability of these performance measures (Goldeng et al., 2004;
O’Connell & Cramer, 2010). Despite some limitations of accounting measures, evidence
from previous research studies implies that they are adequate proxies of economic rates of
return (Vining & Boardman, 1992). In addition, we do not use any stock market measures
since the vast majority of SOEs from our sample are not listed on stock exchanges, while the
level of liquidity of traded stocks is not sufficient for valid estimations (e.g., Okhmatovskiy

18
(2010) recognizes the same problem for investigation of SOE performance and political ties
in Russia). Moreover, Ding et al. (2014) explain that usage of market performance measures
is not well suited for investigation of political interference. Due to efficient markets, political
interference would be immediately reflected in stock prices. Thus, market measures might not
grasp its effect.
We also employ three different measures of board member changes. Board turnover is the
percentage of the total number of board members in the observed year who left at the end of
the year after spending at least one year on the board (e.g., Franks & Mayer, 2001). Board
political turnover is the percentage of the total number of board members in the observed
year who are politically connected2 and who left at the end of the year after spending at least
one year on the board. Board intermediary shows the number of board members who left in
the observed year with tenures shorter than one year. This measure is employed to grasp the
within-year board dynamics. In order to grasp board dynamics not captured by Board
intermediary, we employ variables that show the number of board members who left the
board within one year (Board leavers) and the number of board members appointed in the
same period (Board appointments). With employment of these measures, we take into
account political connectedness of all board members, thus creating a new proxy for political
interference.
Bearing in mind the political view of state ownership and standing of Vickers and Yarrow
(1988), who suggest that SOEs’ board member changes are a result of political rather than
market forces, we employ two variables that represent political force. Parliamentary and
Local elections are dummy variables that take value one in the year of elections and zero for
other years.3 In addition, we use these variables as instruments for the board member
changes‒performance relationship due to potential endogeneity issues.
19
In our models we introduce several other board characteristics as suggested in the previous
research. Board members with short tenures cannot adapt and contribute positively to the
board decision-making processes (Smith et al., 1994). This can create a time lag (Sharma,
1985) with negative performance consequences. However, board members with long tenures
are more likely to be replaced, thus increasing board member changes. Hence, we employ
Board tenure, which is calculated as the average time that board members spent on the board
(e.g., Ding et al., 2014; McIntyre, Murphy, & Mitchell, 2007). Board size is computed as the
total number of board members, and as such appears in previous research models related to
political connections (e.g., Ding et al., 2014; Okhmatovskiy, 2010). Furthermore, Yermack
(1996) suggests that board size has a negative effect on performance since a greater number
of board members leaves room for greater political interference. In addition, the proportion of
women on boards is positively related to enterprise performance (Carter, Simkins, &
Simpson, 2003; Catalyst, 2004). We therefore employ Board male as the percentage of men
on board.
Since SOEs differentiate among themselves, we employ several enterprise-level controls.
SOEs are sometimes used for employment purposes, so it is often argued that an increase in
the number of employees leads to lower performance results (Fan et al., 2007). Therefore, we
employ Size, which is calculated as the natural logarithm of the total number of employees, to
control for absolute availability of resources (e.g., Hu & Leung, 2012; Menozzi et al., 2011;
Vining & Boardman, 1992; Zheng et al., 2015). Hannan and Freeman (1989) explain that
dissolution risk is associated with years of existence. Hence, we control for the period of
SOEs’ Existence, which is computed as the natural logarithm of the difference between years
under investigation and year of SOE incorporation (e.g., Goldeng et al., 2004; Sun et al.,
2015; Tian & Lau, 2001). Additionally, Gilson (1990) indicates that board member changes

20
are common among financially distressed enterprises. We therefore control for Leverage as
the measure of long-term debt over shareholders’ equity (e.g., Faccio, 2010). Furthermore,
recognizing that differences across countries might impact our results and following prior
literature (e.g., Boubakri et al., 2012), we employ GDP, which represents the logarithm value
of the gross domestic product at purchasing power parity (GDP PPP). We obtain data on
GDP PPP from the World Bank online database.
Methodology
To identify whether board member changes are politically induced (Hypothesis 1), we run a
following fixed effects model:
= + + + +
+ + + + +
(1)
where i is the SOE id, t is the year effect, α is the intercept, and denotes the error term.
SOE specific fixed effects are captured by , while time-fixed effects are depicted by .
Board member changes is a dependent variable represented by three measures, namely Board
turnover, Board intermediary, and Board political turnover. We run the regressions only with
parliamentary elections as it is not possible to distinguish between the effects of local and
parliamentary elections in years in which they occur simultaneously. Due to the greater
importance of parliamentary elections, we believe that they create more profound effects on
board member changes. In our second estimation, the instrumental variables are
Parliamentary and Local elections, which enable us to grasp and acknowledge their mutual
effect.
Significant coefficient for variable Parliamentary might indicate that board member changes
are politically motivated. We assume no reverse causality, since board member changes
21
cannot influence the occurrence of elections. The occurrence of elections is prescribed by the
constitution, while early elections are decided based on certain political or economic reasons
and they are not announced because of the board member changes within SOEs. As it can be
noted, variables Size and Performance are lagged, since these variables can have non-
instantaneous association with board member changes. Performance is represented by ROE
and Sales per employee.
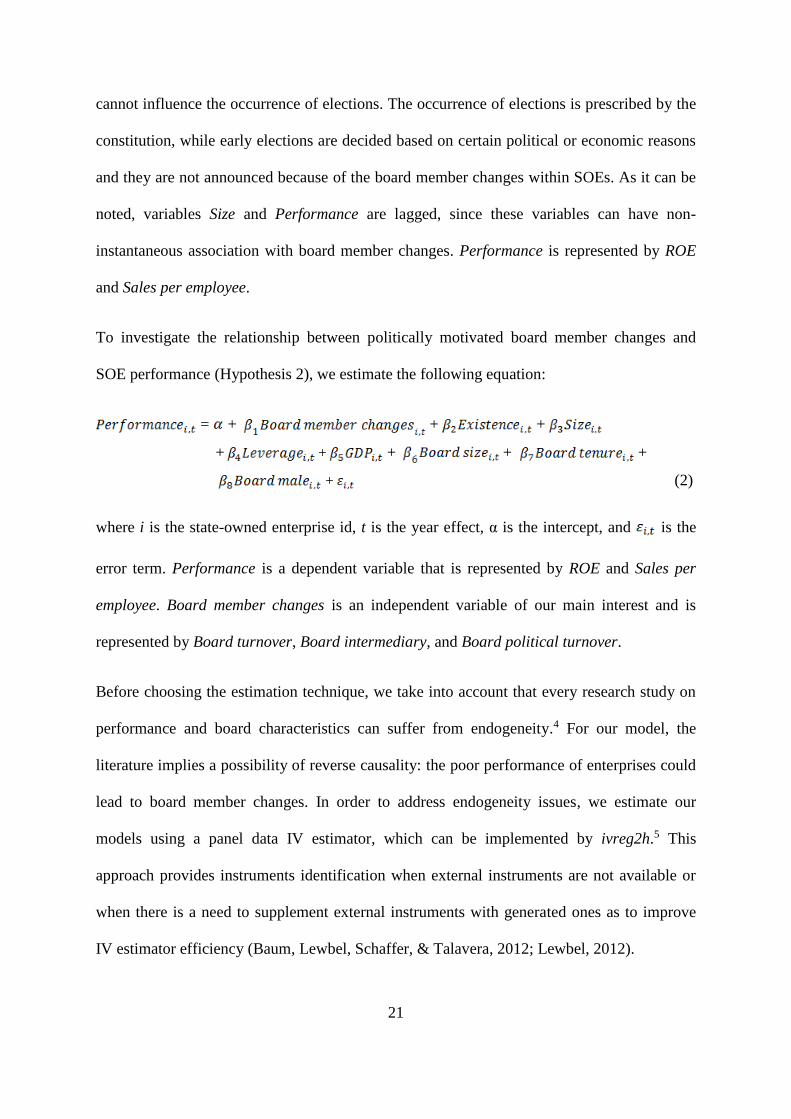
To investigate the relationship between politically motivated board member changes and
SOE performance (Hypothesis 2), we estimate the following equation:
= + + +
+ + + + +
+ (2)
where i is the state-owned enterprise id, t is the year effect, α is the intercept, and is the
error term. Performance is a dependent variable that is represented by ROE and Sales per
employee. Board member changes is an independent variable of our main interest and is
represented by Board turnover, Board intermediary, and Board political turnover.
Before choosing the estimation technique, we take into account that every research study on
performance and board characteristics can suffer from endogeneity.4 For our model, the
literature implies a possibility of reverse causality: the poor performance of enterprises could
lead to board member changes. In order to address endogeneity issues, we estimate our
models using a panel data IV estimator, which can be implemented by ivreg2h.5 This
approach provides instruments identification when external instruments are not available or
when there is a need to supplement external instruments with generated ones as to improve
IV estimator efficiency (Baum, Lewbel, Schaffer, & Talavera, 2012; Lewbel, 2012).
22
The ivreg2h implements Lewbel’s (2012) generated instruments approach, which consists of
two stages. In the first stage, each of the n endogenous variables ( ... ) is regressed on
exogenous variables ( ... ) using OLS. The generated predicted residuals ( ... ) from
this step are then multiplied by demeaned endogenous variables = ( - ) as to
construct instrument vector ... for each i ϵ 1...n. Within the second stage, we run the two-
step IV-GMM, where board member changes are treated as endogenous and are instrumented
by the internally generated instruments. In addition to those instruments, we create a vector of
externally selected instruments that are likely to have a direct effect on board member
changes but not performance of SOEs. The instruments include Parliamentary and Local
elections as they might create a non-instantaneous impact on SOE performance via board
member changes. In addition, for estimations of Board turnover and Board political turnover,
we use within-year board dynamics as an instrument.
We first estimate model (2) for the whole sample and then we re-estimate it within two sets
of sub-samples. To test Hypotheses 3a and 3b, we divide our sample on the basis of median
value for the number of employees. In that way we can investigate whether differences in
political importance of large, and small and medium SOEs are present. Additionally, we want
to recognise whether there are any differences among SOEs that are governed by different
ownership models (Hypothesis 4). For that reason, we depict SOEs that are governed by two
distinct and completely opposite ownership models - independent centralized body (Slovenia
and Croatia) and government governance (Serbia and Montenegro). In all estimations with
Board intermediary, we employ two additional variables, Board leavers and Board
appointments, to grasp additional layers of board dynamics.

23
Sample and summary statistics
Table 3 presents summary statistics for all variables in our estimations. In Panel A we report
performance characteristics of SOEs. We can conclude that during the observed period the
average financial SOE performance is negative since the average value of ROE is -5%. The
average Sales per employee is equal to €190.72 ($225.29). Based on Panel D we can see that
SOEs within our sample exist for 28 years on average and that they have on average 676
employees. The average Leverage is 33%, which is similar to findings of previous research
studies (e.g., 28.14% for politically connected enterprises (Faccio, 2010)).
Panel B of Table 3 reports summary statistics for board characteristics. On average, boards of
SOEs have five members, which is in line with good corporate governance practice suggested
by OECD. Boards are male dominated since on average 81% of board members are men. The
average Board tenure is approximately two years, while 0.33 board members spent less than
one year on boards. The average turnover of all board members is 19%, which is almost 50%
higher than what Franks and Mayer (2001) find for quoted German industrial and commercial
enterprises. In addition, the average turnover of politically connected board members is 10%.
On average, approximately 1.5 board members are appointed to boards each year, while 1.3
board members leave the board.
_ _ _ _ _ _ _ _ _ _ _ _ _ _ _ _
Insert Table 3 about here
_ _ _ _ _ _ _ _ _ _ _ _ _ _ _ _
Table 4 presents further analysis of board member changes by country in the period 2010-
2014. Five out of six countries have average board turnover between 17% and 21%, while for
other measures of board member changes analogous values are noted. Moreover, the

24
proportion of the total board members who left the board in each of the countries is
approximately 60%. Therefore, we can conclude that in countries within our sample, board
member changes follow quite similar patterns, thus providing us with a unique set-up for
investigation of political interference-performance relationship within SOEs.
_ _ _ _ _ _ _ _ _ _ _ _ _ _ _ _
Insert Table 4 about here
_ _ _ _ _ _ _ _ _ _ _ _ _ _ _ _
Table 5 reports correlations among variables. The correlation coefficients do not raise any
potential issues with multicollinearity.
_ _ _ _ _ _ _ _ _ _ _ _ _ _ _ _
Insert Table 5 about here
_ _ _ _ _ _ _ _ _ _ _ _ _ _ _ _
EMPIRICAL RESULTS AND DISCUSSION
Figures 1 to 3 provide an overview of the proportion of board member changes by year and
country, thus disclosing the link between board member changes and elections. They show
that the proportion of board member changes increases in most cases during election and
postelection years.6 Figure 1 points out that the proportion of Board turnovers is higher in
seven out of nine election years and in five out of six postelection years. Similarly, the
proportion of Board intermediary rises in four out of nine election years and in three out of
six postelection years (Figure 2). In election years, the proportion of Board political turnover
increases in five out of nine cases and in postelection years in five out of six cases, as
outlined in Figure 3. Therefore, similarities among all three measures in election and

25
postelection years are observed, implying the existence of the link between the election
cycles and board member changes within SOEs.
_ _ _ _ _ _ _ _ _ _ _ _ _ _ _ _
Insert Figure 1 about here
_ _ _ _ _ _ _ _ _ _ _ _ _ _ _ _
_ _ _ _ _ _ _ _ _ _ _ _ _ _ _ _
Insert Figure 2 about here
_ _ _ _ _ _ _ _ _ _ _ _ _ _ _ _
_ _ _ _ _ _ _ _ _ _ _ _ _ _ _ _
Insert Figure 3 about here
_ _ _ _ _ _ _ _ _ _ _ _ _ _ _ _
Table 6 shows the relationship between elections and board member changes. We find that
board member changes are higher during election years. In parliamentary election years
Board turnover, Board intermediary, and Board political turnover increase by approximately
9%, 23%, and 4% respectively. Moreover, previous year profitability (ROE) and productivity
levels (Sales per employee) are insignificant. Hence, performance as a proxy of market force
is not likely to induce board member changes within SOEs. These findings support our
Hypothesis 1 and the contention of Vickers and Yarrow (1988) that board member changes
within SOEs happen due to political rather than market forces. Moreover, these results
validate the usage of election variables as instruments for board member changes.
_ _ _ _ _ _ _ _ _ _ _ _ _ _ _ _
Insert Table 6 about here
_ _ _ _ _ _ _ _ _ _ _ _ _ _ _ _
26
Table 6 reveals one more important finding. The impact of Parliamentary elections is much
greater for changes of all board members (9%) than for changes of only politically connected
board members (4%). Thus, our results suggest that non-politically connected board members
suffer from social distancing and guilt by association syndrome (Labianca & Brass, 2006;
Yoshikawa et al., 2014). Yoshikawa et al. (2014) explain that outside board members without
political connections are likely to be faced with social distancing since a powerful owner can
replace them. The newly elected politicians assume that non-politically connected board
members are loyal to previous political regimes, and with their change politicians want to
avert any likelihood that their power might be destabilized (Dittmer & Wu, 1995). Therefore,
our results uncover a potential existence of informal political ties within SOEs that go beyond
the establishment of personal political ties. A larger magnitude of the Board intermediary
change in election years (23% vs. 9% and 4%) might indicate that politicians have the
tendency to appoint temporary boards with up to three-month tenures. The temporary boards
enable politicians to take over the control of certain SOEs right after the elections while
deciding which individuals deserve these positions in the long run based on their political
loyalty and obedience.
Other results from Table 6 show that Board tenure has a significant positive effect on Board
turnover and Board political turnover. The increase in the time spent on boards implies that
board members will be replaced as the end of their mandate is approaching. Contrary to that,
Board tenure has a negative effect on Board intermediary. With increase in time spent on
boards, fewer board members with tenures shorter than one year are replaced. The percentage
of men on boards seems to have an insignificant effect, while increase in Board size increases
the number of board member changes. Moreover, an upsurge in number of employees results
in a lower number of board member changes. Fan et al. (2007) argue that evaluation of SOE
27
boards depends also on certain social responsibilities, such as an increase in employment
levels. Hence, when employment levels are low there is a greater likelihood of a board
member change. Within our estimations we employ variance inflation factors (VIF) and we
find no evidence of multicollinearity.
In order to prove consistency of the results presented in Table 6, we perform several
robustness checks. First, we re-estimate the model (1) by controlling for leverage and the
percentage of board members with PhD degrees. We observe consistent results regarding the
impact of elections, which strengthens the argument that board member changes are
politically induced. Interestingly, the percentage of board members with PhD degrees has
negative significance for Board intermediary. Board members with higher qualifications are
expected to possess a greater level of expertise and knowledge, and as such they are less
likely to be replaced in short periods of time. Second, we check the possibility that the effect
of Parliamentary elections is non-instantaneous through employment of lagged
Parliamentary in model (1). We find negative significant coefficient for Board turnover, thus
confirming the literature implication that politicians want to ensure position and power as
soon as they are elected. The negative significance for Board intermediary supports the
notion that politicians use temporary boards in election years. Moreover, we find insignificant
coefficient for Board political turnover. Hence, results of this robustness check support
results presented in Table 6.
Table 7 presents the IV results for the board member changes-performance relationship. We
find that political interference via board member changes deteriorates SOE performance. The
estimates show a significant negative relationship between Board turnover and SOEs’
financial and operating performance, thus supporting our Hypothesis 2. Moreover, Board
intermediary is negatively associated with financial performance and is insignificant for

28
operating performance of SOEs. The descriptive statistics in Table 3 show that SOEs in our
sample have on average five board members with average Board turnover of approximately
20% (during one year one board member leaves the board). In terms of economic
significance, the results from Table 7 imply that the change of one board member (Board
turnover increase of 20 percentage points) results in a 3.2 percentage points decrease in ROE
and 16.6% decrease in Sales per employee. The change of one board member with less than a
year tenure decreases ROE by 0.01 percentage points. Contrary to that, we find that Board
political turnover has negative but insignificant association with both financial and operating
performance of SOEs. This might imply that non-politically connected board members
represent a more valuable “asset” for SOEs. Previous studies point out that politically
connected board members are appointed on the basis of their political loyalty and not their
professional qualifications (Barberis et al., 1998). For that reason, their change might not
influence performance of SOEs. However, we recognize that further analysis in this regard is
needed as to be able to create a well-based conclusion. In spite of insignificance, the negative
sign supports our findings of negative association between board member changes and
performance of SOEs.
_ _ _ _ _ _ _ _ _ _ _ _ _ _ _ _
Insert Table 7 about here
_ _ _ _ _ _ _ _ _ _ _ _ _ _ _ _
The negative association suggested by our results confirms findings of Crutchley et al. (2002)
that greater stability of board membership enhances enterprise performance. Moreover, our
results support Anderson and Chun (2014), who investigate the impact of board turnover on
performance of the S&P 500 enterprises. Their results show that the lowest levels of
performance are observed for enterprises in which five or more board members were changed

29
over three years. Essentially, frequent board member changes disrupt decision making,
leaving procedures and implementation processes unattended (Sharma, 1985). The non-
existence of perfect substitution for individuals, as noted by Sharma (1985), postpones re-
establishment of efficient working dynamics within boards. In addition, frequent board
member changes contribute to the lack of long-term perspective and dedication of individuals
who sit on boards, thus disrupting creation of sound strategic orientation. Consequently,
performance that is dependent from board member deliberation and board decisions is
negatively affected by unstable board memberships that are politically induced.
Table 7 also shows significant positive relationship between Board size and SOE operating
performance. This result is different from findings of Hermalin and Weisbach (2003) and
Menozzi et al. (2011), but it seems to support resource dependence theory in this regard. The
theory asserts that larger boards are able to establish a greater number of external links, thus
securing access to crucial resources (Pfeffer & Salancik, 1978). Moreover, Board tenure is
positively associated with performance of SOEs, since longer tenures imply greater
familiarity of board members with business operations. We also find that board members
leaving the board or being appointed to the board have negative effect on operating
performance. This is related to the appearance of the time lag that represents the period of
adjustment to the new board dynamics (Sharma, 1985). In addition, the presence of women
on boards does not improve performance of SOEs.
Results for control variables in Table 7 imply that larger SOEs have lower operating
performance. Enterprise Existence indicates that older enterprises have higher levels of
efficiency, probably due to better established procedures and prolonged market experience.
Macroeconomic conditions (GDP) seem not to have an effect on performance, which is
consistent with findings of previous research studies (e.g., Boubakri et al., 2012). Increase in

30
Leverage has a negative effect on financial performance, as it creates higher levels of
financial distress while at the same time creating positive effects on productivity levels, likely
due to investments in fixed assets, which improve efficiency.
The robustness of these results is confirmed through re-estimation of the model (2) in several
ways. First, we rerun the model with different macroeconomic control variables (e.g., real
GDP, inflation) and enterprise level controls (e.g., total debt/equity as leverage measure,
growth opportunities). The results of these regressions suggest the negative association
between Board turnover/Board intermediary and SOE performance, thus supporting the
findings presented above.
Second, it is possible that our enterprise level and board level controls have the delayed effect
on SOE performance. Therefore, we re-estimate the model (2) with lagged enterprise level
controls. We find a significant negative relationship of Board turnover with both measures of
performance. Board intermediary stays significant and negative for operating performance. In
addition, we re-run the model (2) with lagged enterprise and board level controls. The
significance of Board turnover in this estimation remains for financial performance, while
Board intermediary loses its significance. Interestingly, the coefficient on Board political
turnover becomes significant for financial performance. This result might imply that after
controlling for certain delayed effects, the loss of certain political connections negatively
affects SOE performance. The signs and significance for other variables in all robustness
checks are quantitatively similar to the ones reported.
Third, we try to complement our analysis on endogeneity using the difference-in-differences
(DID) approach with fixed-effects regression. We create treatment group (countries with
elections) and control group (countries without elections) and two interaction variables,
Treatment*election and Treatment*postelection, for detecting the differentiating effect of

31
elections on the board member changes in the treatment versus the control group.7 The
intertwined effects of parliamentary and local elections limit our ability to clearly specify the
treatment effect. Consequently, the significance of our results is absent. Notwithstanding, the
positive sign for both interaction variables suggests that in countries with elections, board
member changes are higher in election and postelection years than in countries with no
elections.
The second step of our main analysis investigates whether the political importance of large
SOEs alters the board member changes‒performance relationship. Our results in Table 8
suggest a significant negative relation between board member changes and performance of
small and medium SOEs and insignificant relation for large SOEs. These results are
inconsistent with our Hypotheses 3a and 3b, and the findings of Bertrand et al. (2007), which
assert that politicians use large SOEs to improve the likelihood of their re-election. However,
our results are in line with findings of Wu et al. (2012), who analyse the impact of political
connections on SOE performance in China. They explain that due to the importance of
central SOEs (which are at the same time large) for the normal functioning of private
enterprises, governments tend not to use those enterprises for fulfilment of their political
goals. Garrone, Grilli, and Rouseseau (2013) find that the effect of political interference on
large utility SOEs in Italy is uncertain. In addition, large enterprises are usually under the eye
of the media (O’Connell, 1995), and politicians may opt not to reveal themselves and
jeopardize their position.
Contrary to the above, small and medium SOEs are used by local officials for personal and
political goals to secure their political power (Wu et al., 2012). Jin, Yingyi, and Weingast
(2005) reveal that local officials are politically pressured to increase local employment and
they do so through SOEs. In addition, several other reasons might provide explanation for our

32
results. First, large SOEs have established procedures and systems that function despite board
member changes, unlike small and medium size SOEs. Moreover, small and medium SOEs
usually suffer from a lack of supervision and procedures, thus relying to a greater extent on
board decision-making processes. Consequently, political interference via board member
changes affects board deliberation, decision making, and performance of small and medium
SOEs. The results for all other variables are consistent with the results for the whole sample.
Table 8 also shows the Hausman test metrics that confirm the existence of statistically
significant differences between coefficients from two sub-samples.
_ _ _ _ _ _ _ _ _ _ _ _ _ _ _ _
Insert Table 8 about here
_ _ _ _ _ _ _ _ _ _ _ _ _ _ _ _
Within the last step of our main analysis we determine whether different governing models
for state ownership create any dissimilarities in the board member changes-performance
relationship. Table 9 presents results for the centralized and government model. The results
imply that for SOEs under the centralized model, politically induced board member changes
are insignificant in terms of their performance. The insignificant result is in line with
literature which suggests that independent body governing state ownership curtails
opportunities for political interference within SOEs (Musacchio et al., 2015). Moreover,
board nomination and appointment procedures within the centralized model are based on
professional qualifications of individuals and not their political loyalty (World Bank, 2014).
The results also imply positive board member changes-performance relationship in countries
with government model. This result could be in line with the efforts of the governments of
Serbia and Montenegro to professionalise board membership. Due to this result and its
33
implications we do not find the support for our Hypothesis 4. Other results in Table 9 are
consistent with results for the whole sample such as enterprise size, enterprise existence, etc.
As it can be noted, GDP and Leverage are excluded from re-estimations in both sub-samples.
The reason for this is related to the significant drop in the number of observations, while the
results of estimations with and without these variables are analogous. The estimations with
GDP and Leverage are available upon request. We also observe significant statistical
differences between sets of coefficients for these two sub-samples as indicated by Hausman
test metrics.
_ _ _ _ _ _ _ _ _ _ _ _ _ _ _ _
Insert Table 9 about here
_ _ _ _ _ _ _ _ _ _ _ _ _ _ _ _
CONCLUSION
Prior literature recognizes the general contingency of personal-level political ties and their
values/costs for performance of enterprises, but it neglects the examination and analysis of
their heterogeneity. Previous research studies fell short in recognizing the informal channels
through which politicians and businesspeople might influence each other (Sun et al., 2015).
Considering that, our study examines whether election cycles rather than market forces lead
to board member changes as well as how these board member changes relate to the
performance of 200 SOEs in six countries of the former SFRY.
Overall, our results reveal that board member changes are politically motivated rather than
performance induced. We also find that political interference via instable board membership
is negatively associated with performance of SOEs. In addition, our findings imply that the

34
significance and magnitude of this association depends on the SOE’s political importance and
ownership models. The results show that politically induced board member changes are
insignificant for performance of large SOEs and SOEs governed by an independent
government body.
The empirical findings of this study have several important implications. They reveal a more
nuanced picture of political tie heterogeneity and show another channel for political
interference within SOEs. In that way, we extend the political embeddedness perspective by
enabling multilevel investigation of political influence and its impact on the behaviour of
SOEs. Unlike previous research studies, our study also acknowledges the importance of
differentiation among government ownership ties on the basis of adopted ownership models.
Our findings in this regard might have important implications for policymakers. In particular,
the results show that policymakers should adopt a centralized ownership model to create a
shield from political interference. Recognizing that a centralized ownership model might not
be appropriate for all countries due to their specificities, policymakers can at least ensure that
appointment of board members is based on knowledge, skills, and competences rather than
political allegiance.
Even though we have undertaken a careful analysis we acknowledge that our study has
several limitations that suggest implications for future research. First, further examination of
the characteristics of replaced board members (e.g., expertise, work experience) will enrich
the understanding of why board member changes increase in years of elections. Second, in
our study we do not take into account that board member changes might depend on distinct
personal political ties. For example, board members working in private enterprises with
political connections are less likely to be replaced than government officials with direct
political ties. Such analysis would provide us with insights regarding the underlying

35
mechanisms of politically induced board member changes. Third, as noted within the political
embeddedness perspective, political ties create certain benefits as well as costs. Therefore,
empirical research that would disentangle benefits and costs of individual board replacements
in years of elections would provide us with better understanding of the impact of politically
induced board member changes on SOE performance.
ENDNOTES
1 The total number of SOEs ranges from 15 in Montenegro to at least 80 in Slovenia. For
example, level of state ownership in Slovenia is one of the highest among OECD
countries. In 2012, the SOE sector in Slovenia accounted for 11% of the total employment,
which is three times higher than the OECD average (OECD, 2014). Moreover, in the same
year SOEs in Serbia and Croatia employed 7% and 6.3% of the total employment
respectively (Arsic, 2012; Croatian Bureau of Statistics, 2012; DUUDI, 2013).
Governments have a majority state ownership in strategically important SOEs (e.g.,
energy, transport, telecommunication, utilities) that contribute to the overall functioning of
their economies.
2 Our definition of politically connected board members takes into consideration definitions
of political connectedness from previous literature (e.g., Faccio, 2006; Faccio, 2010;
Menozzi et al., 2011; Zheng et al., 2015). Hence, within the scope of our study we define
politically connected board members as: (1) those who hold or held position in central or
local government, parliament, or some other governmental body; (2) those who are
members of the political party; (3) those who participated in election cycles as citizen
representatives; (4) those who have close relationships (e.g., relatives, friends) with
current/past government/parliament officials or political party representatives.
3 The dummy variable for parliamentary elections takes value one for the following years
and countries: 2010-Bosnia and Herzegovina; 2011-Croatia, FYR Macedonia, Slovenia;
2012-Serbia, Montenegro; 2014-Bosnia and Herzegovina, FYR Macedonia, Serbia,
Slovenia. Following the same approach, the dummy variable for local elections takes value
one in: 2010-Bosnia and Herzegovina, Montenegro, Slovenia; 2012-Bosnia and
Herzegovina, Serbia; 2013-Croatia, FYR Macedonia; 2014-Montenegro, Serbia, Slovenia.
Both of these dummy variables are time variant.
4 Endogeneity appears whenever the expected value of the error term is not equal zero and
when there is a correlation between independent variable and the error term. This can be
caused by one of the following: (1) omitted variable - a variable that is relevant cannot be
measured and proper proxy cannot be found; (2) measurement error in regressor; and (3)

36
reverse causality. Research papers that investigated the political interference-performance
relationship independently from the econometric methodology and measure of political
interference that they employ all acknowledge possible presence of endogeneity within
their estimations. For further reference please see Adams, Hermalin, and Weisbach (2010),
Hu and Leung (2012), Ding et al. (2014), Menozzi et al. (2011), and O’Connell and
Cramer (2010).
5 ivreg2h is an instrumental variables estimation using heteroscedasticity based instruments
and Stata command that was written by Baum and Schaffer (2012). ivreg2h uses a two-
step GMM estimation. This technique was used by several researchers (e.g., Bremus and
Buch, 2015; Mishra and Smyth, 2015).
6 For countries where elections happened at the beginning or end of the observed period, we
are not able to observe prior or post levels of board member changes. In Bosnia and
Herzegovina, the elections took place in 2010, so we cannot observe whether the level of
board member changes increased due to the lack of data for 2009. Therefore, we count out
this election year when we calculate the number of years in which there was an increase of
board member changes in an election year. We apply same reasoning for postelection
years for which the data is not available, and we therefore discuss nine election years and
six postelection years in Figures 1, 2, and 3. Since these cases represent the minority, we
do not have a reason to believe that they would significantly change our conclusion.
7 We create the treatment and control group by using binary variable Treatment, which takes
value 1 for enterprises in Serbia and Montenegro (treatment group) and 0 for Bosnia and
Herzegovina (control group). We also create the Election dummy variable, which takes
value 1 for 2012 and 0 otherwise. This is due to the fact that in Serbia and Montenegro,
parliamentary elections were held in 2012 and in the same year there were no
parliamentary elections in Bosnia and Herzegovina. In addition, we create a Postelection
dummy variable which takes value 1 for 2013 and 0 otherwise. Both of these variables are
employed within our estimation in order to control for time trends. We also create two
interaction variables, Treatment*election and Treatment*postelection, to be able to detect
differentiating effect of elections on the board member changes in the treatment group
versus the control group. Before estimating our models, we match enterprises in terms of
size and industry. The underlying reason for insignificance of interaction coefficients is
related to intertwined effects of parliamentary and local elections. Considering that
parliamentary and local elections happen in different years in different countries, it is quite
difficult to depict the treatment and control groups in which board member changes are not
influenced by effects of some post or pre-election cycles. Therefore, differentiating effect
of the treatment becomes insignificant due to the decrease in difference between board
member changes within the treatment and control group. We tried re-estimating the model
with different specification of the treatment and control groups. In all cases, the interaction
variables have positive sign but remain insignificant, which additionally confirms the
interplay of post and/or pre-election effects.
37
REFERENCES
Adams, R. B., Hermalin, B. E., & Weisbach, M. S. 2010. The role of boards of
directors in corporate governance: a conceptual framework survey. Journal of Economic
literature, 48(1): 58-107.
Adhikari, A., Derashid, C., & Zhang, H. 2006. Public policy, political connections
and effective tax rates: longitudinal evidence from Malaysia. Journal of Accounting and
Public Policy, 25(5): 574-595.
Agrawal, A., & Knoeber, C. R. 2001. Do some outside directors play a political role?
The Journal of Law and Economics, 44(1): 179-198.
Anderson, G. M., & Chun, D. 2014. How much board turnover is best? Harvard
Business Review, 92(4): 26-42.
Arsic, M. 2012. Reform of state and social enterprises, Quarterly Monitor, 28: 72-82.
Barberis, N., Shleifer, A., & Vishny, R. 1998. A model of investor sentiment. Journal
of Financial Economics, 49: 307-343.
Baum, C. F., & Schaffer, M.E. 2012. ivreg2h: Stata module to perform instrumental
variables estimation using heteroskedasticity-based instruments. Retrieved on February 10,
2016, from http://ideas.repec.org/c/boc/bocode/s457555.html.
Baum, C. F., Lewbel, A., Schaffer, M. E., & Talavera, O. 2012. Instrumental
variables estimation using heteroskedasticity-based instruments. Presented at the UK Stata
Users Group Meeting 2012, London.
Bertrand, M., Kramarz, F., Schoar, A., & Thesmar, D. 2007. Politicians, firms and
political business cycles: evidence from France. Working paper, University of Chicago
Graduate School of Business, Chicago, IL.
Bicanic, R. 2010. Economic policy in socialist Yugoslavia. Cambridge: Cambridge
University Press.
Boardman, A. E., & Vining, R. V. 1989. Ownership and performance in competitive
environments: A comparison of the performance of private, mixed and state-owned
enterprises. Journal of Law and Economics, 32(1): 1-33.
Boubakri, N., Cosset, J., & Saffar, W. 2008. Political connections of newly privatized
firms. Journal of Corporate Finance, 14(5): 654-673.
Boubakri, N., Cosset, J., & Saffar, W. 2012. The impact of political connections on
firms' operating performance and financing decisions. Journal of Financial Research, 35(3):
397-423.
Boycko, M., Shleifer, A., & Vishny, R. 1996. A theory of privatization. Economic
Journal, 106(435): 309-319.
38
Bozec, R., Breton, G., & Cote, L. 2002. The performance of state-owned enterprises
revisited. Financial Accountability and Management, 18(4): 383-407.
Bremus, F., & Buch, C. M. 2015. Banking market structure and macroeconomic
stability: are low-income countries special? Pacific Economic Review, 20(1): 73-100.
Buchanan, J. M., & Tullock, G. 1962. The calculus of consent: Logical foundations
of constitutional democracy. Michigan: University of Michigan Press.
Capobianco, A., & Christiansen, H. 2011. Competitive neutrality and state-owned
enterprises: Challenges and policy options. OECD Corporate Governance Working Papers
1, OECD Publishing, Paris, France.
Carter, D., Simkins, B., & Simpson, G. 2003. Corporate governance, board diversity
and firm value. Financial Review, 38(1): 33-53.
Catalyst, 2004. The bottom line: Connecting corporate performance and gender
diversity. New York: Catalyst.
Chen, S., Sun, Z., Tang, S., & Wu, D. 2011. Government intervention and investment
efficiency: Evidence from China. Journal of Corporate Finance, 17(2): 257-271.
Chen, Y. S., Shen, C. H., & Lin, C. Y. 2014. The benefits of political connections:
Evidence from individual bank-loan contracts. Journal of Financial Services Research,
45(3): 287-305.
Chong, A., & Lopez-de-Silanes, F. 2005. Privatization in Latin America: Myths and
reality. Redwood City: Stanford University Press.
Croatian Bureau of Statistics 2012. Employment statistics. Retrieved on June 15,
2015, from https://www.dzs.hr/.
Crutchley, C. E., Garner, J. L., & Marshall, B. B. 2002. An examination of board
stability and the long-term performance of initial public offerings. Financial Management,
31(3): 63-90.
De Alessi, L. 1969. Some implications of property rights for government investment
choices. American Economic Review, 59(1): 16-23.
De Alessi, L. 1973. Private property and dispersion of ownership in large
corporations. The Journal of Finance, 28(4): 839-851.
Dewenter, K. L., & Malatesta, P. H. 2001. State-owned and privately owned firms:
An empirical analysis of profitability, leverage, and labor intensity. American Economic
Review, 91(1): 320-334.
Dinc, I. S. 2005. Politicians and banks: Political influences on government-owned
banks in emerging markets. Journal of Financial Economics, 77(2): 453-459.

39
Ding, S., Jia, C., Wu, Z., & Zhang, X. 2014. Executive political connections and firm
performance: Comparative evidence from privately-controlled and state-owned enterprises.
International Review of Financial Analysis, 36: 153-167.
Dittmer, L., & Wu, Y.-S. 1995. The modernization of factionalism in Chinese politics.
World Politics. 47(4): 467–494.
DUUDI 2013. Annual report on operations of strategically important enterprises for
the Republic of Croatia. Retrieved on April 8, 2016, from
https://imovina.gov.hr/UserDocsImages//dokumenti.
Faccio, M. 2006. Politically connected firms. American Economic Review, 96(1):
369-386.
Faccio, M. 2010. Differences between politically connected and nonconnected firms:
A cross-country analysis. Financial Management, 39(3): 905-928.
Fan J.P.H., Wong T.J., & Zhang T. 2007. Politically connected CEOs, corporate
governance, and post-IPO performance of China’s newly partially privatized firms. Journal
of Financial Economics, 84(2): 330-357.
Fama, E. F., & Jensen, M. C. 1983. Separation of ownership and control. Journal of
Law and Economics, 26(2): 301-325.
Franks, J., & Mayer, C. 2001. Ownership and control of German corporations. The
Review of Financial Studies, 14(4): 943-977.
Garrone, P., Grilli, L., & Rouseseau, X. 2013. Management discretion and political
interference in municipal enterprises: Evidence from Italian utilities. Local Government
Studies, 39(4): 514-540.
Gilson, S. C. 1990. Management turnover and financial distress. Journal of
Financial Economics, 25(2): 241-262.
Goldeng, E., Grunfeld, L. A., & Benito, G. R. G. 2004. The inferior performance of
state owned enterprises: Is it due to ownership or market structure? Working paper no. 663,
Norwegian Institute of International Affairs, Oslo, Norway.
Goldman, E., Rocholl, J., & So, J. 2009. Do politically connected boards affect firm
value? The Review of Financial Studies, 22(6): 2331-2360.
Goldman, E., So, J., & Rocholl, J. 2013. Politically connected boards of directors and
the allocation of procurement contracts. The European Financial Review, 17(5): 1617-1648.
Greene, J. 2014. State-owned enterprises: justifications, risks and reform. Presented
at Fiscal Analysis and Forecasting Workshop of the IMF Institute for Capacity Development,
Bangkok, Thailand.

40
Grosman, A., Okhmatovskiy, I., & Wright, M. 2016. State control and corporate
governance in transition countries: 25 Years on from 1989. Corporate Governance: An
International Review, 24(3): 200-221.
Haniffa, R., & Hudaib, M. 2006. Corporate governance structure and performance of
Malaysian listed companies. Journal of Business Finance & Accounting, 33(7&8): 1034-
1062.
Hannan, M. T., & Freeman J. 1989. Organization ecology. Cambridge: Cambridge
Univeristy Press.
Hermalin, B. E., & Weisbach, M. S. 2003. Boards of directors as an endogenously
determined institution: A survey of the economic literature. Economic Policy Review, 9(1):
1-20.
Hillman, A. J. 2005. Politicians on the board of directors: do connections affect the
bottom line. Journal of Management, 31(3): 464-481.
Holstrom, B. 1979. Moral hazard and observability, Bell Journal of Economics,
10(1): 74-91.
Horvat, B. 1971. Yugoslav economic policy in the post-war period: problems, ideas,
institutional Development. American Economic Review, 61(3/2): 71-169.
Hu, F., & Leung, S. C. M. 2012. Top management turnover, firm performance and
government control: Evidence from China’s listed state-owned enterprises. The International
Journal of Accounting, 47(2): 235-262.
Inoue, C. F. K. V., Lazzarini, S. G., & Musacchio, A. 2013. Leviathan as a minority
shareholder: firm-level implications for equity purchases by the state. Academy of
Management Journal, 56(6): 1775-1801.
Jensen, M. C., & Meckling, W. H. 1976. Theory of the firm: Managerial, behaviour,
agency costs and ownership structure. Journal of Financial Economics, 3(4): 305-360.
Jin, H., Yingyi, Q., & Weingast, R. B. 2005. Regional decentralization and fiscal
incentives: Federalism, Chinese Style. Journal of Public Economics, 89(9-10): 1719-1742.
Khwaja, A. I., & Mian, A. 2005. Do lenders favor politically connected firms? Rent
provision in an emerging financial market. Quarterly Journal of Economics, 120(4): 1371-
1411.
Kernaghan, K. 1986. Political rights and political neutrality: finding the balance point.
Canadian Public Administration, 29(4): 639-652.
Krueger, A. 1990. Government failures in development. The Journal of Economic
Perspective, 4(3): 9-23.

41
La Porta, R., Lopez-de-Silanes, F., Shleifer, A., & Vishny, R. 2002. Investor
protection and corporate valuation. The Journal of Finance, 57(3): 1147–1170.
Labianca, G. J., & Brass, D. J. 2006. Exploring the social ledger: negative
relationships and negative asymmetry in social networks in organizations. Academy of
Management Review, 31(3): 596-614.
Lewbel, A. 2012. Using heteroscedasticity to identify and estimate mismeasured and
endogenous regressor models. Journal of Business and Economic Statistics, 30(1): 67-80.
Li, C., & Bachman, D. 1989. Localism, elitism, and immobilism: elite formation and
social change in post-Mao China. World Politics, 42(1): 64–94.
McIntyre, M. L., Murphy, S. A., & Mitchell, P. 2007. The top team: examining board
composition and firm performance. Corporate Governance: The International Journal of
Business in Society, 7(5): 547–561.
Menozzi, A., Gutierrez Urtiaga, M., & Vannoni, D. 2011. Board composition,
political connections, and performance in state-owned enterprises. Industrial and Corporate
Change, 21(3): 671–698.
Michelson, E. 2007. Lawyers, political embeddedness, and institutional continuity in
China's transition from socialism. American Journal of Sociology, 113(2): 352-414.
Mishra, V., & Smyth, R. 2015. Estimating returns to schooling in urban China using
conventional and heteroskedasticity-based instruments. Economic Modelling, 47: 166-173.
Musacchio, A., Pineda Ayerbe, E. I., & García, G. 2015. State-owned enterprise
reform in LatinAmerica: Issues and possible solutions. Discussion paper no. IDB-DP-401,
Inter-American Development Bank, Washington DC, USA.
Narodne novine 2012. Odluka o odredjivanju uvjeta za kandidate za clanove
nadzornih odnosno upravnih odbora, te uprava trgovackih drustava u kojima Republika
Hrvatska ima dionice ili udjele. Retrieved on January 21, 2016, from http://narodne-
novine.nn.hr/clanci/sluzbeni/2012_02_19_520.html.
O'Connell, V. 1995. The information content of security prices on the Irish stock
exchange. British Accounting Review, 27(4): 311-324.
O’Connell, V., & Cramer, N. 2010. The relationship between firm performance and
board characteristics in Ireland. European Management Journal, 28(5): 387–399.
OECD 2012. Competitive neutrality: Maintaining a level playing field between
public and private business. Paris: OECD Publishing.
OECD 2014. The size and sectoral distribution of SOEs in OECD and partner
countries. Paris: OECD Publishing.
42
OECD 2015. Guidelines on corporate governance of state-owned enterprises. Paris:
OECD Publishing.
Official Gazzete of the Federation of Bosnia and Herzegovina 2012. Law on SOEs in
Federation of Bosnia and Herzegovina. Official Gazzete Number 08/05, 81/08, 22/09 and
109/12. Retrieved on September 14, 2015, from
http://mp.ks.gov.ba/preuzimanja/legislativa/zakon-o-javnim-preduze-ima-u-federaciji-bih.
Official Gazzete of the Former Yugoslav Republic of Macedonia 2013. Law on SOEs.
Official Gazzete Number 38/96, 6/2002, 40/2003, 49/2006, 22/2007, 83/2009, 97/10, 6/12
and 109/13. Retrieved on September 14, 2015, from http://www.roads.org.mk/329/zakon-za-
javni-pretprijatija.
Okhmatovskiy, I. 2010. Performance implications of ties to the government and
SOEs: A political embeddedness perspective. Journal of Management Studies, 47(6): 1020-
1047.
Opper, S., Nee, V., & Brehm, S. 2015. Homophily in the career mobility of China's
political elite. Social Science Research, 54: 332-352.
Pfeffer, J., & Salancik, G. R. 1978. The external control of organizations: A
resource dependence perspective. New York: Harper and Row.
PwC 2015. State-owned enterprises: Catalysts for public value creation? Retrieved on
May 5, 2015, from https://www.pwc.com/gx/en/psrc/publications/assets/pwc-state-owned-
enterprise-psrc.pdf
Ross, S. 1973. The economic theory of agency: The principal’s problem. American
Economic Review, 63(2): 134-139.
Sharma, R. A. 1985. Corporate board and performance. Economic and Political
Weekly, 20(8): 17-23.
Shleifer, A., & Vishny, R.W. 1994. Politicians and firms. Quarterly Journal of
Economics, 109(4): 995-1025.
Shleifer, A., & Vishny, R. W. 1997. A survey of corporate governance. The Journal
of Finance, 52(2): 737-783.
Slovenian Sovereign Holding 2011. Rules on supervisory board selection (conditions,
criteria, procedures and evaluation for determining suitability and selecting potential
candidates for members of supervisory bodies of companies with state's capital assets).
Retrieved on June 10, 2015, from http://sdh.si/doc/ENG-
News/Asset%20managament/Rules%20on%20Supervisory%20Board%20Members%20Sele
ction-amended%20Jan15.pdf.
Smith, K. G., Smith, K. A., O’Bannon, D. P., Olian, J. D., Sims, H. P., & Scully, J.
1994. Top management team demography and process: The role of social integration and
communication. Administrative Science Quarterly, 39(3): 412-438.
43
Su, Z.-Q., & Fung, H.-G. 2013. Political connections and firm performance in
Chinese companies. Pacific Economic Review, 18(3): 283-317.
Sun, P., Mellahi, K., Wright, M., & Xu, H. 2015. Political tie heterogeneity and the
impact of adverse shocks on firm value. Journal of Management Studies, 52(8): 1036-1063.
Tian, J. J., & Lau, C.-M. 2001. Board composition, leadership structure and
performance in Chinese shareholding companies. Asia Pacific Journal of Management,
18(2): 245-263.
Vagliasindi, M. 2008. The effectiveness of board of directors of state owned
enterprises in developing countries. World Bank Sustainable Development Network Policy
Research Working Paper 4579, World Bank, Washington, USA.
Vickers, J., & Yarrow, G. 1988. Privatization: An economic analysis. Cambridge:
MIT Press.
Vining, A. R., & Boardman, A. E. 1992. Ownership versus competition: Efficiency in
public enterprise. Public Choice, 73(2): 205-239.
Wang, C., Hong, J., Kafouros, M., & Wright, M. 2012. Exploring the role of
government involvement in outward FDI from emerging economies. Journal of
International Business Studies, 43(7): 655-676.
Wong, S. C. Y. 2004. Improving corporate governance in SOEs: An integrated
approach. Corporate Governance International, 7(2): 5-15.
World Bank 2006. Held by the visible hand: The challenge of SOE corporate
governance for emerging markets. Washington DC: World Bank.
World Bank 2014. Corporate governance of state-owned enterprises: A toolkit.
Washington DC: World Bank.
Wu, J., & Cheng, M.L. 2011. The impact of managerial political connections and
quality on government subsidies. Chinese Management Studies, 5(2): 207-226.
Wu, W., Wu, C., Zhou, C., & Wu, J. 2012. Political connections, tax benefits and firm
performance: Evidence from China. Journal of Accounting and Public Policy, 31(3): 277-
300.
Yermack, D. 1996. Higher market valuation of companies with a small board of
directors. Journal of Financial Economics, 40(2): 185-211.
Yoshikawa, T., Zhu, H., & Wang P. 2014. National governance system, corporate
ownership, and roles of outside directors: A corporate governance bundle perspective.
Corporate Governance: An International Review, 22(3): 252-265.

44
Zheng, W., Singh, K., & Mitchell, W. 2015. Buffering and enabling: The impact of
interlocking political ties on firm survival and sales growth. Strategic Management Journal,
36(11): 1615-1636.

45
TABLE 1
Governing models for state ownership, appointment procedures and criteria for board membership
Governance model adopted Procedure for appointment of board members Criteria for board membership
Bosnia and Herzegovina Decentralized ownership model
Line ministries are responsible for
monitoring and exercising ownership
rights.
Line ministries create decision proposals on appointment of board
members. The proposal is sent to shareholders assembly for confirmation.
The details about procedures are stipulated in the Law on SOEs in
Federation of Bosnia and Herzegovina (Official Gazzete of the Federation
of Bosnia and Herzegovina, 2012).
Aside from the general provisions within the
laws detailed criteria for board membership is
not stated and the criteria is usually determined
by line ministries for each individual public call.
Croatia Centralized ownership model
Independent government body DUUDI
is responsible for monitoring and
exercising ownership rights.
The procedure for appointment of supervisory board members is initiated
by line ministry, but DUUDI conducts the public call. After public call
DUUDI creates a proposal with justification for each candidate and this
proposal is then forwarded to government for adoption.
Criteria for board membership is determined by
government through adoption of the official
decision in which position requirements are
defined e.g., educational level, expertise
(Narodne novine, 2012).
FYR Macedonia Decentralized ownership model
Line ministries are responsible for
monitoring and exercising the
ownership rights.
Line ministries create proposals of decisions on appointment of board
members. The proposal is sent to the government for adoption. The details
about procedures are stipulated in the Law on public enterprises in
Macedonia (Official Gazzete of the FYR Macedonia, 2013).
Aside from the general provisions within the
laws detailed criteria for board membership is
not stated and the criteria is usually determined
by line ministries for each public call.
Montenegro Government ownership model
The quasi decentralized model in which
de facto the government governs SOEs,
while de jure line ministries are
responsible.
The line ministry prepares a call for appointment of board members.
Governmental committee or office for appointments takes over the call,
announces the process, governs the procedure and decides on candidates
to be proposed. The final decision on appointment is made by government
and sent to shareholders assembly for confirmation.
The only criteria stated in legal provisions is that
board members cannot work for SOEs' auditor,
perform duty of executive director or be
convicted for any crime.
Serbia Government ownership model
The quasi decentralized model in which
de facto the government governs SOEs,
while de jure line ministries are
responsible.
The line ministry prepares a call for appointment of board members.
Governmental committee or office for appointments takes over the call,
announces the process, governs the procedure and decides on candidates
to be proposed. The final decision on appointment is made by government
and sent to shareholders assembly for confirmation.
Criteria for appointment of board members such
as education, work experience and level of
expertise is stated in legal provisions of Serbian
laws (e.g., Law on SOEs).
Slovenia Centralized ownership
Independent government body called
Slovenian Sovereign Holding is
responsible for monitoring and
exercising ownership rights.
Personal commission within Slovenian Sovereign Holding carries out
recruitment process for supervisory board membership and sends
proposals to shareholders assembly for confirmation (Slovenian Sovereign
Holding, 2011).
The Slovenian Sovereign Holding's Rules on
supervisory board member selection and other
regulatory documents provide detailed criteria
for supervisory board membership (e.g., level of
education, work experience, postulates about
non-political involvement etc).
Notes: Description of governing models for state ownership, appointment procedures, and criteria for board membership in six countries of the former SFRY for the period 2010-2014.
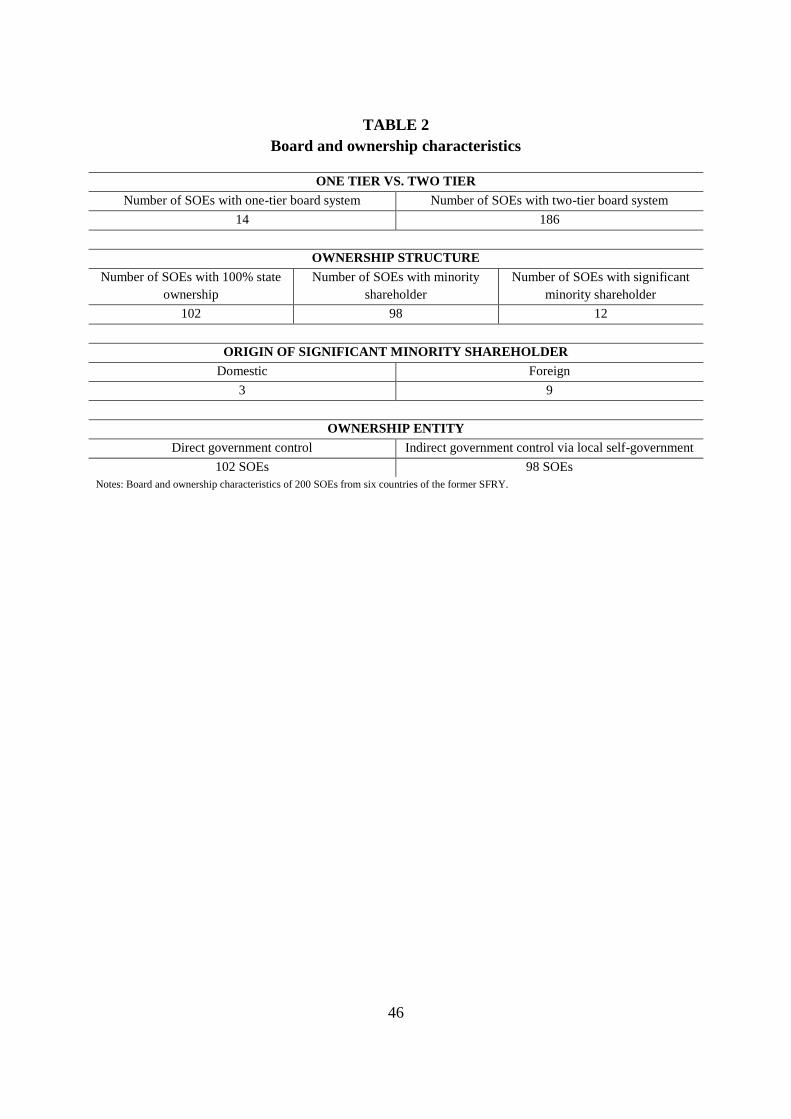
46
TABLE 2
Board and ownership characteristics
Notes: Board and ownership characteristics of 200 SOEs from six countries of the former SFRY.
ONE TIER VS. TWO TIER
Number of SOEs with one-tier board system Number of SOEs with two-tier board system
14 186
OWNERSHIP STRUCTURE
Number of SOEs with 100% state
ownership
Number of SOEs with minority
shareholder
Number of SOEs with significant
minority shareholder
102 98 12
ORIGIN OF SIGNIFICANT MINORITY SHAREHOLDER
Domestic Foreign
3 9
OWNERSHIP ENTITY
Direct government control Indirect government control via local self-government
102 SOEs 98 SOEs
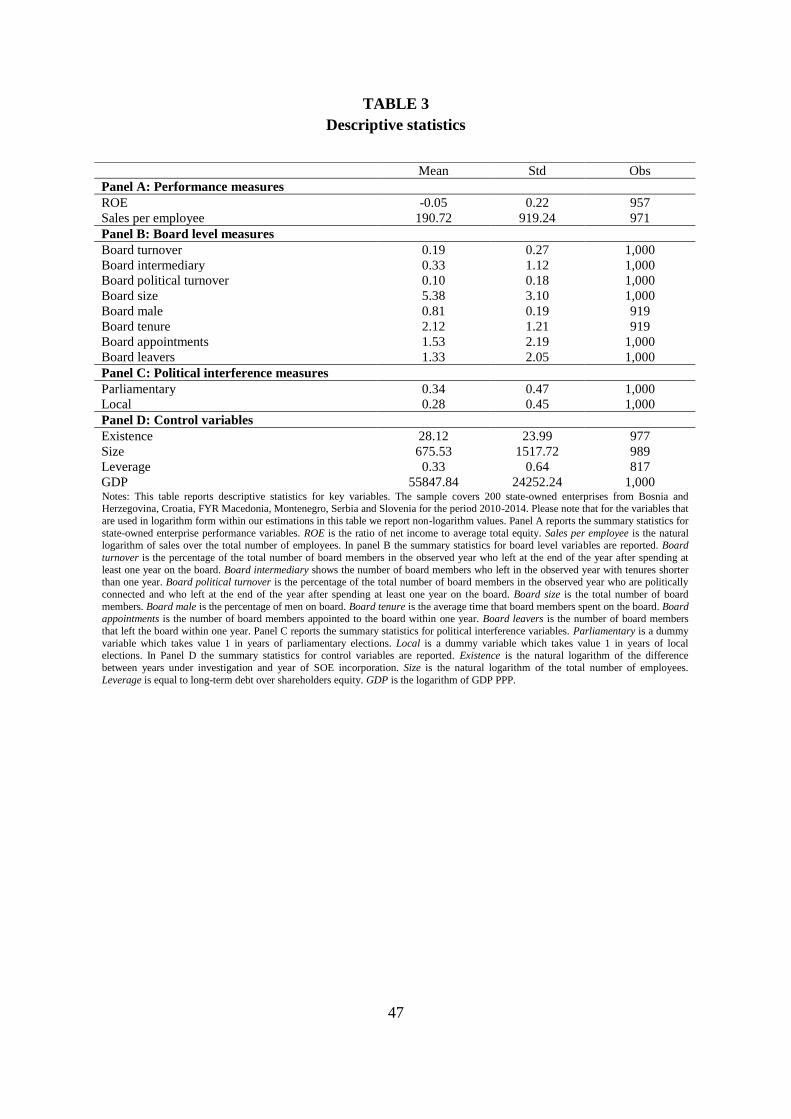
47
TABLE 3
Descriptive statistics
Notes: This table reports descriptive statistics for key variables. The sample covers 200 state-owned enterprises from Bosnia and Herzegovina, Croatia, FYR Macedonia, Montenegro, Serbia and Slovenia for the period 2010-2014. Please note that for the variables that
are used in logarithm form within our estimations in this table we report non-logarithm values. Panel A reports the summary statistics for
state-owned enterprise performance variables. ROE is the ratio of net income to average total equity. Sales per employee is the natural logarithm of sales over the total number of employees. In panel B the summary statistics for board level variables are reported. Board
turnover is the percentage of the total number of board members in the observed year who left at the end of the year after spending at
least one year on the board. Board intermediary shows the number of board members who left in the observed year with tenures shorter than one year. Board political turnover is the percentage of the total number of board members in the observed year who are politically
connected and who left at the end of the year after spending at least one year on the board. Board size is the total number of board
members. Board male is the percentage of men on board. Board tenure is the average time that board members spent on the board. Board appointments is the number of board members appointed to the board within one year. Board leavers is the number of board members
that left the board within one year. Panel C reports the summary statistics for political interference variables. Parliamentary is a dummy
variable which takes value 1 in years of parliamentary elections. Local is a dummy variable which takes value 1 in years of local elections. In Panel D the summary statistics for control variables are reported. Existence is the natural logarithm of the difference
between years under investigation and year of SOE incorporation. Size is the natural logarithm of the total number of employees.
Leverage is equal to long-term debt over shareholders equity. GDP is the logarithm of GDP PPP.
Variable Mean Std Obs
Panel A: Performance measures
ROE -0.05 0.22 957
Sales per employee 190.72 919.24 971
Panel B: Board level measures
Board turnover 0.19 0.27 1,000
Board intermediary 0.33 1.12 1,000
Board political turnover 0.10 0.18 1,000
Board size 5.38 3.10 1,000
Board male 0.81 0.19 919
Board tenure 2.12 1.21 919
Board appointments 1.53 2.19 1,000
Board leavers 1.33 2.05 1,000
Panel C: Political interference measures
Parliamentary 0.34 0.47 1,000
Local 0.28 0.45 1,000
Panel D: Control variables
Existence 28.12 23.99 977
Size 675.53 1517.72 989
Leverage 0.33 0.64 817
GDP 55847.84 24252.24 1,000

48
TABLE 4
Board member changes per country
Notes: Board turnover is the percentage of the total number of board members in the observed year who left at the end of the year after spending at
least one year on the board. Board intermediary shows the number of board members who left in the observed year with tenures shorter than one year. Board political turnover is the percentage of the total number of board members in the observed year who are politically connected and who
left at the end of the year after spending at least one year on the board.
MEAN VALUES OF BOARD MEMBER CHANGES PER COUNTRY
Bosnia and
Herzegovina Croatia
FYR
Macedonia Montenegro Serbia Slovenia
Board turnover 0.17 0.21 0.33 0.21 0.20 0.18
Board intermediary 0.25 0.35 0.30 0.32 0.58 0.32
Board political
turnover 0.09 0.14 0.08 0.16 0.10 0.07
PROPORTION OF CHANGED BOARD MEMBERS
Bosnia and
Herzegovina Croatia
FYR
Macedonia Montenegro Serbia Slovenia
Total number of board
members 474 620 40 144 148 694
Number of board
members who left the
board
306 383 40 81 90 427
Proportion of board
members who left the
board
64.56% 61.77% 100% 56.25% 62.50% 61.53%

49
TABLE 5
Pearson's correlation matrix
Notes: †p<0.10 *p<0.05 **p<0.01 ***p<0.001.
Variable 1. 2. 3. 4. 5. 6. 7. 8. 9. 10. 11. 12. 13. 14. 15. 16.
1. ROE 1.0000
2. Sales per employee 0.1210*** 1.0000
3. Board turnover 0.0220 0.0306 1.0000
4. Board intermediary -0.0653 0.0301 0.4361*** 1.0000
5.Board political turnover 0.0295 -0.0067 0.8040 *** 0.3062*** 1.0000
6. Board size 0.0319 0.3255*** 0.3619*** 0.3299*** 0.3032*** 1.0000
7. Board male 0.0922** 0.0496 -0.0453 -0.0033 -0.0164 0.0380 1.000
8. Board tenure 0.0648† -0.0157 -0.0593 -0.2337*** -0.0065 -0.1897*** 0.0652 1.0000
9. Board appointments -0.0322 0.0951*** 0.3329*** 0.4947*** 0.2596*** 0.6047*** -0.0221 -0.4615*** 1.0000
10. Board leavers 0.0027 0.1219*** 0.8366*** 0.4778*** 0.6792*** 0.6535*** -0.0331 -0.1429*** 0.5496*** 1.0000
11. Parliamentary 0.0031 0.0047 0.0604** 0.0229 0.0294 -0.0719* -0.0155 0.0363 -0.0781* 0.0002 1.0000
12. Local 0.0096 0.1129*** -0.0130 -0.0134 -0.0194 0.0125 0.0093 -0.0210 0.0080 -0.0236 -0.0660* 1.0000
13. Existence 0.0197 0.2079*** -0.0585† -0.0805* -0.0422 0.1168***
0.0782* 0.1066** -0.0348 -0.0230 0.0053 0.0158 1.0000
14. Size 0.0200 0.0820* 0.0219 0.0826** 0.0231 0.3353*** 0.2403*** -0.733* 0.1745*** 0.1417*** -0.0419 0.0055 0.1910*** 1.0000
15. Leverage -0.2327*** 0.1342*** 0.0275 0.0913*** -0.0012 0.1360*** 0.0327 -0.0504 0.1038** 0.0892* -0.0251 -0.0252 -0.1277*** 0.1731*** 1.0000
16. GDP 0.0248 0.2613*** 0.0102 0.0248 -0.0171 0.2238*** 0.0216 -0.0888** 0.1081*** 0.0816** -0.0046 -0.0189 0.2413*** 0.1681*** 0.1834*** 1.0000

50
TABLE 6
Effect of elections on board member changes
BOARD
TURNOVER
BOARD
INTERMEDIARY
BOARD
POLITICAL
TURNOVER (1) (2) (3) (4) (5) (6)
Parliamentary 0.088*** 0.093*** 0.233** 0.235** 0.040*** 0.043***
(0.022) (0.023) (0.091) (0.091) (0.014) (0.015)
Board size 0.081*** 0.081*** 0.226*** 0.223*** 0.046*** 0.046***
(0.007) (0.007) (0.060) (0.059) (0.005) (0.005)
Board tenure 0.048*** 0.049** -0.177** -0.182** 0.035*** 0.037***
(0.014) (0.015) (0.061) (0.059) (0.011) (0.011)
Board male -0.045 -0.066 -0.227 -0.232 -0.063 -0.078
(0.121) (0.123) (0.311) (0.318) (0.077) (0.079)
Size (lagged) -0.072** -0.073* -0.160 -0.108 -0.004 0.001
(0.025) (0.032) (0.142) (0.141) (0.014) (0.018)
ROE (lagged) 0.000 0.023 -0.010
(0.073) (0.218) (0.048)
Sales per
employee (lagged)
0.016 0.123 0.024
(0.033) (0.105) (0.028)
No. of Obs. 722 732 722 732 722 732
R2 Within 0.30 0.29 0.21 0.21 0.23 0.22
Prob>F 0.000 0.000 0.000 0.000 0.000 0.000
Mean VIF 1.10 1.18 1.10 1.18 1.10 1.18 Notes: The table presents the results for the relationship between board member changes and election cycles. Fixed effects panel data was used. First panel (columns (1) and (2)) show results for the board turnover-election relationship. Second panel (columns (3) and (4)) present
results for the board intermediary-election relationship. Third panel (columns (5) and (6)) present results for the board political turnover-
election relationship. In columns (1), (3) and (5) lagged ROE is performance measure. In columns (2), (4) and (6) lagged Sales per employee is performance measure. Robust standard errors are reported in parentheses. In all regressions a constant term is estimated but not reported. †p<0.10 *p<0.05 **p<0.01 ***p<0.001. Board turnover is the percentage of the total number of board members in the observed year who
left at the end of the year after spending at least one year on the board. Board intermediary shows the number of board members who left in the observed year with tenures shorter than one year. Board political turnover is the percentage of the total number of board members in the
observed year who are politically connected and who left at the end of the year after spending at least one year on the board. Parliamentary
is a dummy variable which takes value 1 in years of parliamentary elections. Board size is the total number of board members. Board tenure is the average time that board members spent on the board. Board male is the percentage of men on board. Size is the natural logarithm of
the total number of employees. ROE is the ratio of net income to average total equity. Sales per employee is the natural logarithm of sales
over the total number of employees.

51
TABLE 7
Effect of board member changes on SOE performance: Whole sample
Notes: The table presents the results for estimation of board member changes and SOE performance. IV estimation using
heteroskedasticity-based instruments (ivreg2h) was used. In columns (1) and (2) Board turnover is the measure of board member changes. In columns (3) and (4) Board political turnover is the measure of board member changes. In columns (5) and (6) Board
intermediary is the measure of board member changes. Robust standard errors are reported in parentheses. In all regressions a constant
term is estimated but not reported. †p<0.10 *p<0.05 **p<0.01 ***p<0.001. ROE is the ratio of net income to average total equity and is dependent variables in columns (1), (3) and (5). Sales per employee is the natural logarithm of sales over the total number of
employees and is dependent variable in columns (2), (4) and (6). Board turnover is the percentage of the total number of board
members in the observed year who left at the end of the year after spending at least one year on the board. Board political turnover is the percentage of the total number of board members in the observed year who are politically connected and who left at the end of the
year after spending at least one year on the board. Board intermediary shows the number of board members who left in the observed
year with tenures shorter than one year. Existence is the natural logarithm of the difference between years under investigation and year of SOE incorporation. Size is the natural logarithm of the total number of employees. Leverage is equal to long-term debt over
shareholders equity. GDP is the logarithm of GDP PPP. Board size is the total number of board members. Board tenure is the average
time that board members spent on the board. Board male is the percentage of men on board. Board leavers is the number of board members that left the board within one year. Board appointments is the number of board members appointed to the board within one
year.
ROE
Sales per
employee
ROE Sales per
employee
ROE Sales per
employee
(1) (2) (3) (4) (5) (6)
Board turnover -0.158† -0.826*
(0.094) (0.426)
Board political turnover -0.205 -0.983
(0.147) (0.685)
Board intermediary -0.010* 0.011
(0.018) 0.077
Existence -0.036* 0.216** -0.037* 0.213** -0.027 0.213***
(0.016) (0.069) (0.017) (0.073) (0.016) (0.066)
Size -0.010 -0.113** -0.008 -0.101* -0.003 -0.119**
(0.009) (0.046) (0.009) (0.045) (0.010) (0.043)
Leverage -0.096** 0.175** -0.100*** 0.157* -0.096** 0.194**
(0.031) (0.066) (0.031) (0.067) (0.030) (0.064)
GDP 0.028 0.184 0.030 0.200 0.036 0.148
(0.027) (0.123) (0.027) (0.125) (0.027) (0.123)
Board size 0.009* 0.171*** 0.009 0.164*** -0.001 0.249***
(0.005) (0.026) (0.006) (0.028) (0.008) (0.032)
Board tenure 0.020* 0.011 0.023** 0.024 0.021* -0.049
(0.009) (0.047) (0.009) (0.046) (0.009) (0.052)
Board male 0.123† -0.067 0.135* -0.004 0.136** -0.020
(0.068) (0.340) (0.067) (0.338) (0.063) (0.341)
Board leavers 0.009 -0.100**
(0.010) (0.040)
Board appointments -0.000 -0.101**
(0.008) (0.040)
No. of Obs. 427 424 427 424 427 424 Mean VIF 1.36 1.37 1.35 1.35 1.81 1.82
Underidentification LM
statistic P val
0.00 0.00 0.00 0.00 0.00 0.00
Hansen J statistic P val 0.98 0.12 0.56 0.02 0.51 0.09
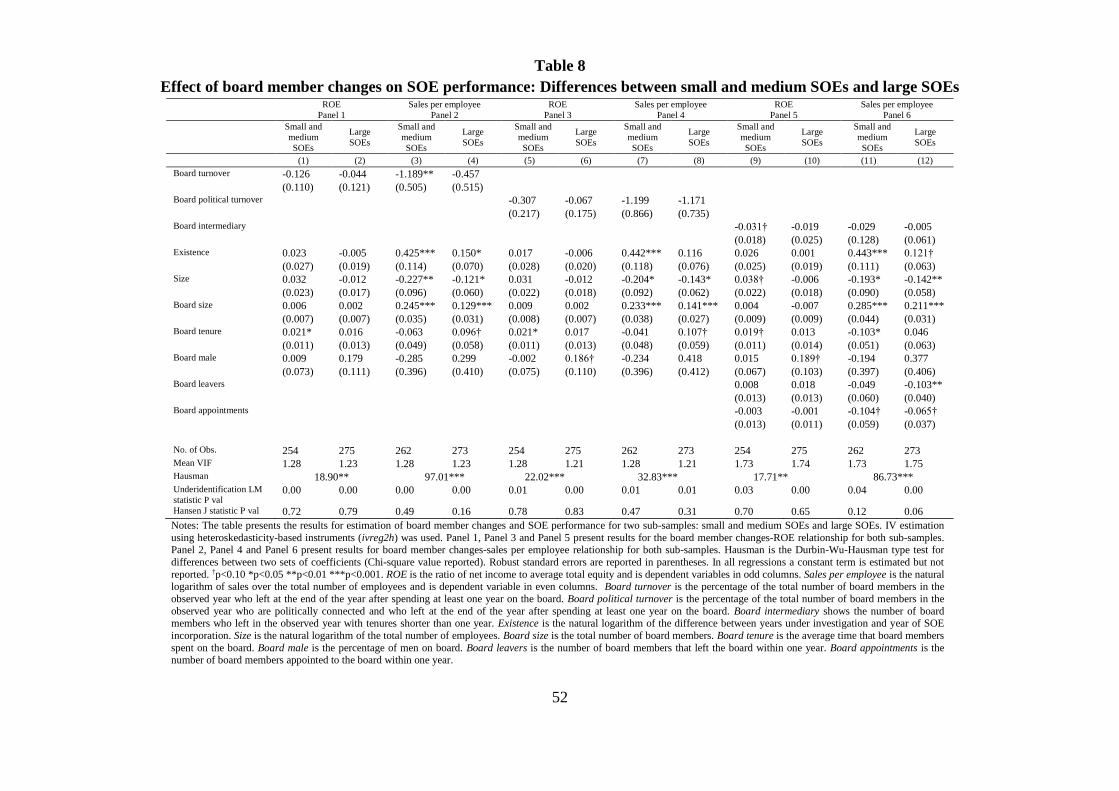
52
Table 8
Effect of board member changes on SOE performance: Differences between small and medium SOEs and large SOEs ROE
Panel 1
Sales per employee
Panel 2
ROE
Panel 3
Sales per employee
Panel 4
ROE
Panel 5
Sales per employee
Panel 6
Small and
medium
SOEs
Large
SOEs
Small and
medium
SOEs
Large
SOEs
Small and
medium
SOEs
Large
SOEs
Small and
medium
SOEs
Large
SOEs
Small and
medium
SOEs
Large
SOEs
Small and
medium
SOEs
Large
SOEs
(1) (2) (3) (4) (5) (6) (7) (8) (9) (10) (11) (12)
Board turnover -0.126 -0.044 -1.189** -0.457 (0.110) (0.121) (0.505) (0.515) Board political turnover -0.307 -0.067 -1.199 -1.171 (0.217) (0.175) (0.866) (0.735) Board intermediary -0.031† -0.019 -0.029 -0.005 (0.018) (0.025) (0.128) (0.061) Existence 0.023 -0.005 0.425*** 0.150* 0.017 -0.006 0.442*** 0.116 0.026 0.001 0.443*** 0.121† (0.027) (0.019) (0.114) (0.070) (0.028) (0.020) (0.118) (0.076) (0.025) (0.019) (0.111) (0.063) Size 0.032 -0.012 -0.227** -0.121* 0.031 -0.012 -0.204* -0.143* 0.038† -0.006 -0.193* -0.142** (0.023) (0.017) (0.096) (0.060) (0.022) (0.018) (0.092) (0.062) (0.022) (0.018) (0.090) (0.058) Board size 0.006 0.002 0.245*** 0.129*** 0.009 0.002 0.233*** 0.141*** 0.004 -0.007 0.285*** 0.211*** (0.007) (0.007) (0.035) (0.031) (0.008) (0.007) (0.038) (0.027) (0.009) (0.009) (0.044) (0.031) Board tenure 0.021* 0.016 -0.063 0.096† 0.021* 0.017 -0.041 0.107† 0.019† 0.013 -0.103* 0.046 (0.011) (0.013) (0.049) (0.058) (0.011) (0.013) (0.048) (0.059) (0.011) (0.014) (0.051) (0.063) Board male 0.009 0.179 -0.285 0.299 -0.002 0.186† -0.234 0.418 0.015 0.189† -0.194 0.377 (0.073) (0.111) (0.396) (0.410) (0.075) (0.110) (0.396) (0.412) (0.067) (0.103) (0.397) (0.406) Board leavers 0.008 0.018 -0.049 -0.103** (0.013) (0.013) (0.060) (0.040) Board appointments -0.003 -0.001 -0.104† -0.065† (0.013) (0.011) (0.059) (0.037) No. of Obs. 254 275 262 273 254 275 262 273 254 275 262 273 Mean VIF 1.28 1.23 1.28 1.23 1.28 1.21 1.28 1.21 1.73 1.74 1.73 1.75 Hausman 18.90** 97.01*** 22.02*** 32.83*** 17.71** 86.73*** Underidentification LM
statistic P val 0.00 0.00 0.00 0.00 0.01 0.00 0.01 0.01 0.03 0.00 0.04 0.00
Hansen J statistic P val 0.72 0.79 0.49 0.16 0.78 0.83 0.47 0.31 0.70 0.65 0.12 0.06
Notes: The table presents the results for estimation of board member changes and SOE performance for two sub-samples: small and medium SOEs and large SOEs. IV estimation
using heteroskedasticity-based instruments (ivreg2h) was used. Panel 1, Panel 3 and Panel 5 present results for the board member changes-ROE relationship for both sub-samples. Panel 2, Panel 4 and Panel 6 present results for board member changes-sales per employee relationship for both sub-samples. Hausman is the Durbin-Wu-Hausman type test for
differences between two sets of coefficients (Chi-square value reported). Robust standard errors are reported in parentheses. In all regressions a constant term is estimated but not
reported. †p<0.10 *p<0.05 **p<0.01 ***p<0.001. ROE is the ratio of net income to average total equity and is dependent variables in odd columns. Sales per employee is the natural logarithm of sales over the total number of employees and is dependent variable in even columns. Board turnover is the percentage of the total number of board members in the
observed year who left at the end of the year after spending at least one year on the board. Board political turnover is the percentage of the total number of board members in the
observed year who are politically connected and who left at the end of the year after spending at least one year on the board. Board intermediary shows the number of board members who left in the observed year with tenures shorter than one year. Existence is the natural logarithm of the difference between years under investigation and year of SOE
incorporation. Size is the natural logarithm of the total number of employees. Board size is the total number of board members. Board tenure is the average time that board members
spent on the board. Board male is the percentage of men on board. Board leavers is the number of board members that left the board within one year. Board appointments is the number of board members appointed to the board within one year.

53
Table 9
Effect of board member changes on SOE performance: Differences between centralized and government model ROE
Panel 1
Sales per employee
Panel 2
ROE
Panel 3
Sales per employee
Panel 4
ROE
Panel 5
Sales per employee
Panel 6
Centralized
model
Government
model
Centralized
model
Government
model
Centralized
model
Government
model
Centralized
model
Government
model
Centralized
model
Government
model
Centralized
model
Government
model
(1) (2) (3) (4) (5) (6) (7) (8) (9) (10) (11) (12)
Board turnover -0.220 0.509* -0.130 0.588 (0.168) (0.240) (0.516) (0.854) Board political turnover -0.282 0.308 -1.354 1.087 (0.219) (0.205) (0.900) (1.097) Board intermediary -0.028 0.047 -0.046 0.179† (0.018) (0.029) (0.061) (0.103) Existence 0.028 0.001 0.231** 0.266** 0.031 -0.005 0.190* 0.310** 0.045* -0.014 0.232** 0.228** (0.023) (0.024) (0.094) (0.094) (0.021) (0.027) (0.095) (0.111) (0.021) (0.020) (0.086) (0.085) Size -0.004 0.026 -0.170*** -0.209† -0.004 0.014 -0.186*** -0.216† 0.001 0.018 -0.170*** -0.253** (0.013) (0.034) (0.054) (0.119) (0.012) (0.036) (0.054) (0.117) (0.012) (0.036) (0.051) (0.098) Board size 0.003 -0.041† 0.036 0.155* 0.002 -0.024 0.068* 0.149* -0.015† -0.033 0.035 0.264*** (0.008) (0.022) (0.031) (0.068) (0.008) (0.019) (0.033) (0.064) (0.008) (0.026) (0.035) (0.055) Board tenure -0.002 0.012 0.006 0.128 0.002 -0.003 0.014 0.106 0.002 0.004 -0.006 0.070 (0.013) (0.034) (0.068) (0.090) (0.013) (0.032) (0.072) (0.089) (0.014) (0.034) (0.083) (0.091) Board male 0.156 0.006 0.353 -0.573 0.180† 0.001 0.329 -0.681 0.198* 0.033 0.372 -0.504 (0.103) (0.187) (0.440) (0.828) (0.095) (0.194) (0.426) (0.789) (0.090) (0.184) (0.421) (0.767) Board leavers 0.014 0.021 0.008 -0.086 (0.012) (0.030) (0.041) (0.072) Board appointments 0.008 -0.009 -0.005 -0.091 (0.011) (0.020) (0.046) (0.060) No. of Obs. 305 73 306 73 305 73 306 73 305 73 306 73 Mean VIF 1.40 1.41 1.40 1.41 1.41 1.39 1.41 1.39 1.94 1.96 1.94 1.96 Hausman 50.08*** 26.77*** 44.99*** 23.73*** 84.04*** 878.05*** Underidentification LM
statistic P val 0.01 0.13 0.01 0.13 0.00 0.15 0.00 0.15 0.01 0.07 0.01 0.07
Hansen J statistic P val 0.49 0.22 0.00 0.38 0.13 0.17 0.03 0.12 0.44 0.14 0.00 0.26
Notes: The table presents the results for estimation of board member changes and SOE performance for two sub-samples: centralized governance model and government governance
model. IV estimation using heteroskedasticity-based instruments (ivreg2h) was used. Panel 1, Panel 3 and Panel 5 present results for the board member changes-ROE relationship
for both sub-samples. Panel 2, Panel 4 and Panel 6 present results for board member changes-sales per employee relationship for both sub-samples. Hausman is the Durbin-Wu-Hausman type test for differences between two sets of coefficients (Chi-square value reported). Robust standard errors are reported in parentheses. In all regressions a constant term
is estimated but not reported. †p<0.10 *p<0.05 **p<0.01 ***p<0.001. ROE is the ratio of net income to average total equity and is dependent variables in odd columns. Sales per
employee is the natural logarithm of sales over the total number of employees and is dependent variable in even columns. Board turnover is the percentage of the total number of board members in the observed year who left at the end of the year after spending at least one year on the board. Board political turnover is the percentage of the total number of
board members in the observed year who are politically connected and who left at the end of the year after spending at least one year on the board. Board intermediary shows the
number of board members who left in the observed year with tenures shorter than one year. Existence is the natural logarithm of the difference between years under investigation and
year of SOE incorporation. Size is the natural logarithm of the total number of employees. Board size is the total number of board members. Board tenure is the average time that
board members spent on the board. Board male is the percentage of men on board. Board leavers is the number of board members that left the board within one year. Board
appointments is the number of board members appointed to the board within one year.

54
FIGURE 1
Proportion of board turnovers per year and country
0%
5%
10%
15%
20%
25%
30%
35%
40%
45%
Bosnia and Herzegovina
Croatia Montenegro FYR Macedonia Serbia Slovenia
Election year
Postelection
year
Notes: Proportion of the total number of board members in the observed year who left at the end of the year after spending at least one year on the
board.
FIGURE 2
Proportion of board intermediary per year and country
0%
10%
20%
30%
40%
50%
60%
70%
80%
90%
Bosnia and Herzegovina
Croatia Montenegro FYR Macedonia Serbia Slovenia
Election year
Postelection
year
Notes: Proportion of the total number of board members who left in the observed year with tenures shorter than one year.
FIGURE 3
Proportion of board political turnovers per year and country
0%
10%
20%
30%
40%
50%
60%
70%
80%
Bosnia and Herzegovina
Croatia Montenegro FYR Macedonia Serbia Slovenia
Election year
Postelection
year
Notes: Proportion of the total number of board members in the observed year who are politically connected and who left at the end of the year after spending at least one year on the board.

55
AUTHOR BIOGRAPHY
Tanja Kuzman is a Doctoral Researcher in Finance at the Management School, University of
Sheffield, UK. Her broad research interests are related to corporate finance, corporate
governance, behaviour of state-owned enterprises, political embeddedness, big-data analytics,
start-up financing, and transition economies. She was a Marie Curie Fellow on EU-funded
GREY project and a consultant on several corporate governance projects of the International
Finance Corporation, the World Bank Group.
Oleksandr Talavera is a Professor of Finance at the School of Management, Swansea
University, UK and he is also the director of the Hawkes Centre for Empirical Finance.
Oleksandr is broadly interested in empirical corporate finance, online-prices, big data
analytics, banking, international finance, and emerging market economies. His research has
been published in the American Economic Review, Journal of European Economic
Association, Journal of Banking and Finance, and Journal of Comparative Economics.
Sotirios K. Bellos is a Lecturer at the International Faculty-CITY College, University of
Sheffield, where he teaches Monetary Economics, Banking and International Finance. His
research interests lie in the field of finance and its association with macroeconomics, as well
as FDI and geo-economics. His research work has appeared in the Bulletin of Economic
Research, International Review of Applied Economics and Foreign Affairs. He also holds a
position of Sector Head in the Corporate Restructuring Division of National Bank of Greece.