arizona.openrepository.comarizona.openrepository.com/arizona/bitstream/10150/186670/1/azu_td...the...
TRANSCRIPT
Influence of vitamin E supplementation on nutritional statusand immune response in ethanol-fed mice and murine AIDS.
Item Type text; Dissertation-Reproduction (electronic)
Authors Wang, Yuejian.
Publisher The University of Arizona.
Rights Copyright © is held by the author. Digital access to this materialis made possible by the University Libraries, University of Arizona.Further transmission, reproduction or presentation (such aspublic display or performance) of protected items is prohibitedexcept with permission of the author.
Download date 29/05/2018 16:35:09
Link to Item http://hdl.handle.net/10150/186670

INFORMATION TO USERS
This manuscript has been reproduced from the microfilm master. UMI
films the text directly from the original or copy submitted. Thus, some
thesis and dissertation copies are in typewriter face, while others may
be from any type of computer printer.
The quality of this reproduction is dependent upon the quality of the copy submitted. Broken or indistinct print, colored or poor quality illustrations and photographs, print bleedtbrough, substandard margins,
and improper alignment can adversely affect reproduction.
In the unlikely. event that the author did not send UMI a complete
manuscript and there are missing pages, these will be noted. Also, if unauthorized copyright material had to be removed, a note will indicate
the deletion.
Oversize materials (e.g., maps, drawings, charts) are reproduced by
sectioning the original, beginning at the upper left-hand comer and
continuing from left to right in equal sections with small overlaps. Each
original is also photographed in one exposure and is included in
reduced form at the back of the book.
Photographs included in the original manuscript have been reproduced xerographically in this copy. Higher quality 6" x 9" black and white photographic prints are available for any photographs or illustrations
appearing in this copy for an additional charge. Contact UMI directly
to order.
U·M·I University Microfilms International
A Bell & Howell Information Company 300 North Zeeb Road. Ann Arbor. M14S106-1346 USA
313/761-4700 800/521-0600


Order Number 9426303
Influence of vitamin E supplementation on nutritional status and immune response in ethanol-fed mice and murine AIDS
Wang, Yuejian, Ph.D.
The University of Arizona, 1994
U·M·I 300 N. Zeeb Rd Ann Arbor, MI48106


INFLUENCE OF VITAMIN E SUPPLEMENTATION ON
NUTRITIONAL STATUS AND IMMUNE RESPONSE
IN ETHANOL-FED MICE AND MURINE AIDS
by
YUEJIAN WANG
A Dissertation Submitted to the Faculty of the
COMMIITEE ON NUTRITIONAL SCIENCES
In Partial Fulfillment of the Requirements For the Degree of
DOCTOR OF PHILOSOPHY
In the Graduate College
THE UNIVERSITY OF ARIZONA
1994
THE UNIVERSITY OF ARIZONA GRADUATE COLLEGE
As members of the Final Examination Committee, we certify that we have
read the dissertation prepared by ___ Y~u~e~j~,~·a~n~W~a~n~g~ ____________________ __
entitled Influence of Dietary Vitamin E Supplementation on Nutritional
Status and Immune Response In Ethanol-Fed Mice and
Murine AIDS
and recommend that it be accepted as fulfilling the dissertation
Doctor of Philosophy
Rona 1 d R. Watson
lli v i d K. Y. Le i
Cl eamond D.
Harris Bernstein Date/ i
Date
Final approval and acceptance of this dissertation is contingent upon the candidate's submission of the final copy of the dissertation to the Graduate College.
I hereby certify that I read this dissertation prepared under my
2
direction and requirement.
it be accepted as fulfilling the dissertation
Ro na 1 dR. Ha tso n Dissertation Dir

3
STATEMENT BY AUTHOR
This dissertation has been submitted in partial fulfillment of requirements for an advanced degree at The University of Arizona and is deposited in the University Library to be made available to borrowers under rules of the Library.
Brief quotations from this dissertation are allowable without special permission, provided that accurate acknowledgment of source is made. Requests for permission for extended quotation from or reproduction of this manuscript in whole or in part may be granted by the head of the major department or the Dean of the Graduate College when in his or her judgment the proposed use of the material is in the interests of scholarship. In all other instances, however, permission must be obtained from the author.
SIGNE~~~

4
ACKNOWLEDGl\1ENTS
It would not have been possible to achieve my dream of earning a Ph.D and becoming a professional scientist without the assistance and support of a number of people. lowe a debt of gratitude and many thanks to them for helping to make my stay and learning experience enjoyable in Dr. Ronald Ross Watson's laboratory in the Department of the Family and Community Medicine.
First of all, I would like to express my deep gratitude to my advisor, Dr. Ronald R. Watson, for advising, understanding, supporting and guiding in the past years. He has provided continuing interest and support throughout my graduate research and his constant encouragement also helped this research run smoothly.
I wish to express my appreciation to Dr. David K. Y. Lei and Dr. Cleamond D. Eskelson for valuable advice and guidance in my graduate research. I also wish to express my appreciation to Dr. Harris Bernstein and Dr. Lynn Joens for serving as members of my committee and for their availability in time of need. In addition, my sincere thanks to Dr. Dennis S. Huang and Dr. Steve M. Wood for valuable discussion and their help in my entire research.
My research assistants should be acknowledged. My special thanks are extended to Mr. Bailin Liang, Mr. Paul T. Giger, Mr. Tony Stazzone, Ms. Andrea Herbert and Mr. Lee Murphy for their tremendous experimental support.
The guidance and support of the above individuals, and others too numerous to list here, made this work a pleasure.

5
DEDICATION
This dissertation is dedicated to all of my family: my wife, Li; my future
children, my parents, my parents-in-law, brothers, sisters-in-law and brothers-in-law
whose love and encouragement have been the major motivation for me in working toward
the Ph.D. degree. They have always been very supportive and understanding throughout
my life.
This dissertation is also specially dedicated to our American host family: Mr. and
Mrs. William and Hellen Arthur, whose love and caring enabled us to get through our
toughest time in the United States finishing this dissertation.

TABLE OF CONTENTS
LIST OF FIGURES
LIST OF TABLES
ABSTRACT
CHAPTER 1: REVIEW OF LITERATURE ................................ . Section I: The Animal Model of Human AIDS: Murine AIDS ..
Introduction ............................................. . Etiology of AIDS .................................... . Immune Functions in AIDS ........................... . Nutritional Status in AIDS ........................... . Conclusion .................................... .
Section II: Alcohol, Immune Response, Nutrition and AIDS .................................... .
Introduction ............................................. . Ethanol and Immune Response .......................... . Ethanol and Nutrition .......................... . Ethanol and AIDS ............................................. . Conclusion .................................... .
Section III: Vitamin E, Immune Response, Nutrition and AIDS .................................... .
Introduction .................................... . Vitamin E and Immune Response .......................... .. Vitamin E and Nutrition .......................... .. Vitamin E and AIDS Therapy .......................... .. Conclusion .................................... .
CHAPTER 2: ALTERATION OF CYTOKINE PRODUCTION, IMMUNE RESPONSE AND NUTRITIONAL STATUS I)~(J lVI~ l\IDS ............................................. . Abstract ................................................ . Introduction ...................................................... . Materials and Methods ............................................. .
LP-BM5 Murine Leukemia Virus Infection Preparation of Peritoneal Resident Macrophages Preparation of Splenocytes and Thymocytes
Page
14
18
22
24 24 24 25 28 32 35
36 36 36 39 42 44
45 45 45 47 47 49
50 50 52 56 56 . 56 56
6

TABLE OF CONTENTS (continued)
Preparation of T Cells from Splenocytes .................. . Cytokine Standards and Antisera .................. . Production of Cytokines ........................... . Preparation of IgG Production ........................... . ELISA for Cytokines ........................... . ELISA for IgG ........................... . Mitogenesis of Splenocytes and Thymocytes ............... . Measurement of Vitamin A and E ....................... . Serum Vitamin A and E .................................... . Measurement of Zinc and Copper ........................... . Statistics .................................... .
Results ............................................. . IL-6 and TNF-a Production by Peritoneal Macrophages ........................... . IL-2 and IFN--y Production by Thl cells ......... . IL-4,IL-5,IL-6 and IL-lO Production by Th2 Cell ......... . Mitogenesis of Splenocytes ........................... . Production of IgG ........................... . Mitogenesis of Thymocytes .................. . Cytokine Production by Thymocytes ......... . Hepatic Levels of Nutrients ........................... . Intestinal Levels of Nutrients ........................... . Splenic Levels of Nutrients ........................... . Thymic Levels of Nutrients ........................... . Serum Levels of Vitamins ........................... .
Discussion
CHAPTER 3: ALCOHOL CONSUMPTION SUPPRESSES CYTOKINE PRODUCTION AND IMMUNE RESPONSE
Page
57 57 58 58 58 59 60 60 61 61 61 62
62 62 62 62 62 62 63 63 64 64 64 64 65
IN C57BL/6 MICE ................................. 85 Abstract . . . . . . . . . . . . . . . . . . . . . . . . . . . . . . . . . . . . . . . . . . . . . . 85 Introduction . .. . . . . . . . . . . . . . . . . .. . . . . . . . . . . . . . . . . . . . . . . . . . 86 Materials and Methods . . . . . . . . . . . . . . . . . .. . . . . . . . . . . . . . . . . . . . 88
Animals and EtOH Diet .... ..... ......... . . . ..... ... .. ...... 88 Standard Cytokines and Their Antibodies ...... . ... ..... .... 88 Preparation of Splenocytes and Thymocytes . . . . . . . . . . 88 Preparation of Cytokine Production ...... .... . ........ 88
7

TABLE OF CONTENTS (continued) Page
Preparation of IgA and IgG Production . ..... .... ... .. . ... 89 Natural Killer (NK) Cell Activity . . ....... ..... . ..... . ....... 89 ELISA for Cytokines ............................ 89 ELISA for IgA and IgG .................................. '" 89 Mitogenesis . . . . . . . . . . . . . . . . . . . . . . . . . . . . . . . . . . . . . 89 Statistics . .... .... ...... .. .. .... ... . ... . . ... .. .. .. . .... 89
Results ......... ..... ..... .... ... ........... .... ....... ....... 90 Production of Splenic Cytokines ..... ..... ... . ..... 90 Production of IL-6 and TNF-a by Splenocytes ........ . . 90 Production of Thymic Cytokine . .... . . .. ..... ..... 90 Splenic NK Cell Activity . . . . . . . . . . . . . . . . . . . . . . . . . . . . 90 IgA and IgG Production ............. ....... .... ... ... ....... 90 Mitogenesis of Splenocytes and Thymocytes . ...... . . . 90
Discussion . . . . . . . . . . . . . . . . . . . . . . . . . . . . . . . . . . . . . . . . . . . . . . . . . . . . . . . . 91
CHAPTER 4: ALCOHOL CONSUMPTION MODULATION OF CYTOKINE PRODUCTION AND IMMUNE RESPONSE DURING MURINE AIDS ............................................. . Abstract Introduction ...................................................... . Materials and Methods .............................. .
Animals ...................................................... . EtOH Diets ...................................................... . LP-BM5 MuL V Infection .................................... . Cytokine Standards and Antisera .......................... .. Preparation of Splenocytes and Thymocytes ......... . Preparation of Cytokine Production .................. . ELISA for Cytokines .................................... . Mitogenesis of Splenocytes and Thymocytes ......... . Statistics ...................................................... .
Results ....................................... . Production of Cytokines by Splenocytes .................. . Production of Cytokines by Thymocytes .................. . Mitogenesis of Splenocytes and Thymocytes ......... . Production of Splenic Cytokine Prior to Retrovirus Infection
101 101 103 105 105 105 106 106 106 106 106 107 107 108 108 108 109
109
8
TABLE OF CONTENTS (continued)
Production of IgA and IgG Prior to Retrovirus Infection Mitogenesis of Splenocytes Prior to Retrovirus Infection Body and Thymus Weight Prior to Retrovirus Infection ........................... . Thymocyte Number and Proliferation Prior to Retrovirus Infection Production of Thymic Cytokines Prior to Retrovirus Infection
Discussion
CHAPTER 5: ALCOHOL CONSUMPTION ALTERS THE NUTRITIONAL STATUS DURING MURINE AID .................................... . Abstract ........................................................ . Introduction ...................................................... . Materials and Methods .................................... .
Animals and LP-BM5 Retrovirus Infection ......... . EtOH Diet ............................................. . Measurement of Tissue Vitamin A and E .......... .. Measurement of Serum Vitamin A and E ......... . Measurement of Tissue Zinc and Copper ......... . Statistics ............................................. .
Results ........................................................ . Nutrient Concentrations In the Liver .................. . Nutrient Concentrations in the Intestine .................. . Nutrient Concentrations in the Spleen .................. . Nutrient Concentrations in the Thymus .................. . Nutrient Concentrations in the Serum .................. .
Discussion
CHAPTER 6: VITAMIN E SUPPLEMENTATION NORMALIZES IMMUNE FUNCTIONS AND CYTOKINE PRODUCTION IN ALCOHOL-FED MICE .................................... . Abstract Introduction ...................................................... . Materials and Methods ................................... .
Page
110
110
111
111
111 113
130 130 131 133 133 133 133 134 134 134 135 135 135 135 135 135 137
143 143 144 146
9

TABLE OF CONTENTS (continued)
Animals ...................................... . Diet and Treatment ................... . Standard Cytokines and Their Antibodies ......... . Preparation of Splenocytes and Thymocytes ......... . Cytokine Production .................................... . IgA and IgG Production .................................... . ELISA for Cytokine Detection ............................ . ELISA for IgA and IgG .................................... . Mitogenesis of Splenocytes and Thymocytes ......... . Statistics ...................................................... .
Results ...................................................... . Production of IL-2 and IFN--y by Splenocytes ......... . Production of Cytokines by Splenocytes .................. . Production of IL-6 and TNF-a by Splenocytes ......... . IgA and IgG Production .................................... . Mitogenesis of Splenocytes ........................... . Production of Cytokines by Thymocytes ......... . Mitogenesis of Thymocytes ........................... .
Discussion ............................................. .
CHAPTER 7: VITAMIN E SUPPLEMENTATION ASSISTS IN THE RESTORATION OF UNDERNUTRITION AND IMMUNE DYSFUNCTIONS DURING MURINE AIDS ......... . Abstract Introduction Materials and Methods
Animals ...................................................... . Diet and Treatment .................................... . LP-BM5 Murine Leukemia Retrovirus Infection ......... . Tissue Vitamin A and E .................................... . Serum Vitamin A and E .................................... . Tissue Zinc and Copper .................................... . Preparation of Splenocytes ........................... . Standard Cytokines and Their Antibodies ......... . Cytokine production .................................... . ELISA Assays for Cytokines ............................... . Cytotoxicity for NK Cells .................................... .
Page
146 146 147 147 147 147 147 147 147 147 148 148 148 148 148 149 149 149 150
162 162 163 165 165 165 166 166 166 166 166 166 166 166 166
10

TABLE OF CONTENTS (continued)
Mitogenesis of Splenocytes Production of IgA and IgG Statistics
Results ...................................................... . Hepatic Levels of Nutrients ........................... . Intestinal Levels of Nutrients ........................... . Splenic Levels of Nutrients ........................... . Thymic Levels of Nutrients .......................... .. Serum Levels of Vitamin A and E ................. .. Production of IL-2 and IFN--y ........................... . Production of IL-4, IL-5 and IL-6 .................. . Production of IL-6 and TNF-a ................. .. ~ ~ell Activity .................................... . Mitogenesis of Splenocytes ........................... . Production of JgA and IgG .......................... ..
Discussion ............................................. .
~HAPTER 8: ALTERATION OF KINETI~S OF ~YTOKINE PRODU~TION BY VITAMIN E SUPPLEMENT A TION DURING MURINE AIDS .................................... . Abstract Introduction Materials and Methods
Animals Diet and Treatment .................................... . LP-BM5 Murine Leukemia Retrovirus Infection ......... . Tissue Vitamin E .................................... . Preparation of Splenocytes and Thymocytes ......... . Standard ~ytokines and Their Antibodies ......... . ~ytokine Production .................................... . ELISA for ~ytokine Detection ..................... .. Mitogenesis of Splenocytes and Thymocytes ......... . ELISA for IgG Detection ................................... . Statistics ............................................. .
Results ..................................................... . Body and Spleen Weights ........................... . Hepatic and Serum Levels of Vitamin E ......... .
Page
167 167 167 168 168 168 168 168 169 169 169 169 170 170 170 171
183 183 185 188 188 188 188 188 189 189 189 189 189 189 189 190 190 190
11

TABLE OF CONTENTS (continued)
Production of IL-2 and IFN-'Y ........................... . Production of IL-4, IL-5 and IL-6 .................. . Production of IL-6 and TNF-a ........................... . Mitogenesis of Splenocytes ........................... . Production of IgG ................................... . Thymus Weight ............................................. . Vitamin E in the Thymus and Serum .................. . Production of Thymic Cytokines .................. . Mitogenesis of Thymocytes ........................... .
Discussion ............................................. .
CHAPTER 9: MODULATION OF CYTOKINE SECRETION, IMMUNE RESPONSE AND NUTRITIONAL STATUS BY VARIOUS LEVELS OF VITAMIN E SUPPLEMENTATION DURING MURINE AIDS Abstract Introduction ...................................................... . Materials and Methods .................................... .
Animals ............................................. . Diet and Treatment .................................... . LP-BM5 Retrovirus Infection ........................... . Hepatic Vitamin A and E .......................... . Serum Vitamin E .................................... . Measurement of Zinc and Copper ........................... . Preparation of Splenocytes and Thymocytes ......... . Standard Cytokines and Their Antibodies .................. . Cytokine Production .................................... . ELISA for Cytokine Detection .......................... .. Mitogenesis of Splenocytes and Thymocytes ......... . NK Cell Cytotoxicity ........................... . IgA and IgG Production .................................... . ELISA for IgA and IgG .................................... . Statistics ............................................. .
Results ...................................................... . Body and Spleen Weights .................................... . Serum Vitamin A and E ........................... . Hepatic Nutrients .................................... .
Page
190 191 191 192 192 192 192 193 194 195
220 220 222 226 226 226 227 227 227 227 227 227 227 227 227 227 227 227 227 228 228 228 228
12

13
TABLE OF CONTENTS (continued) Page
Intestinal Nutrients .................................... . 229 Production of IL-2 and IFN-'Y ........................... . 230 Production of IL-6 and IL-1O ........................... . 230 Production of IL-6 and TNF-a ........................... . 231 Mitogenesis of Splenocytes ........................... . 231 NK Cell Cytotoxicity ................................... . 232 Production of IgA and IgG ........................... . 232 Thymus Weight .................................... . 232 Production of Cytokines by Thymocytes .................. . 232
Discussion ....................................................... . 235
CHAPTER 10: OVERALL CONCLUSIONS 261
REFERENCES 264

14
LIST OF FIGURES Page
FIG. 2.1 IL-6 and TNF-a Production by Macrophages ................... 75
FIG. 2.2 IL-2 and IFN--y Production by Splenic T cells ................... 76
FIG. 2.3 IL-4 and IL-5 Production by Splenic T Cells ................... 77
FIG. 2.4 IL-6 and IL-lO Production by Splenic T cells ................... 78
FIG. 2.5 IL-2 and IL-4 Production by Thymocytes ................... 79
FIG. 2.6 IL-6 and IFN--y Production by Thymocytes ................... 80
FIG. 3.1 Effect of Dietary EtOH on Splenocyte and Thymocyte Proliferation ..................................... 100
FIG. 4.1 Effects of Dietary EtOH on Splenocyte and Thymocyte Proliferation During Retrovirus Infection .... . . .. .. . . .. . . ... 127
FIG. 4.2 Effect of EtOH Consumption Prior to Retrovirus Infection on ConA-Induced Splenic Proliferation ............................ 128
FIG. 4.3 Effect of EtOH Consumption Prior to Retrovirus Infection on LPS-Induced Splenic Proliferation ............................ 129
FIG. 6.1 Effect of Vitamin Eon ConA-Induced Splenocyte Proliferation From EtOH-Fed Mice ............................ 159
FIG. 6.2 Effect of Vitamin Eon LPS-Induced Splenocyte Proliferation From EtOH-Fed Mice ............................ 160
FIG. 6.3 Effect of Vitamin E on Con A-Induced Thymocyte Proliferation.From EtOH-Fed Mice ............................ 161
FIG. 7.1 Effect of Vitamin E on NK Cell Activity During Retrovirus Infection . . . . . . . . . . . . . . . . . .. . . . . . . . . . . . . . . . . . . 180
15
LIST OF FIGURES (continued) Page
FIG. 7.2 Effect of Vitamin E on Con A-Induced Splenocyte Proliferation During Retrovirus Infection .. .. .. .. .. .. .. .. .. .. .. .. .. .. 181
FIG. 9.3 Effect of Vitamin E Supplementation on LPS-Induced Splenocyte Proliferation During Retrovirus Infection . . . . . . . . . . . . . . . . . . . . . . . . . . . . 182
FIG. 8.1 Effect of Vitamin E Supplementation on Kinetics of IL-2 Production By Splenocytes During Retrovirus Infection . .... .... ... . .. .... 206
FIG. 8.2 Effect of Vitamin E Supplementation on Kinetics of IFN--y Production By Splenocytes During Retrovirus Infection .... .. ... . .... .... . 207
FIG. 8.3 Effect of Vitamin E Supplementation on Kinetics of IL-4 Production By Splenocytes During Retrovirus Infection .... .. . . ... . .. . .... 208
FIG. 8.4 Effect of Vitamin E Supplementation on Kinetics of IL-5 Production By Splenocytes During Retrovirus Infection . . .. . . . . . . . . . . . . . . . 209
FIG. 8.5 Effect of Vitamin E Supplementation on Kinetics of IL-6 Production By Splenocytes During Retrovirus Infection ................... 210
FIG. 8.6 Effect of Vitamin E Supplementation on Kinetics of IL-6 Production By Splenocytes During Retrovirus Infection ................... 211
FIG. 8.7 Effect of Vitamin E Supplementation on Kinetics of TNF-a Production By Splenocytes During Retrovirus Infection ................... 212
FIG. 8.8 Effect of Vitamin E Supplementation on Kinetics of Con A-Induced Splenocyte Proliferation During Retrovirus Infection .......... 213
FIG. 8.9 Effect of Vitamin E Supplementation on Kinetics of LPS-Induced Splenocyte Proliferation During Retrovirus Infection .......... 214
FIG. 8.10 Effect of Vitamin E Supplementation on Kinetics of IL-2 Production by Thymocytes During Retrovirus Infection ................... 215
FIG. 8.11 Effect of Vitamin E Supplementation on Kinetics of IL-4 Production by Thymocytes During Retrovirus Infection ................... 216

LIST OF FIGURES (continued) Page
FIG. 8.12 Effect of Vitamin E Supplementation on Kinetics of IL-6 Production by Thymocytes During Retrovirus Infection ................... 217
FIG. 8.13 Effect of Vitamin E Supplementation on Kinetics of IFN--y Production by Thymocytes During Retrovirus Infection ................... 218
FIG. 8.14 Effect of Vitamin E Supplementation on Kinetics of ConA-Induced Thymocyte Proliferation During Retrovirus Infection ................... 219
FIG. 9.1 Effects of Vitamin E Supplementation on Body and Spleen Weights During Retrovirus Infection .. ..... ..................... ...... ... 242
FIG. 9.2 Effects of Various Levels of Vitamin E Supplementation on Levels of Serum Vitamin A and E During Retrovirus Infection . .. . . . . . . . . . . . . . . . . 243
FIG. 9.3 Effects of Various Levels of Vitamin E Supplementation on Hepatic Vitamin A and E During Retrovirus Infection· . . .. . . .. . . . . . . . . . . . . . . . . . . . . 244
FIG. 9.4 Effects of Various Levels of Vitamin E Supplementation on Hepatic Copper and Zinc During Murine AIDS . . .. .. . . . . . . . . . . . . . . . . . . . . .. . . . . . . . . . 245
FIG. 9.5 Effects of Various Levels of Vitamin E Supplementation on Intestinal Vitamin A and E During Retrovirus Infection . . . .. . . . . . . . . . . . . . . . . . . . . . . . 246
FIG. 9.6 Effects of Various Levels of Vitamin E Supplementation on Intestinal Zinc and Copper During Retrovirus Infection ............................ 247
FIG. 9.7 Effects of Various Levels of Vitamin E Supplementation on IL-2 and IFN--y Production by Splenocytes During Retrovirus Infection .......... 248
FIG. 9.8 Effects of Various Levels of Vitamin E Supplementation on IL-6 and IL-lO Production by Splenocytes During Retrovirus Infection .......... 249
FIG. 9.9 Effects of Various Levels of Vitamin E Supplementation on IL-6 and TNF-a Production by Splenocytes During Retrovirus Infection .......... 250
FIG. 9.10 Effects of Various Levels of Vitamin E Supplementation on Splenocyte Proliferation During Retrovirus Infection . . . ... . . . . . . . . . . . . . 251
16

17
LIST OF FIGURES (continued) Page
FIG. 9.11 Effects of Various Levels of Vitamin E Supplementation on NK Cell Activity During Retrovirus Infection ......... ..... . .. ... . .. . .... . 252
FIG. 9.12 Effects of Various Levels of Vitamin E Supplementation on IgA and IgG Production by Splenocytes During Retrovirus Infection . .... .. . .. 253
FIG. 9.13 Effects of Various Levels of Vitamin E Supplementation on Thymus Weight During Retrovirus Infection ............................ 254
FIG. 9.14 Effects of Various Levels of Vitamin E Supplementation on IL-2 Production by Thymocytes During Retrovirus Infection ... " .......... '" . . 255
FIG. 9.15 Effects of Various Levels of Vitamin E Supplementation on IL-4 Production by Thymocytes During Retrovirus Infection .......... 256
FIG. 9.16 Effects of Various Levels of Vitamin E Supplementation on IL-6 Production by Thymocytes During Retrovirus Infection .......... ....... .. 257
FIG. 9.17 Effects of Various Levels of Vitamin E Supplementation on IL-lO Production by Thymocytes During Retrovirus Infection ............ .. . .... 258
FIG. 9.18 Effects of Various Levels of Vitamin E Supplementation on IFN-'Y Production by Thymocytes During Retrovirus Infection . ...... .. . ... ... . .. 259
FIG. 9.19 Effects of Various Levels of Vitamin E Supplementation on Thymocyte Proliferation During Retrovirus Infection ... .. ... .. .. .. . .. . . 260
18
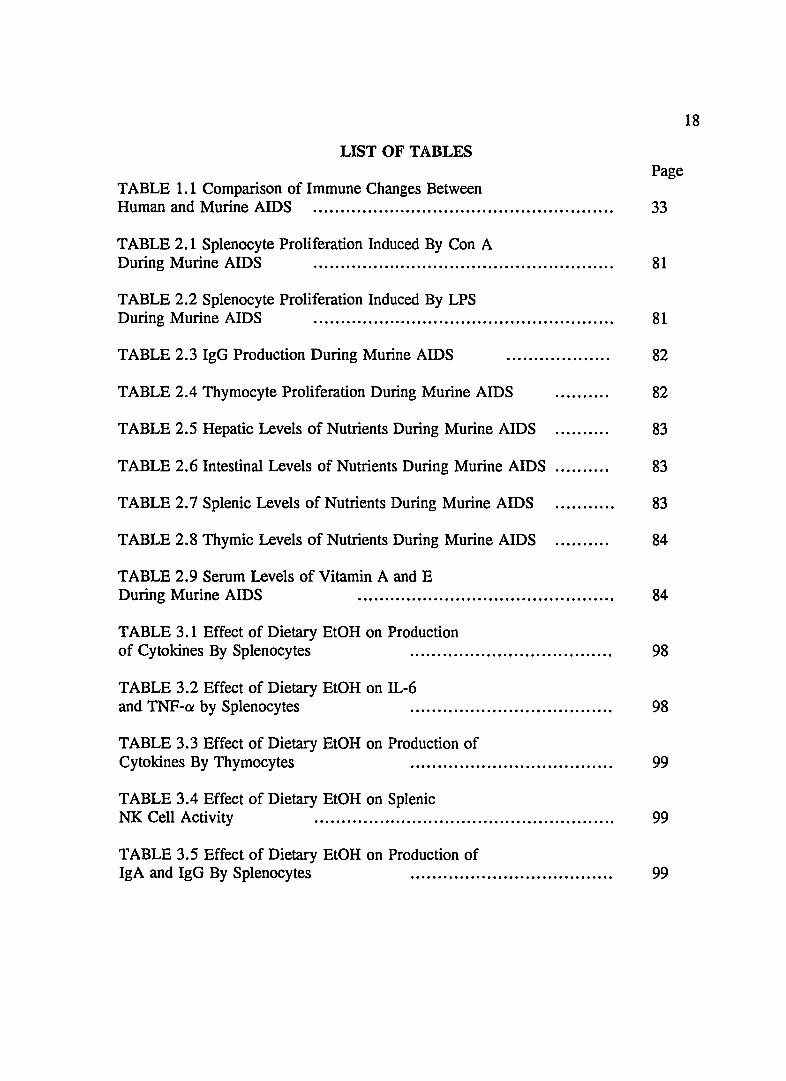
LIST OF TABLES Page
TABLE 1.1 Comparison of Immune Changes Between Human and Murine AIDS . . ... .. ...... ...... . .. ... ....... ... . .. . ..... . . . ... .. . .. 33
TABLE 2.1 Splenocyte Proliferation Induced By Con A During Murine AIDS ... . ..... . .... ......... .. . . ..... .... . .. ... .... . ... . . .. . 81
TABLE 2.2 Splenocyte Proliferation Induced By LPS During Murine AIDS . .... ..... . ............ ... . . .. .. . . ... . . . . .. ... . . . ... ... 81
TABLE 2.3 IgG Production During Murine AIDS 82
TABLE 2.4 Thymocyte Proliferation During Murine AIDS 82
TABLE 2.5 Hepatic Levels of Nutrients During Murine AIDS 83
TABLE 2.6 Intestinal Levels of Nutrients During Murine AIDS 83
TABLE 2.7 Splenic Levels of Nutrients During Murine AIDS 83
TABLE 2.8 Thymic Levels of Nutrients During Murine AIDS 84
TABLE 2.9 Serum Levels of Vitamin A and E During Murine AIDS ............... ..... ......... .... .. ... ... ... ... 84
TABLE 3.1 Effect of Dietary EtOH on Production of Cytokines By Splenocytes .. .. .. .. .... .... .. .. .... ........ .... . 98
TABLE 3.2 Effect of Dietary EtOH on IL-6 and TNF-O! by Splenocytes ...... .. .......... ...... .... ........ . 98
TABLE 3.3 Effect of Dietary EtOH on Production of Cytokines By Thymocytes ........ ...... .......... .... .. ...... . 99
TABLE 3.4 Effect of Dietary EtOH on Splenic NK Cell Activity .... ........ ..... . . . . . . . . ..... . .... ... ... .... .. ... . .. . . 99
TABLE 3.5 Effect of Dietary EtOH on Production of IgA and IgG By Splenocytes ........ ...... ........ .. ...... ....... 99
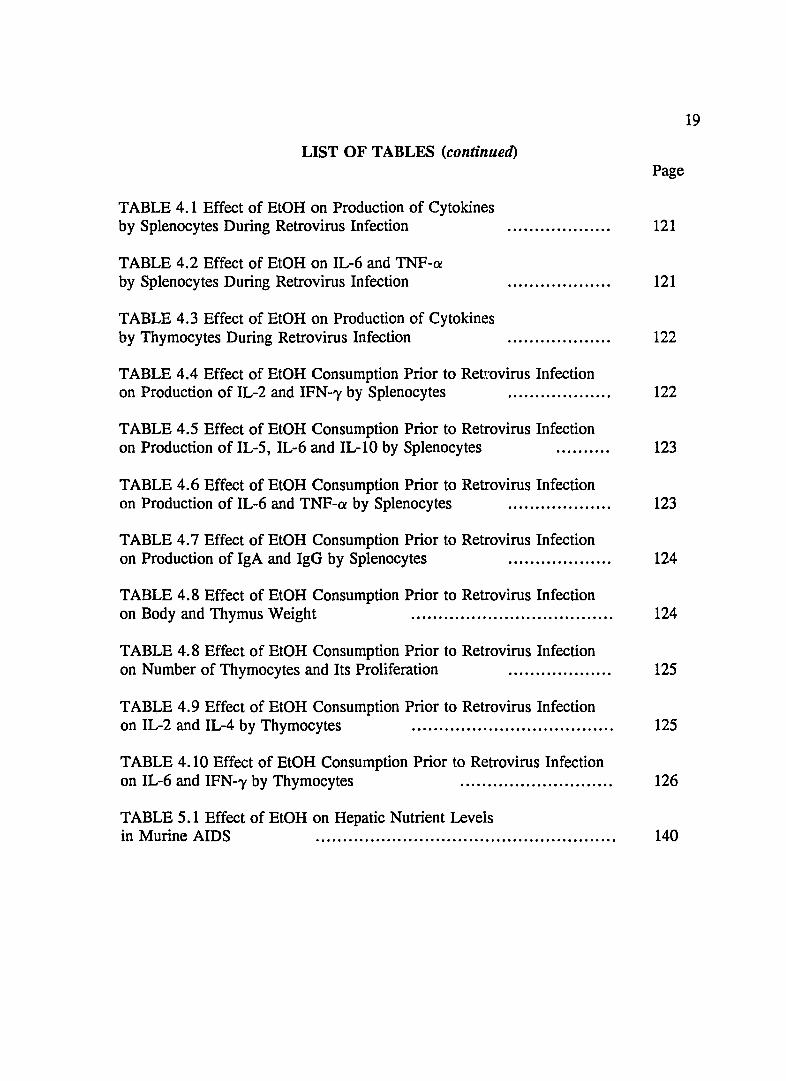
LIST OF TABLES (continued)
TABLE 4.1 Effect of EtOH on Production of Cytokines by Splenocytes During Retrovirus Infection
TABLE 4.2 Effect of EtOH on IL-6 and TNF-Q! by Splenocytes During Retrovirus Infection
TABLE 4.3 Effect of EtOH on Production of Cytokines by Thymocytes During Retrovirus Infection
TABLE 4.4 Effect of EtOH Consumption Prior to Retrovirus Infection
Page
121
121
122
on Production of IL-2 and IFN-'Y by Splenocytes ................... 122
TABLE 4.5 Effect of EtOH Consumption Prior to Retrovirus Infection on Production of IL-5, IL-6 and IL-lO by Splenocytes .......... 123
TABLE 4.6 Effect of EtOH Consumption Prior to Retrovirus Infection on Production of IL-6 and TNF-Q! by Splenocytes .. .. . .... ... . . . . . .. 123
TABLE 4.7 Effect of EtOH Consumption Prior to Retrovirus Infection on Production of IgA and IgG by Splenocytes ................... 124
TABLE 4.8 Effect of EtOH Consumption Prior to Retrovirus Infection on Body and Thymus Weight ..................................... 124
TABLE 4.8 Effect of EtOH Consumption Prior to Retrovirus Infection on Number of Thymocytes and Its Proliferation ................... 125
TABLE 4.9 Effect of EtOH Consumption Prior to Retrovirus Infection on IL-2 and IL-4 by Thymocytes ..................................... 125
TABLE 4.10 Effect of EtOH Consumption Prior to Retrovirus Infection on IL-6 and IFN-'Y by Thymocytes ............................ 126
TABLE 5.1 Effect of EtOH on Hepatic Nutrient Levels in Murine AIDS ....................................................... 140
19

20
LIST OF TABLES (continued) Page
TABLE 5.2 Effect of EtOH on Intestinal Nutrient Levels in Murine AIDS ....................................................... 140
TABLE 5.3 Effect of EtOH on Splenic Nutrient Levels in Murine I\.IDS ....................................................... 141
TABLE 5.4 Effect of EtOH on Thymic Nutrient Levels in Murine AIDS ....................................................... 141
TABLE 5.5 Effect of EtOH on Serum Vitamin A and E Levels in Murine AIDS .............................................. 142
TABLE 6.1 Effect of Vitamin E on IL-2 and IFN-'}' Production by Splenocytes From Ethanol-Fed Mice ............................ 156
TABLE 6.2 Effect of Vitamin Eon IL-4, IL-5, IL-6 and IL-lO Production by Splenocytes From Ethanol-Fed Mice ................... 156
TABLE 6.3 Effect of Vitamin Eon IL-6 and TNF-O! Production by Splenocytes From Ethanol-Fed Mice ................... 157
TABLE 6.4 Effect of Vitamin E on Immunoglobulin Production by Splenocytes From Ethanol-Fed Mice ............................ 157
TABLE 6.5 Effect of Vitamin E on IL-2, IL-4, IL-6 and IFN-,}, Production by Thymocytes From Ethanol-Fed Mice ................... 158
TABLE 7.1 Effect of Vitamin E on Hepatic Nutritional Levels During Retrovirus Infection . . . . . . . . . . . . . . . . . . . . . . . . . . . . . . . . . . . . . 175
TABLE 7.2 Effect of Vitamin E on Intestinal Nutritional Levels During Retrovirus Infection 175
TABLE 7.3 Effect of Vitamin E on Splenic Nutritional Levels During Retrovirus Infection ... .... ..... .. ............ .... . ..... . 176
TABLE 7.4 Effect of Vitamin E on Thymic Nutritional Levels During Retrovirus Infection ... . .... .... . . ......... .... .... ... ... 176

21
LIST OF TABLES (continued) Page
TABLE 7.S Effect of Vitamin E on Serum Vitamin Levels During Retrovirus Infection . . . . . .. . . . . . . . . . . . . . . . . . . . . . . . . . . . . . . . . . . . . . . . 177
TABLE 7.6 Effect of Vitamin E on Production of IL-2 and IFN--y During Retrovirus Infection . . . . . .. . . . . . . . . . . . . . . . . . . . . . . . . . . . . . . . . . . . . . . . 177
TABLE 7.7 Effect of Vitamin E on Production of IL-4, IL-S and IL-6 During Retrovirus Infection . . . . . . . . . . . . . . . . . . . . . . . . . . . . . . . . . . . . . . . . . . . . . . 178
TABLE 7.8 Effect of Vitamin E on Production of IL-6 and TNF-a During Retrovirus Infection . . . . . .. . . . . . . . . . . . . . . . . . . . . . . . . . . . . . . . . . . . . . . . 178
TABLE 7.9 Effect of Vitamin E on Immunoglobulin Production During Retrovirus Infection . . . . . .. . . . . . . . . . . . . . . . . . . . . . . . . . . . . . . . . . . . . . . . 179
TABLE 8.1 Effect of Vitamin E Supplementation on Spleen Weight During Murine AIDS ......... . . . .. . .. ..... .. .. .... . .. .. ... . .. .... . 203
TABLE 8.2 Effect of Vitamin E Supplementation on Hepatic Vitamin E Level During Murine AIDS .............. ........ ........ .. .. .. . 203
TABLE 8.3 Effect of Vitamin E Supplementation on Serum Vitamin E Level During Murine AIDS .... .... .. ...... ... .... .... .... ... ... 204
TABLE 8.4 Effect of Vitamin E Supplementation on IgO Production During Murine AIDS .......................................... " . . 204
TABLE 8.S Effect of Vitamin E on Thymus weight During Murine AIDS ... ......... ... . .. . ... ..... .... .. . .. ...... ... . 20S
TABLE 8.6 Effect of Vitamin E Supplementation on Thymic Vitamin E Level During Murine AIDS ............. ... . .... .. . .. .. 20S

22
ABSTRACT
LP-BM5 murine leukemia retrovirus infection in C57BL/6 mice rapidly produces
murine AIDS with many functional similarities to human AIDS, including progressive
lymphoprolifertaion and increasing severe immunodeficiency. The present studies
indicated that retrovirus infection induces immune dysfunctions via modulating the
cytokine production, and affects the thymus, producing altered T cell differentiation via
the dysregulation of thymocyte cytokine secretion. In addition, retrovirus infection can
directly cause malnutrition, possible via damaging gastrointestinal cells, thereby leading
to malabsorption. Such malnutrition has the theoretical potential to accelerate
development of AIDS via immunosuppression secondary to nutritional deficiency.
Chronic ethanol consumption in the mice altered the cytokine release, and impaired
immune response, and disrupted T cell maturation, which increase host susceptibility to
infection. Chronic ethanol consumption may be one of the co-factors accelerating
development of human AIDS after retrovirus infection. The results from this study
suggest that dietary ethanol, upon retrovirus infection or prior to retrovirus infection,
aggravates progression of immune dysfunction and affects T cell maturation in the
thymus, leading to AIDS as dietary ETOH modifies production of immunological
regulatory cytokines by splenocytes and thymocytes. Furthermore, ethanol can directly
aggravate undernutrition initiated by retrovirus infection. Such ethanol-induced
malnutrition in AIDS may also be a cofactor, accelerating development of AIDS via
immunosuppression secondary to nutritional deficiencies. Vitamin E supplementation
enhances immune responses. The immunostimulatory nature of vitamin E does provide

23
a basis for its use in the modulation of the various cell components and immune
functions, and its consequent therapeutic use during AIDS and alcoholics. The findings
in the study clearly demonstrated that dietary vitamin E supplementation can modulate
dysregulation of cytokines initiated by dietary EtOH and restore immune dysfunctions
induced by EtOH ingestion. The potential therapeutics of vitamin E supplementation
for AIDS treatment has also been determined in this study. Vitamin E supplementation,
even at extremely high levels, can help to restore levels of tissue nutrients, cytokine
dysregulation and some immune dysfunctions initiated by retrovirus infection during
murine AIDS. Thus, the vitamin E supplementation may provide additional therapeutic
approaches for treatment of HIV infected patients or alcoholics without additional
immunotoxicity.
Chapter 1: REVIEW OF LITERATURE
SECTION I: THE ANIMAL MODEL OF HUMAN AIDS: MURINE AIDS
Introduction
24
Acquired immune deficiency syndrome (AIDS) is a clinical disorder representing
the end point in a progression sequence of immune suppressive changes that render the
body highly susceptible to life-threatening tumors and opportunistic infections. AIDS has
been identified as a major public health priority in the United States with heavy social
and economic impact. By mid-1990, approximately 140,000 children and adults in the
United States had developed AIDS. The Centers for Disease Control reported that
85,430 persons died from this condition as of June 1990 (1). Projections of U.S. health
authorities estimated in 1990 that by the end of 1991, a total of 300,000 to 485,000 of
AIDS cases would be found in the United States with the number of deaths increasing
at a proportional rate (2). In addition, 1 to 1.5 million persons are reported to be
infected with the human immunodeficiency virus (HIV) as of mid-1990 (3). The unique
pathogenicity of HIV, its long latent period and the infection, the AIDS epidemic has
steadily increased in the United States. The cases of AIDS in the first three months in
1993 are three times more than that reported for the same period last year. Immune and
other physiological defects induced by HIV infection appear to be progressive and
irreversible with a high mortality rate that approaches 100% (4). Therefore, there are
pressing needs to understand immunopathogenesis of HIV, cofactor involvement in the
disease, anti-retroviral drug testing, and immunoenhancing nutritional therapy. Ethical,
economical and logistical considerations, however, have limited these AIDS studies in

25
humans.
Animal model systems for AIDS that simulate many aspects of the human
diseases, yet have the benefits of large numbers of subjects, low cost, and a well-defined
immunological system, are critically needed for mechanistic studies, cofactor in
development, and AIDS therapeutics. There are no doubts that knowing in one model
system the precise cellular and molecular mechanisms that lead to immunodeficiency
would represent a considerable step forward in the understanding of retrovirus-induced
immunodeficiency in general. Retroviruses appear to be widespread, and have been
isolated from fish, mammals, birds, and reptiles. However, the most promising
opportunities to study AIDS and its related therapeutics is murine AIDS, which is caused
by LP-BM5 murine leukemia retrovirus (MuLV) infection in a genetically susceptible
strain female C57BL/6 mice. Recent advances on murine AIDS further strengthen it as
an excellent animal model for study of the human AIDS. The similarities between
murine AIDS and the early stage of human AIDS are striking in many respects.
Etiology of AIDS
The family of Retroviridae is characterized by RNA containing viruses which
replicates via a DNA intermediate that is integrated with the host genome. Animal
retrovirus-induced diseases are usually not associated with cancer, but instead they are
manifested as nonneoplastic disorders which may include chronic degenerative conditions
or entirely pathogenic events. Immunosuppression, associated with certain retrovirus
mutants, confers a significant increase survival value of the virus in the host. There are
at least four mechanisms by which human and murine retrovirus modulate the host

26
immune apparatus: 1) direct lysis or functional impairment of virus-infected lymphoid
cells as consequence of viral replication; 2) activation and release of novel soluble
mediators of viral and/or host origin from virus-infected cells; 3) damage to host cellular
defense mechanisms involved in phagocytosis, antigen presentation, and nonspecific
effector aspects of cell-mediated immunity by virus infection; 4) disruption of the
immunoregulatory cytokine balance normally sustained by T suppressor or helper cell
cytokine production.
The virus mixture, LP-BM5 MuLV, was originally isolated by Latarjet and
Duplan and produces non-neoplastic lymphoproliferative disease in adult mice (5). LP
BM5 MuL V was obtained from a non-thymic lymphoma which had been induced by
irradiation of mice. Then bone marrow stromal cells were isolated from the infected
mice and grown as cell lines yielded the agent. The cluster of MuL V viruses includes:
1) a 4.8-kbp replication-defective BM5d, 2) a B-tropic mink cell focus-inducing virus
(MCFV), and 3) a replication-competent B-tropic ectropic virus (BEV). None of these
MuLV isolates induced murine AIDS. The immunological disorders are apparently
induced with defective-genome BMSd, but not after infection by BEV and MCFV which
serve to facilitate the transmission of BM5d defective virus in mouse tissues. The murine
major histocompatibility complex has been shown to influence the development of murine
AIDS and the extent of virus spread in adult mouse (6). This murine retrovirus infection
provokes an enlargement of lymphoid organs, primarily spleen and lymph nodes.
Although lentiviruses are associated with human AIDS and C-type retroviruses appear
to be the causative agents in murine AIDS, both are very similar in that they cause

27
profound immunosuppression as well as reduced resistance to opportunistic pathogens and
neoplasia in their respective hosts. It is well established that the development of disease
reflects complicate interactions among cells of the immune system. The major immune
cell target for LP-BM5 MuLV is B cells and macrophage, which is also a major target
for HIV. CD4 + T cells and B cells are required for the development of murine AIDS
infection and the associated immunosuppression (7,8). Using molecular hybridization
techniques and molecular cloning, two studies recently have identified that a defective
viral DNA of 4.8-kbp was pathogenic (9,10). Sequencing of this 4.8-kbp defective viral
genome revealed a unique structure: the gag gene, normally found in helper MuLV, was
conserved but the pol and env genes were largely deleted (9). The single long open
reading frame found was in the gag gene and could encode a putative Pr6~18 protein,
which has been suggested to playa key role in murine AIDS pathogenesis (11). Pr6O:18,
which would be present on the surface of virus-infected B cells, would stimulate
polyclonal activation of helper T cells, leading to aberrant the production of cytokines
(11). It is hypothesized that Pr6~ag, acting as a superantigen, is different from other
antigens thus its presence would eventually lead to defect of the entire immune system
instead of induction of a more usual immune response. It may also stimulate some
primary proliferation of infected target cells in the very early stage of LP-BM5 MuLV
infection. Alternatively, immunodeficiency may arise as a paraneoplasmic syndrome, and
be consequence of the proliferation of the virus infected cells (12,13). Infection of these
cells could lead to an increased cytokine production that is detrimental to the immune
response, or less likely, to a decreased production of a factor essential to keep intact the
28
immune system. Alternatively the infected target cells, possible through the Pr6()1lag,
could themselves interact directly or indirectly with other immune cells of and lead to the
entirely immunodeficiency.
Immune Functions in AIDS
HIV infection in humans progresses to significant immunosuppression, as does
the LP-BM5 MuLV infection in mice (14). The role of T cells is critical to AIDS
development in humans. HIV causes abnormalities in the immune system by depleting
the CD4 + T helper cells, and by changing their functions (14). In addition, mv
activates B cells and infects macrophages which can be critical to antigen presentation
(15). The pathogenesis of LP-BM5 MuLV is characterized by T and B cell dysregulation
with many changes similar to those reported in human HIV infection (15). While T
cells are not the main source of viral replication and not viral components or the various
mixtures directly immunosuppressive, they are essentially required for early pathogenesis
and diseases (16). The temporal sequence of T-cell function changes is similar between
the two diseases, with helper T cell function lost well before dysfunctions of
cytotoxic/suppressor T cells (17). The quantitative loss of overall T-cell function occurs
far in advance of the reduction in CD4 + T helper cell numbers (17); however, the extent
of T cell depletion varies from organ to organ. Although T helper cell numbers stay
relatively constant during early stages of infection, it has been proposed that CD4 + T cell
populations shift from a heterogenous phenotype, characteristic of a mixed population of
naive and memory cells, to a more homogenous phenotype that broadly shares
characteristics of both memory and activated cells (18). The initial resting

29
immunocompetent CD4 + T cell population, in other words, is replaced by a polyclonal
population described as being in an anergic state (18). The state of anergy has been
demonstrated to be related to defects in the signal transduction pathway (PKC, calcium
mobilization, and phospholipase C ) induced by LP-BM5 MuLV during murine AIDS
(18-21). Furthermore, the state of anergy is apparently induced by a soluble, diffusible,
LP-BM5 MuL V -encoded superantigen-like component that is capable of stimulating most
CD4 + T cells (18,19). However, murine AIDS does not result in the generalized
depression of bone marrow function nor the death of infected T -helper cells, as occurs
in human AIDS.
Both viruses induce an early phase of B cell hyperactivity and polyclonal
activation (17). B cells and their production of immunoglobulin (lg) show a significant
number of alterations due to retroviral infection in man (14). Activation of both T and
B lymphocytes can be detected within one week of infection, as judged by flow
cytometric analysis of size of T and B cells and measurements of the percentage of B
cells secreting IgM. There is an absolute increase in the number of B cells in the spleen
and lymph nodes, and a three-fold increase in the fraction of B cells in cell cycle (16).
While T cells from LP-BM5 MuLV-infected mice will not provide helper activity to
normal B cells for a specific antibody response in vitro, they do stimulate elevated
polyclonal IgM secretion by normal B cells (16). During the early part of the LP-BM5
MuL V infection the B cells produce large amounts of Igs with increased number of
plasma or Ig-producing cells. There is widespread, polyclonal activation of B cells (22).
The cells become unresponsive to new antigens, either due to B or T cell defects. The

30
later stages of the murine AIDS-like disease involve continued expansion of members of
the B lymphocyte lineage including all stages from pre-B cells to plasma cells, increased
numbers of the monocyte-macrophage lineage, and appearance of immature T cells in the
periphery (1). Natural killer (NK) cell function is also reduced early in both diseases,
but lymphokine-activated killer cell (LAK) function is maintained for 8-10 weeks after
initiation of LP-BM5 MuLV infection (18). Number and function of macrophages are
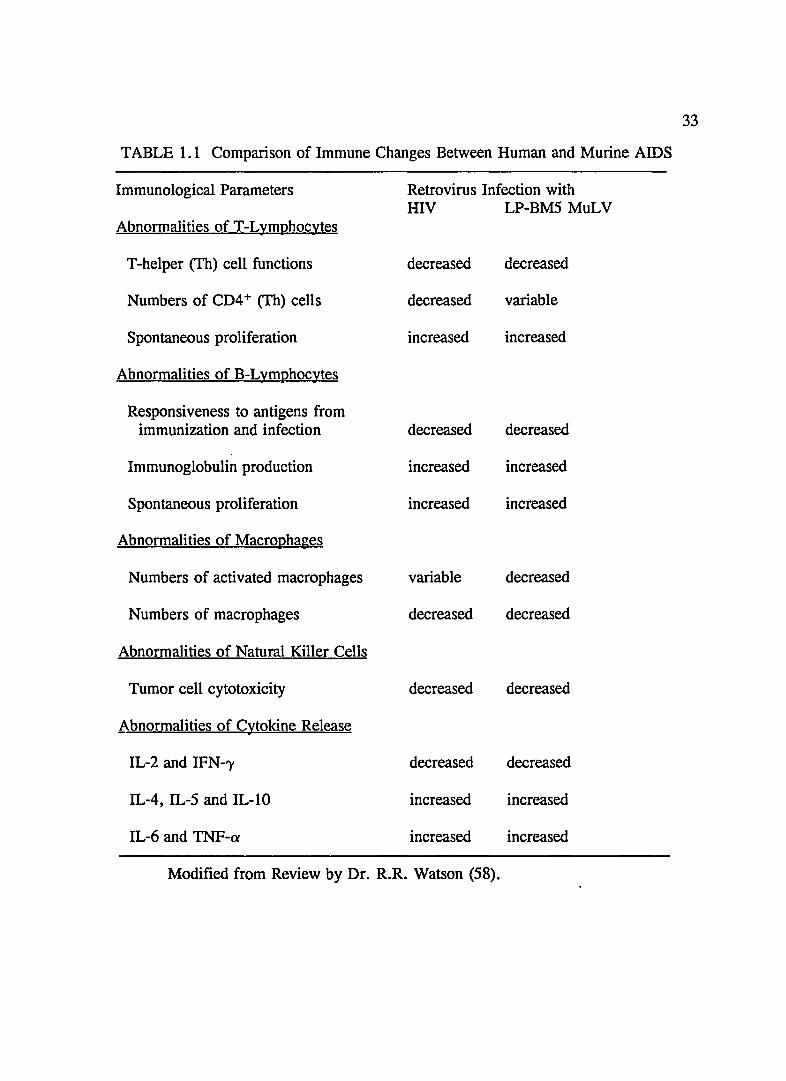
suppressed in both diseases. The similarities between human and murine AIDS are
summarized in Table 1.1.
Cytokines mediate a variety of biological and physiological processes providing
an interactive complexity of potentially immunomodulating agents which integrate cellular
and humoral function within higher mammals. This network of pleiotropic cell
regulators are secreted primarily from immunocompetent cells (23). They playa crucial
role in transmitting and regulating signals for proliferation, differentiation, and
expression of cellular function in a variety of targets especially in relation to immune
responses. Target cell functions are usually affected by the interactions of one or more
of these regulatory molecules. Cytokine dysfunction may be a key component to induce
AIDS in retrovirus-infected subjects. Interleukin 2 (IL-2) is a pivotal cytokine for the
growth and differentiation of T and B cells, and for the enhancement of B cell growth
and Ig production (24). It is secreted mainly by the Th1 subset of activated T helper
cells. In addition to T cell proliferation, subsequent studies have shown that B cells, NK
cells (25), and LAK cells also respond to IL-2 (25). IL-4, IL-5 and IL-6 are synthesized
predominantly by stimulated T cells (26, 27). IL-4, IL-5 and IL-6, respectively, promote

31
the activation, growth, and differentiation ofB lymphocytes into antibody-secreting cells,
but have also been found to have various effects on T cell activation and growth (25,28-
35). IL-10 is produced during a variety of immune activated conditions by ThO and Th2
cell subsets as well as by monocytes, macrophages, and B cells (36). It suppresses Th1
cytokine production (IL-2, IFN-'Y, and lymphotoxin) and antigen-specific proliferation
of Th1 cell subsets after activation in an accessory cell-dependent manner. It also
diminishes delayed-type hypersensitivity reactions and other Th 1 cell-mediated responses.
Acting indirectly, IL-10 suppresses the capacity of certain accessory cells to promote Th 1
cell development (32). Furthermore, it suppresses murine macrophage functions such
as the inhibition of macrophage-mediated immunity and the production of reactive
nitrogen oxides which are involved in the elimination of intra- and extra-cellular
parasites. Interferon-gamma (IFN-'Y) is a multiple immunoregulatory cytokine that is
secreted primarily by activated T lymphocytes (CD4 +, CD8+, and CD4-8-), cells of the
monocyte lineage, and NK cells (37-40). The production of IFN-'Y is modulated by the
simultaneous production of IL-1, IL-2, IL-4, and tumor necrosis factor-cy (TNF). It
primes macrophages for microbicidal and tumoricidal activity and enhances NK
cytotoxicity (41,42). Moreover, its functions include the inhibition of some IL-4-induced
B cell activations, the modulation of B cell differentiation, the augmentation of Ig
secretion in B lymphocytes (43-45), and the up-regulation of expression of the secretory
component required for binding and transport of secreted IgA and IgM (46).
Furthermore, it down-regulates cytokine production (IL-4, IL-6, and IL-lO) and cell
proliferation of Th2 cell clone. Finally, TNF is a cytokine that express activities

32
including inflammation and anti-tumor activity (42,47,48). Activated
monocytes/macrophages are the primary source of TNF-~ (49,50). The production of
TNF is regulated by IFN-')' released from stimulated T cells (51). Thus, the cytokine
production by immune cells will be a major focus in this research project.
Nutritional Status in AIDS
Since progression to AIDS is often complicated by various nutritional disorders,
the additional immune dysfunction due to undernutrition may have precluded recovery
from infectious events which earlier represented survivable episodes. This hypothesis
is based on findings that malnutrition has been associated with immunological dysfunction
(52, 53); development of infectious processes (97,99) and vital organ dysfunction (55).
Thus, the severe malnutrition seen in patients with AIDS may set up a vicious cycle in
which the underlying immunological defects related to HIV infection are accentuated by
the malnutrition-induced immune dysfunction.
Although the roles of vitamins and minerals in the clinical manifestation of HIV
infection has not been well defined (56), a growing number of studies have suggested
important links between vitamins or minerals and HIV infection (57). Vitamin B12 and
B6 deficiencies are common in patients with HIV infection (59-62). The patients at
various stages of HIV disease has serum vitamin A and E deficiencies (63-65).
Malabsorption secondary to HIV-induced intestinal dysfunction appears to be the likely
case of vitamin A deficiency, but no further study about pathogenesis has been reported.
The case of vitamin E deficiency is unclear, although it may relate to the malabsorption
associated with worsening HIV infection. A recent study which found that a major
33
TABLE 1.1 Comparison of Immune Changes Between Human and Murine AIDS
Immunological Parameters Retrovirus Infection with HIV LP-BM5 MuLV
Abnormalities of T-Lymphocytes
T -helper (Th) cell functions decreased decreased
Numbers of CD4 + (Th) cells decreased variable
Spontaneous proliferation increased increased
Abnormalities of B-Lymphocytes
Responsiveness to antigens from immunization and infection decreased decreased
Immunoglobulin production increased increased
Spontaneous proliferation increased increased
Abnormalities of Macrophages
Numbers of activated macrophages variable decreased
Numbers of macrophages decreased decreased
Abnormalities of Natural Killer Cells
Tumor cell cytotoxicity decreased decreased
Abnormalities of Cytokine Release
IL-2 and IFN-'Y decreased decreased
IL-4, IL-5 and IL-lO increased increased
IL-6 and TNF-cx increased increased
Modified from Review by Dr. R.R. Watson (58).

34
percentage of patients with AIDS (50%), ARC (58%) and HIV (38%) had a vitamin E
intake of less than 50% the Recommended Daily Allowance (56). Zinc deficiency in
HIV infection has been identified consistently (65-68). One study reported marginal
copper deficiency in 22 % of their AIDS patients (69). Selenium deficiency also occurs
in AIDS-related malnutrition, though its mechanism has not been determined (69, 70).
Thus, patients with HIV infection can be increasingly compromised nutritionally as the
disease progresses. Indeed, it has been suggested that HIV infection might play
pathogenic role in gastrointestinal cells. In situ hybridization studies have localized HIV
infection in various types of epithelial cells of the bowel mucosa (71, 72). HIV infection
of gastrointestinal cell lines has been documented in vitro (73-75). Since the lymphoid
tissue, the main target of HIV, is present throughout of the gastrointestinal tract, and
CD4-related receptors on the epithelial cells have been demonstrated (76), it is
conceivable that AIDS patients have dysfunction of some portion of gastrointestinal tract
due to retrovirus infection, thereby leading to malabsorption and malnutrition.
Since serum vitamin and mineral levels may not always be sensitive or specific
indicators of states deficiency or excess, levels do not always reliably reflect nutrient
status. Thus, the studies in the animal model are necessary to define the nutritional
status in the different organs during the progression to AIDS. Since some of the
deficiency states seen in HIV -infected patients could result from the alcoholism, drug
use, infections, and other extraneous variables, which are usually associated with AIDS
patients and contribute malnutrition and immune dysfunctions (77-78), it is har.d to
correlate the relationship between retrovirus infection and malnutrition, and between
35
malnutrition and immune dysfunction in human subjects as AIDS advances. Thus, the
studies in murine AIDS may help to clarify the relationship between malnutrition state
and retrovirus infection, and between undernutrition and immune dysfunction. In this
project, we will investigate the nutritional status during murine AIDS.
Conclusion
Studies of murine AIDS have already been instrumental in formulating novel
hypotheses on human AIDS, some of them testable (80). This animal model appears,
therefore, to fulfill its role efficiently. Practically, LP-BM5 MuLV is not considered as
a human pathogen and carries no risk of transmission to other mice (58). The model is
economical, simple to implement and manipulate and offers a practical and ethical
alternative to AIDS studies using primates or humans. The use of this murine AIDS
model, therefore, should provide a fruitful and exciting experimental opportunity to
elucidate the pathogenesis of retrovirus infection, cofactor involvement such as alcohol
user, drug abuse and nutrition, and anti-retroviral drug testing.

SECTION II: ALCOHOL, IMMUNE RESPONSE, NUTRITION AND AIDS
Introduction
36
Excessive alcohol (EtOH) consumption is a major health problem in the United
States. There are 18 million EtOH-dependent people and another 40 million heavy
drinkers in the United States. The cost to individuals and society, in terms of medical
care and other financial and social costs, are tremendous. Between 20-40% of hospital
beds in the United States are filled by patients whose illnesses are EtOH-related.
According to an estimate of the National Institute of Alcohol Abuse and Alcoholism
yearly economic costs for EtOH-related problem amount to $117 billion (81).
Historically, EtOH use has been associated with infectious disease and lowered
resistance of host. As early as 1884, Robert Koch suggested that most victims of
endemic cholera were heavy alcohol drinkers (82). A 1923's report from Cook County
Hospital associated with mortality from pneumonia with heavy alcohol use (83).
Alcoholism has also been closely associated with lung abscesses, bacteremia and
peritonitis, and tuberculosis (84). It thus appears that prolonged consumption of EtOH
results in alterations of immune responses, ultimately manifested by increasing
susceptibility to infectious agents (85). Such changes can be due to the direct effects of
EtOH or its metabolites on immune cells, as well as to nutritional deficiencies found
frequently with alcohol abuse.
Ethanol and Immune Response
Alcohol use is immunotoxic, and affects most components of the immune defense
mechanism. Chronic alcohol users have a number of similar alterations in
37
immunocompetence including a depression of serum bacteriocidal activity, alterations of
immunoglobulin production, leukopenia, defects in chemotaxis, decreased antigen
trapping and processing, and decreased T-cell mitogenesis (81, 82). A loss in the
number of circulating leukocytes has been associated with EtOH use in humans (86, 87),
with detrimental effects on humoral immune response, including antibody production
(88). In addition, EtOH suppresses several aspects of cell-mediated immunity such as
delayed-type hypersensitivity reactions and lymphocyte proliferative response to mitogens
in humans (89). EtOH administration to animals has also a profound effect on decreasing
the weight of peripheral lymphoid organs as measured by a decrease number of
thymocytes and splenocytes (90-92). In mice, EtOH use produces thymic and splenic
atrophy, alterations in circulating lymphocytes and lymphocyte subpopulations, and in
cellular and humoral immunity and impaired cytokine production (93-96). Mice fed
EtOH for a short period of time have shown both normal and decreased natural killer cell
activity (97, 98). Antibody dependent cellular cytotoxicity (99), lymphocytes
proliferation (100), B lymphocyte functions (100, 101) and cytokine production by
lymphoid cells (94, 102) are also impaired by dietary EtOH. Thus, EtOH-induced
immunosuppression may render alcoholics more susceptible to tumorigenesis and
infections seen frequently in alcoholics.
Since any perturbation in tightly controlled cytokine regulatory system can result
in immune alterations modifying host resistance to infectious disease and cancer, the
influence of EtOH consumption on cytokine secretion has been considerably investigated.
Several studies have indicated a correlation between circulating levels of macrophage-

38
derived cytokines and disease progression during chronic BtOH consumption. Increased
plasma concentrations ofTNF-a have been observed in cases of ALD and, interestingly,
relate significantly to decreased long-term survival; plasma IL-1a is also significantly
increased in these patients (relative to healthy controls) but does not correlate with
increased mortality (103). McClain and Cohen (104) reported that both spontaneous and
LPS-stimulated release of TNF-a was increased significantly by monocytes of ALD
patients compared to normals controls. An earlier study indicated that an increase in IL-
6 production by LPS-stimulated monocytes could also be related to ALD, and that
monocytes from alcoholics without ALD did not release IL-6 above control levels (105).
Another report links ALD with increased serum levels of IL-6 and TNF-a by LPS
stimulated monocytes over controls. IL-la, IL-6 and TNF-a govern the production of
certain acute-phase reactants by hepatocytes (106-109), a characteristic response of the
liver to systemic tissue damage and inflammation. They also induce temperature
elevation and fever via cyclooxygenase-dependent pathway (110). Thus, BtOH-mediated
tissue damage may have a significant basis in the effects of BtOH on cytokine secretion
in vivo, especially of the primarily macrophage-derived cytokines. Patients with ALD
also have depressed IL-2 and IFN-'Y production (101, 111), suggesting a possible defect
in cell-mediated immunity.
The results from animal studies differ from data obtained from in human
alcoholics with ALD. Intravenous application of LPS caused comparable serum TNF-a
peaks after 90 min in both normal and chronic alcoholic rats (112). In contrast, acute
BtOH injections confirm the in vitro data (104), that acute BtOH exposure suppresses

39
TNF-a release, independent of chronic EtOH exposure. In a further study, marked
suppression of TNF-a in serum and bronchoalveolar fluid occurred after short-term
EtOH exposure of rats (113). The underlying mechanisms by which EtOH consumption
affects cytokine secretion are listed as follow. It could be a direct effect of EtOH on
cytokine-producing cells by affecting signal transduction and changing fatty acid
composition in cell membrane; It could be affected by some hormonal regulators such
as ACTH, fi-endorphin and prostaglandin(PG) altered by EtOH consumption; It could be
directly affected by tissue damage such as ALD with consecutive cytokine release.
However, a paucity of information, regarding the role of EtOH consumption on other
important immunoregulatory cytokines such as 11-2, IL-4, IL-5, IL-lO and IFN--y is
available.
Ethanol and Nutrition
EtOH depresses the appetite, replaces other food in the diet, and decrease the
value of food by interfering with digestion and absorption (114). EtOH-induced
undernutrition could be due to an inadequate and imbalanced intake of nutrients,
maldigestion, and malabsorption, as well as impaired metabolism, decreased tissue uptake
and storage, increased loss of nutrients through the urine, increased nutritional
requirements, or combination of these factors (115). EtOH is transported throughout the
body system giving it the potential to affect most organs and tissues. EtOH affects the
gastrointestinal tract by alterations in stomach acid secretion and delayed gastric
emptying. Alterations in the mucosa of the small intestine leads to alterations in the
production of enzymes, decreased absorptive capacity, malabsorption, and altered

40
transport of nutrients. EtOH also negatively affects pancreatic function with the potential
for maldigestion of foods (116). Therefore, EtOH intake can affect every stage in
nutrient metabolism including nutrient intake, digestion, absorption, activation, storage,
utilization, degradation and excretion.
Since some nutrient deficiencies are well known to be associated with immune
dysfunction (79, 117), reduction in micro- and macro-nutrient intakes can be related to
significant immunosuppression (118, 119). Chronic EtOH consumption increases the
catabolism of retinol leading to a depletion of existing hepatic vitamin A stores. In
addition, there is a decrease of hepatic storage of vitamin A (120). Deficiency of vitamin
A has been associated with EtOH ingestion in humans (121). Vitamin A deficiency
depresses lymphocyte activation by mitogen in rats, leads to a depletion of mature T -cells
from the spleen, decreases thymus weight, and depresses levels of lymphocytes and
plasma cells (122). Repletion with retinoic acid results in a rapid increase in the
peripheral lymphocyte count (123). Vitamin A deficiency has also been associated with
an increased incidence in a variety of cancers and to an increased susceptibility to
infection (124). Therefore, the EtOH-induced vitamin A deficiency can contribute to
immunosuppression found in EtOH users.
Animal studies have correlated a decreased serum vitamin E level with EtOH use
(125). The decreased serum levels of vitamin E may affect the integrity of cell structure
and function as indicated by an increase in lipid peroxidation and enhance free radical
activity. In rats, depressed antibody-dependent cell mediated cytotoxicity, decreased
lymphocytes blastogenesis in response to mitogens, and depressed NK cell mediated

41
cytotoxicity (126) have been reported in vitamin E deficient states. In humans, a strong
correlation has been shown between decreased serum levels of vitamin E and decreased
number and metabolic functions of T cells (127). Therefore, deficiencies,of vitamin E
in immune organs would be expected to partly contribute to the immune dysfunctions
initiated seen in alcohol-fed mice: depressed proliferation of T and B cells, suppressed
IgA and IgO production, impaired cytotoxicity of splenic NK cell, and dysregulated
cytokine production (94, 102).
Zinc deficiency has great influence on barrier immunity by causing skin lesions,
gastrointestinal alteration, damage to the microvilli, and impaired pulmonary functions.
Zinc has also an important role in immunocompetence and exerts a crucial regulatory
effect on specific immune functions. Zinc deficiency results in the adverse effects on the
immune system of a depression of cell-mediated immunity with decreased T -cells and B
cells in lymphoid tissue, decreased T -helper cell number and activity, an inverted ratio
of T -helper to T -suppressor cells, a depressed response of T-cell to tumor cells, delayed
cutaneous hypersensitivity, decreased lymphokine production, decreased production of
cytotoxic T cells, reduced antibody response requiring T -helper cells, decreased natural
killer cells activity, depressed IgM production, and depression of thymic hormones (128).
In the rabbit, both epithelial and stromal herps simplex keratitsare more severe when zinc
is deficient (129). A dose of trypanosoma cruzi, which would normally be sublethal,
causes the death of 80% of zinc-deficient mice who also exhibit a 50-fold higher
parasitemia than pair-fed controls (130). In such zinc-deficient rats, the expUlsion of
trichinella spiralis (130) and Strongyloides ratti is impaired (131).

42
Zinc deficiency is common with chronic EtOH use. Zinc deficiency may occur
with chronic EtOH use due to inadequate dietary intake, altered absorption and increased
urinary excretion. One study found that 90% of alcoholics with or without liver disease
had inadequate dietary zinc intGke. In animals EtOH intake decreased zinc absorption.
Plasma zinc levels can be decreased 60% below normal in chronic EtOH users (132).
Zinc deficiency can affect vitamin A status due to alterations in vitamin A metabolism,
manifesting with impaired visual function. Zinc plays a role in the storage and
mobilization of vitamin A (133). Zinc is also a part of a metalloenzyme that is
responsible for EtOH metabolism. In animals zinc deficiency impairs EtOH metabolism,
resulting in increased levels of EtOH in the blood and tissues for longer times. This
findings also support the notion that the malnourished state of alcoholics may aggravate
the immune dysfunctions initiated by EtOH ingestion, e.g. depressed proliferation of T
and B cells, impaired cytotoxicity of splenic NK cell, and dysregulated cytokine
production observed in EtOH-fed mice by us (94, 102). These evidence concomitantly
explain the loss of host resistance to the tumors and opportunistic infections observed in
EtOH-fed mice by us (134, -136). Taken together, deficiencies of nutrients induced by
EtOH intakes may render more susceptible to peroxidative injuries, increased appearance
of cancers, immuno- suppression and subsequent .increased infections.
Ethanol and AIDS
Since the association of EtOH use with an increased incidence of a variety of
infectious diseases and cancers (137), EtOH-induced changes in immune response have
been presumed to increase susceptibility to tumorigenesis and opportunistic infections
43
found frequent in AIDS subjects. EtOH use has been associated with some high risk
social practices for HIV infection and because EtOH is often used concomitantly with
other drugs by the high risk group of intravenous drug users (138). A number of
researches in vitro indicated that EtOH may increase both the susceptibility of cells to
mv infection and the extend of viral replication in infected monocytes/macrophages and
T cells (139-141). However, a recent study of EtOH ingestion in mY-positive persons
did not demonstrate an increase in the development of AIDS (142). Since the dosage,
frequency and duration of EtOH exposure in the various stage of mv -positive patients
may be a key role in the progression to AIDS, the results of this study is questionable
when all these factors in EtOH exposure were not well defined. In order to comprehend
the roles of EtOH consumption in development of AIDS, we must address these two
questions. First, are alcoholics more predisposed to HIV infection? Second, can EtOH
ingestion at the special stage of mv infection ( e.g. following seroconversion) aggravate
the development of AIDS? Thus, human studies on the role of EtOH use in AIDS
development should focus attention on those patients who have had prolonged, very high
intakes of EtOH and would therefore be most predisposed to immunosuppression due to
HIV infection. In addition, since significant progression to AIDS with loss of most
peripheral CD4 + T helper cells is necessary to cause immunosuppression, CD4 + T
helper cells (less than 250/mm3) would be most likely to be at risk of further
immunosuppression by EtOH factor. Thus, it is necessary to perform these studies in
animal AIDS model, defining the role of EtOH consumption in development of AIDS.

44
Conclusion
EtOH ingestion broadly suppresses the various arms of immune response as
described above, seriously impairing the body's normal host defense to invading
microbes and tumorigenesis. There is little doubt that alcohol abuse exerts a disruptive
effect on the immune system. These disruptions are the combined result of direct
immunotoxic effects and indirect effects such as malnutrition. The alcoholic's
predisposition to extracellular and intracellular infection indicates the effects of EtOH
consumption at the local, humoral, and cellular levels, inhibiting immune response and
host defense.

SECTION III: VITAMIN E, IMMUNE RESPONSE, NUTRITION AND AIDS
Introduction
45
Since AIDS and alcoholics are diseases associated with immune dysfunctions, one
of the most attractive nutrients is vitamin E, which functions as an antioxidant and an
immunoenhancer. High doses of vitamin E decrease CD8+ T cells and increase
CD4 + /CD8+ ratio, increase total lymphocyte count, stimulate activity of cytotoxic cells,
natural killer (NK) cell activity, phagocytosis of macrophages and mitogen responsiveness
(143). The immunostimulatory nature of vitamin E does provide a basis for its use in
the modulation of the various cell components and immune functions in humans, and the
consequent therapeutic use during AIDS and alcoholics. Furthermore, high doses of
vitamin E supplementation provide essentially no toxicity (144-146). Thus, the
combination of existing medical therapy with vitamin E supplementation may provide a
more successful and novel therapeutic approach for treatment of mv infected individuals
and alcoholics.
Vitamin E and Immune Response
Vitamin E supplementation exerts a positive effect upon the immune system while
its deficiency compromises the immune system (143, 147, 148). Vitamin E has been
found to stimulate Th cells, antibody response, delayed cutaneous hypersensitivity
reaction, phagocytosis, mitogen responsiveness, the reticuloendothelial system, and host
resistance in animal models (149-151). In hemodialysis patients with low concentrations
of vitamin E in the mononuclear cells, parenteral administration of physiological doses
vitamin E, repleting body stores, decreased the number of CD8+ T cells and increased

46
the CD4+/CD8+ ratio (152). Prasad demonstrated a significant increase in bactericidal
activity in human leukocytes after ingestion of 300 mg of vitamin E daily for 3 weeks
(153). Vitamin E deficiency in dogs leads to depression of lymphocyte activation by
mitogens (154). Vitamin E supplementation has also been shown to be beneficial in
reducing the incidence or severity of infectious diseases in elderly persons and in rats
(155). In elder human subjects, vitamin E has been shown to increase IL-2 production
while decreasing that of prostaglandin E2 (PG), to increase the response to delayed
hypersensitivity skin testing, and to enhance lymphocyte proliferating in response to
mitogens (156). In patients with SLE, supplementation with vitamin E decreased in the
severity of this autoimmune disease with the plasma globulin level decreased and the
plasma albumin level increased (157). Therefore, vitamin E supplementation may
decrease the heightened levels of gammaglobulin from polyc1onal B cell activation that
occur in AIDS patients and alcoholics.
Vitamin E may also protect the immune system from and retrovirus infection and
EtOH-induced damage through intervention by hormonal changes. EtOH can increase
the levels of prostaglandin and corticosteroids (158, 159), which are elevated in
alcoholics and AIDS, and are potent inhibitors of the immune cells' activity, including
cytokine release (114). Vitamin E could decrease its levels (160, 156), thereby
enhancing immune response and increasing host resistance. Taken together, vitamin E
supplementation, which normalizes immune responses, could improve host resistance to
tumorigenesis and opportunistic infections seen frequently in alcoholics and AIDS.

47
Vitamin E and Nutrition
Since AIDS and alcoholics are diseases associated with malnutrition, the vitamin
E supplementation may improve the nutritional status. Vitamin E supplementation has
been shown to increase hepatic level of vitamin A in the rat. However, the role of
vitamin E in the absorption or transportation of minerals is still unclear clear. The
hypothesis is that vitamin E may protect gastrointestinal mucosa cells from damages of
retrovirus infection and EtOH use, thereby restoring the malnutrition occurred often in
AIDS and alcoholics. The hypothesis will be tested in this research project.
Vitamin E and AIDS Therapy
AIDS therapies involve pharmacological interventions (e.g. Ganciclovir and
Zidovudine, AZT) to inhibit HIV replication (161). However, these drugs are
accompanied by deleterious toxic side effects. For example, Ganciclovir toxicities
include bone marrow suppression, atrophy of the gastrointestinal tract mucosa and
inhibition of spermatogenesis, nausea, vomiting, reduced white blood cell count and
headaches. These anti-HIV drugs do not also repair damaged immune functions and
improve nutritional deficiencies or other pathological symptoms caused by retrovirus
infection in AIDS individuals. Furthermore, a strain of AZT -resistant HIV was reported
in human individual possibly due to high dose and prolonged use of AZT (162). Thus,
new strategies including specific dietary nutrient supplementation could provide additional
approaches to ameliorate malnutrition status and thereby immune dysfunctions in infected
individuals, eventually slowing the progression of disease to AIDS.
Since AIDS is a disease associated with immune dysfunctions, malnutrition,

48
oxidative stress. one of the most attractive nutrients is vitamin E, which functions as an
antioxidant and an immunoenhancer. Vitamin E may also directly inhibit viral
replication through inhibition of protein kinase C (PKC). The HIV coat protein gp120
induces PKC activity in lymphocytes (163). In tum, PKC activation results in the
transition of HIV from a state of latency to active replication in lymphocytes, and leads
to upregulation of HIV replication in cells with non-dormant HIV (53-55). This notion
is strongly supported by the demonstration that HIV transcription is redox regulated, and
inhibited by antioxidants such as N-acetylcysteine, a well-known antioxidant used to
replenish intracellular glutathione (56, 57, 59, 60). Collectively, vitamin E
supplementation not only enhances the immune response and restore tissue vitamin E
deficiencies but also directly inhibit retrovirus replication, thereby retarding the
progression to AIDS.
Vit2.min E should not be considered as a direct antiretroviral drug but rather as
a potentially immunomodulating and antioxidant agent that achieves its antiretroviral
effect through indirect mechanisms, possible through immunoenhancing, modulation of
signal transduction, restoration of undernutrition and anti-oxidative stress. Its use as
combination therapy with other pharmacologic agents such as AZT could have several
advantages. First, it could lead to more complete viral suppression by deceasing
oxidative stress and enhancing immunity, associated with this retrovirus infection, than
any single drug used alone. Second, it may allow each drug to be used in lower doses,
thus limiting drug toxicities, and decreased frequency of production of drug-resistant
HIV strains. Third, such immunorestorative treatment may be given during maintenance
49
therapy of the AIDS patient following the control of tumors and immune dysfunction by
chemotherapy. Fourth, the use of vitamin E may be important in forestalling initial
episodes of general immune disorders in some patients by extending the period between
mv infection and the appearance of clinical symptoms of AIDS.
Conclusion
Experimental results from animal or human studies have implied that vitamin E
supplementation may act on various immune components to repair immune defects and
lessen malnutrition status induced by EtOH intakes and retrovirus infection. Therefore,
vitamin E supplementation has theoretically therapeutic effects in human AIDS and
alcoholics. I will define in this research project the potential therapeutics of vitamin E
supplementation in alcohol-fed mice and murine AIDS by monitoring immune functions,
cytokine secretion and nutritional status. Although the animal stat may not be totally
extrapolated to alcoholics and mY-infected individuals, information obtained from
murine model may be potentially serve as a basis for the study of therapeutic roles of
vitamin E in humans.
50
CHAPTER 2: ALTERATION OF CYTOKINE PRODUCTION,
IMMUNE RESPONSE AND NUTRITIONAL STATUS DURING MURINE AIDS
Abstract
In present study, we used this model to investigate release of cytokines by splenic
T cells, macrophages and thymocytes, regulatory factors of the immune response and T
cell maturation, and some immune functions, and nutritional status. Our results indicate
secretion of TNF-a and IL-6 by peritoneal resident macrophages was significantly
enhanced beginning at 2 and 4 weeks, respectively, and continuing to 22 weeks post
infection. Release of IL-2 and IFN-'Y by splenic T cells was significantly inhibited from
4 week to 22 week post-infection, whereas secretion of IL-6 and IL-lO splenic T cells
was enhanced from 4 week to 22 week post-infection. Release of IL-4 and IL-5 by
splenic T cells was significantly enhanced at the 8-10 and 4 week post-infection,
respectively and declines progressively thereafter. The splenocyte proliferation
stimulated by mitogens was significantly inhibited after 4 weeks post infection, whereas
IgG production by splenocytes was significantly enhanced after 4 weeks post infection.
The proliferation of thymocyte induced by ConA was significantly enhanced by retrovirus
infection at 4 weeks post-infection compared to control, but significantly inhibited during
8-12 weeks post-infection. Release of IL-2 by thymocytes was significantly increased
by retrovirus infection during 2-5 weeks post-infection and 11-18 weeks post infection,
but significantly decreased during 7-9 weeks post-infection. Secretion of IL-4 by
thymocyte was significantly enhanced by retrovirus infection from 5 to 18 weeks post
infection. The level of IL-6 produced by was significantly inhibited by retrovirus
51
infection at the beginning of retrovirus infection (2-9 weeks), but significantly elevated
after 11 weeks post-infection. Release of IFN--y by thymocytes, however, was
significantly enhanced during the whole period of retrovirus infection compared to
control, while it surged at the 13 weeks post-infection. The levels of vitamin A, E and
copper in the liver in murine AIDS were significantly reduced compared to controls,
whereas the level of zinc in the liver was not affected. Intestinal level of vitamin A was
significantly reduced by retrovirus infection, whereas copper level in the small intestine
was significantly increased compared to controls. Intestinal levels of zinc and vitamin
E were not affected. The levels of vitamin A, E and zinc in the spleen in murine AIDS
were significantly rebated compared to controls, whereas the splenic level of copper was
not influenced. The levels of vitamin A, E and copper in the thymus in murine AIDS
were significantly lessened by retrovirus infection, whereas thymic level of zinc was
significantly elevated. The levels of vitamin A and E in the serum in murine AIDS were
significantly decreased by retrovirus infection compared to controls. We conclude
retrovirus infection induces immune dysfunctions via modulating the cytokine production,
and affects the thymus, producing altered T cell differentiation via the dysregulation of
thymocyte cytokine secretion. Furthermore, the data indicate that retrovirus infection can
directly cause malnutrition, possible via damaging gastrointestinal cells, thereby leading
to malabsorption. Such malnutrition has the theoretical potential to accelerate
development of AIDS via immunosuppression secondary to nutritional deficiency.

52
Introduction
LP-BM5 murine leukemia retrovirus (MuLV) infection induces murine acquired
immune deficiency syndrome (AIDS) characterized by lymphadenopathy, splenomegaly,
hypergammaglobulinemia, deficient B cell responses to T -independent antigens or
depressed allogenic cytotoxic T cell response (58). It produces immune dysfunctions
via dysregulation of cytokine production (164) and possesses many functional similarities
to human AIDS, including changes in T cell number and functions (58). LP-BM5 MuLV
infection in mice is a potentially useful model to study the consequence of human
immunodeficiency virus (HIV) infection in humans (58).
The balance of cellular and humoral immune response to antigens is regulated
by soluble mediators, termed cytokines, mostly produced by T cells and macrophages.
Therefore it is likely that dysregulated release of cytokines is responsible for some of
these changes. Recently the secretion of cytokines has been reported to be altered in
murine AIDS (164). Because of the change in the T cell population of spleen cells
during progression of murine AIDS and interaction between CD4 + and CD8+ T cells that
could affect level and kinetics of cytokine production, we evaluated cytokine production.
We measured during development of murine AIDS Thl-related cytokines [interleukin-2
(IL) and interferon-gamma (IFN--y)] and Th2-related cytokines (IL-4, IL-5, IL-6 and IL-
10) by ConA-stimulated T cells, and monokines (IL-6 and Tumor necrosis factor-a
,TNF) by LPS-stimulated peritoneal macrophages.
The generation of functional competent T cells from precursor populations within
the thymus involves several stages of cellular proliferation and differentiation (165, 166).

53
It has been proposed that the control of these processes is mediated by cytokines (167).
Consequently, the alteration in T cell subsets or T cell functions observed after
retrovirus infection in human peripheral blood cells or mouse spleen cells could be the
consequence of changes at the thymus level, including thymocyte cytokine production.
Histopathological studies of thymic glands from HIV -I-infected children revealed
involuted architecture, reduced size and weight, and fewer Hassal's corpuscles (168,
169). mV-l causes changes in thymic hormone and cytokine levels such as thymosin
lex and IL-6, which act on T cell differentiation (170, 171). Human fetal thymocyte cell
lines were infected with mv -1 in vitro and altered expression of T cell differentiation
markers (172). However, no any detailed information about cytokine production by
thymocytes in the progression of AIDS was reported. Therefore we examined the
changes of cytokine production (IL-2, IL-4, IL-6 and IFN-'Y) by in vitro ConA-stimulated
thymocytes to understand how retrovirus infection alters thymic cytokine secretion, and
thereby adversely affects thymocyte development and function. These studies in murine
AIDS would facilitate the understanding of immunopathagenesis of mv infection.
The human immunodeficiency virus (HIV) is a key causative agent of AIDS,
although malnutrition could contribute to the progression to AIDS. Profound weigh
loss, cachexia, multiple nutrient deficiencies and protein calorie malnutrition are
frequently nutritional disorders found in AIDS patients (198). They have the theoretical
potential to accelerate development of AIDS via immunosuppression secondary to
nutritional deficiency. Therefore, the malnourished state of the AIDS patients may have
precluded recovery from infectious events which earlier represented survivable episodes.

54
Gastrointestinal dysfunctions including diarrhea and malabsorption are also common
manifestations of the AIDS (199, 200). It has been suggested that HIV infection might
play pathogenic role in gastrointestinal cells. This current view of an HIV -induced
enteropathy is supported by two main kinds of data. On the one hand, in situ
hybridization studies have localized HIV infection in various types of epithelial cells of
the bowel mucosa (71, 72). On the other hand, HIV infection of gastrointestinal cell
lines has been documented in vitro (73-75). Such complications in AIDS contribute to
malnutrition with increased susceptibility to infection and malabsorption to further
compromise nutritional status.
Although the roles of vitamins and minerals in the clinical manifestation of HIV
infection has not been well defined (57), a growing number of studies have suggested
important links between vitamins or minerals and HIV infection. Bogend et al. found
that 12 % of their 30 patients at various stages of HIV disease has serum vitamin A
deficiency (63). In their study of AIDS patients, Malcolm et al. reported low vitamin
A levels in seven of 24 patients (29 %) (65). Bogden et al. found that 12 % of 30
patients, at varying stages of mv infection, had low plasma levels of vitamin E (63).
In another study, Passi et al. also noted deficient levels of plasma vitamin E in patients
with HIV (65). Zinc deficiency in HIV infection has been identified consistently. Falutz
et al. reported that serum zinc decreased progressively with advancing mv disease
among 150 patients, compared with 50 HIV-seronegative controls (201). Fordyce-Baum
et al., Malcolm et al., and Bogden et al., all found that marginal or clear zinc deficiency
in any where from 23% to virtually all of the patients tested (63-67). The prevalence of

55
copper deficiency is less clearly set up since there are only two available studies.
Fordyce-Baum et al. found marginal copper deficiency in 22 % of their patients (61). In
contrast, Bogden et al. noticed low levels in only 3% of patients (63). Thus preliminary
data support the clinical importance of vitamin A, E and zinc and copper deficiencies in
HIV infection, although their different extends of deficiency in mv infection have been
reported. There is little doubt that patients with HIV infection will be increasingly
compromised nutritionally as the disease progresses. Thus, two questions were addressed
in the present research. Since serum vitamin and mineral levels may not always be
sensitive or specific indicators of deficient or excess states, levels do not always reliably
reflect nutrient status of the body. Thus, the studies in the animal model are necessary
to define the nutritional status in the different organs during the progression of AIDS.
In addition, since some of the deficient states seen in HIV -infected patients may result
from the alcoholism, infections and drug use or other extraneous variables, which are
usually associated with AIDS patients and contribute malnutrition (77, 78), it is hard to
correlate the relationship between retrovirus infection and malnutrition in human subjects
as AIDS advances. Thus, the studies in the animal model may help to clarify the
relationshIp between undernutrition and retrovirus infection.
56
Materials and Methods
LP-BM5 murine leukemia virus infection Female mice, 4-6 months old, were assigned
to one of two groups. The first group of mice was injected once intraperitoneal with
0.10 ml of LP-BM5 inoculum which had an ecotropic titer of 4.5 10glO PFU/ml which
induced the disease with a time course of immune dysfunction as previously published
(11).
Preparation of peritoneal resident macrophages Peritoneal resident cells (PRC) were
obtained by washing the peritoneal cavity with 7.5 ml of PBS (0.01 M, pH 7.2) three
times after sacrifice under ether anesthesia. After washing PRC with cold RPMI-I640
containing 10% FBS (complete Medium, CM), the cell suspension in 5 ml (5 x 1()6
cells/ml) was added to FBS-coated petri dish (60x15 mm) and incubated for 2 hours at
37°C, 5% CO2 incubator. Non-adherent cells were removed by washing with cold CM
three times. Adherent cells were removed from petri dish with cell scraper. Then the
cell concentration was adjusted to Ixl()6/ml for cell culture. More than 95 % of adherent
cells had morphological characteristics macrophages, judged by a microscope using 2.0%
acetic acid as diluent (1:1). Cell viability was always more than 95% as determined by
trypan blue exclusion.
Preparation of Splenocytes and Thymocytes Spleens and thymi from mice receiving
ETOH or isocaloric control diets were gently teased with forceps in RPMI-I640 medium
(Sigma) containing 10 % FBS (Complete Medium, CM), producing a single cell
suspension of spleen cells. Red blood cells were lysed by the addition of a lysis buffer
(0.16 M ammonia chloride Tris buffer, pH 7.2) at 37° C for 2 minutes. Then the cells
57
were washed twice with CM. Cell concentration was counted and adjusted to 1x10⁷
cellslml. Splenocytes viability was always more than 95 % as determined by trypan blue
exclusion.
Preparation of T cells from Splenocytes. Spleens from mice were gently teased with
forceps in CM. Red blood cells in a single-cell suspension were lysed by the addition of
a lysis buffer (0.16 M ammonia chloride Tris Buffer, pH 7.2). Then the cells were
washed twice with cold CM. The cell concentration was adjusted to Ix 107 Iml in low
cytotoxicity medium. Purified rat anti-mouse Ia monoclonal was added into the cell
suspension (lx1061J£g antibody) at 4 °c for 1 hour. After removing supernatant, cell
pellet was re-suspended into low-cytotoxicity medium and added with rabbit complement
(1:12.5) at 37°C for 1 hour. Then the cell suspension was loaded on the Lymphocyte-M
gradient and centrifuged at 1,650 rpm and 20°C for 20 minutes. Viable cells were
collected with a pasteur pipet and washed twice with cold CM. Viability of purified cells
was more than 95 % as determined by trypan blue exclusion. More than 85 % of the
purified cells were Thyl,2+ T cells and less than 1 % of the purified cells were total of
IgM and Mac-l positive cells as determined by indirect immunofluorescence staining
using monoclonal antibodies (173).
Cytokine Standards and Antisera Rat anti-murine IL-2, IFN-'Y, IL-6 monoclonal
antibodies and standard recombinant murine IL-2, IFN-r and IL-6 were obtained from
Genzyme (Boston, MA). Rabbit anti-murine IL-2 polyclonal antibody was obtained from
Collaborative (Bedford, MA). Rat anti-murine IL-4,IL-5 and IL-10, biotin-rat anti-murine
IL-4, IL-5 and IL-lO monoclonal antibodies, and recombinant murine IL-4, IL-5 and IL-

58
10 standard were obtained from PharMingen (San Diego, CA). Goat anti-murine IL-6
polyc1onal antibody was obtained from R&D System (Minneapolis, MN). Rabbit anti
murine IFN--y serum was prepared in our lab.
Production of Cytokines 100 J.(.l of lxia' macrophages/ml, 5x10⁶ T cells/ml or Ix107
thymocytes were added into 96-well cell culture plate. Then 100 J.(.l of LPS (10 J.(.g/ml)
for macrophage culture and 100 J.(.l of ConA (10 J.(.g/ml) for T cell culture were added and
incubated in 37°C, 5% CO2 incubator. After 24 hours of incubation for IL-2, IL-4, IL-
6, IL-lO and TNF-a production, and 72 hours for IL-5 and IFN--y, cell culture
supernatants were collected for cytokine detection.
Preparation ofIgG Production Splenocytes (lx107/ml) from mice of the same experiment
group were individually cultured in triplicate on 96-well tissue culture plates (0.1
mllwell, Falcon) with CM. Then splenocytes were stimulated with LPS (Gibco, 5
J.(.g/ml) diluted in CM. After 120 hour incubation at 37°C, 5% CO2 incubator, the plates
were centrifuged for 10 minutes at 800 g, and supernatant fluids were collected and
stored at -70° C until detection. Triplicate cultures were set up for each individual
mouse.
ELISA for Cytokines The wells of 96-well microtiter plates were coated overnight at
4°C with 50 J.(.l of anti-cytokine rat or hamster monoclonal antibody specific for the
measured cytokines, diluted to 1-4 J.(.g/ml in 0.05 M bicarbonate buffer (PH 9.6). Plates
were washed one time with PBS (0.01 M, pH 7.2-7.4) containing 0.05% (v/v) Tween-20
(PBST). Then 100 J.(.1 of standard or sample cytokines diluted in culture medium were
added. Plates were incubated for two hours, and washed three times. 50 J.(.1 of diluted

59
anti-IL-2, TNF-a or IFN--y polyclonal serum (1: 100), or goat anti-IL-6 polyclonal, or
biotinylated rat anti-IL-4,5, 10 monoclonal detecting antibodies in PBS (1-4 ",g/ml) were
added into each well. Plates were incubated as above for 1.5 hours and washed four
times with PBST. Then SO ",I of diluted strepavidin-HRP (1:5000) for IL-4,S, 10, goat
anti-rabbit IgG-HRP (1:5000) for IL-2 and IFN--y or donkey anti-goat IgG-HRP (1:5000)
for IL-6 conjugates were added to each well. Plates were incubated as above for one
hour, and washed five times with PBST and once with PBS. Finally, 100 ",I of substrate
buffer (ABTS in 0.1 M citrate buffer, pH 4.2 containing 0.03% H20:z) were added to
each well, and the color was allowed to develop for 20-30 minutes at room temperature.
Optical density was determined at 405 nm. Sensitivity of the ELISAs for IL-2, IL-4, IL-
5, IL-6, IL-lO, IFN--yand TNF-a were determined to be 156pg, 156pg, 32Opg, 200pg,
2U, 78pg and lS6pg per ml, respectively. No cross-reactions between these measured
cytokines in the ELISA kits were observed.
ELISA for IgG. The wells of 96-well microtiter plates (Immulon,II) were coated
overnight at 4 C with 50 ",I of Goat anti-murine IgG gamma-chain (Sigma), diluted to
2 ",g/ml in 0.05 M bicarbonate buffer (PH 9.6). Plates were washed one time with PBS
(0.01 M, Ph 7.2-7.4) containing 0.05%( v/v) Tween-20 (PBST). Plates were washed
twice as above, and 50 ",I of standards and sample murine standard IgA and IgG (Sigma)
diluted in CM were added to plates. Plates were incubated as above for 1 hour, and
washed three times as above. 50 ",I of diluted biotinylated goat anti-murine IgG (2
",g/ml) in PBS were added and incubated at 37° C incubator for another hour. Then 50
",I of diluted strepavidin-HRP (1:5,000, Jackson, West Grove, PA) was added for another

60
hour incubation at 37° C. Finally, 100 #-,1 of substrate buffer of ABTS (Sigma, in citrate
buffer, O.lM, pH 4.2 containing 0.03% H20 2) were added to each well, and the plates
were allowed to develop for 20-30 minutes at room temperature. Optical density was
determined at 405 nm by Titertek Multiscan (Flow Lab, Mclean, VA). Sensitivity of
ELISAs for IgG were determined to be 40 pg/ml, respectively. No cross-reaction of
ELISA kit with IgA and IgM were observed (data not shown).
Mitogenesis of splenocytes and thymocytes Thymocytes(1x10⁷/ml) and splenocytes
(lx107) in 0.1 ml were cultured in 96-well flat-bottom cultured plates (Falcon) with
ConA ( #-,g/ml) in CM at 37° C , 5% CO2 for 20 hours for ConA-induced T Cell
proliferation. Then they were pulsed with 3H-thymidine ( 0.5 #-,Ci/well,New England
Nuclear, Boston, MA). After 4 hours, they were harvested by an a cell sample
harvester(Cambridge Technology, Cambridge, MA). Radioactivity was determined by
a liquid scintillation counter (Tri-Carb, 2200CA, Packand, Lagunahills, CA). Data are
presented as count per minute (cpm).
Measurement of Vitamin A and E. Tissue concentrations of total tocopherol and retinol
were determined by the flu oro metric method described by Dugan et al (202). Briefly,
about 0.1 g of tissues was homogenized in 5 ml water and 5 ml ethanol, and vitamin A
and E extracted with 5.0 ml n-hexane by shaking for 1 minutes and centrifugation at
3000 rpm for 5 minutes. The n-hexane layer was removed and measured at an emission
of 430 nm and an excitation of maximum of 365 nm for retinol measurement. Then,
0.5ml of 60% sulfuric acid added, the solution mixed thoroughly and the fluorescence
intensity for vitamin E determined in the hexane at an emission of 340 nm and an

61
excitation maxima of 295 nm using a fluorescence spectrophotometer (Hitachi F-2000,
Hitachi, Tokyo, Japan) and using alpha-tocopherol or all-trans retinol (Eastman
Chemical, Kingsport, TN) as a standard. All levels of vitamins were represented by
J.l.g/wet g tissue.
Serum Vitamin A and E. Serum vitamin A and E were measured by mixing 0.2 ml
of serum with 2 ml of ethanol, extracting with 4.0 ml n-hexane by shaking for 5 minutes
and centrifugation at 300 rpm for 5 minutes. The vitamin A and E levels in n-hexane
layers were be measured as indicated above. Serum vitamin levels were represented by
J.l.g/ml serum.
Measurement of Zinc and Copper. About 0.1 gram of tissues is dried at 56°C in a
oven for overnight. After cooling, 5 ml of 70% nitric acid is then added. After mixing
and predigestion in a 60°C water bath for an hour, the water bath was brought to
boiling. Five drops of 30% hydrogen peroxide were then added the sample. Before the
tubes were removed from the water bath, another drop of hydrogen peroxide was added.
The solution is either measured directly or diluted to the appropriate concentrations for
elemental analysis by flame atomic absorption (Hitachi, 180-70 Spectrophotometer) at
213.8 nm for zinc and at 324.8 nm for copper. The same nitric acid containing 30%
hydrogen peroxide was used for the standard and blank controls in the mineral analysis.
All levels of minerals were represented by J.l.g/ g dry tissue.
Statistics Two-tailed student t test was applied. p < 0.05 was considered
significant difference between two groups.

62
Results
IL-6 and TNF-O! Production by Peritoneal Macrophages From Fig. 2.1, secretion of
IL-6 and TNF-O! by LPS-stimulated peritoneal resident macrophages was significantly
enhanced from 2 and 4 weeks after infection, respectively, to 22 week post-infection
compared with control.
IL-2 and IFN-y Production by Th 1 Cells From Fig.2.2, release of IL-2 and IFN--y
by ConA-stimulated Thl cells was significantly inhibited from 4 week to 22 week post
infection.
IL-4. IL-5. IL-6 and IL-IO Production by Th2 Cells From Fig. 2.3, secretion of IL-6
and IL-I0 by ConA-stimulated Th2 cells was significantly enhanced from 4 week to 22
week post-infection compared with control, while release of IL-4 and IL-5 by ConA
stimulated Th2 cells was significantly enhanced at the 8-10 week and 4 week post
infection, respectively, but declines progressively thereafter.
Mitogenesis of Splenocytes. As shown in Table 2.1 and 2.2, the ConA- and LPS
induced splenocyte proliferation was significantly ( p < 0.05) reduced by retrovirus
infection during whole period of study (4-16 weeks post infection).
Production of IgG. As shown in Table 2.3, The IgA and IgG production by LPS
stimulated splenocytes was significantly (p < 0.05) enhanced by retrovirus infection
compared to controls from 4-weeks post infection to 16-weeks post infection.
Mitogenesis of Thymocytes As shown in Table 2.4, in vitro thymocyte proliferation
was significantly increased at 4 week post retrovirus infection compared with uninfected
control (p < 0.05). Thereafter the proliferation was significantly inhibited by retrovirus

63
infection at 8 and 12 week post-infection (p < 0.05). However, the proliferation was
no significant change by retrovirus infection at 16 week post-infection (p > 0.05).
Cytokine Production by Thymocytes As shown in Fig. 2.4, the release of IL-2
produced by in vitro ConA-stimulated thymocytes was significantly higher during the
initial weeks of retrovirus infection compared with uninfected control ( p < 0.05).
Thereafter in vitro production of IL-2 was significantly reduced by retrovirus infection
(p < 0.05). Then, level of IL-2 was significantly elevated again by retrovirus infection
after 11 week until 18 week post-infection (p < 0.05), while that of thymocytes from
uninfected mice was gradually decreased as age increased. As shown in Fig. 2.5,
secretion of JL-4 by thymocytes from retrovirus infected mice was significantly higher
than that by thymocytes from uninfected mice from 5 week to 18 week post-infection (p
< 0.05). There was a significantly decline in IL-4 production by thymocytes from
uninfected mice as age increased. As shown in Fig. 2.6, IL-6 secreted by thymocytes
was significantly inhibited by retrovirus infection compared with uninfected controls up
to 11 week post-infection ( p < 0.05), while IL-6 production by thymocytes from
uninfected mice had significantly declined as age increased (P < 0.05). However the
release of IL-6 was significantly enhanced by retrovirus infection after 11 week post
infection compared to continuing reduced production of IL-6 by controls ( p < 0.05).
As shown in Fig. 2.7, IFN--y production by thymocytes was significantly elevated by
retrovirus infection compared with uninfected controls through beginning 2 week post
infection (p < 0.05), and then secretion of IFN--y surged at 13 week post-infection.
Hepatic Levels of Nutrients As shown in Table 2.5, the levels of vitamin A, E and

64
copper in the liver in murine AIDS were significantly (p < 0.05) reduced compared to
uninfected mice. The level of zinc in the liver was not affected by retrovirus infection.
Intestinal Levels of Nutrients The Copper level in the small intestine was significantly
(p < 0.05) increased by retrovirus infection compared to controls, whereas the vitamin
A level was significantly (p < 0.05) reduced by the retrovirus infection. The zinc and
vitamin E level was not affected by retrovirus infection (Table 2.6).
Splenic Levels of Nutrients As shown in Table 2.7, the levels of vitamin A, E and zinc
in the spleen after development murine AIDS were significantly (p < 0.05) reduced
compared to controls, whereas the splenic level of copper was slightly increased by
retrovirus infection.
Thymic Levels of Nutrients The levels of vitamin A, E and copper in the thymus after
development of murine AIDS were significantly (p < 0.05) decreased by retrovirus
infection compared to controls, whereas thymic level of zinc was significantly elevated
by retrovirus infection (Table 2.8).
Serum Levels of Vitamins The levels of vitamin A and E in the serum in murine AIDS
were significantly reduced by retrovirus infection compared to controls (Table 2.9).
65
Discussion
Our results confirm and expand those of Gazzinelli et al (164) showing altered
cytokine expression caused by LP-BM5 murine retrovirus infections. We conclude that
lymphoid cell dysfunction modified cytokine production by mitogen-stimulated
immunocompetent cells which may be induced by a superantigen encoded by defective
genome in the LP-BM5 retrovirus mixture. We demonstrated, for the first time, that
retrovirus infection can cause undernutrition, reducing tissue levels of nutrients during
murine AIDS.
Imbalanced release of cytokines appears responsible for much of the
immunopathogenesis of MAIDS. Release of IL-6 and TNF-o: by LPS-stimulated
macrophages was significantly enhanced from 4 weeks after virus infection. Elevated
levels of plasma IL-6 and TNF-o: are also seen in HIV-infected human subjects (174, ,
175). Elevated levels of IL-6 may play an important role in the polyclonal B cell
activation and Immunoglobulin secretion, which are characteristically seen in both HIV
infection and LP-BM5 infection. This notion is supported by the elevated level of IgG
produced by splenocytes we obs,~rved. This increase of non-specific antibodies may
contribute to development of AIDS. Elevated level of TNF-o: may be involved lipid
metabolism: inducing hypertriglyceridemia and wasting in both human AIDS (176) and
murine AIDS (177).
CD4 + T cells can be divided into two major subsets on the basis of cytokine
expression. Thl cells produce IL-2, IFN--yand lymphotoxin, whereas Th2 cells produce
IL-4, IL-5, IL-6 and IL-I0 (178). The relevance of these patterns of cytokine secretion

66
and reciprocal regulation by Th clones also have been recently demonstrated (179). IL-
10 can inhibit Th1 differentiation and its cytokine production, and conversely IFN--y can
inhibit Th2 differentiation and its cytokine production. IL-4 induces ThO cells to
become Th2 cells producing Th2-related cytokines. The capability of T cells in spleen
to produce the Th1 cytokines, IL-2 and IFN--y, in response of ConA stimulation is
diminished. IFN--y activates macrophages, neutrophils and natural killer cells, and
stimulates IL-1 secretion by monocytes. IL-2 is a major factor in the T cell growth and
proliferation. Thus the decreased release of IL-2 and IFN--y appears responsible for the
immune defects observed in the progress of MAIDS, which may contribute to enhanced
susceptibility to pathogen infections. Increased production ofIL-10 during murine AIDS
can be a contributing factor to inhibition of Th1-type cells in MAIDS. Th2-type
responses would be dominated in the progression of murine AIDS due to decreased IFN
-y. Elevated production of Th2 cytokines, IL-4, IL-5 and IL-6 can efficiently stimulate
B cell growth and differentiation to immunoglobulin secretion , a central feature of
murine AIDS. Cellular immune dysfunction in monokine and cytokine production during
progression of murine AIDS has been shown to parallel the observation in HN infection.
The continuing elucidation of the mechanism of immunomodulation during murine AIDS
may help us to understand how infection with HIV induce these immune defects in
human subjects, perhaps via preferential activation of Th2 cells.
We demonstrated for the first time that murine retrovirus infection modified
production of cytokines by in vitro ConA-stimulated thymocytes. The mammalian
thymocytes can be subdivided into 4 major sUbpopulations based on expression of the

67
differentiation-related antigens CD4 and CDS. "Double-negative" (DN) CD4-CDS-
thymocytes (2-4% of total in the normal adult mouse) represent immature cells with the
capacity to give rise to the other subsets in irradiated host (ISO). CD4+S+ cells in the
thymic cortex account for the majority (SO-S5 %) of thymocytes and most of such
"double-positive" (DP) cells are destined to die in situ (1S1). The other two" single
positive" (SP) CD4-S+ and CD4+S- subsets (5-10%) in the thymic medulla represent
mature T cells seen in the peripheral tissue (1S1). SP subsets could be further divided
into CD3 + and CD3- subset. CD3 + cells resemble mature peripheral T cells in that they
are functionally immunocompetent, including responding to a variety of mitogen stimuli
and secreting cytokines, and originate from CD3-4-8+ and CD3-4 +S- immature T cells in
the thymus (ISO, lSI). Our previous report found murine retrovirus infection alters T
cell differentiation by reducing CD4 + CDS + cells. This population (SO-S5 % in normal
mice) dramatically dropped to only 30% and other populations, CD4 +S- and CD4-S+ (SP
subsets) were elevated respectively from controls 1.99% and 7.67% to 33.9S% and
15.5% of thymocytes in retrovirus infected mice at 16 week post-infection (lS2). The
continuing analysis of CD3 marker of two SP subsets by fluorescence cytometry in our
lab indicated that the percentage of CD3+CD4 +CDS- subsets in the thymus from
retrovirus infected mice for 16 weeks dramatically dropped from control 74% to 7.9%
of CD4+CDS- subset, while percentage of CD3+CD4-CDS+ thymocytes of CD4-CDS+
subsets did not change during the murine AIDS (2.3% in murine AIDS vs 2.2% in
(.::ontrol mice, Lopez et al., unpublished data). Therefore the increased SP thymocytes
by the retrovirus infection were immature CD3- SP T cells, not mature CD3 + SP T cells.

68
Since we did not study the kinetics of thymocyte subsets during the progression of
murine AIDS, we speculated that the increased or decreased thymocytes proliferation and
thymic cytokine release induced by retrovirus infection might partly reflect the fluctuation
of populations of CD3 + mature T cells in the medulla and CD3- immature T cells in the
cortex of thymus. The changes in thymocytes differentiation may explain the dysfunction
of T cells seen in AIDS.
How could thymocyte differentiation be altered during the progression of murine
AIDS? One possibility appears that activated peripheral T cells by retrovirus infection
re-enter to the adult thymus, thereby they secret some cytokines and adversely affect
regulation or differentiation of T maturation in the thymus. Agus et al found that
homing of mature T cells to the thymus of adult mice was substantial and exclusively
restricted to Con A-activated T cells. However, mature resting T cells have virtually no
capacity to migrate to the thymus (183). The physiological significance of "back
migration II of activated T cells into the thymus may be that presentation of retrovirus
antigens in the thymus may trigger self-tolerance induction, causing the loss of immune
response to retrovirus antigen. Alternatively, release of cytokines by retrovirus-activated
mature T cells may impair T cell differentiation, causing secondary acquired T Cell
deficiency. This notion that circulating T cells activated by retrovirus migrate into the
adult thymus is in accord with the some reported (184-187). This speculation is also
supported by the recent observation in our lab that mature mesenteric lymph node
lymphocytes from mice infected with retrovirus LP-BM5 migrated back to thymus of
normal mice by adoptive transfer assay ( Lopez et al, unpublished data).
69
Production and action of cytokines in the human and mouse thymus have been
associated with an essential role in T cell development (167). In mice, expressing a
human IL-2Ra chain transgene, thymocytes express a nonfunctional murine IL-2RB
human IL-2Ra heterodimer resulting in the accumulation of T cell precursors in the
thymus and periphery (188). Also, anti-IL-2R a chain antibodies abrogate T cell
development which can be reversed by addition of IL-2 (189). Addition of IL-2 to intact
lobes immersed in culture medium promotes the selective outgrowth of T cells expression
'YO TCR (190). Consequently, the dysregulation of IL-2 release by retrovirus infection
we observed may be responsible for the changes in T cell subpopulations and
differentiation in the thymus during the progression to murine AIDS. The addition of
IL-4 blocks T cell development by reducing the number of DP thymocytes (191). The
constitutive production of IL-4 in IL-4 transgenic mice also result in the inhibition of DP
thymocytes and mature peripheral T cell development (192, 193). Consequently we
conclude that consistently increased level of IL-4 induced by retrovirus infection in the
thymus may contribute the impairment of T cell development in the murine or human
AIDS, thereby causing secondary acquired T cell deficiency. IL-6 has been shown to
promote the differentiation of Thy-l +IL-2R + donor thymocytes after intrathymic transfer
into irradiated hosts (194). Thus, the dysregulation of IL-6 secretion induced by
retrovirus infection at the beginning of infection may also contribute the abrogation of
T cell development in the thymus. The physiological significance of increased level of
IFN-'Y by thymocytes induced by retrovirus infection may be involved in the up
regulation of MHC class I and II expression in the surface of thymic stromal cells, which

70
playa crucial roles in the positive and negative selection during T cell education (Le.
recognization 'self and non-self) in the thymus. Thus, the dysregulation of IFN--y
release by thymocytes may reflect the failure of T cell education, leading to loss of
tolerance to self antigens or reaction to non-self antigens. The source of IFN--y in vivo
has been suggested to be mature CD4 + T cells and NK cells in the peripheral tissues
(195). The decreased number of CD3+CD4+CDS- T subset or no changed CD3+CD4-
CDS+ T subset in the thymus during the progression of murine AIDS can not account
for consistently increased secretion of IFN--y by thymocytes. Thus, we measured thymic
NK cell activity by fluorescence release assay (192). Surprisingly, NK cells activity was
increased after 12 week retrovirus infection (data not shown), because NK cells are
present at a very low frequency ( < 0.1 % of thymocytes) in both the human and the
mouse thymus (196, 197). This result suggested that the impairment of T cell
differentiation and changes of T subpopulations in the thymus during the progression of
murine AIDS could be caused by back migration of other peripheral lymphoid cells (e.g.
NK cells) as well as mature peripheral T cells. The continuing elucidation of the
physiological roles of cytokines in the T cell maturation and the mechanism of these
changes induced by retrovirus infection may facilitate the understanding the
immunopathogenic mechanism of HIV infection on the thymus in human AIDS.
Vitamin A deficiency depresses lymphocyte activation by mitogen in rats (122),
and leads to a depletion of mature T -cells from the spleen. Repletion with retinoic acid
results in a rapid increase in the peripheral lymphocyte count (123). Vitamin A
deficiency may decrease antigen binding due to alterations in surface membrane

71
glycoproteins (203). In large populations, vitamin A deficiency has been found to be
associated with an increased incidence of a variety of cancers, and severity of infection
(203). Similar depression of the general immune functions associated with vitamin E
deficiencies have also been observed in both animals and humans. In rats, depressed
antibody-dependent cell mediated cytotoxicity (204), decreased lymphocytes blastogenesis
in response to mitogens (205), and depressed NK cell mediated cytotoxicity (126) have
been reported in vitamin deficient states. In guinea pigs, dietary vitamin E deficiency
depressed spleen T-and B-lymphocyte immune responses to mitogens to about 50% of
vitamin E adequate animals (133). The macrophages of these vitamin E deficient guinea
pigs also lacked accessory cell functions and acted only as suppressor cells (206). In
humans, a strong correlation of decreased serum levels of vitamin E and decreased
number and metabolic functions of T-lymphocytes have been shown in athletes (207).
Therefore, the deficiencies of vitamin A and vitamin E in the tissues including immune
organs should contribute immune dysfunctions initiated by retrovirus infection in murine
AIDS, e.g. depressed proliferation of T and B cells in the spleen and mesenteric lymph
nodes, impaired cytotoxicity of splenic NK cell, and dysregulated cytokine production
by lymphocytes from spleen and mesenteric lymph node observed in murine AIDS by us
(102, 208, 209).
Zinc has an important role in immunocompetence and exerts a crucial regulatory
effect on specific immune functions. Zinc deficiency results in the adverse effects on the
immune system of a depression of cell-mediated immunity with decreased T -cells and B
cells in lymphoid tissue, decreased T-helper cell number and activity, an inverted ratio

72
of T-helper to T-suppressor cells, a depressed response of T-cell to tumor cells, delayed
cutaneous hypersensitivity, decreased lymphokine production, decreased production of
cytotoxic T cells, reduced antibody response requiring T-helper cells, decreased natural
killer cells activity, depressed IgM, and depression of thymic hormones (123, 210). Zinc
deficiency may be particularly important because of indications that zinc may play an
important role in immune function, particularly in T-cell response, in mv infection.
Fallutz et al. reported that serum zinc concentration correlated with the
lymphoproliferative responses of mononuclear cells to PHA stimulation and that zinc
supplementation augmented this response to PHA in HIV-infected patients (201). In the
rabbit, both epithelial and stromal herps simplex keratitsare more severe when zinc is
deficient (129). A dose of trypanosoma cruzi, which would normally be sublethal,
causes the death of 80% of zinc-deficient mice who also exhibit a 50-fold higher
parasitemia than pair-fed. controls (131). In such zinc-deficient rats, the expulsion of
trichinella spiralis (130) and Strongyloides ratti is impaired (130, 211). Findings
indicating an impaired host defense system in copper deficiency have been reported in
humans and animals. Children with the Menkes syndrome, a rare congenital disease
resulting in copper deficiency, frequently die from pneumonia (212). Copper deficiency
in humans is accompanied by bacterial infections, diarrhea, and bronchopneumonia (213-
216). Bactericidal activity by neutrophils is decreased on copper-deficient cattle,ewes,
and lambs (217, 218). In rat, increased suscep.tibility to Salmonella typhimurium in
copper deficiency was caused by decreased macrophage activity. Reduced numbers of
splenic antibody-producing cells and T cells, reduced proliferation of T and B cells,
73
reduced responsiveness and stimulator activity of splenic T cells in one-way mixed
lymphocyte reaction (219-224), and impaired cell-mediated immunity have been observed
in copper deficient mice (221). Therefore, nutrient deficiencies in AIDS could further
predispose HIV -infected patients to more frequent or severe infections. Thus, the severe
malnutrition seen in patients with AIDS may set up a vicious cycle in which the
underlying immunological deficit related to HIV infection is exacerbated by the immune
dysfunction associated with malnutrition. This finding also supports the notion that the
malnourished state of AIDS may aggravate the immune dysfunctions initiated by
retrovirus infection, e.g. depressed proliferation of T and B cells in the spleen and
mesenteric lymph node, impaired cytotoxicity of splenic NK cell, and dysregulated
cytokine production by lymphocytes from spleen and mesenteric lymph node observed
in murine AIDS by us (102, 208, 209). These evidence concomitantly explain the loss
of host resistance to the tumor and opportunistic infections observed in murine AIDS by
us (225-227). It is not clear why zinc level in the thymus and level of copper in the small
intestine were elevated by retrovirus infection during murine AIDS. They may reflect
another kind of pathological symptom of AIDS as these nutrient deficiencies in other
tissues, possible originating from an abnormal pathway of their absorption into the body.
In summary, results in a murine model of AIDS induced by LP-BM5 murine
leukemia retrovirus show a undernutrition after development of AIDS, possible due to
the retrovirus infection causing significant gastrointestinal damage, thereby inducing
malabsorption. Nutritional deficiencies could facilitate the progression of the disease
initiated by retrovirus infection, and suppress immune responses, and speed loss of

74
resistance to the tumors and opportunistic infections. Obviously the mechanism by which
retrovirus infection ca.uses malnutrition should be further elucidated, which would
facilitate the understanding of HIV -induced enteropathy in AIDS individuals. The
alteration of immune response, cytokine productions, and the enhanced susceptibility to
opportunistic infections during the progression of LP-BM5 MuLV infection has been
shown in parallel with that of HIV-infected patients (195). Therefore, to continue
elucidating of the mechanism of immunomodulation during LP-BM5 MuLV infection
should help us to understand HIV -induced immune dysfunction in humans.

75
-e. Control
10 -E 8 -Cl 6 c -c 4 I
U. Z 2 I-
0 0 2 4 ' 10 16 22
35
::::- 28
/~ E -- 21 ~ Cl C -to 14 ~
I
~
7
0 0 2 4 10 16 22
Post-Infection (weeks)
Fig. 2.1 IL-6 and TNF-cx Production by Peritoneal Macrophages. Every sample was determined in triplicate. The values are Mean + SD of 6-8 mice. Cytokines were secreted by I x HP macrophages in 0.2 ml volume.

4
E 3 -en S 2 C\I
I
....I
_ 2
E -C)
c: -<IS E 1 E ('(J OJ •
Z u.
-e. Centrel -0- LP.BMS
o 2 4 6 B 10 16 22
0---------__ _ o 2 4 6 B 1 0 16 22
Post-Infection (Weeks)
76
Fig. 2.2 IL-2 and IFN--y Production by Splenic T cells. Every sample was determined in triplicate. The values are Mean + SD of 6-8 mice. Cytokines were secreted by 1 x 10⁶ T cells in 0.2 ml volume.

77
-e. Control -0. lP.BM5
5
E 4 ~O - 3 Cl
c: -0I;f' 2 , ~ 1
0 0 2 4 6 8 10 16 22
8
:::: 6 E -C) c: 4 -U')
I
...J 2
a a 2 4 6 8 10 16 22
Post-Infection (Weeks)
Fig. 2.3 IL-4 and IL-5 Production by Splenic T cells. Every sample was determined in triplicate. The values are Mean + SD of 6-8 mice. Cytokines were secreted by 1 x 10⁶ T cells in 0.2 ml volume.

78
.. -- Control _0_ LP.8M5
21
- c=/ E 14 -C)
c:: -<0 7 I
-!
0 0 2 4 6 8 10 16 22
320
Q - 240 E -:::J - 160 0 ,..
I
~ 80 ~- ----- -'-...... a
0 2 4 6 8 10 16
Post-Infection (\Veeks)
Fig. 2.4 IL-6 and IL-lO Production by Splenic T cells. Every sample was determined in triplicate. The values are Mean + SD of 6-8 mIce. Cytokines were secreted by 1 x 10⁶ T cells in 0.2 ml volume.

79
-e. Control -0_ LP.8MS
1.00
-E
0.75 -en ..s 0.50
C\I I
~ 0.25
0.00 0
0.50 2 5 7 9 11 13 15 18 20
::::- 0.40
E - 0.30 C)
C -~ 0.20
I
-1 0.10
0.00 a 2 5 7 9 11 13 15 1 B 20
Post-I nfection (Weeks)
Fig. 2.5 IL-2 and IL-4 Production by thymocytes. Every sample was determined in triplicate. The values are Mean + SD of 6-8 mice. Cytokines were secreted by I x las thymocytes in 0.2 ml volume.

80
-.- Control _0_ LP.8M5
2
0 • 0 2 5 7 9
9 11 13 15 18 20
::::-e 6 -CD C -l-
I
Z :3 U.
0- 0--0
0 0 2 5 7 9 11 13 15 18 20
Post·lnfection (Weeks)
Fig. 2.6 IL-6 and IFN--y Production by thymocytes. Every sample was determined in triplicate. The values are Mean + SD of 6-8 mice. Cytokines were secreted by 1 x 1<f thymocytes in 0.2 ml volume.
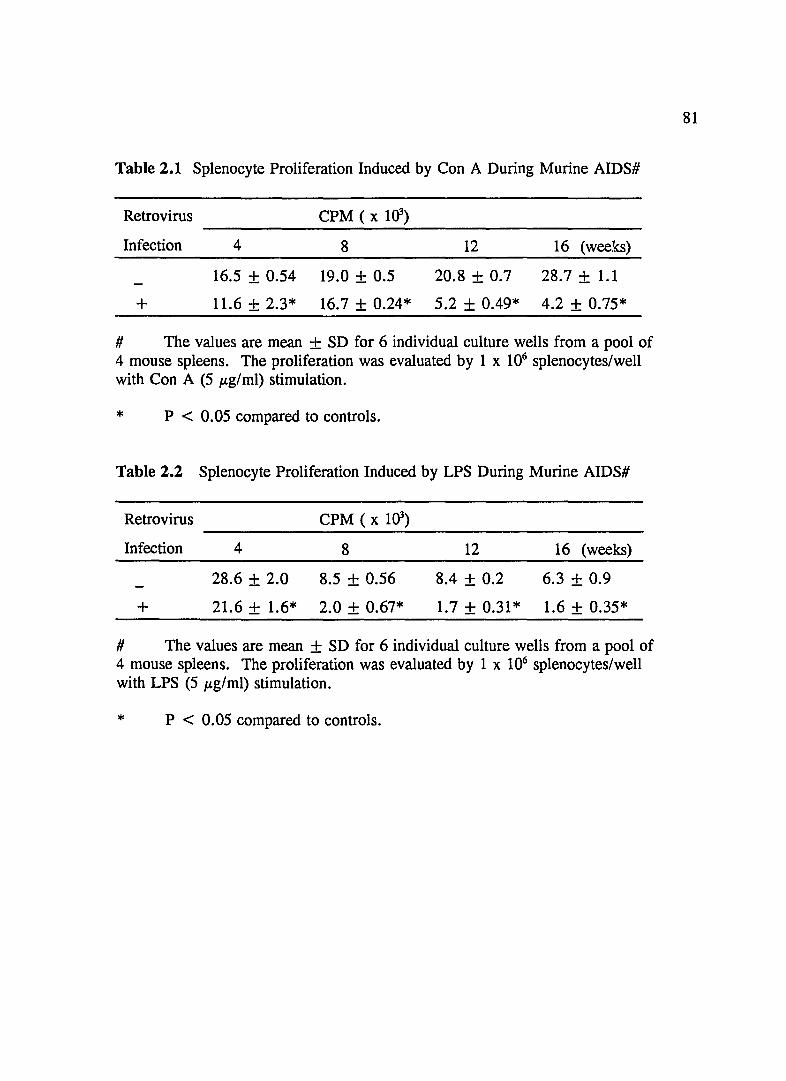
Table 2.1 Splenocyte Proliferation Induced by Con A During Murine AIDS#
Retrovirus CPM ( x 1()3)
Infection 4 8 12
16.5 ± 0.54 19.0 + 0.5 20.8 ± 0.7 28.7 + 1.1
+ 11.6 ± 2.3* 16.7 ± 0.24* 5.2 ± 0.49* 4.2 ± 0.75*
# The values are mean + SD for 6 individual culture wells from a pool of 4 mouse spleens. The proliferation was evaluated by 1 x 10⁶ splenocytes/well with Con A (5 J.tg/ml) stimulation.
* P < 0.05 compared to controls.
Table 2.2 Splenocyte Proliferation Induced by LPS During Murine AIDS#
Retrovirus CPM ( x 1()3)
Infection 4 8 12 16 (weeks)
28.6 + 2.0 8.5 + 0.56 8.4 ± 0.2 6.3 + 0.9
+ 21.6 + 1.6* 2.0 + 0.67* 1.7 ± 0.31 * 1.6 + 0.35*
# The values are mean + SD for 6 individual culture wells from a pool of 4 mouse spleens. The proliferation was evaluated by 1 x 10⁶ splenocytes/well with LPS (5 J.tg/ml) stimulation.
* P < 0.05 compared to controls.
81

Table 2.3 IgG Production During Murine AIDS#
Retrovirus IgG (ng/ml)
Infection 4 8 12 16 (weeks)
3.1 + 0.15 5.5 + 0.4 7.6 + 0.45 8.0 + 0.58
+ 10.0 + 1.2* 23.5 + 1.5* 30.0 + 2.9* 75.9 + 9.6*
# The values are mean + SD for 6 individual culture wells from a pool of 4 mouse spleens. The content of IgG was secreted by 1 x 1()6 splenocytes/well with LPS stimulations (5 I-'g/ml) stimulation.
* P < 0.05 compared to controls.
Table 2.4 Thymocyte Proliferation During Murine AIDS#
Retrovirus CPM (x 103)
Infection 4 8 12 16 (weeks)
7.66 + 1.06 10.63 + 2.05 11.63 + 2.59 9.44 + 2.83
+ 9.62 + 0.96* 7.95 + 0.32* 5.04 + 1.48* 11.23 + 1.48
# The values are mean ± SD for 6 individual culture wells from a pool of 4 mouse thymuses. The proliferation was evaluated by 1 x 1()6 thymocytes/well with Con A (5 I-'g/ml) stimulation.
* P < 0.05 compared to controls.
82

Table 2.5 Hepatic Levels of Nutrients During Murine AIDS*
Groups Nutrients (p,gig liver)
a-retinol a-tocopherol zinc copper
Control 450.0+60.1 67.3±8.5 86.4+ 10.1 15.9+ 1.4
Murine AIDS 150.0±39.0@ 43.3±4.0@ 89.7±11.8 12.8±1.9@ * Values are mean + SD for 8-10 mice. @ p < 0.05.
Table 2.6 Intestinal Levels of Nutrients During Murine AIDS*
Groups Nutrients (p,gig intestine)
a-retinol a-tocopherol zinc
Uninfected 57.1 +2.4 145.2+30.0 53.3+ 15.0
Murine AIDS 46.8+6.7@ 154.8+46.7 50.3+15.8 * Values are mean + SD for 8-10 mlce. @ p < 0.05.
Table 2.7 Splenic Levels of Nutrients During Murine AIDS*
Groups Nutrients (p,gig spleen)
a-retinol a-tocopherol zinc
Uninfected 23.7+3.2 396.6+37.6 13.9+1.4
copper
6.3+0.4
8.5+0.2@
copper
7.38+1.4
Murine AIDS 7.4±1.9@ 85.8±33.3@ 7.17±1.2@ 9.13±0.6@ * Values are mean + SD for 8-10 mlce. @ p < 0.05.
83
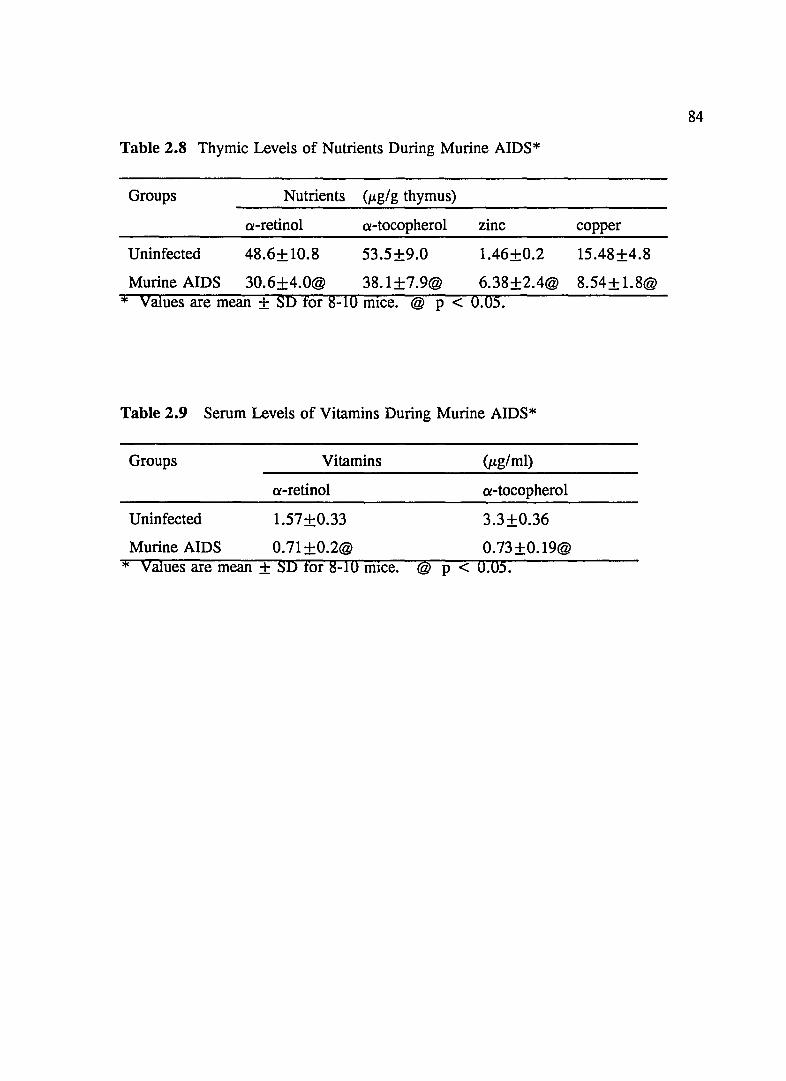
Table 2.8 Thymic Levels of Nutrients During Murine AIDS*
Groups Nutrients (p.g/g thymus)
a-retinol a-tocopherol zinc copper
Uninfected 48.6+ 10.8 53.5±9.0 1.46+0.2 15.48+4.8
Murine AIDS 30.6±4.0@ 38.1±7.9@ 6.38±2.4@ 8.54± 1.8@ * Values are mean + SD for 8-10 mIce. @ p < 0.05.
Table 2.9 Serum Levels of Vitamins During Murine AIDS*
Groups Vitamins
a-retinol
Uninfected 1.57+0.33
Murine AIDS 0.71 +0.2@ * Values are mean + SD for 8-10 mIce.
(JLg/ml)
a-tocopherol
3.3+0.36
0.73+0.19@ @ p < 0.05.
84

CHAPTER 3: ALCOHOL CONSUMPTION SUPPRESSES
CYTOKINE PRODUCTION AND IMMUNE RESPONSE IN C57BL/6 MICE
Abstract
85
In the present study, effects of chronic dietary ethanol (EtOH) on cytokine
production by splenocytes and thymocytes, splenocyte and thymocyte proliferation
induced by mitogens, splenic NK cell activity and antibody production (IgA and IgG)
were examined. C57BL\6 mice were fed 5% EtOH v/v in the Lieber-DeCarli liquid diet
for 11 weeks. Release of interleukin-2 (IL), IL-5, IL-6, IL-lO and Interferon-gamma
(IFN) produced by ConA-stimulated splenocytes was significantly decreased, while
secretion of IL-4 was slightly decreased by chronic dietary EtOH compared to controls.
Production of TNF-a and IL-6 by LPS-stimulated splenocytes was significantly and
slightly increased by EtOH compared with controls, respectively. Splenocyte and
thymocyte proliferation induced by ConA was significantly inhibited by EtOH, while
splenocyte proliferation induced by LPS was not affected. NK cell activity was
significantly inhibited by EtOH compared with controls. The production of IgA and IgG
by splenocytes were also significantly decreased by EtOH compared with controls. The
levels of IL-2, IL-4 and IL-6 produced by ConA-stimulated thymocytes were significantly
reduced by dietary EtOH compared with control, while production of IFN-,), by
thymocytes was not affected. Our results suggest that chronic dietary EtOH alters the
cytokine release, thereby impairing immune response and T cell maturation, which
increase host susceptibility to infection.

86
Introduction
Prolonged consumption of ethanol (EtOH) results in alterations of host defense
mechanisms manifested ultimately by increasing susceptibility to infectious agents (84).
The deleterious effects of EtOH on the ability to generate immune responses may play
a crucial role in this increased susceptibility to infection. In experimental animals and
humans EtOH has an inhibitory effect on many aspects of the immune response (85).
A loss of number of circulating leukocytes has been associated with EtOH use (86, 87)
with detrimental effects on humoral immune response, including antibody production
(88). It also suppressed aspects of cell-mediated immunity such as delayed-type
hypersensitivity reactions (86, 88) and lymphocyte proliferative response to mitogens
(89). EtOH administration to experimental animals has a profound effect on peripheral
lymphoid organs as measured by a decrease number of thymocytes and splenocytes as
well as in weighs of the spleen and thymus (90-92, 228, 299). Mice fed EtOH for short
periods of time have shown both normal and decreased NK cell activity (97, 98, 230).
Antibody dependent cellular cytotoxicity (99), lymphocytes proliferation (100), and B
lymphocyte functions (100, 101) are also impaired by dietary EtOH. However little is
known about the immunomodulatory mechanisms that cause these various immune
changes, especially EtOH-dysregulated cytokine production (231).
Pro-thymocytes leave the bone marrow and arrive at the thymus where they find
the appropriate environment that let them complete their differentiation to become
functional T cells. Thus, the thymus provides a unique environment for the development
of T cells, supporting both precursor cell proliferation and differentiation. Production
87
and action of cytokines in the human and mouse thymus have been associated with an
essential role in T cell development. To our best knowledge, there is no any papr~rs to
report the effects of chronic dietary EtOH on cytokine release by thymocytes.
Interference of EtOH with alterations of immune mechanisms may be one of the
most important factors that predispose alcohol abusers to an increased risk of infections.
Any perturbation in tightly controlled cytokine regulated system can result in immune
alterations modifying host resistance to infectious disease and cancer. We have therefore
designated this study to investigate the chronic effects of dietary EtOH on the production
of major regulatory cytokines (interleukin-2 (IL), IL-4, IL-5, IL-6, IL-lO, tumor necrosis
factor-ex (TNF) and interferon-gamma [IFN-'Y)] by splenocytes and cytokines (IL-2, IL-4,
IL-6 and IFN-'Y by thymocytes, and some immune functions (splenocyte and thymocyte
proliferation, splenic NK cell activity, IgG and IgA production).
88
Materials and Methods
Animals and EtOH Diet Female C57BL\6 mice, 3 to 5 weeks old, were obtained
from the Charles River Laboratories Inc. (Wilmington, DE). The mice were housed in
transparent plastic cages with stainless steel wire lids. Mice were housed to 4 mice a
cage. The housing facility was maintained at 20 to 22° C and 60 to 80% relative
humidity and the animals were exposed to a 12: 12 hr light-dark cycle. Water and
mouse chow (Texland, Madison, WI) were provided ad libitum. After 3 week housing
in the animal facility in the Arizona Health Sciences Center, mice were randomly
assigned to one of the following two treatments: control and EtOH (5% v/v, Lieber
DeCarli liquid diet, #710260, Dyetes, Bethlehem, PA). All diets were made isocaloric
by substituting 26% of the total calories with ethanol for the ethanol diet and dextrose
for the control diet. In previous study in our lab, we have found that higher dietary
EtOH (e.g. more than 6% v/v) significantly increased mortality of mice, and lower
dietary EtOH (e.g. less than 4% v/v) did not cause significant change on immune
functions. Mice were fed the respective diets for 11 weeks. Pair-fed study was
performed in our lab, and no difference between pair-fed group and EtOH-fed ad-lib
group was observed in the weight of thymus and spleen, and some immunoparameters
and cytokine secretion (IL-2, IFN-'Y and TNF-a) (232). Thus, we did not set up another
group for pair-fed group in this study.
Standard Cytokines and their Antibodies See Materials and Methods in Ch. 2.
Preparation of Splenocytes and Thymocytes See Materials and Methods in Ch. 2.
Preparation of Cytokine Production See Materials and Methods in Ch. 2.

89
Preparation of IgA and IgG Production See Materials and Methods in Ch. 2.
Natural Killer (NK) Cell Activity See Materials and Methods in Ch. 2.
ELISA For Cytokines See Materials and Methods in Ch. 2.
ELISA for IgA and IgG See Materials and Methods in Ch. 2.
Mitogenesis of Splenocytes and Thymocytes See Materials and Methods in Ch. 2.
Statistics Data are presented as the mean + SD for each group. Two tail t-student
test was applied. p < 0.05 was considered significant difference between two groups.
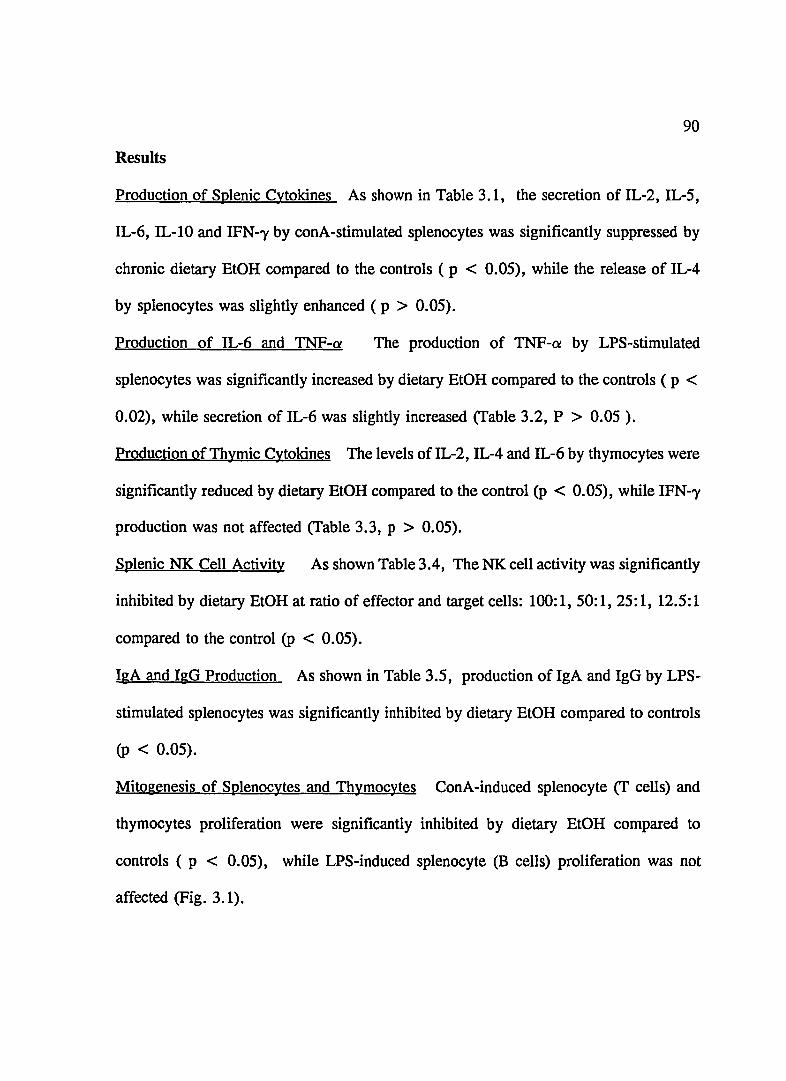
90
Results
Production of Splenic Cytokines As shown in Table 3.1, the secretion of IL-2, IL-5,
IL-6, IL-10 and IFN--y by conA-stimulated splenocytes was significantly suppressed by
chronic dietary EtOH compared to the controls (p < 0.05), while the release of IL-4
by splenocytes was slightly enhanced ( p > 0.05).
Production of IL-6 and TNF-O! The production of TNF-O! by LPS-stimulated
splenocytes was significantly increased by dietary EtOH compared to the controls (p <
0.02), while secretion of IL-6 was slightly increased (Table 3.2, P > 0.05 ).
Production of Thymic Cytokines The levels ofIL-2, IL-4 and IL-6 by thymocytes were
significantly reduced by dietary EtOH compared to the control (p < 0.05), while IFN--y
production was not affected (Table 3.3, p > 0.05).
Splenic NK Cell Activity As shown Table 3.4, The NK cell activity was significantly
inhibited by dietary EtOH at ratio of effector and target cells: 100: 1, 50: 1, 25: 1, 12.5: 1
compared to the control (p < 0.05).
IgA and IgG Production As shown in Table 3.5, production of IgA and IgG by LPS
stimulated splenocytes was significantly inhibited by dietary EtOH compared to controls
(p < 0.05).
Mitogenesis of Splenocytes and Thymocytes Con A-induced splenocyte (T cells) and
thymocytes proliferation were significantly inhibited by dietary EtOH compared to
controls (p < 0.05), while LPS-induced splenocyte (B cells) proliferation was not
affected (Fig. 3.1).
91
Discussion
Medical complications related to the ingestion of large amounts of alcoholic
beverages are a major health problem. The emphasis of this study was to evaluate if
EtOH consumption could impair cytokine secretion, which is a critical factor in immune
modulation (233). Our data demonstrated that chronic dietary EtOH had a general
suppressive effect on in vitro cytokine production by splenocytes and thymocytes. This
could lead to immune dysfunction, favoring pathogenic or opportunistic infection as seen
in the chronic alcohol user (82, 84, 195).
Several mechanisms have been suggested for immunomodulatory effect of EtOH
(233a, 234). Some immunological parameters are directly influenced by EtOH
interacting with cell membranes while others are changed through intervention by
hormonal changes caused by central nervous system effects, nutritional modulation or
physiological modification by EtOH, and alcoholic liver diseases (235, 236). Model of
murine EtOH-consumption used Lieber-DeCarli liquid diet. It is supplemented with
nutrients largely, minimizing the interference of alcoholic liver diseases and EtOH
induced malnutrition. Thus, the suppression mechanism of dietary EtOH on cytokine
production is partly caused by a direct effects of EtOH or its metabolites' effects.
Although it is not an accurate picture of changes associated with the totality of dietary
EtOH effects in human alcoholism, it hopefully will aid in the definition of
immunomodulatory role of chronic dietary EtOH on immune response. Our in vitro data
indicated that EtOH at physiological concentrations (1 %, 0.2%, 0.04%, v/v in
medium)directly suppress cytokine production in a concentration-dependent manner

92
(Wang et al. in manuscript). We also performed experiments to test for the effects of
BtOH before or after mitogen (ConA) stimulation in order to understand the possible
mechanism of BtOH direct effects on cytokine production. First, we exposed BtOH to
splenocytes for 4 hours, then washed this BtOH off the splenocytes with CM. ConA was
added and plates were allowed to incubate for 24 hours in order to induce cytokine
production. No suppressive effect of BtOH on these cytokines was observed (Wang et
al. in manuscript). Alternatively, first Con A is added for 4 hour stimulation, and then
ConA was washed off from splenocytes. BtOH was then added into the culture plates
for another 24 hour incubation for the production of cytokine production. The results
showed a kind of the suppression of IL-2, IL-4 and IL-6 production in a concentration
dependent manner (Wang et al. in manuscript). Taken together, we speculated that
suppression of cytokine secretion directly induced by BtOH was perhaps caused by
impairment of signal transduction and inhibition of expression of mRNA and translation
of cytokines. Resting cells were not affected by BtOH exposure before mitogen activates
them. Since BtOH could directly interfere with cytokine producing cells by altering
signal transduction and membrane fluidity (237, 238), we speculated that chronic dietary
BtOH may dysregulate cytokine production via perturbing signal transduction when
immunocompetent cells are activated. In addition, Chronic BtOH consumption can
decrease the percentage of T cells and macrophages in the spleen (95), explaining part
of the reduction in splenocyte cytokine production.
In the immune system, IL-2 is a pivotal cytokine in the growth and differentiation
of T and B cells and activation of natural killer (NK) cells and lymphokine-activated

93
killer cells (231). IL-2 also can act as a growth and differentiation factor for B cells and
can activate macrophages (23). IL-4 was initially described as a costimulator of
proliferation of B cells treated with anti-IgM antibody. IL-4 has since been shown to
playa critical role in immunoglobulin class switching. IL-4 also acts as a growth factor
for T cells and may also influence T cells by inducing expression of high affinity IL-2
receptor and the production of IL-2. In addition, IL-4 has been shown to induce
macrophage to express MHC class and FcR, and activate them to kill tumor cells (239-
241). IL-5 is a B cell growth factor because of its ability to stimulate proliferation and
antibody production by B cells. IL-5 increase the amount of IgA secreted by murine
splenic B cells (242, 243). IL-6 is a major inducer of terminal differentiation of B cells
into plasma cells. In relation to T cells, IL-6 has been shown to play an important role
in the T response to alloantigen and development of effector T cytotoxicity cells (244).
IFN-'Y has mUltiple distinct biological activity including anti-viral activity, activating
phagocytosis of macrophages and neutrophil cells, cytotoxicity of NK cells, augmenting
the development of Thl (T helper) cells and inhibits differentiation of Th2 cells and
production of Th2 cytokines (245). IL-IO inhibits Thl differentiation of Thl cells and
production of Th 1 cytokines via indirect action of IL-I 0 on a subpopulation of accessary
cells (195). TNF-a can not only stimulate IL-I and IL-6 secretion by macrophages, but
also induces IL-2 receptor expression and T cell proliferation (246, 237). This study
confirm and expand the understanding of the substantial immune dysfunction caused by
dietary EtOH. The suppression of T cell proliferation by chronic dietary EtOH we
observed confirmed the reports (89, 91, 248). It could be due to the decreased level of

94
IL-2 induced by dietary EtOH we observed. The decreased production of IgA and IgG
by LPS-stimulated splenocytes by chronic dietary EtOH we observed is consistent with
inhibition of B cell antibody response to T-cell dependent antigenic stimulation by
dietary EtOH (248). That could be caused by decreased levels of IL-5 and IL-6 induced
by EtOH observed here. However no effect of dietary EtOH on LPS-stimulated B cell
proliferation was observed, which is consistent with previous finding that dietary EtOH
has no effect on B cell response to T -independent antigens (248). This may be due to
the absence in change of IL-4 secretion and decreased production of IFN--y induced by
dietary EtOH we observed. Our results confirmed that chronic dietary EtOH exerts a
suppressive effect on NK cell activity, which is consistent with the previous reports (92,
230). The suppression of NK cell activity could have been caused by the reduction of
IL-2 and IFN--y we observed, which are potent inducers and simulators of NK cells.
Impaired immune functions of polymorphonuclear neutrophils (PMN) and
macrophages/monocytes were also observed in alcoholism and EtOH-fed animal models
(249, 250). With regards to functions as hematopoiesis, chemotaxis, adherence and
activation of PMN of macrophages/monocytes are critically dependent on the presence
ofIL-l and IFN--y (251). IFN--y release by ConA-stimulated splenocytes from the EtOH
treated mice were significantly inhibited. IL-la release by murine peritoneal
macrophages was also significantly suppressed by dietary EtOH (Wang et al. unpublished
data). Therefore, suppression of macrophages functions could be caused decreased
levels of IL-la and IFN-,}" which is responsible for initiating macrophage activation and
augment macrophage-related immune responses, including antigen presentation,
95
phagocytosis and release of soluble factors.
The mammalian thymocytes can be subdivided into 4 major subpopulations based
on expression of the differentiation-related antigens CD4 and CD8. "Double-negative
" (DN) CD4-CD8- thymocytes (2-4% of total in the normal adult mouse) represent
immature cells with the capacity to give rise to the other subsets in irradiated host (180).
CD4 +8+ cells in the thymic cortex account for the majority (80-85 %) of thymocytes and
most of such "double-positive" (DP) cells are destined to die in situ (181). The other
two" single-positive" (SP) CD4-8+ and CD4+8- subsets (5-10%) in the thymic medulla
represent mature T cells seen in the peripheral tissue, which originate from DP
thymocytes (181). The control of generation of functional competent T cells from
precursor population within the thymus was mediated by cytokines (167). In mice,
expressing a human IL-2Ra chain transgene, thymocytes express a nonfunctional murine
IL-2Rl3-human IL-2Ra heterodimer resulting in the accumulation of T cell precursors in
the thymus and periphery (167). Also, anti-IL-2R ex chain antibodies abrogate T cell
development which can be reversed by addition ofIL-2 (189). Addition of IL-2 to intact
lobes immersed in culture medium promotes the selective outgrowth of T cells expression
'YO TCR (190). The addition of IL-4 blocks T cell development by reducing the number
of DP thymocytes (191). The constitutive production of IL-4 in IL-4 transgenic mice
also result in the inhibition of DP thymocytes and mature peripheral T cell development
(192, 193). IL-6 has been shown to promote the differentiation of Thy-1 +IL-2R + donor
thymocytes after intrathymic transfer into irradiated hosts (194). The physiological
significance of IFN-'Y is involved in the up-regulation of MHC class I and II expression

96
in the surface of thymic stromal cells, which play a crucial role in the positive and
negative selection during T cell education (Le. recognization 'self' and non-self) in the
thymus. The BtOH-induced suppression of IL-2, IL-4 and IL-6 by thymocytes may be
responsible for the changes in T cell subpopulations and differentiation in the thymus
resulting from BtOH ingestion (253). There were no difference in the percentage of a6-
TCR+, CD4+ and CD8+ thymocytes between Lieber-DeCarli fed mice with or without
ethanol (5 %, v/v) (62). Therefore, the functional change of mature T cells in the thymus
may be responsible for the change of cytokine secretion by thymocytes we observed here.
BtOH-induced corticosteroid may play some role in this process (254). The another
possible mechanism has been proposed whereby ethanol interacts with the endogenous
opioid system by : (a) production of certain ethanol metabolites, for example the
isoquinolines which bind to opiate receptors, (b) altering the binding properties of opiate
receptors and (c) altering the release, synthesis and post-translational processing of
endogenous opioid peptide (255, 256). Thus, BtOH-induced changes in corticosteroid
and opiate could be responsible for the changes in cytokine release by thymocytes,
thereby altering T cell maturation. Abnormalities ofT cell maturation in the thymus may
contribute the impairment of T cell response we and others observed in the peripheral
tissues in animals or humans.
In summary, chronic BtOH ingestion via liquid diet generally caused marked
suppression in the cytokine production induced by mitogens in vitro by splenocytes and
thymocytes, concomitant with a general suppression of immune response. Our results
suggest that the suppressive effects of BtOH on immune responses could be directly

97
caused by dysregulation of cytokine r€?lease by splenocytes and thymocytes, which
controls the T cell maturation and general immune response.

Table 3.1 Effect of Dietary EtOH on Production of Cytokines by Splenocytes*
Cytokines
(ng/ml) Control
IL-2 1.90 + 0.65
IL-4 0.088 + 0.031
IL-5 1.71 + 0.85
IL-6 3.84 + 0.031
IFN--y 21.0 + 5.60
IL-IO(U/ml) 9.76 + 4.89
Treatment
EtOH
0.82 + 0.19
0.056 + 0.033
0.41 + 0.07
1.44 + 1.25
14.7 + 0.97
1.65 + 0.10
P Values
< 0.02
N.S.
< 0.002
< 0.0002
< 0.02
< 0.001
* Every sample was determined in triplicate. Values are mean + SD for 8 mice per group. Cytokine production was secreted by 1 x 1()6 splenocytes in 0.2ml volumes.
N.S. Not Significant
Table 3.2 Effect of Dietary EtOH on IL-6 and TNF-O! By Splenocytes*
Cytokines
(ng/ml)
IL-6
TNF-O!
Control
3.60 ± 0.64
1.32 + 0.04
Treatment
EtOH
2.95 + 0.46
0.9 + 0.18
P Values
N.S.
< 0.05
* Values are mean + SD for 8 mice per group. Cytokine production was secreted by 1 x 1<r splenocytes in a 0.2 ml volume.
N.S. Not Significant
98
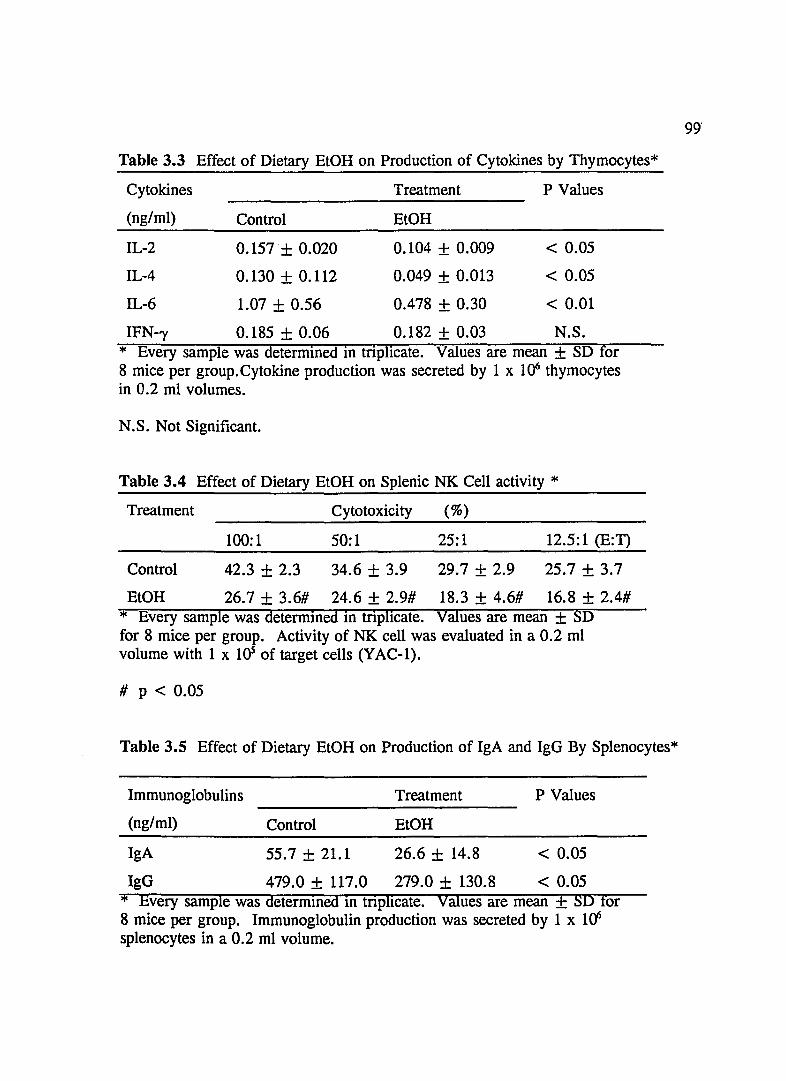
Table 3.3 Effect of Dietary EtOH on Production of Cytokines by Thymocytes*
Cytokines
(ng/ml)
IL-2
IL-4
Control
0.157 + 0.020
0.130 + 0.112
Treatment
EtOH
0.104 + 0.009
0.049 + 0.013
P Values
< 0.05
< 0.05
IL-6 1.07 + 0.56 0.478 + 0.30 < 0.01
IFN-" 0.185 + 0.06 0.182 + 0.03 N.S. * Every sample was determined in triplicate. Values are mean + SD for 8 mice per group.Cytokine production was secreted by 1 x IO' thymocytes in 0.2 ml volumes.
N.S. Not Significant.
Table 3.4 Effect of Dietary EtOH on Splenic NK Cell activity *
Treatment Cytotoxicity (%)
100:1 50:1 25:1 12.5: 1 (E:T)
Control 42.3 + 2.3 34.6 + 3.9 29.7 + 2.9 25.7 + 3.7
EtOH 26.7 ± 3.6# 24.6 ± 2.9# 18.3 ± 4.6# 16.8 ± 2.4# * Every sample was determinea in triplicate. Values are mean + SD for 8 mice per group. Activity of NK cell was evaluated in a 0.2 ml volume with 1 x lOS of target cells (YAC-l).
# p < 0.05
Table 3.5 Effect of Dietary EtOH on Production of IgA and IgG By Splenocytes*
Immunoglobulins
(ng/ml) Control
Treatment P Values
EtOH
IgA 55.7 + 21.1 26.6 + 14.8 < 0.05
IgG 479.0 + 117.0 279.0 + 130.8 < 0.05 * Every sample was determmed m tnphcate. Values are mean + SD for 8 mice per group. Immunoglobulin production was secreted by 1 x 10' splenocytes in a 0.2 ml volume.
99'
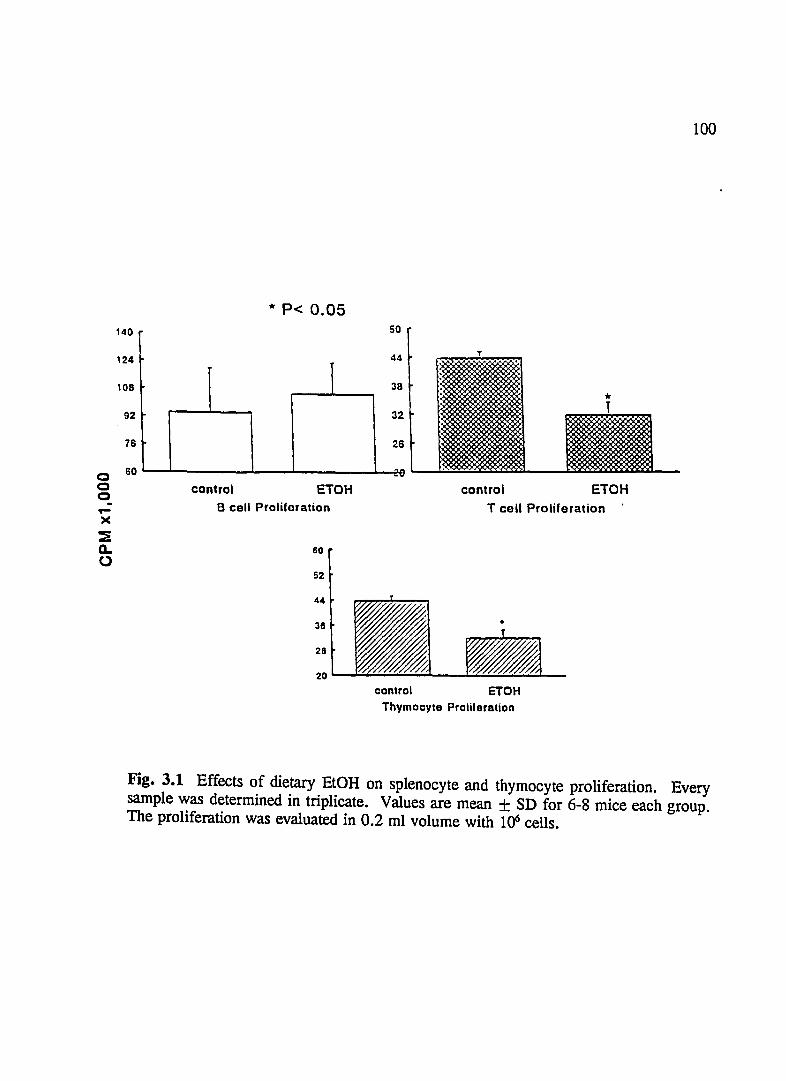
0 0 0 ..->C
::E D-O
100
* P< 0.05 140 50
124
108 1 44
3B
* 92 32
76 26
60 -"'"
control ETOH control ETOH B cell Proliferation T cell Proliferation .
60
52
control eTOH Thymocyte Proliferation
Fig. 3.1 Effects of dietary EtOH on splenocyte and thymocyte proliferation. Every sample was determined in triplicate. Values are mean ± SD for 6-8 mice each group. The proliferation was evaluated in 0.2 ml volume with 1()6 cells.

101
CHAPTER 4: ALCOHOL CONSUMPTION MODULATION OF
CYTOKINE PRODUCTION AND IMMUNE RESPONSE DURING MURINE AIDS
Abstract
Chronic dietary EtOH 5% (v/v) in the Lieber-DeCarli liquid diet was fed
C57BL/6 mice inoculated with LP-BM5 retrovirus causing murine AIDS for 11 weeks.
Cytokine production by splenocytes and thymocytes, and some immune functions were
measured. Decreased levels of IL-2 caused by retrovirus infection remained unchanged.
Elevated levels of IL-5 and IL-6 produced in vitro by splenocytes during retrovirus
infection were further increased by EOH. Elevated IL-4 due to retroviral infection was
not affected by EtOH. Increased production of IL-10 induced by retrovirus infection,
however, was significantly inhibited by EtOH while decreased release of IFN--y induced
by retrovirus infection was significantly enhanced. Elevated levels of TNF-c:x produced
by splenocytes from retrovirus infected mice were significantly further increased by
EtOH, while levels of IL-6 were not affected. Suppressed T cell proliferation caused by
retrovirus infection was significantly reduced further by EtOH. However, no effect of
EtOH was observed on B cell decreased proliferation by retrovirus infection.
Retrovirus-suppressed IL-2 production and retrovirus-elevated IFN--y secretion by
thymocytes were not further affected by EtOH. However, decreased IL-5 levels and
increased IL-5 during murine AIDS were significantly increased and reduced by EtOH,
respectively. Unchaged IL-4 during murine AIDS was significantly reduced by EtOH.
IL-2 production produced by ConA-stimulated splenocytes was suppressed during murine
AIDS. It was further inhibited in EtOH-fed mice compared to controls at 6 weeks post-
102
infection, whereas decreased level of IFN-'Y during murine AIDS was not further affected
in EtOH-fed mice. The levels of IL-S, IL-6 and IL-1O by secreted by ConA-induced
splenocytes, elevated during murine AIDS, were significantly further enhanced in EtOH
fed mice compared to controls at 6 weeks post-infection, while retrovirus-induced
elevated release of IL-6 and TNF-a, by produced by LPS-stimulated splenocytes, were
further increased in EtOH-fed mice compared to controls at 6 and 9 weeks post-infection,
respectively. ConA- and LPS-induced splenocytes proliferation, inhibited by retrovirus
infection, was significantly further suppressed in EtOH-fed mice compared to controls.
The body and thymus weight were not affected by EtOH consumption, whereas
thymocyte number and proliferation, which had been reduced during murine AIDS, were
significantly further reduced by EtOH use. The production of IL-2 and IL-6 by
thymocytes, which has been lessened during murine AIDS, were significantly further
suppressed by dietary EtOH at 6 weeks post- infection, whereas levels of IL-4 and IL-6
by thymocytes, which had been elevated during murine AIDS, were significantly further
increased by EtOH consumption. These data also suggest that dietary EtOH consumption
can modulate cytokine production by thymocytes, adversely affecting T cell
differentiation, especially during retrovirus infection. These results suggest that dietary
EtOH aggravates progression of immune dysfunction and affects T cell maturation in the
thymus, leading to AIDS as dietary EtOH modifies production of immunological
regulatory cytokines by splenocytes and thymocytes.

103
Introduction
Because of overwhelming evidence that the deleterious effects of chronic EtOH
consumption on immune response (84, 85, 287), it could further enhance susceptibility
to infection and development of AIDS (288, 17). EtOH increased in vitro both the
susceptibility of cells to HIV infection and their replication of HIV in infected
monocytes/macrophages and T cells (139-141). However, a recent study of EtOH
ingestion in HIV -positive persons did not demonstrate an increase in the development of
AIDS (142). Since the dosage, frequency and duration of EtOH exposure in the various
stage of HIV -positive patients may be a key role as a cofactor in the progression to
AIDS, the results of this study are difficult to be interpreted when EtOH exposure was
not well defined. Thus it remains unclear if alcoholics more predisposed to HIV
infection and whether EtOH ingestion at the special stage of HIV infection (e.g.
following seroconversion) aggravates the development of AIDS. Ethical, economical
and logistical considerations, however, have precluded well-defined studies in mv+
humans using large amounts of EtOH. As the rate of development of human AIDS
after retrovirus infection is variable (17), some cofactors may exacerbate the effects of
retrovirus infection on development of severe immunosuppression initiated by retrovirus.
Alcohol (BtOH) use, which has suppressive effects on immune responses (85, 248, 257),
could synergize with retrovirus infection to accelerate the onset of immune dysfunctions
(17, 269). We found that dietary EtOH reduced in vitro cytokine production by cells
from normal, uninfected animals (269, 270). Dietary EtOH also synergized with murine
AIDS to promote growth of tumors (271), death rate after Streptococcus pneumoniae

104
infection (272), and intestinal parasite colonization (273, 226). Therefore we further
defined the effects of chronic dietary EtOH consumption on in vitro production of
regulatory cytokines (IL-2, IL-4, IL-5, IL-6, IL-lO, IFN-'Y and TNF-a) by mitogen
stimulated splenocytes and thymocytes, and some immune functions during murine
retrovirus infection. Then in order to assert whether EtOH users prior to retrovirus
infection are more predisposed to immunological susceptibility to retrovirus infection,
chronic EtOH-fed mice were infected with LP-BM5 retrovirus infections, and immune
dysfunctions and cytokine dsyregulation were monitored in T and B cell proliferation,
antibody [immunoglobulin A and G (Ig)] production and cytokine [Interleukin-2, 5, 6,
10 (IL), interferon-'Y (IFN) and tumor necrosis factor-a (TNF)] production. In addition,
we proposed EtOH use prior to retrovirus infection may act as a cofactor in the
development of AIDS via affecting T cell maturation in the thymus. In order to test this
hypothesis, chronic EtOH-fed mice were infected with LP-BM5 retrovirus infections
causing murine AIDS, which functionally simulates human AIDS (58). Thymocyte
proliferation and its cytokine [interleukin-2, 4, 6 (IL), and IFN-'Y ] production were
monitored.

105
Materials and Methods
Animals Female C57BL\6 mice, 3 to 4 weeks old were obtained from the Charles
River Laboratories Inc. (Wilmington, DE). The mice were housed in transparent plastic
cages with stainless steel wire lids. Mice were housed 4 mice to a cage. The housing
facility was maintained at 20 to 22° C and 60 to 80% relative humidity and animals were
exposed to a 12: 12 hr light-dark cycle. Water and mouse chow (Texland, Madison, WI)
were provided ad libitum. After 1 week housing in the animal facility in the Arizona
Health Sciences Center, mice were infected with retrovirus LP-BM5, and then randomly
assigned to the following two treatments in the first study: control and EtOH. These
treatments were initiated simultaneously. There was no observed difference at the time
of mouse sacrifice between the two treatments on mouse body weight (Control: 26.61 ±
2.35 g vs EtOH: 27.31 ± 1.75 g, values are mean + S.D. of 8 mice per group). In the
second study, one group received control liquid diet as a control. Another group
received EtOH liquid diet. After 10 weeks feeding, all mice received retrovirus
infection. Upon infection, all mice received the control liquid diet until sacrifice. The
schedule of experiment is following:
Weeks: 0 Dietary Treatment (4.5 % EtOH and and Control)
10 LP-BM5 Infection and
all mice received control liquid diet.
16 19 Sacrifice for Analysis
EtOH Diets In the first study, infected mice were fed with 5 % EtOH (v/v) in Lieber-
106
DeCarli liquid diet (#710260,Dyets, Bethlehem, PA). All diets were made isocaloric by
substituting 26% of the total calories with ethanol for the ethanol diet and dextrose for
the control diet. Mice were fed the respective diets for 11 weeks. In the second study,
all mice were fed the National Research Council (NRC) liquid diet (20). Dietary
ingredients were obtained from Dytes (#710279, Bethlehem, PA). All diets were made
isocaloric by substituting 26% of the total calories with ethanol in the ethanol diet and
with dextrose in the control diet. In previous studies in our lab, we have found that
higher dietary EtOH (e.g. more than 5% v/v) significantly increased mortality of mice,
and lower dietary EtOH (e.g. less than 3% v/v) did not cause significant change in
immune functions. Therefore, the concentration of EtOH in a NRC liquid diet was 4.5 %
(v/v) in this study. A pair-fed study was previously performed in our lab with no
significant differences between the pair-fed group and ad-lib group observed in diet
consumption, body weight, the weight of thymus and spleen, immune functions and
cytokine production (294). Therefore, the diets were provided ad libitum in this study.
The average consumed volume of liquid diet was 12-15 ml per mouse per day for every
diet. No significant difference of consumption of the diets and body weight before
sacrifice between the two groups were observed (data not shown).
LP-BM5 MULV Infection See Materials and Methods in Ch. 2.
Cytokine Standards and Antisera See Materials and Methods in Ch. 2.
Preparation of Splenocytes and Thymocytes See Materials and Methods in Ch. 2.
Preparation of Cytokine Production See Materials and Methods in Ch. 2.
ELISA for Cytokines See Materials and Methods in Ch. 2.

107
Mitogenesis of Splenocytes and Thymocytes See Materials and Methods in Ch. 2.
Statistics Two-tailed student T-test was applied. p < 0.05 was considered a
significant difference between two groups.
108
Results
Production of Cytokines by Splenocytes. As shown in Table 4.1, the elevated levels
of IL-S and IL-6 by splenocytes induced by retrovirus infection ( in normal mice IL-S:
1.71 + 0.85 ng/ml; IL-6: 3.84 + 0.031) were significantly and further increased by
dietary BtOH ( p < O.OS), while the release of decreased IL-2 and IL-4 levels by
splenocytes in the murine AIDS ( in normal mice IL-2: 1.90 + 0.65 ng/ml; IL-4: 0.088
+ 0.031 ng/ml) was not further affected by BtOH. The decreased secretion of IFN-'Y
by splenocytes during retrovirus infection ( in normal mice: 21.0 + S.6 ng/ml) was
significantly increased by dietary BtOH (p < 0.05), while increased release of IL-lO
in murine AIDS ( in normal mice 9.76 + 4.89 U/ml) was significantly reduced (p <
0.05). As shown in Table 4.2, the elevated production of TNF-a by LPS-stimulated
splenocytes during murine AIDS ( in normal mice 1.32 + 0.34 ng/ml) was significantly
and further increased by dietary BtOH (p < O.OS), while increased level of IL-6
secretion during retrovirus infection ( in normal mice 3.6 + 0.64 ng/ml) was slightly
increased ( p> 0.05 ).
Production of Cytokines by Thymocytes. As shown in Table 4.3, The decreased IL-2
and IL-S production by thymocytes during retrovirus infection was significantly ( p <
O.OS) further reduced by dietary BtOH (in normal mice: IL-2: 0.157 + 0.053; IL-S: 1.70
+ 0.014 ng/ml). Increased IL-4 and IL-6 production by thymocytes during retrovirus
infection was significantly (P < O.OS) reduced by BtOH ( in normal mice: IL-4: 0.064
+ 0.035; IL-6: 1.07 + 0.S6 ng/ml). Increased IFN-'Y level during retrovirus infection
was not affected by BtOH (in normal mice: 0.18S + 0.056 ng/ml).

109
Mitogenesis of Splenocytes and Thymocytes. The suppressed splenocytes proliferative
response to the T-cell mitogen ConA during murine AIDS ( in normal mice 9300 + 2400
cpm) was significantly and further inhibited by dietary EtOH, while suppressed
splenocyte proliferation induced by the B-cell mitogen LPS during murine AIDS ( in
normal mice 44000 + 2500 cpm) was not affected (Fig. 5.1). As shown in Fig. 5.1,
increased thymocyte proliferation during murine AIDS was not significnatly affected by
EtOH.
Production of Splenice Cytokine Prior to Retrovirus Infection. T helper type I cells
(Thl) produce IL-2 and IFN-'Y which are responsible for cell-mediated immunity.
Secretion of IL-2 and IFN-'Y produced by ConA-stimulated splenocytes during murine
AIDS declined due to retrovirus infection compared to uninfected normal mice (IL-2:
3.54 + 0.43; IFN-'Y: 30.0 + 5.0 ng/ml). IL-2 production during murine AIDS was
significantly (p < 0.05) further inhibited in EtOH-fed mice at 6 and 9 weeks post
infection compared to their controls (Table 4.4). However, the decreased levels of IFN
'Y produced by ConA-stimulated splenocytes were not affected by EtOH use (Table 4.4).
Th2 cells produce IL-5, IL-6 and IL-lO that are responsible for humoral immunity.
Secretion of IL-5, IL-6 and IL-lO by ConA-stimulated splenocytes during murine AIDS
is enhanced due to retrovirus infection compared to uninfected, normal mice (IL-5: 0.32
+ 0.015 ng/ml; IL-6: 2.0 + 0.05 ng/ml; IL-lO: 0.45 + 0.05 ng/ml). As shown in
Table 4.5, elevated levels ofIL-5, IL-6 and IL-lO during murine AIDS were significantly
(p < 0.05) further increased in EtOH-fed group at 6 weeks post-infection, but not at
9 weeks post-infection. Macrophages and B cells produce IL-6 and TNF-a, which are

110
involved in immune reactions and immunopathogenesis. The levels of IL-6 and TNF-a
produced by LPS-stimulated splenocytes during murine AIDS were elevated due to
retrovirus infection compared to uninfected, normal mice (IL-6: 1.75 + 0.04 ng/ml;
TNF-a: 1.46 + 0.034 ng/ml). The levels ofIL-6 and TNF-a, increased during murine
AIDS, were significantly (p < 0.05) further enhanced in EtOH-fed mice compared to
control group at 6 and 9 weeks post-infection (fable 4.6).
Production of IgA and IgG Prior to Retrovirus Infection. Hypergammaglobulinemia is
a feature of AIDS. The in vitro production of IgA and IgG by splenocytes was enhanced
by retrovirus infection during murine AIDS compared to uninfected, nonnal mice (IgA:
50.1 + 4.3 ng/ml; IgG: 479.0 ± 77.0 ng/ml). As shown in Table 4.7, elevated IgA and
IgG production by LPS-stimulated splenocytes during murine AIDS was significantly (p
< 0.05) increased in EtOH-fed mice compared to controls at 6 weeks post-infection, but
not at 9 weeks post-infection. These results are in accord with the findings of increased
IL-5 and IL-6 production (Table 4.5), which are major simulators of IgA and IgG
secretion.
Mitogenesis of Splenocytes Prior to Retrovirus Infection. T and B cell proliferation
response to mitogens during murine AIDS are suppressed compared to uninfected,
nonnal mice (f cells: 26,855 + 1,300 cpm; B cells: 48,566 + 2,459 cpm). Decreased
ConA-induced splenocyte proliferation was significantly (p < 0.05) further suppressed
in EtOH-fed mice at 6 weeks post-infection, but not at 9 weeks (Fig. 4.2). This results
are in accord with the findings of decreased IL-2 release (fable 4.1), which is a major
T cell growth factor. Inhibited LPS-induced splenocytes proliferation was significantly

111
further (p < 0.05) reduced in EtOH-fed mice compared to control group at 6 and 9
weeks post-infection (Fig. 4.3).
Body and thymus weight Prior to Retrovirus Infection. As shown in Table 4.7, The
body weight and thymus weight were not affected by dietary EtOH consumption.
Thymocyte number and proliferation Prior to Retrovirus Infection. Thymocyte number
was slightly decreased by retrovirus infection compared to that from uninfected, normal
mice (4.8). EtOH consumption significantly (p < 0.05) further reduced thymocyte
number compared to controls at 6 or 9 weeks post-infection, while decreased thymocyte
proliferation during murine AIDS was significantly ( P < 0.05) reduced by EtOH use
compared to controls at 6 weeks post-infection, but not at 9 weeks post-infection (fable
4.9).
Production of thymic cytokines Prior to Retrovirus Infection. IL-2 production by
thymocytes was decreased during murine AIDS at 6 post-infection compared to that from
uninfected, normal mice and was elevated at 9 weeks post infection, whereas IL-6
production was suppressed at 6 weeks post-infection and was enhanced at 9 weeks post
infection. IL-4 and IFN--y levels produced by thymocytes were elevated during murine
AIDS. EtOH consumption significantly (p < 0.05) further reduced IL-2 production
compared to controls at 6 weeks post-infection, but it had no effect on IL-2 secretion at
9 weeks post-infection (fable 4.10). Increased IL-4 release by thymocytes during murine
AIDS was significantly (p < 0.05) further elevated by EtOH compared to controls at
6 and 9 weeks post-infection (fable 4.10). EtOH consumption significantly (p < 0.05)
further reduced IL-6 production compared to controls at 6 weeks post-infection, but it
112
had no effect on retrovirus-induced increased IL-6 secretion at 9 weeks post-infection
(Table 4.11). Increased IFN--y release by thymocytes during murine AIDS was sightly
further elevated by EtOH compared to controls at 6 and 9 weeks post-infection (fable
4.11).

113
Discussion
Murine AIDS has been shown to increase certain cytokines (lL-4, IL-5, IL-6, IL-
10 and TNF-a), while suppressing others (lL-2 and IFN-'Y) (208). Dietary EtOH fed
normal, uninfected mice (94) and rats (270) usually suppresses cytokine production.
Thus, there is potential to normalize or exacerbate retrovirus-induced immune
dysfunction. However, for the first time, EtOH was shown to exacerbate, as well as
normalize, immune dysfunctions in cytokine production induced by murine retrovirus
infection. IL-5 and IL-6 production increased by murine AIDS (208) was further
enhanced by EtOH while IL-lO secretion, increased by infection (208), was reduced by
EtOH. IFN-'Y production, suppressed by retrovirus infection (208), was partially
normalized by dietary EtOH. Thus, retrovirus-induced modulation of cytokine
production was exacerbated in some cases and counteracted in others. Chronic EtOH
consumption prior to retrovirus infection more yielded immune dysfunctions and cytokine
dysregulation initiated by retrovirus infection, even though EtOH use was discontinued
for the 6 weeks after infection. Thus, chronic consumption of EtOH can act as a
cofactor to aggravate immune dysfunction and cytokine dysregulation, supporting the
concept that alcoholics may be predisposed to accelerated immune dysfunctions during
HIV infection. The chronic EtOH diet induced immunosuppression in normal mice (94)
appears responsible for the speeding development of murine AIDS, indicating a greater
loss of host resistance after EtOH consumption. Clearly dietary EtOH functioned as a
co-factor by further modulating retrovirus-induced immune dysfunction in cytokine
production.

114
Murine retrovirus infection or dietary EtOH consumption alone has been shown
to have a suppressive effect on T cell proliferation (22, 94). Chronic dietary EtOH
consumption could exacerbate decreased T cell proliferation induced by retrovirus
infection. Decreased IL-2 production in murine AIDS (274) was not further affected by
EtOH. This could be due to the limitation of ELISA kit for IL-2, because the level of
IL-2 in murine AIDS is around the detection limit of the kit. Decreased production of
IFN-,), by Th2 cells in the spleen (208) was significantly increased by EtOH. This may
be caused by increased NK cell activity induced by EtOH via B-endorphin and
norepinephrine, potent simulators of NK cell activity (274-276), because NK cells was
suggested to be a major source ofIFN-')' in vivo (164). Increased release ofIFN-')' could
shut off production of IL-IO by Thl cells, because it is a reciprocal regulator (277),
leading to the imbalance of Th 1 and Th2 cell development and cytokine production, a
critical factor in the resistance to infection. While chronic EtOH can modify spleen T
subsets, the changes (278, 95) are not dramatic enough to significantly explain the
changes we observed in cytokine production. Consequently, we conclude that the effects
of chronic EtOH consumption on cytokine production was also functional, perhaps via
disturbing the signal transduction of immunocompetent cells (237, 238). An imbalance
in the Thl and Th2 response may contribute to the immune dysfunction associated with
HIV infection, and resistance to HIV infection and progression to AIDS may be
dependent on a Thl > Th2 dominance (89, 295, 296). This notion is supported by the
evidence that knockout of IL-4 gene in murine AIDS prevented development of immune
dysfunction and loss of Thl cytokine production (80). The levels of IL-5, IL-6 and IL-

115
10 (Th2 cytokines) by ConA-stimulated splenocytes, elevated during murine AIDS, were
further increased in EtOH-fed mice. This suggests that chronic EtOH consumption could
worsen the imbalanced ofThI and Th2 cytokine production occurred often in AIDS (80).
Inhibited production of IL-2 (Thl cytokine) during murine AIDS was further suppressed
in EtOH-fed mice, supporting the notion that preferential activation of Th2 cells due to
EtOH consumption in murine AIDS. Production IFN--y (Thl cytokine) by cells from
EtOH-fed mice was not affected. This may be due to increased NK cell activity induced
by EtOH via B-endorphin and norepinephrine, potent simulators of NK cell activity (297,
298), as NK cells are major sources of IFN--y in vivo (178, 195). Thus, many of the
features of chronic EtOH use before retrovirus infection are consistent with a decrease
in Thl function and activation of Th2 function seen often in AIDS, thus exacerbating to
the development of AIDS as a cofactor.
In vivo activated B cells from HIV patents spontaneously produce IL-6 and TNF
Ol (279), which was what we found with LPS-stimulated spleen cells for LP-BM5
retrovirus infected mice (208). IL-6 production would explain the
hypergammaglobulinemia and global B cell dysfunction seen with both pathogens.
Chronic dietary EtOH consumption slightly enhanced this increased level ofIL-6 by LPS
stimulated splenocytes, which may aggravate hypergammaglobulinemia and global B cell
dysfunction. Enhancement of increased IL-5 levels in murine AIDS by dietary EtOH
may also contribute to this exacerbation. Furthermore, IL-6 also is involved in
governing the production of certain acute-phase reactants by hepotocytes, which results
in a series of tissue damage (107). Elevated levels of TNF-Ol may be involved with lipid
116
metabolism: inducing hypertriglyceridemia and wasting in both human and murine AIDS
(176, 177). Thus enhancement of elevated levels of TNF-a and IL-6 in murine AIDS
by dietary BtOH consumption will aggravate pathological symptoms of the host initiated
by retrovirus infection. In the other hand, increased enhancement by chronic BtOH
consumption before retrovirus infection of elevated levels of TNF-a and IL-6 in murine
AIDS may aggravate pathological symptoms of the host initiated by retrovirus infection,
thus suggesting that BtOH use could be an important cofactor to facilitate the
development of AIDS.
Several mechanisms have been suggested for EtOH-containing diets that suppress
immunological parameters (280, 234). Some immunological parameters are directly
influenced by BtOH (281) or its metabolites interacting with the cell membranes (231),
or perhaps via BtOH-induced hormonal changes caused by the central nervous system.
Second, chronic BtOH use causes nutritional deficiencies which are very
immunosuppressive and the cause of some cytokine suppression (282) by BtOH. Finally,
immune dysfunction is a part of major physiological modification during alcoholic liver
disease (117, 283). In this study, the model of murine BtOH-consumption, by using
Lieber-DeCarli liquid diet which is supplemented with nutrients well above the
requirements for growth in non-EtOH fed mice, minimized the interference of alcoholic
liver diseases and alcohol-induced malnutrition. Thus, the mechanism of dietary BtOH
action on cytokine production is likely a direct effect of BtOH or its metabolites' effect,
or via hormonal and central nervous system changes. Chronic consumption of dietary
BtOH was shown to have a consistently suppressive effect on the cytokine productioa in

117
non-retrovirus infected mice (279) and rats (270). However, we found that chronic
dietary EtOH consumption results in stimulation of several cytokines including IFN-'Y,
IL-5, IL-6 and TNF-a during retrovirus-induced immune dysfunction. This distinction
may reflect that significant changes in drug metabolism (284), response of cytokine
secretion to EtOH exposure and hormonal status in murine AIDS. The elucidation of
these mechanisms will help to explain dietary EtOH modulation on cytokine production
in murine AIDS mice, which will facilitate understanding the immunopathegenic
mechanism of dietary EtOH in human AIDS.
Altered responsiveness may be due to the essential elimination of mature
thymocytes with CD surface markers in the thymus, while the number of immature
lymphoid cells increased dramatically. Because of the well-known role of
adrenocorticosteroids in thymic atrophy, we hypothesize that alteration of cytokine
production from the thymus was due to cortisteroids induced by EtOH and retrovirus.
The EtOH consumption reduced the thymus weight (289, 248). However, the results
from this study indicated EtOH use prior to retrovirus infection did not reduce thymus
weight during murine AIDS. The m3:~or reason is thymus weight increases with lower
number ofthymocytes in retrovirus-infected mice (182). The histological studies showed
the disappearance of defined areas (like the cortex and medulla) in these thymuses from
murine AIDS. Moreover, there are empty spaces between groups of cells that do not
correspond to collagen fibers. Thus, the increase of thymus induced by retrovirus
infection may offset the decrease induced by EtOH consumption. These evidences
consistently explain EtOH consumption reduced thymocyte number with no change of
118
thymus weight.
Pro-thymocytes leave the bone marrow and arrive at the thymus where they find
the appropriate environment that let them complete their differentiation to become
functional T cell. The generation of functional competent T cells from precursor
populations within the thymus involves several stages of cellular proliferation and
differentiation (181). It has been proposed that the control of these processes is mediated
by cytokines (167). For example, in mice expressing a human IL-2RO! chain transgene,
thymocytes express a nonfunctional murine IL-2RJ3-human IL-2RO! heterodimer resulting
in the accumulation of T cell precursors in the thymus and periphery (167). Also, anti
IL-2R O! chain antibodies abrogate T cell development which can be reversed by addition
of IL-2 (189). Addition of IL-2 to intact lobes immersed in culture medium promotes
the selective outgrowth ofT cells expression ')'0 TCR (190). Consequently, the inhibition
of IL-2 production by BtOH use we observed may partly contribute to the disruption of
T cell differentiation in the thymus, thereby adversely affecting pheripheral immune
responses. Consequently, the inhibition of IL-2 production by EtOH use we observed
may partly contribute to the changes in T cell subpopulations and differentiation in the
thymus. The addition of IL-4 blocks T cell development by reducing the number of
double-positive thymocytes (191). The constitutive production ofIL-4 in IL-4 transgenic
mice also result in the inhibition of double-positive thymocytes and mature peripheral T
cell development (193, 194). Consistently increased level of IL-4 induced by retrovirus
infection in the thymus was further enhanced by EtOH consumption. Thus, we
concluded that this increase may aggravate the impairment of T cell development in the

119
murine or human AIDS, thereby causing secondary acquired T cell deficiency. IL-6 has
been shown to promote the differentiation of Thy-l +IL-2R+ donor thymocytes after
intrathymic transfer into irradiated hosts (254). Thus, the suppression of IL-6 secretion
induced by retrovirus infection at the beginning of infection may also contribute the
abrogation of T cell development in the thymus. EtOH ingestion further increased IL-6
production, thus EtOH definitely contribute to the disruption of T cell maturation. The
physiological significance of increased level of IFN--y by thymocytes induced by
retrovirus infection may be involved in the up-regulation of MHC class I and II
expression in the surface of thymic stromal cells, which play a crucial roles in the
positive and negative selection during T cell education (i.e. recognition 'self and non
self) in the thymus. Thus, the dysregulation of IFN--y release by thymocytes may reflect
the failure of T cell education, leading to loss of tolerance to self antigens or reaction to
non-self antigens. Dietary EtOH prior to retrovirus infection further increased IFN--y
levels, which would be expected to contribute the failure of T cell education. Thus,
abnormalities of T cell maturation in the thymus may contribute the impairment of T cell
response we and others observed in the peripheral tissues in animals or humans.
The underlying mechanisms by which EtOH uses are more predisposed to
disruption of T cell functions due to retrovirus infection is that EtOH-induced
corticosteroid may play some role in this process (254). The another possible mechanism
has been proposed whereby ethanol interacts with the endogenous opioid system by : (a)
production of certain ethanol metabolites, for example the isoquinolines which bind to
opiate receptors, (b) altering the binding properties of opiate receptors and (c) altering

120
the release, synthesis and post-translational processing of endogenous opioid peptide
(303, 304). Thus, EtOH-induced changes in corticosteroid and opiate could be
responsible for the changes in cytokine release by thymocytes, thereby altering T cell
maturation. In addition, EtOH consumption may facilitate the spread and replication of
retrovirus infection via inhibiting immune response and increasing oxidative stress (287).
In summary, chronic dietary EtOH consumption further aggravated the already
imbalanced immune response induced by the retrovirus infection. This would facilitate
the progression of AIDS and pathological damage caused by retrovirus infection,
explaining EtOH facilitation of retrovirus-induced loss of disease and cancer resistance.
Although the potential of EtOH consumption as a cofactor is human AIDS is not well
defined, our results indicated that the chronic EtOH consumption exacerbated the
imbalanced immune response induced by the retrovirus infection. It is conceivable that
this could facilitate the progression to AIDS and pathological damage caused by
retrovirus infection, explaining EtOH facilitation of retrovirus-induced loss of disease and
cancer resistance. Likewise, one of the mechanisms of EtOH use as a cofactor in
development of AIDS is preferential activation of Th2 cells. The adversely effects of
EtOH consumption on T cell differentiation in the thymus via modulating cytokine
secretion during murine AIDS may provide defect helper T cells, explaining aggravation
of immune dysfunction by EtOH during murine AIDS by EtOH consumption. The
continuing elucidation of the mechanism of EtOH effects on immune system during AIDS
may help us to understand how combination of EtOH use and HIV infection aggravate
the progression of AIDS in human subjects, perhaps via synergic effects.

121
TABLE 4.1 Effect of EtOH on Production of Cytokines by Splenocytes During Retrovirus Infection *
Cytokines Dietray
(ng/ml) Control
IL-2 0.124 + 0.12'
IL-4 0.232 + 0.13
IL-S 1.36 + 0.71
IL-6 18.6 + 9.38
IFN-'Y 8.8 + 1.4
IL-lO(U/ml) 17.3 + S.2
Supplement
EtOH
0.146 + 0.12
0.329 + 0.27
2.87 + 0.78
30.9 + 6.S
21.6 + 4.6
1.66 + 0.28
P Values
N.S.
N.S.
< 0.0001
< 0.02
< 0.0001
< 0.0001
* Values are mean + SD for 8 mice per group. Cytokine production was secreted by 1 x 1()6 splenocytes in a 0.2ml volume.
N.S. Not Significant
Table 4.2 Effect of EtOH on IL-6 and TNF-O! By Splenocytes During Retrovirus Infection *
Cytokines Dietary
(ng/ml) Control
IL-6 24.S + 6.8
TNF-O! 3.54 + 0.71
Supplement
EtOH
28.7 + 8.S
4.47 + 0.68
P Values
N.S.
< 0.02
* Every sample was determined in triplicate. Values are mean + SD for 8 mice per group. Cytokine production was secreted by 1 x 1()6 splenocytes in 0.2 ml volumes.
N.S. Not Significant

Table 4.3 Effect of EtOH on Production of Cytokines by Thymocytes During Retrovirus Infection *
Cytokines Dietray
(ng/ml) Control
IL-2 0.134 + 0.014
IL-4 0.130 + 0.112
IL-5 0.55 ± 0.05
IL-6 3.80 + 2.3
IFN--y 12.4 + 9.1
Supplement
EtOH
0.103 + 0.007
0.049 + 0.013
0.36 + 0.02
0.67 + 0.32
12.8 + 15.2
P Values
< 0.05
< 0.05
< 0.0001
< 0.02
N.S.
* Values are mean ± SD for 8 mice per group. Cytokine production was secreted by 1 x 1()6 thymocytes in a 0.2m1 volume.
N.S. Not Significant
Table 4.4 Effect of EtOH Consumption Prior to Retrovirus Infection on Production of IL-2 and IFN--y by Splenocytes*
Post-infection Groups Cytokines (ng/ml)
(weeks) IL-2 IFN--y
6 Control 1.80 + 0.34 15.6 + 7.06
EtOH 0.87 + 0.22# 18.8 + 3.6
9 Control 0.30 + 0.032 10.6 + 3.54
EtOH 0.061 + 0.03# 13.36 + 10.76
122
* Every sample was determmed m tnphcate. Values are mean + SD for 6-8 mice for each group. Cytokine was secreted by 1x1()6 splenocytes in 0.2 ml. The concentrations of IL-2 and IFN--y produced by ConA-stimulated splenocytes from uninfected, normal mice ( diet- and age-matched to experimental mice) are 3.54 + 0.43 and 30.0 + 5.0 ng/ml, respectively.
# p < 0.05 compared to age-matched control.
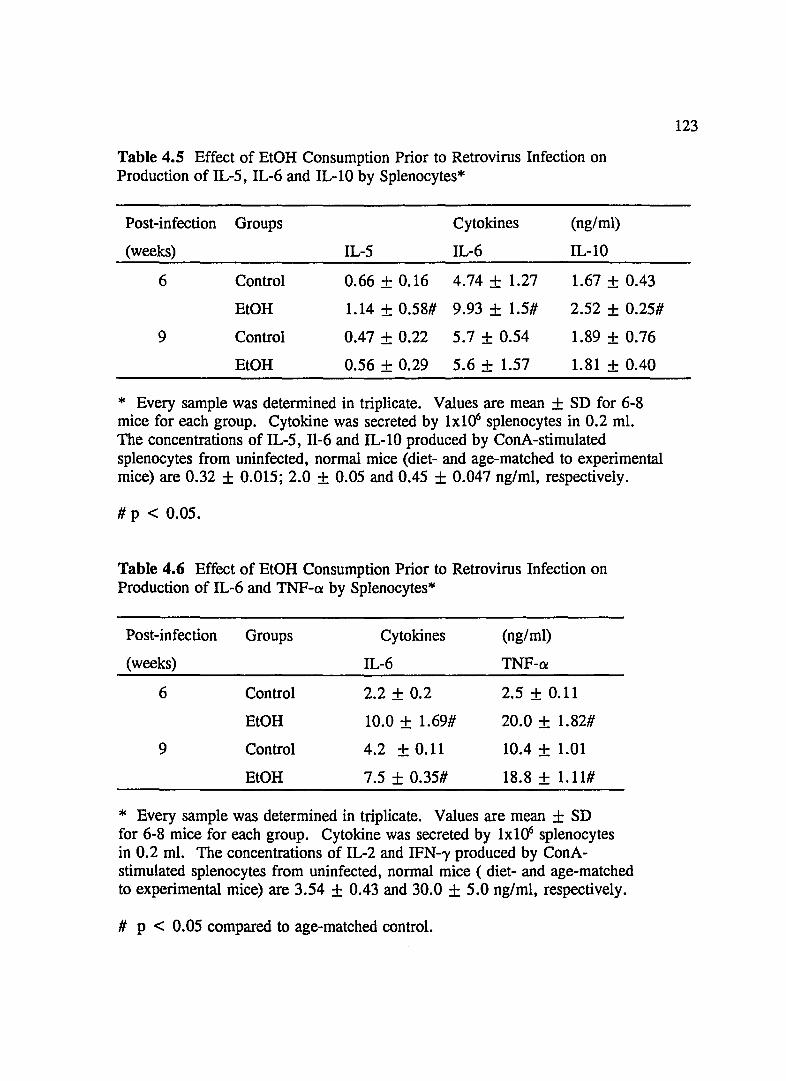
Table 4.5 Effect of EtOH Consumption Prior to Retrovirus Infection on Production of IL-5, IL-6 and IL-lO by Splenocytes*
Post-infection Groups Cytokines (ng/ml)
(weeks) IL-5 IL-6 IL-lO
6 Control 0.66 + 0.16 4.74 + 1.27 1.67 + 0.43
EtOH 1.14 + 0.58# 9.93 ± 1.5# 2.52 + 0.25#
9 Control 0.47 + 0.22 5.7 + 0.54 1.89 + 0.76
EtOH 0.56 + 0.29 5.6 + 1.57 1.81 + 0.40
* Every sample was determined in triplicate. Values are mean + SD for 6-8 mice for each group. Cytokine was secreted by lxlcYi splenocytes in 0.2 ml. The concentrations of IL-5, 11-6 and IL-lO produced by ConA-stimulated splenocytes from uninfected, normal mice (diet- and age-matched to experimental mice) are 0.32 + 0.015; 2.0 + 0.05 and 0.45 + 0.047 ng/ml, respectively.
# P < 0.05.
Table 4.6 Effect of EtOH Consumption Prior to Retrovirus Infection on Production of IL-6 and TNF-a by Splenocytes*
Post-infection Groups Cytokines (ng/ml)
(weeks) IL-6 TNF-a
6 Control 2.2 + 0.2 2.5 + 0.11
EtOH 10.0 + 1.69# 20.0 + 1.82#
9 Control 4.2 + 0.11 10.4 + 1.01
EtOH 7.5 ± 0.35# 18.8 + 1.11#
* Every sample was determined in triplicate. Values are mean + SD for 6-8 mice for each group. Cytokine was secreted by lxlcYi splenocytes in 0.2 ml. The concentrations of IL-2 and IFN-'Y produced by ConAstimulated splenocytes from uninfected, normal mice ( diet- and age-matched to experimental mice) are 3.54 + 0.43 and 30.0 + 5.0 ng/ml, respectively.
# p < 0.05 compared to age-matched control.
123

Table 4.7 Effect of EtOH Consumption Prior to Retrovirus Infection on Production of IgA and IgG by Splenocytes*
Post-infection
(weeks)
6
9
Groups
Control
EtOH
Control
EtOH
Immunoglobulin
IgA (ng/ml)
60.8 + 4.1
71.7 + 6.7#
125.1 + 10.2
105.2 + 28.9
IgG (~g/ml)
1.01 + 0.52
2.12 ± 0.41#
8.8 + 2.78
8.86 + 2.59
* Every sample was determined in triplicate. Values are mean + SD for 6-8 mice for each group. IgA and IgG were secreted by 1x1<r splenocytes in 0.2 ml. The concentrations of IgA and IgG produced by LPS-stimulated splenocytes from uninfected, normal mice (diet- and
124
age- matched to experimental mice) are 50.1 + 4.3 and 479.0 + 77.0 ng/ml, respectively.
# p < 0.05 compared to age-matched control.
Table 4.8 Effect of EtOH Consumption Prior to Retrovirus Infection on Body and Thymus Weight*
Post-infection Groups Weight
(weeks) Body (gm) Thymus (mg)
6 Control 28.7 + 2.3 59.8 + 5.9
EtOH 29.1 ± 4.2 65.6 + 4.3
9 Control 30.6 ± 5.0 66.7 + 10.8
EtOH 31.6 + 2.5 68.5 + 13.2
* Values are mean + SD for 6-8 mice for each group. Body and thymus weight of uninfected, normal mouse (diet- and age-matched mice) are 30.2 + 3.2 gm and 52.9 + 2.3 mg, respectively.
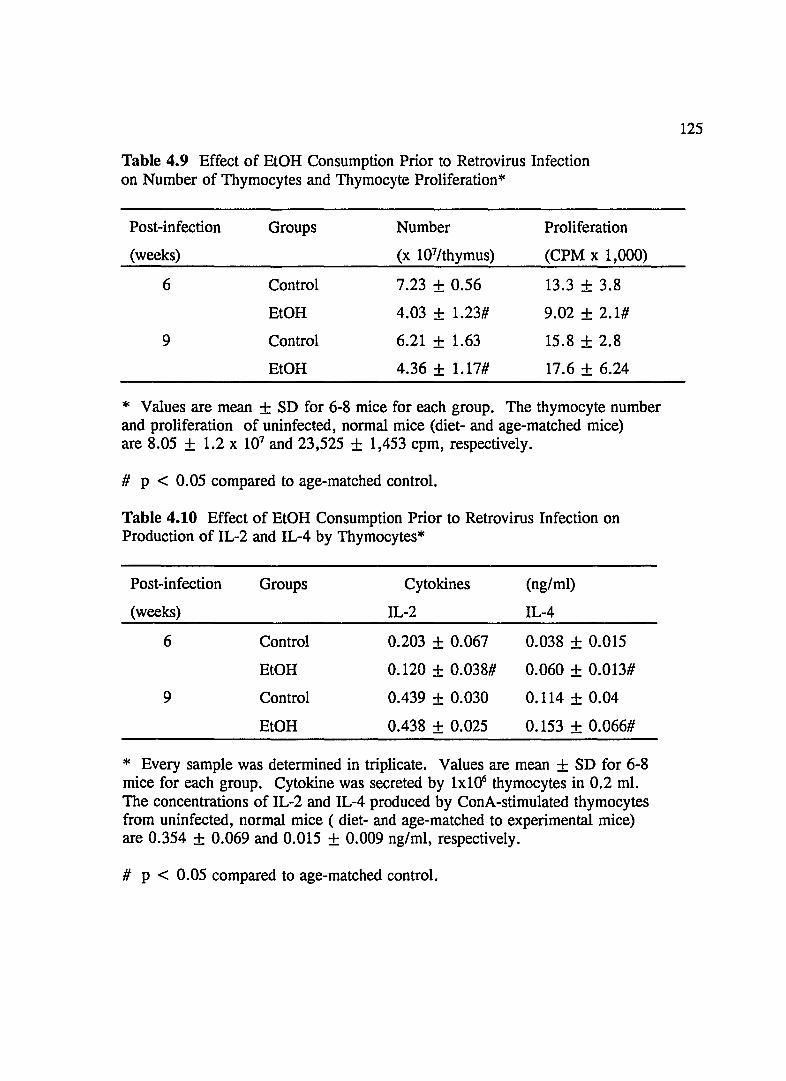
Table 4.9 Effect of EtOH Consumption Prior to Retrovirus Infection on Number of Thymocytes and Thymocyte Proliferation*
Post-infection
(weeks)
6
9
Groups
Control
EtOH
Control
EtOH
Number Proliferation
(x 107/thymus) (CPM x 1,000)
7.23 + 0.56 13.3 + 3.8
4.03 + 1.23# 9.02 + 2.1#
6.21 + 1.63 15.8 + 2.8
4.36 + 1.17# 17.6 + 6.24
* Values are mean ± SD for 6-8 mice for each group. The thymocyte number and proliferation of uninfected, normal mice (diet- and age-matched mice) are 8.05 + 1.2 x 10⁷ and 23,525 + 1,453 cpm, respectively.
# p < 0.05 compared to age-matched control.
Table 4.10 Effect of EtOH Consumption Prior to Retrovirus Infection on Production of IL-2 and IL-4 by Thymocytes*
Post-infection Groups Cytokines (ng/ml)
(weeks) IL-2 IL-4
6 Control 0.203 + 0.067 0.038 + 0.015
EtOH 0.120 + 0.038# 0.060 + 0.013#
9 Control 0.439 + 0.030 0.114 + 0.04
EtOH 0.438 + 0.025 0.153 + 0.066#
* Every sample was determined in triplicate. Values are mean + SD for 6-8 mice for each group. Cytokine was secreted by lxl(Yi thymocytes in 0.2 ml. The concentrations of IL-2 and IL-4 produced by ConA-stimulated thymocytes from uninfected, normal mice ( diet- and age-matched to experimental mice) are 0.354 + 0.069 and 0.015 + 0.009 ng/ml, respectively.
# p < 0.05 compared to age-matched control.
125

Table 4.11 Effect of EtOH Consumption Prior to Retrovirus Infection on Production of IL-6 and IFN--y by Thymocytes*
Post-infection Groups Cytokines (ng/m1)
(weeks) IL-6 IFN--y
6 Control 1.40 + 1.02 1.87 + 0.098
EtOH 0.32 + 0.039# 2.83 + 2.38
9 Control 4.58 + 1.54 6.45 + 2.0
EtOH 4.78 + 1.04 13.1 +9.6
* Every sample was determined in triplicate. Values are mean + SD for 6-8 mice for each group. Cytokine was secreted by 1x1<f thymocytes
126
in 0.2 ml. The concentrations of IL-2 and IL-4 produced by ConA-stimulated thymocytes from uninfected, normal mice ( diet- and age-matched to experimental mice) are 2.50 + 0.42 and 0.560 + 0.023 ng/ml, respectively.
# p < 0.05 compared to age-matched control.

127
20
-0 0 0 ,.-x 10 -:: a. (.)
0 control ETOH Thymocyte Proliferation
20 # P < 0.05
-0 0 o . ..-)( 10 -:: D-O
0
control ETOH
T cell Proliferation 20
-0 0 0 ..-
10 )(
1 1
-:: D-O
0
control ETOH B cell Proliferation
Fig. 4.1 Effects of Dietary EtOH on Splenocyte and Thymocyte Proliferation During Retrovirus Infection. Every sample was determined in triplicate. Values are mean + Sd of 8-10 mice. Proliferation was evaluated with 106 cells in 0.25 ml volume.

-:::a a.. 25 u -c: o ._-- U) tU"'C ~ c: o ca e-U) o ::::J () a c:..c: -I-me
"C
E >.
..c: I-
20
15
10
5
128
D Control EtOH
6 9
Post-I nfection (weeks)
Fig.4.2 Effect of EtOH Consumption Prior to Retrovirus Infection on Con A-Induced Splenic Proliferation. Every sample was determined in triplicate. Values are mean + SD of 10 mice. Thymidine incorporation was evaluated with 1<1 splenocytes in 0.25 ml volume.

-~ a. 25 o -c: .2_ - (/) CO-c '- c: o co ~(/) o ~ (J a c:..c:: -l-
CD -c: "'C
E >.
..c:: l-
20
15
10
5
o
129
D Control
#
#
6 9
Post-I nfection (weeks)
Fig. 4.3 Effect of EtOH Consumption Prior To Retrovirus Infection on LPS-Induced Splenic Proliferation. Every sample was determined in triplicate. Values are mean ± SD of 10 mice. Thymidine incorporation was evaluated with 1(JS splenocytes in 0.25 ml volume.

CHAPTER 5: ALCOHOL CONSUMPTION ALTERS THE NUTRITIONAL
STATUS DURING MURINE AIDS
Abstract
130
As alcohol (BtOH) abusers and AIDS patients have nutritional disorders, the
influence of chronic EtOH consumption (5%, v/v for 10 weeks) on levels of
immunomodulatory nutrients (vitamin A, E, zinc and copper) in the serum, liver, small
intestine, spleen and thymus was determined in murine AIDS. The hepatic levels of
vitamin A, E and zinc in both normal and LP-BM5 retrovirus infected female C56BL/6
mice fed EtOH were significantly reduced compared to controls, whereas the level of
copper in the liver was not affected. Intestinal levels of vitamin A and copper were not
affected by EtOH, whereas vitamin E and zinc were significantly reduced in both normal
mice and those with AIDS fed EtOH. The splenic levels of vitamin A and zinc in the
normal mice were significantly reduced by EtOH compared to controls, but not vitamin
E and copper. All splenic levels of nutrients we measured were reduced in EtOH-fed
mice with AIDS. The levels of vitamin A, E, zinc and copper in the thymus in murine
AIDS were also significantly affected by EtOH consumption. The serum levels of
vitamin A and E in both normal mice and murine AIDS were significantly decreased by
dietary EtOH. These data produced evidence that chronic EtOH can directly aggravate
undernutrition initiated by retrovirus infection. Such EtOH-induced malnutrition in AIDS
may be a cofactor, accelerating development of AIDS via immunosuppression secondary
to nutritional deficiencies.

131
Introduction
A growing number of studies have suggested important links between vitamins
or minerals deficiencies and HIV infection (57). Patients at various stages of mv
disease has serum vitamin A and E deficiencies (63, 95). Serum zinc decreased
progressively with advancing mv disease among 150 patients, compared with 50 HIV
seronegative controls (201). Marginal or substantial zinc deficiency occurs one-quarter
to virtually all of the patients tested (63, 64, 67, 95). The prevalence of copper
deficiency is less clearly set up since there are only two available studies (63, 95). In
animal model for human AIDS, LP-BM5 retrovirus infection has been shown to cause
undernutrition by reducing tissue levels of immunomodulatory nutrients (e.g vitamin A,
E, zinc and copper) in the organs including immune organs during murine AIDS (305).
These findings provide evidence that undernutrition secondary to retrovirus infection seen
in AIDS individuals could play a forceful role in aggravating immune dysfunctions,
rendering the body more susceptible to tumors and opportunistic infections.
EtOH-induced undernutrition could be due to an inadequate and imbalanced intake
of nutrients, maldigestion, and malabsorption, as well as impaired metabolism, decreased
tissue uptake and storage, increased loss of nutrients through the urine, increased
nutritional requirements, or combination of these factors (98, 114). EtOH is transported
throughout the body system giving it the potential to affect most organs and tissues.
EtOH affects the gastrointestinal tract by alterations in stomach acid secretion and
delayed gastric emptying. Alterations in the mucosa of the small intestine reduce
production of enzymes, decrease absorptive capacity, induce malabsorption, and alter

132
transport of nutrients (116). Thus, EtOH intake can affect every stage of nutrient
metabolism including nutrient intake, digestion, absorption, activation , storage,
utilization, degradation and excretion. Therefore, it is conceivable that EtOH
consumption in AIDS can worsen the nutritional status, leading to deeper nutritional
deficiencies in AIDS. However, no direct studies in humans or animals have been
investigated EtOH's detrimental role on nutritional status during AIDS.
The onset of clinical symptoms of AIDS (low CD4 + T cells count and
opportunistic infections) is quite variable among HIV positive patients with a mean
incubation time 3-10 years following seroconversion (306). In this study, we investigated
if chronic EtOH consumption in murine AIDS as a cofactor aggravates undernutrition
initiated by retrovirus infection. The important immunomodulatory nutrients (vitamin A
and E, zinc and copper) in the liver, intestine and serum as well as immune organs
(spleen and thymus) were analyzed in this study.

133
Materials and Methods
Animals and LP-BM5 Retrovirus Infection See Materials and Methods in Ch. 2.
EtOH Diet All mice were fed the National Research Council (NRC) liquid diet (307).
Dietary ingredients were obtained from Dytes (#710279, Bethlehem, PA). All diets were
made isocaIoric by substituting 26% of the total calories with ethanol in the ethanol diet
and with dextrose in the control diet. In previous studies in our lab, we have found that
higher dietary EtOH (e.g. more than 5% v/v) significantly increased mortality of mice,
and lower dietary EtOH (e.g. less than 3% v/v) did not cause significant change in
physiological functions. Therefore, the concentration of EtOH in a NRC liquid diet was
4.5% (v/v) in this study. After 3 weeks housing in the animal facility in the Arizona
Health Sciences Center, mice were randomly assigned to one of the following four
treatments: normal mice with fed control diet, murine AIDS with control diet, normal
mice with EtOH diet, and murine AIDS with EtOH diet. A pair-fed study was
previously performed in our lab, and no difference between the pair-fed group and ad-lib
group was observed in the weight of thymus and spleen, nutritional status (307). Thus,
all diets were provided ad libitum in this study. The average consumed volume of liquid
diet was 12-15 ml for one mouse per day for every treatment. No significant difference
of consumption of the diets and body weight between the four groups was observed (data
not shown). Retrovirus infection and diet treatment began simultaneously. The total
treatment was for 10 weeks. Animals were cared for as required by the University of
Arizona Committee on Animal Research.
Measurement of Tissue Vitamin A and E See Materials and Methods in Ch. 2.

Measurement of Serum Vitamin A and E
134
See Materials and Methods in Ch. 2.
Measurement of Tissue Zinc (Zn) and Copper (Cu)
Ch.2.
See Materials and Methods in
Statistics All parameters were compared using one way ANOV A test, followed two-
tailed t student test for comparison between any two groups. p < 0.05 was considered
significant difference between two groups.

135
Results
Nutrient Concentrations in the Liver EtOH consumption significantly (p < 0.05)
reduced vitamin A and E concentrations in the liver in the uninfected, normal mice
(Table 7.1). In murine AIDS, EtOH further significantly (p < 0.05) decreased them,
which had been significantly (p < 0.05) lessened by retrovirus infection (Table 7.1).
Hepatic Zn concentration was also significantly (p < 0.05) decreased by EtOH ingestion
in both normal mice and those with AIDS, whereas hepatic Cu concentration was not
affected (Table 7.1).
Nutrient Concentrations in the Intestine As shown in Table 7.2, intestinal vitamin E
and Zn levels were significantly (p < 0.05) reduced by EtOH consumption in both
normal mice and those with AIDS, whereas levels of vitamin A and Cu were unaffected.
Nutrient Concentrations in the Spleen Splenic levels of vitamin A and Zn were
significantly (p < 0.05) lessened by EtOH in uninfected, normal mice and during murine
AIDS (Table 7.3), while vitamin E and Cu levels were significantly (p < 0.05) reduced
by EtOH only in murine AIDS. The reduction of splenic nutrients during murine AIDS
was not significantly exacerbated by EtOH consumption (Table 7.3).
Nutrient Concentrations in the Thymus As shown in Table 7.4, thymic levels of vitamin
E, Zn and Cu were significantly (p < 0.05) decreased by EtOH during murine AIDS,
while thymic concentrations of vitamin A and Zn were significantly (p < 0.05) lessened
by EtOH in normal mice. However thymic levels of vitamin E and Cu were not affected
by EtOH in normal mice.
Nutrient Concentrations in the Serum Serum vitamin A and E were significantly (p <
136
0.05) decreased by EtOH in uninfected mice and during murine AIDS (Table 7.5). But
EtOH ingestion did not further reduce serum vitamin A and E levels in murine AIDS,
which had been lessened by retrovirus infection.

137
Discussion
We demonstrated, for the first time, that EtOH consumption in murine AIDS can
aggravate undernutrition initiated by retrovirus infection in some tissues, but not others.
The levels of tissue nutrients were altered by EtOH consumption in normal mice and
during murine AIDS. These findings suggest that EtOH could be an important cofactor
in speeding the development of AIDS disease, via worsening retrovirus-induced
undernutrition in AIDS.
Since some nutrient deficiencies are associated with immune dysfunction,
reduction in tissue concentrations of nutrients can be related to significant
immunosuppression (118, 119). Vitamin A deficiency depresses lymphocyte activation
by mitogens (122). Vitamin A deficiency may decrease antigen binding due to alterations
in surface membrane glycoproteins (123). Vitamin A deficiency in humans has been
found to be associated with an increased incidence of a variety of cancers, and severity
of infection (123). Similar depression of the general immune functions associated with
vitamin E deficiencies have also been observed in both animals and humans. In rats,
depressed antibody-dependent cell mediated cytotoxicity (201), decreased lymphocytes
blastogenesis in response to mitogens (126), and depressed NK cell mediated cytotoxicity
(126) have been reported in vitamin deficient states. In guinea pigs, dietary vitamin E
deficiency depressed spleen T and B lymphocyte responses to mitogens to about 50% of
vitamin E adequate animals (133). The macrophages of these vitamin E deficient guinea
pigs also lacked accessory cell functions and acted only as suppressor cells (206). In
humans, a strong correlation of decreased serum levels of vitamin E and decreased

138
number and metabolic functions of T-Iymphocytes have been shown in athletes (207).
Therefore, the reduced levels of vitamin A and vitamin E in the tissues including immune
organs should exacerbate immune dysfunction initiated by retrovirus infection during
EtOH consumption. These results are in accord with our previous findings that
depressed proliferation of splenic and thymic T cells, and their dysregulated cytokine
production in murine AIDS were aggravated by EtOH consumption (102, 208, 209).
Zinc deficiency has great influence on barrier immunity by causing skin lesions,
gastrointestinal alteration, damage to the microvilli, and impaired pulmonary functions.
Zinc has also an important role in immunocompetence and exerts a crucial regulatory
effect on specific immune functions. Zinc deficiency results in the adverse effects on the
immune system with depression of cell-mediated immunity, decreased T -cells and B-cells
in lymphoid tissue, a depressed response of T-cell to tumor cells, decreased lymphokine
production, reduced antibody response, decreased natural killer cells activity and
depression of thymic hormones (123, 210). Zinc deficiency may be an important
cofactor suppressing T cell responses, especially in HIV infection with its reduction in
T cell number and functions. Fallutz et al. reported that serum zinc concentration
correlated with the lymphoproliferative responses of mononuclear cells to PHA
stimulation and that zinc supplementation augmented this response to PHA in HN
infected patients (219). Reduced numbers of splenic antibody-producing cells and T
cells, reduced proliferation of T and B cells, reduced responsiveness and stimulator
activity of splenic T cells in one-way mixed lymphocyte reaction (219-224), and impaired
cell-mediated immunity have been observed in copper deficient mice (307). Therefore,

139
EtOH-induced nutrient deficiencies of zinc and copper in AIDS could further predispose
HIV -infected patients to more frequent or severe infections. This finding also supports
the notion that EtOH consumption as a cofactor may aggravate the immune dysfunctions
initiated by retrovirus infection via reducing nutrient levels in the tissues. These
evidence concomitantly explain the loss of host resistance to the tumor and opportunistic
infections in murine were exacerbated by EtOH consumption observed by us (225-227).
In conclusion, EtOH ingestion broadly suppresses the various nutrient levels in
the tissues including lymphoid organs as described above, seriously impairing the body's
nutritional status. These disruptions in nutritional status can significantly suppress
immune responses, suggesting the EtOH ingestion could be a potential cofactor in the
progression to AIDS.

140
Table 5.1 Effect of EtOH on Hepatic Nutrient Levels in Murine AIDS*
Groups Nutrients (p.g/g tissue)
EtOH Retrovirus Vitamin A Vitamin E Zinc Copper
962.2± 640.0+ 26.6± 3.1+0. 151.1 123.2 2.6 49
+ 149.0+ 237.3+ 19.5+ 2.65+ 51.1# 84.4# 0.96# 0.31
+ 718.1 + 326.8+ 24.6+ 2.58+ 54.1# 59.8# 1.3 0.3
+ + 107.2+ 173.5+ 19.9+ 2.55+ 38.2#@ 48.6#@ 1.8#@ 0.24
* Values are mean + SD of 6-8 mice. # p < 0.05 compared to the uninfected mice. @ p < 0.05 compared to the infected mice.
Table 5.2 Effect of EtOH on Intestinal Nutrient Levels in Murine AIDS*
Groups Nutrients (p.g/g tissue)
EtOH Retrovirus Vitamin A Vitamin E Zinc Copper
57.1 +2.4 145.2+30.0 53.3+ 6.3+0.4 5.0
+ 66.3+8.3 76.8+17.6# 35.6+ 7.5+ 1.4 6.3#
+ 46.8+6.7# 154.8+46.7 50.3+ 8.5+0.2 5.8
+ + 58.0+5.6 87.0+ 13.0#@ 25.6+ 8.2+ 1.9 9.5#@
* Values are mean + SD of 6-8 mice. # p < 0.05 compared to the uninfected mice. @ p < 0.05 compared to the infected mice.

141
Table 5.3 Effect of EtOH on Splenic Nutrient Levels in Murine AIOS*
Groups Nutrients (p.g/g tissue)
EtOH Retrovirus Vitamin A Vitamin E Zinc Copper
110.7+18.5 67.5+9.9 32.8+ 3.2+ 2.4 0.32
+ 53.9+9.0# 58.6+6.4 24.5+ 2.8+ 1.7# 0.53
+ 50.2+18.8# 47.4+10.9# 21.1+ 1.5+ 1.5# 0.63#
+ + 75.0+16.0# 44.3+9.8# 16.1+ 1.48+ 2.6#@ 0.58#
* Values are mean + SO of 6-8 mice. # p < 0.05 compared to the uninfected mice. @ p < 0.05 compared to the infected mice.
Table 5.4 Effect of EtOH on Thymic Nutrient Levels in Murine AIOS*
Groups Nutrients (p.g/g tissue)
EtOH Retrovirus Vitamin A Vitamin E Zinc Copper
48.6+1.8 84.1 + 11.7 24.1+ 2.03+ 2.3 0.13
+ 37.1+1.2# 90.2+14.5 17.3+ 1.75+ 1.5# 0.26
+ 30.6+4.0# 56.8+13.5# 28.2+ 1.91+ 2.6 0.14
+ + 37.1+2.8# 65.1±6.8# 16.1+ 1.57+ 2.5# 0.3#@
* Values are mean + SO of 6-8 mice. # p < 0.05 compared to the uninfected mice. @ p < 0.05 compared to the infected mice.
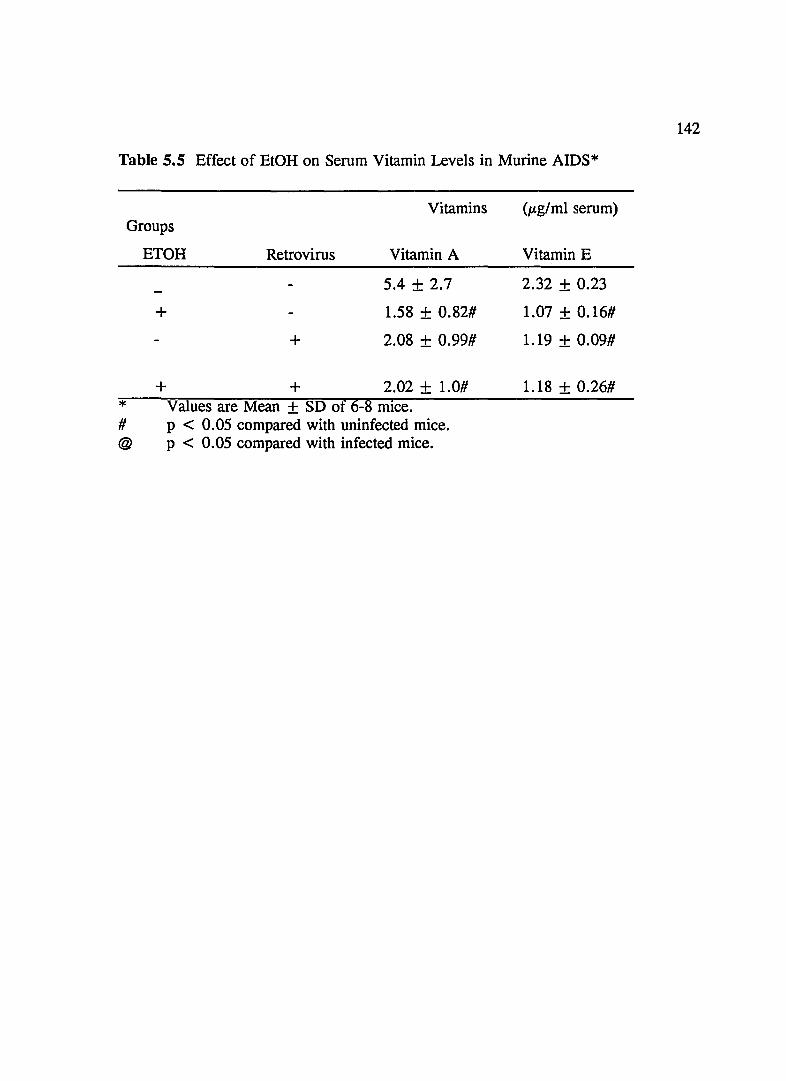
Table 5.5 Effect of EtOH on Serum Vitamin Levels in Murine AIDS*
Groups
ETOH
+
Retrovirus
+
Vitamins
Vitamin A
5.4 + 2.7
1.58 + 0.82#
2.08 + 0.99#
+ + 2.02 + 1.0# * Values are Mean + SD of 6-8 mice. # p < 0.05 compared with uninfected mice. @ p < 0.05 compared with infected mice.
(",g/ml serum)
Vitamin E
2.32 + 0.23
1.07 + 0.16#
1.19 + 0.09#
1.18 + 0.26#
142
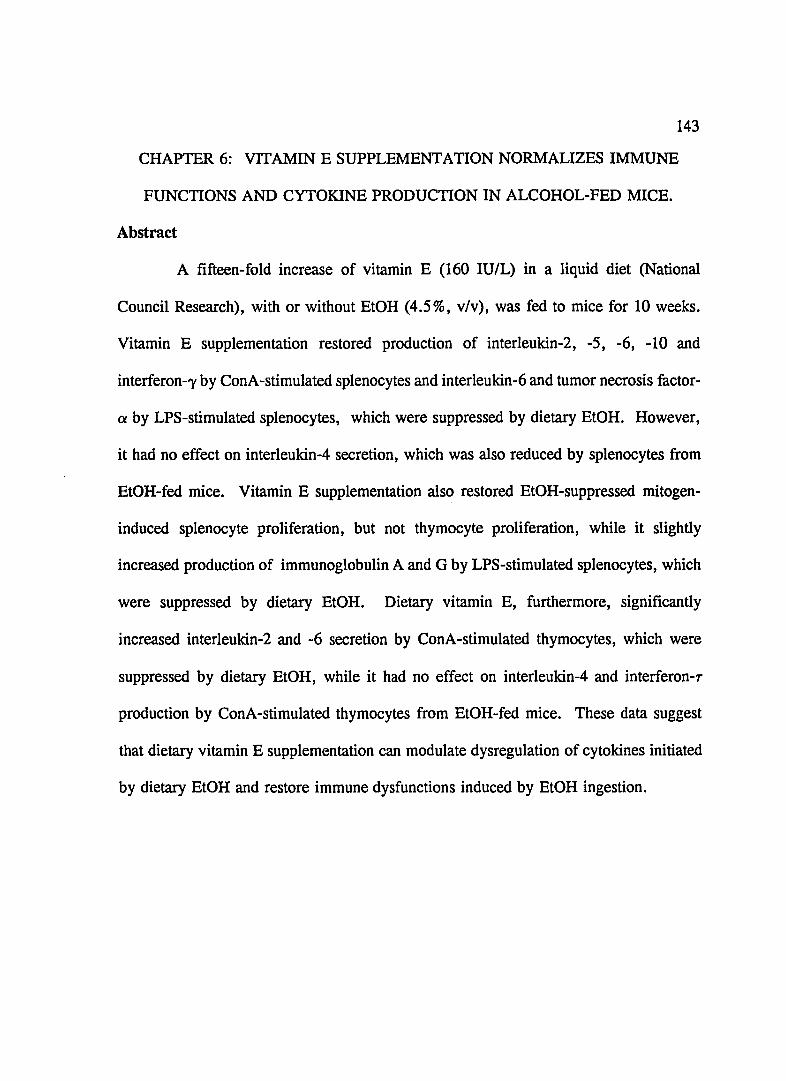
143
CHAPTER 6: VITAMIN E SUPPLEMENTATION NORMALIZES IMMUNE
FUNCTIONS AND CYTOKINE PRODUCTION IN ALCOHOL-FED MICE.
Abstract
A fifteen-fold increase of vitamin E (160 lUlL) in a liquid diet (National
Council Research), with or without EtOH (4.5%, v/v), was fed to mice for 10 weeks.
Vitamin E supplementation restored production of interleukin-2, -5, -6, -10 and
interferon-'Y by ConA-stimulated splenocytes and interleukin-6 and tumor necrosis factor
ex by LPS-stimulated splenocytes, which were suppressed by dietary EtOH. However,
it had no effect on interleukin-4 secretion, which was also reduced by splenocytes from
EtOH-fed mice. Vitamin E supplementation also restored EtOH-suppressed mitogen
induced splenocyte proliferation, but not thymocyte proliferation, while it slightly
increased production of immunoglobulin A and G by LPS-stimulated splenocytes, which
were suppressed by dietary EtOH. Dietary vitamin E, furthermore, significantly
increased interleukin-2 and -6 secretion by ConA-stimulated thymocytes, which were
suppressed by dietary EtOH, while it had no effect on interleukin-4 and interferon-T
production by ConA-stimulated thymocytes from EtOH-fed mice. These data suggest
that dietary vitamin E supplementation can modulate dysregulation of cytokines initiated
by dietary EtOH and restore immune dysfunctions induced by EtOH ingestion.
144
Introduction
Prolonged consumption ofEtOH results in alterations of host defense mechanisms,
ultimately manifested by increasing susceptibility to infectious agents (84). In
experimental animals and humans, EtOH has an inhibitory effect on many aspects of the
immune response (85). A loss in the number of circulating leukocytes has been
associated with EtOH use in humans (86, 87), with detrimental effects on humoral
immune response, including antibody production (88). In addition, EtOH suppresses
several aspects of cell-mediated immunity such as delayed-type hypersensitivity reactions
(86, 88) and lymphocyte proliferative response to mitogens in humans (89). EtOH
administration to animals has a profound effect on decreasing the weight of peripheral
lymphoid organs as measured by a decrease number of thymocytes and splenocytes (91,
228, 308). Mice fed EtOH for a short period of time have shown both normal and
decreased natural killer cell activity (97, 98, 230). Antibody dependent cellular
cytotoxicity (97), lymphocytes proliferation (100), B lymphocyte functions (100, 101) and
cytokine production by lymphoid cells (94, 102) are also impaired by dietary EtOH.
In experimental animals and humans, dietary supplementation of vitamin E has
been associated with increased lymphoproliferative response to mitogens, T-helper
activity, antibody synthesis, neutrophil antimicrobial activity, lymphoblastic cell viability
and macrophage phagocytic activity (160, 308a, 308b). Dietary vitamin E
supplementation also stimulates splenocytes to release valuable cytokines, thereby
enhancing the overall immune response (309). Furthermore, high intakes of vitamin E
improves host resistance to pathogens (155, 310). Our previous finding indicated that

145
vitamin E supplementation in EtOH-fed mice also reduces the size and numbers of
carcinogen-induced tumors, which had been increased by dietary alcohol (135). If the
EtOH-induced immune dysfunction is normalized by vitamin E supplementation, then our
hypothesized mechanism of vitamin E-improved tumor resistance would be further
defined.
The generation of functional T cells from precursors within the thymus involves
several stages of cellular proliferation and differentiation (165, 166). Control of these
processes is mediated by cytokines, hormones, and by interactions with specific elements
of the thymic stroma (167). Thus, EtOH-induced alterations in the numbers of T cell
subsets and their functions as observed in human peripheral blood cells or mouse spleen
cells, could be the consequence of changes at the thymic level, particularly thymocyte
cytokine production. Our recent studies showed that dietary EtOH adversely affects
thymic cytokine secretion, while dietary vitamin E supplementation favorably affects
thymic cytokine release (311). However, nothing is known about the influence of
vitamin E on secretion of cytokines by thymocytes in the EtOH-fed animals or humans.
We have designated this study to investigate if dietary vitamin E supplementation
can normalize EtOH-induced reduction of major regulatory cytokines (lL-2, IL-4, IL-5,
IL-6, IL-lO, IFN--y and TNF-O! by splenocytes and IL-2, IL-4, IL-6 and IFN--y by
thymocytes), and some EtOH-induced immunosuppression including splenocyte and
thymocytes proliferation, immunoglobulin A and G (lg) production.

146
Materials and Methods
Animals Female C57BL\6 mice, 4 weeks old, were obtained from the Charles River
Laboratories Inc. (Wilmington, DE). The mice were housed 4 to a cage, in transparent
plastic cages with stainless steel wire lids. The housing facility was maintained at 20 to
22° C and 60 to 80% relative humidity with the animals exposed to a 12: 12 hr light-dark
cycle. Water and mouse chow (Texlnd, Madison, WI) were provided ad libitum.
Diet and Treatment All mice were fed the National Research Council (NRC) liquid
diet (294). Dietary ingredients were obtained from Dytes (#710279, Bethlehem, PA).
The vitamin E supplemented diet had 150 lUlL d-alpha-tocopherol acetate (Sigma, st.
Louis, MO), which was added to a liquid diet, in addition to the 10.5 lUlL d-alpha
tocopherol acetate contained in the basal liquid diet. All diets were made isocaloric by
substituting 26% of the total calories with ethanol in the ethanol diet and with dextrose
in the control diet. In previous studies in our lab, we have found that higher dietary
EtOH (e.g. more than 5% v/v) significantly increased mortality of mice, and lower
dietary EtOH (e.g. less than 3% v/v) did not cause significant change in immune
functions (312). Therefore, the concentration of EtOH in a NRC liquid diet was 4.5%
(v/v) in this study. After 3 weeks housing in the animal facility in the Arizona Health
Sciences Center, mice were randomly assigned to one of the following four treatments:
untreated but fed liquid diet, liquid diets supplemented with (a) EtOH (4.5% v/v), (b)
Vitamin E (160 U/L) and (c) Vitamin E (160 U/L) + EtOH (4.5%, v/v). Mice were
fed the respective diets for 10 weeks. A pair-fed study was performed in our lab, and
no difference between the pair-fed group and ad-lib group was observed in the weight

147
of thymus and spleen, and some immunoparameters and cytokine secretion (29). Thus,
diets were provided ad libitum in this study. The average consumed volume of liquid
diet was 12-15 ml for one mouse per day for every treatment. No significance difference
of consumption of the diets and body weight between the four groups was observed (data
not shown). Animals were cared for as required by the University of Arizona Committee
on Animal Research.
Standard Cytokines and Their Antibodies See Materials and Methods in Ch. 2.
Preparation of Splenocytes and Thymocytes See Materials and Methods in Ch. 2.
Cytokine Production See Materials and Methods in Ch. 2.
IgA and IgG Production See Materials and Methods in Ch. 2.
ELISA for Cytokine Detection See Materials and Methods in Ch. 2.
ELISA Assays for IgA and IgG See Materials and Methods in Ch. 2.
Mitogenesis of Splenocytes and Thymocytes See Materials and Methods in Ch. 2.
Statistics All parameters were compared at individual time points using one way
ANOV A test, followed by a two-tailed t student test between any two groups. p < 0.05
was considered a significant difference between two groups.

148
Results
Production of IL-2 and IFN--y by Splenocytes As shown in Table 8.1, dietary vitamin
E significantly (p<0.05) enhanced release of IL-2 and IFN--y by ConA-stimulated
splenocytes compared with the controls, and significantly (p < 0.05) restored the secretion
of IL-2 and IFN--y by ConA-stimulated splenocytes, which had been significantly
suppressed by chronic dietary EtOH (p<0.05).
Production of Cytokines by Splenocytes Vitamin E supplementation significantly
(p < 0.05) increased IL-4 production by ConA-stimulated splenocytes compared with the
controls, but not production ofIL-5, IL-6 and IL-lO. The decreased production ofIL-5,
IL-6 and IL-10 by splenocytes from EtOH-fed mice was significantly (p < 0.05) enhanced
by dietary vitamin E supplementation compared to EtOH-fed mice (Table 8.2).
However, dietary vitamin E had no effect on IL-4 secretion, which was significantly
(p<0.05) reduced by dietary EtOH (Table 8.2).
Production of IL-6 and TNF-a by Splenocytes As shown in Table 8.3, vitamin E
supplementation had no effect on the IL-6 and TNF-a production by LPS-stimulated
splenocytes compared to the contrcls. However, the decreased production of IL-6 and
TNF-a by LPS-stimulated splenocytes from EtOH-fed was significantly (p<0.05)
improved by dietary vitamin E supplementation compared to EtOH-fed mice.
IgA and IgG Production As shown in Table 8.4, production of IgA and IgG by LPS
stimulated splenocytes was significantly inhibited by dietary ETOH compared to
controls(p < 0.05). Dietary vitamin E supplementation slightly improved these reduced
the levels of IgA and IgG, but not significantly (p > 0.05). However, vitamin E

149
supplementation did not show any enhancement of IgA and IgG production by
splenocytes compared to the controls.
Mitogenesis of Splenocytes Vitamin E supplementation significantly (p < 0.05) enhanced
the proliferation of ConA and LPS -induced splenocyte (Fig. 8.1 & Fig. 8.2). ConA and
LPS-induced splenocyte proliferations, significantly (p < 0.05) inhibited by dietary EtOH,
were significantly (p < 0.05) increased by dietary vitamin E supplementation (Fig. 1
& Fig. 2).
Production of Cytokines by Thymocytes As shown in Table 8.5, vitamin E
supplementation only significantly affected IL-4 production, but not production of IL-2,
IL-6 and IFN-'Y by ConA-induced thymocytes. However, suppressed secretion of IL-2
and IL-6 by thymocytes from EtOH-fed mice was significantly (p < 0.05) restored by
dietary vitamin E supplementation. No significantly effects of dietary vitamin E on IL-4
and IFN release by thymocytes in EtOH-fed mice were observed.
Mitogenesis of thymocytes Dietary vitamin E supplementation had no significant effect
on thymocyte proliferation from both normal mice and EtOH-fed mice, which was
significantly (p < 0.05) suppressed by dietary EtOH (Fig. 8.3).

150
Discussion
The emphasis of this study has been focused on whether vitamin E
supplementation could offset EtOH-induced suppression of cytokine secretion, which is
a critical factor in immune modulation (23). Our data demonstrates that dietary vitamin
E has a general enhancing effect on in vitro cytokine production by splenocytes and
thymocytes. This discovery has led to a normalization of some immune dysfunctions
induced by EtOH ingestion. It could, in addition, restore host resistance to pathogenic
or opportunistic infection and tumor in the chronic EtOH users (84).
Vitamin E supplementation has been associated with enhancement of the immune
response and increasing resistance to pathogenic infections and tumors in animal models
and humans. In this study, the results indicated that vitamin E supplementation enhanced
production of IL-2, IL-4 and IFN--y, which are the most important cytokines in immune
response, concomitant with the enhancement of mitogenesis of splenocytes. It is not
surprising, therefore, that vitamin E supplementation plays a role in preventing EtOH
induced suppression of immune response. There are a number of mechanisms by which
vitamin E may protect the immune system from EtOH-induced damage. Some
immunological parameters are directly influenced by EtOH ingestion through intervention
by hormonal changes caused by central nervous system effects. For example, EtOH can
increase the levels of prostaglandin (pG) and corticosteroids (158, 159), which are potent
inhibitors of the immune cells' activity, including cytokine release (254). Vitamin E
could decrease its levels (160, 156), thereby enhancing immune response and increasing
host resistance. Some immunological responses could be directly affected by EtOH

151
ingestion via nutrient deficiencies (79, 117), which are well known to be associated with
immune dysfunction (118, 119). For example, deficiencies of hepatic vitamin A, E, and
zinc have been associated with EtOH ingestion (313-315). Vitamin E supplementation
can beneficially improve the hepatic levels of vitamin A , E, and zinc (208), which are
strongly correlated with their levels in the spleen and thymus. Thus dietary vitamin E
can improve secondary malnutrition to EtOH ingestion, thereby favorably affecting
immune response. Some immune cells are directly damaged by dietary EtOH through
free radical and lipid peroxide production. Vitamin E , functioning as antioxidant and
free radical scavenger, can inhibit lipid peroxidation and decrease the burden of free
radicals on immune cells (316). These should prevent immune cells from losing
functions due to reaction with free radical or lipid peroxidation in cell membranes.
Finally, dietary EtOH could directly interfere with cytokine producing cells via altering
transduction and membrane fluidity (237, 238) by increasing an alcohol metabolite:
acetaldehyde (316). Vitamin E, as an essential component of cell membrane, could
directly protect cytokine producing cells from EtOH disturbance via inhibiting the actions
of agents capable of alkylating or forming adduct with lipids in the surface of cell
membranes. Taken together, dietary vitamin E supplementation can help to overcome
tissue deficiencies of nutrients, and restore abnormalities of hormones release, and
modulate cytokine release in EtOH-fed mice, thereby favorably affecting immune
response and host defense.
Cytokines play crucial roles in the immune response. IL-2 is a pivotal cytokine
in the growth and differentiation of T and B cells, and activation of NK cells and

152
lymphokine-activated killer cells (231). IL-2 also can act as a growth and differentiation
factor for B cells and activate macrophages. Stimulation of IL-2 and IFN by vitamin E
may be part of the explanation for vitamin E's increased tumor resistance in EtOH-fed
mice (135). IFN--y plays a key role in T-cell mediated tumor regression (316) by its
anti-proliferative activity. IFN--y has multiple distinct biological activities including anti
viral activity, activating phagocytosis of macrophages and neutrophil cells, cytotoxicity
of NK cells (23). Enhancement of IFN--y by dietary vitamin E in normal mice may be
due to the decrease of immunosuppressive product PG~ by immunocompetent cells
induced by dietary vitamin E (156). PG~ is a potent inhibitor of NK cells (48), a major
source of IFN--y production in vivo (195). In addition. EI-Hag et a1 showed that NK cell
activity was susceptible to oxidative injury by H20 2 (317). Seaman et a1 found that
phorbol ester-mediated suppression of NK cell activity was depressed on release of
reactive oxygen metabolites, especially of H20 2, by monocytes and polymorphonuclear
leukocytes (318). Since dietary vitamin E supplementation decreased H20 2 level (319),
increased NK cell activity in mice fed with vitamin E may be responsible for the
increased level of IFN--y. This idea is strengthened by the demonstration of vitamin E
stimulated NK cell activity in vivo and in vitro (320, 321). Vitamin E functions as an
antioxidant and free radicals scavenger, therefore it may act directly on macrophages in
several ways, including enhancement of receptor expression and reduction of PG~
production. Since PG~ can down regulate MHC molecule expression on macrophage
(322), reduced production of PG~ may be responsible for up-regulation of IL-l , an
inducer of IL-2. Subsequently IL-2 could stimulate the production of other cytokines,
153
including IL-5 and IL-6. IL-5 is a B cell growth factor because of its ability to stimulate
proliferation and antibody production by B cells. IL-5 increases the amount of IgA
secreted by murine splenic B cells (242, 243). IL-6 is a major inducer of terminal
differentiation of B cells into plasma cells. In relation to T cells, IL-6 has been shown
to play an important role in the T cell response to alloantigen and development of
effector T cytotoxicity cells (244). We observed that suppression of T cell proliferation
by chronic dietary EtOH was restored by vitamin E. This could be due to the increased
level of IL-2 and IL-6 induced by vitamin E. Decreased production of IgA and IgG by
LPS-stimulated splenocytes from chronic EtOH-fed mice we observed was slightly
restored by vitamin E, consistent with the vitamin E-induced increased of IL-5 and IL-6
by splenocytes in EtOH-fed mice. Suppressed IL-I0 release by EtOH also was enhanced
by vitamin E, explaining the enhancement of Th2 cytokines (IL-5 and IL-6) and IgA and
IgG production. However, it is still not clear why vitamin E supplementation stimulated
production of IL-2 and IFN-I', not production of IL-5, IL-6 and IL-lO by splenocytes
from normal mice. The possible reason is that vitamin E selectively enhance Thl cell
differentiation, which is responsible for IL-2 and IFN--y production.
The control of generation in functional competent T cells from precursor
population within the thymus was mediated by cytokines (167). In mice, expressing a
human IL-2Ra chain transgene, thymocytes express a nonfunctional murine IL-2R13-
human IL-2Ra heterodimer resulting in the accumulation of T cell precursors in the
thymus and periphery (167). Also, anti-IL-2R a chain antibodies abrogate T cell
development which can be reversed by addition of IL-2 (189). Addition of IL-2 to intact

154
lobes immersed in culture medium promotes the selective outgrowth of T cells expression
'Yo TCR (190). The addition of IL-4 blocks T cell development by reducing the number
of double positive thymocytes (191). The constitutive production of IL-4 in IL-4
transgenic mice also result in the inhibition of double positive thymocytes and mature
peripheral T cell development (192, 193). IL-6 has been shown to promote the
differentiation of Thy-l +IL-2R+ donor thymocytes after intrathymic transfer into
irradiated hosts (194). The vitamin E-induced enhancement of IL-2 and IL-6 by
thymocytes, suppressed by EtOH, may be responsible for the normalization in T cell
subpopulations and differentiation in the thymus after chronic EtOH ingestion (323).
Therefore, the change of cytokine secretion by thymocytes during vitamin E
supplementation in EtOH-fed mice we observed may be responsible for the functional
change of mature T cells in the thymus, contributing the general enhancement of immune
response. It is not clear why vitamin E supplementation selectively reduced IL-4
production by thymocytes. Vitamin E may alter the subpopulations of thymocytes in the
thymus or their functions (e.g. alteration of receptors and signal transduction) via
modulating some thymic hormone production. Possible underlying mechanisms we
propose include: (A) vitamin E supplementation reversing the deficiencies of vitamin A
and E in the thymus initiated by dietary EtOH, which may be essential for T cell
maturation; This notion is supported by our previous finding that dietary vitamin E
significantly normalized EtOH-induced deficiencies of hepatic vitamin A and E levels
(324), which have been strongly corrected with its level in the thymus (325); (B)
Vitamin E supplementation normalized the deficiency of hepatic zinc initiated by dietary

155
EtOH (326), which has been shown to be essential for T cell maturation (327); and (C)
Vitamin E supplementation reduced the level of corticosteroids, which are potent inducers
of thymocyte apoptosis (247). Taken together, abnormalities of T cell maturation by
dietary EtOH in the thymus, could be restored by dietary vitamin E, contributing to a
general enhancement of the immune response.
In summary, dietary vitamin E supplementation in a liquid diet generally caused
marked enhancement in the cytokine production induced by mitogens in vitro by
splenocytes and thymocytes in EtOH-fed mice, concomitant with a general enhancement
of immune response. Our results suggest that the suppressive effects of EtOH on the
immune response could be directly restored by dietary vitamin E supplementation,
thereby increasing host disease resistance to infections and tumors. Although the animal
data should not necessarily be extrapolated to EtOH users, information obtained from
such studies may be potentially transferable or serve as basis for the study of the
immunoenhancing properties of vitamin E in EtOH users.
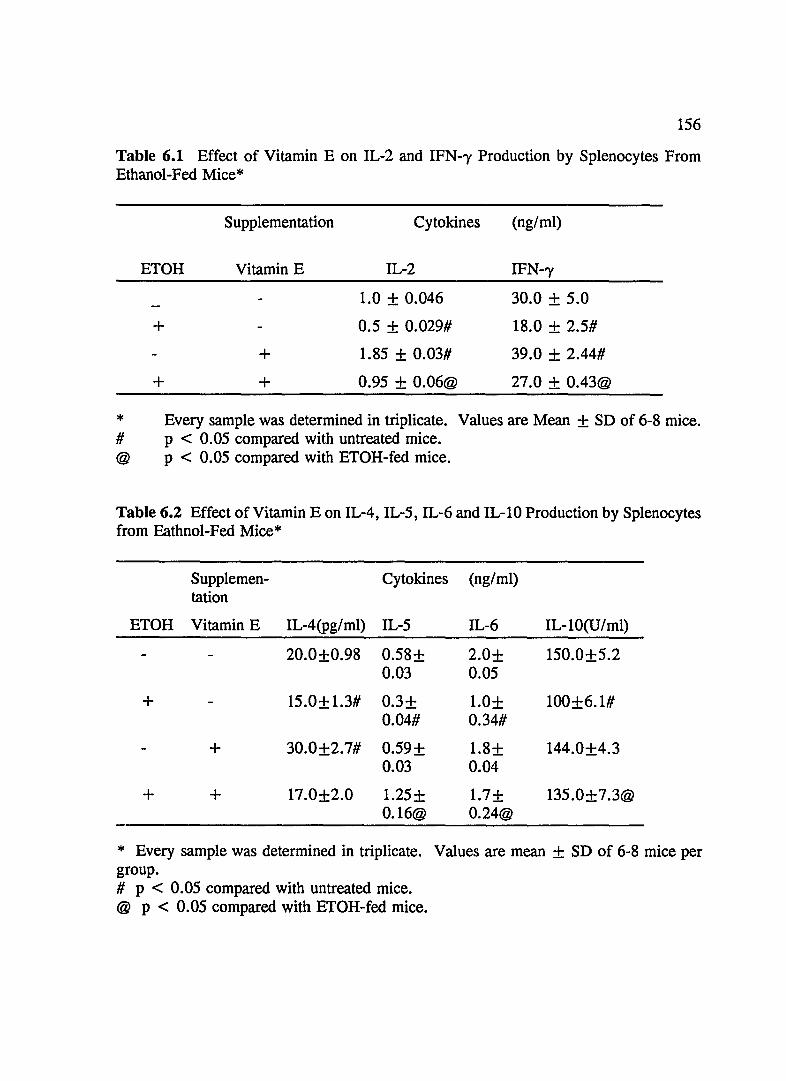
156
Table 6.1 Effect of Vitamin E on IL-2 and IFN--y Production by Splenocytes From Ethanol-Fed Mice*
Supplementation Cytokines (ng/ml)
ETOH
+
+
Vitamin E
+
+
IL-2
1.0 + 0.046
0.5 + 0.029#
1.85 ± 0.03#
0.95 + 0.06@
IFN--y
30.0 + 5.0
18.0 + 2.5#
39.0 + 2.44#
27.0 + 0.43@
* # @
Every sample was determined in triplicate. Values are Mean + SD of 6-8 mice. p < 0.05 compared with untreated mice. p < 0.05 compared with ETOH-fed mice.
Table 6.2 Effect of Vitamin E on IL-4, IL-S, IL-6 and IL-lO Production by Splenocytes from Eathnol-Fed Mice*
Supplemen- Cytokines (ng/ml) tation
ETOH Vitamin E IL-4(pg/ml) IL-S IL-6 IL-lO(U/ml)
20.0+0.98 0.58+ 2.0+ 150.0+5.2 0.03 0.05
+ 15.0+1.3# 0.3± 1.0± 100+6.1# 0.04# 0.34#
+ 30.0±2.7# 0.59+ 1.8+ 144.0+4.3 0.03 0.04
+ + 17.0±2.0 1.2S± 1.7± 13S.0+7.3@ 0.16@ 0.24@
* Every sample was determined in triplicate. Values are mean + SD of 6-8 mice per group. # p < 0.05 compared with untreated mice. @ p < 0.05 compared with ETOH-fed mice.
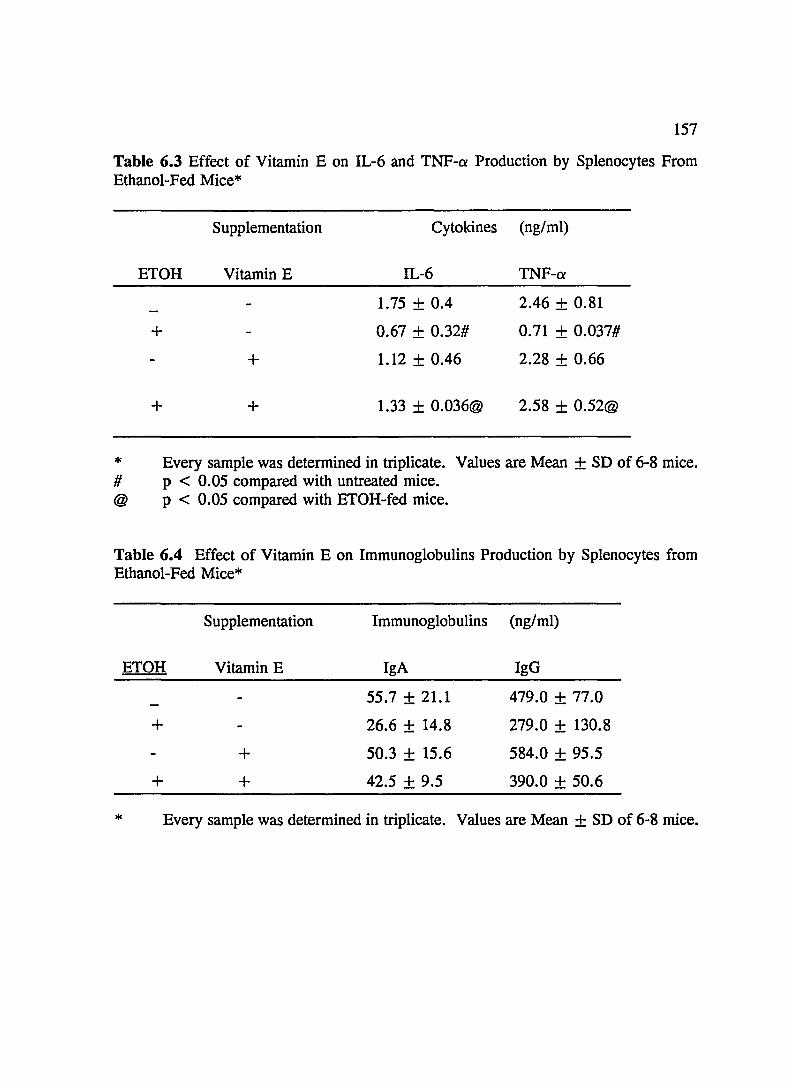
157
Table 6.3 Effect of Vitamin E on IL-6 and TNF-a Production by Splenocytes From Ethanol-Fed Mice*
* # @
Supplementation Cytokines (ng/ml)
ETOH Vitamin E IL-6 TNF-a
1.75 + 0.4 2.46 + 0.81
+ 0.67 + 0.32# 0.71 + 0.037#
+ 1.12 + 0.46 2.28 + 0.66
+ + 1.33 + 0.036@ 2.58 + 0.52@
Every sample was determined in triplicate. Values are Mean + SD of 6-8 mice. p < 0.05 compared with untreated mice. p < 0.05 compared with ETOH-fed mice.
Table 6.4 Effect of Vitamin E on Immunoglobulins Production by Splenocytes from Ethanol-Fed Mice*
*
ETOH
+
+
Supplementation
Vitamin E
+ +
Immunoglobulins (ng/ml)
IgA IgG
55.7 ± 21.1 479.0 + 77.0
26.6 + 14.8 279.0 + 130.8
50.3 ± 15.6 584.0 + 95.5
42.5 + 9.5 390.0 + 50.6
Every sample was determined in triplicate. Values are Mean + SD of 6-8 mice.

158
Table 6.5 Effect of Vitamin E on IL-2, IL-4, IL-6 and IFN--y Production by
Thymocytes from Ethanol-Fed Mice*
Supple- Cytokines (ng/ml) mentation
ETOH Vitamin E IL-2 IL-4 IL-6 IFN--y
0.17+ 0.11+0.09 1.25+ 0.21+0.09 0.04 0.23
+ 0.09+ 0.09+0.06 0.63+ 0.20+0.02 0.01# 0.01#
+ 0.19+ 0.06+0.01# 1.35+ 0.23+0.09 0.01 0.045
+ + 0.12+ 0.10+0.02 1.0+ 0.25+0.09 0.1@ 0.03@
* Every sample was determined in triplicate. Values are mean + SD of 6-8 mice per group. # p < 0.05 compared with untreated mice.
@ p < 0.05 compared with ETOH-fed mice.
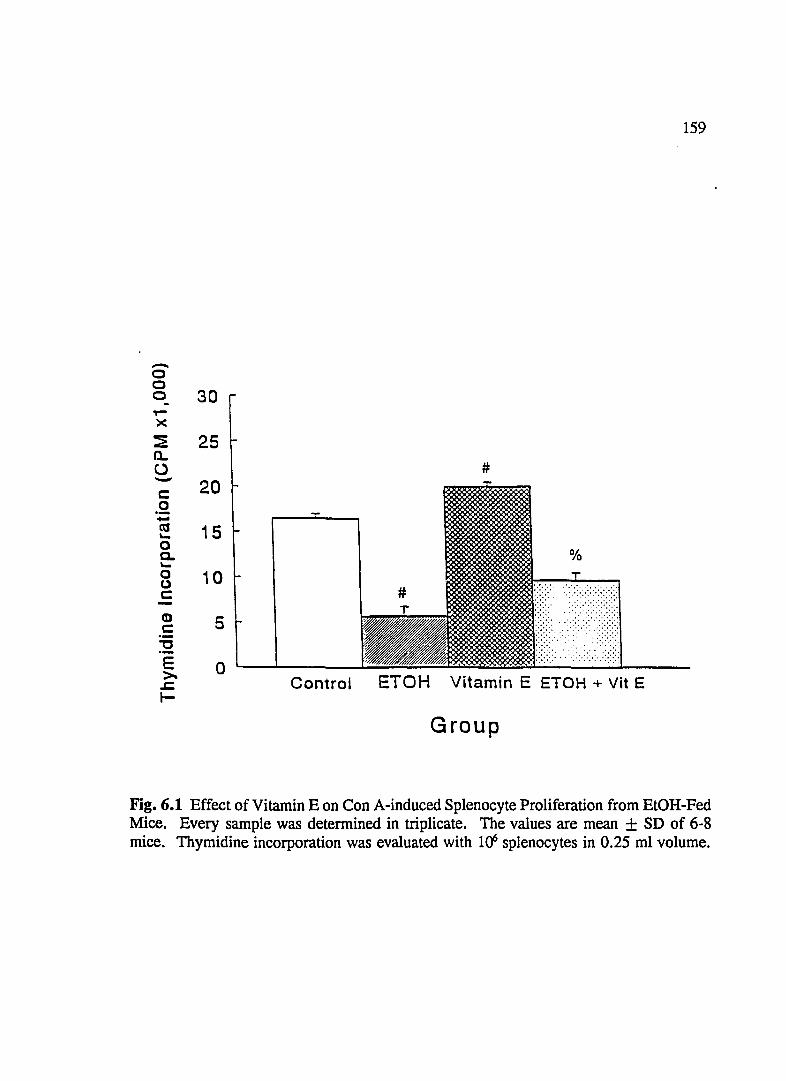
159
-0 0 0 30 .,.-x :E 25 a.. U # - 20 c 0 .--as 15 ~
0 a. ~
0 10 (J C
<D 5 c "C .-E 0 >- Control ETOH Vitamin E ETOH + Vit E ..c .-
Group
Fig. 6.1 Effect of Vitamin E on Con A-induced Splenocyte Proliferation from EtOH-Fed Mice. Every sample was determined in triplicate. The values are mean + SD of 6-8 mice. Thymidine incorporation was evaluated with las splenocytes in 0.25 ml volume.

-o o o· 66 ,.>< E 55 a. o -c o -'" ... o a. ... o o c CD c .-
"C .-E ~ .c I-
44
33
22
11
Control
#
ETOH Vitamin E ETOH+Vit E
Group
160
Fig. 6.2 Effect of Vitamin Eon LPS-Induced Splenocyte Proliferation from EtOH-Fed Mice. Every sample was determined in triplicate. The values are mean + SD of 6-8 mice. Thymidine incorporation was evaluated with 1rf splenocytes in 0.25 ml volume.

-o o o 20 .,.x ::E a.. U -c o
.';:: ca '-o a. '-o Cl C
CD C .-
'"C .-E :>. .c I-
16
12
8
4
o
161
Control ETOH Vitamin E ETOH + Vit E
Group
Fig. 6.3 Effect of Vitamin E on ConA-Induced Thymocyte ProHferation from EtOH-fed mice. Every sample was determined in triplicate. The values are mean + SD of 6-8 mice. Thymidine incorporation was evaluated with 10> thymocytes in 0.25 ml volume.

Abstract
CHAPTER 7: VITAMIN E SUPPLEMENTATION ASSISTS
IN THE RESTORATION OF UNDERNUTRITION AND
IMMUNE DYSFUNCTIONS DURING MURINE AIDS
162
Dietary supplementation, with a fifteen-fold increase of vitamin E (160
International Units/Liter) in a liquid diet, restored concentrations of vitamin A and E in
the liver, intestine, serum, spleen and thymus. It significantly normalized hepatic,
splenic concentrations of zinc and copper. Vitamin E supplementation also partially
restored production of interleukin-2 and interferon--y by splenocytes in vitro, which were
suppressed by murine AIDS. Retrovirus-induced elevated production of interleukin-4,
interleukin-5 and interleukin-6 by splenocytes in vitro was significantly reduced by
dietary vitamin E. Increased levels of interleukin-6, tumor necrosis factor-a and
immunoglobulin A and G produced by splenocytes in vitro during murine AIDS were
also significantly normalized by vitamin E. It also partially restored splenocyte
proliferation and splenic natural killer cell activity. These data indicate that vitamin E
supplementation can help to restore levels of tissue nutrients, cytokine dysregulation and
some immune dysfunctions initiated by retrovirus infection during murine AIDS.

163
Introduction
Acquired immune deficiency syndrome (AIDS) is a clinical disorder in humans
caused by human immunodeficiency virus (HIV) infection. It represents the end point
in a progressive sequence of immunosuppressive changes which render the body highly
susceptible to life-threatening tumors and opportunistic infections. AIDS has been
identified as a major public health priority in the United States with heavy social and
economic impact. Immune and other physiological defects induced by HIV infection
appear to be progressive and irreversible with a high mortality rate that approaches 100
% (328). Therefore, there is a pressing need for valid and effective therapeutic or
preventive interventions in AIDS individuals.
Gastrointestinal dysfunction including diarrhea and malabsorption, is a common
manifestation of the AIDS (200). mv infection may play a pathogenic role in
gastrointestinal cells, deleteriously affecting their nutritional absorption capacities. In
situ hybridization studies have localized HIV infection in various types of epithelial cells
of the bowel mucosa (72, 75). Although the roles of vitamins and minerals in the
clinical manifestation of HIV infection has not been well defined, a growing number of
studies have suggested important links between vitamins or minerals and HIV infection
(57). Patients at various stages of mv disease had serum vitamin A and E deficiencies
(63). A recent study which found that a major percentage of patients with AIDS (50%),
AIDS-related complex (58%) and HIV (38%) had a vitamin E intake of less than 50%
the Recommended Daily Allowance (56). Serum zinc decreased progressively with
advancing mv disease among 150 patients (201). Zinc and copper deficiencies in HIV

164
patients tested were also reported (67). Undernutrition has been associated with
immunological dysfunction, development of infectious processes and vital organ
dysfunctions. Thus, a vicious cycle may be set up in which the underlying
immunological defects related to HIV infection are exacerbated by the immune
dysfunction associated with undernutrition, initiated by retrovirus infection.
The immunostimulatory nature of vitamin E does provide a basis for its use in the
modulation of the various cell components and immune functions, and its consequent
therapeutic use during AIDS. Thus, we investigated if dietary vitamin E supplementation
would normalize undernutrition, cytokine dysregulation and immune dysfunctions
associated with retrovirus infection in murine AIDS. Such a system, with the potential
for the manipulation of immune cells and functions, may also be useful as a model for
clinical trials in humans and eventually for use as a therapy in human AIDS individuals.

165
Materials and Methods
Animals. Female C57BL\6 mice, 5 weeks old, were obtained from the Charles River
Laboratories Inc. (Wilmington, DE). The mice were housed in transparent plastic cages
with stainless steel wire lids with 4 mice per cage. The housing facility was maintained
at 20 to 22° C and 60 to 80% relative humidity, and animals were exposed to a 12:12
hr light-dark cycle. Water and mouse chow (Texland, Madison, WI) were provided ad
libitum. After 2 week housing in the animal facility in the Arizona Health Sciences
Center, mice were then randomly assigned to one of the following four treatments:
control (untreated and uninfected), vitamin E supplemented diet (treated and uninfected),
LP-BM5 infection (untreated and infected), and LP-BM5 infection plus vitamin E
supplemented diet (treated and infected). All diets were provided ad libitum. The
consumed volume of liquid diet was 12-15 x 1O-3L per mice. No significant difference
of consumption of the diets and body weight between four groups was observed (data not
shown). Animals were cared for as required by the University of Arizona Committee
on Animal Research.
Diet and Treatment. All mice were given the National Research Council liquid diet
(294), which meets the nutritional requirement of mice. Dietary ingredients were
obtained from Dytes (#710279, Bethlehem, PA). The vitamin E supplemented diet had
150 International Units (lU)/L of vitamin E as d-alpha-tocopherol acetate (Sigma, St.
Louis, MO) added to liquid diet in addition to the 10.5 lUlL d-alpha-tocopherol acetate
contained in the basal liquid diet. Vitamin E dietary supplementation was initiated the
day of retrovirus infection.
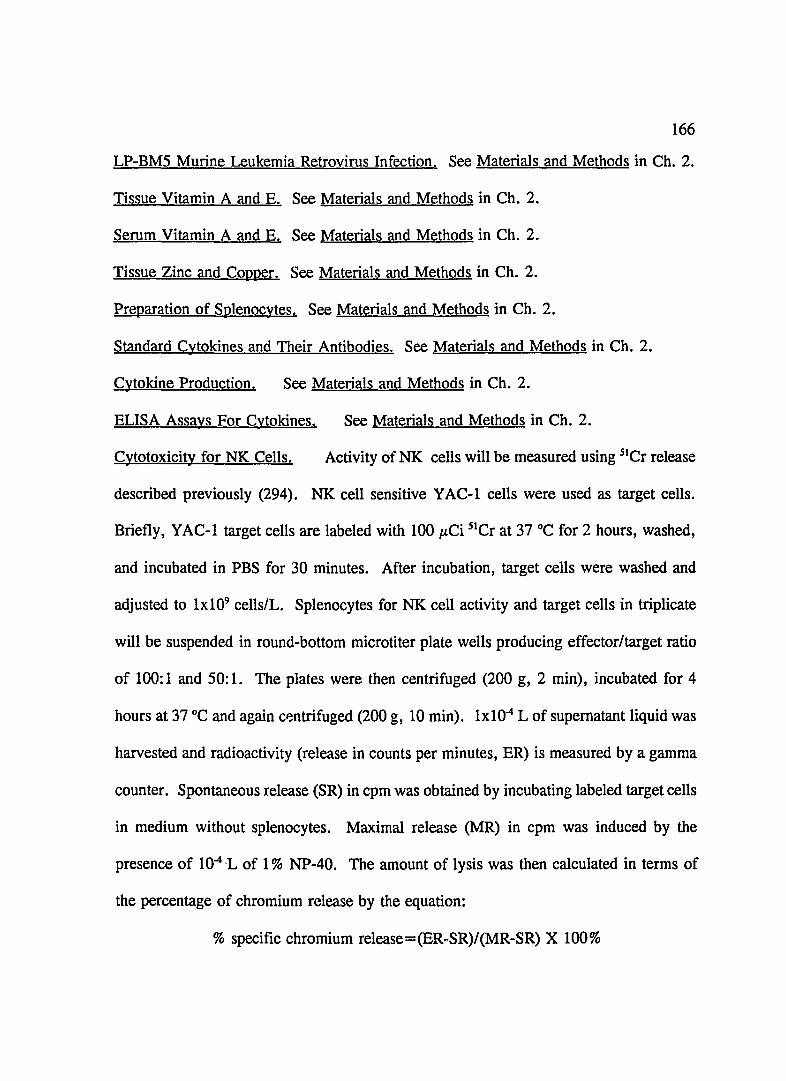
166
LP-BM5 Murine Leukemia Retrovirus Infection. See Materials and Methods in Ch. 2.
Tissue Vitamin A and E. See Materials and Methods in Ch. 2.
Serum Vitamin A and E. See Materials and Methods in Ch. 2.
Tissue Zinc and Copper. See Materials and Methods in Ch. 2.
Preparation of Splenocytes. See Materials and Methods in Ch. 2.
Standard Cytokines and Their Antibodies. See Materials and Methods in Ch. 2.
Cytokine Production. See Materials and Methods in Ch. 2.
ELISA Assays For Cytokines. See Materials and Methods in Ch. 2.
Cytotoxicity for NK Cells. Activity of NK cells will be measured using 51Cr release
described previously (294). NK cell sensitive Y AC-1 cells were used as target cells.
Briefly, YAC-1 target cells are labeled with 100 ILCi 51Cr at 37°C for 2 hours, washed,
and incubated in PBS for 30 minutes. After incubation, target cells were washed and
adjusted to 1x10⁹ cells/L. Splenocytes for NK cell activity and target cells in triplicate
will be suspended in round-bottom microtiter plate wells producing effector/target ratio
of 100: 1 and 50: 1. The plates were then centrifuged (200 g, 2 min), incubated for 4
hours at 37°C and again c~ntrifuged (200 g, 10 min). 1x10⁴ L of supernatant liquid was
harvested and radioactivity (release in counts per minutes, ER) is measured by a gamma
counter. Spontaneous release (SR) in cpm was obtained by incubating labeled target cells
in medium without splenocytes. Maximal release (MR) in cpm was induced by the
presence of 104 'L of 1 % NP-40. The amount of lysis was then calculated in terms of
the percentage of chromium release by the equation:
% specific chromium release=(ER-SR)/(MR-SR) X 100%

167
Mitogenesis of Splenocytes. See Materials and Methods in Ch. 2.
Preparation of IgA and IgG . See Materials and Methods in Ch. 2.
Statistics. All parameters were compared between four groups using one way
ANOV A, followed by two-tailed student t test between any two groups. p < 0.05 was
considered significant difference between two groups.

168
Results
Hepatic levels of Nutrients. Zn level in the liver was not affected by retrovirus
infection, whereas levels of vitamin A, E and eu were significantly (p < 0.05) reduced
(Table 7.1). Vitamin E supplementation significantly (p<0.05) increased the hepatic
levels of vitamin A and E and hepatic concentrations of Zn and eu in retrovirus-infected
mice (Table 7.1). It had no effect on the hepatic levels of Zn and eu in uninfected mice,
while significantly (p<0.05) increasing hepatic concentrations of vitamin A and E (Table
7.1).
Intestinal Levels of Nutrients. Intestinal levels of vitamin A and E were significantly
(p < 0.05) reduced by the retrovirus infection, whereas the Zn and eu concentrations
were not affected (Table 7.2). Vitamin E supplementation significantly (p<0.05)
increased the intestinal concentration of vitamin E in the retrovirus-infected mice, but it
had no effect on intestinal concentrations of vitamin A and Zn in the uninfected mice and
infected mice (Table 7.2).
Splenic Levels of Nutrients. The levels of vitamin A, E and Zn in the spleen were
significantly (p < 0.05) decreased by retrovirus infection, whereas eu level was
significantly (p<0.05) elevated in the infected mice (Table 7.3). Vitamin E
supplementation significantly (p < 0.05) normalized all splenic levels of nutrients (Table
7.3).
Thymic Levels of Nutrients. The levels of vitamin A, E in the thymus were
significantly (p<0.05) lessened by retrovirus infection (Table 7.4). Vitamin E
supplementation significantly (p < 0.05) normalized thymic vitamin A and E

169
concentrations (Table 7.4).
Serum Levels of Vitamin A and E. Serum vitamin A and E levels were significantly
(p<0.05) reduced by retrovirus infection (Table 7.5). Vitamin E significantly (p<0.05)
increased the serum levels of vitamin E in the retrovirus-infected mice (Table 7.5),
whereas serum vitamin A was not affected by vitamin E.
Production of IL-2 and IFN-=y. IL-2 and IFN--y are secreted by Thl cells, and modulate
cell-mediated immunity against virus infection. Dietary vitamin E supplementation
significantly (p < 0.05) increased release of IL-2 and IFN--y by splenocytes from
uninfected mice (Table 7.6). Production of IL-2 and IFN--y by splenocytes, suppressed
by retrovirus infection, was significantly (p < 0.05) restored by vitamin E
supplementation (Table 7.6). These results are in according with the enhancement of
Con A-induced T cell proliferation and NK cell activity in the spleen (Fig. 7.1 & 7.2).
Production of IL-4. IL-5 and IL-6. IL-4, IL-5 and IL-6 are produced by Th2 cells, and
modulate humoral responses. Release of IL-4 by splenocytes from uninfected mice was
significantly (p< 0.05) enhanced by dietary vitamin E (Table 7.7), whereas IL-5 and IL-
6 secretion was not affected by vitamin E (Table 7.7). While murine AIDS elevated IL-
4, IL-5 and IL-6 secretion, vitamin E significantly (p<0.05) decreased them (Table 7.7).
Production of IL-6 and TNF-a. Production of IL-6 and TNF-a by LPS-stimulated
splenocytes could be released by macrophages and B cells. Vitamin E supplementation
did not affect on IL-6 and TNF-a production by LPS-stimulated splenocytes in the
uninfected mice, while it significantly (p < 0.05) reduced their levels, which were
elevated by retrovirus infection (Table 7.8).
170
NK Cell Activity. Vitamin E supplementation had no effect on the splenic NK cell
activity in uninfected mice, while it significantly (p<0.05) restored the decreased NK
cell activity induced by retrovirus infection at a ratio of effectors/target cells: 100: 1 and
50:1 (Fig 7.1).
Mitogenesis of Splenocytes. Proliferation of ConA- and LPS-induced splenocytes was
significantly increased (p < 0.05) by dietary vitamin E, whereas suppressed T and B cell
proliferation in the spleen induced by retrovirus infection was significantly (p < 0.05)
restored by vitamin E supplementation (Fig 7.2 & 7.3).
Production of IgA and IgG. Vitamin E supplemental diet had no effect on IgA and IgG
production by LPS-induced splenocytes in the uninfected mice (Table 7.9). However,
increased IgA and IgG levels induced by retrovirus infection were significantly (p < 0.05)
reduced by vitamin E (Table 7.9).

171
Discussion
The present study investigated the effects of supplemental vitamin E during
murine AIDS on nutrients levels, cytokine secretion by splenocytes, and immune
functions. Increased dietary vitamin E normalized concentrations of vitamin A, E , zinc
and copper in the tissues, which were either reduced or elevated by murine AIDS. It
partially restored secretion of IL-2 and IFN-'Y, mitogenesis of splenocytes, and NK cell
activity, which were suppressed by retrovirus infection. Vitamin E treatment reduced
levels of IL-4, IL-5, IL-6 and TNF-a, which had been elevated by retrovirus infection.
These results suggest a possible role for vitamin E as a potential therapeutic nutrient to
help normalize undernutrition and immune dysfunction caused by retrovirus infection in
AIDS patients.
Vitamin A and E deficiencies have also been associated with suppression of
immune responses and loss of disease resistance. Vitamin A deficiency depresses
lymphocyte activation by mitogen in rats, and leads to a depletion of mature T-cells from
the spleen. Repletion with retinoic acid results in a rapid increase in the peripheral
lymphocyte count (119). In rats, depressed antibody-dependent cell mediated
cytotoxicity, decreased lymphocytes blastogenesis in response to mitogens, and depressed
NK cell mediated cytotoxicity have been reported in vitamin E deficient states. In
humans, a strong correlation of decreased serum levels of vitamin E and decreased
number and metabolic functions ofT cells have been shown (Odeleye and Watson 1991).
Therefore, deficiencies of vitamin A and E in immune organs would be expected to
partly contribute to the immune dysfunctions seen in murine AIDS: depressed

172
proliferation of T and B cells form spleen and mesenteric lymph nodes, impaired
cytotoxicity of splenic NK cell, and dysregulated cytokine production by lymphocytes
from spleen and mesenteric lymph node observed (208). Thus, vitamin E
supplementation in AIDS may enhance immune response in part via normalizing
nutritional status in the immune organs or tissues.
Zinc has an important role in immunocompetence and exerts a crucial regulatory
effect on specific immune functions. Zinc deficiency results in the adverse effects on the
immune system of a depression of cell-mediated immunity with decreased T -cells and B
cells in lymphoid tissue, decreased T -helper cell number and activity, an inverted ratio
of T -helper to T -suppressor cells, a depressed response of T-cell to tumor cells,
decreased lymphokine production, decreased production of cytotoxic T cells, reduced
antibody response, and decreased NK cells activity (128). Serum zinc concentration
correlated with the lymphoproliferative responses of mononuclear cells to mitogen
stimulation and that zinc supplementation augmented this response to mitogen in mv
infected patients (201). Copper deficiency has also been shown to be involved in
immune dysfunctions and defects of host defense. Reduced numbers of splenic
antibody-producing cells and T cells, reduced proliferation of T and B cells, and reduced
responsiveness and stimulator activity of splenic T cells in one-way mixed lymphocyte
reaction have been observed in copper deficient mice (330). Therefore, zinc and copper
deficiencies in AIDS could further predispose HIV -infected patients to more frequent or
severe infections. Such nutritional changes may help explain the loss of host resistance
to the tumor and opportunistic infections observed in murine AIDS (225-227). Thus,

173
vitamin E supplementation may help normalize host defenses via reversing zinc and
copper deficiencies in AIDS. It is not clear, however, why zinc level in the thymus and
level of copper in the spleen were elevated by retrovirus infection during murine AIDS.
They may reflect another kind of pathological symptom of AIDS as these nutrient
deficiencies in other tissues, possible originating from an abnormal pathway of their
absorption into the body. Clearly, murine retrovirus infection caused deficiencies of
nutrients, which play important roles in normal immune functions and antioxidant
activities.
Oxidants such as superoxide radicals, hydrogen peroxides, hydroxyl radicals, and
lipid peroxides play an important role in AIDS (337). TNF-a generates oxidants from
neutrophils at concentrations as low as 0.5 ng/ml (338). TNF-a levels are elevated in
the serum of HIV patients and murine AIDS, and thus TNF-a may use oxidative stress
as a second messenger. Oxidants can induce the expression ofHIV in human T cell lines
by activating transcription of NF-kB (339,340). Thus vitamin E, as an antioxidant, may
block activation of NF-kB via offsetting the oxidative stress, and reducing TNF-a level,
thereby inhibiting HIV replication and retarding the progression to AIDS. A unique
feature of the retrovirus is its persistence in a quiescent state, prior to activation, without
production of either viral mRNA or proteins. Vitamin E, which lowers oxidative stress,
may potentially inhibit retrovirus replication, keep retrovirus in a quiescent state, and
retard the progression to AIDS. Indeed, our previous results indicated that vitamin E
supplementation significantly reduced free radicals and hepatic lipid peroxidation, which
were enhanced by retrovirus infection in murine AIDS (225).

174
IFN-,}, has multiple distinct biological activity including anti-viral activity,
activating phagocytosis of macrophages and neutrophils and increasing cytotoxicity of NK
cells (231). Thus, stimulation of IFN-,}, production by vitamin E may explain vitamin
E's increased tumor resistance (225). IFN-'}' plays a key role in T-cell mediated tumor
regression (341) by its anti-proliferative activity of tumor cells. Enhancement of IFN-'}'
production by dietary vitamin E in normal mice may be due to the d~reased production
of immunosuppressive prostaglandin Hz (PG) by immunocompetent cells (156). PGHz
is a potent inhibitor of NK cells (148, 341), a major source of IFN-,}, production. Since
NK cell activity is susceptible to oxidative injury by H20 2 (342), and vitamin E
supplementation decreased H20 2 level (343), increased NK cell activity and IFN--y
production in mice fed vitamin E was expected.
Our murine AIDS studies imply that vitamin E supplementation acts on various
immune components to modify immune defects induced by retrovirus infection, and
effectively normalize the other important nutrient deficiencies initiated by retrovirus
infection in the immune organs. Thus, the combination of existing medical therapy with
nutritional supplementation may provide successful and novel therapeutic approaches for
treatment of HIV infected individuals. Although our animal data may not totally be
extrapolated to HIV -positive humans, information obtained from such studies using
murine AIDS may potentially serve as a basis for the study of immunoenhancing
properties of vitamin E in HIV -infected humans.

175
Table 7.1 Effect of Vitamin E on Hepatic Nutritional Levels During Retrovirus Infection*
Treatment Vitamins (p.g/g tissue) Minerals
Vitamin E Retroviurs Retinol Tocopherol Zinc Copper
886.1+ 66.8+7.9 84.6+ 18.8+ 108 5.5 2.1
+ 1180+ 87.4+7.7# 88.2± 16.9+ 303# 6.0 2.7
+ 678+ 23.0+7.2# 98.9+ 16.1+ 97.5# 17.2 2.3
+ + 1446+ 73.5+6.8$ 129+ 22+ 135$ 13.1$ 2.7$
* Values are SD + of 6-8 mice. # P < 0.05 compared to uninfected mice. $ p < 0.05 compared to retrovirus-infected mice.
Table 7.2 Effect of Vitamin E on Intestinal Nutritional Levels During Retrovirus Infection *
Treatment Vitamins (p.g/g tissue) Minerals
Vitamin E Retroviurs Retinol Tocopherol Zinc Copper
66.6± 55.2+5.4 54.7+ 5.9+ 5.1 9.1 1.2
+ 60.4+ 51.3+6.0 63.5+ 9.1+ 16.9 11.4 1.7
+ 50.6± 44.0±4.8# 56.1± 7.8+ 4.4# 9.2 2.4
+ + 49.6+ 56.7+3.9$ 74.8+ 9.2+ 15.5 8.9 1.4
* Values are SD + of 6-8 mice. # P < 0.05 compared to uninfected mice. $ p < 0.05 compared to retrovirus-infected mice.
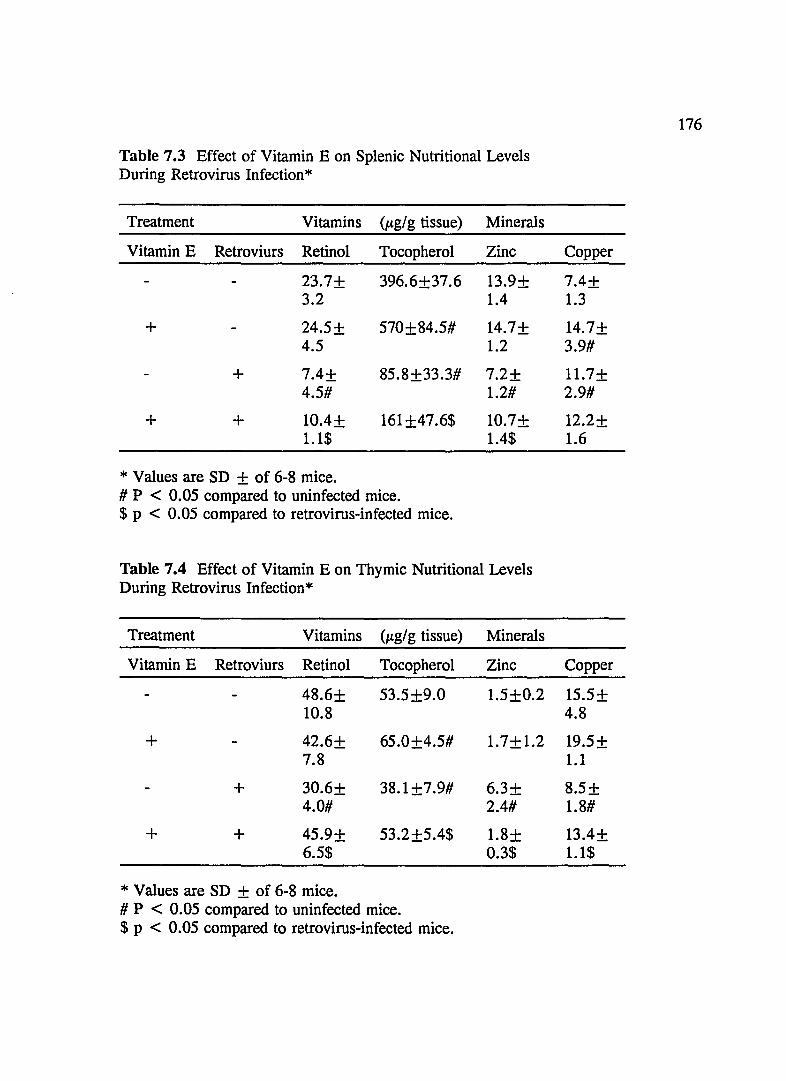
176
Table 7.3 Effect of Vitamin E on Splenic Nutritional Levels During Retrovirus Infection *
Treatment Vitamins (p.g/g tissue) Minerals
Vitamin E Retroviurs Retinol Tocopherol Zinc Copper
23.7+ 396.6+37.6 13.9+ 7.4+ 3.2 1.4 1.3
+ 24.5+ 570+84.5# 14.7+ 14.7+ 4.5 1.2 3.9#
+ 7.4± 85.8+33.3# 7.2+ 11.7+ 4.5# 1.2# 2.9#
+ + 1O.4± 161±47.6$ 10.7+ 12.2± 1.1$ 1.4$ 1.6
* Values are SD + of 6-8 mice. # P < 0.05 compared to uninfected mice. $ p < 0.05 compared to retrovirus-infected mice.
Table 7.4 Effect of Vitamin E on Thymic Nutritional Levels During Retrovirus Infection*
Treatment Vitamins (p.g/g tissue) Minerals
Vitamin E Retroviurs Retinol Tocopherol Zinc Copper
48.6± 53.5+9.0 1.5±0.2 15.5+ 10.8 4.8
+ 42.6+ 65.0+4.5# 1.7+ 1.2 19.5+ 7.8 1.1
+ 30.6+ 38.1+7.9# 6.3+ 8.5+ 4.0# 2.4# 1.8#
+ + 45.9± 53.2+5.4$ 1.8± 13.4+ 6.5$ 0.3$ 1.1$
* Values are SD + of 6-8 mice. # P < 0.05 compared to uninfected mice. $ p < 0.05 compared to retrovirus-infected mice.

Table 7.5 Effect of Vitamin E on Serum Vitamin Levels During Retrovirus Infection *
Treatment Vitamins (j.tg/ml)
Vitamin E Retroviurs Retinol Tocopherol
2.0±0.4 1.2±0.5
+ 1.9+0.3 3.3+0.9#
+ 1.3+0.5# 0.72+0.1#
+ + 1.4+0.6 2.1+0.6$
* Values are SD + of 6-8 mice. # P < 0.05 compared to uninfected mice. $ p < 0.05 compared to retrovirus-infected mice.
Table 7.6 Effect of Vitamin E on Production of IL-2 and IFN--y During Retrovirus Infection*
Treatment Cytokines (ng/ml)
Vitamin E Retroviurs IL-2 IFN--y
0.50+0.03 15.0+1.9
+ 1.0±0.06# 29.0±2.4#
+ 0.02+0.001# 1.05+0.1#
+ + 0.35+0.03$ 18 +0.94$
* Values are SD + of 6-8 mice. # P < 0.05 compared to uninfected mice. $ p < 0.05 compared to retrovirus-infected mice.
177

Table 7.7 Effect of Vitamin E on Production of IL-4, IL-S and IL-6 During Retrovirus Infection*
Treatment Cytokines (ng/ml)
Vitamin E Retroviurs IL-4 IL-S IL-6
0.02+0.001 0.S8+0.03 2.1+0.0S
+ 0.03+0.001# 0.S9+0.033 1.8+0.08
+ 0.031 +0.001# 2.4+0.1S# 3.4+0.13#
+ + 0.017+0.002$ 0.4+0.012$ 2.3+0.13$
* Values are SD + of 6-8 mice. # P < O.OS compared to uninfected mice. $ p < O.OS compared to retrovirus-infected mice.
Table 7.S Effect of Vitamin E on Production of IL-6 and TNF-a During Retrovirus Infection *
Treatment Cytokines (ng/ml)
Vitamin E Retroviurs IL-6 TNF-a
20.S+3.2S 2.S2+0.89
+ 21.S+2.4 2.73+0.32
+ 32.4±4.32# 4.S1+0.S6#
+ + 24.S±I.S2$ 3.21 +0.089$
* Values are SD + of 6-8 mice. # P < O.OS compared to uninfected mice. $ p < O.OS compared to retrovirus-infected mice.
178

Table 7.9 Effect of Vitamin E on Immunoglobulin Production During Retrovirus Infection *
Treatment Immunoglobulin
Vitamin E Retrovirus IgA(ng/ml) IgG(~g/ml)
44.S±20.3 3.6+0.3
+ 40.0+1S.1 3.6+0.3
+ 16S+43.7# 24.5+9.9#
+ + 110.0+S.0$ 13.S+1I3$
* Values are SD + of 6-8 mice. # P < O.OS compared to uninfected mice. $ p < O.OS compared to retrovirus-infected mice.
179

o Control
60
-~ -~ 40 ~ .....
CJ ..... ~ 0 ~
0 ~
~ 20 U ~ Z
o L-..l.-_
-Vitamin E
100:1
Retrovirus
~ ~
Control Vitamin E
b
50:1
Ratiu of Effectors/Target Cells
180
Fig. 7.1 Effect of Vitamin E on NK Cell Activity During Retrovirus Infection. Bars are represented as mean + SD of 6-8 mice.
a p < 0.05 compared to uninfected mice b P < 0.05 compared to retrovirus-infected mice.

181
- 30 ~ ~ a U -.-== Q .... - 20 .... CIl ="0 &.. == Q = c..
CIl
&.. = Q Q CJ,.e: ~~ 10 ~-.-
== .... "0 .... S ~
,.e: ~ 0
Control Vitamin E Control Vitamin E
Retrovirus Treatments
Fig. 7.2 Effect of Vitamin E on eonA-Induced Splenocyte Proliferation During Retrovirus Infection. Every sample was determined in triplicate. Bars are represented as mean + SD of 6-8 mice. The proliferation was evaluated in 0.2 ml with l(r splenocytes.
a p < 0.05 compared to uninfected mice b P < 0.05 compared to retrovirus-infected mice.

15
10
5
o
a
Control Vitamin E Control Vitamin E
Retrovirus Treatments
182
Fig. 7.3 Effect of Vitamin E on LPS-induced Splenocyte Proliferation During Retrovirus Infection. Every sample was determined in triplicate. Bars are represented as mean + SD of 6-8 mice. The proliferation was evaluated in 0.2 ml with las splenocytes.
a p < 0.05 compared to uninfected mice b P < 0.05 compared to retrovirus-infected mice.
183
CHAPTER 8: ALTERATION OF KINETICS OF CYTOKINE
PRODUCTION BY VITAMIN E SUPPLEMENTATION DURING MURINE AIDS
Abstract
Dietary supplementation, with a IS-fold increase of vitamin E (160 IU/L) in a
liquid diet, normalized hepatic and serum levels of vitamin E, reduced by retrovirus
infection at 4 and 12 weeks post-infection. Vitamin E significantly dwindled
splenomegaly induced by retrovirus infection, while significantly restoring levels ofIL-2
and IFN-'Y produced by ConA-stimulated splenocytes at 4, 8 and 12 weeks post-infection,
respectively, suppressed by murine AIDS. Retrovirus infection elevated levels of IL-4,
IL-S and IL-6 produced by ConA-stimulated splenocytes, which were significantly
normalized by dietary vitamin E supplementation at 4, 8 and 12 weeks post-infection,
respectively. Levels of IL-6, TNF-~ and IgG produced by LPS-stimulated splenocytes
during progression to murine AIDS were also significantly normalized by vitamin Eat
4, 8 and 12 weeks post-infection, respectively. Vitamin E supplementation also restored
retrovirus-suppressed splenocyte proliferation at 8 and 12 weeks post-infection,
respectively. Vitamin E modulated IL-2 production by thymocytes in both uninfected
mice and retrovirus-infected mice. It significantly reduced level of IL-4 secretion by
thymocytes in the uninfected mice at 4 and 8 weeks, but not at 12 and 16 weeks. It also
significantly reduced IL-4 production by thymocytes, elevated by the retrovirus infection.
Vitamin E significantly reduced IL-6 and IFN-'Y production by thymocytes increased in
the murine AIDS. The effects of dietary vitamin E on conA-induced proliferation of
thymocytes were consistent with the finding on changes of IL-2 secretion. No effects of

184
dietary vitamin E on thymus weight were observed in both uninfected and retrovirus-
infected mice, whereas vitamin E significantly increased serum and thymic vitamin E
concentration, which had been reduced by retrovirus infection. These data indicate that
dietary vitamin E supplementation can overcome lowered levels of vitamin E, and
modulate cytokine release, normalize immune dysfunctions during progression to murine
AIDS, thereby favorably affecting host resistance. These changes help to explain
restoration of cancer resistance in murine AIDS by vitamin E.
185
Introduction
AIDS therapies involve pharmacological interventions (e.g. Ganciclovir and
Zidovudine, AZT) to inhibit HIV replication (161). However, these drugs are
accompanied by deleterious toxic side effects. For example, Ganciclovir toxicities
include bone marrow suppression, atrophy of the gastrointestinal tract mucosa and
inhibition of spermatogenesis, nausea, vomiting, reduced white blood cell count and
headaches. These anti-HIV drugs do not repair damaged immune functions caused by
retrovirus infection. Furthermore, a strain of AZT -resistant HIV was reported in human
individuals possible due to the use of high dose and prolonged use of AZT (162). Thus,
new strategies including specific dietary nutrient supplementation with immunoenhancing
activity could provide supplemental approaches to ameliorate damaged immune system
in infected individuals, eventually slowing the progression to AIDS. The combination
of existing medical therapy with nutritional supplementation may provide much successful
and novel therapeutic approaches for treatment of HIV infected individuals.
The role of vitamin E in the clinical manifestation of HIV has not been well
defined (56). Some patients with varying stages of HIV infection had low plasma levels
of vitamin E (63). Thus, vitamin E supplementation may act as an immunoenhancing
agent to favorably modulate the immune response in HIV infection. Our previous study
(349) indicated that 8-weeks dietary vitamin E supplementation during murine retrovirus
infection prior to development of AIDS significantly restored NK cell activity and
mitogenesis of splenocytes, and production of IL-2 and IFN-'Y, suppressed by retrovirus
infection. Thus, we investigated if prolonged supplementation of dietary vitamin E more

186
extensively modulates cytokine production and restoration of some immune functions
altered by progression to AIDS. Such a system, with this potential for the manipulation
of immune cells and functions, may also be useful as a model for clinical trials in
humans and eventually for use as an adjunct therapy in human AIDS individuals.
Most studies have been focused on enhancement of vitamin E on immune changes
in peripheral immune organs such as spleen and lymph nodes. However nothing is
known about the influence of vitamin E on the thymus, a unique site of T cell
maturation. The generation of functional T cells from precursors within the thymus
involves several stages of cellular proliferation and differentiation (165, 166). Control
of these processes is mediated by cytokines (167). Thus, retrovirus-induced alterations
in the numbers of T cell subsets and their functions observed after in human peripheral
blood cells or mouse spleen cells could be the consequence of changes at the thymus
level, particularly thymocyte cytokine production. Histopathological studies of thymic
glands from HIV -I-infected children revealed involuted architecture, reduced size and
weight, and fewer Hassal's corpuscles (168, 169). HIV-1 causes changes in thymic
hormone and cytokine levels such as thymosin Icy and IL-6, which act on T cell
differentiation (170, 350). Human fetal thymocyte cell lines were infected with HIV-1
in vitro and altered expression ofT cell differentiation markers (351). Murine retrovirus
LP-BM5 infection also targeted the thymus during the progression to AIDS, by
dsyregulating cytokine production by thymocytes (354), and reducing double-positive
CD4+8+ and CD3+ CD4+CD8- thymocytes, and increasing CD3-CD4+CD8- thymocytes
(182). As vitamin E has low toxicity, it could be an immunoenahancing agent to
187
favorably modulate the cytokine secretion by thymocytes, thereby favorably affecting T
cell maturation in the thymus and improving immune responses. Therefore we examined
if dietary vitamin E supplementation would normalize dysregulation of cytokine
production (IL-2, IL-4, IL-6 and IFN-'Y) by in vitro ConA-stimulated thymocytes and
their proliferation during progression to murine AIDS.

188
Materials and Methods
Animals. Female CS7BL\6 mice, S weeks old, were obtained from the Charles River
Laboratories Inc. (Wilmington, DE). The mice were housed in transparent plastic cages
with stainless steel wire lids with 4 mice per cage. The housing facility was maintained
at 20 to 22° C and 60 to 80% relative humidity, and animals were exposed to a 12:12
hr light-dark cycle. Water and mouse chow (Texland, Madison, WI) were provided ad
libitum. After 2 week housing in the animal facility in the Arizona Health Sciences
Center, mice were then randomly assigned to one of the following four treatments:
control (untreated and uninfected), vitamin E supplemented diet (treated and uninfected),
LP-BMS infection (untreated and infected), and LP-BMS infection plus vitamin E
supplemented diet (treated and infected). All diets were provided ad libitum. The
consumed volume of liquid diet was 12-1S ml per mouse. No significance difference of
consumption of the diets between four groups was observed (data not shown). Animals
were cared for as required by the University of Arizona Committee on Animal Research.
Diet and Treatment. All mice were given the National Research Council liquid diet
(294). Dietary ingredients were obtained fr:om Dyets (#710279, Bethlehem, PA). The
vitamin E supplemented diet had ISO lUlL of vitamin E as d-alpha-tocopherol acetate
(Sigma, St. Louis, MO) added to liquid diet in addition to the IO.S lUlL d-alpha
tocopherol acetate contained in the basal liquid diet. Vitamin E dietary supplementation
was initiated the day of retrovirus infection.
LP-BMS Murine Leukemia Retrovirus Infection. See Materials and Methods in Ch. 2.
Tissue Vitamin E. See Materials and Methods in Ch. 2.

189
Preparation of Splenocytes and Thymocytes. See Materials and Methods in Ch. 2.
Standard Cytokines and Their Antibodies. See Materials and Methods in Ch. 2.
Cytokine Production. See Materials and Methods in Ch. 2.
ELISA For Cytokine Detection. See Materials and Methods in Ch. 2.
Mitogenesis of Splenocytes and Thymocytes. See Materials and Methods in Ch. 2.
ELISA for IgG Detection. See Materials and Methods in Ch. 2.
Statistics. All parameters were compared at individual time points using one way
ANDV A test, following using two-tailed t student test between any two groups. p <
0.05 was considered significant difference between two groups.

190
Results
Body and Spleen Weights. The body weight of mice given vitamin E supplementation
during progression to murine AIDS were not significantly changed (data not shown).
Vitamin E supplementation significantly reduced increased spleen weight (splenomegaly)
induced by retrovirus infection during the whole period of study (p < 0.05, Table 8.1),
while vitamin E has no effect on spleen weight of non-infected mice (Table 8.1).
However, vitamin E can not completely normalized spleen weight after retrovirus
infection.
Hepatic and Serum Levels of Vitamin E. Hepatic level of vitamin E was significantly
reduced by the retrovirus infection at 4 and 12 weeks post-infection, respectively (Table
8.2, p < 0.05). Vitamin E supplementation significantly increased hepatic level of
vitamin E in the uninfected mice. Serum vitamin E level was significantly reduced by
retrovirus infection at 4 and 12 weeks post-infection, respectively (Table 8.3, p < 0.05).
Vitamin E significantly increased the serum levels of vitamin E in both non-infected mice
and retrovirus-infected mice (Table 8.3, p < 0.05).
Production of IL-2 and IFN-y. IL-2 and IFN--y are secreted by Th1 cells, which are
responsible for regulation of cell-mediated immunity against virus infections. Dietary
vitamin E supplementation significantly increased IL-2 release (Fig. 8.1) at 4, 8 and 12
weeks and IFN--y release (Fig. 8.2) during the whole period by splenocytes from
uninfected mice compared with that of controls (p < 0.05). However, at 16 weeks
production of IL-2 was significantly inhibited (p < 0.05, Fig. 8.1) compared with the
untreated controls. As retrovirus infection progressed to murine AIDS, production of

191
IL-2 and IFN--y was suppressed by retrovirus infection (p < 0.05, Fig. 8.1 & 8.2). IL-2
production was significantly partly restored by dietary vitamin Eat 4, 8 and 12 week (
P < 0.05), but no effect of dietary vitamin E was observed at 16 week. These results
were in agreement with the proliferation of ConA-induced splenocytes (Fig. 8. 8).
Decreased release of IFN--y induced by retrovirus infection was significantly (p < 0.05)
restored by dietary vitamin E (Fig. 8.2).
Production of IL-4. IL-5 and lL-6. IL-4, IL-5 and IL-6 are produced by Th2 cells,
which are responsible for regulation of humoral immune responses. Release of IL-4 by
splenocytes was significantly (p < 0.05, Fig. 8.3) enhanced by dietary vitamin Eat 8
and 12 week compared with uninfected controls, but no significantly effect by dietary
vitamin E was observed at 4 and 16 weeks (Fig. 8.3). IL-5 secretion was significantly
(p<0.05, Fig. 8.4) reduced and IL-6 production was not affected by vitamin E (Fig.
8.5). Retrovirus infection significantly (p < 0.05) increased production ofIL-4 and IL-6
occurred during the whole period, and IL-5 at 4 weeks post-infection. However,
elevated IL-4, IL-5 and IL-6 secretion by murine AIDS was significantly decreased ( p
< 0.05) by dietary vitamin E supplementation during the whole period relative to their
controls: untreated, retrovirus infected mice (Fig. 8.3, 8.4 & 8.5).
Production of lL-6 and TNF-~. Production of IL-6 and TNF-~ by LPS-induced
splenocytes could be released by macrophages or B cells. Dietary vitamin E
supplementation did not modify IL-6 and TNF-~ production by LPS-stimulated
splenocytes in the uninfected mice, while it significantly normalizes their levels elevated
by retrovirus infection after 4 weeks post-infection compared with retrovirus-infected

192
controls (Fig. 8.6 & 8.7).
Mitogenesis of Splenocytes. Proliferation of Con A-induced splenocytes was significantly
increased (p < 0.05) by feeding increase dietary vitamin Eat 8 and 12 weeks, while
proliferation was significantly inhibited by dietary vitamin E at 16 weeks(Fig. 8.8).
Higher dietary vitamin E significantly increased T-cell mitogenesis (p < 0.05)
proliferation, which was suppressed by retrovirus infection at 4, 8 and 12 weeks, but not
at 16 weeks when the retrovirus infection had progressed to murine AIDS. Dietary
vitamin E significantly enhanced (p < 0.05) proliferation LPS-induced splenocytes
compared with untreated controls at 8, 12 and 16 weeks, while no effect of dietary
vitamin E was observed at 4 weeks (Fig. 8.9). Vitamin E enhanced B-cell proliferation,
suppressed by retrovirus infection at 4, 8 and 12 weeks post-infection. However, by 16
weeks of dietary vitamin E supplementation had no effect on the suppressed proliferation
of B cells during the final stage of murine AIDS.
Production of IgG. Feeding the vitamin E supplemented diet had no effect on IgG
production in the uninfected mice during the whole period of this study (Table 8.4).
However, increased IgG levels induced by retrovirus infection in the murine AIDS were
significantly reduced by vitamin E at 4, 8 and 12 weeks post-infection, but not at 16
weeks post-infection (Table 8.4).
Thymus Weight. Vitamin E supplementation has no effect on the thymus weight in
uninfected and infected mice (Table 8.5). Retrovirus infection caused thymic atrophy at
4 weeks post-infection and increased the thymus weight at 12 weeks post-infection.
Vitamin E in the Thymus and Serum. As shown in Table 8.6, retrovirus infection

193
significantly (p < 0.05) reduced both serum and thymic vitamin E levels during murine
AIDS. Vitamin E supplementation significantly (p < 0.05) increased the serum and
thymic concentrations of vitamin E in both uninfected, normal mice and those with
murine AIDS.
Production of Thymic Cytokines. Vitamin E supplementation significantly (p < 0.05)
increased IL-2 production at 8 weeks (Fig. 8.10), while it significantly (p < 0.05)
reduced the levels of IL-2 at 12 and 16 weeks (Fig. 8.10). Dietary vitamin E
supplementation significantly (p < 0.05) enhanced IL-2 secretion, suppressed by
retrovirus infection, at 8 weeks post-infection (Fig. 8.10), while it significantly (p <
0.05) reduced the levels of IL-2 production at 12 and 16 weeks post-infection (Fig.
8.10). No significant effect of vitamin Eon IL-2 production was observed at 4 weeks
treatment. Dietary vitamin E supplementation significantly (p < 0.05) reduced levels
of IL-4 secretion in the uninfected mice at the 4, 8 and 16 weeks treatment, but not at
12 weeks (Fig. 8.11), while it significantly (p < 0.05) decreased IL-4 production,
elevated by retrovirus infection, during the whole period of murine AIDS development
(Fig. 8.11). There was no effect of vitamin E supplementation on production of IL-6 in
the uninfected mice, while it significantly (p < 0.05) reduced IL-6 levels, increased by
retrovirus infection, at'12 and 16 weeks post-infection in murine AIDS, but not before
(Fig. 8.12). There was no significant effect of dietary vitamin E supplementation on
IFN--y production was observed in the uninfected mice except at 16 weeks (p < 0.05),
while it significantly (p < 0.05) reduced production of IFN--y which was dramatically
increased by retrovirus infection, at 8 to 16 weeks post-infection in murine AIDS (Fig.

194
8.13).
Mitogenesis of thymocytes Vitamin E supplementation significantly (p < 0.05)
enhanced ConA-induced proliferation of thymocytes in the uninfected, normal mice at
4 and 8 weeks treatment, however, it significantly (p < 0.05) reduced the proliferation
at 16 weeks treatment (Fig. 8.14). Dietary vitamin E supplementation significantly (p
< 0.05) increased proliferation of thymocytes, suppressed by retrovirus infection, at 8
weeks post-infection and significantly reduced proliferation, enhanced by retrovirus
infection, at 16 weeks post-infection in murine AIDS, while no effect was observed on
proliferation at 4 and 12 weeks post-infection (Fig. 8.14).

195
Discussion
IL-2 is a pivotal cytokine in the growth and differentiation of T and B cells, the
activation of natural killer (NK) cells and lymphokine-activated killer cells (233). It also
acts as a growth and differentiation factor for B cells and activates macrophages (23).
Thus, stimulation of IL-2 production we observed by vitamin E supplementation in both
uninfected mice and retrovirus infected mice may be responsible for vitamin E's
immunoenhancing activity (147, 156) and reduction in tumor growth (225). Since
vitamin E functions as an antioxidant and free radicals scavenger, it may act directly on
macrophages in several ways, including enhancement of receptor expression and
reduction of prostaglandin (PO) production. As POE,z down-regulates Ia expression by
macrophages (355), reduced production of PG~ could be responsible for up-regulation
of IL-l , an inducer of IL-2. Subsequently IL-2 may stimulate the production of other
cytokines including IL-4. Our finding of enhancement by dietary vitamin E of mitogen
induced splenic B proliferation is in accord with our finding of increased production of
IL-4 by Th cells. In addition, reduced levels of PO~ would lead to the elimination of
PGE,z dependent-T suppressor cells and thus permit mitogen-induced T cell proliferation
and IL-2 production by Th cells (155).
IFN--y has multiple biological functions including anti-viral activity, activating
phagocytosis of macrophages and neutrophils, increasing cytotoxicity of NK cells and
CTL, and augmenting the development of Thl cells. IFN--y inhibits differentiation of
Th2 cells and suppresses the production of Th2 cytokines (245). Stimulation of IFN--y
production by vitamin E may explain its increased tumor resistance during murine AIDS
196
(225). IFN-'Y plays a key role in T-cell mediated tumor regression (356) by its anti-
proliferative activity of tumor cells. The restoration of IFN-'Y production by vitamin E
during its suppression by retrovirus infection may explain the concomitant reduction Th2
cytokine production (IL-4, IL-5 and IL-6), elevated by murine AIDS. Enhancement of
IFN-'Y production by dietary vitamin E in normal mice may be due to the decrease
production of immunosuppressive PG~ by immunocompetent cells induced by dietary
vitamin E (156). PG~ is a potent inhibitor of NK cells (148, 357), a major source of
IFN-'Y production in vivo (195). In addition, El-Hag et al (358) showed that NK cell
activity was susceptible to oxidative injury by H20 2• Vitamin E should help to prevent
H20 2 toxicity. Seaman et al (359) found that phorbol ester-mediated suppression of NK
cell activity was depressed by reactive oxygen metabolites, especially the release of
H20 2, by monocytes and polymorphonuclear leukocytes. Since vitamin E dietary
supplementation decreased H20 2 level (360), the increased NK cell activity in mice fed
vitamin E may be responsible for the increased level ofIFN-'Y. This idea is strengthened
by the demonstration of vitamin E stimulated NK cell activity in vivo and in vitro in
uninfected, normal mice (361, 362). Due to the central regulatory roles of IL-2, IL-4
and IFN-'Y in immune regulation, the effects of supplemental vitamin E on macrophages
and T cells can cause general immunoenhancement through increasing levels of IL-2, IL-
4 and IFN-'Y. However it is not clear why longer duration of dietary vitamin E (16
weeks) supplementation results in mitogen-induced splenic T and B cell proliferation, in
accord with decreased IL-2 and IL-4. In vitro studies in our laboratory revealed that
higher vitamin E concentration ( e.g more than 10 ",g/ml) can suppress T and B cell

197
proliferation, while physiological levels of vitamin E (1-5 J.!g/ml) significantly enhanced
T and B cell proliferation from both uninfected mice and retrovirus-infected mice (Wang
et al. unpublished observation). Thus, the reduced cytokine production with long
exposure of vitamin E could be caused by increasing vitamin E in cell membranes
causing increased fluidity, which may adversely affect the immune response. The exact
mechanism by which very high vitamin E can suppress immune responses is still not
clear. The unexpected reduced release of IL-5 by Th2 cells in uninfected mice by
vitamin E supplementation could also be due to the decreased PGEz, a potent stimulator
of IL-5 production (363). In addition, previous studies have shown that high vitamin
E diet reduced serum corticosterone levels (160). Corti steroids suppress the numbers and
function of T -cells, which would explain the enhanced immune responses we observed
with supplemental vitamin E. Thus, high intake of vitamin E modulates cytokine
production, leading to modulation of immune response in vivo in uninfected mice, as
well as retrovirus infected mice with immune dysfunctions.
In vivo activated B cells from HIV patents produce high levels of IL-6 and TNF-a
(365), as we found with LPS-stimulated splenocytes for LP-BM5 retrovirus infected mice
(208). Increased IL-6 production would explain the hypergammaglobulinemia and global
B cell dysfunction seen with both pathogens (244). Dietary vitamin E supplementation
significantly reduced the increased production of IL-6 by LPS-stimulated splenocytes l,
suggesting how it alleviated hypergammaglobulinemia and global B cell dysfunction in
the murine AIDS. Suppression of increased IL-5 levels during murine AIDS by dietary
vitamin E may also contributed to this mitigation. Furthermore, IL-6 also is involved

198
in governing the production of acute-phase reactants by hepatocytes, which results in a
series of tissue damage (366). Elevated levels of TNF-~ may be involved with lipid
metabolism: inducing hypertriglyceridemia and wasting in both human and murine AIDS
(176, 177). Elevated levels of IL-6 and TNF-~ have also been associated with the
stimulation of HIV replication in macrophages/monocytes and T cells (364, 365). Thus
reduction by dietary vitamin E supplementation of elevated levels of TNF-~ and IL-6 in
murine AIDS should ameliorate pathological symptoms of the host initiated by retrovirus
infection including helping to explain the lower incidence and small size of esophageal
cancer (225).
Formation of highly reactive oxygen-containing molecules is a normal
consequence of a variety of essential immunological reactions. Oxidants such as
superoxide radicals, hydrogen peroxides, hydroxyl radicals, and lipid peroxides play
important roles in human diseases (360). Lower levels of antioxidants such as
glutathione and other acid soluble thiols correlated with the progression to AIDS (45).
As thiols including vitamin E were associated with the inhibition of HIV replication in
vitro (368, 369), oxidative stress may be a potent inducer of both viral activation and
DNA damage in infected cells, including immunosuppression (370, 371). As TNF-~
generates reactive oxygen species through neutrophils at concentration as low as 0.5
ng/ml (372). TNF-~ levels are elevated in the serum of HIV patients and murine AIDS
(233, 365). TNF-~, produced by retrovirus-infected macrophages/monocytes, could use
oxidative stress as a second messenger. Reactive oxygen species induce expression of
HIV in human T cell lines by activating transcription of NF-kB (373. 374). Thus higher
199
intake of vitamin E supplementation may block activation of NF-kB via offsetting the
oxidative stress (375), thereby retarding the progression of AIDS. The reduction by
vitamin E supplementation we observed of increased levels of TNF-a during murine
AIDS may also contribute to lower the oxidative burden initiated by the retrovirus
infection. A unique feature of the retrovirus life cycle is that persistence in a quiescent
state, prior to activation, without production of either viral mRNA or proteins. Agents
such as vitamin E, that function as antioxidants and lower oxidative stress, may slow
the retrovirus replication, thereby offsetting these AIDS-symptoms and retarding the
progression to AIDS in HIV -positive individuals. This idea is also supported by our
finding that dietary vitamin E supplementation reduced the splenomegaly and restored T
and B cell proliferation in murine AIDS.
While dietary vitamin E did not completely restore immune dysfunctions including
cytokine production induced by retrovirus, its use as combination therapy with other
pharmacologic agents such as AZT could have several advantages. First, it could lead
to more complete viral suppression by deceasing oxidative stress, associated with this
retrovirus infection, than any single drug used alone. Second, it may allow each drug
to be used in lower doses, thus limiting drug toxicities, and decreased frequency of
drug-resistant HIV production. Third, such immunorestorative treatment may be given
during maintenance therapy of the AIDS patient following the control of tumors and
immune dysfunction by chemotherapy, especially when tissue levels of vitamin E are
lowered. In addition, although the animal data may not totally be extrapolated to mv
positive humans, information obtained from such studies using murine AIDS may be
200
potentially transferable or serve as a basis for the study of immunoenhancing properties
of vitamin E in HIV -infected humans.
Production and action of cytokines in the thymus have been associated with an
essential role in T cell development (167). In mice, expressing a human IL-2Ra chain
transgene, thymocytes expressed a nonfunctional murine IL-2RB-human IL-2Ra
heterodimer resulting in the accumulation of T cell precursors in the thymus and
periphery (167). Also, anti-IL-2R a chain antibodies abrogate T cell development which
can be reversed by addition of IL-2 (189). Addition of IL-2 to intact lobes immersed in
culture medium promotes the selective outgrowth of T cells expression 'YO TCR (190).
Consequently, the modulation of IL-2 release by dietary vitamin E we observed may be
responsible for favorable changes in T cell subpopulations and differentiation. The
addition of IL-4 blocks T cell development by reducing the number of "double-positive:
CD4 +CD8+ thymocytes (191). The constitutive production of IL-4 in IL-4 transgenic
mice also resulted in the inhibition of "double-positive" CD4 +CD8+ thymocytes and
mature peripheral T cell development (192, 193). As dietary vitamin E reduced
production of IL-4, increased by retrovirus infection in the thymus, these changes may
contribute to the restoration of abrogation of T cell development during progression to
murine or human AIDS, normalizing immune dysfunctions initiated by retrovirus
infection. IL-6 has been shown to promote the differentiation of Thy-l +IL-2R+ donor
thymocytes after intrathymic transfer into irradiated hosts (194). Thus, the reduction of
IL-6 secretion by dietary vitamin E in murine AIDS may also contribute to the
restoration of T cell development in the thymus abrogated by retrovirus infection. The

201
physiological significance of increased production of IFN-'Y by thymocytes, induced by
retrovirus infection, may be involved in the up-regulation of MHC class I and II
expression on the surface of thymic stromal cells. It plays a crucial role in the positive
and negative selection during T cell education (Le. recognition 'self and 'non-self) in
the thymus. Thus, the elevated levels of IFN-'Y release by thymocytes in murine AIDS
may reflect the failure of T cell education, leading to loss of tolerance to self antigens
or reaction to non-self antigens. Supplemental vitamin E reduced the IFN-'Y production
in murine AIDS, suggesting modulatory effects of dietary vitamin E on thymic cytokine
production with reversing of impairment of T cell maturation in the thymus initiated by
retrovirus infection. The exact physiological significance of vitamin E modulatory effects
on thymic cytokine production depends on the further elucidation of mechanism on how
cytokines regulate T cell development.
Changes in function and subpopulations of thymocytes appear to be responsible
for the modulation of cytokine production by vitamin E supplementation. Possible
underlying mechanisms we propose include: (A) vitamin E supplementation reversing
the deficiencies of vitamin E in the thymus initiated by retrovirus infection, which may
be essential for T cell maturation; (B) Vitamin E supplementation normalized the
deficiency of hepatic zinc initiated by retrovirus infection (10), which has been shown
to be essential for T cell maturation (379-381); (C) Vitamin E supplementation reduced
the level of corticosteroids (160), which are potent inducers of thymocyte apoptosis (38).
In summary, the favorably effects of dietary vitamin E supplementation on T cell
differentiation in the thymus via modulating cytokine secretion we observed during
202
murine AIDS may provide new mature helper T cells and replace retrovirus-infected and
damaged peripheral T helper cells, explaining restoration of immune response in murine
AIDS by dietary vitamin E. The effects of dietary vitamin E supplementation on T cell
maturation in the thymus in the uninfected, normal mice may also enhance the immune
response via regulating T cell differentiation, explaining enhancement of cell-mediated
immunity by vitamin E supplementation in animals and individuals (148).

Table 8.1 Effect of Vitamin E Supplementation on Spleen Weight During Murine AIDS*
Treatment Spleen Weight (mg)
Vitamin E Retrovirus 4 Weeks 8 Weeks 12 Weeks 16 Weeks
84.0± 84.4+2.9 79.0+ 85.0+ 2.0 12.0 17.0
+ 210+ 690.6+ 1240+ 2410+ 62.0# 36# 420# 250#
+ 77.0+ 88.4+9.0 75.0+ 90.0+8.0 7.0 16.0
+ + 140+ 341± 620+ 775+ 22.0@ 121@ 240@ 241@
* Values are mean + SD of 4 mice per group. # p < 0.05 compared with untreated and uninfected mice. @ p < 0.05 compared with infected mice.
Table 8.2 Effect of Vitamin E Supplementation on Hepatic Vitamin E level During Murine AIDS *
Treatment Ql-Tocopherol (p.g/ g liver)
Vitamin E Retrovirus 4 Weeks 12 Weeks
23.8 ± 2.5 67.3 ± 8.5
+ 13.9 ± 5.8# 43.3 + 4.0#
+ 49.4 ± 2.6# 180.0 + 13.2#
+ + 37.9 ± 5.3@ 107.0 + 11.4@
* Values are mean + SD of 4 mice. # @
p < 0.05 compared with untreated and uninfected mice. p < 0.05 compared with infected mice.
203

Table 8.3. Effect of Vitamin E Supplementation on Serum Vitamin E level During Murine AIDS*
Treatment Ol-Tocopherol (~g/ml)
Vitamin E Retrovirus 4 Weeks 12 Weeks
3.66 + 0.49 3.3 + 0.36
+ 2.2 + 0.56# 0.73 + 0.19#
+ 5.86 + 0.94# 13.9 + 5.1#
+ + 6.32 ± 204@ 7.17 + 304@
* Values are mean + SD of 4 mice. # p < 0.05 compared with untreated and uninfected mice. @ p < 0.05 compared with infected mice.
Table 8.4 Effect of Vitamin E Supplementatin on IgG Production During Murine AIDS*
Treatment IgG ~g/ml)
Vitamin E Retrovirus 4 Weeks 8 Weeks 12 Weeks 16 Weeks
3.1+ 5.5±Oo4 7.6+0.45 8.0+0.58 0.15
+ 10.0+ 23.5+ 30.0+2.9# 75.0+9.6# 1.2# 1.5#
+ 3.0+ 5.0+ 704+1.2 8.2+0.69 0.66 0.74
+ + 5.6± 8.4+ 18.0+1.8@ 74.0+ 1.8 0.17@ 0.47@
204
* Content of IgG was secreted by 1()6 splenocytes stimulated by LPS in a 0.2 ml volume. # p < 0.05 compared with untreated and uninfected mice. @ p < 0.05 compared with infected mice.

Table 8.S Effect of Vitamin E on Thymus Weight During Murine AIDS*
Treatment Thymus Weight (mg)
Vitamin E Retrovirus 4 Weeks 8 Weeks 12 Weeks 16 Weeks
56.0+ 55.0+3.0 53.0+5.0 55.0+7.0 10.0
+ 42.0+ 48.0+ 1.5# 90.0+ 99.0+ 16.0# 13.0# 23.0#
+ 53.0+ 51.0+4.0 56.0+ 58.2+7.0 8.0 10.0
+ + 52.1+ 54.5+10.0 91.0+ 93.4+2.0 20.0 11.0
* Values are mean + SD of 6-8 mice per group. # p < 0.05 compared with untreated and uninfected controls.
Table 8.6 Effect of Vitamin E Supplementation on Thymic Vitamin E level During Murine AIDS*
Treatment
Vitamin E
+
Retrovirus
+
Thymus (p.g/g wet tissue)
53.5 + 9.0
65.0 + 4.5#
38.1 ± 7.9#
+ + 53.2 + 5.4@ * The length of treatment of vitamin E and retrovirus infection was 8 weeks. Values are mean + SD of 4 mice. # p < 0.05 compared with untreated and uninfected mice. @ p < 0.05 compared with infected mice.
205
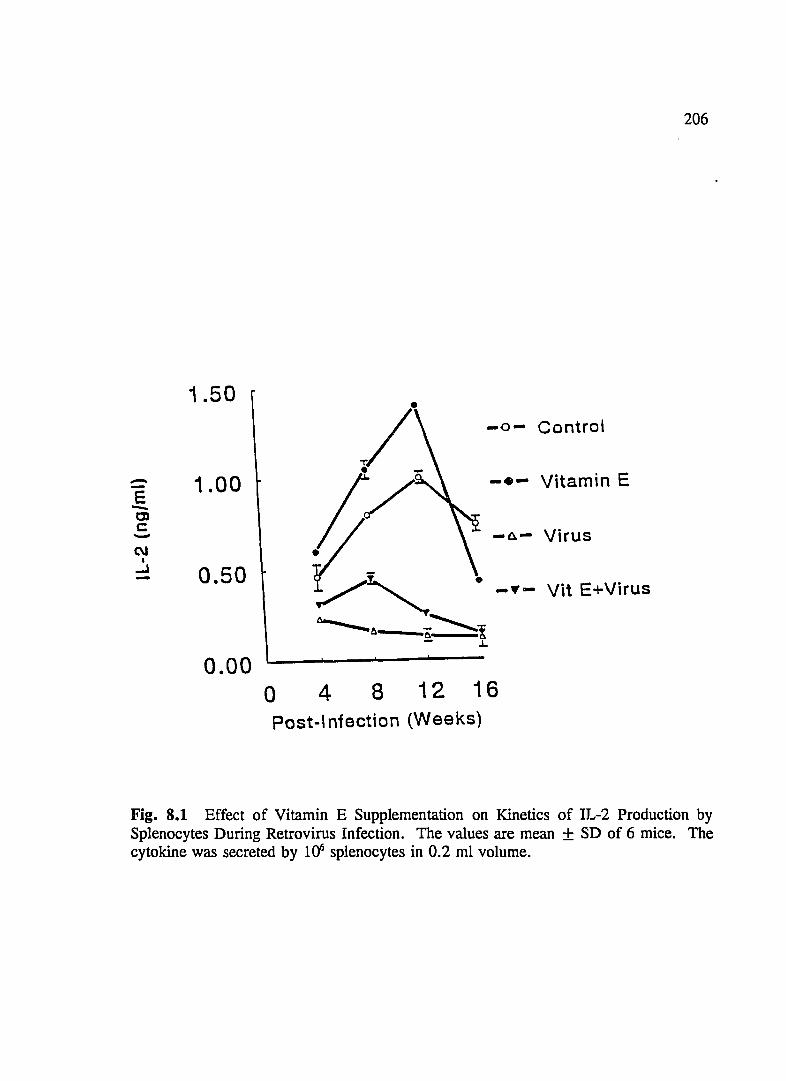
206
1.50 Tie -0- Control
-.- Vitamin E --E 1.00 -C)
c - -0.-C\1
I
-' 0.50 ~ • -.- Vit E+Virus
"- ~a a~l. - .1.
0.00 a 4 8 12 16 Post-Infection (Weeks)
Fig. 8.1 Effect of Vitamin E Supplementation on Kinetics of IL-2 Production by Splenocytes During Retrovirus Infection. The values are mean + SD of 6 mice. The cytokine was secreted by 1()6 splenocytes in 0.2 ml volume.

207
40
T T -0- Control
30 ~r-l--1 -E i'-.+ 1 -~- Virus -C) c:
20 -~ -... -e- Vitamin E I
Z U. 0
10 A~ _._ Vit E+Virus
~A 0
0 4 8 12 16 Post-Infection (Weeks)
Fig. 8.2 Effect of Vitamin E Supplementation on Kinetics of IFN-')' Production by Splenocytes During Retrovirus Infection. The values are mean + SD of 6 mice. The cytokine was secreted by 1<r splenocytes in 0.2 ml volume.

208
0.40
-0- Control
- Vitamin E -E -C) c 0.20 - Virus ~
-f).-
I
.....J
.L ..r.. -y- Vit E+Virus
0.00 o 4 8 12 16 Post-Infection (Weeks)
Fig. 8.3 Effect of Vitamin E Supplementation on Kinetics of IL-4 Production by Splenocytes During Retrovirus Infection. The values are mean + SD of 6 mice. The cytokine was secreted by l<r splenocytes in 0.2 ml volume.
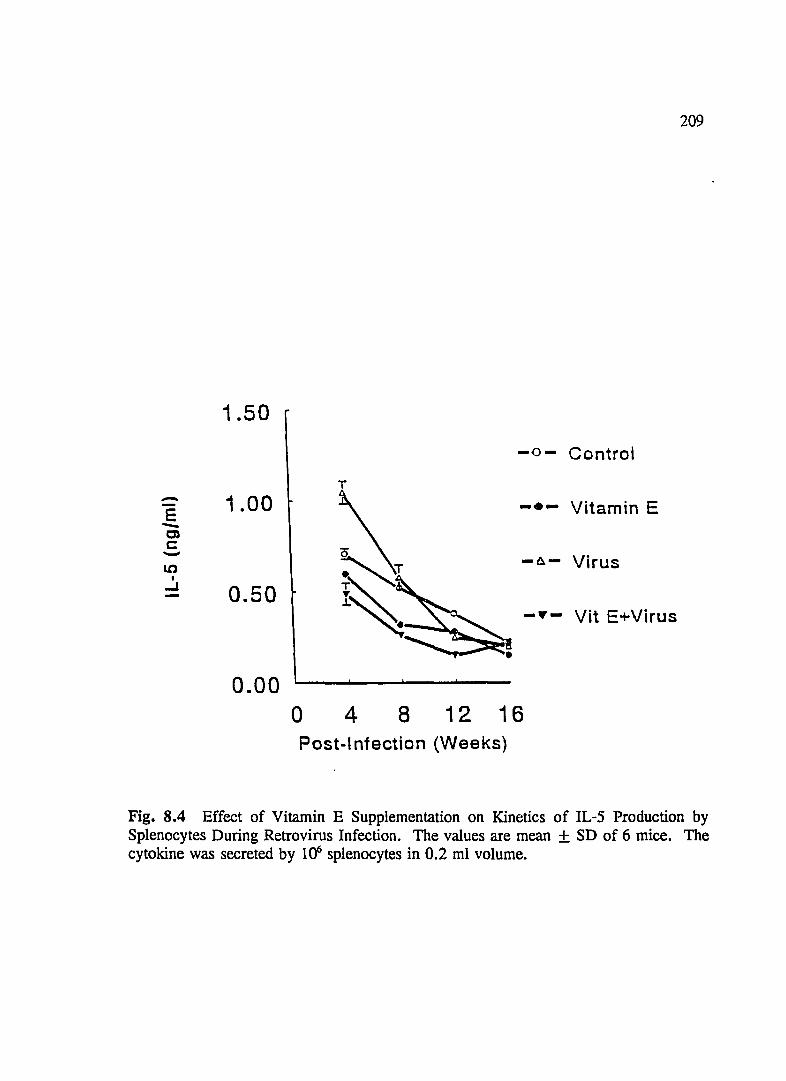
209
1.50
-0- Control
T - 1.00 Vitamin E E -.--C) c: - Virus U')
-0.-I
~ 0.50 -~- Vit E+Virus
0.00 o 4 8 12 16 Post-Infection (Weeks)
Fig. 8.4 Effect of Vitamin E Supplementation on Kinetics of IL-5 Production by Splenocytes During Retrovirus Infection. The values are mean + SD of 6 mice. The cytokine was secreted by 1()6 splenocytes in 0.2 ml volume.

210
28 T
-0- Control
21 - -.- Vitamin E E -C) c: 14 - -~- Virus (Q
I
-1
7 Vit E+Virus
o o 4 8 12 16 Post-Infection (Weeks)
Fig. 8.5 Effect of Vitamin E Supplementation on Kinetics of IL-6 Production by Splenocytes during Retrovirus infection. The values are mean + SD of 6 mice. The cytokine was secreted by 1()6 splenocytes in 0.2 ml volume.
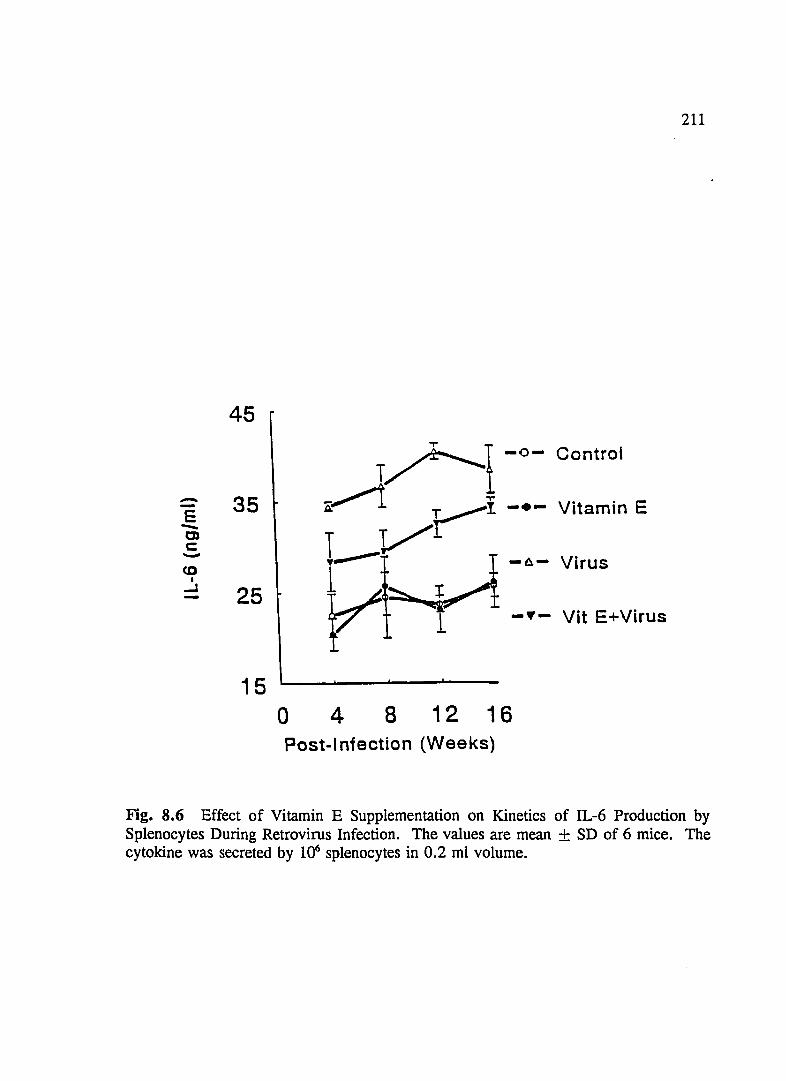
45
--E 35 -C)
c -CD
I
...J 25
15 a
T/,-1-0- Control
A~ yI -.- Vitamin E
T .-V r ~ -,,- Virus
V 1 - .. - Vit E+Virus
4 8 12 16 Post-I nfection (Weeks)
211
Fig. 8.6 Effect of Vitamin E Supplementation on Kinetics of IL-6 Production by Splenocytes During Retrovirus Infection. The values are mean + SD of 6 mice. The cytoldne was secreted by 1()6 splenocytes in 0.2 ml volume.

212
10
-0- Control T T - / ~t-·-E Vitamin E -Cl
c y/L - 5 C -0.- Virus ,
LL .--- H z is ==~ 1 r--v- Vit E+Virus
a a 4 8 12 16 Post-Infection (Weeks)
Fig. 8.7 Effect of Vitamin E Supplementation on Kinetics of TNF-a Production by Splenocytes During Retrovirus Infection. The values are mean + SD of 6 mice. The cytokine was secreted by 1()6 splenocytes in 0.2 ml volume.
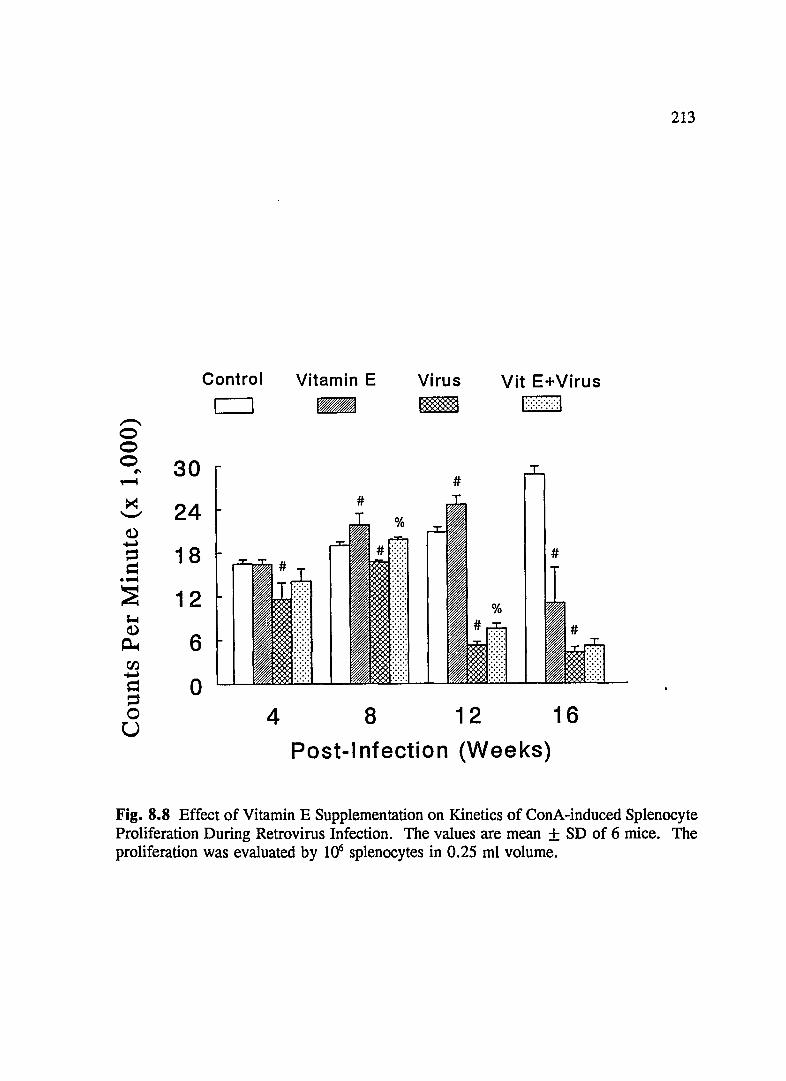
.,,-... o o o
'" ,...-4 30
~ 24 ~ ~
::s 1 8 d
• ...-4
:E 12
Control
c=J
4
Vitamin E
~
8
Virus
~
#
12
Vit E+Virus 1:::::::::::::1
16
Post-I nfection (Weeks)
213
Fig. 8.8 Effect of Vitamin E Supplementation on Kinetics of ConA-induced Splenocyte Proliferation During Retrovirus Infection. The values are mean + SD of 6 mice. The proliferation was evaluated by 1Q6 splenocytes in 0.25 ml volume.
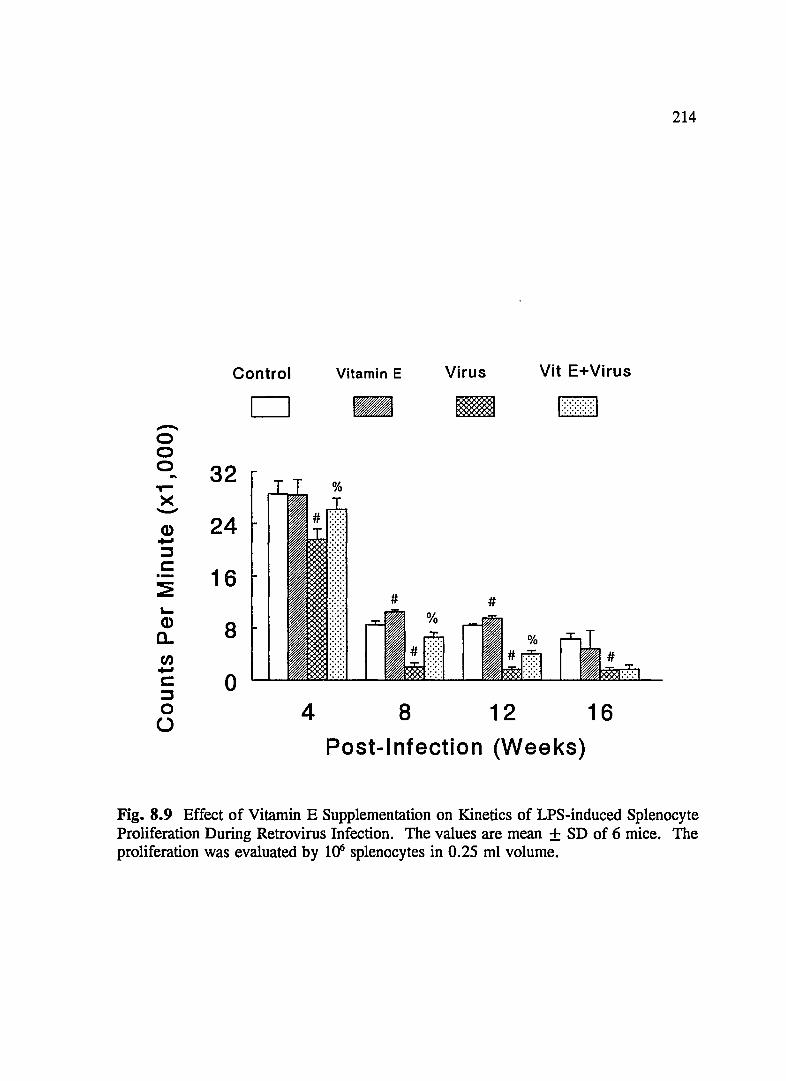
214
Control Vitamin E Virus Vit E+Virus
D - - II§] ...... -0 0 0 32 .. ..-X -(J) 24 .... ::l c:
16 ~ ~
(J) 8 0.. tJJ .... c: 0 ::l 0 4 8 12 16 (,)
Post-Infection (Weeks)
Fig. 8.9 Effect of Vitamin E Supplementation on Kinetics of LPS-induced Splenocyte Proliferation During Retrovirus Infection. The values are mean + SD of 6 mice. The proliferation was evaluated by 1<fi splenocytes in 0.25 ml volume.
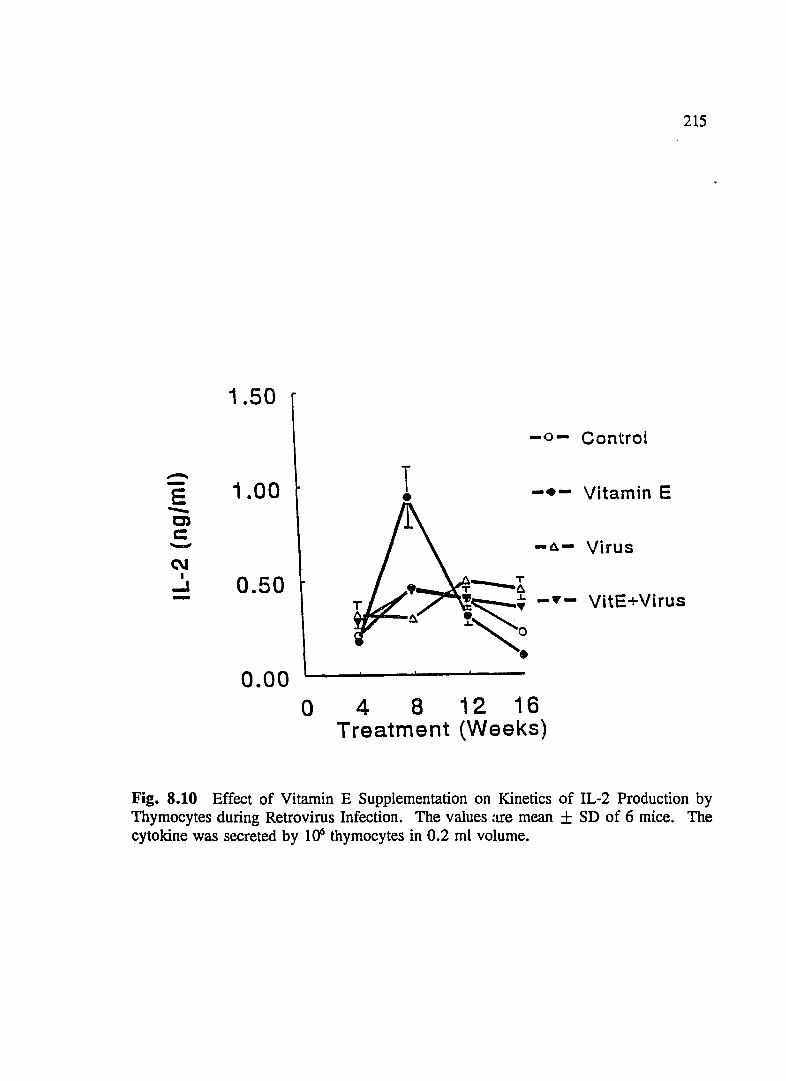
215
1.50
-0- Control
E 1.00 T • --C) c - -~- Virus C\I
I ....l 0.50 - -~- VitE+Virus
0.00 a 4 8 12 16
Treatment (Weeks)
Fig. 8.10 Effect of Vitamin E Supplementation on Kinetics of IL-2 Production by Thymocytes during Retrovirus Infection. The values are mean + SD of 6 mice. The cytokine was secreted by 1<r thymocytes in 0.2 ml volume.

216
0.80
-0- Control
-E -C)
c: 0.40 -~
I
~
0.00 a 4 8 12 16
Treatment (Weeks)
Fig. 8.11 Effect of Vitamin E Supplementation on Kinetics of IL-4 Production by Thymocytes During Retrovirus Infection. The values are mean + SD of 6 mice. The cytokine was secreted by 1()6 thymocytes in 0.2 ml volume.

217
2.40
-0- Control
1.80 v - / .... -.- Vitamin E
E - ~i-.-Virus Cl 1.20 c: -co
I ~ !><~ ~ -.- VitE+Virus 0.60
0.00 o 4 8 12 16
Treatment (Weeks)
Fig. 8.12 Effect of Vitamin E Supplementation on Kinetics of IL-6 Production by Thymocytes During Retrovirus Infection. The values are mean + SO of 6 mice. The cytokine was secreted by 1()6 thymocytes in 0.2 ml volume.
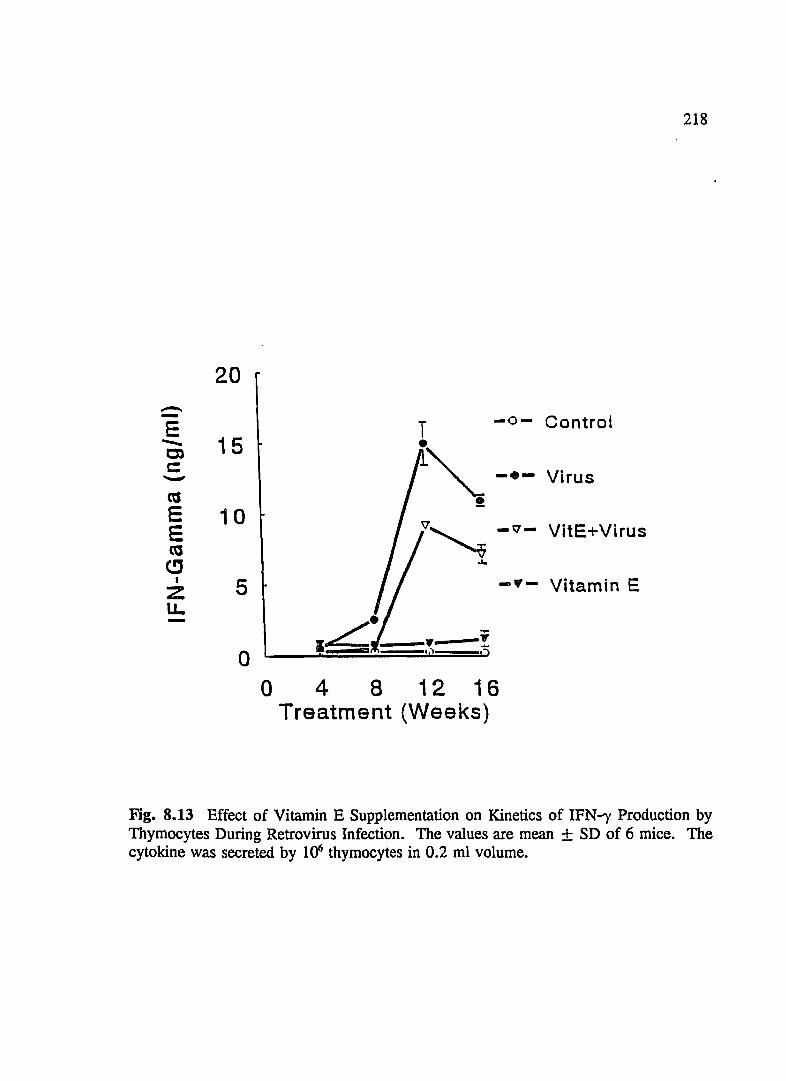
218
20
-E -0- Controt -... 15 C)
c: Virus -<U
E 10 E -\1- VitE+Virus <U (!l
I 5 -,,- Vitamin E Z LL
-y ~
0 0 4 8 12 16
Treatment (Weeks)
Fig. 8.13 Effect of Vitamin E Supplementation on Kinetics of IFN-'Y Production by Thymocytes During Retrovirus Infection. The values are mean + SD of 6 mice. The cytokine was secreted by 1cr thymocytes in 0.2 ml volume.

-o o o ,.. >< -en CD -::l C .-:! "-CD a.. -C ::l o (J
16
#
12 o Control
- Vitamin E 8
- Retrovirus
4 k::::;::::1 Vit E+Virus
o 4 8 12 16
Treatment (Weeks)
Fig. 8.14 Effect of Vitamin E supplementation on Kinetics of ConA-induced Thymocyte Proliferation During Retrovirus Infection. The values are mean + SD of 6 mice. The proliferation was evaluated by 1()6 thymocytes in 0.25 ml volume.
219

220
CHAPTER 9: MODULATION OF CYTOKINE SECRETION,
IMMUNE RESPONSE AND NUTRITIONAL STATUS BY VARIOUS LEVELS OF
VITAMIN E SUPPLEMENTATION DURING MURINE AIDS
Abstract
Dietary supplementation, with a 15-, 150- and 450-fold increase of vitamin E
in a liquid diet (National Council Research), significantly restored levels of interleukin-2
(lL) and interferon-r produced by splenocytes, which were suppressed by retrovirus
infection. Retrovirus infection elevated levels of IL-6 and IL-IO produced by
splenocytes, which were significantly normalized by all levels of vitamin E
supplementation, respectively. Increased levels of IL-6, tumor necrosis factor-a,
immunoglobulin A and G produced by splenocytes during progression to murine AIDS
were also significantly normalized by all levels of vitamin E supplementation. Vitamin
E supplementation also restored retrovirus-suppressed splenocyte proliferation and natural
killer cell cytotoxicity. 15-, 150- and 450-fold increase of vitamin E supplementation
modulated IL-2 production by thymocytes in both uninfected mice and retrovirus-infected
mice, causing murine AIDS. 150- and 450-fold vitamin E significantly reduced level of
IL-4 secretion by thymocytes in the uninfected, normal mice. Its supplementation at all
levels also significantly reduced IL-4 production by thymocytes, elevated by the
retrovirus infection. Vitamin E significantly reduced IL-6 and interferon-r production
by thymocytes increased in the murine AIDS. The effects of dietary vitamin E on conA
induced proliferation of thymocytes were consistent with the finding on changes of IL-2
secretion. No effects of dietary vitamin E on thymus weight were observed in both

221
uninfected and retrovirus-infected mice. They also significantly restored serum and
haptic vitamin A and E which had been reduced by retrovirus infection. They also
significantly restored hepatic copper, which had been reduced by retrovirus infection,
whereas only 150- and 450-fold vitamin E improved hepatic zinc level. Vitamin E
supplementation at all levels had no effects on hepatic zinc and copper levels in normal
mice, whereas they significantly increased serum and hepatic vitamin A and E
concentrations. Vitamin E supplementation at all levels significantly increased intestinal
vitamin A and E levels during murine AIDS, whereas only intestinal vitamin E levels
was altered by various levels of vitamin E supplementation. Interestingly, vitamin E
supplementation had no effect on intestinal copper level, whereas they significantly
increased intestinal zinc level in the normal mice and only 450-fold vitamin E
supplementation significantly elevated intestinal level of zinc. These data indicate that
dietary vitamin E supplementation at extremely high levels was not immunotoxic, and
can modulate cytokine release and normalize immune dysfunctions during progression
to murine AIDS, which should favorably affect host resistance. These data also indicate
that dietary vitamin E supplementation at extremely high levels can modulate cytokine
production by thymocytes, affecting T cell differentiation, especially during murine
AIDS. Furthermore, thsy improved undernutrition initiated by retrovirus infection during
progression to murine AIDS, which should favorably affect immune response.

222
Introduction
Acquired immune deficiency syndrome (AIDS) is a clinical disorder causf!d by
human immunodeficiency virus (HIV), representing the end point in a progressive
sequence of immunosuppressive changes. HIV, the key causative agent of AIDS, induces
immunosuppression which results in host defense defects that render the body highly
susceptible to opportunistic infections and neoplasm (383). The unique pathogenicity of
HIV, the long latent period of HIV infection and the rapidity with which the AIDS
epidemic has steadily increased in the United States in recent years. Therefore there is
a pressing need for valid and effective therapeutic and preventive interventions in HIV
infected individuals.
Since progression to AIDS is often complicated by various nutritional disorders,
the additional immune dysfunction due to undernutrition may exacerbate immune damage
due to the retrovirus infection, and have precluded recovery from infectious events which
earlier represented survivable episodes. This hypothesis is based on findings from
clinical and experimental situations where malnutrition has been associated with
immunological dysfunction (53, 163); development of infectious processes (53, 54) and
vital organ dysfunction (55). Thus, the severe malnutrition seen in patients with AIDS
may set up a vicious cycle in which the underlying immunological defects related to HIV
infection are aggravated by the malnutrition-induced immune dysfunction. Although the
roles of vitamins and minerals in the clinical manifestation of HIV infection has not been
well defined (56), a growing number of studies have suggested important links between
vitamins or minerals and HIV infection (57). Two studies found that 12%-29% of their
223
patients at various stages of HIV disease has serum vitamin A and E deficiencies (63,
65). A recent study which found that a major percentage of patients with AIDS (50%),
ARC (58%) and HIV (38%) had a vitamin E intake ofless than 50% the Recommended
Daily Allowance (56). Zinc deficiency in HN infection has been identified consistently
(67, 68, 421). One study reported marginal copper deficiency in 22% of their AIDS
patients (68). Thus, patients with HIV infection will be increasingly compromised
nutritionally as the disease progresses. Indeed, it has been suggested that HIV infection
might play pathogenic role in gastrointestinal cells. In situ hybridization studies have
localized HN infection in various types of epithelial cells of the bowel mucosa (72, 73).
HIV infection of gastrointestinal cell lines has been documented in vitro (74, 75). Since
the lymphoid tissues, the main target of HIV, are present throughout of the
gastrointestinal tract, and CD4-related receptors have been demonstrated (76), it is
conceivable that AIDS patients have dysfunction of some portion of gastrointestinal tract
due to retrovirus infection, thereby leading to malabsorption and malnutrition. The
results from murine AIDS studies further confirmed that retrovirus infection induced
hepatic and serum nutrient deficiencies as well as splenic nutrients in the presence of
normal food intake, reducing important immunoregulatory nutrients such as vitamin A,
E, zinc and copper (422). Such retrovirus-induced malnutrition has the theoretical
potential to accelerate development of AIDS via immunosuppression secondary to
nutritional deficiency.
The role of vitamin E in the clinical manifestation of HIV has not been well
defined (57). Some patients with varying stages of HIV infection had low plasma levels

224
of vitamin E (63). The data from murine AIDS study further confirmed that the
deficiencies of vitamin E occurred in the liver as well as spleen and thymus (384). In
rats, depressed antibody-dependent cell mediated cytotoxicity (204), decreased
lymphocytes blastogenesis in response to mitogens (205), and depressed NK cell
mediated cytotoxicity (126) have been reported in vitamin deficient states. Therefore,
the deficiencies of vitamin E in the tissues including immune organs may aggravate
immune dysfunctions initiated by retrovirus infection, speeding the development of
AIDS. Thus, vitamin E supplementation could act as an immunoenhancing agent to
favorably modulate the immune response in HIV infection.
As vitamin E has low toxicity, it could be an immunoenhancing agent to favorably
modulate the cytokine secretion by thymocytes, thereby favorably affecting T cell
maturation in the thymus and improving immune responses. Consequently, vitamin E
supplementation has been proposed to be a useful additional therapy for AIDS treatment
(390). IS-fold increase of vitamin E during murine AIDS significantly restored NK cell
activity, T and B cell proliferation, and IL-2 and IFN--y, and nutritional status which had
been suppressed by retrovirus infection (391). The results from another study (392)
suggested that 8-12 weeks vitamin E consumption (1S-fold increase) can significantly
normalized immune dysfunctions and cytokine dysregulation, whereas 4 weeks vitamin
E supplementation was not effective for immunorestoration. Thus, the combination of
existing medical therapy with vitamin E supplementation may provide a more successful
and novel therapeutic approach for treatment of HIV infected individuals (393). The
strategy in this study was developed to determine whether supplementation of dietary

225
vitamin E at extremely high levels (150- and 450-fold) would more extensively modulate
cytokine production by splenocytes and thymocytes and restore some immune functions
, and improve nutritional status, altered by progression to AIDS, or if vitamin E at
extremely high oral supplementation is immunotoxic. Such a system, with this potential
for the manipulation of immune cells and functions, may also be useful as a model for
clinical trials in humans and eventually for use as an adjunct therapy in HIV-infected
individuals.

226
Materials and Methods
Animals. Female CS7BL\6 mice, 5 weeks old, were obtained from the Charles River
Laboratories Inc. (Wilmington, DE). The mice were housed in transparent plastic cages
with stainless steel wire lids with 4 mice per cage. The housing facility was maintained
at 20 to 22° C and 60 to 80% relative humidity. Animals were exposed to a 12:12 hr
light-dark cycle. Water and mouse chow (Texland, Madison, WI) were provided ad
libitum. Animals were cared for as required by the University of Arizona Committee
on Animal Research. After 1 week of adaptation in the animal facility in the Arizona
Health Sciences Center, mice were then randomly assigned to one of the following eight
treatments: control diets including uninfected and infected mice, vitamin E
supplemented diets (1S-fold increase) including uninfected and infected mice, vitamin E
supplemented diets (1S0-fold increase) including uninfected and infected mice, vitamin
E supplemented diets (4S0-fold increase) including uninfected and infected mice. All
diets were provided ad libitum. The mice consumed 14-16 mlliquid diet per day. No
significant differences of diet consumption between groups were observed (data not
shown).
Diet and Treatment. All mice were given the National Research Council liquid diet
(294). Dietary ingredients were obtained from Dyets (#710279, Bethlehem, PA). The
vitamin E supplemented diet had ISO (1S-fold increase), 1,SOO (ISO-fold increase) and
4,SOO (4S0-fold increase) lUlL of vitamin E as d-alpha-tocopherol acetate (Sigma, St.
Louis, MO) added to liquid diet in addition to the 1O.S lUlL d-alpha-tocopherol acetate
contained in the basal liquid diet. Vitamin E dietary supplementation was initiated the

227
day of retrovirus infection. The length of diet treatment and retrovirus infection was 10
weeks.
LP-BMS Retrovirus Infection. See Materials and Methods in Ch. 2.
Hepatic Vitamin A and E. See Materials and Methods in Ch. 2.
Serum Vitamin A and E. See Materials and Methods in Ch. 2.
Measurement of Zinc and Copper. See Materials and Methods in Ch.3
Preparation of Splenocytes and Thymocytes. See Materials and Methods in Ch. 2.
Standard Cytokines and Their Antibodies. See Materials and Methods in Ch. 2.
Cytokine Production. See Materials and Methods in Ch. 2.
ELISA For Cytokine Detection. See Materials and Methods in Ch. 2.
Mitogenesis of Splenocytes and Thymocytes. See Materials and Methods in Ch. 2.
NK CeIl Cytotoxicity. See Materials and Methods in Ch. 8.
IgA and IgG Production. See Materials and Methods in Ch. 2.
ELISA for IgA and IgG. See Materials and Methods in Ch. 2.
Statistics. The purpose of this study is to investigate if IS0- and 4S0-fold increase
of vitamin E supplementation is better for murine AIDS therapy. Thus comparison will
be focused on between two groups, e.g. uninfected vs infected; IS-fold vs control; IS0-
fold vs 4S0-fold and so on. All parameters were compared using two-tailed student's t
test between two groups. p < O.OS was considered significant difference between two
groups.

228
Results
Body and Spleen Weights. The body weight of mice given vitamin E supplementation
during progression to murine AIDS was not significantly different (Fig. 9.1A). Vitamin
E supplementation slightly reduced spleen weight, which had been induced to
splenomegaly by retrovirus infection (Fig. 9. !tB), but no statistic significance.
Serum Vitamin A and E. The concentrations of serum vitamin A and E were
significantly (p < 0.05) reduced by retrovirus infection (Fig. 9.2A&B). Vitamin E
supplementation at all levels significantly (p < 0.05) increased serum vitamin A and E
in both normal mice and murine AIDS, however, 150- and 4S0-fold vitamin E did not
further increase serum vitamin A and E in normal mice (Fig. 9.2A&B). ISO-fold
vitamin E supplementation significantly (p < 0.05) further increased serum vitamin A
compared to that increased by IS-fold vitamin E, but 4S0-fold vitamin E did not
compared to that increased by ISO-fold vitamin E.
Hepatic Nutrients. The concentrations of serum vitamin A, E and copper were
significantly (p < 0.05) lessened by retrovirus infection, whereas zinc was not affected
(Fig. 9.3A&B and Fig. 9.4A&B). Vitamin E supplementation at all levels significantly
(p < 0.05) elevated hepatic vitamin E levels in both normal mice and murine AIDS,
while ISO-fold vitamin E significantly (p < 0.05) further increased hepatic vitamin E
(Fig. 9.4A). However, 4S0-fold vitamin E did not further increase hepatic vitamin E
compared to that increased by ISO-fold vitamin E (Fig. 9.4A). 150- and 4S0-fold
vitamin E significantly (p < 0.05) increased hepatic vitamin A concentration in normal
mice, but IS-fold vitamin E failed to do (Fig. 9.4B). Vitamin E supplementation at all

229
levels significantly (p < 0.05) restored hepatic vitamin A, whereas ISO-fold vitamin E
significantly (p < 0.05) further increased vitamin A level compared to that increased
by IS-fold vitamin E. 4S0-fold vitamin E failed to further increase hepatic vitamin E
compared to that increased by ISO-fold vitamin E (Fig. 9.3B). Hepatic zinc and copper
were not affected by vitamin E supplementation at all levels, whereas vitamin E
supplementation at all levels significantly (p < 0.05) restored zinc levels, and 150- and
4S0-fold significantly (p < 0.05) increased hepatic copper (Fig. 9.4A&B). ISO-fold
vitamin E significantly (p < 0.05) further increased hepatic zinc compared to that
increased by IS-fold vitamin E, whereas 4S0-fold vitamin E failed to further increase
hepatic Zn and copper levels compared to that increased by ISO-fold vitamin E (Fig.
9.4A&B).
Intestinal Nutrients. Intestinal vitamin A and E levels was significantly ( p < 0.05)
reduced by retrovirus infection, whereas intestinal zinc and copper were not affected
(Fig. 9.SA&B and Fig. 9.6A&B). Vitamin E supplementation at all levels significantly
(p < 0.05) increased intestinal vitamin E and zinc concentrations, but not vitamin A and
copper (p < 0.05) in normal mice (Fig. 9.SA&B and Fig. 9.6A&B). 4S0-fold vitamin
E did not further increase vitamin E and zinc compared to that increased by ISO-fold
vitamin E in normal mice, even though ISO-fold vitamin E significantly (p < 0.05)
increased intestinal vitamin E and zinc compared to that increased by IS-fold vitamin E
(Fig. 9.SA&B and Fig. 9.6A&B). Vitamin E supplementation at all levels significantly
(p < 0.05) restored intestinal vitamin A and E levels in murine AIDS, whereas 150-
fold vitamin E significantly (p < 0.05) increase intestinal vitamin E compared to that

230
increased by IS-fold vitamin E, but not vitamin A (Fig. 9.SA&B). 4S0-fold vitamin E
had no effect on further increase of vitamin A and E in murine AIDS (Fig. 9.SA&B).
Vitamin E supplementation had no effects on intestinal copper in murine AIDS, whereas
4S0-fold vitamin E significantly ( p < O.OS) elevated intestinal zinc (Fig. 9.6A&B).
Production of IL-2 and IFN-'}'. IL-2 and IFN--y are secreted by Thl cells, and are
responsible for regulation of cell-mediated immunity against virus infections and tumors.
Dietary vitamin E supplementation significantly (p < O.OS) increased IL-2 release (Fig.
9.7A) and IFN--yrelease (Fig. 9.7B) by ConA-induced splenocytes from uninfected mice,
whereas ISO-fold and 4S0-fold vitamin E supplementation failed to further enhance
production of IL-2 and IFN--y compared to that increased by IS-fold vitamin E
supplementation. As the retrovirus infection progressed to murine AIDS, production of
IL-2 and IFN--y was suppressed (p < O.OS, Fig. 9.7A&B). IL-2 and IFN--y production
was significantly restored by dietary vitamin E at IS-, ISO- and 4S0-fold vitamin E
supplementation (p < O.OS), whereas ISO- and 4S0-fold vitamin E supplementation did
not further restore the levels of IL-2 and IFN--y produced by splenocytes compared to
that increased by IS-fold vitamin E supplementation (Fig. 9.7A&B).
Production of IL-6 and IL-lO. IL-6 and IL-lO are produced by Th2 cells, and are
responsible for regulation of humoral immune responses. Release of IL-6 by splenocytes
was not significantly affected by dietary vitamin E at any levels in uninfected mice (Fig.
9.8A), whereas IL-IO production could be significantly (p < O.OS) reduced by only
4S0-fold vitamin E supplementation (Fig. 9.8B). The retrovirus infection significantly
(p < O.OS) increased IL-6 and IL-IO production. However, elevated IL-6 and IL-lO

231
secretion during murine AIDS was significantly decreased (p < 0.05) by dietary vitamin
E supplementation at all levels of vitamin E supplementation (Fig. 9.8A&B), whereas
150- and 450-fold vitamin E supplementation did not further reduce the levels of IL-6
and IL-lO produced by splenocytes compared to that reduced by IS-fold vitamin E
supplementation.
Production of IL-6 and TNF-~. Production of IL-6 and TNF-~ by LPS-induced
splenocytes could be released by macrophages or B cells. Dietary IS-fold vitamin E
supplementation did not modify IL-6 by LPS-stimulated splenocytes in the uninfected
mice. However, 150- and 450-fold vitamin E supplementation significantly (p < 0.05)
reduced IL-6 production (Fig. 9.9A). All vitamin E supplementation had little effect on
the production of TNF-~ by LPS-stimulated splenocytes from uninfected mice (Fig.
9.9B). Increased secretion of IL-6 and TNF-~ during murine AIDS could be
significantly (p < 0.05) reduced by all levels of vitamin E supplementation, whereas
150- and 450-fold ~itamin E supplementation did not further reduce the levels of IL-6
and TNF-~ produced by splenocytes compared to that lessened by IS-fold vitamin E
supplementation (Fig. 9.9A&B).
Mitogenesis of Splenocytes. Proliferation of ConA- and LPS-induced splenocytes was
significantly (p < 0.05) increased by increased dietary vitamin E in a concentration
dependent manner in the uninfected mice (Fig. 9. lOA & B). Higher levels of dietary
vitamin E significantly (p < 0.05) increased T-cell and B-cell mitogenesis, which was
suppressed by retrovirus infection, whereas 450-fold increase of vitamin E
supplementation did not further enhance splenic T and B cell proliferation compared to

232
that increased by ISO-fold vitamin E supplementation (Fig. 9.lOA&B).
NK Cell Cytotoxicity. NK cell cytotoxicity was not affected by all levels of vitamin E
supplementation in uninfected mice (Fig. 9.11). The suppressed NK cell activity by
retrovirus infections were significantly (p < 0.05) restored by all levels of vitamin E
supplementation during murine AIDS, whereas 150- and 4S0-fold vitamin E
supplementation did not further increase splenic NK cell activity compared to that
increased by that IS-fold vitamin E supplementation, yet there was a trend to increase
NK cell activity as increase of vitamin E supplementation (Fig. 9.11).
Production of IgA and IgG. Supplemented vitamin E diets had no effect on IgA and
IgG production by LPS-stimulated splenocytes in the uninfected mice (Fig. 9.12A&B).
However, increased IgA and IgG levels induced by retrovirus infection were significantly
(p < 0.05) reduced by all levels of vitamin E supplementation in the murine AIDS,
whereas 150- and 4S0-fold vitamin E supplementation did not further decrease production
of IgA and IgG by splenocytes compared to that reduced by IS-fold vitamin E
supplementation (Fig. 9.12A&B).
Thymus Weight. As shown in Fig. 9.13, vitamin E supplementation has no effect on
the thymus weight in uninfected and infected mice.
Production of Cytokines by Thymocytes. IS-fold vitamin E slightly decreased IL-2
production, whereas 150- and 4S-fold vitamin E significantly (p < 0.05) reduced. IL-2
production by thymocytes (Fig. 9.14). The retrovirus-induced suppression ofIL-2 could
be significantly (p < 0.05) normalized by IS-fold vitamin E, however, 150- and 4S0-fold
vitamin E had no effects on that (Fig. 9.14). Vitamin E supplementation at all levels had

233
no effects on IL-4 production by thymocytes in the uninfected, normal mice, whereas
their supplementation in murine AIDS significantly (p < O.OS) reduced IL-4 production
during which had been elevated by retrovirus infection (Fig. 9.1S). However, IS0- and
4S0-fold vitamin E supplementation did not further reduce IL-4 production compared to
that reduced by IS-fold vitamin E during murine AIDS (Fig. 9.1S). IS-fold vitamin E
had no effect on thymic IL-6 production, whereas IS0- and 4S0-fold vitamin E
suppressed IL-6 production in the uninfected, normal mice (Fig. 9.16). Elevated IL-6
production by thymocytes during murine AIDS was significantly ( p < O.OS) reduced by
vitamin E supplementation at all levels, but IS0- and 4S0-fold vitamin E did not further
decrease IL-6 production compared to that lessened by IS-fold vitamin E supplementation
(Fig. 9.16). Retrovirus infection did not alter thymic IL-IO production (Fig. 9.17). IS
fold vitamin E had no effect on thymic IL-IO production, whereas IS0- and 4S0-fold
vitamin E suppressed IL-IO production in both the uninfected, normal mice and those
with murine AIDS (Fig. 9.17). 4S0-fold vitamin E supplementation did not further
reduce IL-IO production compared to that decreased by IS-fold vitamin E
supplementation (Fig. 9.17). These was no changes in IFN-')' production by thymocytes
from the uninfected, normal mice fed vitamin E at all levels (Fig. 9.18), whereas
increased IFN-')' production during murine AIDS was significantly ( p < O.OS)
normalized by various levels of vitamin E supplementation (Fig. 9.18). lSO- and 4S0-
fold vitamin E supplementation slight decreased thymocyte proliferation, whereas IS-fold
vitamin E supplementation slight increased thymocyte proliferation in the uninfected,
normal mice (Fig. 9.19). The retrovirus-induced suppression of thymocyte proliferation

234
was significantly (p < 0.05) enhanced by IS-fold vitamin E supplementation, whereas
150- and 4S0-fold had no effects on thymocyte proliferation (Fig. 9.19).

235
Discussion
The present study investigated the effects of different supplemental vitamin E
levels during murine AIDS on cytokine secretion, immune functions and nutritional
status. The findings presented in this study confirm and expand our previous findings
that vitamin E supplementation could be effective treatment, favorably affecting immune
response and nutritional ststus during murine AIDS. Vitamin E supplementation at 150-
and 450-fold were not immunotoxic, even though this extremely high vitamin E
supplementation appears to only marginally further normalize immune dysfunction and
cytokine dysregulation. These results suggest a possible role for high vitamin E dosage
as a potential therapeutic nutrient to help normalize immune dysfunction and malnutrition
caused by HIV infection, thereby retarding the development of AIDS.
Cytokines play crucial roles in the immune response. IL-2 is a pivotal cytokine
in the growth and differentiation of T cells, and activation of NK cells and lymphokine
activated killer cells (231). IL-2 also can act as a growth and differentiation factor for
B cells and activate macrophages. Stimulation of IL-2 by vitamin E is correlate with its
enhancement of T and B cell proliferation, and NK cell activity by vitamin E during
murine AIDS. Increased secretion of IFN-'Y by vitamin E may be part of the explanation
for its enhancement of tumor resistance during murine AIDS (225). IFN-'Y plays a key
role in T-cell mediated tumor regression by its anti-proliferative activity (341). IFN-'Y
has multiple distinct biological activities including anti-viral activity, activating
phagocytosis of macrophages and neutrophil cells, cytotoxicity of NK cells (397).
Enhancement of IFN-'Y by vitamin E in murine AIDS may be partly due to the decrease

236
of immunosuppressive product PGE,z produced by immunocompetent cells induced by
vitamin E (156). PGE,z is increased during murine AIDS (390) and is a potent inhibitor
of NK cells (397), which is a major source of IFN--y production in vivo (195). NK cells
were also injured by reactive oxygen species (ROS, 358, 359), which were significantly
enhanced during murine AIDS (225). Vitamin E supplementation in murine AIDS was
shown to be protective against AIDS-associated oxidative stress such as increased free
radicals and increased haptic lipid peroxidation (225). Thus vitamin E, acting as an
antioxidant, protects NK cells from attacks of ROS. This idea is strengthened by the fact
that vitamin E stimulated NK cell activity during murine AIDS in this study. Thus,
increased activity of NK cells by vitamin E supplementation is expected to be responsible
for the increased IFN--y. In turn, increased IFN--y depressed Th2 cytokine production,
explaining the decrease of IL-6 and IL-10 by vitamin E supplementation we observed in
this study. Elevated levels of IL-6 and IL-lO have been believed to be associated with
AIDS development. For instance, IL-lO can inhibit Th1 cytokine production (e.g. IL-2
and IFN--y), leading to imbalance of Th1 and Th2 cytokine profile. This imbalance is
believed to be a key point during development of AIDS (398). Increased IL-6 can also
stimulate mv replication in HIV-infected monocytes/macrophages and CD4+ T cells
(399,400), and contribute the hypergammaglobulinemia seen often in both AIDS diseases
(244). Therefore, immunomodulatory nature of vitamin E dose provide a basis for
vitamin E nutritional therapy in AIDS.
TNF-a levels are elevated in mv patients and murine AIDS (208, 365). The
physiological effects of TNF-a in the body include increasing phospholipase A2 activity

237
and generation of ROS (401), a potent inducer of HIY replication in monocytes (402-
405), and stimulating synthesis of PGEz, an immunosuppressive substance produced by
macrophages/monocytes and lymphocytes in human and murine AIDS (406). These
effects of TNF-a could also be directly lessened by vitamin E, because vitamin E
reduced TNF-a level in murine AIDS and inhibits phospholipase A2 and PGEz production
(148, 407). Thus, vitamin E supplementation during murine AIDS would contribute to
inhibition of retrovirus infection, via reducing generation of ROS, PGEz and TNF-a, and
inhibiting activity of phospholipase A2. Vitamin E may also directly inhibit viral
replication through inhibition of protein kinase C (PKC). The HIV coat protein gp120
induces PKC activity in lymphocytes (408). In turn, PKC activation results in the
transition of my from a state of latency to active replication in lymphocytes, and leads
to upregulation ofHIY replication in cells with non-dormant mv (409-411). This notion
is strongly supported by the fact that HIY transcription is redox regulated, and inhibited
by antioxidants such as N-acetylcysteine, a well-known antioxidant used to replenish
intracellular glutathione (412-415). Collectively, vitamin E supplementation not only
enhances the immune response and restor/! tissue vitamin E deficiencies but also directly
inhibit retrovirus replication, thereby retarding the progression to AIDS.
This result is consistent with our previous finding that longer duration ( more than
12 weeks) of vitamin E supplementation inhibited IL-2 production by thymocytes (416).
The exact physiological significance of high dosage of vitamin E supplementation on T
cell differentiation should be further defined. As dietary vitamin E reduced production
of IL-4, increased by retrovirus infection in the thymus, these changes may contribute
238
to the restoration of abrogation of T cell development during progression to murine or
human AIDS, normalizing immune dysfunctions initiated by retrovirus infection. Thus,
the reduction of IL-6 secretion by dietary vitamin E in murine AIDS may also contribute
to the restoration of T cell development in the thymus abrogated by retrovirus infection.
The physiological significance of increased production of IFN-'Y by thymocytes, induced
by retrovirus infection, may be involved in the up-regulation of MHC class I and II
expression on the surface of thymic stromal cells. It plays a crucial role in the positive
and negative selection during T cell education (Le. recognition 'self and 'non-self) in
the thymus. Thus, the elevated levels of IFN-'Y release by thymocytes in murine AIDS
may reflect the failure of T cell education, leading to loss of tolerance to self antigens
or reaction to non-self antigens. Supplemental vitamin E reduced the IFN-'Y production
in murine AIDS, suggesting modulatory effects of dietary vitamin E on thymic cytokine
production with reversing of impairment of T cell maturation in the thymus initiated by
retrovirus infection. Since the role of IL-lO in the T cell maturation is not elucidated so
far, the physiological significance of vitamin E-induced reduction of IL-lO production
is not clear.
Changes in function and subpopulations of thymocytes appear to be responsible
for the modulation of cytokine production by vitamin E supplementation. Possible
underlying mechanisms we propose include: (A) vitamin E supplementation reversing
the deficiencies of vitamin E in the thymus initiated by retrovirus infection, which may
be essential for T cell maturation; (B) Vitamin E supplementation normalized the
deficiency of hepatic zinc initiated by retrovirus infection (417), which has been shown

239
to be essential for T cell maturation (418-420); (C) Vitamin E supplementation reduced
the level of corticosteroids, which are potent inducers of thymocyte apoptosis (144).
Vitamin E supplementation is known to be not toxic in humans (144, 146). The
450-fold increase of vitamin E supplementation did not further increase the levels of
haptic and serum vitamin E. This may explain the nontoxicity of high dosage of vitamin
E supplementation observed in both human studies. The possible mechanism is increased
excretion of vitamin E in the body after increased oral vitamin E supplementation,
keeping vitamin E a reasonable levels. Therefore, extremely high vitamin E
supplementation (e.g. 150- and 450-fold) is not immunotoxic, even though it was not
more effective than that of 15-fold vitamin E supplementation.
Vitamin E supplementation has a positive effects on immune response in murine
AIDS (423). One of mechanisms of vitamin E immunoenhancing functions is that
vitamin E may improve tissue nutrient levels, which had been reduced by retrovirus
infection. Since some nutrient intakes are well known to be associated with immune
response, increase in tissue concentrations of nutrients can be related to significant
immunoenhancemen~ (119). Vitamin A supplementation was found to stimulate
lymphocyte proliferation response to Trichophyton and Candida and to stimulate cell
mediated cytotoxicity to allogenic tumor cells (424). Vitamin A supplementation in mice
stimulates immune functions and reduced death due to retrovirus infection (425).
Vitamin E supplementation has been found to stimulate T-helper lymphocytes, antibody
response, delayed cutaneous hypersensitivity reaction, the reticuloendothelial system, and
host resistance in animal models (426). Vitamin E has also been found to stimulate

240
phagocytosis and mitogen responsiveness, in addition to enhancement of humoral immune
response (424). Therefore, the increase of vitamin A and E in the tissues including
immune organs should contribute to ameliorate immune dysfunctions initiated by
retrovirus infection: increased proliferation of T and B in the spleen, and normalized
cytokine production by lymphocytes from spleen and thymus observed in murine AIDS
(423). Indeed, the improvement of nutritional status by various levels of vitamin E
supplementation is correlated with the enhancement of immune response by various levels
of vitamin E supplementation during murine AIDS we observed (427).
The underlying mechanism by which vitamin E supplementation restored hepatic
nutrients levels during murine AIDS is proposed as follow. Vitamin E may protect
gastrointestinal mucosal cells from retrovirus infection, possible via vitamin E's
inhibition of retrovirus replication (436). Thus, retrovirus-induced malabsorption would
be retarded and the improvement of nutritional status would be expected. High levels
of vitamin E supplementation is known to be nontoxic in humans (140, 144). The 450-
fold increase of vitamin E supplementation did not further increase the levels of haptic
and serum vitamin E. This may explain the non toxicity of high dosage of vitamin E
supplementation observed in both human and animal studies. The possible mechanism
is increased excretion of vitamin E in the body after increased oral vitamin E
supplementation, keeping vitamin E a reasonable levels. Therefore, extremely high
vitamin E supplementation (150- and 450-fold) is not toxic, even though it was not more
effective than that of 15-fold vitamin E supplementation at normalization of tissue
nutrient levels during murine retrovirus infection.

241
In conclusion, vitamin E supplementation in murine AIDS acts on various immune
components to modify immune defects and nutritional status induced by retrovirus
infection without any immunotoxicity at extreme high oral supplementation. It tends to
partially normalize immune dysfunction, cytokine dsyregulation and malnutrition during
murine AIDS. Thus, the vitamin E nutritional supplementation may provide additional
therapeutic approaches for treatment of HIV infected patients without additional
immunotoxicity.

..-. b!I -....
40
.c 30 b!I .... CI.I
~ :>-. 20
"0 o =
-bJl
E! --.... .c: bJl ....
10
800
600
IU 400
~ I:: IU 200 IU -~
C"I'.J o
242
II 1x .15x 1m 150x~ 450x
A
Unifected Murine AIDS b
Unifected Murine AIDS
Fig. 9.1 Effects of Vitamin E supplementation on Body and Spleen Weights During retrovirus infection. The values are mean + SD for 4 or 8 mice per group. Mouse number of groups for Ix and I5x was 4 mice per group. Mouse number of groups for I50x and 450x was 8 mice per group.
a p < 0.05 compared to control diet-fed uninfected, normal mice. b p < 0.05 compared to control diet-fed infected mice.

-r.. 81x • 15x m 150X~ 450x ~ ~ .-btl -btl
800
.: 600
~
= .- 400 S CIS ... :> 200
CJ
a
a
.... ... CIS Co ~
o~--
= 5 --S -~ 4 -= 3 .-s !! 2 > 8 1 :: r.. ~
ell 0
Uninfected
a
Unifected
Murine AIDS
Murine AIDS
243
Fig. 9.2 Effects of Various Levels of Vitamin E Supplementation on Serum Vitamin A and E During Retrovirus Infection. The values are mean + SD for 4 or 8 mice in each group. Mouse number of groups for 1 x and 15 x was 4 mice per group. Mouse number of groups for 150 x and 450 x was 8 mice per group.
a: p < 0.05 compared to control diet-fed uninfected, normal mice. b: p < 0.05 compared to control diet-fed infected mice.

Vitamin E
III 1x • 15x m 150x~ 450x
~ ~ 800 ac :::L. -~ == .... S CI:I ..... .... >
CJ .... .... CI:I Co. ~
==
600
400
200
2000
1700
~ 1400 bJ)
=.. -< c .• S c:I -.. >
1100
800
500
200
a
a
UninCected Infected
244
Fig. 9.3 Effects of Various Levels of Vitamin E supplementation on hepatic vitamin A and E during Retrovirus Infection. The values are mean + SD for 4 or 8 mice in each group. Mouse number of groups for 1 x and 15 x was 4 mice per group. Mouse number of groups for 150 x and 450 x was 8 mice per group.
a: p < 0.05 compared to control diet-fed uninfected, normal mice. b: p < 0.05 compared to control diet-fed infected mice.
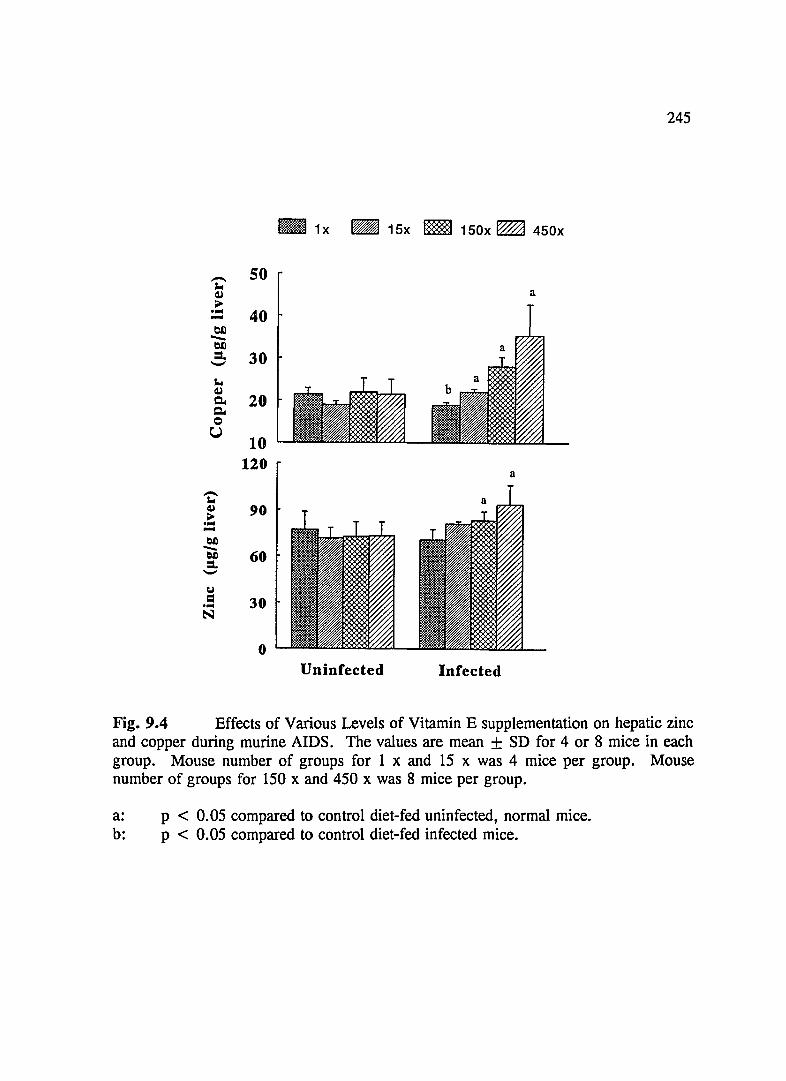
245
- 1x _ 15x m 150x ~ 450x
- 50 ~ QJ a ;;.. •• 40 -0.0 -0.0 :t. 30 -~ QJ
~ ~
20 0 u
10 120
a
'i:' 4.1 90 ;> .,.. -~ -~ 60 =. -Col
= 30 .,.. N
0 Uninfected Infected
Fig. 9.4 Effects of Various Levels of Vitamin E supplementation on hepatic zinc and copper during murine AIDS. The values are mean + SD for 4 or 8 mice in each group. Mouse number of groups for 1 x and 15 x was 4 mice per group. Mouse number of groups for 150 x and 450 x was 8 mice per group.
a: p < 0.05 compared to control diet-fed uninfected, normal mice. b: p < 0.05 compared to control diet-fed infected mice.

-4J .S 420 ..... rn 4J
== 320 .... ~ -~ 220 :::1. -~ = .... S = .... .... i>_
4> CI ... ~ III 4> ~
CI ...
120
60
50
40
30
20
10
246
_ 1x _ 15x rmJ 150x ~ 450x
a
a
a
Unirected Infected
Fig. 9.5 Effects of Various Levels of Vitamin E Supplementation on Intestinal Vitamin A and E During Retrovirus Infection. The values are mean + SD for 4 or 8 mice in each group. Mouse number of groups for 1 x and 15 x was 4 mice per group. Mouse number of groups for 150 x and 450 x was 8 mice per group.
a: p < 0.05 compared to control diet-fed uninfected, normal mice. b: p < 0.05 compared to control diet-fed infected mice.
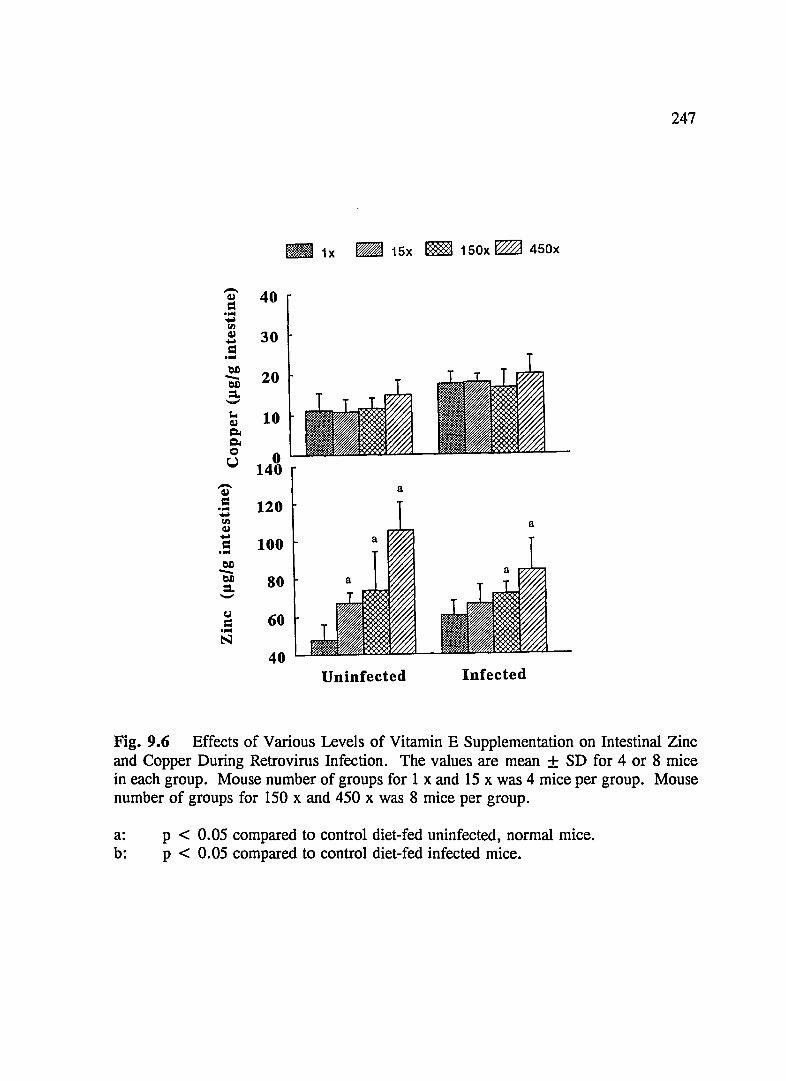
-Q,I = .... ..... til Q,I
-= ....
~
== .... .... til Q,I .... == .... ~ -
40
30
20
10
o 140
120
100
~ 80 =. -~ 60 .... N
40
247
_ 1x _ 15x ~ 150x ~ 450x
a
Uninfected Infected
Fig. 9.6 Effects of Various Levels of Vitamin E Supplementation on Intestinal Zinc and Copper During Retrovims Infection. The values are mean + SD for 4 or 8 mice in each group. Mouse number of groups for 1 x and 15 x was 4 mice per group. Mouse number of groups for 150 x and 450 x was 8 mice per group.
a: p < 0.05 compared to control diet-fed uninfected, normal mice. b: p < 0.05 compared to control diet-fed infected mice.
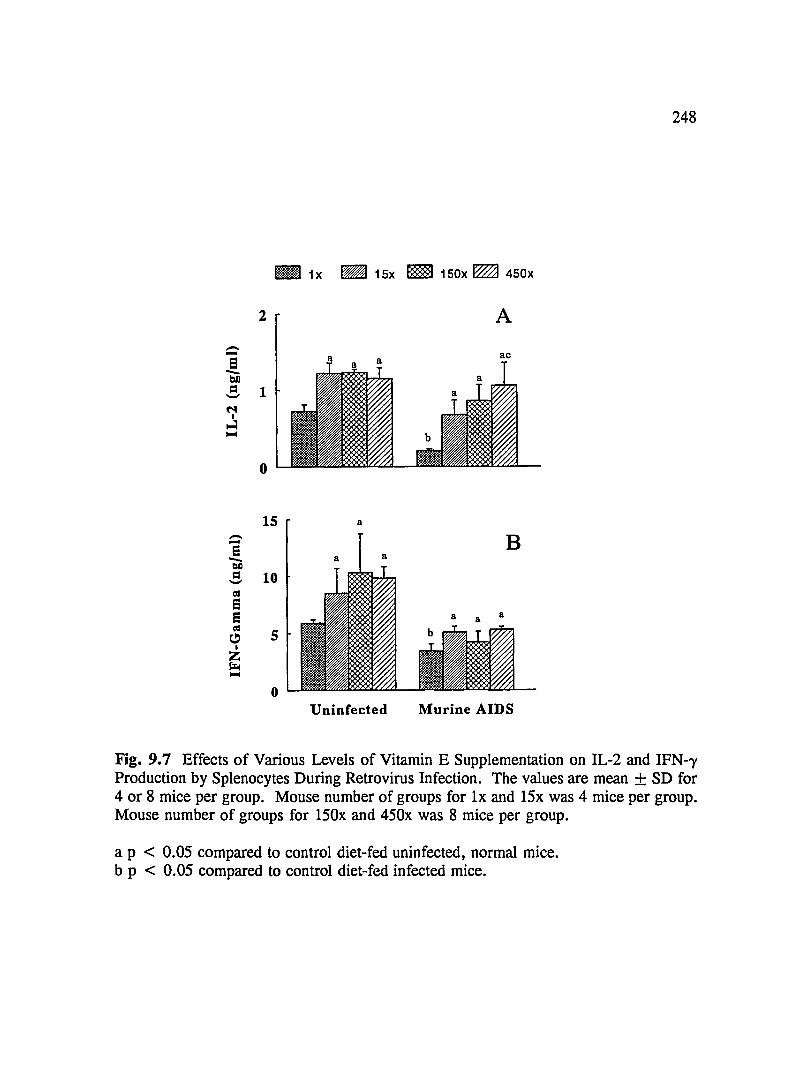
_ 1x _ 15x m 150x ~ 450x
2 A
--8 -OJ)
,s 1 ~
I ....:I ....
--e -~ = -= 8 e = ~ I
Z ~ ....
o
15 a
B a a
10
5
0 UninCected Murine AIDS
248
Fig. 9.7 Effects of Various Levels of Vitamin E Supplementation on IL-2 and IFN--y Production by Splenocytes During Retrovirus Infection. The values are mean + SD for 4 or 8 mice per group. Mouse number of groups for Ix and I5x was 4 mice per group. Mouse number of groups for I50x and 450x was 8 mice per group.
a p < 0.05 compared to control diet-fed uninfected, normal mice. b p < 0.05 compared to control diet-fed infected mice.

249
Vitamin E _ 1x _ 15x ml150x ~ 450x
4 b A
--e -bf)
= '-"
2
b B
o Uninfected Murine AIDS
Fig. 9.8 Effects of Various Levels of Vitamin E Supplementation on IL-6 and IL-lO Production by Splenocytes During Retrovirus Infection. The values are mean + SO for 4 or 8 mice per group. Mouse number of groups for Ix and 15x was 4 mice per group. Mouse number of groups for 150x and 450x was 8 mice per group.
a p < 0.05 compared to control diet-fed uninfected, normal mice. b p < 0.05 compared to control diet-fed infected mice.

Vitamin E
24
- 24 i ~ -S 18 tS I
~ Z 12 E-4 ~ CI ~ 6 o CI o
- 1x _ 15x 1m 150x ~ 450x
A
b B
~ 0 L.cm~~~L-
Uninfected Murine AIDS
250
Fig. 9.9 Effects of Various Levels of Vitamin E Supplementation on IL-6 and TNF-a Production by Splenocytes During Retrovirus Infection. The values are mean + SD for 4 or 8 mice per group. Mouse number of groups for Ix and I5x was 4 mice per group. Mouse number of groups for I50x and 450x was 8 mice per group.
a p < 0.05 compared to control diet-fed uninfected, normal mice. b p < 0.05 compared to control diet-fed infected mice.

251
-= _ 1x _ 15x m 150x ~ 450x
= ~ 1"'"4 40 ~ e A c.. (oJ 30 - ae
= 0 .... 20 ..... ~ J.4
~ 10 .... -0
J.4 =.. - 0 -QJ
_(oJ
gE-4 = 80 .. 1"'"4 ~
E! acd B ~ 60 CJ -= 0 .... 40 .... cu J.4
~ .... - 20 0
'" =.. -- 0 QJ CJ
== Unifected Murine AIDS
Fig. 9.10 Effects of Various Levels of vitamin E Supplementation on Splenocyte Proliferation During Retrovirus Infection. The values are mean + SD for 4 or 8 mice per group. Mouse number of groups for Ix and 15x was 4 mice per group. Mouse number of groups for 150x and 450x was 8 mice per group.
a p < 0.05 compared to control diet-fed uninfected, normal mice. b p < 0.05 compared to control diet-fed infected mice.

252
_1x _ 15x _ 150x _ 450x
~
~ 100
ac
a
50
o Uninfected Infected
Fig. 9.11 Effects of Various Levels of Vitamin E Supplementation on NK cell Avtivitu during retrovirus infection. The values are mean + SD for 4 or 8 mice per group. Mouse number of groups for Ix and 15x was 4 mice per group. Mouse number of groups for 150x and 450x was 8 mice per group.
a p < 0.05 compared to control diet-fed uninfected, normal mice. b p < 0.05 compared to control diet-fed infected mice.

Vitamin E
-~ 100 -:;... .... .... CJ .... ~ o .... .B 50 :;... U --11.1 U ~ Z
--e -boO =.. -~ boO
I-c
o
40
20
o
- 1x _ 15x 1m 150x ~ 450x
A Be
B b
Unifected Murine AIDS
253
Fig. 9.12 Effects of Various Levels of Vitamin E Supplementation on IgA and IgG Production by Splenocytes During Retrovirus Infection. The values are mean + SD for 4 or 8 mice per group. Mouse number of groups for Ix and 15x was 4 mice per group. Mouse number of groups for 150x and 450x was 8 mice per group.
a p < 0.05 compared to control diet-fed uninfected, normal mice. b p < 0.05 compared to control diet-fed infected mice.
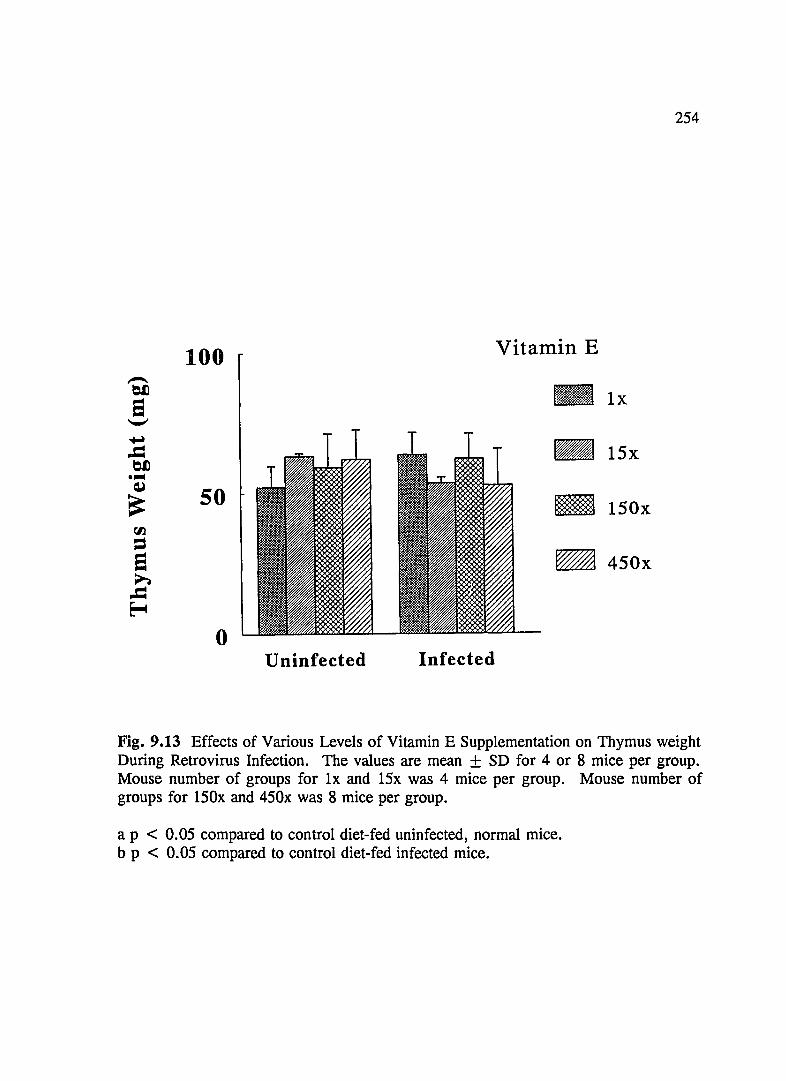
254
100 Vitamin E ~
b.Il - Ix a '-' .... --= I5x b.Il •• Q,)
50 ~ - I50x rI.l = -a 450x ~
-= ~ 0
Uninfected Infected
Fig. 9.13 Effects of Various Levels of Vitamin E Supplementation on Thymus weight During Retrovirus Infection. The values are mean + SD for 4 or 8 mice per group. Mouse number of groups for Ix and I5x was 4 mice per group. Mouse number of groups for I50x and 450x was 8 mice per group.
a p < 0.05 compared to control diet-fed uninfected, normal mice. b p < 0.05 compared to control diet-fed infected mice.

255
0.30 Vitamin E
- 1x
~ ,..... 0.20 -a 15x
-.... bf)
= - 150x ---M I 0.10 ~ -t-04 450x
0.00 Uninfected Infected
Fig. 9.14 Effects of Various Levels of Vitamin E Supplementation on IL-2 Production by Thymocytes During Retrovirus Infection. The values are mean + SD for 4 or 8 mice per group. Mouse number of groups for Ix and I5x was 4 mice per group. Mouse number of groups for I50x and 450x was 8 mice per group.
a p < 0.05 compared to control diet-fed uninfected, normal mice. b p < 0.05 compared to control diet-fed infected mice.
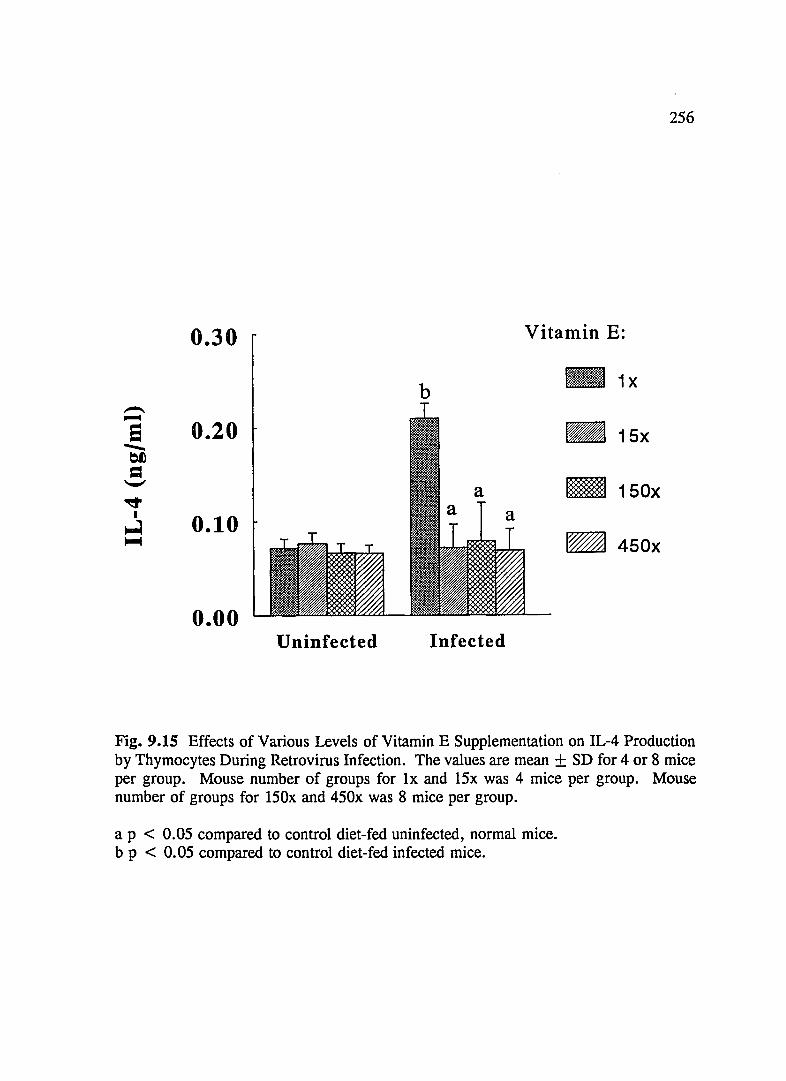
256
0.30 Vitamin E:
b - 1x ~ ....... a 0.20 - 15x --btl
= -'-' 150x ~
I 0.10 ~
_ 450x 1-4
0.00 Uninfected Infected
Fig. 9.15 Effects of Various Levels of Vitamin E Supplementation on IL-4 Production by Thymocytes During Retrovirus Infection. The values are mean + SD for 4 or 8 mice per group. Mouse number of groups for Ix and 15x was 4 mice per group. Mouse number of groups for 150x and 450x was 8 mice per group.
a p < 0.05 compared to control diet-fed uninfected, normal mice. b p < 0.05 compared to control diet-fed infected mice.

257
0.30 b Vitamin E - 1x
,-.. ,.... 0.20 -a 15x
~
bIl
== - 150x '-' \C
I 0.10 ~ - 450x '"""'"
0.00 Uninfected Murine AIDS
Fig. 9.16 Effects of Various Levels of Vitamin E Supplementation on IL-6 Production by Thymocytes During Retrovirus Infection. The values are mean + SD for 4 or 8 mice per group. Mouse number of groups for 1x and 15x was 4 mice per group. Mouse number of groups for 150x and 450x was 8 mice per group.
a p < 0.05 compared to control diet-fed uninfected, normal mice. b p < 0.05 compared to control diet-fed infected mice.

258
4 Vitamin E:
3 ~ 1x --e ~ 15x ........ ~ = 2 - ~ = 150x
1""04 I
~ ~ 450x 1-1
1
o U ninfected Infected
Groups
Fig. 9.17 Effects of Various Levels of Vitamin E Supplementation on IL-lO Production by Thymocytes During Retrovirus Infection. The values are mean + SD for 4 or 8 mice per group. Mouse number of groups for Ix and 15x was 4 mice per group. Mouse number of groups for 150x and 450x was 8 mice per group.
a p < 0.05 compared to control diet-fed uninfected, normal mice. b p < 0.05 compared to control diet-fed infected mice.

259
Vitamin E b 3 - 1x
2 - 15x
1m 150x
1 - 450x
o Uninfected Murine AIDS
Groups Fig. 9.18 Effects of Various Levels of Vitamin E Supplementation on IFN- y Production by Thymocytes During Retrovirus Infection. The values are mean + SD for 4 or 8 mice per group. Mouse number of groups for Ix and 15x was 4 mice per group. Mouse number of groups for 150x and 450x was 8 mice per group.
a p < 0.05 compared to control diet-fed uninfected, normal mice. b p < 0.05 compared to control diet-fed infected mice.
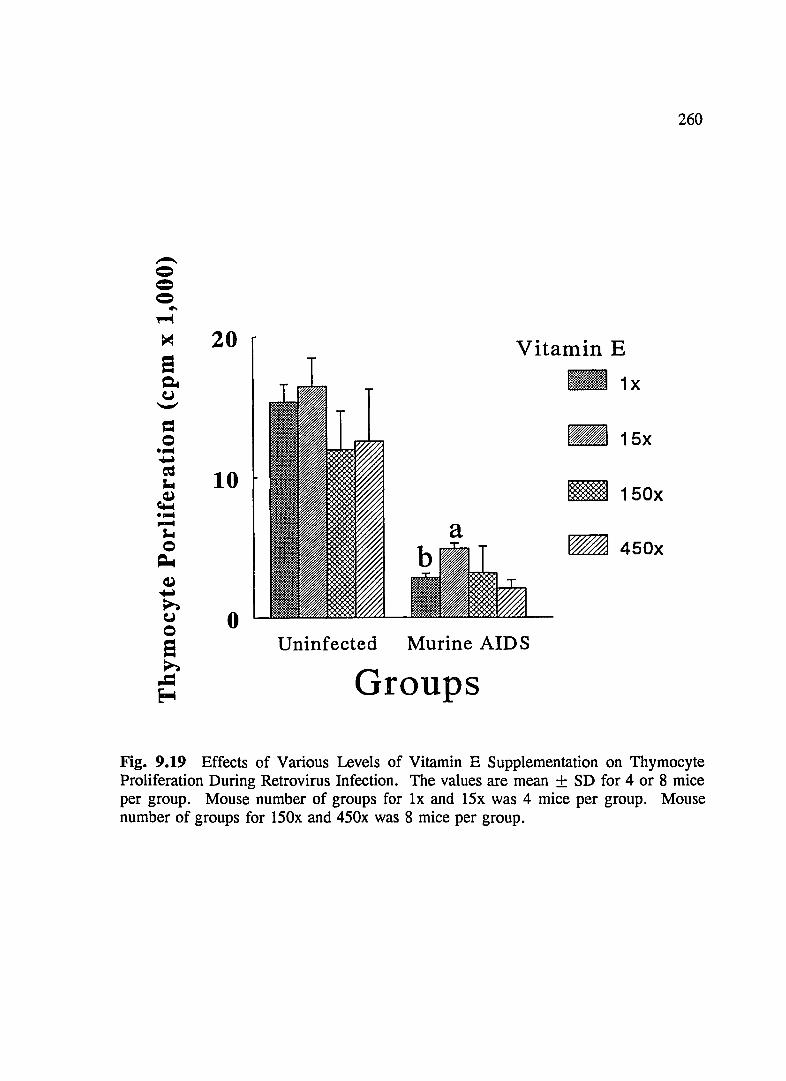
260
..-.. = = = .. ~
~ 20 Vitamin E a -~ 1x CJ '-"
= - 15x 0 .,. ~
~ 10 .. - 150x ~ •• ...... "'" -0 450x ~
Q,) ~
~ CJ 0 0 a Uninfected Murine AIDS ~
Groups ~ ~
Fig. 9.19 Effects of Various Levels of Vitamin E Supplementation on Thymocyte Proliferation During Retrovirus Infection. The values are mean + SD for 4 or 8 mice per group. Mouse number of groups for Ix and I5x was 4 mice per group. Mouse number of groups for I50x and 450x was 8 mice per group.

261
CHAPTER 10: OVERALL CONCLUSIONS
In present studies, we found that retrovirus infection altered the cytokine
production by T cells, macrophages and thymocytes. This cytokine dysregulation has
been shown in parallel with that of HIV -infected individuals. Thus, the elucidating of
the mechanisms of aberrant cytokine release by retrovirus infection should facilitate our
understanding HIV-induced immune dysfunction in humans. In addition, our present
results indicated that retrovirus infection also directly induced the nutritional deficiencies
in the various organs or tissues, including immune organs. Since the importance of these
nutrients in induction of immune responses, undernutrition has the theoretical potential
to accelerate the development of AIDS via immuno- suppression secondary to nutritional
deficiencies.
EtOH ingestion broadly suppresses the various arms of immune response. The
one of mechanisms of EtOH-induced immunosuppression is modulation of cytokine
release by EtOH. Our results indicated that EtOH consumption impaired the cytokine
release by splenocytes and thymocytes, which should contribute to suppression of
immune responses and impairment of T cell differentiation. Due to the overwhelming
evidence that the deleterious effects of chronic EtOH use on immune responses, it could
further enhances susceptibility to infection and development of AIDS. Our present data
suggested that dietary EtOH aggravated progression of immune dysfunction as it modified
production of immunological regulatory cytokines and immune functions. These data
also suggested that dietary EtOH consumption can modulate cytokine production by
thymocytes, adversely affecting T cell differentiation, especially during retrovirus

262
infection. These results produce evidences that EtOH consumption could be a cofactor
during development of AIDS, via producing altered immune responses and then
disrupting T cell differentiation. In addition, chronic EtOH can directly aggravate
undernutrition initiated by retrovirus infection. Such EtOH-induced malnutrition in AIDS
could be a cofactor, accelerating development of AIDS via immunosuppression secondary
to nutritional deficiencies.
Vitamin E supplementation restored the important immunoregulatory cytokine
production by splenocytes and thymocytes and immune response, which was suppressed
by dietary ETOH. Our results suggest that the suppressive effects of EtOH on the
immune response could be directly restored by dietary vitamin E supplementation,
thereby increasing host disease resistance to infections and tumors. Vitamin E
supplementation has been shown to normalize cytokine dysregulation by splenocytes and
thymocytes, and ameliorate immune dysfunctions, and improve undernutrition during
retrovirus infection. In addition, our data also indicated that dietary vitamin E
supplementation at extremely high levels was not immunotoxic, and can modulate
cytokine release and normalize immune dysfunctions during progression to murine AIDS,
which should favorably affect host resistance. These data also indicate that dietary
vitamin E supplementation at extremely high levels can modulate cytokine production by
thymocytes, affecting T cell differentiation, especially during murine AIDS. Thus, the
vitamin E nutritional supplementation may provide additional therapeutic approaches for
treatment of HIV infected patients without additional immunotoxicity. The clinical trials
for potential therapeutic role of vitamin E in AIDS individuals have not been performed.

263
Experimental results from murine AIDS studies have implied that vitamin E
supplementation may act on various immune components to repair immune defects
induced by retrovirus infection, and effectively normalize the other important nutrient
deficiencies initiated by retrovirus infection in the immune organs. Although the animal
data may not be totally extrapolated to HIV-positive humans, information obtained from
such studies using murine AIDS may be potentially transferable or serve as a basis for
the study of therapeutic roles of vitamin E in HIV -infected humans.
Vitamin E should not be considered as a direct anti-retroviral drug but rather as
a potentially immunomodulating antioxidant that achieves its anti-retroviral effect through
indirect mechanisms, possible through inactivation of triggers of HIV gene expression,
immunoenhancing, membrane fluidity, restoration of undernutrition and anti-oxidative
stress. Its use as combination therapy with other pharmacologic agents such as AZT
could have several advantages. First, it could lead to more complete viral suppression
by deceasing oxidative stress and enhancing immunity, associated with this retrovirus
infection, than any single drug used alone. Second, it may allow each drug to be used
in lower doses, thus limiting drug toxicities, and decreased frequency of drug-resistant
HIV production. Third, such immunorestorative treatment may be given during
maintenance therapy of the AIDS patient following the control of tumors and immune
dysfunction by chemotherapy. Fourth, the use of vitamin E may be important in
forestalling initial episodes of general immune disorders in some patients by extending
the period between HIV infection and the appearance of clinical symptoms of AIDS.
264
REFERENCES 1. Centers for Disease Controls For AIDS (1981-1990), MMWR,40:41,1991
2. Centers for Disease Control For AIDS, MMWR, 39:1, 1990.
3. Holmes, KK, Karon, JM, Kreiss, J. Am. Public Health 85:858, 1990.
4. Berkel men , RL, Heyward, WL, Stehr-Green, JL, Curran, JW. Am. J. Med. 86:761,1989.
5. Latarjet, R, Duplan, JF. Int. J. Radiat. BioI. 5:339, 1962.
6. Makino, M, Sei, Y, Arora, PK, Morse, HC, III, Hartley, JW. Impaired calcium mobilization in CD4 + and CD8+ T cells in a retrovirus-induced immunodeficiency syndrome, murine AIDS. J.Immunol. i49:1707,1993.
7. Cerny, A, Hugin, AW, Hardy, RR, Hayakawa, K, Zinkernagel, RM, Makino, M, Morse, HC, III, B cells are required for induction of T cell abnormalities in a murine retrovirus-induced inlmunodeficiency syndrome. J. Exp. Med. 171:315,1990.
8. Yetter, RA, Mark, R, Buller, I, Lee, JS, Elkins, KL, Mosier, DE, Fredrickson, TN, Morse,HC, III. CD4 + T cells are required for development of a murine retrovirus-induced immunodeficiency syndrome (MAIDS). J. Exp. Med. 168:623,1988.
9. Aziz, DC, Hunna, Z, Jolicoeur, P. Severe immunodeficiency disease induced by a defective murine virus. Nature (London), 338:505, 1989.
10. Chattopadhyay, SK, Mosrse, HC, III, Makino, M, Rusceti, SK, Hartley, HW. Defective virus is associated with induction of murine retrovirusinduced immunodeficiency syndrome. Proc. Natl. Acad. Sci. USA, 86:3862,1989.
11. Jolicoeur, P. FASEB. J. 5:2398,1991.
12. Cherung, SC, Chattoadhyay, SK, Hartley, JW, Morse, HC,III, Pitha, PM. Expression of defective virus and cytokine genes in murine AIDS. J. Virol. 65:3611,1991.
13. Huang, M, Simard, C, Jolicoeur, P. Immunodeficiency and clonal growth of targets cells induced by helper-free defective retrovirus. Science, 246: 1614, 1989.

265
14. Fauci, AS. Science 239:617, 1988.
15. Gardner, MB. In: "Animal Models of AIDS" pp.279-90 (1990).
16. Mosier, DE. Immunol. Invst. 15:233, 1986.
17. Watson, RR. Immunomodulation by alcohol: A cofactor in development of AIDS after retrovirus infection. In: Cofactors in HIV-I Infection and AIDS. CRC Press, pp 47-54, 1989.
18. Muralidhar, G, Koch, S, Haas, SM, Swain, SL. CD4 T cells in murine acquired immunodeficiency syndrome: Polyc1onal Progression to anergy. I. Exp. Med. 175:1589, 1992.
19. Muralidhar, G, Koch, S, Swain, SL. CD4 T cell subsets and superantigen in MAIDS. Adv. Biosci. 86:289, 1993.
20. Fitzpatrick, EA, Bryson, IS, Rhoads, C, Kaplan, AM, Cohen, DA. T-deficient transmembrane signaling in CD4 + T cells of retroviral-induced immune-deficient mice. I. Immunol. 148:3377, 1992.
21. Cohen, DA, Fitzpatrick, EA, Bryson, IS, Rhoads, C, Kaplan, AM. Mechanism of anergy in CD4+ T cells during murine AIDS. Adv. Biosci. 86:281,1993.
22. Chattopadhyay, SK, Makino, M, Hartley, JW, Morese, III HC. Pathogenesis of MAIDS, a retrovirus induced immunodeficiency disease in mice. In "Immunodeficient Animals in Experimental Medicine" (Eds., Wu, B-A and Zheng, I.) Basel, Switzerland, Karger, pp. 12, 1988.
23. Balkwill, FR, Burke, F. The cytokine network. Immunol. Today 10:299-304 (1989).
24. Mit!, BS. The interleukins. FASEB, I. 3:2379,1989.
25. Hamblin, AS Immunol. (suppl). Lymphokines and interleukins. 1:39, 1988.
26. Yokota, T, Coffman, RL, Hagiwara, H. Isolation and characterization of lymphokine (IL-5). Proc. Nat!. Acad. Sci. USA. 84:7388, 1987.
27. Yokota, T, Otsuka, T, Mm~mann, T. Isolation and characterization of a human interleukin cDNA clone, that express B-cell and T-cell stimulating activation. Proc. Ntal. Acad. Sci. USA. 83:5894, 1986.

266
28. Snapper, C, Finkelman, FD, Paul, WE. Regulation of IgGI and IgE production by interleukin 4. Immun. Rev. 102:51, 1988.
29. Tonkonogy, SL, Mckenzie, DT, Swain, SL. Regulation of isotype production by IL-4 and IL-5: Effects of lymphokines on Ig production depend on the state of activation of the responding B cells. J. Immunol. 142:4351, 1989.
30. Van Vlasselaer, P, Gascan, H, De Wall Malefyt, R, Devries, JE. IL-2 and a contact-mediated signal provided by TOR alpha beta + or TCR gamma delta + CD4 + T cells induce polyclonal Ig production by committed human B cells. Enhancement by IL-5, specific inhibition of IgA synthesis by IL-4. J. Immunol. 148: 1674, 1992.
31. Hsieh, CS, Macatonia, SE, Tripp, CS, Volf, SF, Q'Garra, A, Murphy, KM. Development of Thl CD4+ T cells through IL-12 produced by Listeria-induced macrophages. Science. 260:547, 1993.
32. Scott, P. IL-12: Initiation cytokine for cell-mediated immunity. Science. 260:496, 1993.
33. Harriman, G., Kunimoto, DY, Strober, S, Elliott, JF, Pactkau, V. The role of IL-5 in IgA B cell differentiation. J. Immunol. 140:3033, 1988.
34. Murakami, S, Ono, S, Havad, N, Hava, Y, Katoh, Y, Dobash, K, Takatsu, K. Hamaka, T. T cell derived factor BI51-TRFlIIL-5 activates blastoid cells among unprimed B cells to induce a polyclonal differentiation into immunoglobulin M secreting cells. Immunol. 65:221, 1988.
35. Taga, T, Kawanishi, Y, Hardy, RR, Hirano, T, Kishimato, T. Receptors for B cell stimulatory factor 2: Quantitation, specificity, distribution, and regulation of their expression. J. Exp. Med. 166:967, 1987.
36. Howard, M, Q'garra, A. Biological properties of interleukin 10. Immunol. Today 13: 198, 1992.
37. Biondi, A, Roach, JA, Schlossmann, SF, Todd, RF. Phenotypic characterization of human T-Iymphocyte populations producing macrophage activating factor lymphokines. J. Immunol. 133:281, 1984.
38. Kuwano, K, Kawashima, T, Arai, S. Antiviral effect of TNF-a and IFN--y secreted from a CD8+ influenza virus specific CTL clone. Viral.lmmunol. 6:1, 1993.

39. Michael, A, Hackett, I, Bennett, M, Kumar, V, Yuan, D. Regulation of B lymphocytes by natural killer cells. I. Immunol. 142: 1095, 1989.
267
40. Sandvig, S, Taskay, T, Andersson, I, De Ley, M, Andersson, U. Gammainterferon is produced by CD3+ and CD3-lymphocytes. Immunol. Rev. 97:51, 1987.
41. Van Der Merwe, PA. S. Afr. Med. I. 74:411, 1988.
42. Pace, IL, Russell, SW, Torres, BA, Hohnson, HM, Gray, PW. Recombinant mouse -y-interferon induces the priming step in macrophage activation for tumor cell killing. I. Immunol. 130:2011, 1983.
43. Leibson, HI, Geftar, M, Zlotnik, A, Marrack, P, Kappler, IW. Role of gamma-interferon in antibody-producing responses. Nature 309:799, 1984.
44. Nakamura, M, Daky, M, Gafter, M, Manser, T, Pearson, G. Effect of IFN--y on the immune response in vivo and on gene expression in vitro. Nature 307:381, 1984.
45. Sidman, C, Marshall, I, Shultz, I, Gray, P, Iohnson, HM. -y-interferon is one of several direct B cell-maturing lymphokines. Nature 309:801, 1984.
46. Sollid, I, Kvale, D, Brandtzaeg, P, Markussen, G, Thorsby, E. Interferon--y enhances expression of secretory component, the epithelial receptor for polymeric immunoglobulins. I. Immunol. 138:4303, 1987.
47. Grunfeld, C, Palladino, Jr. MA. Tumor necrosis factor: Immunologic, antitumor, metabolic, and cardiovascular activities. Adv. Int. Med. 35:45, 1990.
48. Feinmau, R, Henriksen-Destefazno, D, Tsujimoto, M, Vilcek, I. Tumor necrosis factor is an important mediator of tumor cell killing by human monocytes. I. Immunol. 138:635, 1987.
49. Cuturi, MC, Murphy, M, Costa Giomi, MP, Weinmann, R, Perussia, B, Trinchieri, G. Independent regulation of tumor necrosis factor and lymphotoxin production by human peripheral blood lymphocytes. I. Exp. Med. 165: 1581, 1987.
50. Beutler, B. The tumor necrosis factors: cachectin and lymphotoxin. Hosp. Pract. Feb. 15:45, 1990.

268
51. Paya, CV, Kenmotsu, N, Schoon, RA, Leibson, PJ. Tumor necrosis factor and lymphotoxin secretion by human natural killer cells leads to antiviral cytotoxicity. J. Immunol. 141:1989, 1988.
52. Chandra, RK, Scrimahaw, WS. Am. J. Clin. Nutr. 33:2694, 1980.
53. Chandra, RK. Nutrition, immunity and infections: Present knowledge and future directions. Lancet, i:688, 1983.
54. Dorsetor J, Whittle HC, Granwood BM. Persistent measles infection in malnourished children, Br. Med. J. 2: 1633, 1977.
55. Grunt JP. Clinical impact of protein malnutrition on organ mass and functions. In" Blackhur, G.L., Grant, J.P., Young, V.P., eds. Amino acid metabolism and medical applications", Boston: Wright, pp347,1977.
56. Dworkin BM, Wormser GP, Axelrod R. Dietary intake in patients with acquired immunodeficiency syndrome(AIDS), patients with AIDS-related complex and serologically positive human immunodeficiency virus patients: correlations with nutritional status. J Par. Ent. Nutr. 14:605, 1990.
57. Coodley G, Girard DE. Vitamins and Minerals in HIV infection J. General Intern. Med. 6:472, 1991.
58. Watson, RR. Murine models for acquired deficiency syndrome. Life Sci. 44:i, 1989.
59. Beach, RS, Mantero-Atienza, E, Eisdorfer, C. Altered folate metabolism in early HIV infection. JAMA, 259:3129, 1988
60. Harriman G, Smith PD, Horne MK. Vitamin B12 malabsorption in patients with acquired immunodeficiency syndrome. Arch Intern. Med. 149:2039, 1989.
61. Herbert, V. B12 deficiency in AIDS. JAMA, 260:2837, 1988.
62. Remacha, A. Eur. J. Haematol. 42:506,1989.
63. Bogden, JD, Baker, H, Frank, O. Micronutrient status and human immunodeficiency virus (HIV) infection. Ann. N.Y. Acad. Sci. 587:189, 1990.

64. Malcolm, JA, Tynn, DF, Sutherland, DC, Dobsm, P, Kelson, W., Carlton, J. Proceeding of the sixth International Conference on AIDS, Abstract Th.B. pp.206, 1990.
65. Passi, S, De Luca, C, Oicardo, M, Morrone, A, Lppolito, F. Blood deficiency values of polyunsaturated fatty acids of phospholipids, vitamin E and glutathione peroxidase as possible risk factors in the onset and development of acquired immunodeficiency syndrome. G. Ital. Dermoatol. Venereol. 125:125, 1990.
66. Falut, J, Tsoukas, C, Gold, P. Zinc as a cofactor in human immunodeficiency virus-induced immunosuppression. JAMA, 259:2850, 1988.
67. Fordycc-Baum, MK, Mantero-Atinza, E, Van Riel, P, Morgan, R, Beach, RS. Proceeding of Fifth International Conference on AIDS Abstract Th.B. pp.310, 1989.
68. Coulston, A, Mccorkindale, C, Dyhevik, W, Menigun, T. Proceddings of the Fifth International Conference on AIDS, Abstract Th.B 200 ,1990.
69. Dworkin, BD, Rosenthal, WA, Wormser, GP, Weiss, I. Selenium deficiency in AIDS. J. Parent. Enter. Nutr. 10:405, 1986.
70. Colman, N. Grossman, F. Nutritional factors in epidemic Kaposi's sarcoma. Semin. Oncol. 14 (suppl):54, 1987.
71. Nelson, TA, Wiley, CA, Reynolds-Kohler, C, Neese, LE, Margaretten, W, Levy, JA. Human Immunodeficiency virus detected in bowel epithelium from patients with gastrointestinal symptoms. Lancet, i:259, 1988.
72. Levy, JA, Margaretten, W, Nelson, J. Detection of HIV in Enterochromaffin cells in the rectal mucosa of an AIDS patient. Am. J. Gastroenterol, 84:787, 1989.
73. Adachi, A, Koenig, S, Gendelman, HE, Dauherty, D, Gattoni-Celli, S, Fauci, AS" Martin, MA. Productive, persistent infection of human colorectal cell lines with human immunodeficiency virus. J. Virol. 61:209, 1987.
74. Moyer, MD, Hout, RI, Tamirez, A, Jol, S, Meltzer, MS, Gendelman, HE, Infection of human gastrointestinal cells by HIV -1. Res. Human
269
Retrovir. 6: 1409, 1990.
75. Barnett, SW, Barboza, A, Wilcox, CM, Forsmark, LE, Levy, JA. Characterization of human immunodeficiency virus type 1 strains recovered from bowel of infected individuals. Virology, 182:802, 1991.
76. Moyer, MP, Hout, R, Wideman, D, Martin, D. Expression of a potential HIV receptor on human gastrointestinal epithelial cells (giecs). International Conference on AIDS, (Montreal). Abstr. WCP 607, 1989.
77. Knapp, HR. Nutrient drug interactions in " Present knowledge in nutrition: (eds. Brown, M.C.) Six Edition, International life sciences Institute-Nutrition Foundation, Washington, D.C. pp 451, 1990.
78. Mitchell, MC. Nutrient and Alcohol In " Present knowledge in nutrition: (eds. Brown, M.C.) Six Edition, International life sciences InstituteNutrition Foundation, Washington, D.C. pp 457, 1990.
79. Watzl, B, Watson, RR. Minireview: Immunomodulation by cocaine - a neuroendocrine response. Life Sci. 46, 1319, 1990.
80. Kabagawa, 0, Vaupel, BA, Gayama, S, Koehler, G, Kopf, M. Resistance of mice deficient in IL-4 to retrovirus-induced immunodeficiency syndrome (MAIDS). Science, 262:240, 1993.
81. Gordis, E, Lewis, M, Warren, C. Alcoholism" Medical and Health Annual: Encyclopedia britannica, pp 266, 1989.
82. Smith, FE, Palmer, DL. Alcoholism Infection and altered host defenses. J. Chronic. Dis. 29:35, 1976.
83. Capps, JA, Colemann, A. Influence of alcohol on prognosis of pneuma in Cook County Hospital. JAMA 80:750, 1923.
84. MacGregor, RR. Alcohol and Immune defense. J.Amer. Med. Assoc. 256: 1474, 1986.
85. Watson, RR. Alcohol and cellular immune responses, In: "Nutrition, Disease Resistance, and Immune Function (ED. Watson, R.R.)", Marcel Dekker, New York, pp. 313, 1984.
86. Smith, WI, Van Theil, DH, Whiteside, T, Janoson, B, Magovern, J, Puet, T, Rabin, BS. Altered immunity in male patients with alcoholic
270

liver disease: Evidence for defective immune regulation. Alcoholism Clin. Exp. Res. 4: 199, 1980.
87. Spagnuolo, PJ, MacGregor, RR. Acute ethanol effect on chemotaxis and other components of host defense. J. Lab. Clin. Med. 86:24,1975.
88. Gluckman, SJ, Dvorak, VC, MacGregor, RR. Host defenses during prolonged alcohol consumption in a controlled environment. Arch. Inter. Med. 137: 1539, 1977.
89. Mutchnick, MG, Lee, HH. Impaired lymphocyte proliferation response to mitogen in alcoholic patients. Absence of a relation to liver disease activity. Alcohol Clin. Exp. Res. 12: 155, 1988.
90. Jerrells, TR, Marietta, CA, Eckardt, MJ, Majchrowicz, E, Weight, EF. Effects of ethanol administration on parameters of immunocompetence in rats. J. Leuk. BioI. 39:499, 1986.
91. Marietta, CA, Jerrells, TR, Meagher, RC, Karanian, JW, Weight, FF., Echardt, MJ. Effects of long-term ethanol inhalation on the immune and hematopoietic systems of the rat. Alcohol Clin Exp. Res. 12:211, 1988.
92. Roselle, GA, Meddenhall, CL. Ethanol-induced alterations in lymphocyte function in the guinea pig. Alcohol Clin. Exp. Res. 8:62, 1984.
93. Lopez, MC, Huang, DS, Wang, Y, King, K, Watson, RR. Modification of the intestinal immune system by ethanol and murine AIDS. Adv. BioscL 86:299, 1993.
94. Wang, Y, Huang, DS, Giger, PT, Watson, RR. Influence of chronic dietary ethanol on cytokine production by murine splenocytes and thymocytes. Alcohol Clin. Exp. Res. in press, 1994.
95. Watson, RR; Odeleye, OE; Darban, HR; Lopez, MC. Modification of lymphoid subsets by chronic consumption of alcohol in C57BL/6 mice infected with LP-BM5 murine leukemia virus. Alcohol Alcoholism. 27:417, 1992.
96. Watson, RR, Moriguchi, S, Jackson, J, Werner, J, Wilmore, J, Freund, B. Modification of cellular immune functions in humans by endurance excise training during 6-adrenergic blockade with alcohol or propranolol. Med. Sci. Sport Exercise 18:95, 1986.
271

97. Blank, SE, Duncan, DA, Meadows, GG. Suppression of natural killer cell activity by ethanol consumption and food restriction. Alcohol Clin. Exp. Med. 15:16,1991.
98. Meadows, GG, Blank, SE, Duncan, DD. Influence of ethanol consumption on natural killer cell activity in mice. Alcohol c1in. Exp. Res. 13:476, 1989.
99. Walia, AS, Pruitt, KM, Rodgers, JD, Lamon, EW. In vitro effect of ethanol on cell-mediated cytotoxicity by murine spleen cells. Immunopharmacology, 13: 11, 1987.
100. Mufti, SI, Prabhala, R, Moriguchi, S. Functional and numerical alterations induced by ethanol in the cellular immune system. Immunopharmacology, 15:85, 1988.
101. Aldo-Benson, M. Ethanol and the B-cell: humoral immunity. in II Drugs of Abuse and Immune Function" (Watson, R.R., Ed.), CRC Press, Boca Raton, FL, pp 175; 1990.
102. Wang, Y, Huang, DS, Giger, PT, Watson, RR. Dietary ethanol-induced modification of cytokine release induced by LP-BM5 retrovirus causing murine AIDS, Alcohol Clin. Exp. Res. 17:1305, 1993.
103. Felver, ME, Mezey, E, McGurie, M, Mitchell, MC, Herlong, HF, Veech, GA, Veech, R.L. Plasma tumor necrosis factor a predicts decreased long-term survival in severe alcoholic hepatitis. Alcohol Clin. Exp. Res. 14:255, 1990.
104. McClain, CJ, Cohen, DA. Increased tumor necrosis factor production by monocytes in alcoholic hepatitis. Hepatology, 9:349, 1989.
105. Deviere, J, Content, J, Denys, C, Vandenbussche, P, Schandene, L, Wybran, J, Dupont, E. High interleukin 6 serum levels and increased production by leukocytes in alcoholic liver cirrhosis. correlation with IgA serum levels and lymphokines production. Clin. Exp. Immunol. 77:221, 1989.
106. Gauldie, J, Richards, C, Harnish, D, Land sorp , P and Baumann, H. Interferon 62/B stimulatory factor type 2 shares identity with monoderived hepatocyte stimulatory factor and regulates the major acute phase protein response in liver cells. Proc. Natl. Acad. Sci. USA 87:7255,
272

1987.
107. Geiger, T, Andus, T, Klapproh, I, Hirano, T, Kishimoto, T, Heinrich, PC, Induction of rat acute-phase proteins by interleukin 6 in vivo. Eur. I. Immuno!. 18:717, 1988.
108. Perlmutter, DH, Dinarello, CA, Pun sal , PI. Cachectin/tumor necrosis factor regulates hepatic acute-phase gene expression. I. Clin. Invest. 78: 1349, 1986.
109. Steel, DM, Whitehead, AS. Heterogeneous modulation of acute-phasereactant mRNA levels by interleukin-1B and interleukin 6 in the human hepatoma cell line PLC/PRF/5. Biochem. I. 277:477, 1991.
110. Dinarello, CA, Marnoy, SO, Rosenwassar, U. Role of arachidonate metabolism in the immunoregulatory function of human leukocytic pyrogen/lymphocyteactivating/interleukin 1. I. Immuno!. 130:890, 1983.
111. Saxena, S, Nouri-Aria, KT, Anderson, MG, Eddleston, AL, Williams, R. Interleukin 2 activity in chronic liver disease and the effect of in vitro alpha interferon. Clin. Exp. Immunol. 63:541, 1986.
112. Nelson, S, Bagby, G, Summer, W. The effects of acute and chronic alcoholism on tumor necrosis factor and the inflammatory response. I. Infec. Dis. 160:422, 1989.
113. Nelson, S, Bagby, G, Summer, W. Alcohol suppresses lipopolysaccharide-induced tumor necrosis factor activity in serum and lung. Life. Sci. 44:673, 1989.
114. Lieber, L. Alcohol and Nutrition: an overview. Alcohol Health and Research World 13: 197, 1989.
115. Derr, RL, Porta, EA, Larkin, EC, Raco, GA. Is ethanol per se hepatoxic ? I. Hepatol. 10:381, 1990.
116. Leonard, TK, Mohs, ME, Watson, RR. The cardiovascular effects of alcohol. In" Nutrition and Heart Disease Volume I" (Ed Watson, R.R.). CRC Press, Boca Raton, Florida, pp 19, 1987.
117. Watzl, B, Watson, RR. Nutrition and alcohol-induced immunomodulation. In " Nutrition and Alcohol" (Eds. Watson, R.R. and Watzl, B.) CRC Press, Boca Raton, Florida, pp 429, 1992.
273

118. Chandra, RK. Ed., in Nutrition and Immunology, Alan R. Liss, New York, pp342, 1988.
119. Sherman, AR, Hallgnist, MA. Nutrients and Immunity in "Present knowledge in nutrition: (eds. Brown, M.C.) Six Edition, International life sciences Institute-Nutrition Foundation, Washington, D.C. pp 463, 1990.
120. Grummer, M, Erdma, J. Effect of chronic alcohol consumption and moderate fat diet on vitamin A status in rats fed either vitamin A or beta carotene. J. Nutr. 113:350, 1983.
121. Ryle, PR, Thomas, AD. Nutrition and vitamins in alcoholism. In: Clinical biochemistry of Alcoholism" (Ed Rosalki, S.B.) Churchill Livington, New York, pp 188, 1984.
122. Cunningham-Rundles, S. Effects of nutritional status on immunological functions. Am. J. Clin. Nutr. 35: 1202, 1985.
123. Good, RA, Fernandes, G, Yunis, EJ, Copper, WC, Jose, DC, Kramer, JR, Hansen, MA. Nutritional Deficiency, immunological function and disease. Am. J. PathoI. 84:599, 1976.
124. Lenoard, TK, Watson, RR. The AIDS-immunocompetence-nutritioninfection cycle. In " Nutrition, Immunomodulation and AIDS" (Ed Watson, R.R.) CRC Press Inc. Boca Raton, Florida, pp245, 1990.
125. Bjorne-Boe, GA, Johnsen, J, Biorne-Boe, A, Bache-Wiig, J, Morland, J, Drevon, CA. Diminished serum concentration of vitamin E in alcoholics. Ann. Nutr. Metab. 32:56, 1988.
126. Meeker, HC, Eskew, ML, Scheuchenzuber, W, Scholtz, RW, Zarkower, A. Antioxidant effects of cell-mediated immunity. J. Leuk. BioI. 38:451, 1985.
127. Bendich, A, Gabriel, E, Machlin, U. Effect of dietary level of vitamin E on immune system of the spontaneously hypertensive (SHR) and normotensive Wistar Kyoto (WKY) rat. J. Nutr. 113: 1920, 1983.
128. Keen, CL, Gershwin, ME. Zinc deficiency and immune functions. Annu. Rev. Nutr. 10:415, 1990.
129. Feller, LS, Smolin, G, Okumoto, M, Condon, D. Herpetic keratitis in
274
zinc-deficient rabbits. Invest. OphthalmoI. Vi suI. Sci. 22:788, 1982.
130. Fenwick, PK, Aggett, PI, Macdonald, DC, Huber, C, Wakelin, D. Zinc deprivation and zinc repletion: effect on the response of rats to infection with Trichinella spiralis. Am. I. Clin. Nutr. 52:166, 1990.
131. Fraker, PI, Caruso, R, Kierszenbaum, F. Alteration of the immune and nutritional status of mice by synergy between zinc deficiency and infection with Trypanosoma cruzi. I. Nutr. 107:1889, 1977.
132. Mohn, ME, Watson, R.R. Ethanol induced malnutrition, a potential cause of immunosuppression during AIDS. In" Alcohol, Immunomodulation, and AIDS" (Eds. Seminara, D.; Watson, R.R.; Panlowski, A.). Alan R. Liss Inc. New York, pp419, 1990.
133. Bendich, A, Gabriel, E, Machlin, U. Protective effect of taurine, zinc and tocopherol on retinol-induced damage in human lymphoblastic cells. Ann. NY. Acad. Sci. 435:382, 1984.
134. Darban, H, Watson, RR, Darban, J, Shahbazian, LM. Modification of resistance to Streptococcus pneumonia by dietary ethanol, immunization and murine retroviral infection. Alcoho Clin. Exp. Res. 16:844, 1992.
135. Odeleye, OE, Eskelson, CD, Mufti, SI, Watson, RR. Vitamin E inhibition of lipid peroxidation and ethanol-mediated promotion of esophageal tumorigenesis. Nutr. Cancer 17:223, 1992.
136. Shahbaazian, LM, Darban, HR, Darban, JR, Stazzone, AM, Watson, RR. Influence of the level of dietary ethanol on resistance to Streptococcus pneumonia in mice with murine AIDS. Alcohol Alcoholism. 27:417, 1992.
137. Dunne, FJ. Alcohol and the immune system. A causative agent in altering host defense mechanisms. Bris. Med. J. 298:534, 1989.
138. Metzler, CW, Wirt, R. Social and behavior factors associated with high risk sexual behavior among adolescents. I. Behav. Med. 13:245, 1990.
139. Bagasra, 0, Whittle, P, Kajdacsy-Balla, A, Lischner, HW. Effects of alcohol ingestion on in vitro susceptibility of peripheral blood mononuclear cells to infection with HIV -1 and on CD4 and CD8 lymphocytes. Prog. Clin. BioI. Res. 325:351, 1990.
275

140. Saravolatz, LD, Cerra, RF. The effect of alcohol on HIV infection in vitro. Prog. Clin. BioI. Res. 325:267, 1990.
141. DesJarlis, DC, Friedman, SR. HLTV-III/LAV associated disease progression and cofactors in a cohort of IV drug abusers. AIDS 1:105, 1989.
142. Kaslow, RA, Blackwelder, WC, Ostro, DG, Yerg, D, Palenicek, J, Coulson, AH, Valdiserri, RO. No evidence for a role of Alcohol or other psychoactive drugs in accelerating immunodeficiency in HIV -I-positive individuals. JAMA, 261:3424, 1989.
143. Odeleye OE, Watson RR. The potential role of vitamin E in the treatment of immunological abnormalities during acquired immune deficiency syndrome. Prog. Food Nutr. Sci. 15:1, 1991.
144. Bendich, A, Machlin, U. Safety of oral intake of vitamin E. Am. J. Clin.Nutr. 48:612, 1988.
145. National Research Council (US) subcommittee on the tenth edition of the RDAS, fat soluble vitamin. In:" Subcommittee of the tenth edition of the RDAS, (ed. Recommended Dietary Allowances). Washington, D.C., National Academy Press, pp 78, 1989.
146. Mino, M. Use and safety of elevated dosages of vitamin E in infants and children. Int. J. Vita. Nutr. Res. Suppl. 30:69, 1989.
147. Meydani SN, Meyani M, Blumberg JB. Antioxidants and the aging immune response. Adv. Exp. Med. BioI. 262:57, 1990.
148. Meydani SN, Barklund MP, Liu S. Vitamin E supplementation enhances cell-mediated immunity in healthy elderly subjects. Am J. Clin. Nutr. 52:557, 1990.
149. Watson, RR, Ceonard, JK. J. Am. Diet Assoc. 86:505, 1986.
150. Watson, RR, Moriguchi, S, Jackson, J, Werner, J, Wilmore, J, Freund, B. Modification of cellular immune functions in humans by endurance excise training during B-adrenergic blockade with ateholol or propranolol. Med. Sci. Sport Exercise 18:95, 1986.
151. Shefty, B, Schultz, R. Influence of vitamin E and selenium on immune response mechanisms. Fed. Proc. 38:2139, 1979.
276

152. Taccone-Galluci, M, Giardini, D, Piazza, A, Spagnoli, GC, Bandino, D, Lubrand, R, Taggi F, Evangeli, B, Monaco, P. Vitamin E supplementation in hemodialysis patients: Effects on peripheral blood mononuclear cell lipids peroxidation and immune response. Clin. Nephroi. 25:81, 1986.
153. Prasad, IN. Effect of vitamin E supplementation on leukocyte function. Am. J. Clin. Nutr. 33:606, 1980.
154. Bendich, A. Antioxidant vitamins and their functions in immune responses. Adv. Exp. Med. BioI. 262:35, 1990.
155. Kline, K, Rao, A, Romach, EH, Kidao, S, Morgan, TJ, Snaders, BG. Vitamin E modulation of disease resistance and immune responses. Ann. N. Y. Acad. Sci. 587:294, 1990.
156. Meydani, SN, Meydani, M, Verdon, CP, Shapiro, AA, Blumberg, JB, Hayes, KC. Vitamin E supplementation suppresses prostaglandin E2 synthesis and enhances the immune response of aged mice. Mech Aging Dev. 34:191, 1986.
157. Welsh, A. Lupus erythematosus; Treatment by combined use of massive amounts of calcium pantothenate with synthetic vitamin E. SO-A.M.A. Archives of Dermat. and Syph, 1952.
158. Anton, RF, Becker, JC, Randall, CL. Ethanol increases PGE and thromboxane production in mouse pregnant uterine tissue. Life Sci. 46: 1145, 1990
159. Tabakoff, B, Jaffe, RC, Ritzmann, RF, Corticosterone concentration in mice during ethanol drinking and withdrawal. J. Pharm. Pharmacoi. 30:371, 1978.
160. Lim, TS, Putt, N, S atran ski , D, Chung, C, Watson, RR. Effect of vitamin E or cell mediated immune response and serum corticosterone in young and maturing mice. Immunology 44:289, 1981.
161. Furman PH, Fyte JA, St. Clair MH. Phosphorylation of 3'-azido-3'deoxythymidine and selective interaction of the 5'-triphosphate with human immunodeficiency virus reverse transcriptase. Proc. Nati. Acad. Sci. USA, 83:8333, 1986.
277

162. Erice A, Mayers DL, Strike DG, Sannerud KJ, McCutchan FE, Henry K, Balfour HH, Jr. Primary infection with zidovudine-resistant human immunodeficiency virus type I. J. New. Engl. Med. 328:1163, 1993.
163. Chandra, RK, Scrimshaw, WS. Immunocompetence in nutritional assessment. Am. J. Clin. Nutr. 33:2694, 1980.
164. Gazzinelli, RT, Makino, M, Chattopadhway, SK, Snapper, CM, Sher, A, Hugin, AW, Morese, H.C., III. J Immunol. 148:182, 1992
165. Scollay, R, Wilson, A, D'amico, A, Kelly, K, Egreton, M, Pearse. M, Wu, L, Shortamn, K. Imrnunol. Rev. 104:81-120, 1988.
166. Lesley, J, Trotter, J, Schutle, T, Hyman, R. Phenotypic analysis of the early events during repopulation of the thymus by bone marrow prothymocyte cells. Immunol. 128:63, 1990
167. Carding, SR, Hayday, AC, Bottomly, K, Cytokines in T-cell development. Immunol. Today. 12:239, 1991
168. Joshi, VV, Oleske, JM. Pathologic appraisal of the thymus gland in acquired immunodeficiency syndrome in children, Arch. Pathol. Lab. Med. 109: 142, 1985.
169. Schuurman, HI, Krone, WJA, Broekhuizen, R, Van Baarien, J, Van Veen, P, Goldtein, AL, Huber, J, Goudsmit, J. The thymus in acquired immune deficiency syndrome, comparison with other types of immunodeficiency disease, and presence of components of human immunodeficiency virus type I. Am. J.Pathol. 134:1329, 1989.
170. Schnittman, SM, Singer, KH, Greenhouse, JJ, Stanley, SK, Whichard, LP, Haynes, BF, Fausci, AS. Thymic microenvirnment induces HIV expression. J. Immunol. 147:2553, 1991.
171. Schnittman, SM, Singer, KH, Greenhouse, JJ, Stanley, SK, Whichard, LP, Haynes, BF, Fauci, AS, VII international conference on AIDS. Abstract Book Vol 2 Florence, Italy, p. 153, 1991.
278
172. Tanaka, K. E., Hatch, W.C., Kress, Y., Soeiro, R., Calvelli, T., Rashbaum, W.K., Rubinstein, A., and Lyman, W.D. J AIDS, 5:94, 1992.
173. Lopez, MC, Chen, GJ, Huang, DS, Wang, Y, Watson, RR. Int. J. Immunopharmac. in press, 1992.

174. Breen, EC, Rezai, AR, Hirano, T, Kishimoto, T, Martinez-Maza, O. J. ImmunoI144,480, 1990.
175. Lahdevirta, K, Maury, CPL, Teppo, AM, Repo, H. Am. J. Exp. 85,289, 1988.
176. Grunfeld, C, Feingold, KR. The role of the cytokines, interferon alpha and tumor necrosis factor in the hypertriglyceridemia and wasting of AIDS. J.Nutr. 122:749, 1992.
177. Odeleye, OE, Eskelson, CD, Watson, RR. Changes in Hepatic Lipid Composition after infection by LP-BM5 causing murine AIDS. Life Sci. 51: 129, 1992
178. Mosmann, TR, Coffman, RL. Thl and Th2 Cells: Different Patterns of Lymphokine Secretion Lead to Different Functional Properties. Ann. Rev. Immunol. 7:145, 1989.
179. Fernandez-Botran, R, Sanders, VM, Mosmann, TR, Vitetta, ES. J. Exp. Med. 168:543, 1988.
180. MacDonald, HR, Budd, RC, Howe, RC. A CD3- subset of CD4-CD8+ thymocytes: a rapidly cycling intermediate in the generation of CD4+CD8+ cells. Eur. J. Immunol. 18:519, 1988.
181. Ceredig, R, Glasebrook, AL, MacDonald, HR. Phenotypic and functional properties of murine thymocytes. J. Exp. Med. 155:358, 1982.
182. Lopez, MC, Colombo, LL, Huang, DS, Wang, Y, Watson, RR, Modification of thymic cell subsets induced by long-term cocaine administration during murine retroviral infection producing AIDS. Clin. Immunol. Immonopathol. 65:45, 1992.
183. Agus, DB, Surh, CD, Sprent, J. J. Exp. Med. 173:1039, 1991.
184. LO, D, Burldy, LC, Widera, G, Cowing, C, Flavell, RA, Palmiter, RD, Brinster, RL. Cell 53: 159, 1988.
185. Naparstek, Y, Ben-Nun, A, Holoshitz, J, Reshef, T, Frenkel, A, Rosenberg, M, Cohen, IR, Nature (Lod.) 300:262, 1982.
186. Naparstek, Y, Ben-Nun, A, Holoshitz, J, Reshef, T, Frenkel, A, Rosenberg, M, Cohen, IR. Eur. J. Immunol. 13:418, 1983.
279

280
187. Fink, PJ, Bevan, MJ, Weissman, IL. J.Exp. Med. 159:436, 1984.
188. Gutierrez-Ramos, JC, Martinez-A, C, Kohler, G. Immunol Res. 140:661, 1990
189. Zuniga-Pflucker, JC, Kruisbeek, AM. Intrathymic radioresistant stem cells follow on IL-2/IL-2R pathway during thymic regeneration after sublethal irradiation. J.Immunol. 144, 3736, 1989.
190. Ceredig, R, Medveczky, J, Skulimowski, A. Mouse fetal thymus lobes cultured in IL-2 generate CD3+ ,TCR TO expressing CD4-/CD8- cells. J. Immunol. 142:3353, 1989.
191. Plum, J, De Smedt, M, Leclercq, G, Tison, B. Inhibitory effect of murine recombinant IL-4 on thymocyte development in fetal thymus organ cultures. J. Immunol. 145: 1066, 1990.
192. Tepper, RI, Levinson, DA, Stanger, BZ, Compos-Tosres, J, Abbas, AK, Leder, P. IL-4 induces allergic-like inflammatory disease and alters Tcell development in transgenic mice. Cell 62:457, 1990.
193. Lewis, DD, Yu, CC, Forbush, KA. Interleukin 4 expressed in situ selectively alters thymocyte development. J. Exp. Med. 173:89, 1991.
194. Nakano, N, Kikutani, H, Kishimoto, T. Early T Lymphocytes: Differentiation in vivo of adult intrathymic precursor cells. Dev. Immunol. 1 :77, 1990.
195. Scott. P, Kaufmann, SHE. The role of T-cell subsets and cytokines in the regulation of infection. Immunol. Today, 12:348, 1991.
196. Mingari, MC, Poggi, A, J. Exp. Med., 174:21, 1991.
197. Garni-Wagner, BA, Witte, IL, Tutt, MM, J. Immunol. 144:796, 1990
198. Chlehowski, RT. Significance of altered nutritional status in acquired immune deficiency syndrome (AIDS). Nutr. Cancer 7:85, 1985.
199. Kolter, DP, Gartz, HP, Lange, M, Klein, EB, Halt, PRo Enteropathy associated with the acquired immunodeficiency syndrome. Ann. Intern. Med. 101:421, 1984.
200. Ullrich, R, Zeitz, M, Heise, M, Lage, M, Hoffken, G, Recken, EO. Small intestinal structure and function in patients infected with human

immunodeficiency virus (HIV): Evidence for HIV-induced enteropathy. Ann. Intern. Med. 111:15, 1989.
201. Falutz, J, Tsoukas, C, Gold, P, Zinc as a cofactor in human immunodeficiency virus---induced immunosuppression. JAMA 259:2850, 1988.
202. Dugan, RE, Frigero, NA, Siebert, JM. Calorimetric determination of vitamin A and its derivative with trifluoroacetic acid. Anal. Chern. 36: 114, 1964.
203. Colman, N, Grossman, F. Similarities between AIDS and PCM. Am. J. Public Med. 73: 1332, 1983.
204. Eskew, ML, Scheuchenzuber, WJ. The effects of ozone inhalation on the immunological response of selenium and vitamin E deprived rats. Env. Res. 40:274, 1986.
205. Eskew, ML, Scholtz, RW, Reddy, CC, Todhunter, DA, Zarkower, A, Effects of vitamin E and selenium deficiencies on rat immune function. Immunology, 54: 173, 1985.
206. Gebremichael, A, Levy, EM, Corwin, LM. Adherent cell requirement for the effect of vitamin E on in vitro antibody synthesis. J. Nutr. 114: 1297, 1984.
207. Surkina, ID, Orlova, Z. Changes in relation to stress. Fiziol. Chel. 12:460, 1986.
208. Wang, Y, Huang, DS, Giger, PT, Watson, RR. The kinetics of imbalanced of cytokine production by T cells and macrophages during the murine AIDS. Adv. Biosci. 86:673, 1993.
209. Huang, DS, Wang, Y, Watson, RR. Alterations of cytokine production and proliferation in mesenteric lymph nodes cuased by LP-BM5 retrovirus infection producing murine AIDS. Immunol. Regional. accepted, 1993.
210. Jain, VK, Chandra, KK. Does nutritional deficiency predispose to acquired immune deficiency syndrome? Nutr. Res. 4:537, 1984.
211. Fenwick, PK, Aggett, PJ, Macdonald, DC, Humber, C, Wakelin, D. Zinc deprivation and zinc repletion: effect on the response of rats to
281
infection with Strongyloides ratti. Am. J. Clin. Nutr. 52:173, 1990.
212. Pedroni, E, Baianchi, E, Ugazio, AG, Burgio, GR. Immunodeficiency and steely hair. Lancet i: 1303, 1975.
213. Graham, GG, Cordano, A. Copper depletion and deficiency in the malnourished infant. Johns Hopkins Med. J. 124: 139, 1969.
214. AI-Rashid, RA, Spangler, J. Neonatal copper deficiency. N. Eng. J. Med. 285:841, 1971.
215. Karpel, JT, Peden, VH. Copper deficiency in long-term parenteral nutrition. J. Pediatr. 80:32, 1972.
216. Yuen, P, Lin, HJ, Hutchison, JH. Copper deficiency in a low birthweight infant. Arch. Dis. Child. 54:553, 1979.
217. Boyne, R, Arthur, JR, Effects of selenium and copper deficiency on neutrophil function in cattle. J. Compo Pathol. 91:271, 1981.
218. Jones, DG, Suttle, NF. Some effects of copper deficiency on the resistance of mice to infection with pasteurella haemolytica. J. Compo Pathol. 93: 143, 1983.
219. Jones, DG, Suttle, NF. Some effects of copper on leukocyte function in sheep and cattle. Res. Vet. Sci. 31:151, 1981.
220. Prohaska, JR, Lukaewycz, OA. Copper deficiency suppresses the immune response in mice. Sciences 213:559, 1981.
221. Lukasewycz, OA, Prohaska, JR. Lymphocytes from copper-deficient mice exhibit decreased mitogen reactivity. Nutr. Res. 3:335, 1983.
222. Lukasewycz, OA, Prohaska, JR, Meyer, SG, Schmidtke, JR, Marder, SM, Marder, P. Alterations in lymphocytes subpopulations in copper deficient mice. Infect. Immunol. 48:644, 1985.
223. Prohaska, JR, Kolquist, KL, Lukaewycz, OA. Splenocytes from copperdeficient mice are low responders and weak simulators in mixed lymphocytes reaction. Nutr. Res. 7:43, 1987.
224. Lukasewycz, OA, Prohaska, JR. Immunization against transplantable leukemia impaired in copper-deficient mice. J, Natl. Cancer Inst. 69:489,
282
1982.
225. Odeleye, OE, Eskelson, CD, Mufti, SI, Watson, RR. Vitamin E protection against chemically-induced esophageal tumor growth in mice immunocompromised by retroviral infection. Carcinogenesis. 13: 1818, 1992.
226. Alak, TIB, Shahbazian, M, Huang, DS, Wang, Y, Darban, H, Jenkins, EM, Watson, RR. Alcohol and murine acquired immunodeficiency syndrome suppression of resistance to Cryptosporidium parvum infection during modulation of cytokine production. Alcohol: Clin. Exp. Res. 17:539, 1993.
227. Darban, H, Enriquez, J, Sterling, CR, Lopez, MC, Chen, G, Watson, RR. Cryptosporidium growth enhanced by retrovirally-induced immunosuppression in mice infected with LP-BM5 murine leukemia virus. J. Inf. Dis. 164:741, 1991.
228. Tennenbum, TI, Ruppert, RD, St.Pierre, RL, Greenberger, NJ. The effect of chronic alcohol administration on the immune responsiveness of rats, J. Allerg, 44:272, 1969.
229. Slone, FL, Smith, WI, VanThiel, DH. The effects of alcohol and partial portal ligation on the immune system of the rat. Gastroenterology, 72: 1133, 1977.
230. Abdallah, RM, Starkey, JR, Meadows, GG. Alcohol and related dietary effects on mouse natural killer cell activity. Immunology, 50:131, 1983.
231. Watzl, B, Watson, RR. Alcohol and cytokine secretion. In "Alcohol, Immunology and Cancer (Eds, Yirmiya, R and Tayloy, A.N.), CRC Press, Boca Raton, Florida, pp. 87, 1992.
232. Arai, K, Kee, F, Miyaajima, A, Miyatake, S, Arai, N, Yokotu, T. Cytokines: coordinates of immune and inflammatory responses. Ann. Rev. Biochem. 59:783, 1990.
233. Watzl, B, Lopez, MC, Shabazian, M, Chen, G-J, Colombo, LL, Huang, D, Way, D, Watson, RR. Diet and Ethanol modulate Immune responses in Young C57BL/6 mice. Alcoholism Clin. Exp. Res. in press, 1993.
234. MitzI, BS. The Interleukins, FASEB, J. 3:2379, 1989.
283

235. Watson, RR. Ethanol, Immunomodulation and Cancer Progress in Food and Nutrition Science, 2:189, 1988.
236. Martinez, F, Abril, ER, Earnest, DL, Watson, RR. Ethanol and cytokine secretion, Alcohol, 9:455, 1992.
237. Watson, RR. Alcohol, Drug of Abuse and Immunomodulation, Pergamon Press, New York, Adv. Bio. Sci. 86: 1, 1993.
238. Watson, RR, Watzl, B. Nutrition and alcohol, CRC Press, Boca Raton, Florida, pp. 1, 1992.
239. Dorio, RJ and Forman, HJ. Ethanol inhibition is signal transduction in superoxide production by rat alveolar macrophages. Ann. Clin.Lab. Sci. 18: 190, 1988
240. Dorio, RJ, Hoek, JB, Rubin, E, Forman, HJ. Ethanol modulation of rat alveolar macrophage superoxide production. Biochem. Pharmacol, 37:3528, 1988.
241. Paul, WE, Ohara, J. B cen stimulatory factor-l/interleukin 4. Ann. Rev. Immunol. 5:429, 1987.
242. Le Gros, G, Ben-Sasson, SZ, Sender, R, Finkelman, FD. Paul, WE. Generation of Interleukin-4 (IL-4 )-producing cells in vivo and in vitro: IL-2 and IL-4 are required for in vitro generation of IL-4-producing cells. J. Exp. Med. 172:921, 1990.
243. Snapper, CM, Paul,W.E. B-cell stimulating factor-l (IL-4) prepares resting murine B-cells to secret IgG 1 upon subsequent stimulation with bacterial lipopolysaccharide. J. Immunol. 139: 10, 1987.
244. Sanderson, CJ, Camphell, HD, Young IG. Molecular and cellular biology of eosinophil differentiation factor (interleukin-5) and its effects on human and mouse B-cell. Immunol. Rev., 102:29, 1988.
245. Bohjaven, P, Okajima, RM, Hodez, RJ. Differential regulation of interleukin-4 and interleukin-5 gene expression: a comparison of T-cell gene induction by anti-CD3 antibody or by exogenous Iymphokines. Proc. Natl. Acad. Sci. USA. 87:5283, 1990.
246. Van Snick, J. Interleukin-6: an overview. Ann. Review of Immunol. 8:253, 1990.
284

247. Gajewski, TF, Joyce, D, Fitch, FW. Antiproliferative effects of IFN-T in immune response: Differential selection of TH1 and TH2 murine helper T lymphocytes clones using recombinant IL-2 and recombinant IFN--y. J. Immunol. 143:15, 1989.
248. Scheruich, P, Thoma, B, Ucer, U, Ptizenmaier, K. Immunoregulatory activity of recombinant human TNF-a induction of TNF receptor on human T Cells and TNF-a mediate enhancement of T-cell responses. J. Immunol. 40:2639, 1989.
249. Beutler, B, Gerami, A. The Biology of Cachectin-TNF: a primary mediator of the host response. Ann. Rev. Immunol. 7:625, 1988.
250. Jerrells, TR, Smith, W, and Eckardt, MI. Murine model of Ethanolinduced immunosuppression. Alcohol Clin. Exp. Res. 14:546, 1991.
251. Gluckman, SG, MacGregor, RR. Effect of acute alcohol intoxication on granulocyte mobilization and kinetics, Blood, 52:551, 1979.
252. Hallengren, B, Forsgren, A. Effect of alcohol on chemotaxis, adherence and phagocytosis of human polymorphonuclear leukocytes. Acta Med. Scand. 204:43, 1978.
253. Akira, S, Hirano, T., Taga, T., Kishimoto, T. Biology of multifunctional cytokines: IL-6 and related molecules (IL-1 and TNF), FASEB, J. 4:2860, 1990
254. Ewald, SJ, Walden, SM. Flow cytometric and histological analysis of mouse thymus in fetal alcohol syndrome. J. Leuk. BioI. 44:434, 1988.
255. Jerrels, TR, Marietta CA, Weight, FF, Eckardt, MI. Effect of adrenalectomy on ethanol-associated immunosuppression. Int. J. Immunopharca. 12:435, 1990.
256. Budec, M, Ciric, 0, Koko, V, Asanin, R. The possible mechanism of action of ethanol on rat thymus. Drug and Alcohol Dependence 30: 181, 1992.
257. Gianouakis, C. The effect of ethanol on the biosynthesis and regulation of opioid peptides. Experientia, 45:428, 1989.
258. Watzl, B, Watson, RR. Role of alcohol abuse in nutritional immunosuppression. J. Nutr. 122:733, 1991
285
259. Watzl, B, Abril, E, Abbaszadergan, MR, Scuderi, P, Watson, RR. Effect of alcohol in vivo on tumor necrosis factor secretion by cultured rat Kupffer cells. In" Cells of the Hepatic Sinusoid ( Eds, Wisse, E. and Knook, D.L.) Kupffer Cell Foundation, Leiden, The Netherlands, 3:480, 1991.
260. Watson, RR, Odeleye, OE, Eskelson, CD, Mufti, SI. Alcohol stimulation of lipid peroxidation and esophagal tumor growth in mice immunocompromised by retrovirus infection. Alcohol 9:495, 1992.
261. Shabhazian, LM, Darban, HR, Darban, JR, Stazzone, AM, Watson, RR. Influence of the level of dietary ethanol on resistance to Streptococcus pneumoniae in mice with murine AIDS. Alcohol Alcoholism 27:354, 1992.
262. Petro, TM, Watson, RR, Feely, DE, Darban, H. Alcohol, cocaine, murine AIDS and resistance to Giardia. Adv. Bio. Sci. 86:315, 1993.
263. Chen, GJ, Watson, RR. Modulation of tumor necrosis factor and gamma interferon production by cocaine and morphine in aging mice infected with LP-BM5, a murine retrovirus. J. Leuk. BioI. 50:349, 1991.
264. Watson, RR, Jackson, JC, Hartmann, B, Sampliner, R, Mobley, D, Eskelson, C. Cellular Immune Functions, Endorphines, and Alcohol Consumption in Males. Alcoholism: Clin. Exp. Res. 9:248, 1985.
265. Mathews, PM, Froelich, CJ, Sibbit, Jr, WL, Bankhurst, AD. Enhancement of natural cytotoxicity by beta-endorphin. J. Immunoi. 130: 1658, 1983.
266. Romagnani,S. Induction of Thl and Th2 responses: a key role for the 'natural' immune response? Immunoi. Today 13:379, 1992
267. Watson, RR, Lopez, MC, Odeleye, 0, Darban, H. Modulation of differentiation antigen expression and function of immune cells following short and prolonged alcohol intake during murine retrovirus infection. In: Nutrient Modulation of the Immune Response. pp255 , 1992.
268. Boue, F, Wallon, C, Goujard C, Barresinouss, F, Galand, P, Defraissy, JF. HIV induced IL-6 production by human B lymphocytes:Role ofIL-4. J. Immunoi. 148:3761, 1992.
286

269. Watson, RR. Ethanol, immunomodulation and cancer. Progress Food Nutr. Sci. 2: 189, 1988
270. Prabhala, RH, Watson, RR. Effects of various alcohol applied in vitro on human subtypes and mitogenesis. Prog. Clin. BioI. Res. 325: 155, 1990
271. Watzl, B, Watson, RR. Role of nutrients in alcohol-induced immunomodulation. Alcohol Alcoholism. In Press, 1993
272. Watson, RR. Alcohol, drugs of abuse and immunomodulation. Pergamon Press, Adv. Bio. Sci. 86:1, 1993.
273. Ansher, S, Thompson, W, Watson, RR. The effects of cytokines and murine AIDS on hepatic drub metabolism. Adv. Bio. Sci. 86:305, 1993.
274. Berkelman, RL, Heyward, WL, Stehr-Green, JK, Curran, JW, Epidemiology of human immunodeficiency virus infection and acquired immunodeficiency syndrome. Am. J. Med. 86:761, 1989.
275. Liu, KD, Darrow, WW, Tutherfor, GW. III. A model-based estimate of the mean incubation period for AIDS in homosexual men. Sciences, 240: 1333, 1988.
276. Wang, Y, Watson, RR. Alcohol, immune response and murine AIDS: Role of vitamin E as immunostimulator and antioxidant. Alcohol, accepted, 1994.
277. Wang, Y, Watson, RR. Alcohol immunomodulation during AIDS. In II
Drug of abuse and immunomodulation" (Eel. Watson, R.R.), CRC press. Boca Raton, FL, accepted, 1994.
278. Ewald, SJ, Frost, WW. Effect of prenatal exposure to ethanol on development of the thymus. Thymus, 9:211, 1987.
279. Ewald, SJ, Frost, WW. Flow cytometric and histological analysis of mouse thymus in fetal alcohol syndrome. J. Leu. BioI. 44:434, 1988.
280. Wang, Y, Watson, RR. A key understanding retrovirus-induced immune dysfunction: murine AIDS. submitted, 1994.
281. Petro, TM, Watson, RR. Feely, DE, Darban, H. Alcohol, cocaine, murine AIDS and resistance to Giardia. Adv. Biolsci. 86:315, 1993.
287

282. Watson, RR, Odeleye, OE, Eskelson, CD, Mufti, S1. Alcohol stimulation of lipid peroxidation and esophagal tumor growth in mice immunocompromised by retrovirus infection. Alcohol, 9:495, 1992.
283. Wang Y, Huang, DS, Giger, PT, Watson R.R. Kinetics of cytokine production by T and macrophages during murine AIDS. Adv. BiolSci. 86:335, 1993.
284. Clerici, M, Shearer, GM. A Thl to Th2 switch is a critical step in the etiology of HIV infection. Immunol. Today, 14: 107, 1993.
285. Watson, RR, Jackson, JC, Hartmann, B, Sampliner, R, Mobley, D, Eskelson, CD. Cellular Immune Functions, Endorphines, and Alcohol Consumption in Males. Alcoholism: Clin. Exp. Res. 9:248, 1985.
286. Mathews, PM, Froelich, CJ, Sibbit, Jr., WL, Bankhurst, AD. Enhancement of natural cytotoxicity by beta-endorphin. J. Immunol. 130: 1658, 1983.
287. Boue, F, Wallon, C, Goujard C, Barresinouss, F, Galand, P, Defraissy, JF. HIV induced IL-6 production by human B lymphocytes: Role of IL-4. J. Immunol. 148:3761, 1992.
288. Mellors, JW, Griffith, BP, Ortiz, MA, Landry, ML, Ryan, JL. Tumor necrosis factor-alphalcachectin enhances human immunodeficiency virus type 1 replication in primary macrophages. J. Infect. Dis. 163:78, 1991.
289. Poli, G, Bressler, P, Kinter, A. Interleukin 6 induces human immunodeficiency virus expression in monocytic cells alone and in synergy with tumor necrosis factor alpha by transcriptional and posttranscriptional mechanism. J Exp. Med. 172:151, 1990.
289. Balla, AK, Lischner, HW, Pomerantz, RJ, and Bagasra, O. Human studies on alcohol and susceptibility to HIV infection. Alcohol, accepted, 1994.
290. Budec, M, Ciric, 0, Koko, V, Asanin, R. The possible mechanism of action of ethanol on rat thymus. Drug and Alcohol Dependence 30:181, 1992.
291. Gianouakis, C. The effect of ethanol on the biosynthesis and regulation of opioid peptides. Experientia, 45:428, 1989.
288
292. Liu, KD, Darrow, WW, Tutherfor. GW III. A model-based estimate of the mean incubation period for AIDS in homosexual men. Sciences, 240: 1333, 1988.
293. Lukasewycz, OA, Prohaska, JR. Lymphocytes from copper-deficient mice exhibit decreased mitogen reactivity. Nutr. Res. 3:335, 1983.
294. Jerrells, TR, Marietta, CA, Eckardt, MJ, Majchrowicz, E, Weight, EF. Effects of ethanol administration on parameters of immunocompetence in rats. J. Leuk. BioI. 39:499, 1986.
295. Tanaka, T., Fujomura, H., Tonisu, M. Enhancement of helper T-cell activity by dietary supplementation of Vitamin E in mice. Immunology 38:724-734, 1979.
296. Yasunaga, T, Kato, H, Ohgaki, K, Inamoto, T, Hikasa, Y. Effect of Vitamin E as an immunopotentiation agent for mice at optimal dosage and its toxicity at high dosage. J. Nutr. 112:1075, 1982.
297. Wang, Y, Huang, DS, Eskelson, CD, Watson, RR. Dietary vitamin E supplementation assists in restoration of undernutrition and immune dysfunction due to retrovirus infection causing murine AIDS. J. Nutr. accepted, 1993.
298. Tengerdy, RP, Mathias, MM, Nockels, CF. Effects of Vitamin E on immunities and disease resistance. In: "Vitamin Nutrition and Cancer (ed. Prasad, K.N.) Karger, Basel, pp. 123, 1984.
299. Wang, Y, Huang, DS, Watson, RR. Vitamin E supplementation modulates cytokines production by thymocytes during murine AIDS. Immunol. Res. accepted, 1994.
300. Odeleye, OE, Eskelson, CD, Watson, RR, Lopez, MC, Watzl, B. Effects of prolonged ethanol consumption on hepatic lipids and hepatotoxicity in C57BL/6 female mice. Alcohol Alcoholism, 26:585, 1991.
301. EI-Hag, A, Lipsky, PE, Bennett, M, Clark, RA. Immunomodulation by neutrophil myeloperoxidase and hydrogen peroxide: differential susceptibility of human lymphocyte functions. J. Immunol. 136:3420, 1986.
302. Seaman, WE, Ginhart, TD, Blacman, MA, Dalal, B, Talal, N, Werb, Z.
289

Suppression of natural killing in vitro by monocytes and polymorphonuclear leukocytes. Requirement for reactive metabolites of oxygen. J. Clin. Invest. 69:876, 1982.
303. Bray, RA. Rrahmi, Z. Role of lipoxygenation in human natural killer cell activation. J. Immunol. 136: 1783, 1986.
304. Odeleye, 0, Watson, R.R. Alcohol-related Nutrition Derangements: Implications for nutritional support. In" Nutrition and Alcohol" (Eds. Watson, R.R. and Watzl, B.) CRC Press, Boca Raton, Florida, ppl, 1992.
305. EI-Hag, A, Lipsky, PE, Bennett, M. Clark, RA. Immunomodulation by neutrophil myeloperoxidase and hydrogen peroxide: differential susceptibility of human lymphocyte functions. J. Immunol. 136:3420, 1986.
306. Seaman, WE, Ginhart, TD, Blacman, MA, Dalal, B, Talal, N, Werb, Z. Suppression of natural killing in vitro by monocytes and polymorphonuclear leukocytes. Requirement for reactive metabolites of oxygen. J. Clin. Invest. 69:876, 1982.
307. Synder, D, Beller, D, Unanue, ER. Prostaglandin modulate macrophage expression. Nature (London) 299: 163, 1982.
308. Ewald, SJ, Walden, SM. Flow cytometric and histological analysis of mouse thymus in fetal alcohol syndrome. J. Leuk. BioI. 44:434; 1988.
309. Odeleye, OE, Eskelson, CD, Mufti, SI, Watson, RR, Chvapil, M. Vitamin E reduction of lipid peroxidation products in rats fed cod liver oil and ethanol. Alcohol, 8:273-, 1991.
310. Alexander, DW, Tibbetts, SO, Cassity, NA, Millsap, AL, Riley, CE, Fritsche, KL. Rat immune cell a-tocopherol content is reduced by dietary fish oils. FASEB J. 7:A285, 1993.
311. Dardenne, M, Boukaiba, N, Gagnerrault, MC, Homo-Delarche, F, Chappnis, D, Lemonnier, D, Savino, W. Restoration of the thymus in aging mice by in vivo zinc supplementation. Clin. Immunol. & Immunopathol. 66: 127, 1993.
312. McConkey, DJ, Hartez, P, Nicotera, P, Orrenius, S. Calcium-activated DNA fragmentation kills immature thymocytes. FASEB J. 3:1843, 1989.
290

313. Basham, T, Holdener, T, Merigan, T. Intermittent, alternating, and concurrent regiments of zidovudine and 2-3 dideoxycytidine in the LPBM5 murine induced immunodeficiency model. J. Infect. Dis. 163:869, 1991.
314. Kramer TT, Johnson WT. Copper and Immunity In" Nutrient modulation of the immune responses" (Ed. Cunningham-Rundles, S). Marcel Dekker, New York, pp 239, 1992
315. Baruchel, S, Wainberg, MA. The role of oxidative stress in disease progression in individuals infected by the human immunodeficiency virus. J. Leuk. BioI. 52: 111, 1992
316. Larrick, JM, Wright, S. Cytotoxic mechanism of tumor necrosis factor alpha. FASEB J. 4:3215, 1990.
317. Paeck, R, Rubin, P, Bauerle, PA. Reactive oxygen intermediates as apparently widely used messengers in the activation of the NF-kB transcription factor and HIV. EMBO J. 10:2247, 1991.
318. Toledano, M, Leonard, W. Modulation of transcription factor NF-kB by oxidation-reduction in vitro. Proc. Natl. Acad. Sci. USA, 88:4328, 1991.
319. Tuttle, TM, McCrady, CW, Inge, TH, Solocer, M, Beor, HD. Gammainterferon plays a key role in T-cell-mediated tumor regression. Cancer Res. 53: 833, 1993.
320. Brunda, MT, Heherman, RB, Holden, HT. Inhibition of natural killer cells activity by prostaglandin, J. Immunol. 24:2682, 1990.
321. EI-Hag, A, Lipsky, PE, Bennett, M, Clark, RA. Immunomodulation by neutrophil myeloperoxidase and hydrogen peroxide: differential susceptibility of human lymphocyte functions. J. Immunol. 36:3420,1986.
322. Bray, R.A. & Rrahmi, Z. Role of lipoxygenation in human natural killer cell activation. J. Immunol. 136: 1783, 1986.
323. Almagor, M, Kahane, M. Protective effects of the glutathione redox cycle and Vitamin E on cultured fibroblast infected by mycoplasma pneumonia. Infect. Immunol. 52:240, 1986.
324. Nockels, C. Protective effects of supplemental vitamin E against infection
291
Fed. Proc. 38:2134, 1979.
325. Tengerdy, RP, Mathias, MM, Nockels, CF. Effects of vitamin E on immunities and disease resistance. In: "Vitamin Nutrition and Cancer " (ed. Prasad, K.N.) Karger, Basel, pp. 123, 1984.
326. Tengerdy, R. Effects of Vitamin E on immune response. In: "Vitamin E, A Comprehensive Treatise" (Machlin J. ed.) Dekker, New York pp. 429, 1980.
327. Odeleye, OE, Watson, RR. The potential role of vitamin E in the treatment of immunologic abnormalities during acquired immune deficiency syndrome. Prog. Food Nutr. Sci. 15: 1, 1991.
328. Wang, Y, Huang, DS, Wood, S, Lopez, MC, Giger, P, Murphy, L. and Watson, RR. Vitamin E supplementation assists in the restoration of imbalanced immune functions induced by murine LP-BM5 retrovirus causing murine AIDS. FASEB. J. 7:A285, 1993.
329. Savino, W, Dardenne, M, Marche, C, Rophilme, DT, Dupuy, JM, Pekovic, D, Lapointe, N, and Bach, JF. Thymic epithelium in AIDS. Am. J. Pathol. 122:302, 1986.
330. Seemayer, T, Laroche, C, Russo, P, Malebrache, R, Arnous, E, Guerin, JM, Pierre, G, Dupuy, JM, Gartner, JG, Lapp, WS, Spira, TJ, Elie, R. Precocious thymic involution manife~~. by epithelial injury in the acquired immune deficiency syndrome. Hum. pathol. 15:469, 1984.
331. Bonyhadl, ML, Rabin, L, Salimi, S, Brown, DA, Kosek, J, McCune, 1M, Kaneshlma, H. HIV induces thymus depletion in vivo. Nature, 363:728, 1993.
332. Aldrovandl, GM, Feuer, G, Gao, L, Jamieson, B, Kristeva, M, Chen, ISY, Zack, JA. The SCID-hu mouse as a model for HIV infection. Nature, 363:732, 1993.
333. Wang, Y, Huang, DS, Giger, PT, Watson, RR. Kinetics of cytokine production by thymocytes during murine AIDS caused by LP-BM5 retrovirus infection. Immunol. Letter, accepted, 1994.
334. Synder, D, Beller, D, Unanue, ER. Prostaglandin modulate ,macrophage expression. Nature (London) 299: 163, 1982.
292
335. Tuttle, TM, McCrady, CW, Inge, TH, Solocer, M, Beor, HD. Gammainterferon plays a key role in T-cell-mediated tumor regression. Cancer Res. 53: 833, 1993.
336. Brunda, MT, Heherman, RB, Holden, HT. Inhibition of natural killer cells activity by prostaglandin, J. Immunol. 24: 2682, 1990.
337. El-Hag, A, Lipsky, PE, Bennett, M, Clark, RA. Immunomodulation by neutrophil myeloperoxidase and hydrogen peroxide: differential susceptibility of human lymphocyte functions. J. Immunol. 36:3420,1986.
338. Seaman, WE, Ginhart, TD, Blacman, MA, Dalal, B, Talal, N, Werb, Z. Suppression of natural killing in vitro by monocytes and polymorphonuclear leukocytes. Requirement for reactive metabolites of oxygen. J. Clin. Invest. 69:876, 1982.
339. Bray, RA, Rrahmi, Z. Role of lipoxygenation in human natural killer cell activation. J. Immunol. 136: 1783, 1986.
340. Roder, JC, and Kline, M. Target-effector interaction in the natural kill cell system. LV. modulation of cyclic nucleotides. J. Immunol. 123: 2785, 1979.
341. Gogu, SR, Blumberg, JB. Vitamin E enhances murine natural killer cell cytotoxicity against Yac-l tumor cells. J. Nutr. Immunol. 1: 31, 1992.
342. Betz, M, Fox, BS. Prostaglandin E2 inhibits production of THI lymphokines but not of TH2 lymphokines. J. Immunol. 146: 108, 1991.
343. Boue, F, Wallon, C, Goujard C, Barresinouss, F, Galand, P, Defraissy, JF. HIV induced IL-6 production by human B lymphocytes: Role of IL-4. JJmmunol. 148:3761, 1992.
344. Gieger, T, Andus, T, Klapproh, J, Hirano, T, Kishimoto, T, Deinrich, P.C. Induction of rat acute-phase proteins by interleukin-6 in vivo. Eur. J. Immunol. 18:717, 1988.
345. Mellors: J. Infet. Dis. 163:78, 1991.
346. Poli, G, Bressler, P, Kinter, A. Interleukin 6 induces human immunodeficiency virus expression in monocytic cells alone and in synergy with tumor necrosis factor alpha by transcriptional and posttranscriptional mechanism. J Exp. Med. 172: 151, 1990.
293

347. Staltman, P. Oxidative stress: a radical view. Semin. Hematol. 26:249, 1989.
348. Eck, HP, Gmunder, H, Hartmann, M, Petzoldt, D, Daniel V. and Droge, W. Low concentration of acid-soluble thiol (cystine) in the blood plasma of HIV-1 infected patients. BioI. Chern. Hoppe-Seyler, 370:101, 1989.
349. Kalebic, T, Kinter, A, Poli, G, Anderson, ME, Mester, A, Fauci, AS. Suppression of human immunodeficiency virus expression in chronically infected monocytic cells by glutathione, glutathione ester, and N-acetyl-Lcysteine. Proc. Natl. Acad. Sci. USA 88:986, 1990.
350. Staal, FJT, Roederer, M, Herzenb erg , LA. Intracellular thiols regulate activation of nuclear factor kB and transcription of HIV. Proc. Natl. Acad. Sci. USA, 87:9943, 1990.
351. Floyd, RA, Schneider, JE. Hydroxy free radicals damage to DNA. In" Membrane Lipid Oxidation (Vigo-Pelfrey, C., Ed.) Boca Raton, FL: CRC Press, Vol. I, 1990.
352. Halliwell, B, Gutterbridge, JMC. The importance of free radicals and catalytic metal ions in human disease. Mol. Aspects Med. 8:89, 1985.
353. Larrick, JM, Wright, S. Cytotoxic mechanism of tumor necrosis factor alpha. FASEB J. 4:3215, 1990.
354. Paeck, R, Rubin, P, Bauerle, PA. Reactive oxygen intermediates as apparently widely used messengers in the activation of the NF-kB transcription factor and HIV. EMBO J. 10:2247, 1991.
355. Toledano, M, Leonard, W. Modulation of transcription factor NF-kB by oxidation-reduction in vitro. Proc. Natl. Acad. Sci. USA, 88:4328, 1991.
356. Tappet, AL. Vitamin E and free radical peroxidation of lipids. Ann. N. Y. Acad. Sci: 203: 12, 1972.
357. Basham, T, Holdener, T, Merigan, T. Intermittent, alternating, and concurrent regiments of zidovudine and 2-3 dideoxycytidine in the LPBM5 murine induced immunodeficiency model. J. Infect. Dis. 163:869, 1991.
358. Gangemi, JD, Cozen, RM, Clerq, E, Balzarini, J, Hochkeppel, HK, AZT in the treatment of murine acquired immunodefic:.ency disease and
294

opportunistic herps simplex virus infections. Chemotherap. 33: 1864, 1989.
Antimicro. Agents
359. Wang, Y, Huang, DS, Giger, PT, Watson, RR. Kinetics of cytokine production by thymocytes during murine AIDS caused by LP-BM5 retrovirus infection. Immunol. letter, 1993, accepted.
360. Dardenne, M, Savino, W, Wade, S, Kaiserlian, D, Lemonnier, D, and Bach, JF. In vivo and in vitro systems of thymulin in marginally zincdeficient mice. Eur. J. Immunol. 14:454, 1984.
361. Prasas, AS, Meftah, S, Abdallah, J, Kaplan, J, Brewere, GJ, Bach, JF, Dardenne, M. Serum thymulin in human zinc deficiency. J Clin. Invest. 82: 1202, 1988
362. Dardenne, M, Boukaiba, N, Gagnerrault, MC, Homo-Delarche, F, Chappnis, D, Lemonnier, D, Savino, W. Restoration of the thymus in aging mice by in vivo zinc supplementation. Clin. Immunol. & Immunopathol. 66: 127, 1993.
363. Berkelman, RL, Heyward, WL, Stehr-Green, JK, Curran, JW. Epidemiology of human immunodeficiency virus infection and acquired immunodeficiency syndrome. Am. J. Med. 86:761, 1989.
364. Wang, Y, Liang, B, Watson, RR. Suppression of vitamin A, E, Zinc and copper levels in murine AIDS caused by LP-BM5 retrovirus infection. Nutr. Res. accepted, 1994.
365. Savino, W, Dardenne, M, Marche, C, Rophilme, DT, Dupuy, JM, Pekovic, D, Lapointe, N, Bach, JF. Thymic epithelium in AIDS. Am. J. Pathol. 122:302, 1986.
366. Seemayer, T, Laroche, C, Russo, P, Malebrache, R, Amous, E, Guerin, JM, Pierre, G, Dupuy, JM, Gartner, JG, Lapp, WS, Spira, TJ, Elie, R. Precocious thymic involution manifest by epithelial injury in the acquired immune deficiency syndrome. Hum. pathol. 15:469, 1984.
367. Bonyhadl, ML, Rabin, L, SalImI, S, Brown, DA, Kosek, J, McCune, JM, Kaneshlma, H. HIV induces thymus depletion in vivo. Nature, 363:728, 1993.
368. Aldrovandl, GM, Feuer, G, Gao, L, JamIeson, B, Kristeva, M, Chen, ISY, Zack, JA. The SCID-hu mouse as a model for HIV infection.
295

Nature, 363:732, 1993.
369. Wang, Y, Huang, DS, Giger, PT, and Watson, RR. Kinetics of cytokine production by thymocytes during murine AIDS caused by LP-BM5 retrovirus infection. Immunol. Letter, 1993, accepted.
370. Wang, Y, Watson, R.R. Is Vitamin E supplementation a useful agent in AIDS therapy? Prog. Food. Nutr. Sci. 1993, in press.
371. Wang, Y, Huang, DS, Liang, B. Watson, RR. Normalization of restoration of nutritional status and immune functions by vitamin E supplementation in murine AIDS. 1. Nutr. accepted, 1994.
372. Wang, Y, Huang, DS, Watson, RR. Vitamin E supplementation modulates cytokine production by thymocytes during murine AIDS. accepted, Immunol. Res., 1993.
373. Wang, Y, Watson, RR. Is Vitamin E supplementation a useful agent in AIDS therapy? Prog. Food. Nutr. Sci. in press, 1993.
296
374. Wierda, WG, Mehr, DS, Kim, YB. Comparison of fluorochrome-labeled and 51Cr-Iabeled targets for natural killer cytotoxicity assay. J. Immunol. Methods. 122: 15, 1989.
375. Fernandes, G, Tomar, V, Mohan, N, Venkatraman, JA. Potential of diet therapy on murine AIDS. J. Nutr. 122:716, 1992.
376. Brunda, MT, Heherman, RB, Holden, HT. Inhibition of natural killer cells activity by prostaglandin J. Immunol. 24:2682, 1990.
377. Clerici, M, Shearer, GM. A THl--> TH2 switch is a critical step in the etiology of HIV infection. Immunol. Today. 14: 107, 1993.
378. Mellors, JW, Griffith, BP, Ortiz, MA, Landry, ML, Ryan, JL. Tumor necrosis factor-alphalcachectin enhances human immunodeficiency virus type 1 replication in primary macrophages. J Infect. Dis. 163:78, 1991.
379. Tsunetsugu-Yokoto, Y, Honda, M. Effect of cytokine on HIV release and IL-2 receptor alpha expression in monocytic cell lines. J AIDS. 3:511, 1990.
380. Klebanoff, SJ, Vadas, MA, Harlan, 1M. Stimulation of neutrophils by tumor necrosis factor. J. Immunol. 136:4220, 1986.

381. Toledano, M, Leonard, W. Modulation of transcription factor NF-kB by oxidation-reduction in vitro. Proc. Natl. Acad. Sci. USA, 88:4328, 1991.
382. Spriggs, DR, Sherman, ML, Imamura, K. Phospholipase A2 activation and autoinduction of tumor necrosis factor gene expression by tumor necrosis factor. Cancer Res. 50:7101, 1990.
383. Roederer, M, Stall, FJ, Raju, PA, Ela, SW, Herzenberg, LA. Cytokinestimulated human immunodeficiency virus replication is inhibited by Nacetyl-L-cysteine. Proc. Natl. Acad. Sci. USA, 87:4884, 1990.
384. Paeck, R, Rubin, P, Bauerle, PA. Reactive oxygen intermediates as apparently widely used messengers in the activation of the NF-kB transcription factor and mv. EMBO J. 10:2247, 1991.
385. Akama, H, Ichikawa, Y, Matsushita, Y, Shinozawa, T, Homma, M. Mononuclear cells enhance prostaglandin E2 production of polymorphonuclear leukocytes via tumor necrosis factor-G!. Biochem. Biophys. Res. Commun. 168:857, 1990.
386. Cao, YZ, Choy, PC, Chan, AC. Regulation by vitamin E of phosphatidylcholine metabolism in rat heart. Biochem J, 247: 135, 1987.
387. Zorn, NE, Weill, CL, Russell, DH. The HIV protein, GP120, activates nuclear protein kinase C in nuclei from lymphocytes and brain. Biochem. Biophys. Res. Commun. 166: 1133, 1990.
388. Jakobovits, A, Rosenthal, A, Capton, DJ. Trans-activation of HIV-1 LTR-directed gene expression by tat requires protein kinase C. EMBO J. 9: 1165, 1990.
389. Kinter, AL, Poli, G, Maury, W, Folks, TM, Fauci AS. Direct and cytokine-mediated activation of protein kinase C induces human immunodeficiency virus expression in chronically infected promonocytic cells. J Viro!. 64:4306, 1990.
390. Matthes, E, Langen, P, Brachwitz, H. Alteration of DNA topoisomerase II activity during infection of H9 cells by human immunodeficiency virus type 1 in vitro: a target for potential therapeutic agents. Antiviral. Res., 13:273, 1990.
391. Stall, FJT, Roederer, M, Raju, PA, Anderson, MT, Ela, SW, Herzenberg, LA, Herzenberg, LA. Antioxidants inhibit stimulation of
297

HIV transcription. AIDS Res. Human Retrovirus. 9:299, 1993.
392. Kalebic, T, Kinter, A, Poli, G, Anderson, ME, Meister, A, Fauci, AS. Suppression of human immunodeficiency virus expression in chronically infected monocytic cells by glutathione, glutathione ester, and Nacetylcysteine. Proc. Natl. Acad. Sci. USA, 88:986, 1991.
393. Mihm, S, Ennen, J, Pessara, U, Kurth, R, Droge, W. Inhibition of HIV -1 replication and NF-kB activity by cysteine and cysteine derivatives. AIDS, 5:497, 1991.
394. Ho, W-Z, Douglas, SD. Glutathione and N-acetylcysteine suppression of HIV replication in human monocytes/macrophages in vitro. AIDS Res. Hum Retroviruses, 8: 1249, 1992.
395. Wang, Y, Huang, DS, Watson, RR. Vitamin E supplementation modulates cytokine production by thymocytes during murine AIDS. Immunol. Res. accepted, 1993.
396. Dardenne, M, Savino, W, Wade, S, Kaiserlian, D, Lemonnier, D, Bach, JF. In vivo and in vitro systems of thymulin in marginally zinc-deficient mice. Eur. J. Immunol. 14:454, 1984.
397. Prasas, AS, Meftah, S, Abdallah, J, Kaplan, J, Brewere, GJ, Bach, JF, Dardenne, M. Serum thymulin in human zinc deficiency. J Clin. Invest. 82: 1202, 1988.
398. Dardenne, M, Boukaiba, N, Gagnerrault, MC, Homo-Delarche, F, Chappnis, D, Lemonnier, D, Savino, W. Restoration of the thymus in aging mice by in vivo zinc supplementation. Clin. Immunol. & Immunopathol. 66: 127, 1993.
399. McConkey, DJ, Hartez, P, Nicotera, P, Orrenius, S. Calcium-activated DNA fragmentation kills immature thymocytes. FASEB J. 3: 1843, 1989.
400. Faluz, J., Tsoukas, C., Gold, P. Zinc as a cofactor in human immunodeficiency virus-induced immunosuppression. JAMA, 259:2850, 1988.
401. Wang, Y, Liang, B, Watson, R.R. Suppression of tissue levels of vitamin A, E, zinc and copper in murine AIDS, Nutr. Res. accepted, 1993.
298

402. Wang, Y, Huang, DS, Liang, B, Watson, RR. Normalization of nutritional status and immune responses by vitamin E supplementation in murine AIDS. J. Nutr. Accepted, 1994.
403. Watson, RR, Leonard, TK. Selenium and vitamins A, E and C: nutrients with cancer prevention properties. 1. Am. Diet Assoc. 86:505, 1986.
404. Watson, RR, Yahya, D. Enhanced survival by vitamin A supplementation during a retrovirus infection causing murine AIDS. Life Sci. 43: 13, 1988.
405. Sheffy, BE, Schultz, RD, Influence of vitamin E and selenium on immune response mechanisms. Fed. Proc. 38:2139, 1979.
406. Wang, Y, Huang, DS, Wood, S, Watson, RR. Partial normalization of immune function and cytokine production by various levels of vitamin E supplementation during murine AIDS. 1993; submitted.
407. Cunningham-Rundlles, S. Effects of nutritional status on immunological function. Am. J. Clin. Nutr. 35: 1202, 1982.
408. Fraker, PJ, Gershwin, ME, Good, PA, Prasad, AS. interrelationships between zinc and immune function. Fed. Proc. 45:1474, 1983.
409. Chandra, RK, Au, B. Single nutrient deficiency and cell-mediated immune responses. I. Zinc, Am. J. Clin. Nutr. 33:736, 1980.
410. Dardenne, M, Savino, W, Wade, S, Kaiserlian, D, Lemonnier, D, Bach, JF. In vivo and in vitro systems of thymulin in marginally zinc-deficient mice. Eur. J. Immunol. 14:454, 1984.
411. Prasas, AS, Meftah, S, Abdallah, J, Kaplan, J, Brewere, GJ, Bach, JF, Dardenne, M. Serum thymulin in human zinc deficiency. J. Ciin. Invest. 82: 1202, 1988.
412. Dardenne, M, Boukaiba, N, Gagnerrault, MC, Homo-Delarche, F, Chappnis, D, Lemonnier, D, Savino, W, Restoration of the thymus in aging mice by in vivo zinc supplementation. Clin. Immunol. & Immunopathol. 66: 127, 1993.
413. Prohasks, JR, Lukadewycz, ~A. Copper deficiency suppresses the . immune response of mice. Science, 213:559, 1981.
299

414. Failla, ML, Babu, U, Seidel, KE. Use of immunoresponsiveness to demonstrate that the dietary requirement for copper in young rats is greater with dietary fructose than dietary starch. J. Nutr. 118:487, 1988.
415. Viestenz, KE, Klevay, LM. A randomized trial of copper therapy in rats with electrocardiographic abnormalities due to copper deficiency. Am. J. Clin. Nutr. 35:258, 1982.
300