university grants commission - welcome to … council of indian medicine (ccim) (1970) 5. council of...
TRANSCRIPT


The University Grants Commission which came into existence on
28.12.1953 became a statutory body of Government of India by an
Act of Parliament in 1956. The Section 12 of the UGC Act provides
that the Commission shall in consultation with the concerned
universities, take all such steps as it may think fit for the promotion
and coordination of university education and for the maintenance of
standards in teaching, examination and research. For teaching and
research, extension was added as the third dimension of education
by the Commission.
The UGC serves as a vital link between the Union and State
Governments and the institutions of higher learning. In addition to
its role of giving grants to universities and colleges, the University
Grants Commission also advises Central and State Governments on
the measures necessary for the improvement of university
education. It also frames regulations such as those on the minimum
standards of instruction and qualifications of teachers on the advice
of subject specialists and academicians with whom it frequently
interacts in connection with the formulation, evaluation and
monitoring of programmes.
UNIVERSITY GRANTS COMMISSION
UGC Interventions towards quality enhancement in higher education
Schemes exclusively meant for Universities
Schemes meant exclusively for Colleges
Schemes meant for both Universities and Colleges
1. General development Assistance to Central, State and Deemed universities
(Includes 16 merged schemes)
2. One time Catch up grants to Non-12B State Universities funded by State
Governments
3. Operation 'Faculty Recharge': initiative for Augmenting the Research and
Teaching Resources of Universities
4. Enhancing Faculty resources of Universities - ENCORE
5. Establishment of Rajiv Gandhi chairs in Universities
6. Academic Staff Colleges
7. Special Assistance Programme
8. Centres with Potential for Excellence in Particular Areas (Envisaged to
identify 25 Universities during XI Plan)
9. Area Study Centers in Universities
10. Universities with Potential for Excellence
11. Establishing/Up gradation of Computer Centers
12. UGC-INFONET Connectivity Programme
13. UGC-INFONET Digital Library Consortium
14. Promotion of Yoga Education and Practice of Positive Health in Universities
15. Incentives for Resource Mobilization
16. Development Assistance for Up gradation of Existing and New
Management Departments in Universities
17. Development Grant to Colleges (includes 14 merged schemes)
18. One-time Catch-up Grant to Uncovered (Non-12B) Colleges
19. Development Assistance to Colleges for the Construction of Buildings
20. Construction of Women's Hostel for Colleges
21. Establishment of New Model Degree Colleges in Educationally Backward
Districts with Low (GER)
22. Faculty Development Programme for Colleges
23. Organizing Conferences/Workshops/Seminars in Colleges
24. Autonomous Colleges
25. Colleges with Potential for Excellence
26. Instrumentation Maintenance Facility (IMF) in Colleges
27. UGC-Network Resource Center (UGC-NRC) in Colleges
28. Jubilee, Centenary Grants to Colleges
29. Providing additional assistance to Universities and 5,500 Colleges already
covered under Section 12(B) of the UGC Act, 1956
30. Development of Women's Studies in Indian Universities and Colleges
31. Capacity Building for Women Managers in Higher Education
32. Establishment of Special Cells for SCs & STs in Universities/ Deemed to be
Universities and Grant-in aid Institutions & IUCs receiving Central
Assistance
33. Innovative Programmes
34. Setting Up of Media Centers/ Affiliated Media Centers
35. Career Oriented Courses in Universities and Colleges
36. Establishment and monitoring of the Internal Quality Assurance Cells
(IQACs) in Higher Education Institutions (HEIs)
37. E-Content Development
38. Strengthening Social Science and Humanities Teaching and Research
capacity
39. Research Fellowship in Humanities & Social Sciences Students
40. Development of Sports Infrastructure and Equipment in Universities and
Colleges
UNIVERSITY GRANTS COMMISSIONBahadur Shah Zafar Marg, New Delhi-110 002
Website : www.ugc.ac.in
1. All India Council for Technical Education (AICTE) (1987)
2. Bar Council of India (BCI) (1961)
3. Central Council of Homoeopathy (CCH) (1973)
4. Central Council of Indian Medicine (CCIM) (1970)
5. Council of Architecture (CoA) (1972)
6. Dental Council of India (DCI) (1948)
7. Distance Education Council (DEC) (1985)
8. Indian Council of Agricultural Research (ICAR)
9. Indian Nursing Council (INC) (1947)
10. Institute of Cost and Works Accountants of India (ICWAI) (1959)
11. Medical Council of India (MCI) (1956)
12. National Council for Teacher Education (NCTE) (1993)
13. Pharmacy Council of India (PCI) (1948)
14. Rehabilitation Council of India (RCI) (1992)
15. State Councils of Higher Education (SCHE)
16. University Grants Commission (UGC) (1956)
17. Veterinary Council of India (VCI) (1984)
Source : Respective Websites
Regulatory Bodies Source : Analysis of Budgeted Expenditure on Education, MHRD
EXPENDITURE IN EDUCATION
Educational Expenditure as % of Public Expenditure & GDP16
14
12
10
8
6
4
2
Year
0
1951-52
0.641.48
2.11
2.983.84
4.28
3.77
7.92
11.99
13.37
14.42
13.63
10.16
10.67
Educational Expendture as % of Public Expenditure As % of GDP
1960-61
1970-71
1980-81
1990-91
2000-01
2008-09 (P)
Perc
enta
ge
(P) : Provisional estimatesSource : Analysis of Budgeted Expenditure on Education, MHRD
Higher & TechnicalEducation
32.3%Adult Education
0.3%ElementaryEducation
41.8%
SecondaryEducation
25.6%
Source : Analysis of Budgeted Expenditure on Education, MHRD
Public Expenditure on Education - Sector-wise (Estimated) : 2009-10
Expenditure on Higher Education in India (As % of GDP)
4.5
Exp
end
itu
re (
as %
of
GD
P)
4
3.5
3
2.5
2
1.5
1
0.5
02006-07
3.64
1.091.23
1.25
3.4
3.77 3.85
Expenditure on Education (as % of GDP) Higher Education as % GDP
Higher Educationin India at a glance
Statewise Higher Education Institutions
February, 2012
UNIVERSITY GRANTS COMMISSIONBahadur Shah Zafar Marg, New Delhi-110 002 (INDIA)
Website : www.ugc.ac.in
Jammu &Kashmir
Himachal Pradesh
Punjab
Chandigarhl
253
H
l 11 328H
l
106319
H
l
226759
H
l
864
H
H 6
l
307842
H
l
542
H
3H
l
463144
H
l
64115
Hl
223628
Hl
183636
H
l
241248
H
l
90222
H
l
385958
H l
65321
Hl
649
H
l 10 507H
l
554
H
l 3 16H
l
393
Hl
283
H
l
763
H
l
155
H
l
24325
H
l
110019
H
l
94226
Hl
23112
H
l
406646
H
H 4
H 1
Haryana
Chha
tisga
rh
Delhi
Delhi Sikkim
ArunachalPradesh
Rajasthan
Gujarat
Daman & Diu
D & N Haveli
Maharashtra
Karnataka
Andhra Pradesh
Puducherry
A & N Island
TamilNadu
Kerala
Lakshadweep
Goa
Uttar Pradesh
Odisha
Bihar
Jharkhand
WestBengal
Meghalaya
Tripura
Mizoram
Manipur
Nagaland
Assam
Madhya Pradesh
Uttrakhandl
36019
H
l
85217
H
Number of Degree awarding Institutions
Number of Colleges
Total Number of Degree awarding Institutions = 634
Number of Colleges = 33,023
l
34418
H
1.14
2007-08 2008-09 2009-10
41. Guidelines for Universities, Research Institutes and Colleges for
Procurement, Storage, Usage and Disposal of Radioactive and other
Hazardous materials/Chemicals
42. Epoch Making Social Thinkers of India
43. Human Rights and Values in Education
44. Lifelong Learning and Extension
45. Modified Guidelines for Post Graduate Merit Scholarship Scheme for
University Rank Holders at Undergraduate Level
46. Research Fellowship in Science for Meritorious Students
47. Junior Research fellowship (JRF) in Sciences, Humanities and Social
Sciences
48. Junior Research fellowship in Engineering and Technology
49. Junior Research fellowship (JRF) and Research Associateship (RA) for
Foreign Nationals
50. Fellowship to M.Phil/Ph.D Scholars in Central Universities
51. Dr. S. Radhakrishnan Post Doctoral Fellowship (PDF) in Humanities and
Sciences (including languages )
52. Dr. D.S. Kothari Post-Doctoral Fellowships in Sciences, Medical Sciences &
Engineering Sciences
53. Post Doctoral Fellowship to Women Candidates
54. Post Graduate Indira Gandhi Scholarship Scheme for Single Girl Child
55. Rajiv Gandhi National Fellowship for SC/ST Candidates
56. Emeritus Fellowship
57. Special Honorarium to teachers who are Fellows of at least two of the four
Science Academies identified by UGC
58. Research Awards
59. Major Research Project
60. Minor Research Project
61. Incentivisation of Teachers, Subject/Discipline based Association for
Organization of various Academic and Research Activities
62. Travel Grant Scheme for College Teachers/College Librarians/Vice
Chancellors/Commission Members and UGC Officers
63. Appointment/ Honorarium of Guest/Part-Time Teachers
Details about Schemes are available on UGC website : www.ugc.ac.in
Schemes meant for professional development of Faculty of Universities &
Colleges and for recognition of Academics of eminence
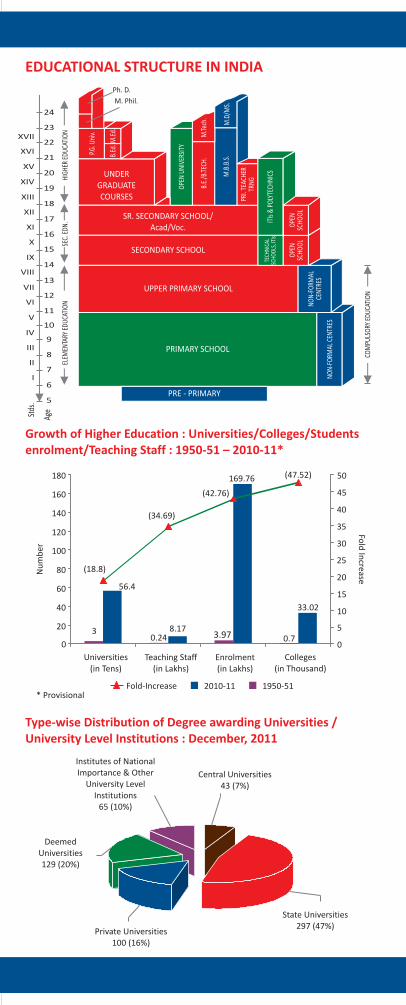
EDUCATIONAL STRUCTURE IN INDIA
Faculty-wise Doctorate Degrees (Ph.D.) awarded during 2009-10*
Age
5
I6
7
8
9
10
11
12
13
14
15
16
17
18
19
20
21
22
23
Ph. D.
M. Phil.
24
II
III
IV
V
VI
VII
VIII
IX
X
XI
XII
XIII
XIV
XV
XVI
XVII
UNDERGRADUATECOURSES
P.G. U
niv.
B.Ed
.
OPE
N UN
IVER
SITY
B.E.
/B.T
ECH.
M.Te
ch.
M.D
/MS.
M.B
.B.S
.
PRI.
TEAC
HER
TRNG
OPE
NSC
HOO
LO
PEN
SCHO
OL
NON-
FORM
ALCE
NTRE
S
NON-
FORM
AL C
ENTR
ES
TECH
NICA
LSC
HOO
LS, I
TIs
ITIs
& P
OLY
TECH
NICS
M.E
d.
SR. SECONDARY SCHOOL/Acad/Voc.
SECONDARY SCHOOL
UPPER PRIMARY SCHOOL
PRIMARY SCHOOL
PRE - PRIMARY
Stds
.
ELEM
ENTA
RY E
DUCA
TIO
NSE
C. E
DN.
HIGH
ER E
DUCA
TIO
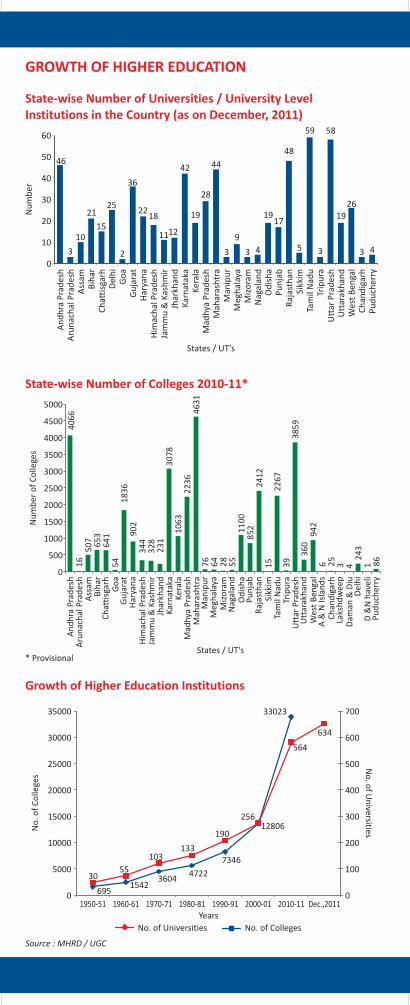
NGROWTH OF HIGHER EDUCATION
State-wise Number of Universities / University Level Institutions in the Country (as on December, 2011)
States / UT's
COM
PULS
ORY
EDU
CATI
ON
State-wise Number of Colleges 2010-11*
5000
An
dh
ra P
rad
esh
Aru
nac
hal
Pra
des
hA
ssam
Mah
aras
htr
aM
anip
ur
Pu
nja
b
Sikk
im
Wes
t B
enga
lA
& N
Isla
nd
sC
han
dig
arh
Laks
hd
wee
p
Utt
arak
han
d
D &
N h
avel
iP
ud
uch
erry
Od
ish
aN
agal
and
Miz
ora
mM
egh
alay
a
Ker
ala
Kar
nat
aka
Jhar
khan
dJa
mm
u &
Kas
hm
irH
imac
hal
Pra
des
hH
arya
na
Gu
jara
tG
oa
Ch
atti
sgar
hB
ihar
Raj
asth
an
States / UT's
Mad
hya
Pra
des
h
Del
hi
Dam
an &
Diu
Tam
il N
adu
Utt
ar P
rad
esh
Trip
ura
4500
4000
3500
3000
2500
2000
1500
1000
500
0
Nu
mb
er o
f C
olle
ges
40
66
50
71
6
23
13
28
30
78
11
00
85
2
76
64
55
28
24
12
22
67
94
2
15 39 6
36
03
85
9
46
31
22
36
10
63
34
49
02
18
36
64
15
4
65
3
25
3 42
43
1 86
GROWTH OF HIGHER EDUCATION
Growth of Students Enrolment (‘000’) in Higher Education
1800016975
8399
4925
27521954
7049
3306
16000
14000
12000
10000
8000
6000
4000
2000
1950-510
1050
170431 749
1437397
43
1960-61 1970-71 1980-81
Year
1990-91 2000-01 2010-11*
Total Student Enrolment ('000') Girls Enrolment ('000)
Enro
lmen
t (i
n '0
00
')
GROWTH OF HIGHER EDUCATION
* Provisional
* Provisional
Level-wise Students Enrolment (‘000’) : Boys & Girls 2010-11*10000
9000
8000
7000
6000
5000
4000
3000
2000
1000
0
8580
6037
1167
Graduate
882
81 56 98 73
Post-Graduate Research Diploma/Certificate
Boys Girls
Level
Nu
mb
er (
'00
0')
GROWTH OF HIGHER EDUCATION
State-wise Students Enrolment 2010-11*
An
dh
ra P
rad
esh
Aru
nac
hal
Pra
des
hA
ssam
Meg
hal
aya
Miz
ora
m
Tam
il N
adu
Utt
arak
han
dW
est
Ben
gal
D &
N H
avel
i
Trip
ura
Laks
hd
wee
pP
ud
uch
erry
Sikk
imR
ajas
than
Pu
nja
b
Nag
alan
d
Man
ipu
rM
ahar
ash
tra
Ker
ala
Jam
mu
& K
ash
mir
Him
ach
al P
rad
esh
Har
yan
aG
uja
rat
Go
aD
elh
iC
hat
tisg
arh
Bih
ar
Utt
ar P
rad
esh
States / UT's
Dam
an &
DIu
Ch
and
igar
hA
& N
Isla
nd
Od
ish
a
Mad
hya
Pra
des
h
Kar
nat
aka
Jhar
khan
d
3000000
Total Students Enrolment
18
47
47
91
60
68 26
84
51 69
07
76
30
43
81
27
87
70
26
78
38
93
64
84
52
56
51
33
56
41
84
39
42
74
45
0
40
41
21
10
01
47
3
92
89
39
19
55
22
63
37
55
41
63
31
23
03
20
02
65
10
41
84
69
87
07
89
47
91
16
08
32
80
0 29
44
85
31
58
64
51
02
12
08
60
41
03
51
22
94
40
75
14
82
27
7
25
64
88
6
2500000
2000000
1500000
1000000
500000
0
Type-wise Distribution of Degree awarding Universities / University Level Institutions : December, 2011
Institutes of NationalImportance & Other
University LevelInstitutions
65 (10%)
Deemed Universities129 (20%)
Private Universities100 (16%)
State Universities297 (47%)
Central Universities43 (7%)
Students Enrolment by stages in Higher Education 2010-11*
* Provisional
Year
Growth of Teaching Staff in Universities and Colleges
900000
800000
700000
600000
500000
400000
300000
200000
100000
0
40816966
411628
263125
193341
128876
2.53
5.47
8.21
11.17
17.48
34.69
5967323549
30
35
25
20
15
10
5
01950-51 1960-61 1970-71 1980-81 1990-91 2000-01 2010-11*
Teaching staff in Universities & Colleges Fold increase
No
. of
Un
iver
siti
es
Fold
increase sin
ce 19
50
-51
* ProvisionalSource : MHRD for 1950-51 & 1960-61 and UGC for 1970-71 onwards
Faculty-wise Students Enrolment in Higher Education 2010-11*
Education569961 (3.36%)
Engineering/Technology
2862439 (16.86%)
Veterinary Science27423 (0.16%)
Medicine652533 (3.85%)
Agriculture93166 (0.55%)
Law327146 (1.93%)
Others232691 (1.37%)
Arts6177730 (36.39%)
Science3127042 (18.42%)
Commerce/Management2904752 (17.11%)
Faculty-wise Students Enrolment (‘000’) : Boys & Girls 2010-11*Growth of Higher Education Institutions
35000
30000
25000
20000
15000
10000
5000
1950-510
70033023
256
190
133103
5530
6951542
36044722
7346
12806
564
634600
500
400
300
200
100
0
No
. of
Co
llege
s
No
. of U
niversities
No. of Universities No. of Colleges
1960-61 1970-71 1980-81Years
1990-91 2000-01 2010-11 Dec.,2011
* Provisional * Provisional Boys Girls
Arts
Com
mer
ce/
Man
agem
ent
Educ
atio
nEn
gg./
Tech
.
Med
icin
eAg
ricul
ture
Vete
rinar
ySc
ienc
e Law
Oth
ers
Scie
nce
3500
3000
2500
2000
1500
1000
500
0
32
73
29
05
17
78
13
49
11
37
17
68
24
63
24
32
23
30
20 7
24
38
4 14
58
7
68
25
80
12
06
2
Nu
mb
er (
'00
0')
Faculty
Arts3490 (31%)
Others503 (5%)
Law123 (1%)
Veterinary Science150 (1%)
Agriculture573 (5%)
Medicine337 (3%)
Engineering/Technology1007 (9%)
Education469 (4%)
Commerce &Management
767 (7%) Science3742 (34%)
* Provisional (Data pertains to 305 Universities / University level Institutions, out of 534)
Arts includes Humanities, Social Sciences, Languages etc.
Science includes Basic Science, Home-Science, Computer Science
and Computer Application.
Medicine includes Ayurveda, Dentistry, Homeopathy, Nursing,
Pharmacy, Public Health/Social Preventive Medicine, Unani,
Tibbia, Physiotherapy, Occupational Therapy and Siddha Medicine
etc.
Others includes Library and Information Science, Fine Arts,
Journalism & Mass Communication, Physical Education, Social
Work, etc.
Post-Graduate2049124 (12%)
Research137668 (1%)
Diploma / Certificate171618 (1%)
Graduate14616473 (86%)
Growth of Higher Education : Universities/Colleges/Studentsenrolment/Teaching Staff : 1950-51 – 2010-11*
* Provisional
* Provisional
50
45
0
15
20
25
30
35
40
Nu
mb
erFo
ld In
crease
(18.8)
56.4
(47.52)169.76
(34.69)
(42.76)
33.02
0.73.970.243
0
Universities(in Tens)
Colleges(in Thousand)
Enrolment(in Lakhs)
Teaching Staff(in Lakhs)
20
40
60
80
100
120
140
160
180
Fold-Increase 1950-512010-11
5
10
8.17
An
dh
ra P
rad
esh
Aru
nac
hal
Pra
des
hA
ssam
Ker
ala
Kar
nat
aka
Jhar
khan
dJa
mm
u &
Kas
hm
irH
imac
hal
Pra
des
hH
arya
na
Gu
jara
tG
oa
Del
hi
Ch
atti
sgar
hB
ihar
46
60
50
3
10
21
15
25
2
36
2218
12
42
19
Mad
hya
Pra
des
h
28
11
40
30
20
10
0
Nu
mb
er
Mah
aras
htr
aM
anip
ur
Pu
nja
b
Sikk
imTa
mil
Nad
uTr
ipu
raU
ttar
Pra
des
hU
ttar
akh
and
Wes
t B
enga
lC
han
dig
arh
Pu
du
cher
ry
Od
ish
aN
agal
and
Miz
ora
mM
egh
alay
a
Raj
asth
an
9
3 4
26
19
58
3
59
5 3 4
48
1719
44
3
*ProvisionalSource : MHRD for 1950-51 & 1960-61 and UGC for 1970-71 onwardsCoverage : Figures of students enrolment & teaching staff (1970-71 onwards) pertain to regular courses in Universities & Colleges (excluding Polytechnics, other Diploma awarding Institutions &Non-formal System of Higher Education)
Source : MHRD / UGC
EDUCATIONAL STRUCTURE IN INDIA
Faculty-wise Doctorate Degrees (Ph.D.) awarded during 2009-10*
Age
5
I6
7
8
9
10
11
12
13
14
15
16
17
18
19
20
21
22
23
Ph. D.
M. Phil.
24
II
III
IV
V
VI
VII
VIII
IX
X
XI
XII
XIII
XIV
XV
XVI
XVII
UNDERGRADUATECOURSES
P.G. U
niv.
B.Ed
.
OPE
N UN
IVER
SITY
B.E.
/B.T
ECH.
M.Te
ch.
M.D
/MS.
M.B
.B.S
.
PRI.
TEAC
HER
TRNG
OPE
NSC
HOO
LO
PEN
SCHO
OL
NON-
FORM
ALCE
NTRE
S
NON-
FORM
AL C
ENTR
ES
TECH
NICA
LSC
HOO
LS, I
TIs
ITIs
& P
OLY
TECH
NICS
M.E
d.
SR. SECONDARY SCHOOL/Acad/Voc.
SECONDARY SCHOOL
UPPER PRIMARY SCHOOL
PRIMARY SCHOOL
PRE - PRIMARY
Stds
.
ELEM
ENTA
RY E
DUCA
TIO
NSE
C. E
DN.
HIGH
ER E
DUCA
TIO
N
GROWTH OF HIGHER EDUCATION
State-wise Number of Universities / University Level Institutions in the Country (as on December, 2011)
States / UT's
COM
PULS
ORY
EDU
CATI
ON
State-wise Number of Colleges 2010-11*
5000
An
dh
ra P
rad
esh
Aru
nac
hal
Pra
des
hA
ssam
Mah
aras
htr
aM
anip
ur
Pu
nja
b
Sikk
im
Wes
t B
enga
lA
& N
Isla
nd
sC
han
dig
arh
Laks
hd
wee
p
Utt
arak
han
d
D &
N h
avel
iP
ud
uch
erry
Od
ish
aN
agal
and
Miz
ora
mM
egh
alay
a
Ker
ala
Kar
nat
aka
Jhar
khan
dJa
mm
u &
Kas
hm
irH
imac
hal
Pra
des
hH
arya
na
Gu
jara
tG
oa
Ch
atti
sgar
hB
ihar
Raj
asth
an
States / UT's
Mad
hya
Pra
des
h
Del
hi
Dam
an &
Diu
Tam
il N
adu
Utt
ar P
rad
esh
Trip
ura
4500
4000
3500
3000
2500
2000
1500
1000
500
0
Nu
mb
er o
f C
olle
ges
40
66
50
71
6
23
13
28
30
78
11
00
85
2
76
64
55
28
24
12
22
67
94
2
15 39 6
36
03
85
9
46
31
22
36
10
63
34
49
02
18
36
64
15
4
65
3
25
3 42
43
1 86
GROWTH OF HIGHER EDUCATION
Growth of Students Enrolment (‘000’) in Higher Education
1800016975
8399
4925
27521954
7049
3306
16000
14000
12000
10000
8000
6000
4000
2000
1950-510
1050
170431 749
1437397
43
1960-61 1970-71 1980-81
Year
1990-91 2000-01 2010-11*
Total Student Enrolment ('000') Girls Enrolment ('000)
Enro
lmen
t (i
n '0
00
')
GROWTH OF HIGHER EDUCATION
* Provisional
* Provisional
Level-wise Students Enrolment (‘000’) : Boys & Girls 2010-11*10000
9000
8000
7000
6000
5000
4000
3000
2000
1000
0
8580
6037
1167
Graduate
882
81 56 98 73
Post-Graduate Research Diploma/Certificate
Boys Girls
Level
Nu
mb
er (
'00
0')
GROWTH OF HIGHER EDUCATION
State-wise Students Enrolment 2010-11*
An
dh
ra P
rad
esh
Aru
nac
hal
Pra
des
hA
ssam
Meg
hal
aya
Miz
ora
m
Tam
il N
adu
Utt
arak
han
dW
est
Ben
gal
D &
N H
avel
i
Trip
ura
Laks
hd
wee
pP
ud
uch
erry
Sikk
imR
ajas
than
Pu
nja
b
Nag
alan
d
Man
ipu
rM
ahar
ash
tra
Ker
ala
Jam
mu
& K
ash
mir
Him
ach
al P
rad
esh
Har
yan
aG
uja
rat
Go
aD
elh
iC
hat
tisg
arh
Bih
ar
Utt
ar P
rad
esh
States / UT's
Dam
an &
DIu
Ch
and
igar
hA
& N
Isla
nd
Od
ish
a
Mad
hya
Pra
des
h
Kar
nat
aka
Jhar
khan
d
3000000
Total Students Enrolment
18
47
47
91
60
68 26
84
51 69
07
76
30
43
81
27
87
70
26
78
38
93
64
84
52
56
51
33
56
41
84
39
42
74
45
0
40
41
21
10
01
47
3
92
89
39
19
55
22
63
37
55
41
63
31
23
03
20
02
65
10
41
84
69
87
07
89
47
91
16
08
32
80
0 29
44
85
31
58
64
51
02
12
08
60
41
03
51
22
94
40
75
14
82
27
7
25
64
88
6
2500000
2000000
1500000
1000000
500000
0
Type-wise Distribution of Degree awarding Universities / University Level Institutions : December, 2011
Institutes of NationalImportance & Other
University LevelInstitutions
65 (10%)
Deemed Universities129 (20%)
Private Universities100 (16%)
State Universities297 (47%)
Central Universities43 (7%)
Students Enrolment by stages in Higher Education 2010-11*
* Provisional
Year
Growth of Teaching Staff in Universities and Colleges
900000
800000
700000
600000
500000
400000
300000
200000
100000
0
40816966
411628
263125
193341
128876
2.53
5.47
8.21
11.17
17.48
34.69
5967323549
30
35
25
20
15
10
5
01950-51 1960-61 1970-71 1980-81 1990-91 2000-01 2010-11*
Teaching staff in Universities & Colleges Fold increase
No
. of
Un
iver
siti
es
Fold
increase sin
ce 19
50
-51
* ProvisionalSource : MHRD for 1950-51 & 1960-61 and UGC for 1970-71 onwards
Faculty-wise Students Enrolment in Higher Education 2010-11*
Education569961 (3.36%)
Engineering/Technology
2862439 (16.86%)
Veterinary Science27423 (0.16%)
Medicine652533 (3.85%)
Agriculture93166 (0.55%)
Law327146 (1.93%)
Others232691 (1.37%)
Arts6177730 (36.39%)
Science3127042 (18.42%)
Commerce/Management2904752 (17.11%)
Faculty-wise Students Enrolment (‘000’) : Boys & Girls 2010-11*Growth of Higher Education Institutions
35000
30000
25000
20000
15000
10000
5000
1950-510
70033023
256
190
133103
5530
6951542
36044722
7346
12806
564
634600
500
400
300
200
100
0
No
. of
Co
llege
sN
o. o
f Un
iversities
No. of Universities No. of Colleges
1960-61 1970-71 1980-81Years
1990-91 2000-01 2010-11 Dec.,2011
* Provisional * Provisional Boys Girls
Arts
Com
mer
ce/
Man
agem
ent
Educ
atio
nEn
gg./
Tech
.
Med
icin
eAg
ricul
ture
Vete
rinar
ySc
ienc
e Law
Oth
ers
Scie
nce
3500
3000
2500
2000
1500
1000
500
0
32
73
29
05
17
78
13
49
11
37
17
68
24
63
24
32
23
30
20 7
24
38
4 14
58
7
68
25
80
12
06
2
Nu
mb
er (
'00
0')
Faculty
Arts3490 (31%)
Others503 (5%)
Law123 (1%)
Veterinary Science150 (1%)
Agriculture573 (5%)
Medicine337 (3%)
Engineering/Technology1007 (9%)
Education469 (4%)
Commerce &Management
767 (7%) Science3742 (34%)
* Provisional (Data pertains to 305 Universities / University level Institutions, out of 534)
Arts includes Humanities, Social Sciences, Languages etc.
Science includes Basic Science, Home-Science, Computer Science
and Computer Application.
Medicine includes Ayurveda, Dentistry, Homeopathy, Nursing,
Pharmacy, Public Health/Social Preventive Medicine, Unani,
Tibbia, Physiotherapy, Occupational Therapy and Siddha Medicine
etc.
Others includes Library and Information Science, Fine Arts,
Journalism & Mass Communication, Physical Education, Social
Work, etc.
Post-Graduate2049124 (12%)
Research137668 (1%)
Diploma / Certificate171618 (1%)
Graduate14616473 (86%)
Growth of Higher Education : Universities/Colleges/Studentsenrolment/Teaching Staff : 1950-51 – 2010-11*
* Provisional
* Provisional
50
45
0
15
20
25
30
35
40
Nu
mb
er
Fold
Increase
(18.8)
56.4
(47.52)169.76
(34.69)
(42.76)
33.02
0.73.970.243
0
Universities(in Tens)
Colleges(in Thousand)
Enrolment(in Lakhs)
Teaching Staff(in Lakhs)
20
40
60
80
100
120
140
160
180
Fold-Increase 1950-512010-11
5
10
8.17
An
dh
ra P
rad
esh
Aru
nac
hal
Pra
des
hA
ssam
Ker
ala
Kar
nat
aka
Jhar
khan
dJa
mm
u &
Kas
hm
irH
imac
hal
Pra
des
hH
arya
na
Gu
jara
tG
oa
Del
hi
Ch
atti
sgar
hB
ihar
46
60
50
3
10
21
15
25
2
36
2218
12
42
19M
adh
ya P
rad
esh
28
11
40
30
20
10
0
Nu
mb
er
Mah
aras
htr
aM
anip
ur
Pu
nja
b
Sikk
imTa
mil
Nad
uTr
ipu
raU
ttar
Pra
des
hU
ttar
akh
and
Wes
t B
enga
lC
han
dig
arh
Pu
du
cher
ry
Od
ish
aN
agal
and
Miz
ora
mM
egh
alay
a
Raj
asth
an
9
3 4
26
19
58
3
59
5 3 4
48
1719
44
3
*ProvisionalSource : MHRD for 1950-51 & 1960-61 and UGC for 1970-71 onwardsCoverage : Figures of students enrolment & teaching staff (1970-71 onwards) pertain to regular courses in Universities & Colleges (excluding Polytechnics, other Diploma awarding Institutions &Non-formal System of Higher Education)
Source : MHRD / UGC

EDUCATIONAL STRUCTURE IN INDIA
Faculty-wise Doctorate Degrees (Ph.D.) awarded during 2009-10*
Age
5
I6
7
8
9
10
11
12
13
14
15
16
17
18
19
20
21
22
23
Ph. D.
M. Phil.
24
II
III
IV
V
VI
VII
VIII
IX
X
XI
XII
XIII
XIV
XV
XVI
XVII
UNDERGRADUATECOURSES
P.G. U
niv.
B.Ed
.
OPE
N UN
IVER
SITY
B.E.
/B.T
ECH.
M.Te
ch.
M.D
/MS.
M.B
.B.S
.
PRI.
TEAC
HER
TRNG
OPE
NSC
HOO
LO
PEN
SCHO
OL
NON-
FORM
ALCE
NTRE
S
NON-
FORM
AL C
ENTR
ES
TECH
NICA
LSC
HOO
LS, I
TIs
ITIs
& P
OLY
TECH
NICS
M.E
d.
SR. SECONDARY SCHOOL/Acad/Voc.
SECONDARY SCHOOL
UPPER PRIMARY SCHOOL
PRIMARY SCHOOL
PRE - PRIMARY
Stds
.
ELEM
ENTA
RY E
DUCA
TIO
NSE
C. E
DN.
HIGH
ER E
DUCA
TIO
N
GROWTH OF HIGHER EDUCATION
State-wise Number of Universities / University Level Institutions in the Country (as on December, 2011)
States / UT's
COM
PULS
ORY
EDU
CATI
ON
State-wise Number of Colleges 2010-11*
5000
An
dh
ra P
rad
esh
Aru
nac
hal
Pra
des
hA
ssam
Mah
aras
htr
aM
anip
ur
Pu
nja
b
Sikk
im
Wes
t B
enga
lA
& N
Isla
nd
sC
han
dig
arh
Laks
hd
wee
p
Utt
arak
han
d
D &
N h
avel
iP
ud
uch
erry
Od
ish
aN
agal
and
Miz
ora
mM
egh
alay
a
Ker
ala
Kar
nat
aka
Jhar
khan
dJa
mm
u &
Kas
hm
irH
imac
hal
Pra
des
hH
arya
na
Gu
jara
tG
oa
Ch
atti
sgar
hB
ihar
Raj
asth
an
States / UT's
Mad
hya
Pra
des
h
Del
hi
Dam
an &
Diu
Tam
il N
adu
Utt
ar P
rad
esh
Trip
ura
4500
4000
3500
3000
2500
2000
1500
1000
500
0
Nu
mb
er o
f C
olle
ges
40
66
50
71
6
23
13
28
30
78
11
00
85
2
76
64
55
28
24
12
22
67
94
2
15 39 6
36
03
85
9
46
31
22
36
10
63
34
49
02
18
36
64
15
4
65
3
25
3 42
43
1 86
GROWTH OF HIGHER EDUCATION
Growth of Students Enrolment (‘000’) in Higher Education
1800016975
8399
4925
27521954
7049
3306
16000
14000
12000
10000
8000
6000
4000
2000
1950-510
1050
170431 749
1437397
43
1960-61 1970-71 1980-81
Year
1990-91 2000-01 2010-11*
Total Student Enrolment ('000') Girls Enrolment ('000)
Enro
lmen
t (i
n '0
00
')
GROWTH OF HIGHER EDUCATION
* Provisional
* Provisional
Level-wise Students Enrolment (‘000’) : Boys & Girls 2010-11*10000
9000
8000
7000
6000
5000
4000
3000
2000
1000
0
8580
6037
1167
Graduate
882
81 56 98 73
Post-Graduate Research Diploma/Certificate
Boys Girls
Level
Nu
mb
er (
'00
0')
GROWTH OF HIGHER EDUCATION
State-wise Students Enrolment 2010-11*
An
dh
ra P
rad
esh
Aru
nac
hal
Pra
des
hA
ssam
Meg
hal
aya
Miz
ora
m
Tam
il N
adu
Utt
arak
han
dW
est
Ben
gal
D &
N H
avel
i
Trip
ura
Laks
hd
wee
pP
ud
uch
erry
Sikk
imR
ajas
than
Pu
nja
b
Nag
alan
d
Man
ipu
rM
ahar
ash
tra
Ker
ala
Jam
mu
& K
ash
mir
Him
ach
al P
rad
esh
Har
yan
aG
uja
rat
Go
aD
elh
iC
hat
tisg
arh
Bih
ar
Utt
ar P
rad
esh
States / UT's
Dam
an &
DIu
Ch
and
igar
hA
& N
Isla
nd
Od
ish
a
Mad
hya
Pra
des
h
Kar
nat
aka
Jhar
khan
d
3000000
Total Students Enrolment
18
47
47
91
60
68 26
84
51 69
07
76
30
43
81
27
87
70
26
78
38
93
64
84
52
56
51
33
56
41
84
39
42
74
45
0
40
41
21
10
01
47
3
92
89
39
19
55
22
63
37
55
41
63
31
23
03
20
02
65
10
41
84
69
87
07
89
47
91
16
08
32
80
0 29
44
85
31
58
64
51
02
12
08
60
41
03
51
22
94
40
75
14
82
27
7
25
64
88
6
2500000
2000000
1500000
1000000
500000
0
Type-wise Distribution of Degree awarding Universities / University Level Institutions : December, 2011
Institutes of NationalImportance & Other
University LevelInstitutions
65 (10%)
Deemed Universities129 (20%)
Private Universities100 (16%)
State Universities297 (47%)
Central Universities43 (7%)
Students Enrolment by stages in Higher Education 2010-11*
* Provisional
Year
Growth of Teaching Staff in Universities and Colleges
900000
800000
700000
600000
500000
400000
300000
200000
100000
0
40816966
411628
263125
193341
128876
2.53
5.47
8.21
11.17
17.48
34.69
5967323549
30
35
25
20
15
10
5
01950-51 1960-61 1970-71 1980-81 1990-91 2000-01 2010-11*
Teaching staff in Universities & Colleges Fold increase
No
. of
Un
iver
siti
esFo
ld in
crease since 1
95
0-5
1
* ProvisionalSource : MHRD for 1950-51 & 1960-61 and UGC for 1970-71 onwards
Faculty-wise Students Enrolment in Higher Education 2010-11*
Education569961 (3.36%)
Engineering/Technology
2862439 (16.86%)
Veterinary Science27423 (0.16%)
Medicine652533 (3.85%)
Agriculture93166 (0.55%)
Law327146 (1.93%)
Others232691 (1.37%)
Arts6177730 (36.39%)
Science3127042 (18.42%)
Commerce/Management2904752 (17.11%)
Faculty-wise Students Enrolment (‘000’) : Boys & Girls 2010-11*Growth of Higher Education Institutions
35000
30000
25000
20000
15000
10000
5000
1950-510
70033023
256
190
133103
5530
6951542
36044722
7346
12806
564
634600
500
400
300
200
100
0
No
. of
Co
llege
s
No
. of U
niversities
No. of Universities No. of Colleges
1960-61 1970-71 1980-81Years
1990-91 2000-01 2010-11 Dec.,2011
* Provisional * Provisional Boys Girls
Arts
Com
mer
ce/
Man
agem
ent
Educ
atio
nEn
gg./
Tech
.
Med
icin
eAg
ricul
ture
Vete
rinar
ySc
ienc
e Law
Oth
ers
Scie
nce
3500
3000
2500
2000
1500
1000
500
0
32
73
29
05
17
78
13
49
11
37
17
68
24
63
24
32
23
30
20 7
24
38
4 14
58
7
68
25
80
12
06
2
Nu
mb
er (
'00
0')
Faculty
Arts3490 (31%)
Others503 (5%)
Law123 (1%)
Veterinary Science150 (1%)
Agriculture573 (5%)
Medicine337 (3%)
Engineering/Technology1007 (9%)
Education469 (4%)
Commerce &Management
767 (7%) Science3742 (34%)
* Provisional (Data pertains to 305 Universities / University level Institutions, out of 534)
Arts includes Humanities, Social Sciences, Languages etc.
Science includes Basic Science, Home-Science, Computer Science
and Computer Application.
Medicine includes Ayurveda, Dentistry, Homeopathy, Nursing,
Pharmacy, Public Health/Social Preventive Medicine, Unani,
Tibbia, Physiotherapy, Occupational Therapy and Siddha Medicine
etc.
Others includes Library and Information Science, Fine Arts,
Journalism & Mass Communication, Physical Education, Social
Work, etc.
Post-Graduate2049124 (12%)
Research137668 (1%)
Diploma / Certificate171618 (1%)
Graduate14616473 (86%)
Growth of Higher Education : Universities/Colleges/Studentsenrolment/Teaching Staff : 1950-51 – 2010-11*
* Provisional
* Provisional
50
45
0
15
20
25
30
35
40
Nu
mb
er
Fold
Increase
(18.8)
56.4
(47.52)169.76
(34.69)
(42.76)
33.02
0.73.970.243
0
Universities(in Tens)
Colleges(in Thousand)
Enrolment(in Lakhs)
Teaching Staff(in Lakhs)
20
40
60
80
100
120
140
160
180
Fold-Increase 1950-512010-11
5
10
8.17
An
dh
ra P
rad
esh
Aru
nac
hal
Pra
des
hA
ssam
Ker
ala
Kar
nat
aka
Jhar
khan
dJa
mm
u &
Kas
hm
irH
imac
hal
Pra
des
hH
arya
na
Gu
jara
tG
oa
Del
hi
Ch
atti
sgar
hB
ihar
46
60
50
3
10
21
15
25
2
36
2218
12
42
19
Mad
hya
Pra
des
h
28
11
40
30
20
10
0
Nu
mb
er
Mah
aras
htr
aM
anip
ur
Pu
nja
b
Sikk
imTa
mil
Nad
uTr
ipu
raU
ttar
Pra
des
hU
ttar
akh
and
Wes
t B
enga
lC
han
dig
arh
Pu
du
cher
ry
Od
ish
aN
agal
and
Miz
ora
mM
egh
alay
a
Raj
asth
an
9
3 4
26
19
58
3
59
5 3 4
48
1719
44
3
*ProvisionalSource : MHRD for 1950-51 & 1960-61 and UGC for 1970-71 onwardsCoverage : Figures of students enrolment & teaching staff (1970-71 onwards) pertain to regular courses in Universities & Colleges (excluding Polytechnics, other Diploma awarding Institutions &Non-formal System of Higher Education)
Source : MHRD / UGC

EDUCATIONAL STRUCTURE IN INDIA
Faculty-wise Doctorate Degrees (Ph.D.) awarded during 2009-10*
Age
5
I6
7
8
9
10
11
12
13
14
15
16
17
18
19
20
21
22
23
Ph. D.
M. Phil.
24
II
III
IV
V
VI
VII
VIII
IX
X
XI
XII
XIII
XIV
XV
XVI
XVII
UNDERGRADUATECOURSES
P.G. U
niv.
B.Ed
.
OPE
N UN
IVER
SITY
B.E.
/B.T
ECH.
M.Te
ch.
M.D
/MS.
M.B
.B.S
.
PRI.
TEAC
HER
TRNG
OPE
NSC
HOO
LO
PEN
SCHO
OL
NON-
FORM
ALCE
NTRE
S
NON-
FORM
AL C
ENTR
ES
TECH
NICA
LSC
HOO
LS, I
TIs
ITIs
& P
OLY
TECH
NICS
M.E
d.
SR. SECONDARY SCHOOL/Acad/Voc.
SECONDARY SCHOOL
UPPER PRIMARY SCHOOL
PRIMARY SCHOOL
PRE - PRIMARY
Stds
.
ELEM
ENTA
RY E
DUCA
TIO
NSE
C. E
DN.
HIGH
ER E
DUCA
TIO
N
GROWTH OF HIGHER EDUCATION
State-wise Number of Universities / University Level Institutions in the Country (as on December, 2011)
States / UT's
COM
PULS
ORY
EDU
CATI
ON
State-wise Number of Colleges 2010-11*
5000
An
dh
ra P
rad
esh
Aru
nac
hal
Pra
des
hA
ssam
Mah
aras
htr
aM
anip
ur
Pu
nja
b
Sikk
im
Wes
t B
enga
lA
& N
Isla
nd
sC
han
dig
arh
Laks
hd
wee
p
Utt
arak
han
d
D &
N h
avel
iP
ud
uch
erry
Od
ish
aN
agal
and
Miz
ora
mM
egh
alay
a
Ker
ala
Kar
nat
aka
Jhar
khan
dJa
mm
u &
Kas
hm
irH
imac
hal
Pra
des
hH
arya
na
Gu
jara
tG
oa
Ch
atti
sgar
hB
ihar
Raj
asth
an
States / UT's
Mad
hya
Pra
des
h
Del
hi
Dam
an &
Diu
Tam
il N
adu
Utt
ar P
rad
esh
Trip
ura
4500
4000
3500
3000
2500
2000
1500
1000
500
0
Nu
mb
er o
f C
olle
ges
40
66
50
71
6
23
13
28
30
78
11
00
85
2
76
64
55
28
24
12
22
67
94
2
15 39 6
36
03
85
9
46
31
22
36
10
63
34
49
02
18
36
64
15
4
65
3
25
3 42
43
1 86
GROWTH OF HIGHER EDUCATION
Growth of Students Enrolment (‘000’) in Higher Education
1800016975
8399
4925
27521954
7049
3306
16000
14000
12000
10000
8000
6000
4000
2000
1950-510
1050
170431 749
1437397
43
1960-61 1970-71 1980-81
Year
1990-91 2000-01 2010-11*
Total Student Enrolment ('000') Girls Enrolment ('000)
Enro
lmen
t (i
n '0
00
')
GROWTH OF HIGHER EDUCATION
* Provisional
* Provisional
Level-wise Students Enrolment (‘000’) : Boys & Girls 2010-11*10000
9000
8000
7000
6000
5000
4000
3000
2000
1000
0
8580
6037
1167
Graduate
882
81 56 98 73
Post-Graduate Research Diploma/Certificate
Boys Girls
Level
Nu
mb
er (
'00
0')
GROWTH OF HIGHER EDUCATION
State-wise Students Enrolment 2010-11*
An
dh
ra P
rad
esh
Aru
nac
hal
Pra
des
hA
ssam
Meg
hal
aya
Miz
ora
m
Tam
il N
adu
Utt
arak
han
dW
est
Ben
gal
D &
N H
avel
i
Trip
ura
Laks
hd
wee
pP
ud
uch
erry
Sikk
imR
ajas
than
Pu
nja
b
Nag
alan
d
Man
ipu
rM
ahar
ash
tra
Ker
ala
Jam
mu
& K
ash
mir
Him
ach
al P
rad
esh
Har
yan
aG
uja
rat
Go
aD
elh
iC
hat
tisg
arh
Bih
ar
Utt
ar P
rad
esh
States / UT's
Dam
an &
DIu
Ch
and
igar
hA
& N
Isla
nd
Od
ish
a
Mad
hya
Pra
des
h
Kar
nat
aka
Jhar
khan
d
3000000
Total Students Enrolment
18
47
47
91
60
68 26
84
51 69
07
76
30
43
81
27
87
70
26
78
38
93
64
84
52
56
51
33
56
41
84
39
42
74
45
0
40
41
21
10
01
47
3
92
89
39
19
55
22
63
37
55
41
63
31
23
03
20
02
65
10
41
84
69
87
07
89
47
91
16
08
32
80
0 29
44
85
31
58
64
51
02
12
08
60
41
03
51
22
94
40
75
14
82
27
7
25
64
88
6
2500000
2000000
1500000
1000000
500000
0
Type-wise Distribution of Degree awarding Universities / University Level Institutions : December, 2011
Institutes of NationalImportance & Other
University LevelInstitutions
65 (10%)
Deemed Universities129 (20%)
Private Universities100 (16%)
State Universities297 (47%)
Central Universities43 (7%)
Students Enrolment by stages in Higher Education 2010-11*
* Provisional
Year
Growth of Teaching Staff in Universities and Colleges
900000
800000
700000
600000
500000
400000
300000
200000
100000
0
40816966
411628
263125
193341
128876
2.53
5.47
8.21
11.17
17.48
34.69
5967323549
30
35
25
20
15
10
5
01950-51 1960-61 1970-71 1980-81 1990-91 2000-01 2010-11*
Teaching staff in Universities & Colleges Fold increase
No
. of
Un
iver
siti
es
Fold
increase sin
ce 19
50
-51
* ProvisionalSource : MHRD for 1950-51 & 1960-61 and UGC for 1970-71 onwards
Faculty-wise Students Enrolment in Higher Education 2010-11*
Education569961 (3.36%)
Engineering/Technology
2862439 (16.86%)
Veterinary Science27423 (0.16%)
Medicine652533 (3.85%)
Agriculture93166 (0.55%)
Law327146 (1.93%)
Others232691 (1.37%)
Arts6177730 (36.39%)
Science3127042 (18.42%)
Commerce/Management2904752 (17.11%)
Faculty-wise Students Enrolment (‘000’) : Boys & Girls 2010-11*Growth of Higher Education Institutions
35000
30000
25000
20000
15000
10000
5000
1950-510
70033023
256
190
133103
5530
6951542
36044722
7346
12806
564
634600
500
400
300
200
100
0
No
. of
Co
llege
s
No
. of U
niversities
No. of Universities No. of Colleges
1960-61 1970-71 1980-81Years
1990-91 2000-01 2010-11 Dec.,2011
* Provisional * Provisional Boys Girls
Arts
Com
mer
ce/
Man
agem
ent
Educ
atio
nEn
gg./
Tech
.
Med
icin
eAg
ricul
ture
Vete
rinar
ySc
ienc
e Law
Oth
ers
Scie
nce
3500
3000
2500
2000
1500
1000
500
0
32
73
29
05
17
78
13
49
11
37
17
68
24
63
24
32
23
30
20 7
24
38
4 14
58
7
68
25
80
12
06
2
Nu
mb
er (
'00
0')
Faculty
Arts3490 (31%)
Others503 (5%)
Law123 (1%)
Veterinary Science150 (1%)
Agriculture573 (5%)
Medicine337 (3%)
Engineering/Technology1007 (9%)
Education469 (4%)
Commerce &Management
767 (7%) Science3742 (34%)
* Provisional (Data pertains to 305 Universities / University level Institutions, out of 534)
Arts includes Humanities, Social Sciences, Languages etc.
Science includes Basic Science, Home-Science, Computer Science
and Computer Application.
Medicine includes Ayurveda, Dentistry, Homeopathy, Nursing,
Pharmacy, Public Health/Social Preventive Medicine, Unani,
Tibbia, Physiotherapy, Occupational Therapy and Siddha Medicine
etc.
Others includes Library and Information Science, Fine Arts,
Journalism & Mass Communication, Physical Education, Social
Work, etc.
Post-Graduate2049124 (12%)
Research137668 (1%)
Diploma / Certificate171618 (1%)
Graduate14616473 (86%)
Growth of Higher Education : Universities/Colleges/Studentsenrolment/Teaching Staff : 1950-51 – 2010-11*
* Provisional
* Provisional
50
45
0
15
20
25
30
35
40
Nu
mb
er
Fold
Increase
(18.8)
56.4
(47.52)169.76
(34.69)
(42.76)
33.02
0.73.970.243
0
Universities(in Tens)
Colleges(in Thousand)
Enrolment(in Lakhs)
Teaching Staff(in Lakhs)
20
40
60
80
100
120
140
160
180
Fold-Increase 1950-512010-11
5
10
8.17
An
dh
ra P
rad
esh
Aru
nac
hal
Pra
des
hA
ssam
Ker
ala
Kar
nat
aka
Jhar
khan
dJa
mm
u &
Kas
hm
irH
imac
hal
Pra
des
hH
arya
na
Gu
jara
tG
oa
Del
hi
Ch
atti
sgar
hB
ihar
46
60
50
3
10
21
15
25
2
36
2218
12
42
19
Mad
hya
Pra
des
h
28
11
40
30
20
10
0
Nu
mb
er
Mah
aras
htr
aM
anip
ur
Pu
nja
b
Sikk
imTa
mil
Nad
uTr
ipu
raU
ttar
Pra
des
hU
ttar
akh
and
Wes
t B
enga
lC
han
dig
arh
Pu
du
cher
ry
Od
ish
aN
agal
and
Miz
ora
mM
egh
alay
a
Raj
asth
an
9
3 4
26
19
58
3
59
5 3 4
48
1719
44
3
*ProvisionalSource : MHRD for 1950-51 & 1960-61 and UGC for 1970-71 onwardsCoverage : Figures of students enrolment & teaching staff (1970-71 onwards) pertain to regular courses in Universities & Colleges (excluding Polytechnics, other Diploma awarding Institutions &Non-formal System of Higher Education)
Source : MHRD / UGC

The University Grants Commission which came into existence on
28.12.1953 became a statutory body of Government of India by an
Act of Parliament in 1956. The Section 12 of the UGC Act provides
that the Commission shall in consultation with the concerned
universities, take all such steps as it may think fit for the promotion
and coordination of university education and for the maintenance of
standards in teaching, examination and research. For teaching and
research, extension was added as the third dimension of education
by the Commission.
The UGC serves as a vital link between the Union and State
Governments and the institutions of higher learning. In addition to
its role of giving grants to universities and colleges, the University
Grants Commission also advises Central and State Governments on
the measures necessary for the improvement of university
education. It also frames regulations such as those on the minimum
standards of instruction and qualifications of teachers on the advice
of subject specialists and academicians with whom it frequently
interacts in connection with the formulation, evaluation and
monitoring of programmes.
UNIVERSITY GRANTS COMMISSION
UGC Interventions towards quality enhancement in higher education
Schemes exclusively meant for Universities
Schemes meant exclusively for Colleges
Schemes meant for both Universities and Colleges
1. General development Assistance to Central, State and Deemed universities
(Includes 16 merged schemes)
2. One time Catch up grants to Non-12B State Universities funded by State
Governments
3. Operation 'Faculty Recharge': initiative for Augmenting the Research and
Teaching Resources of Universities
4. Enhancing Faculty resources of Universities - ENCORE
5. Establishment of Rajiv Gandhi chairs in Universities
6. Academic Staff Colleges
7. Special Assistance Programme
8. Centres with Potential for Excellence in Particular Areas (Envisaged to
identify 25 Universities during XI Plan)
9. Area Study Centers in Universities
10. Universities with Potential for Excellence
11. Establishing/Up gradation of Computer Centers
12. UGC-INFONET Connectivity Programme
13. UGC-INFONET Digital Library Consortium
14. Promotion of Yoga Education and Practice of Positive Health in Universities
15. Incentives for Resource Mobilization
16. Development Assistance for Up gradation of Existing and New
Management Departments in Universities
17. Development Grant to Colleges (includes 14 merged schemes)
18. One-time Catch-up Grant to Uncovered (Non-12B) Colleges
19. Development Assistance to Colleges for the Construction of Buildings
20. Construction of Women's Hostel for Colleges
21. Establishment of New Model Degree Colleges in Educationally Backward
Districts with Low (GER)
22. Faculty Development Programme for Colleges
23. Organizing Conferences/Workshops/Seminars in Colleges
24. Autonomous Colleges
25. Colleges with Potential for Excellence
26. Instrumentation Maintenance Facility (IMF) in Colleges
27. UGC-Network Resource Center (UGC-NRC) in Colleges
28. Jubilee, Centenary Grants to Colleges
29. Providing additional assistance to Universities and 5,500 Colleges already
covered under Section 12(B) of the UGC Act, 1956
30. Development of Women's Studies in Indian Universities and Colleges
31. Capacity Building for Women Managers in Higher Education
32. Establishment of Special Cells for SCs & STs in Universities/ Deemed to be
Universities and Grant-in aid Institutions & IUCs receiving Central
Assistance
33. Innovative Programmes
34. Setting Up of Media Centers/ Affiliated Media Centers
35. Career Oriented Courses in Universities and Colleges
36. Establishment and monitoring of the Internal Quality Assurance Cells
(IQACs) in Higher Education Institutions (HEIs)
37. E-Content Development
38. Strengthening Social Science and Humanities Teaching and Research
capacity
39. Research Fellowship in Humanities & Social Sciences Students
40. Development of Sports Infrastructure and Equipment in Universities and
Colleges
UNIVERSITY GRANTS COMMISSIONBahadur Shah Zafar Marg, New Delhi-110 002
Website : www.ugc.ac.in
1. All India Council for Technical Education (AICTE) (1987)
2. Bar Council of India (BCI) (1961)
3. Central Council of Homoeopathy (CCH) (1973)
4. Central Council of Indian Medicine (CCIM) (1970)
5. Council of Architecture (CoA) (1972)
6. Dental Council of India (DCI) (1948)
7. Distance Education Council (DEC) (1985)
8. Indian Council of Agricultural Research (ICAR)
9. Indian Nursing Council (INC) (1947)
10. Institute of Cost and Works Accountants of India (ICWAI) (1959)
11. Medical Council of India (MCI) (1956)
12. National Council for Teacher Education (NCTE) (1993)
13. Pharmacy Council of India (PCI) (1948)
14. Rehabilitation Council of India (RCI) (1992)
15. State Councils of Higher Education (SCHE)
16. University Grants Commission (UGC) (1956)
17. Veterinary Council of India (VCI) (1984)
Source : Respective Websites
Regulatory Bodies Source : Analysis of Budgeted Expenditure on Education, MHRD
EXPENDITURE IN EDUCATION
Educational Expenditure as % of Public Expenditure & GDP16
14
12
10
8
6
4
2
Year
0
1951-52
0.641.48
2.11
2.983.84
4.28
3.77
7.92
11.99
13.37
14.42
13.63
10.16
10.67
Educational Expendture as % of Public Expenditure As % of GDP
1960-61
1970-71
1980-81
1990-91
2000-01
2008-09 (P)
Perc
enta
ge
(P) : Provisional estimatesSource : Analysis of Budgeted Expenditure on Education, MHRD
Higher & TechnicalEducation
32.3%Adult Education
0.3%ElementaryEducation
41.8%
SecondaryEducation
25.6%
Source : Analysis of Budgeted Expenditure on Education, MHRD
Public Expenditure on Education - Sector-wise (Estimated) : 2009-10
Expenditure on Higher Education in India (As % of GDP)
4.5
Exp
end
itu
re (
as %
of
GD
P)
4
3.5
3
2.5
2
1.5
1
0.5
02006-07
3.64
1.091.23
1.25
3.4
3.77 3.85
Expenditure on Education (as % of GDP) Higher Education as % GDP
Higher Educationin India at a glance
Statewise Higher Education Institutions
February, 2012
UNIVERSITY GRANTS COMMISSIONBahadur Shah Zafar Marg, New Delhi-110 002 (INDIA)
Website : www.ugc.ac.in
Jammu &Kashmir
Himachal Pradesh
Punjab
Chandigarhl
253
H
l 11 328H
l
106319
H
l
226759
H
l
864
H
H 6
l
307842
H
l
542
H
3H
l
463144
H
l
64115
Hl
223628
Hl
183636
H
l
241248
H
l
90222
H
l
385958
H l
65321
Hl
649
H
l 10 507H
l
554
H
l 3 16H
l
393
Hl
283
H
l
763
H
l
155
H
l
24325
H
l
110019
H
l
94226
Hl
23112
H
l
406646
H
H 4
H 1
Haryana
Chha
tisga
rh
Delhi
Delhi Sikkim
ArunachalPradesh
Rajasthan
Gujarat
Daman & Diu
D & N Haveli
Maharashtra
Karnataka
Andhra Pradesh
Puducherry
A & N Island
TamilNadu
Kerala
Lakshadweep
Goa
Uttar Pradesh
Odisha
Bihar
Jharkhand
WestBengal
Meghalaya
Tripura
Mizoram
Manipur
Nagaland
Assam
Madhya Pradesh
Uttrakhandl
36019
H
l
85217
H
Number of Degree awarding Institutions
Number of Colleges
Total Number of Degree awarding Institutions = 634
Number of Colleges = 33,023
l
34418
H
1.14
2007-08 2008-09 2009-10
41. Guidelines for Universities, Research Institutes and Colleges for
Procurement, Storage, Usage and Disposal of Radioactive and other
Hazardous materials/Chemicals
42. Epoch Making Social Thinkers of India
43. Human Rights and Values in Education
44. Lifelong Learning and Extension
45. Modified Guidelines for Post Graduate Merit Scholarship Scheme for
University Rank Holders at Undergraduate Level
46. Research Fellowship in Science for Meritorious Students
47. Junior Research fellowship (JRF) in Sciences, Humanities and Social
Sciences
48. Junior Research fellowship in Engineering and Technology
49. Junior Research fellowship (JRF) and Research Associateship (RA) for
Foreign Nationals
50. Fellowship to M.Phil/Ph.D Scholars in Central Universities
51. Dr. S. Radhakrishnan Post Doctoral Fellowship (PDF) in Humanities and
Sciences (including languages )
52. Dr. D.S. Kothari Post-Doctoral Fellowships in Sciences, Medical Sciences &
Engineering Sciences
53. Post Doctoral Fellowship to Women Candidates
54. Post Graduate Indira Gandhi Scholarship Scheme for Single Girl Child
55. Rajiv Gandhi National Fellowship for SC/ST Candidates
56. Emeritus Fellowship
57. Special Honorarium to teachers who are Fellows of at least two of the four
Science Academies identified by UGC
58. Research Awards
59. Major Research Project
60. Minor Research Project
61. Incentivisation of Teachers, Subject/Discipline based Association for
Organization of various Academic and Research Activities
62. Travel Grant Scheme for College Teachers/College Librarians/Vice
Chancellors/Commission Members and UGC Officers
63. Appointment/ Honorarium of Guest/Part-Time Teachers
Details about Schemes are available on UGC website : www.ugc.ac.in
Schemes meant for professional development of Faculty of Universities &
Colleges and for recognition of Academics of eminence