university committee on faculty affairs october 8, 2013 budget and planning overview
DESCRIPTION
University committee on faculty affairs October 8, 2013 budget and planning overview. Office of Planning and Budgets. MSU All Funds Revenues. 1990: $0.7B. 2012: $2.0B. Departmental $40M 6%. Auxiliary: $121M 17%. Tuition & Fees: $134M 19%. Auxiliary: $293M 14%. Tuition & Fees: - PowerPoint PPT PresentationTRANSCRIPT

•1

Other:
$14M 2%
1990: $0.7B 2012: $2.0B
•Office of Planning and Budgets
•2
Tuition & Fees:
$134M 19%
Tuition & Fees:
$641M 31%
Auxiliary:
$121M 17%
Auxiliary:
$293M 14%
Appropriations:
$206M 30%
Appropriations:
$241M 12%
AgBio Research/MSUE
:
$38M 5%
AgBio Research/MSU
E:
$52M 3%
Sponsored Programs:
$137M 20%Sponsored Programs:
$443M 22%
Gifts:
$44M 6%
Gifts:
$174M 9%
Other:
$31M 1%
Departmental
$165M 8%
Departmental
$40M 6%
Ranking:
1)Appropriation
2)Sponsored Programs
3)Tuition & Fees
4)Auxiliary
5)Gifts
Ranking:
1)Tuition & Fees
2)Sponsored Programs
3)Auxiliary
4)Appropriation
5)Gifts
MSU All Funds Revenues

•3
By Fund
1990: $0.7B 2012: $2.0B
Fluctuations between annual revenue and expense totals vary with investment performance and state appropriations outcomes
MSU All Funds Expenses

•4
•State Appropriations SupportState Appropriations History
Appropriations down
$81M over 10 years
If increased at inflation, MSU appropriations
would be $166.6M more than current
levels

•5

•6
•7

Tuition & Fees / Cost of Attendance
Northwestern University $43,779University of Michigan $39,122Michigan State University $32,580Indiana University $31,484University of Illinois $29,102Penn State University $28,746Purdue University $28,702University of Wisconsin $26,628University of Iowa $26,279Ohio State University $25,450University of Nebraska $20,734University of Minnesota $18,774
Northwestern University $60,840University of Michigan $51,940Indiana University $44,568Penn State University $44,458Michigan State University $43,986University of Illinois $43,144Purdue University $42,010University of Wisconsin $40,988Ohio State University $40,902University of Iowa $40,054University of Nebraska $34,450University of Minnesota $29,774
Non-Resident Tuition & Fees Non-Resident Cost of Attendance
MSU ranks 3rd in the Big Ten for non-resident tuition and fees and 5th for cost of attendance
•8
Big Ten Non-Resident

Tuition & Fees / Cost of Attendance
Resident Tuition & Fees Resident Cost of Attendance
MSU ranks 6th in the Big Ten for resident tuition and fees and cost of attendance
Northwestern University $43,779Penn State University $16,444University of Illinois $14,960University of Minnesota $13,524University of Michigan $12,994Michigan State University $12,623University of Wisconsin $10,379Indiana University $10,034Ohio State University $10,034Purdue University $9,900University of Iowa $8,057University of Nebraska $7,984
Northwestern University $60,840Penn State University $32,156University of Illinois $29,002University of Michigan $25,812Ohio State University $24,850University of Minnesota $24,524Michigan State University $24,029University of Wisconsin $23,759Purdue University $23,208Indiana University $23,118University of Iowa $21,832University of Nebraska $21,700
•9
Big Ten Resident

•10
MSU Endowment Status

•11
IPEDS 2010-11 reporting
Big Ten Revenues

•12
Big Ten Median & MSU
FY07-FY11
Big Ten Min Big Ten Median
Big Ten Max
As of 06/30/2011
Total Growth in Expenses

•13
As of 06/30/2011
Commonly used peer comparison that does not account for structural differences between institutions (i.e. Hospitals, System Consolidation, Agricultural Experiment Stations, etc
Big Ten Net Assets

•14
Big Ten & MSU
FY07-FY11
Big Ten Min Big Ten Median
Big Ten Max
As of 06/30/2011
Total Growth in Unrestricted Net Assets

•15
Big Ten Median & MSU
FY07-FY11
Big Ten Min Big Ten Median
Big Ten Max
As of 06/30/2011
Total Growth in Debt

Moody’s Long Term Credit Ratings
S&P Moody’s
(Northwestern, University of Michigan) AAA Aaa(Indiana, Northwestern, Purdue, University of Michigan)
(Indiana, Purdue) AA+ Aa1* (MSU, Iowa, Minnesota, Nebraska, OSU)(MSU, Iowa, Minnesota, Nebraska, OSU,
PSU) AA* Aa2 (University of Illinois, PSU)
(University of Illinois) AA- Aa3A+ A1A A2A- A3
Note: University of Wisconsin not rated by S&P or Moody’s
*Big Ten Median
Big Ten
As of 01/11/13

*In addition to the above, MSU also has $81M in short-term commercial paper to be converted to long-term debt, and $143M in short-term commercial paper to be repaid by internal units
Outstanding debt includes issues 2000A, 2003A, 2005, 2007A, 2007B, 2010A, 2010C
Long Term Bonds
General Fund General Fund $338
Revenue Based Residential and Hospitality Services $169 Intercollegiate Athletics $57
Projects Parking Operations $47 Facility for Rare Isotope Beams $17 MSU College of Law $18 Recycling $12 Vet Oncology $5 National Superconducting Cyclotron Laboratory $5 Executive Development CenterAnaerobic Digestion Research and Ed. Center
Donor Supported Projects Secchia Center-CHM West MI $16 Wharton Center $13
Total $697*
Summary of Current Bonded Debt

Five Year Performance
Targeted range from 6-7
Adverse performance results mainly from loss of appropriations and negative investment returns
•18
Composite Financial Index

•19•Dollars in Thousands
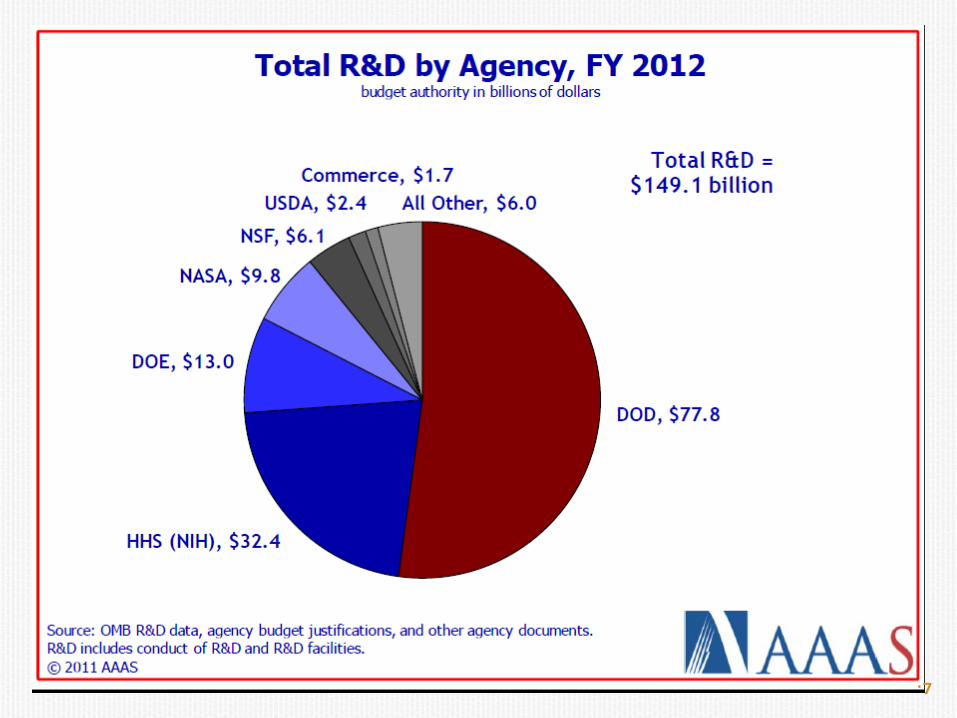
Source: NSF Survey
Big Ten Comparison
Research Expenditures
2006 2010 20111 Yr.
ChangeU of M* $837,529 $1,184,445 $1,279,123 8.0%Wisconsin* $904,787 $1,029,295 $1,111,642 8.0%Minnesota* $609,918 $786,074 $847,419 7.8%OSU $643,283 $755,194 $832,126 10.2%PSU* $656,634 $770,449 $794,846 3.2%Purdue* $420,426 $548,980 $578,231 5.3%Illinois $524,680 $515,133 $545,669 5.9%MSU $388,845 $431,373 $454,248 5.3%Iowa* $356,169 $444,034 $443,893 0.0%Nebraska $214,053 $191,268 $235,296 23.0%Indiana* $378,212 $177,520 $184,096 3.7%
* Institutional numbers represent all campus amounts for 2006.
MSU Financial Data

•20
Total Annual Giving 2006 2011 % ChangePennsylvania State University $165,218,147 $274,832,042 66%University of Nebraska $126,945,265 $171,672,448 35%Ohio State University $211,316,845 $258,450,886 22%University of Iowa $103,271,605 $123,487,703 20%Indiana University $250,677,402 $296,822,003 18%University of Michigan $257,443,519 $273,142,460 6%University of Minnesota $269,600,597 $275,273,205 2%University of Wisconsin $328,625,770 $316,756,282 -4%Purdue University $177,435,105 $157,108,205 -11%Michigan State University $147,363,851 (9th) $128,360,845 (10th) -13% (10th)Univ of Illinois - Urbana $156,748,647 $128,822,182 -18%
As of 06/30/2011Source: VSE Report
Base year represents capital campaign effort for MSU and Purdue
Private Support

•21
Institutions with on campus hospitals, such as U of M, include patient donor support in the above calculations
Includes approximately $749M traditional endowment, $651M endowment trust and $318M MSU FoundationSOURCE: Council for Aid to Education reports
2006 2011 % ChangeUniversity of Michigan $5,652,262,026 $7,834,751,733 39%Purdue University $1,494,553,799 $2,001,600,855 34%Pennsylvania State University $1,389,600,000 $1,831,100,000 32%University of Iowa $832,869,000 $1,058,694,909 27%University of Wisconsin $1,639,014,521 $2,066,958,201 26%Indiana University $1,276,159,743 $1,574,815,344 23%Michigan State University $1,482,844,988 (6th) $1,718,100,760 (6th) 16% (7th)University of Minnesota $2,287,562,061 $2,514,007,307 10%University of Nebraska $1,153,559,000 $1,241,577,000 8%Univ of Illinois - Urbana $1,252,289,994 $1,132,625,790 -10%Ohio State University $1,996,839,412 $1,405,646,025 -30%
Endowment Market Value

•22
• Involves engagement of campus stakeholder groups
• Board of Trustees
• Academic governance
• ASMSU
• COGS
• Refines multi-year planning focused on improving the
value proposition for stakeholder
• University administrators
• Collective bargaining
groups
• RHA
• State policy makers
MSU Budget Process

Spartans Will.
•23
MSU Long-Term Planning

•24
Academic Initiatives• Creating a Campus-wide Strategy for data,
technology, teaching and learning
• Creating a campus climate to support interdisciplinary work
• Closing the graduation gap
• Fostering a healthier campus

•25
• An updated ten year analysis of eight critical university areas requiring long-term support because of current state and federal financial circumstances
• The eight categories are:
– Just-in-Time Facilities Renewal– Administrative Computing (EBSP, EBSP Transition,
Research Administration, SIS)– Specialized Research Space – Financial Aid – Health Care– F-RIB – Academic Quality – Energy/Other Regulatory Issues
Long-Term Financial Framework

November-December 2013Executive Branch
July 2014State appropriation
passed
January 20142013-14 executive
budget recommendation
March, April, May, 2014
Legislative hearings: House and Senate
State Appropriations Timeline
•26

June-October, 2013Trustees act on 2013-14
budgets and 2012-13 budget request
April-May, 2014Admin/Board discussion on
2014-15 budget guidelines
February - May 2014Budget Planning Meetings
Fall 2013Budget & Planning - Strategic Issues
June-July, 2014Board action on final 2014-15
budgets
June, 2014Preliminary 2015-16 operating
and capital outlay request formulated
August, 2014Administration consultation on
2015-16 budget request
October, 2014Trustees act on 2014-15 budget
request
MSU Internal Timeline
•27

Formula based on budget proposal
•Salary increments
•Operating support
•1% reallocation
Differential
•Program allocations
•Reductions
Operating UnitsSeparately
Reviewed Items
•Financial aid
•Utilities
•Health care
•Other benefits
•Financial framework
General Fund Budget Development
•28

• 29
Budget Guidelines Summary
Budget Item2011-12
Approved2012-13
Approved2013-14 Proposed
2014-15Preliminary
State Appropriations (15.0)% 1.6% 1.82% 2%
Tuition & Fees6.9% 3.6%
1.9% Lower Div
3.6% Upper Div
3.0% Lower Div
3.0% Upper Div
Financial Aid 10.0% 5.5% 4.5% 4.0%
Graduate Assistants 2.0% 2.0% 2.0% 2.0%
Faculty Salaries 2.0%* 2.0%* 2.25%** 2.0%*
Utilities 5.0% 4.0% 4.0% 4.0%***
Health Care 5.0% 5.0% 1.5% 5.0%
Framework-Academic Competitiveness
$2.0 $4.7 $2.0 $2.0
Balance $0 $0 $0 $0
•Preliminary 2013-14 budget approved by the BOT in June 2012 •*Includes 1.5% general merit, 0.5% college market, and 0.5% provost market pool•** Includes 1.5% general merit, 0.75% college market, and 0.5% provost market pool•***Infrastructure financing
•30
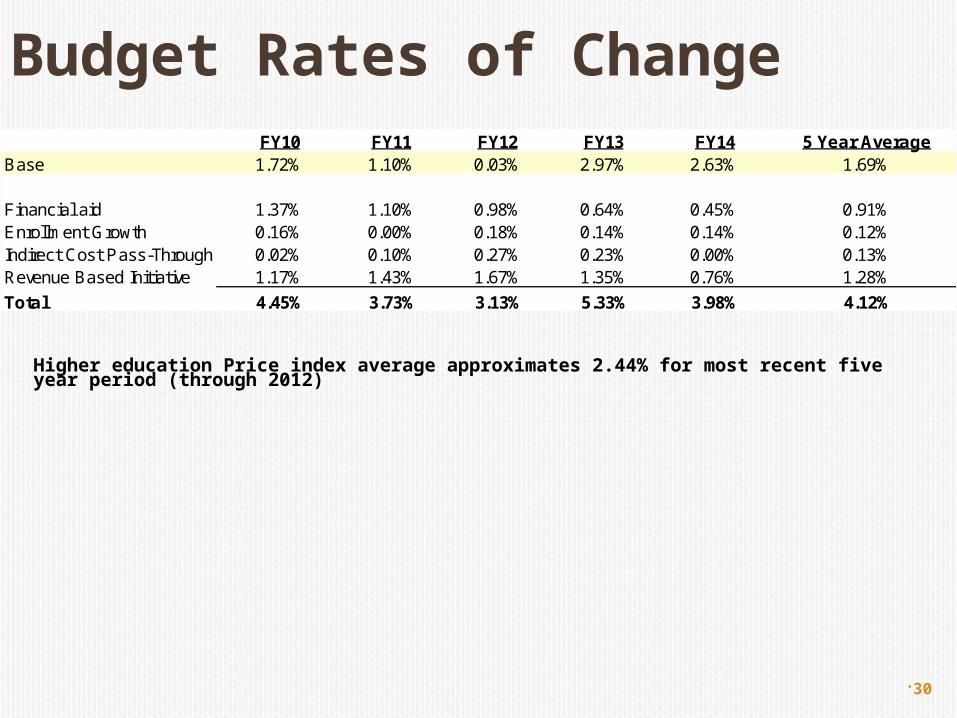
Higher education Price index average approximates 2.44% for most recent five year period (through 2012)
FY10 FY11 FY12 FY13 FY14 5 Year AverageBase 1.72% 1.10% 0.03% 2.97% 2.63% 1.69%
Financial aid 1.37% 1.10% 0.98% 0.64% 0.45% 0.91%Enrollment Growth 0.16% 0.00% 0.18% 0.14% 0.14% 0.12%Indirect Cost Pass-Through 0.02% 0.10% 0.27% 0.23% 0.00% 0.13%Revenue Based Initiative 1.17% 1.43% 1.67% 1.35% 0.76% 1.28%
Total 4.45% 3.73% 3.13% 5.33% 3.98% 4.12%
Budget Rates of Change

Thank You
•31