university as entrepreneur a population in thirds arizona and national data
TRANSCRIPT
University as Entrepreneur
A POPULATION IN THIRDSArizona and National Data
University as Entrepreneur
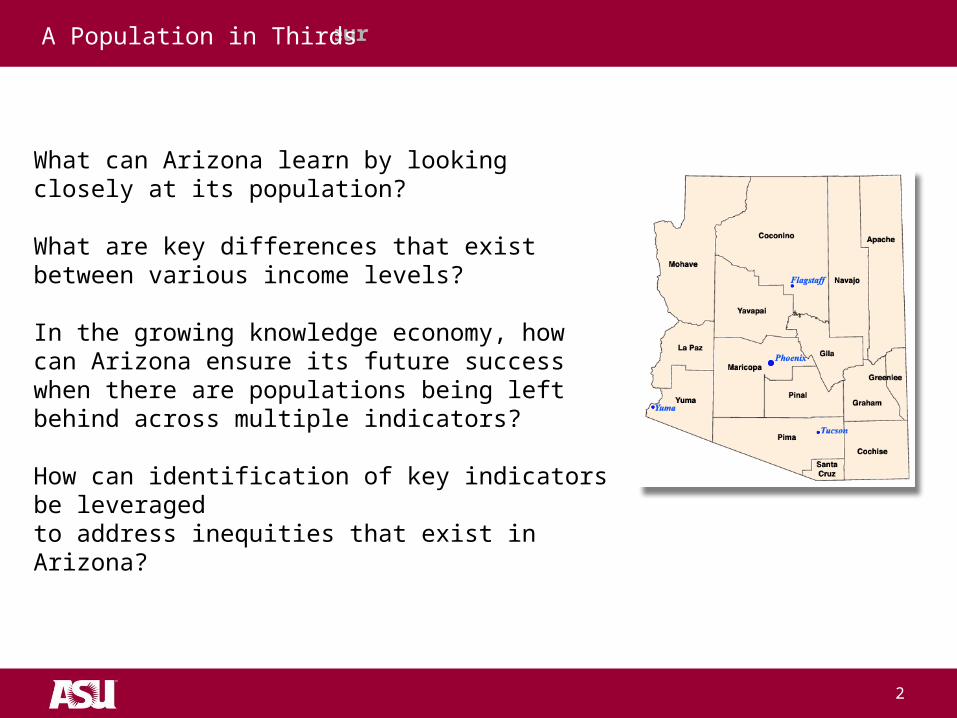
What can Arizona learn by looking closely at its population?
What are key differences that exist between various income levels?
In the growing knowledge economy, how can Arizona ensure its future success when there are populations being left behind across multiple indicators?
How can identification of key indicators be leveraged to address inequities that exist in Arizona?
2
A Population in Thirds
University as Entrepreneur
33.3%
33.3%
33.4%
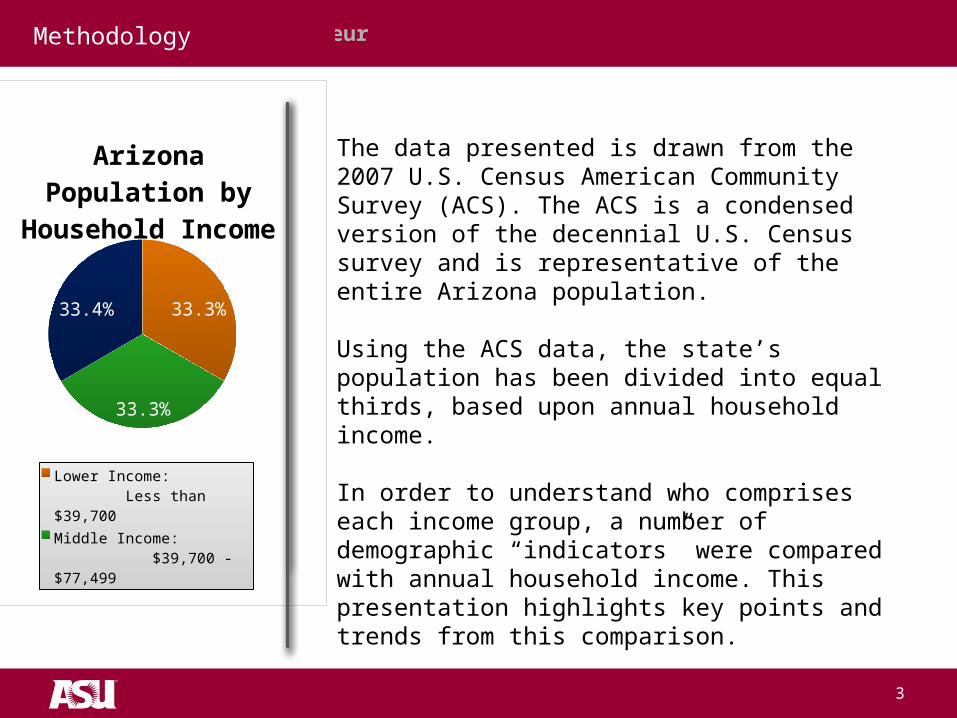
Arizona Population by Household In-
come
Lower Income: Less than $39,700
Middle Income: $39,700 - $77,499
Upper Income: $77,500 or More
Methodology
3
The data presented is drawn from the 2007 U.S. Census American Community Survey (ACS). The ACS is a condensed version of the decennial U.S. Census survey and is representative of the entire Arizona population.
Using the ACS data, the state’s population has been divided into equal thirds, based upon annual household income.
In order to understand who comprises each income group, a number of demographic “indicators” were compared with annual household income. This presentation highlights key points and trends from this comparison.
University as EntrepreneurMethodology
4
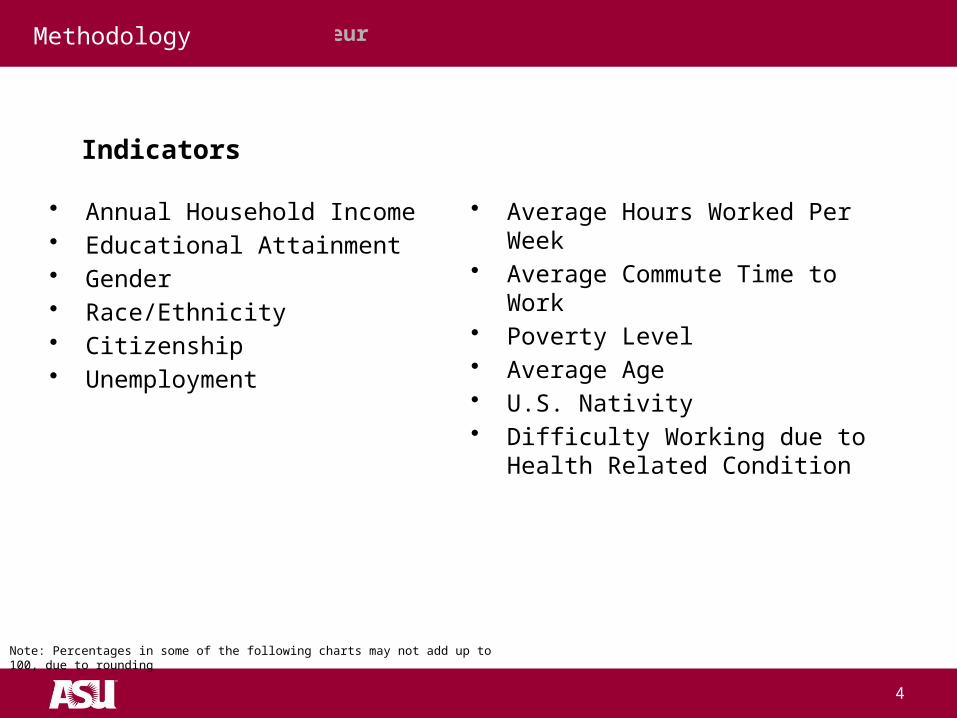
Indicators
• Annual Household Income• Educational Attainment• Gender• Race/Ethnicity• Citizenship• Unemployment
• Average Hours Worked Per Week• Average Commute Time to Work• Poverty Level• Average Age• U.S. Nativity• Difficulty Working due to Health
Related Condition
Note: Percentages in some of the following charts may not add up to 100, due to rounding
University as Entrepreneur
Arizona: A General Scan
5
University as Entrepreneur
6
Arizona: A General Scan
What does Arizona’s population look like if we divide it evenly in thirds and then look at a number of indicators? What pictures emerge?
By using annual household income to evenly divide Arizona’s population, several key indicators emerge as being related to economic mobility. Understanding the impact of these indicators is the initial step in addressing economic inequality and providing a greater number of Arizonans with opportunity for upward economic mobility.
University as Entrepreneur
7
Arizona: The picture that emerges
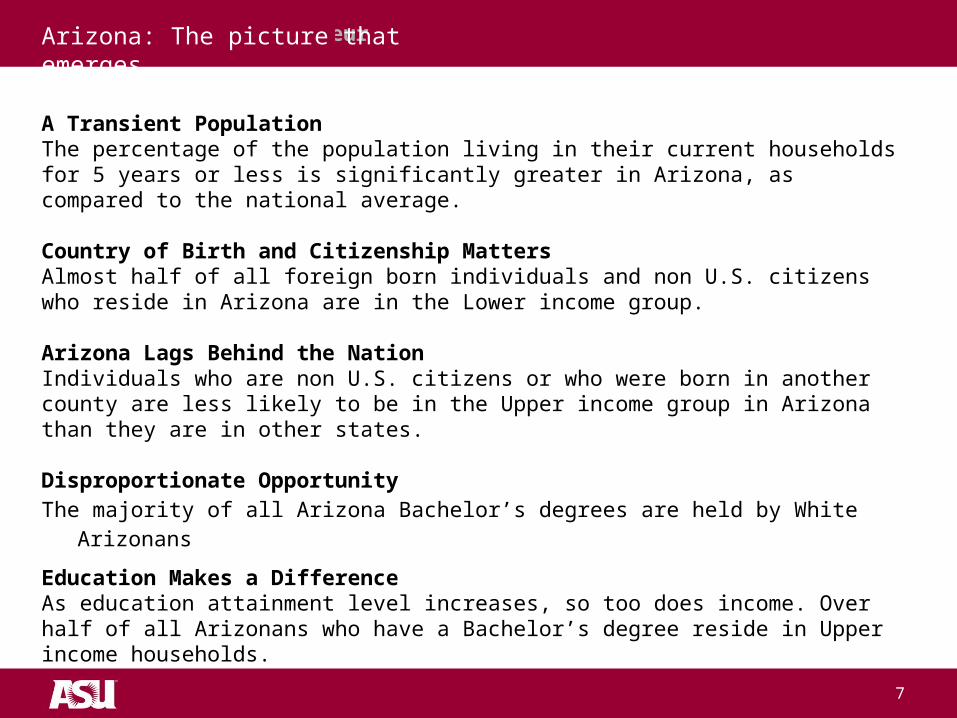
A Transient PopulationThe percentage of the population living in their current households for 5 years or less is significantly greater in Arizona, as compared to the national average.
Country of Birth and Citizenship MattersAlmost half of all foreign born individuals and non U.S. citizens who reside in Arizona are in the Lower income group. Arizona Lags Behind the NationIndividuals who are non U.S. citizens or who were born in another county are less likely to be in the Upper income group in Arizona than they are in other states. Disproportionate OpportunityThe majority of all Arizona Bachelor’s degrees are held by White Arizonans
Education Makes a DifferenceAs education attainment level increases, so too does income. Over half of all Arizonans who have a Bachelor’s degree reside in Upper income households.
University as Entrepreneur
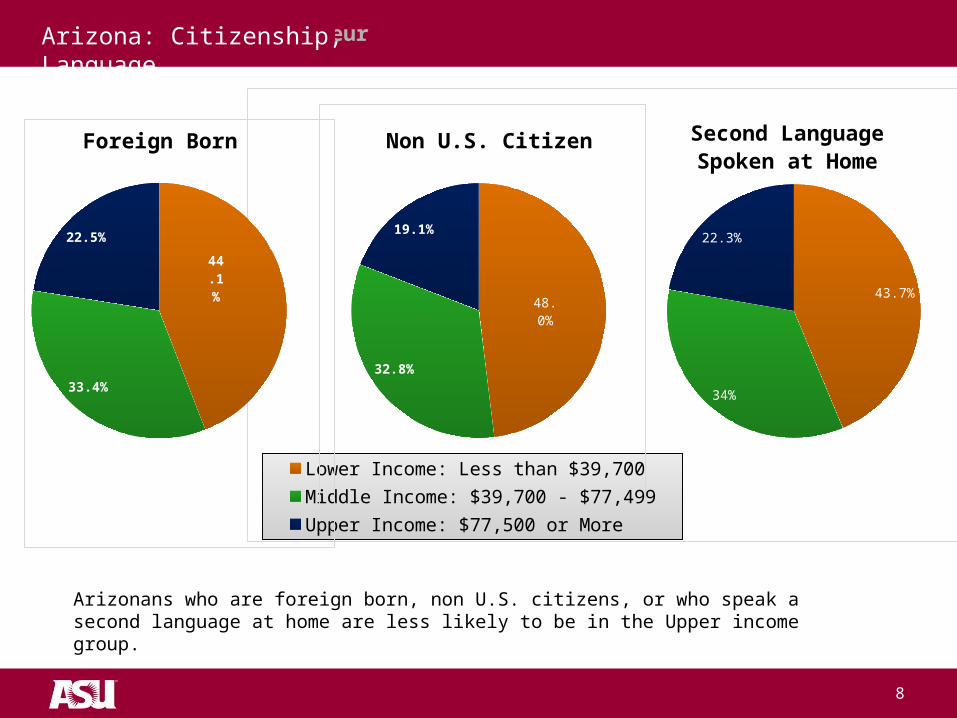
43.7%
34%
22.3%
Second LanguageSpoken at Home
Lower Income: Less than $39,700
Middle Income: $39,700 - $77,499
Upper Income: $77,500 or More
48.0%
32.8%
19.1%
Non U.S. Citizen
44.1%
33.4%
22.5%
Foreign Born
8
Arizona: Citizenship, Language
Arizonans who are foreign born, non U.S. citizens, or who speak a second language at home are less likely to be in the Upper income group.
University as Entrepreneur
Total Arizona Population
Lower Income Middle Income Upper Income0%
10%
20%
30%
40%
50%
60%
70%
80%
90%
100%
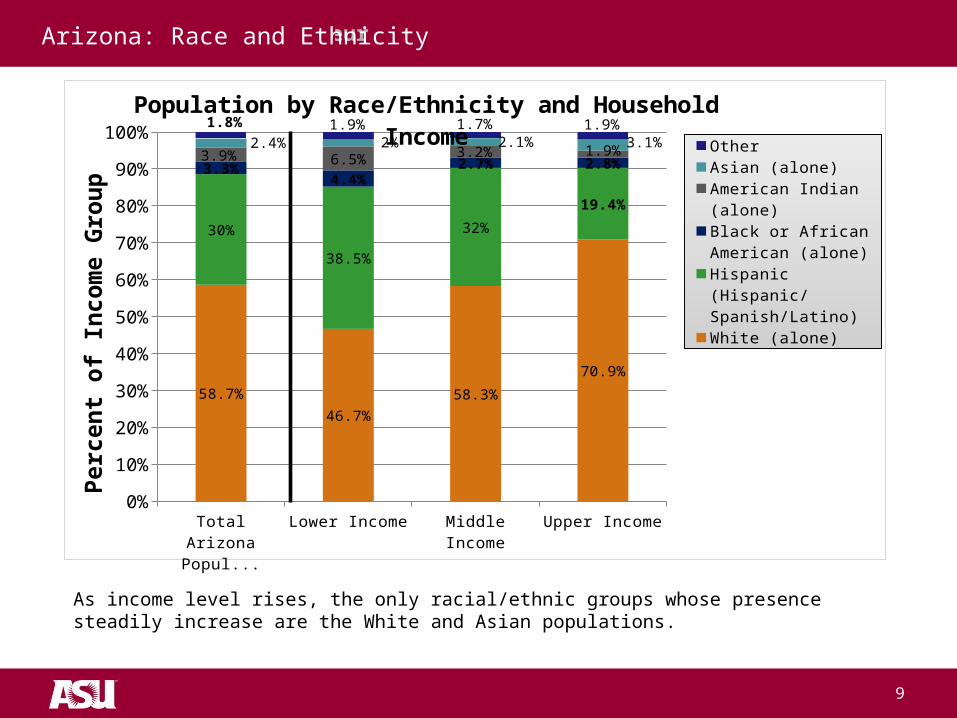
58.7%
46.7%
58.3%
70.9%
30%
38.5%
32%
19.4%
3.3%4.4%
2.7% 2.8%3.9% 6.5% 3.2% 1.9%2.4% 2% 2.1% 3.1%
1.8% 1.9% 1.7% 1.9%
Population by Race/Ethnicity and Household Income
Other
Asian (alone)
American Indian (alone)
Black or African American (alone)
Hispanic (Hispanic/Span-ish/Latino)
White (alone)
Per
cen
t o
f In
com
e G
rou
p
9
Arizona: Race and Ethnicity
As income level rises, the only racial/ethnic groups whose presence steadily increase are the White and Asian populations.
University as Entrepreneur
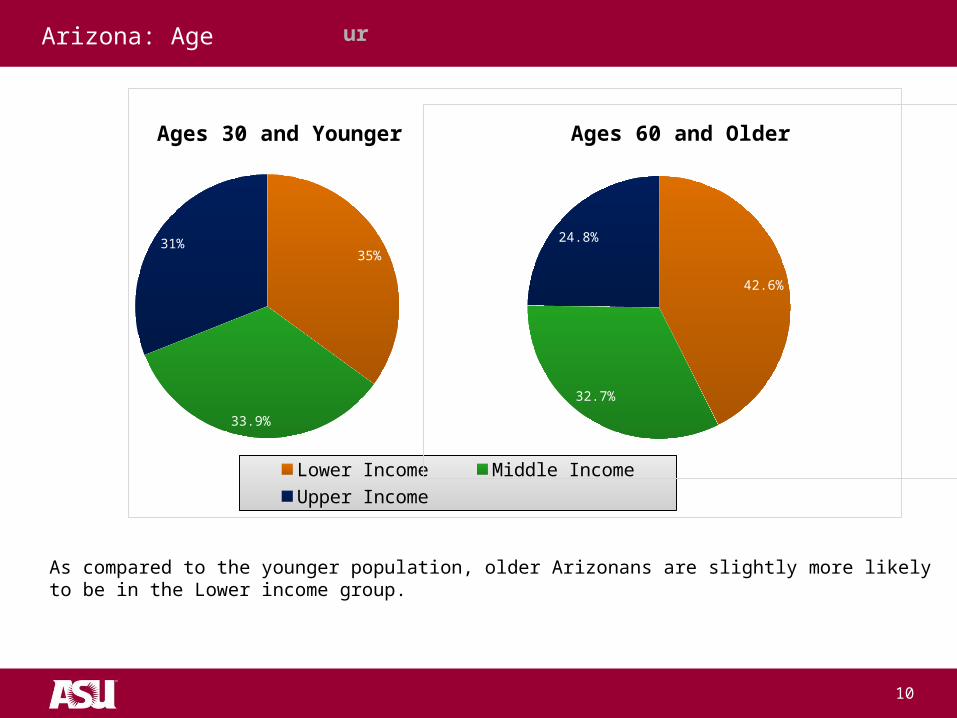
35%
33.9%
31%
Ages 30 and Younger
Lower Income Middle Income Upper Income
42.6%
32.7%
24.8%
Ages 60 and Older
10
Arizona: Age
As compared to the younger population, older Arizonans are slightly more likely to be in the Lower income group.

University as Entrepreneur
Ages 60 and Older
35.2%
32.6%
32.3%
Total Female Population
Lower Income Middle Income Upper Income
11
Arizona: Gender
Both the male and female populations in Arizona are relatively evenly distributed across all three income groups. However, females are slightly more likely to be in the Lower income group while males are slightly more likely to be in the Upper income group.
31.4%
34.1%
34.5%
Total Male Population
University as Entrepreneur
12
Arizona: Poverty
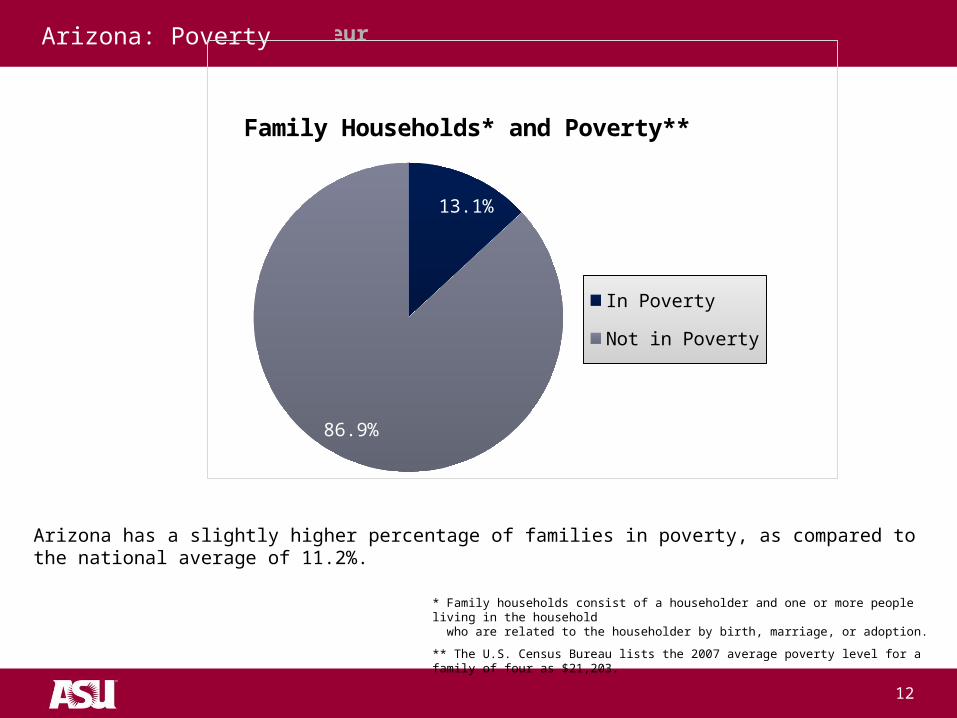
13.1%
86.9%
Family Households* and Poverty**
In Poverty
Not in Poverty
* Family households consist of a householder and one or more people living in the household who are related to the householder by birth, marriage, or adoption.
** The U.S. Census Bureau lists the 2007 average poverty level for a family of four as $21,203.
Arizona has a slightly higher percentage of families in poverty, as compared to the national average of 11.2%.
University as Entrepreneur
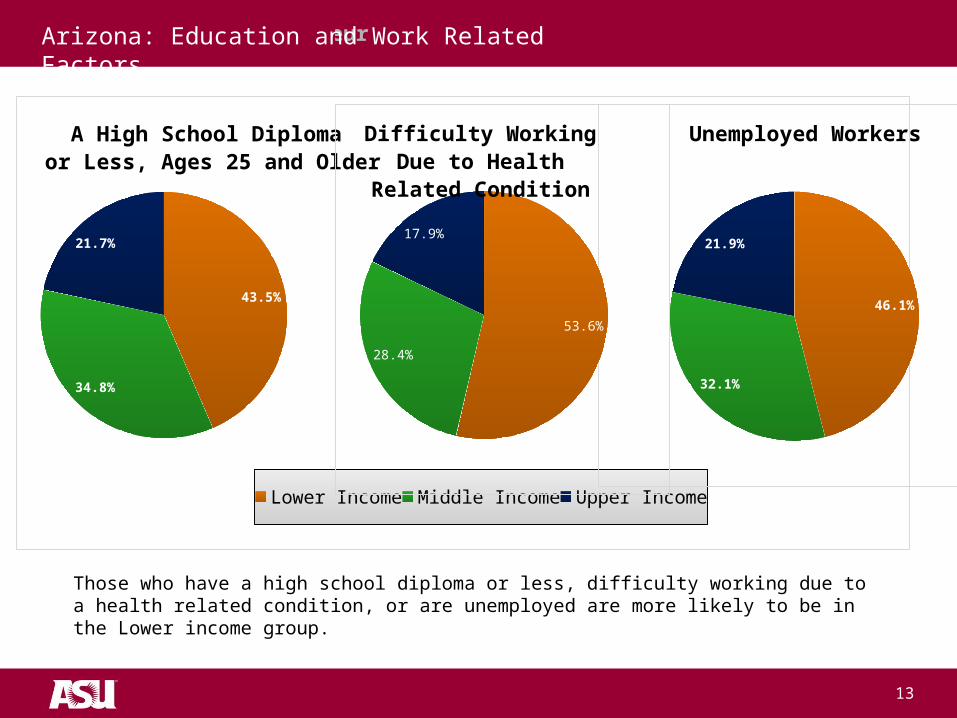
43.5%
34.8%
21.7%
A High School Diploma or Less, Ages 25 and Older
Lower Income Middle Income Upper Income
46.1%
32.1%
21.9%
Unemployed Workers
53.6%
28.4%
17.9%
Difficulty Working Due to Health Related Condition
13
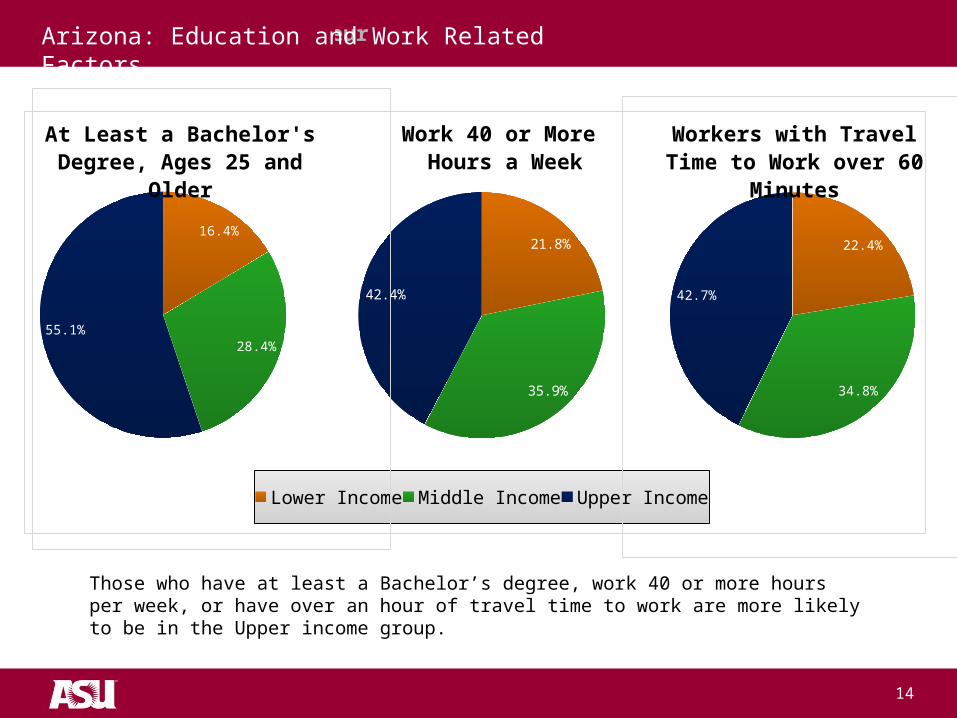
Arizona: Education and Work Related Factors
Those who have a high school diploma or less, difficulty working due to a health related condition, or are unemployed are more likely to be in the Lower income group.
University as Entrepreneur
21.8%
35.9%
42.4%
Work 40 or More Hours a Week
Lower Income Middle Income Upper Income
22.4%
34.8%
42.7%
Workers with Travel Time to Work over 60 Minutes
14
16.4%
28.4%55.1%
At Least a Bachelor's Degree, Ages 25 and
Older
Arizona: Education and Work Related Factors
Those who have at least a Bachelor’s degree, work 40 or more hours per week, or have over an hour of travel time to work are more likely to be in the Upper income group.

University as Entrepreneur
Arizona National Arizona National Arizona National 0%
10%20%30%40%50%60%70%80%90%
100%
48%40.8% 44.1%
35.5%42.8% 42%
32.8%33.3%
33.4%
32.1%
35.6% 34%
19.1%25.8% 22.5%
32.4%21.6% 24%
Lower Income Middle Income Upper Income
Pe
rce
nt
of
Po
pu
lati
on
Non U.S. Citizens Foreign Born Hispanic
15
Arizona’s Population and The Nation
Arizona and National Data Compared Across Key Indicators
As compared to the nation, Arizona has a greater proportion of non U.S. citizens, foreign born, and Hispanic individuals in the Lower income group.
University as Entrepreneur
16
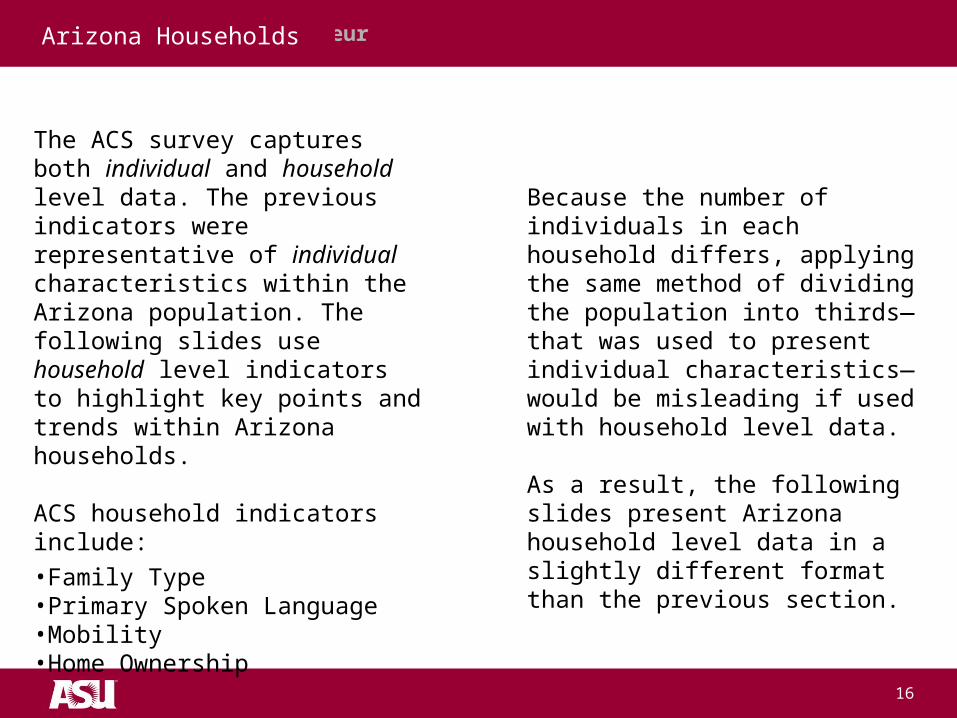
Arizona Households
The ACS survey captures both individual and household level data. The previous indicators were representative of individual characteristics within the Arizona population. The following slides use household level indicators to highlight key points and trends within Arizona households.
ACS household indicators include:
•Family Type•Primary Spoken Language•Mobility•Home Ownership
Because the number of individuals in
each household differs, applying the same method of dividing the population into thirds—that was used to present individual characteristics—would be misleading if used with household level data.
As a result, the following slides present Arizona household level data in a slightly different format than the previous section.
University as Entrepreneur
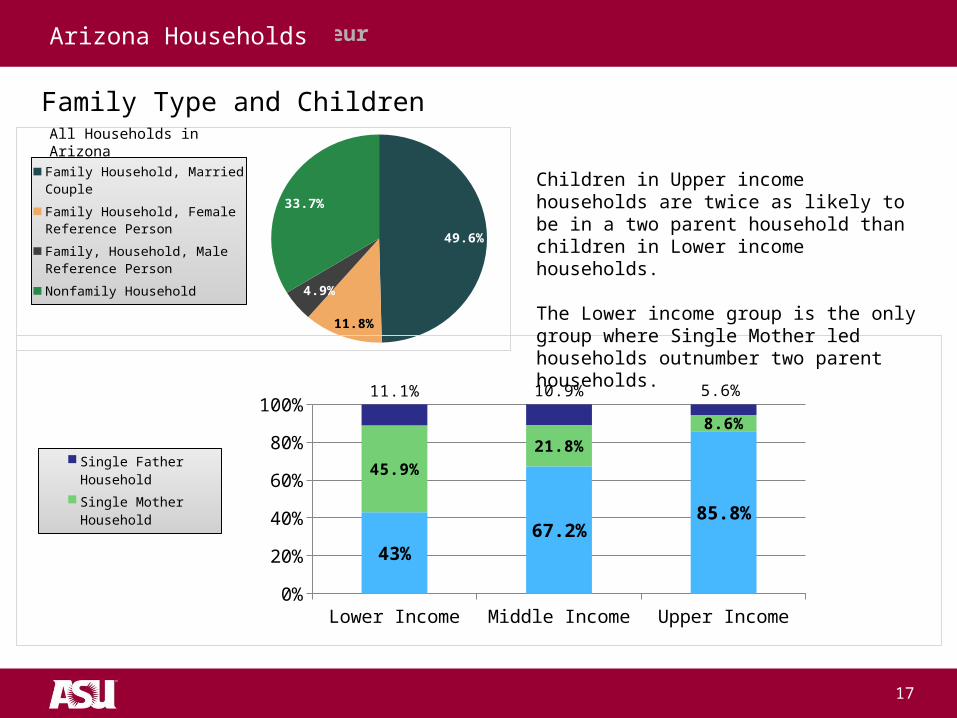
49.6%
11.8%
4.9%
33.7%
Family Household, Married Couple
Family Household, Female Ref-erence Person
Family, Household, Male Ref-erence Person
Nonfamily Household
Lower Income Middle Income Upper Income0%
20%
40%
60%
80%
100%
43%67.2%
85.8%
45.9%
21.8%
8.6%
11.1% 10.9% 5.6%
Single Father Household
Single Mother Household
Married Couple Household
Children in Upper income households are twice as likely to be in a two parent household than children in Lower income households.
The Lower income group is the only group where Single Mother led households outnumber two parent households.
Family Type and ChildrenAll Households in Arizona
17
Arizona Households
University as Entrepreneur
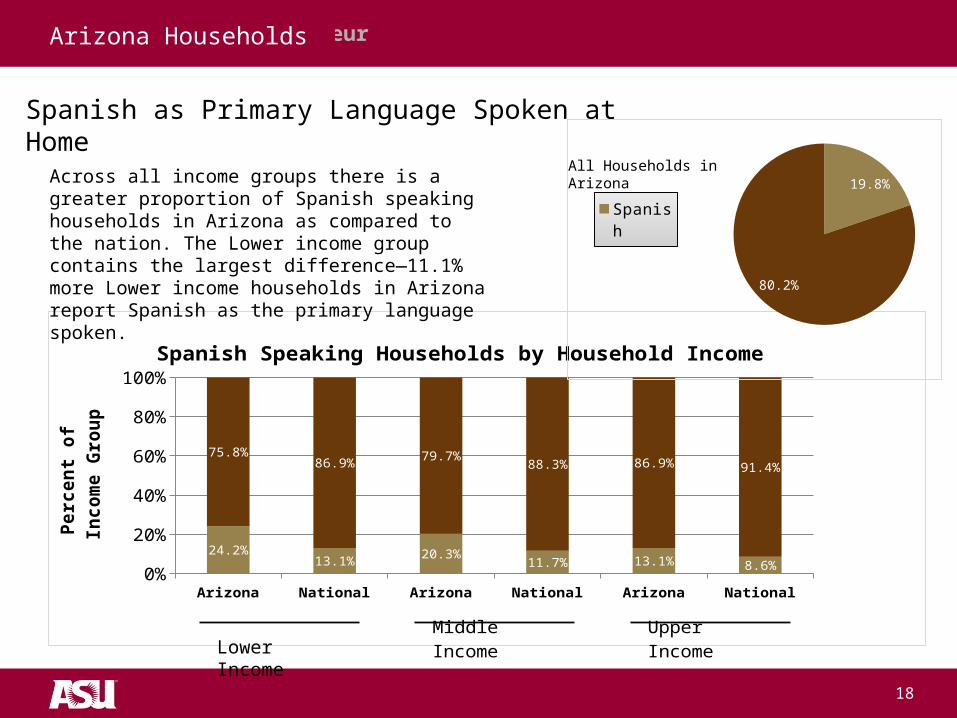
Spanish as Primary Language Spoken at Home
All Households in Arizona
Arizona National Arizona National Arizona National0%
20%
40%
60%
80%
100%
24.2%13.1%
20.3%11.7% 13.1% 8.6%
75.8%86.9%
79.7%88.3% 86.9% 91.4%
Spanish Speaking Households by Household Income
Pe
rce
nt
of
Inc
om
e G
rou
p
Middle Income
Upper Income
Across all income groups there is a greater proportion of Spanish speaking households in Arizona as compared to the nation. The Lower income group contains the largest difference—11.1% more Lower income households in Arizona report Spanish as the primary language spoken.
18
Arizona Households
Lower Income
19.8%
80.2%
Spanish
Other
University as Entrepreneur
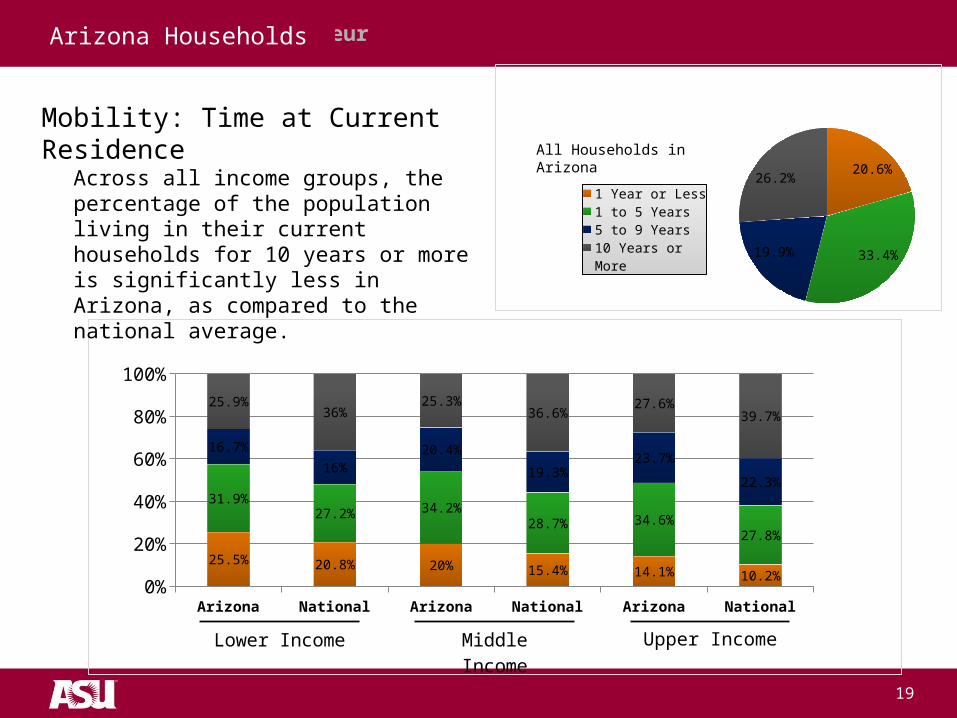
20.6%
33.4%19.9%
26.2%
1 Year or Less
1 to 5 Years
5 to 9 Years
10 Years or More
Arizona National Arizona National Arizona National0%
20%
40%
60%
80%
100%
25.5% 20.8% 20% 15.4% 14.1% 10.2%
31.9%27.2% 34.2%
28.7% 34.6%27.8%
16.7%
16%20.4%
19.3%23.7%
22.3%
25.9%36%
25.3%36.6%
27.6%39.7%
Lower Income Middle Income
All Households in Arizona
19
Arizona Households
Mobility: Time at Current Residence
Upper Income
Across all income groups, the percentage of the population living in their current households for 10 years or more is significantly less in Arizona, as compared to the national average.
University as Entrepreneur
20
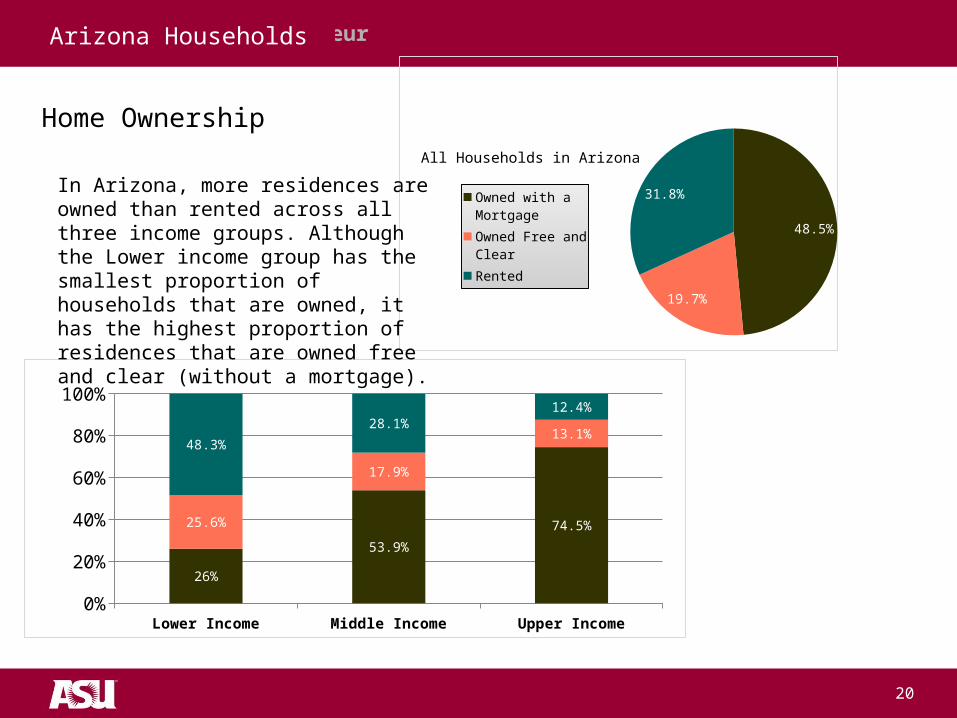
48.5%
19.7%
31.8%Owned with a Mortgage
Owned Free and Clear
Rented
Lower Income Middle Income Upper Income0%
20%
40%
60%
80%
100%
26%
53.9%
74.5%25.6%
17.9%
13.1%48.3%
28.1%12.4%
Home Ownership All Households in Arizona
Arizona Households
In Arizona, more residences are owned than rented across all three income groups. Although the Lower income group has the smallest proportion of households that are owned, it has the highest proportion of residences that are owned free and clear (without a mortgage).
University as Entrepreneur
EDUCATION DETAILArizona
21
University as Entrepreneur
0%
10%
20%
30%
40%
50%
60%
70%
80%
90%
100%
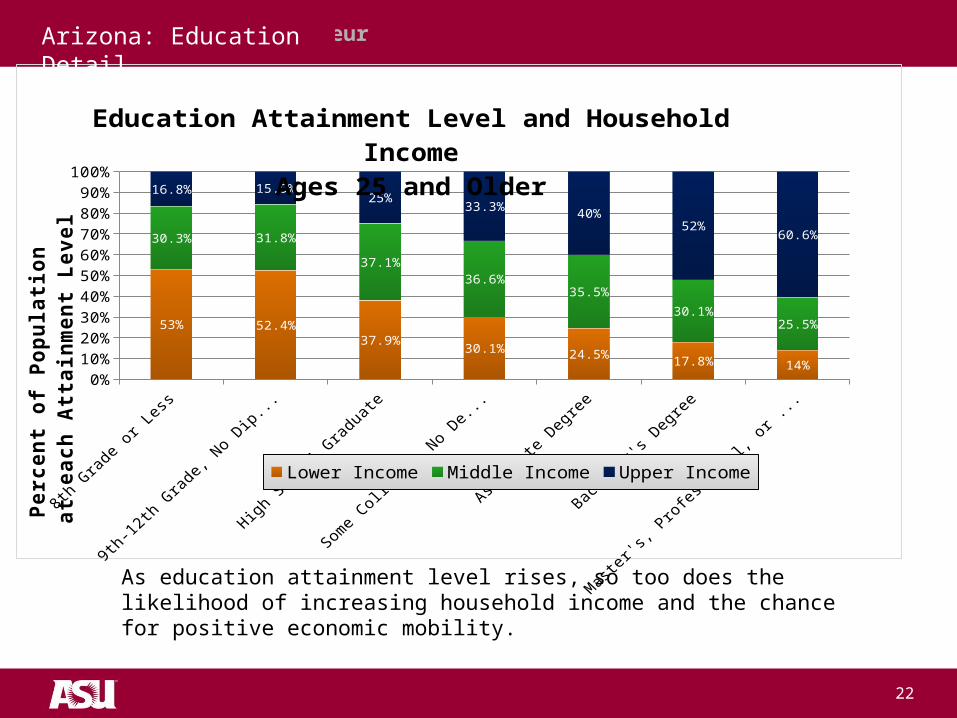
53% 52.4%37.9%
30.1% 24.5%17.8% 14%
30.3% 31.8%
37.1%36.6%
35.5%
30.1%25.5%
16.8% 15.9%25%
33.3%40%
52%60.6%
Education Attainment Level and Household IncomeAges 25 and Older
Lower Income Middle Income Upper IncomePe
rce
nt
of
Po
pu
lati
on
a
t e
ac
h A
tta
inm
en
t L
ev
el
22
As education attainment level rises, so too does the likelihood of increasing household income and the chance for positive economic mobility.
Arizona: Education Detail
University as Entrepreneur
81%
8.9%
2.8%1.1%
5.4%
1.1%
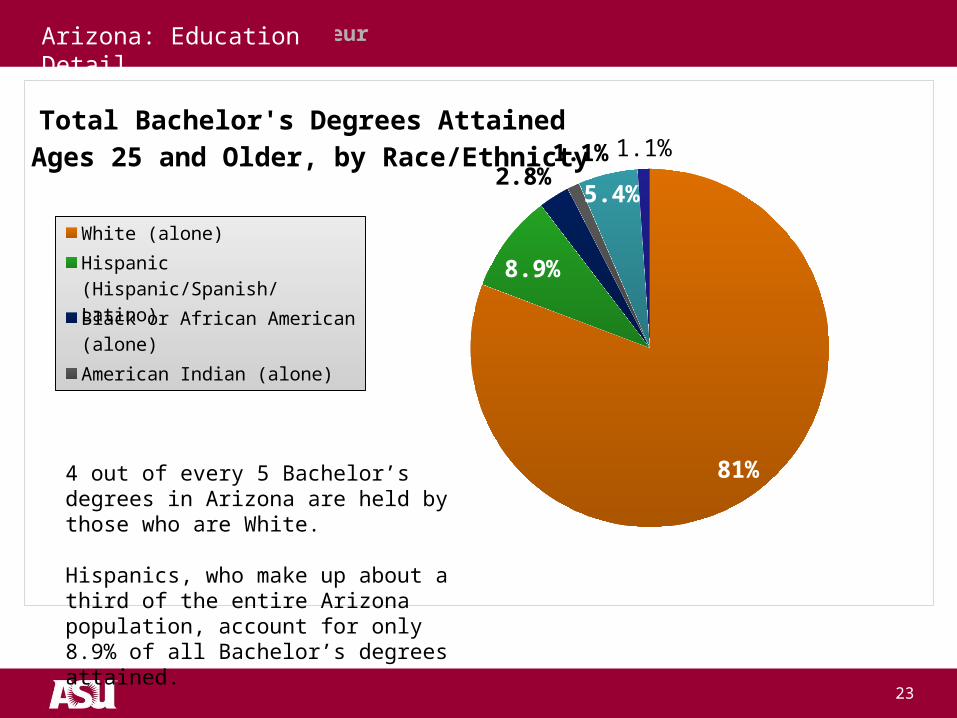
Total Bachelor's Degrees Attained Ages 25 and Older, by Race/Ethnicty
White (alone)Hispanic (Hispanic/Spanish/Latino)Black or African American (alone)American Indian (alone)Asian (alone)Other
23
4 out of every 5 Bachelor’s degrees in Arizona are held by those who are White.
Hispanics, who make up about a third of the entire Arizona population, account for only 8.9% of all Bachelor’s degrees attained.
Arizona: Education Detail
University as Entrepreneur
Total Arizona Popula-tion
Lower Income Middle Income Upper Income0%
1000%
2000%
3000%
4000%
5000%
6000%
7000%
3140.0%
1700.0%
2660.0%
4570.0%
920.0%
460.0%
810.0%
1880.0%
2320.0%
1470.0%
2510.0%
3280.0%
880.0%
490.0%
960.0%
1850.0%
5330.0%
4480.0% 4480.0%
6400.0%
2580.0%
1840.0%
2340.0%
3560.0%
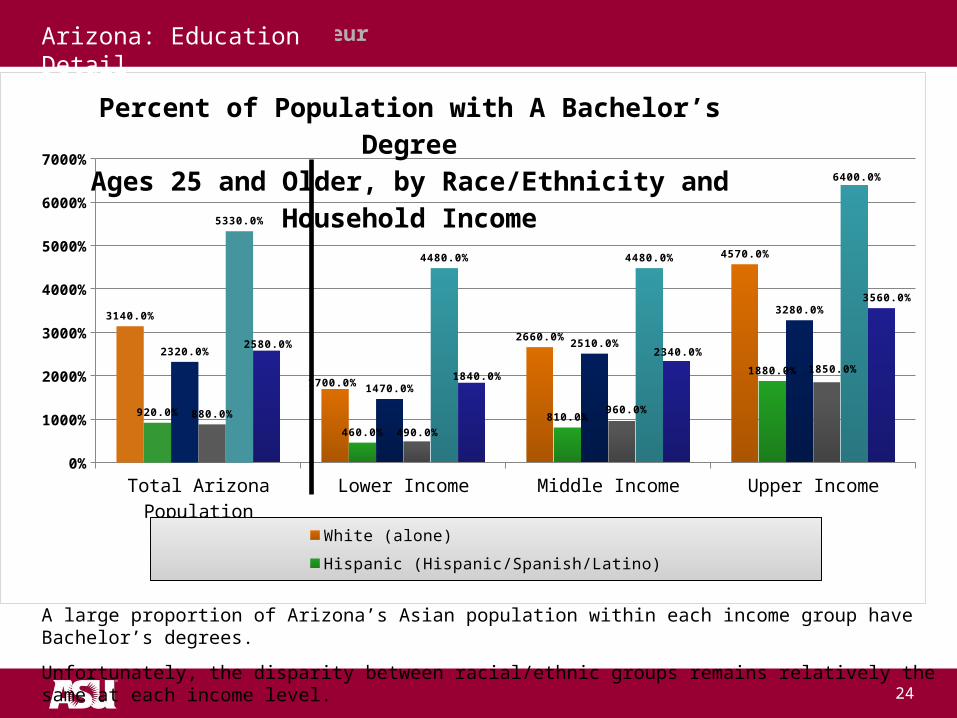
Percent of Population with A Bachelor’s DegreeAges 25 and Older, by Race/Ethnicity and Household
Income
White (alone) Hispanic (Hispanic/Spanish/Latino)Black or African American (alone) American Indian (alone)Asian (alone) Other
24
A large proportion of Arizona’s Asian population within each income group have Bachelor’s degrees.
Unfortunately, the disparity between racial/ethnic groups remains relatively the same at each income level.
Arizona: Education Detail

University as Entrepreneur
Lower Income Middle Income Upper Income0%
1000%
2000%
3000%
4000%
5000%
6000%
7000%
3350.0% 3560.0%3090.0%
4180.0%3710.0%
2110.0%
4410.0%
3010.0%
2580.0%
5610.0%
2700.0%
1690.0%
3190.0%3420.0% 3410.0%
3970.0%
3070.0% 2960.0%
Percent of Race/Ethnic Group with Less than a Bachelor’s Degree
Ages 25 and Older, by Household Income
White (alone) Hispanic (Hispanic/Spanish/Latino)Black or African American (alone) American Indian (alone)Asian (alone) Other
25
For White and Asian Arizonans who have less than a Bachelor’s degree, the likelihood of being in the Upper income group is nearly the same as being in either the Middle or Lower groups. American Indian and Black/African American Arizonans are far more likely to be in the Lower income group.
Arizona: Education Detail

University as Entrepreneur
94.2%
5.8%
Total Population
Employed
Unemployed
88.1%
11.9%
Unemployed
With Less than a Bachelor's Degree
With a Bachelor's Degree or More
47.8%
32%
20.3%
Unemployed with Less than a Bachelor's Degree
Lower Income
Middle Income
Upper Income
Unemployment and EducationAges 16 and Older and in the Labor Force
26
Nearly 9 out of every 10 unemployed Arizonan has less than a Bachelor’s degree.
Of those unemployed with less than a Bachelor’s degree, nearly half are in the Lower income group.
Arizona: Education Detail
University as Entrepreneur
45.6%
34.1%
20.3%
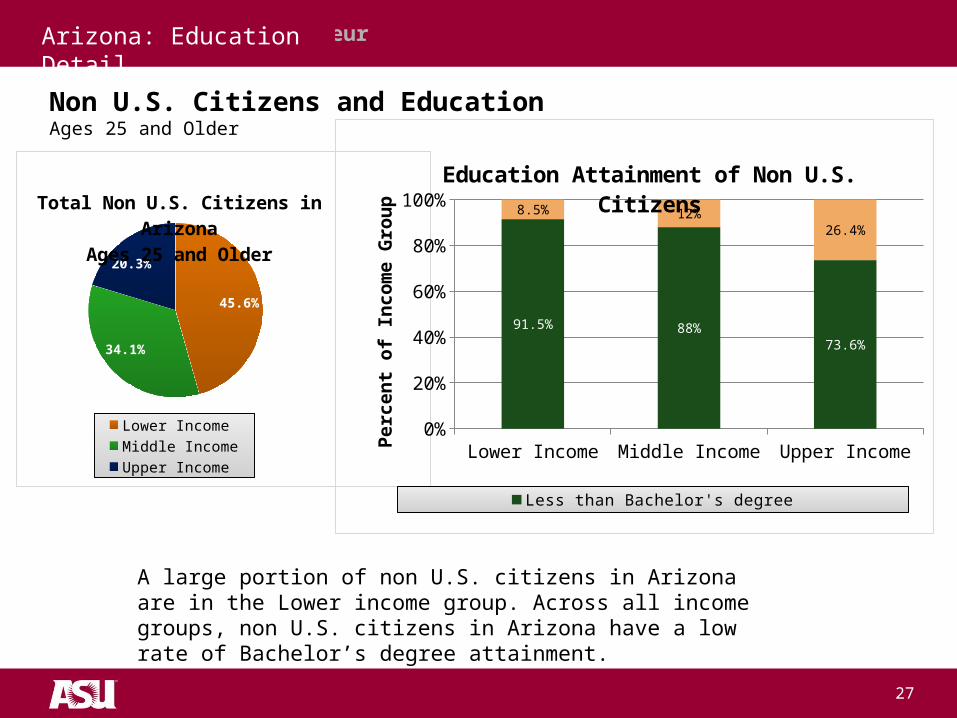
Total Non U.S. Citizens in ArizonaAges 25 and Older
Lower IncomeMiddle IncomeUpper Income
Non U.S. Citizens and EducationAges 25 and Older
A large portion of non U.S. citizens in Arizona are in the Lower income group. Across all income groups, non U.S. citizens in Arizona have a low rate of Bachelor’s degree attainment.
27
Arizona: Education Detail
Lower Income Middle Income Upper Income0%
10%20%30%40%50%60%70%80%90%
100%
91.5% 88%73.6%
8.5% 12%26.4%
Education Attainment of Non U.S. Citizens
Less than Bachelor's degree Bachelor's Degree Attained
Pe
rce
nt
of
Inc
om
e G
rou
p

University as Entrepreneur
Gender, Ethnicity and EducationAges 25 and Older
28
Male Male, Hispanic0%
10%20%30%40%50%60%70%80%90%
100%
34.4% 39.2%
37.1%37.9%
28.5% 22.9%
Male Population with Less than a Bachelor’sBy Household Income and Gender
Upper Income
Middle Income
Lower Income
Female Female, Hispanic
39.8% 44.5%
33.9%36.3%
26.2%19.2%
Female Population with Less than a BachelorsBy Household Income and Gender
Even with equal educational attainment, males are less likely to be in the Lower income group than females. This trend is evident to the same degree within Arizona’s Hispanic population as well.
Arizona: Education Detail
University as Entrepreneur
0%10%20%30%40%50%60%70%80%90%
100%
3400.0%4440.0%
1530.0%2220.0%
3550.0%
3530.0%
2830.0%2920.0%
3050.0%2030.0%
5640.0%4850.0%
Lower Income Middle Income Upper Income
Pe
rce
nt
of
La
ng
ua
ge
an
d E
du
ca
tio
n G
rou
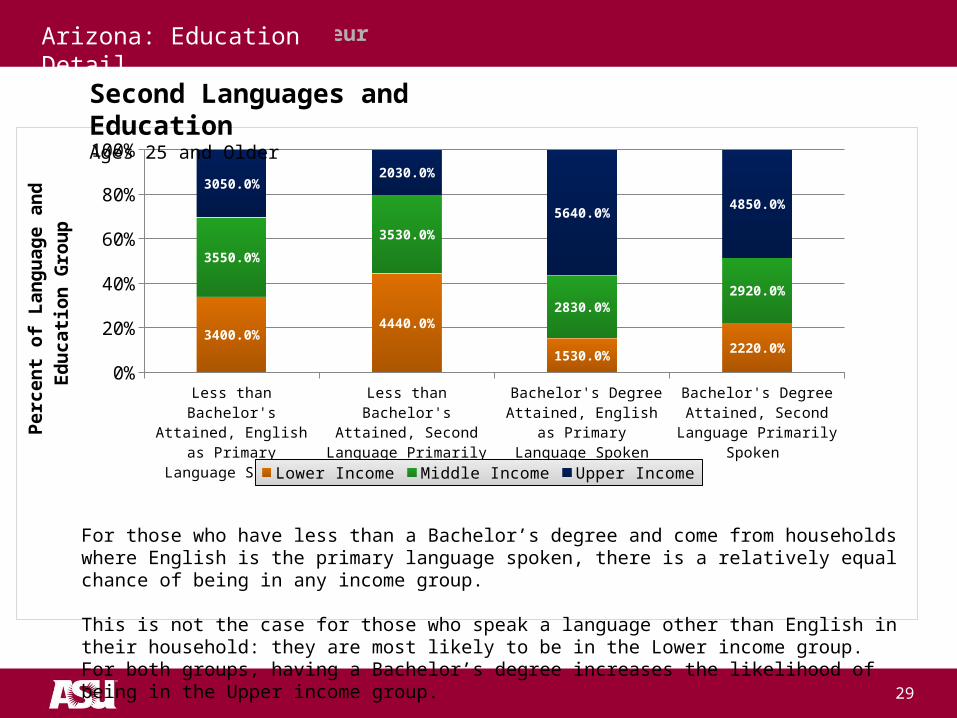
pSecond Languages and EducationAges 25 and Older
29
For those who have less than a Bachelor’s degree and come from households where English is the primary language spoken, there is a relatively equal chance of being in any income group.
This is not the case for those who speak a language other than English in their household: they are most likely to be in the Lower income group. For both groups, having a Bachelor’s degree increases the likelihood of being in the Upper income group.
Arizona: Education Detail
University as Entrepreneur
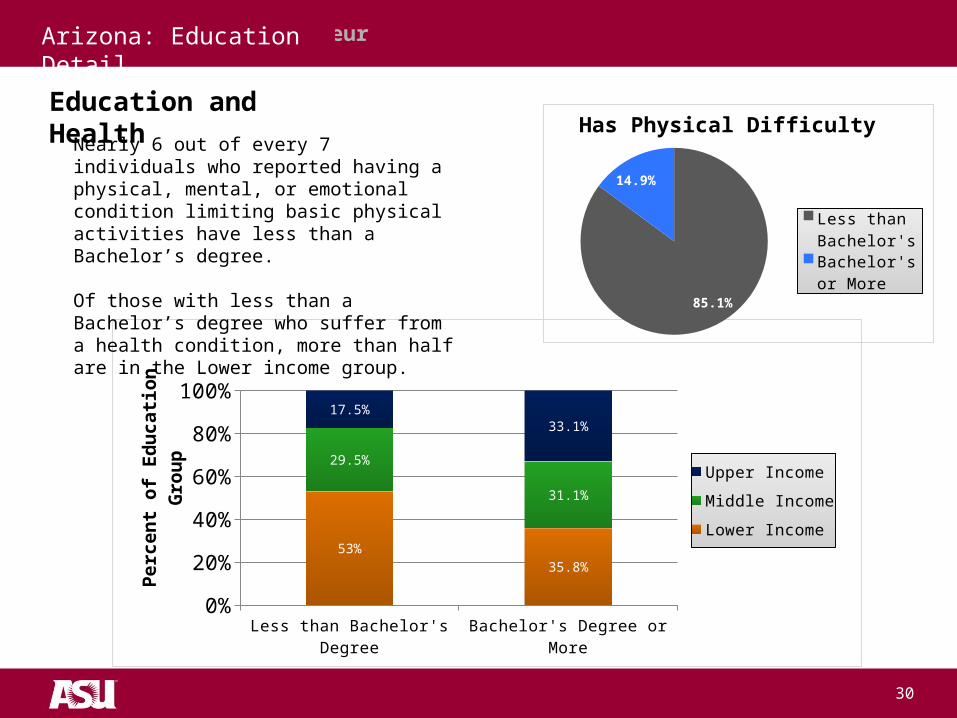
Education and Health
Less than Bachelor's Degree Bachelor's Degree or More0%
20%
40%
60%
80%
100%
53%35.8%
29.5%
31.1%
17.5%33.1%
Upper Income
Middle Income
Lower Income
Pe
rce
nt
of
Ed
uc
ati
on
Gro
up
30
85.1%
14.9%
Has Physical Difficulty
Less than Bachelor's
Bachelor's or More
Nearly 6 out of every 7 individuals who reported having a physical, mental, or emotional condition limiting basic physical activities have less than a Bachelor’s degree.
Of those with less than a Bachelor’s degree who suffer from a health condition, more than half are in the Lower income group.
Arizona: Education Detail