universiti tun hussein onn malaysia faculty of...
TRANSCRIPT

UNIVERSITI TUN HUSSEIN ONN MALAYSIAFaculty of Mechanical and Manufacturing Engineering
__________________________________________________________________
COURSE INFORMATION
COURSE TITLE: ENGINEERING LABORATORY III (BDA 27101)
TOPIC 1: TENSILE TEST
1. INTRODUCTION
The tensile experiment is the most common mechanical test that reveals severalimportant mechanical properties, such as: modulus of elasticity, yield strength,ultimate tensile strength, ductility, and toughness. The material to be tested isformed into a shape suitable for gripping in the testing machine, and then pulled atconstant rate until it fractures. The tensile instrument elongates the specimen at aconstant rate and has devices to continuously measure and record the applied loadand elongation of the specimen. During the stretching of the specimen, changesoccur in its physical dimensions and its mechanical properties. The ability topredict the loads that will cause a part to fail depends upon both materialproperties and the part geometry. This experiment involves testing to determinethe relative properties.
2. OBJECTIVES
1. To understand the principles of tensile testing machine.2. To observe the stress-strain relationship for several standard materials by
performing a tensile test.3. To obtain approximate values from stress-stain curve such as percentage of
elongation, Yield Strength; Tensile Strength and Modulus of Elasticity, E.
3. LEARNING OUTCOMES
At the end of this experiment, students should be able to:
1. Conduct experiment and identify the dependent and independent variables.2. Record, tabulate and analyze the raw data.3. Indicate the important parameters such as yield strength, elastic, plastic
region, maximum load, failure load and explain each parameter.4. Determine the modulus of elasticity for each specimen.5. Understand the stress-strain relationship for several standard materials by
performing a tensile test and tensile properties from a stress strain curve.
UNIVERSITI TUN HUSSEIN ONN MALAYSIAFaculty of Mechanical and Manufacturing Engineering
__________________________________________________________________
BDA27101-Edition III/2011 2
4. THEORY.
A tensile test, also known as tension test, is probably the most fundamental type ofmechanical test that can be performed on material. Tensile tests are simple,relatively inexpensive, and fully standardized. By pulling on something, you willvery quickly determine how the material will react to forces being applied intension. As the material is being pulled, you will find its strength along with howmuch it will elongate.
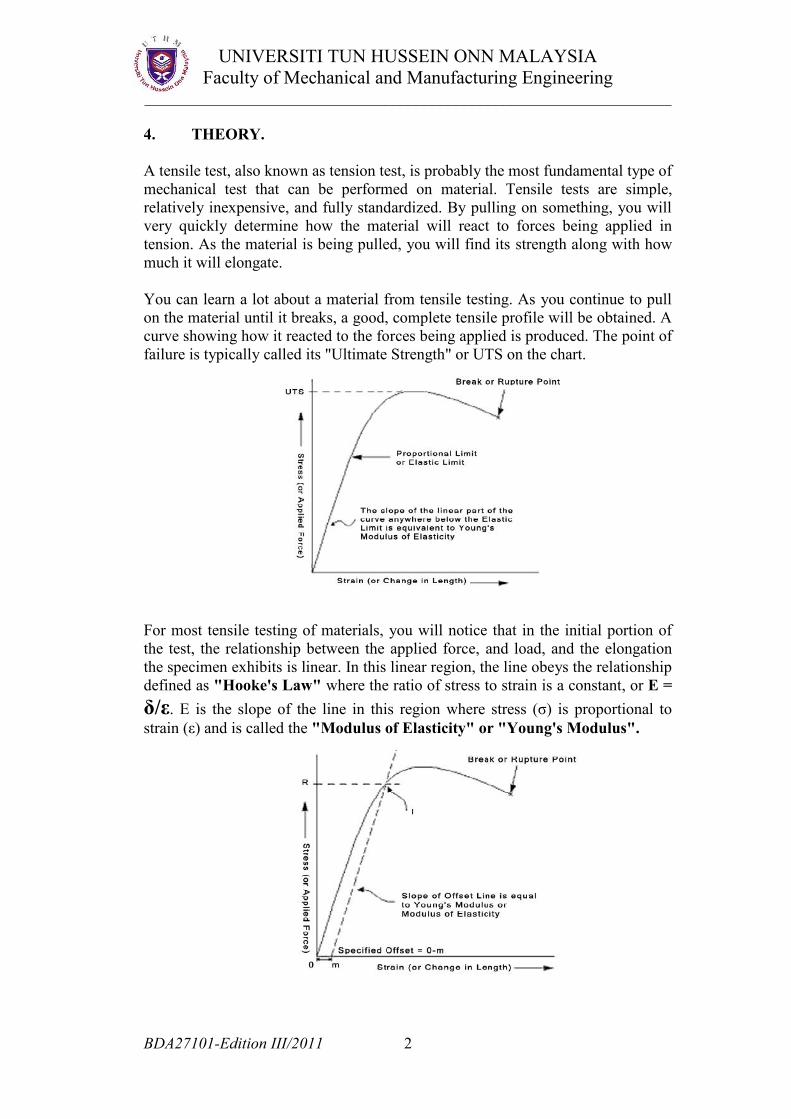
You can learn a lot about a material from tensile testing. As you continue to pullon the material until it breaks, a good, complete tensile profile will be obtained. Acurve showing how it reacted to the forces being applied is produced. The point offailure is typically called its "Ultimate Strength" or UTS on the chart.
For most tensile testing of materials, you will notice that in the initial portion ofthe test, the relationship between the applied force, and load, and the elongationthe specimen exhibits is linear. In this linear region, the line obeys the relationshipdefined as "Hooke's Law" where the ratio of stress to strain is a constant, or E =δ/ε. E is the slope of the line in this region where stress (σ) is proportional tostrain (ε) and is called the "Modulus of Elasticity" or "Young's Modulus".
UNIVERSITI TUN HUSSEIN ONN MALAYSIAFaculty of Mechanical and Manufacturing Engineering
__________________________________________________________________
BDA27101-Edition III/2011 2
4. THEORY.
A tensile test, also known as tension test, is probably the most fundamental type ofmechanical test that can be performed on material. Tensile tests are simple,relatively inexpensive, and fully standardized. By pulling on something, you willvery quickly determine how the material will react to forces being applied intension. As the material is being pulled, you will find its strength along with howmuch it will elongate.
You can learn a lot about a material from tensile testing. As you continue to pullon the material until it breaks, a good, complete tensile profile will be obtained. Acurve showing how it reacted to the forces being applied is produced. The point offailure is typically called its "Ultimate Strength" or UTS on the chart.
For most tensile testing of materials, you will notice that in the initial portion ofthe test, the relationship between the applied force, and load, and the elongationthe specimen exhibits is linear. In this linear region, the line obeys the relationshipdefined as "Hooke's Law" where the ratio of stress to strain is a constant, or E =δ/ε. E is the slope of the line in this region where stress (σ) is proportional tostrain (ε) and is called the "Modulus of Elasticity" or "Young's Modulus".

UNIVERSITI TUN HUSSEIN ONN MALAYSIAFaculty of Mechanical and Manufacturing Engineering
__________________________________________________________________
BDA27101-Edition III/2011 3
5. ADDITIONAL THEORY.
……………………………………………………………………………………....……………………………………………………………………………………....……………………………………………………………………………………....……………………………………………………………………………………....……………………………………………………………………………………....……………………………………………………………………………………....……………………………………………………………………………………....……………………………………………………………………………………....……………………………………………………………………………………....……………………………………………………………………………………....……………………………………………………………………………………....……………………………………………………………………………………....……………………………………………………………………………………....……………………………………………………………………………………....……………………………………………………………………………………....……………………………………………………………………………………....……………………………………………………………………………………....……………………………………………………………………………………....……………………………………………………………………………………....……………………………………………………………………………………....……………………………………………………………………………………....……………………………………………………………………………………....……………………………………………………………………………………....……………………………………………………………………………………....……………………………………………………………………………………....……………………………………………………………………………………....……………………………………………………………………………………....……………………………………………………………………………………....……………………………………………………………………………………....……………………………………………………………………………………....……………………………………………………………………………………....……………………………………………………………………………………....……………………………………………………………………………………....……………………………………………………………………………………....……………………………………………………………………………………....……………………………………………………………………………………....……………………………………………………………………………………....……………………………………………………………………………………....……………………………………………………………………………………....……………………………………………………………………………………....……………………………………………………………………………………....……………………………………………………………………………………....……………………………………………………………………………………....……………………………………………………………………………………....……………………………………………………………………………………....……………………………………………………………………………………....
UNIVERSITI TUN HUSSEIN ONN MALAYSIAFaculty of Mechanical and Manufacturing Engineering
__________________________________________________________________
BDA27101-Edition III/2011 4
6. APPARATUS.
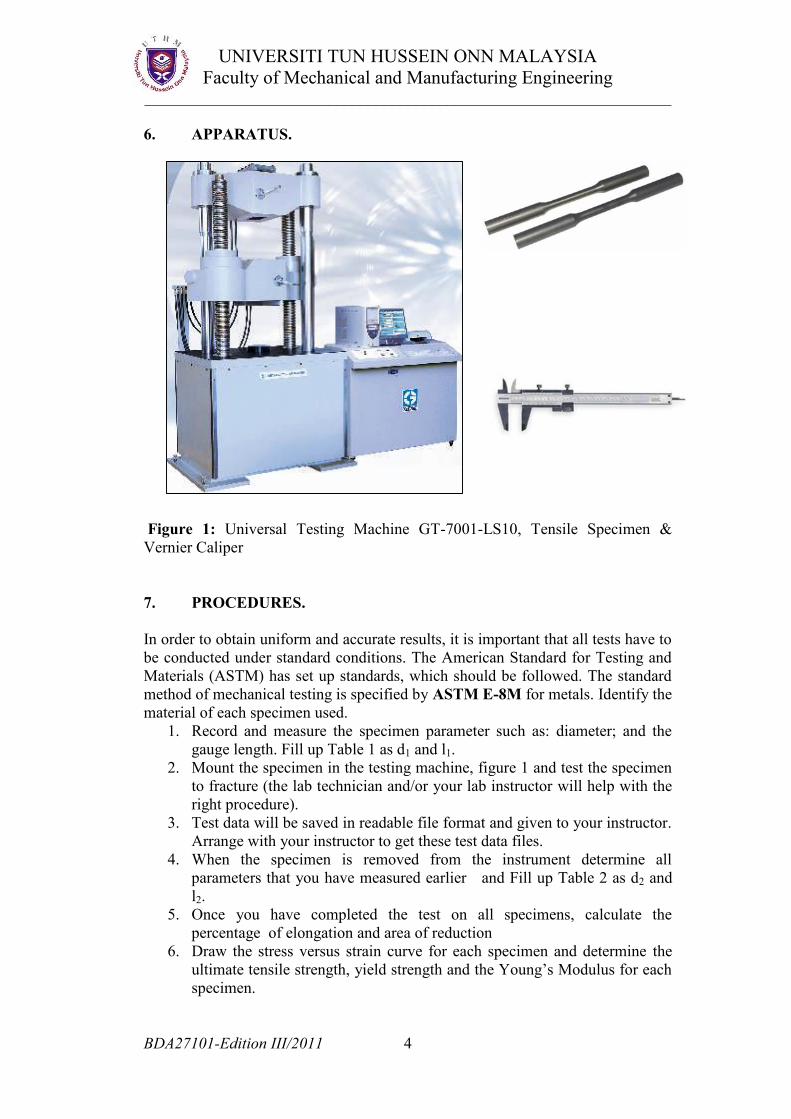
Figure 1: Universal Testing Machine GT-7001-LS10, Tensile Specimen &Vernier Caliper
7. PROCEDURES.
In order to obtain uniform and accurate results, it is important that all tests have tobe conducted under standard conditions. The American Standard for Testing andMaterials (ASTM) has set up standards, which should be followed. The standardmethod of mechanical testing is specified by ASTM E-8M for metals. Identify thematerial of each specimen used.
1. Record and measure the specimen parameter such as: diameter; and thegauge length. Fill up Table 1 as d1 and l1.
2. Mount the specimen in the testing machine, figure 1 and test the specimento fracture (the lab technician and/or your lab instructor will help with theright procedure).
3. Test data will be saved in readable file format and given to your instructor.Arrange with your instructor to get these test data files.
4. When the specimen is removed from the instrument determine allparameters that you have measured earlier and Fill up Table 2 as d2 andl2.
5. Once you have completed the test on all specimens, calculate thepercentage of elongation and area of reduction
6. Draw the stress versus strain curve for each specimen and determine theultimate tensile strength, yield strength and the Young’s Modulus for eachspecimen.
UNIVERSITI TUN HUSSEIN ONN MALAYSIAFaculty of Mechanical and Manufacturing Engineering
__________________________________________________________________
BDA27101-Edition III/2011 5
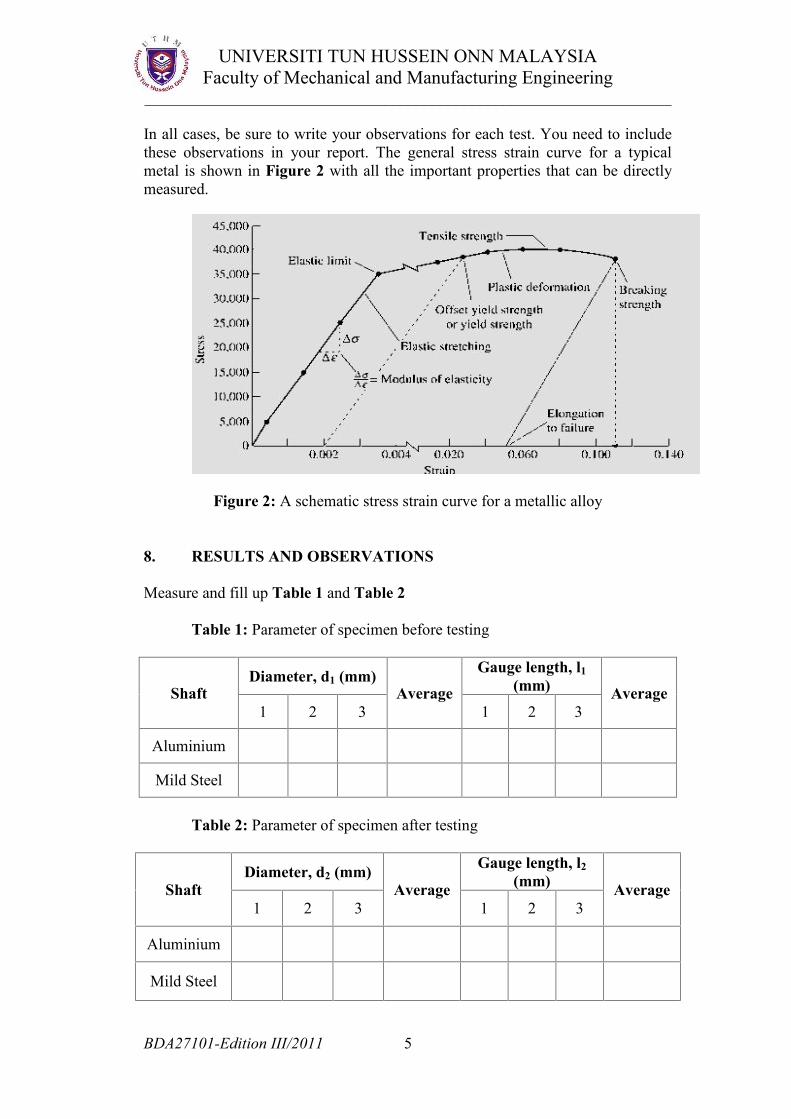
In all cases, be sure to write your observations for each test. You need to includethese observations in your report. The general stress strain curve for a typicalmetal is shown in Figure 2 with all the important properties that can be directlymeasured.
Figure 2: A schematic stress strain curve for a metallic alloy
8. RESULTS AND OBSERVATIONS
Measure and fill up Table 1 and Table 2
Table 1: Parameter of specimen before testing
ShaftDiameter, d1 (mm)
AverageGauge length, l1
(mm) Average1 2 3 1 2 3
Aluminium
Mild Steel
Table 2: Parameter of specimen after testing
ShaftDiameter, d2 (mm)
Average
Gauge length, l2(mm) Average
1 2 3 1 2 3
Aluminium
Mild Steel
UNIVERSITI TUN HUSSEIN ONN MALAYSIAFaculty of Mechanical and Manufacturing Engineering
__________________________________________________________________
BDA27101-Edition III/2011 5
In all cases, be sure to write your observations for each test. You need to includethese observations in your report. The general stress strain curve for a typicalmetal is shown in Figure 2 with all the important properties that can be directlymeasured.
Figure 2: A schematic stress strain curve for a metallic alloy
8. RESULTS AND OBSERVATIONS
Measure and fill up Table 1 and Table 2
Table 1: Parameter of specimen before testing
ShaftDiameter, d1 (mm)
AverageGauge length, l1
(mm) Average1 2 3 1 2 3
Aluminium
Mild Steel
Table 2: Parameter of specimen after testing
ShaftDiameter, d2 (mm)
Average
Gauge length, l2(mm) Average
1 2 3 1 2 3
Aluminium
Mild Steel

UNIVERSITI TUN HUSSEIN ONN MALAYSIAFaculty of Mechanical and Manufacturing Engineering
__________________________________________________________________
BDA27101-Edition III/2011 6
………………………………………………………………………………………………………………………………………………………………………………………………………………………………………………………………………………………………………………………………………………………………………………………………………………………………………………………………………………………………………………………………………………………………………………………………………………………………………………………………………………………………………………………………………………………………………………………………………………………………………………………………………………………………………………………………………………………………………………………………………………………………………………………………………………………………………………………………………………………………………………………………………………………………………………………………………………………………………………………………
9. DISCUSSIONS
1. Calculate the young’s modulus based on printed out graph and compareYoung’s modulus of all the materials tested.
………………………………………………………………………………………………………………………………………………………………………………………………………………………………………………………………………………………………………………………………………………………………………………………………………………………………………………………………………………………………………………………………………………………………………………………………………………………………………………………………………………………………………………………………………………………………………………………………………………………………………………………………………………………………………………………………………………………………………………………………………………………………………………………………………………………………………………………………………………………………………………………………………………………………………………………………………………………………………………………………………………………………………………………………………………………………………………………………………………………………………………………………………………………………………………………………………………………………………………………………………………………………………………………………………………………………………………………………………………………………………………………………………………………………………………………………………………………………………………………………………………………………………………………………………………

UNIVERSITI TUN HUSSEIN ONN MALAYSIAFaculty of Mechanical and Manufacturing Engineering
__________________________________________________________________
BDA27101-Edition III/2011 7
………………………………………………………………………………………………………………………………………………………………………………………………………………………………………………………………………………………………………………………………………………………………………………………………………………………………………………………………………………………………………………………………………………………………………………………………………………………………………………………………………………………………………………………………………………………………………………………………………………………………………………………………………………………………………………………………………………………………………………………………………………………………………………………………………………………………………………………………………………………………………………………………………………………………………………………………………………………………………………………………………………………………………………………………………………
2. Compare the yield strengths and the ultimate strengths of the materialstested. Did all materials yield?
………………………………………………………………………………………………………………………………………………………………………………………………………………………………………………………………………………………………………………………………………………………………………………………………………………………………………………………………………………………………………………………………………………………………………………………………………………………………………………………………………………………………………………………………………………………………………………………………………………………………………………………………………………………………………………………………………………………………………………………………………………………………………………………………………………………………………………………………………………………………………………………………………………………………………………………………………………………………………………………………
3. Compare the ductility of all the materials, based on % reduction of areaRA, % of elongation EL, and the shape changes during deformation. Arethe data for %RA and %EL consistent?
………………………………………………………………………………………………………………………………………………………………………………………………………………………………………………………………………………………………………………………………………………………………………………………………………………………………………………………………………………………………

UNIVERSITI TUN HUSSEIN ONN MALAYSIAFaculty of Mechanical and Manufacturing Engineering
__________________________________________________________________
BDA27101-Edition III/2011 8
………………………………………………………………………………………………………………………………………………………………………………………………………………………………………………………………………………………………………………………………………………………………………………………………………………………………………………………………………………………………………………………………………………………………………………………………………………………………………………………………………………………………………………………………………………………………………………………………………………………………………………………………………………………………………………………………………………………………………………………………………………………………………………………………………………………………………………………………………………………………………………………………………………………………………………………………………………………………………………………………………………………………………………………………………………………………………………………………………………………………………………………………………………………………………………………………………………………………………………………………………………………………………………………………………………………………………………………………………………………………………………………………………………………………………………………………………………………………………………………………………………………………………………………………………………
4. Possible sources of error include errors in load cell, cross-sectionaldimensions and gauge measurements. How much error do these factorscontribute to the results obtained?
………………………………………………………………………………………………………………………………………………………………………………………………………………………………………………………………………………………………………………………………………………………………………………………………………………………………………………………………………………………………………………………………………………………………………………………………………………………………………………………………………………………………………………………………………………………………………………………………………………………………………………………………………………………………………………………………………………………………………………………………………………………………………………………………………………………………………………………………………………………………………………………………………………………………………………………………………………………………………………………………………………………………………………………………………………………………………………………………………………………………

UNIVERSITI TUN HUSSEIN ONN MALAYSIAFaculty of Mechanical and Manufacturing Engineering
__________________________________________________________________
BDA27101-Edition III/2011 9
………………………………………………………………………………………………………………………………………………………………………………………………………………………………………………………………………………………………………………………………………………………………………………………………………………………………………………………………………………………………………………………………………………………………………………………………………………………………………………………………………………………………………………………………………………………………………………………………………………………………………………………………………………………………………………………………………………………………………………………………………………………………………………………………………………………………………………………………………………………………………………………………………………………………………………………………………………………………………………………………………………………………………………………………………………
10. CONCLUSION
Write your observations and comments whenever possible in your discussion interm of achievement, problems facing throughout the experiment andrecommendation for improvement.
……………………………………………………………………………………....……………………………………………………………………………………....……………………………………………………………………………………....……………………………………………………………………………………....……………………………………………………………………………………....……………………………………………………………………………………....……………………………………………………………………………………....……………………………………………………………………………………....……………………………………………………………………………………....……………………………………………………………………………………....……………………………………………………………………………………....……………………………………………………………………………………....……………………………………………………………………………………....……………………………………………………………………………………....……………………………………………………………………………………....……………………………………………………………………………………....……………………………………………………………………………………....……………………………………………………………………………………....……………………………………………………………………………………....……………………………………………………………………………………....……………………………………………………………………………………....……………………………………………………………………………………....……………………………………………………………………………………....……………………………………………………………………………………....
UNIVERSITI TUN HUSSEIN ONN MALAYSIAFaculty of Mechanical and Manufacturing Engineering
__________________________________________________________________
BDA27101-Edition III/2011 10
……………………………………………………………………………………....……………………………………………………………………………………....……………………………………………………………………………………....……………………………………………………………………………………....……………………………………………………………………………………....……………………………………………………………………………………....……………………………………………………………………………………....……………………………………………………………………………………....……………………………………………………………………………………....……………………………………………………………………………………....……………………………………………………………………………………....……………………………………………………………………………………....……………………………………………………………………………………....……………………………………………………………………………………....……………………………………………………………………………………....……………………………………………………………………………………....……………………………………………………………………………………....
11. REFERENCES

UNIVERSITI TUN HUSSEIN ONN MALAYSIAFaculty of Mechanical and Manufacturing Engineering
__________________________________________________________________
BDA27101-Edition III/2011 11
COURSE INFORMATION
COURSE TITLE: ENGINEERING LABORATORY III (BDA 27101)
TOPIC 2: TORSION TEST
1. INTRODUCTION
Torsion tests allow direct measurement of the shear modulus (G) of a material.This ability makes torsion testing, although not as common, a useful partner fortensile testing in determining the mechanical properties of a material.
There are two kinds of torsion experiments: torque control and angular speedcontrol. Torque control experiments apply a uniformly increasing torque to thespecimen and the amount of strain is measured as an angle through which thespecimen has turned. Angular speed control turns the specimen at a specificangular speed while the torque is measured.
Angular speed control is the type of experiment we will be doing, thus the directlymeasured quantity in this experiment will be torque.
Young's modulus (E) is related to the shear modulus and finding E with theexperimentally obtained G reinforces this relationship; they are dependent uponone another according to the equation:
Where, v is Poisson's ratio.
2. OBJECTIVES
The main objective of this experiment is to determine the elastic and yieldbehavior of material when subjected by torque load.
3. LEARNING OUTCOMES
At the end of this experiment, students should be able to:
1. Conduct experiment, record, tabulate and analyze the raw data.2. Plot the graph of Twisting angle versus Load torque (N.m).3. Determine the modulus of rigidity for each specimen4. Compare the value of modulus of rigidity form experiment with the theory5. Produce good conclusion from the experiment conducted.

UNIVERSITI TUN HUSSEIN ONN MALAYSIAFaculty of Mechanical and Manufacturing Engineering
__________________________________________________________________
BDA27101-Edition III/2011 12
4. THEORY
When a circular shaft is twisted at either end, with no other forces acting upon it,the bar is said to be in pure torsion. If we let the left-hand end of the shaft remainfixed, then the right-hand end the bar will rotate through an angle ( ) with respectto the left end .See Figure 1
Figure 1
Simultaneously, a longitudinal line on the surface of the bar, such as line nn, willrotate through a small angle with respect to the position nn'. Because of thisrotation, a rectangular element on the surface of the bar, such as the elementshown in the figure between two cross sections distance dx apart, is distorted. Thiselement is shown again in Figure 2, isolated from the remainder of the bar.
Figure 2
During torsion, the right-hand cross section of the original configuration of theelement (abdc) rotates with respect to the opposite face and points b and d moveto b' and d', respectively. The lengths of the sides of the element do not changeduring this rotation, but the angles at the corners are no longer 90°. Thus, theelement is undergoing pure shear and the magnitude of the shear strain is equalto the decrease in the angle bac.

UNIVERSITI TUN HUSSEIN ONN MALAYSIAFaculty of Mechanical and Manufacturing Engineering
__________________________________________________________________
BDA27101-Edition III/2011 13
This angle is
Note: tan is approximately equal to because under pure torsion the angle () is small.
The distance bb' is the length of a small arc of radius r subtended by the angle ,which is the angle of rotation of one cross section with respect to the other. Thus,bb' = r . Also, the distance ab is equal to the length of the element, dx.Substituting these expressions into the preceding equation, we have
Under pure torsion, the rate of change /dx of the angle of twist are constantalong the length of the bar. This constant is equal to the angle of twist per unitlength. Thus, = / L, where L is the length of the shaft. Then, we have
Now, observe that for linear elastic material, the magnitude of the shear stress, (shown in Figure 1) is.
From here we can establish the relationship between the applied torque T and theangle of twist which it produces. The resultant of the shear stresses shown inFigure 3, below, must be statically equivalent to the total torque T. The shearforce acting on an element of area dA (shown shaded in the figure) is dA, and themoment of this force is also equal to dAG 2 . The total torque T is the summationover the entire cross-sectional area of these elemental moments;
Thus, where J is equal to the polar moment of inertia of the circular cross section
GrG
UNIVERSITI TUN HUSSEIN ONN MALAYSIAFaculty of Mechanical and Manufacturing Engineering
__________________________________________________________________
BDA27101-Edition III/2011 13
This angle is
Note: tan is approximately equal to because under pure torsion the angle () is small.
The distance bb' is the length of a small arc of radius r subtended by the angle ,which is the angle of rotation of one cross section with respect to the other. Thus,bb' = r . Also, the distance ab is equal to the length of the element, dx.Substituting these expressions into the preceding equation, we have
Under pure torsion, the rate of change /dx of the angle of twist are constantalong the length of the bar. This constant is equal to the angle of twist per unitlength. Thus, = / L, where L is the length of the shaft. Then, we have
Now, observe that for linear elastic material, the magnitude of the shear stress, (shown in Figure 1) is.
From here we can establish the relationship between the applied torque T and theangle of twist which it produces. The resultant of the shear stresses shown inFigure 3, below, must be statically equivalent to the total torque T. The shearforce acting on an element of area dA (shown shaded in the figure) is dA, and themoment of this force is also equal to dAG 2 . The total torque T is the summationover the entire cross-sectional area of these elemental moments;
Thus, where J is equal to the polar moment of inertia of the circular cross section

UNIVERSITI TUN HUSSEIN ONN MALAYSIAFaculty of Mechanical and Manufacturing Engineering
__________________________________________________________________
BDA27101-Edition III/2011 14
Thus, we have
(Note that GJ is called the torsional rigidity of the shaft.) Finally, since the totalangle of twist is equal to L, we have that
This is the result we want. The experiment you are about to perform will yielddata on the torque T and the angle from which we can calculate G, the shearmodulus, given the dimensions of the shaft. Important to note that for a solidcircular shaft of uniform radius:
5. ADDITIONAL THEORY
……………………………………………………………………………………....……………………………………………………………………………………....……………………………………………………………………………………....……………………………………………………………………………………....……………………………………………………………………………………....……………………………………………………………………………………....……………………………………………………………………………………....……………………………………………………………………………………....……………………………………………………………………………………....……………………………………………………………………………………....……………………………………………………………………………………....……………………………………………………………………………………....……………………………………………………………………………………....……………………………………………………………………………………....……………………………………………………………………………………....
Figure 3

UNIVERSITI TUN HUSSEIN ONN MALAYSIAFaculty of Mechanical and Manufacturing Engineering
__________________________________________________________________
BDA27101-Edition III/2011 15
……………………………………………………………………………………....……………………………………………………………………………………....……………………………………………………………………………………....……………………………………………………………………………………....……………………………………………………………………………………....……………………………………………………………………………………....……………………………………………………………………………………....……………………………………………………………………………………....……………………………………………………………………………………....……………………………………………………………………………………....……………………………………………………………………………………....……………………………………………………………………………………....……………………………………………………………………………………....……………………………………………………………………………………....……………………………………………………………………………………....……………………………………………………………………………………....……………………………………………………………………………………....……………………………………………………………………………………....……………………………………………………………………………………....……………………………………………………………………………………....……………………………………………………………………………………....……………………………………………………………………………………....……………………………………………………………………………………....……………………………………………………………………………………....……………………………………………………………………………………....……………………………………………………………………………………....……………………………………………………………………………………....……………………………………………………………………………………....……………………………………………………………………………………....……………………………………………………………………………………....……………………………………………………………………………………....……………………………………………………………………………………....……………………………………………………………………………………....……………………………………………………………………………………....……………………………………………………………………………………....……………………………………………………………………………………....……………………………………………………………………………………....……………………………………………………………………………………....……………………………………………………………………………………....……………………………………………………………………………………....……………………………………………………………………………………....……………………………………………………………………………………....……………………………………………………………………………………....……………………………………………………………………………………....……………………………………………………………………………………....……………………………………………………………………………………....……………………………………………………………………………………....……………………………………………………………………………………....

UNIVERSITI TUN HUSSEIN ONN MALAYSIAFaculty of Mechanical and Manufacturing Engineering
__________________________________________________________________
BDA27101-Edition III/2011 16
6. APPARATUS
Figure: Torsion Testing Machine, Torsion Specimen & Vernier Caliper.
7. PROCEDURES
1. Record and measure the Specimen length and diameter at three differentlocations and calculate the average length and diameter. Also measurepully length. Fill up Table 1.
2. Mount the Specimen in the testing machine and test the Specimen (the labtechnician and/or your lab instructor will help with the rightprocedure).Make sure pulley is in Horizontal position.
3. Attach the angle indicator and zero the readings.4. Measure the angle of twist when load (W) is added from 0 to 200N and
when load is removed from 200N to 0N for both specimens. Fill up Table2 and Table 3.
8. RESULTS AND OBSERVATIONS
Table 1: Diameter of specimen
ShaftDiameter, D (mm)
AverageLength, (mm)
Average1 2 3 1 2 3
Brass
Mild Steel
Pulley Length

UNIVERSITI TUN HUSSEIN ONN MALAYSIAFaculty of Mechanical and Manufacturing Engineering
__________________________________________________________________
BDA27101-Edition III/2011 17
Table 2: Torsion test result for Brass Shaft
Load, W(N) 0 50N 100N 150N 200N
Angle oftwist
duringadditional
of load
Angle oftwist
duringremoval of
load
Table 3: Torsion test result for Mild Steel Shaft
Load, W(N) 0 50N 100N 150N 200N
Angle oftwist
duringadditional
of load
Angle oftwist
duringremoval of
load
………………………………………………………………………………………………………………………………………………………………………………………………………………………………………………………………………………………………………………………………………………………………………………………………………………………………………………………………………………………………………………………………………………………………………………………………………………………………………………………………………………………………………………………………………………………………………………………………………………………………………………………………………………………………………………………………………………………………………………………………

UNIVERSITI TUN HUSSEIN ONN MALAYSIAFaculty of Mechanical and Manufacturing Engineering
__________________________________________________________________
BDA27101-Edition III/2011 18
………………………………………………………………………………………………………………………………………………………………………………………………………………………………………………
9. DISCUSSIONS
1. Write your observations and comments on the results of the experiment.
………………………………………………………………………………………………………………………………………………………………………………………………………………………………………………………………………………………………………………………………………………………………………………………………………………………………………………………………………………………………………………………………………………………………………………………………………………………………………………………………………………………………………………………………………………………………………………………………………………………………………………………………………………………………………………………………………………………………………………………………………………………………………………………………………………………………………………………………………………………………………………………………………………………………………………………………………………………………………………………………
2. Briefly explain another method to determine Modulus of Rigidity, G.
………………………………………………………………………………………………………………………………………………………………………………………………………………………………………………………………………………………………………………………………………………………………………………………………………………………………………………………………………………………………………………………………………………………………………………………………………………………………………………………………………………………………………………………………………………………………………………………………………………………………………………………………………………………………………………………………………………………………………………………………………………………………………………………………………………………………………………………………………………………………………………………………………………………………………………………………………………………………………………………………………………………………………………………………………………………………………………………………………………………………………………………………………………………………………………………………………………………………………………………………

UNIVERSITI TUN HUSSEIN ONN MALAYSIAFaculty of Mechanical and Manufacturing Engineering
__________________________________________________________________
BDA27101-Edition III/2011 19
3. If the cross section of shaft is not cylinder, explain how to perform thetorsion analysis.
………………………………………………………………………………………………………………………………………………………………………………………………………………………………………………………………………………………………………………………………………………………………………………………………………………………………………………………………………………………………………………………………………………………………………………………………………………………………………………………………………………………………………………………………………………………………………………………………………………………………………………………………………………………………………………………………………………………………………………………………………………………………………………………………………………………………………………………………………………………………………………………………………………………………………………………………………………………………………………………………………………………………………………………………………………………………………………………………………………………………………………………………………………………………………………………………………………………………………………………………
4. Briefly explain some of the important factors in designing a high-qualityshaft.
………………………………………………………………………………………………………………………………………………………………………………………………………………………………………………………………………………………………………………………………………………………………………………………………………………………………………………………………………………………………………………………………………………………………………………………………………………………………………………………………………………………………………………………………………………………………………………………………………………………………………………………………………………………………………………………………………………………………………………………………………………………………………………………………………………………………………………………………………………………………………………………………………………………………………………………………………………………………………………………………………………………………………………………………………………………………………………………………………………………………………………………………………………………………………………………………………………………………………………………………………………………………………………………………………………

UNIVERSITI TUN HUSSEIN ONN MALAYSIAFaculty of Mechanical and Manufacturing Engineering
__________________________________________________________________
BDA27101-Edition III/2011 20
10. CONCLUSIONS
Write your observations and comments whenever possible in your discussion interm of achievement, problems facing throughout the experiment andrecommendation for improvement.
……………………………………………………………………………………....……………………………………………………………………………………....……………………………………………………………………………………....……………………………………………………………………………………....……………………………………………………………………………………....……………………………………………………………………………………....……………………………………………………………………………………....……………………………………………………………………………………....……………………………………………………………………………………....……………………………………………………………………………………....……………………………………………………………………………………....……………………………………………………………………………………....……………………………………………………………………………………....……………………………………………………………………………………....……………………………………………………………………………………....……………………………………………………………………………………....……………………………………………………………………………………....……………………………………………………………………………………....……………………………………………………………………………………....……………………………………………………………………………………....……………………………………………………………………………………....……………………………………………………………………………………....……………………………………………………………………………………....……………………………………………………………………………………....……………………………………………………………………………………....……………………………………………………………………………………....……………………………………………………………………………………....……………………………………………………………………………………....……………………………………………………………………………………....……………………………………………………………………………………....……………………………………………………………………………………....……………………………………………………………………………………....……………………………………………………………………………………....……………………………………………………………………………………....……………………………………………………………………………………....……………………………………………………………………………………....……………………………………………………………………………………....……………………………………………………………………………………....……………………………………………………………………………………....……………………………………………………………………………………....……………………………………………………………………………………....……………………………………………………………………………………....

UNIVERSITI TUN HUSSEIN ONN MALAYSIAFaculty of Mechanical and Manufacturing Engineering
__________________________________________________________________
BDA27101-Edition III/2011 21
……………………………………………………………………………………....……………………………………………………………………………………....……………………………………………………………………………………....……………………………………………………………………………………....……………………………………………………………………………………....……………………………………………………………………………………....……………………………………………………………………………………....……………………………………………………………………………………....……………………………………………………………………………………....……………………………………………………………………………………....……………………………………………………………………………………....……………………………………………………………………………………....……………………………………………………………………………………....……………………………………………………………………………………....……………………………………………………………………………………....……………………………………………………………………………………....……………………………………………………………………………………....……………………………………………………………………………………....……………………………………………………………………………………....……………………………………………………………………………………....
11. REFERENCES

UNIVERSITI TUN HUSSEIN ONN MALAYSIAFaculty of Mechanical and Manufacturing Engineering
__________________________________________________________________
BDA27101-Edition III/2011 22
COURSE INFORMATION
COURSE TITLE: ENGINEERING LABORATORY III (BDA 27101)
TOPIC 3: SHEAR FORCE OF A BEAM
1. INTRODUCTION
This guides describes how to set up and perform Shear Force in a Beamexperiments. It clearly demonstrates the principles involved and gives practicalsupport to your studies.
Figure 1 shows the Shear Force in a Beam experiment. It consists of a beamwhich is ‘cut’. To stop the beam collapsing a mechanism, (which allowsmovement in the shear direction only) bridges the cut on to a load cell thusreacting (and measuring) the shear force. A digital display shows the force fromthe load cell.
A diagram on the left-hand support of the beam shows the beam geometry andhanger positions. Hanger supports are 20mm apart, and have a central groovewhich positions the hangers.
Figure 1: Shear Force In A Beam Experiments.
2. OBJECTIVES
The objectives of this experiment are as follows:

UNIVERSITI TUN HUSSEIN ONN MALAYSIAFaculty of Mechanical and Manufacturing Engineering
__________________________________________________________________
BDA27101-Edition III/2011 23
3. LEARNING OUTCOMES
At the end of this experiment, students should be able to:
1. Conduct experiment and identify the dependent and independent variables.2. Record, tabulate and analyze the raw data.3. To draw shear diagram.4. Compare the theoretical and experimental result5. Produce good conclusion from the experiment conducted.
4. THEORY.
Beams are defined as structural members supporting loads at various points alongthe member. Transverse loadings of beams are classified as concentrated loads ordistributed loads. One of the main concerns that should be put into considerationwhen designing beams for strength is how the material and the cross section of abeam of a given selected span should be selected if the beam is not to fail under agiven loading.
Applied loads result in internal forces consisting of a shear force (from the shearstress distribution) and a bending moment (from the normal stress distribution).For prismatic beam, that is straight beam with a uniform cross section; theirdesign depends primarily upon the determination of the largest value of thebending moment and shear force created in the beam by a given loading. Thedetermination of these values and of the critical sections of the beam in whichthey occur is greatly facilitated by drawing a shear force diagram and bendingmoment diagram. The variation of the shear force V (N) and the bending momentM (Nm) along the beam may be investigated from these diagrams. The values ofV and M at various points may be obtained either by drawing free body diagramof successive portions of the beam or from relationship that involves the appliedload, shear force and bending moment.
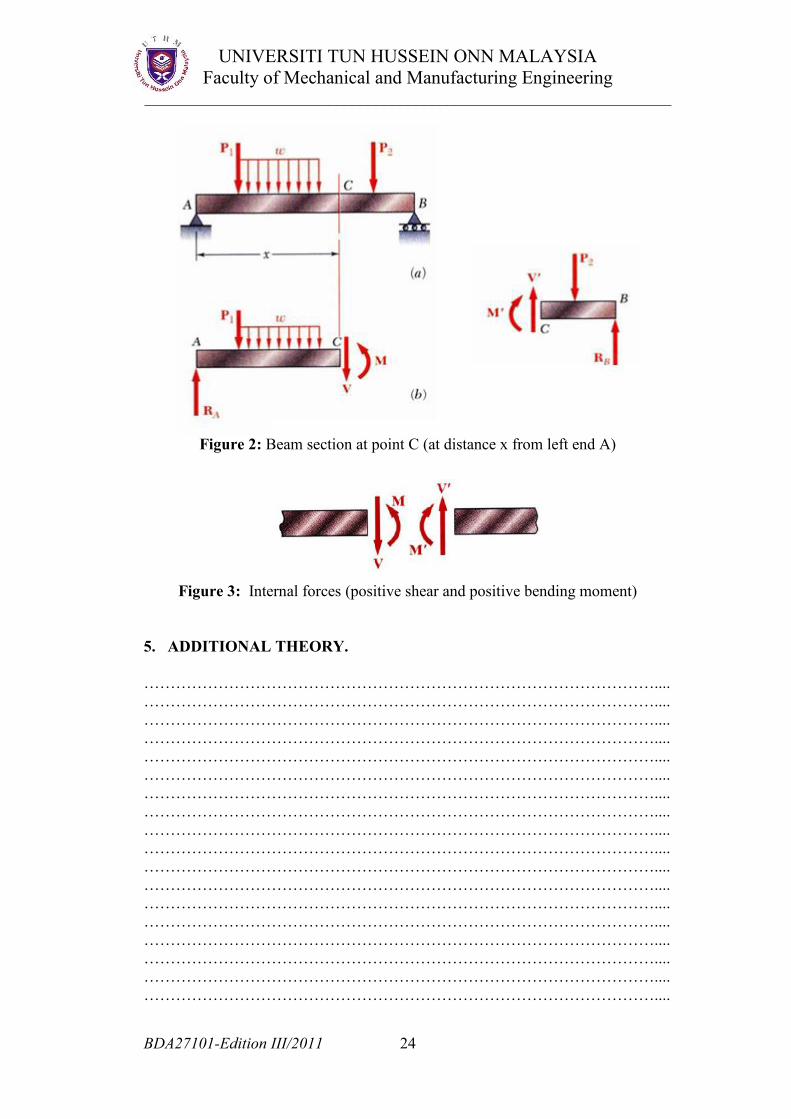
Determination of the maximum normal stress (σmax) and maximum shearingstress (τ max) requires identification of maximum internal shear force and bendingmoment. Shear force and bending moment at a point are determined by passing asection through the beam and applying an equilibrium analysis on the beamportions on either side of the section as shown in Figure 2 and 3. Signconventions for shear forces V and V’ and bending couples M and M’
1. To comprehend the action of shear in a beam.2. To measure the shearing force at a normal section of a loaded beam and to
check its agreement with theory.
UNIVERSITI TUN HUSSEIN ONN MALAYSIAFaculty of Mechanical and Manufacturing Engineering
__________________________________________________________________
BDA27101-Edition III/2011 24
Figure 2: Beam section at point C (at distance x from left end A)
Figure 3: Internal forces (positive shear and positive bending moment)
5. ADDITIONAL THEORY.
……………………………………………………………………………………....……………………………………………………………………………………....……………………………………………………………………………………....……………………………………………………………………………………....……………………………………………………………………………………....……………………………………………………………………………………....……………………………………………………………………………………....……………………………………………………………………………………....……………………………………………………………………………………....……………………………………………………………………………………....……………………………………………………………………………………....……………………………………………………………………………………....……………………………………………………………………………………....……………………………………………………………………………………....……………………………………………………………………………………....……………………………………………………………………………………....……………………………………………………………………………………....……………………………………………………………………………………....

UNIVERSITI TUN HUSSEIN ONN MALAYSIAFaculty of Mechanical and Manufacturing Engineering
__________________________________________________________________
BDA27101-Edition III/2011 25
……………………………………………………………………………………....……………………………………………………………………………………....……………………………………………………………………………………....……………………………………………………………………………………....……………………………………………………………………………………....……………………………………………………………………………………....……………………………………………………………………………………....……………………………………………………………………………………....……………………………………………………………………………………....……………………………………………………………………………………....……………………………………………………………………………………....……………………………………………………………………………………....……………………………………………………………………………………....……………………………………………………………………………………....……………………………………………………………………………………....……………………………………………………………………………………....……………………………………………………………………………………....……………………………………………………………………………………....……………………………………………………………………………………....……………………………………………………………………………………....……………………………………………………………………………………....……………………………………………………………………………………....……………………………………………………………………………………....……………………………………………………………………………………....……………………………………………………………………………………....……………………………………………………………………………………....……………………………………………………………………………………....……………………………………………………………………………………....……………………………………………………………………………………....……………………………………………………………………………………....……………………………………………………………………………………....……………………………………………………………………………………....……………………………………………………………………………………....……………………………………………………………………………………....……………………………………………………………………………………....……………………………………………………………………………………....……………………………………………………………………………………....……………………………………………………………………………………....……………………………………………………………………………………....……………………………………………………………………………………....……………………………………………………………………………………....……………………………………………………………………………………....……………………………………………………………………………………....……………………………………………………………………………………....……………………………………………………………………………………....……………………………………………………………………………………....……………………………………………………………………………………....……………………………………………………………………………………....

UNIVERSITI TUN HUSSEIN ONN MALAYSIAFaculty of Mechanical and Manufacturing Engineering
__________________________________________________________________
BDA27101-Edition III/2011 26
6. APPARATUS.
Figure 4: Shearing force of a beam experiment in the structures frame.
Before setting up and using the equipments, always:
Visually inspect all parts, including electrical leads, for damage or wear. Check electrical connections are correct and secure. Check all components are secured correctly and fastenings are sufficiently
tight. Position the Test Frame safely. Make sure it is mounted on a solid, level
surface, is steady, and easily accessible.
Note: Never apply excessive loads to any part of the equipments. If the meteris only 0.1 N, lightly tap the frame (there may be a little ‘stiction’ and thisshould overcome it).

UNIVERSITI TUN HUSSEIN ONN MALAYSIAFaculty of Mechanical and Manufacturing Engineering
__________________________________________________________________
BDA27101-Edition III/2011 27
7. PROCEDURES.
6.1 Experiments 1: Shear Force Variation with an Increasing Point Load
Figure 5: Force Diagram.
The equation we will use in this experiment is:
Shear force at cut, =.
Where a is the distance to the load (not the cut)Distance a = 260mm
You may find the following table useful in converting the masses used in theexperiment to loads.
Table 1: Grams To Newton’s Conversion Table.
Mass (Grams) Load (Newton)
100 0.98
200 1.96
300 2.94
400 3.92
500 4.90
Step 1 to 4 of the following instructions may already have been completed foryou.
1. Place an assembled Test Frame (refer to the separate instructions suppliedwith the Test Frame if necessary) on a workbench. Make sure the‘window’ of the Test Frame is easily accessible.
2. There are four securing nuts in the top member of the frame. Slide them toapproximately the positions shown in figure 5.
3. With the right-hand end of the experiment resting on the bottom memberof the Test Frame, fit the left- hand support to the top member of theframe. Push the support on to the frame to ensure that the internal bars aresitting on the frame squarely. Tighten the support in position by screwingtwo of the thumbscrews provided into the securing nuts (on the front of thesupport only).
UNIVERSITI TUN HUSSEIN ONN MALAYSIAFaculty of Mechanical and Manufacturing Engineering
__________________________________________________________________
BDA27101-Edition III/2011 28
4. Lift the right-hand support into a position and locate the two remainingthumbscrews into the securing nuts. Push the support on to the frame toensure the internal bars are sitting on the frame squarely. Position thesupport horizontally so the rolling pivot is in the middle of its travel.Tighten the thumbscrews.
5. Make sure the Digital Force Display is ‘on’. Connect the mini DIN leadfrom ‘Force Input 1’ on the Digital Force display to the socket marked‘Force Output’ on the left- hand support of the experiment. Ensure the leaddoes not touch the beam.
6. Carefully zero the force meter using the dial on the left-hand beam of theexperiments. Gently apply a small load with a finger to the centre of thebeam and release. Zero the meter again if necessary. Repeat to ensure themeter returns to zero.
7. This experiment examines how shear force varies with an increasing pointload. Figure 5 shows the force diagram for the beam.
8. Check the Digital Force Display meter reads zero with no load. Place ahanger with a 100 g mass to the left of the ‘cut’(40mm away).Record theDigital Force Display reading in table as in Table 2. Repeat using massesof 200g, 300g and 500g. Convert the mass into a load (in N).
9. Remember, Shear force at the cut = Displayed force.10. Calculate the theoretical shear force at the cut and complete the Table 2.
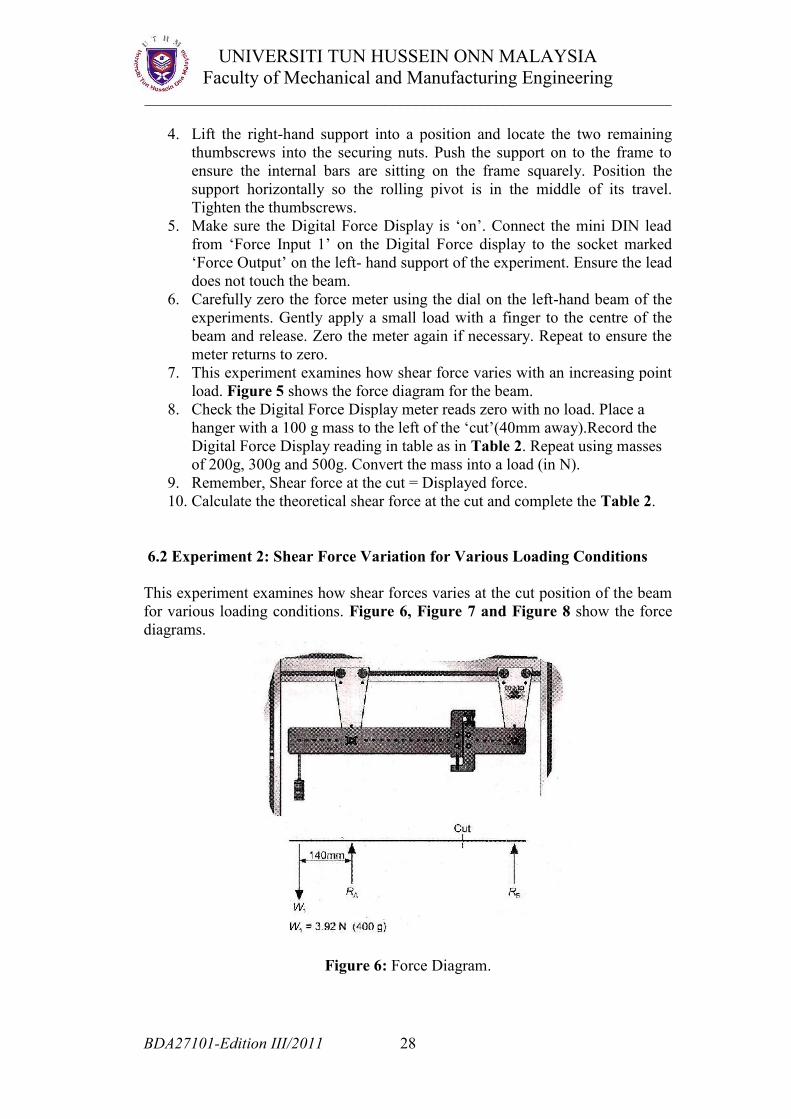
6.2 Experiment 2: Shear Force Variation for Various Loading Conditions
This experiment examines how shear forces varies at the cut position of the beamfor various loading conditions. Figure 6, Figure 7 and Figure 8 show the forcediagrams.
Figure 6: Force Diagram.
UNIVERSITI TUN HUSSEIN ONN MALAYSIAFaculty of Mechanical and Manufacturing Engineering
__________________________________________________________________
BDA27101-Edition III/2011 28
4. Lift the right-hand support into a position and locate the two remainingthumbscrews into the securing nuts. Push the support on to the frame toensure the internal bars are sitting on the frame squarely. Position thesupport horizontally so the rolling pivot is in the middle of its travel.Tighten the thumbscrews.
5. Make sure the Digital Force Display is ‘on’. Connect the mini DIN leadfrom ‘Force Input 1’ on the Digital Force display to the socket marked‘Force Output’ on the left- hand support of the experiment. Ensure the leaddoes not touch the beam.
6. Carefully zero the force meter using the dial on the left-hand beam of theexperiments. Gently apply a small load with a finger to the centre of thebeam and release. Zero the meter again if necessary. Repeat to ensure themeter returns to zero.
7. This experiment examines how shear force varies with an increasing pointload. Figure 5 shows the force diagram for the beam.
8. Check the Digital Force Display meter reads zero with no load. Place ahanger with a 100 g mass to the left of the ‘cut’(40mm away).Record theDigital Force Display reading in table as in Table 2. Repeat using massesof 200g, 300g and 500g. Convert the mass into a load (in N).
9. Remember, Shear force at the cut = Displayed force.10. Calculate the theoretical shear force at the cut and complete the Table 2.
6.2 Experiment 2: Shear Force Variation for Various Loading Conditions
This experiment examines how shear forces varies at the cut position of the beamfor various loading conditions. Figure 6, Figure 7 and Figure 8 show the forcediagrams.
Figure 6: Force Diagram.
UNIVERSITI TUN HUSSEIN ONN MALAYSIAFaculty of Mechanical and Manufacturing Engineering
__________________________________________________________________
BDA27101-Edition III/2011 29
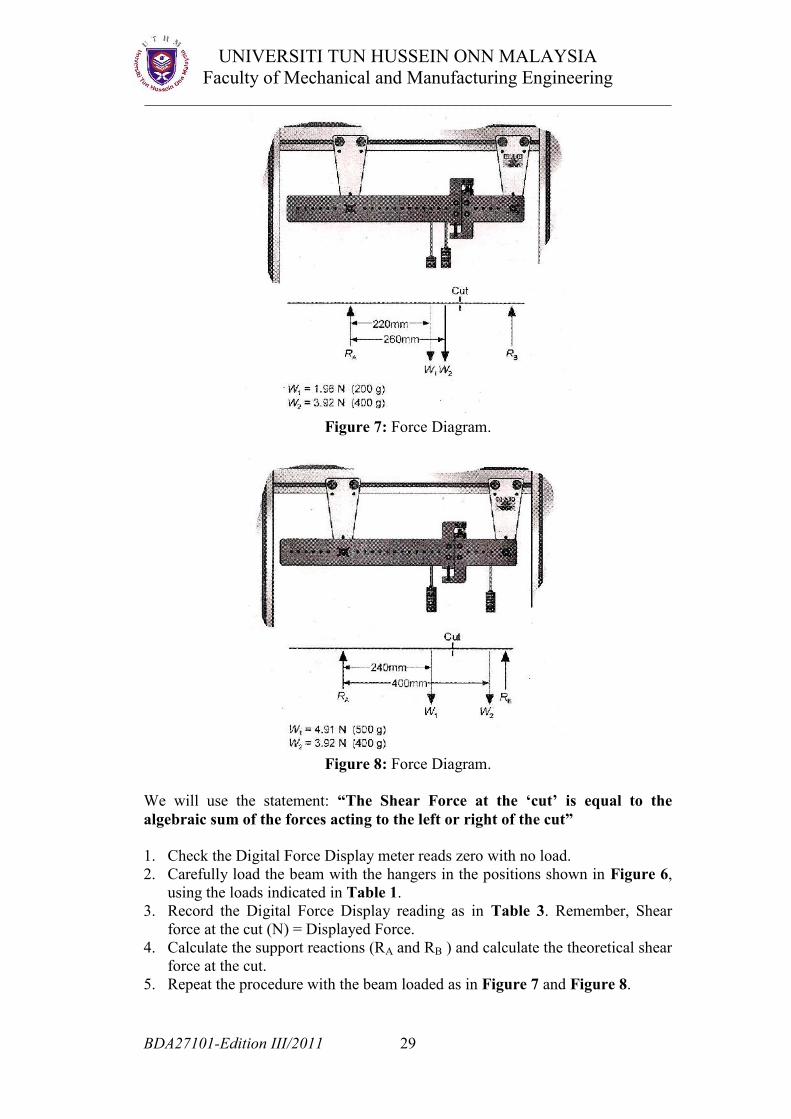
Figure 7: Force Diagram.
Figure 8: Force Diagram.
We will use the statement: “The Shear Force at the ‘cut’ is equal to thealgebraic sum of the forces acting to the left or right of the cut”
1. Check the Digital Force Display meter reads zero with no load.2. Carefully load the beam with the hangers in the positions shown in Figure 6,
using the loads indicated in Table 1.3. Record the Digital Force Display reading as in Table 3. Remember, Shear
force at the cut (N) = Displayed Force.4. Calculate the support reactions (RA and RB ) and calculate the theoretical shear
force at the cut.5. Repeat the procedure with the beam loaded as in Figure 7 and Figure 8.
UNIVERSITI TUN HUSSEIN ONN MALAYSIAFaculty of Mechanical and Manufacturing Engineering
__________________________________________________________________
BDA27101-Edition III/2011 29
Figure 7: Force Diagram.
Figure 8: Force Diagram.
We will use the statement: “The Shear Force at the ‘cut’ is equal to thealgebraic sum of the forces acting to the left or right of the cut”
1. Check the Digital Force Display meter reads zero with no load.2. Carefully load the beam with the hangers in the positions shown in Figure 6,
using the loads indicated in Table 1.3. Record the Digital Force Display reading as in Table 3. Remember, Shear
force at the cut (N) = Displayed Force.4. Calculate the support reactions (RA and RB ) and calculate the theoretical shear
force at the cut.5. Repeat the procedure with the beam loaded as in Figure 7 and Figure 8.

UNIVERSITI TUN HUSSEIN ONN MALAYSIAFaculty of Mechanical and Manufacturing Engineering
__________________________________________________________________
BDA27101-Edition III/2011 30
8. RESULTS AND OBSERVATIONS
7.1 Fill up Table 2 for part 1 experiment and Table 3 for Part 2 experiment.
Experiments 1
Table 2: Results for experiment 1.
Mass (g) Load (N) Experimental ShearForce (N)
Theoretical ShearForce (N)
0100200300400500
Experiment 2
Table 3: Results for Experiment 2.
Figure W1(N)
W2(N)
Force(N)
ExperimentalShear Force
(N)
RA(N)
RB(N)
TheoreticalShear Force
(Nm)4 3.92 05 1.96 3.926 4.91 3.92
………………………………………………………………………………………………………………………………………………………………………………………………………………………………………………………………………………………………………………………………………………………………………………………………………………………………………………………………………………………………………………………………………………………………………………………………………………………………………………………………………………………………………………………………………………………………………………………………………………………………………………………………………………………………………………………………………………………………………………………………………………………………………………………………………………………………………………………………………………………………………………………………………………………………………………………………………………………………………………………………………………………………………………………………………………………………………………………………………………………………………………………………………………………………………………

UNIVERSITI TUN HUSSEIN ONN MALAYSIAFaculty of Mechanical and Manufacturing Engineering
__________________________________________________________________
BDA27101-Edition III/2011 31
………………………………………………………………………………
………………………………………………………………………………………………………………………………………………………………………………………………………………………………………………………………………………………………………………………………………………………………………………………………………………………………………………………………………………………………………………………………………………………………………………………………………………………………………………………………………………………………………………………………………………………………………………………………………………………………………………………………………………………………………………
9. DISCUSSIONS
1. Plot a graph which compares your experimental results to those youcalculated using the theory.
2. Comment on the shape of the graph. What does it tell us about how shearforce varies due to an increased load? Does the equation we usedaccurately predict the behavior of the beam?
………………………………………………………………………………………………………………………………………………………………………………………………………………………………………………………………………………………………………………………………………………………………………………………………………………………………………………………………………………………………………………………………………………………………………………………………………………………………………………………………………………………………………………………………………………………………………………………………………………………………………………………………………………………………………………………………………………………………………………………………………………………………………………………………………………………………………………………………………………………………………………………………………………………………………………………………………………………………………………………………
3. Calculate the support reactions (RA and RB ) and calculate the theoreticalshear force at the cut.
………………………………………………………………………………………………………………………………………………………………………………………………………………………………………………………………………………………………………………………………………………………………………………………………………………………………………………………………………………………………

UNIVERSITI TUN HUSSEIN ONN MALAYSIAFaculty of Mechanical and Manufacturing Engineering
__________________________________________________________________
BDA27101-Edition III/2011 32
………………………………………………………………………………
………………………………………………………………………………………………………………………………………………………………………………………………………………………………………………………………………………………………………………………………………………………………………………………………………………………………………………………………………………………………………………………………………………………………………………………………………………………………………………………………………………………………………………………………………………………………………………………………………………………………………………………………………………………………………………………………………………………………………………………………………………………………………………………………………………………………………………………………………………………………………………………………………………………………………………………………………………………………………………………………………………………………………………………………………………………………………………………………………………………………………………………………………………………………………………………………………………………………………………………………………………………………………………………………………………………………………………………………………………………………………………………………………………………………………………………………………………………………………………………………
4. Comment on how the results of the results of the experiments comparewith those calculated using the theoretical.
………………………………………………………………………………………………………………………………………………………………………………………………………………………………………………………………………………………………………………………………………………………………………………………………………………………………………………………………………………………………………………………………………………………………………………………………………………………………………………………………………………………………………………………………………………………………………………………………………………………………………………………………………………………………………………………………………………………………………………………………………………………………………………………………………………………………………………………………………………………………………………………………………………………………………………………………………………………………………………………………………………………………………………………………………………………………………………………………………………………………………………………………………………………………………………

UNIVERSITI TUN HUSSEIN ONN MALAYSIAFaculty of Mechanical and Manufacturing Engineering
__________________________________________________________________
BDA27101-Edition III/2011 33
10. CONCLUSION.
Write your observations and comments whenever possible in your discussion interm of achievement, problems facing throughout the experiment andrecommendation for improvement.
……………………………………………………………………………………....……………………………………………………………………………………....……………………………………………………………………………………....……………………………………………………………………………………....……………………………………………………………………………………....……………………………………………………………………………………....……………………………………………………………………………………....……………………………………………………………………………………....……………………………………………………………………………………....……………………………………………………………………………………....……………………………………………………………………………………....……………………………………………………………………………………....……………………………………………………………………………………....……………………………………………………………………………………....……………………………………………………………………………………....……………………………………………………………………………………....……………………………………………………………………………………....……………………………………………………………………………………....……………………………………………………………………………………....……………………………………………………………………………………....……………………………………………………………………………………....……………………………………………………………………………………....……………………………………………………………………………………....……………………………………………………………………………………....……………………………………………………………………………………....……………………………………………………………………………………....……………………………………………………………………………………....……………………………………………………………………………………....……………………………………………………………………………………....……………………………………………………………………………………....……………………………………………………………………………………....……………………………………………………………………………………....……………………………………………………………………………………....……………………………………………………………………………………....……………………………………………………………………………………....……………………………………………………………………………………....……………………………………………………………………………………....……………………………………………………………………………………....……………………………………………………………………………………....……………………………………………………………………………………....……………………………………………………………………………………....
UNIVERSITI TUN HUSSEIN ONN MALAYSIAFaculty of Mechanical and Manufacturing Engineering
__________________________________________________________________
BDA27101-Edition III/2011 34
……………………………………………………………………………………....
……………………………………………………………………………………....……………………………………………………………………………………....……………………………………………………………………………………....……………………………………………………………………………………....……………………………………………………………………………………....……………………………………………………………………………………....……………………………………………………………………………………....……………………………………………………………………………………....……………………………………………………………………………………....……………………………………………………………………………………....……………………………………………………………………………………....……………………………………………………………………………………....……………………………………………………………………………………....……………………………………………………………………………………....……………………………………………………………………………………....……………………………………………………………………………………....……………………………………………………………………………………....……………………………………………………………………………………....……………………………………………………………………………………....
11. REFERENCES
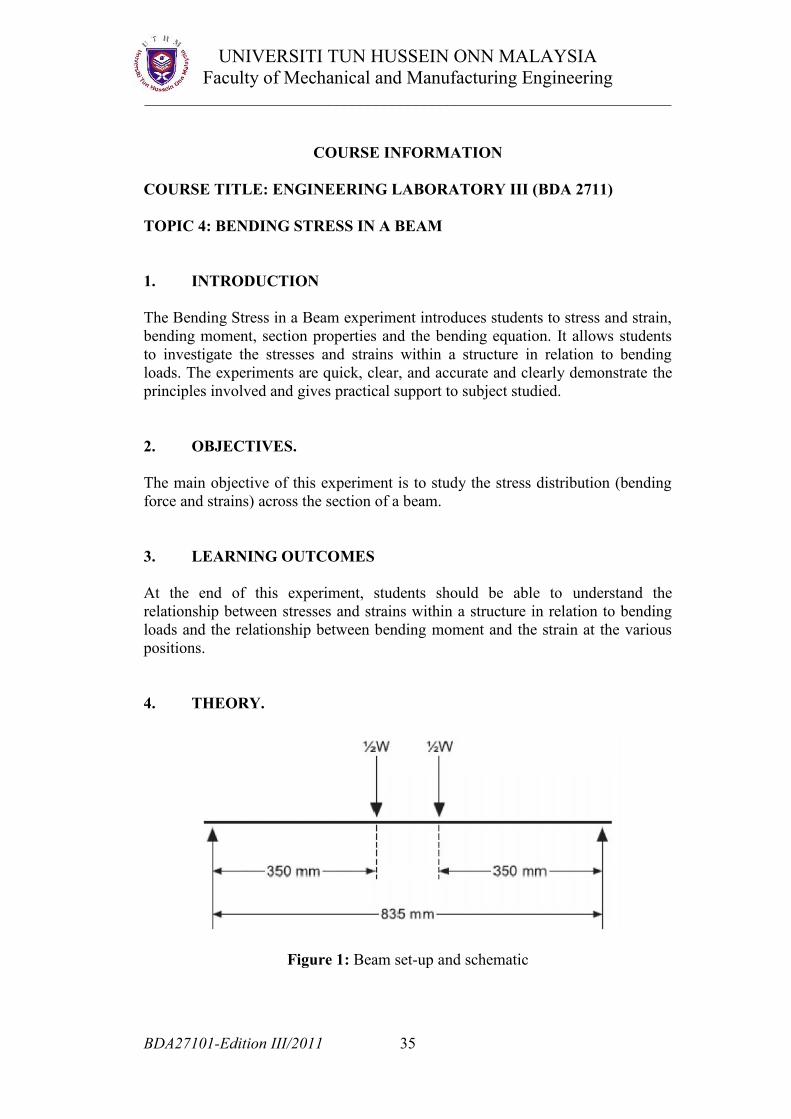
UNIVERSITI TUN HUSSEIN ONN MALAYSIAFaculty of Mechanical and Manufacturing Engineering
__________________________________________________________________
BDA27101-Edition III/2011 35
COURSE INFORMATION
COURSE TITLE: ENGINEERING LABORATORY III (BDA 2711)
TOPIC 4: BENDING STRESS IN A BEAM
1. INTRODUCTION
The Bending Stress in a Beam experiment introduces students to stress and strain,bending moment, section properties and the bending equation. It allows studentsto investigate the stresses and strains within a structure in relation to bendingloads. The experiments are quick, clear, and accurate and clearly demonstrate theprinciples involved and gives practical support to subject studied.
2. OBJECTIVES.
The main objective of this experiment is to study the stress distribution (bendingforce and strains) across the section of a beam.
3. LEARNING OUTCOMES
At the end of this experiment, students should be able to understand therelationship between stresses and strains within a structure in relation to bendingloads and the relationship between bending moment and the strain at the variouspositions.
4. THEORY.
Figure 1: Beam set-up and schematic

UNIVERSITI TUN HUSSEIN ONN MALAYSIAFaculty of Mechanical and Manufacturing Engineering
__________________________________________________________________
BDA27101-Edition III/2011 36
As well as the information given on the unit you will need the following formulae(The bending equation):
Where,
And
Where,
5. ADDITIONAL THEORY.
……………………………………………………………………………………....……………………………………………………………………………………....……………………………………………………………………………………....……………………………………………………………………………………....……………………………………………………………………………………....……………………………………………………………………………………....……………………………………………………………………………………....……………………………………………………………………………………....……………………………………………………………………………………....……………………………………………………………………………………....……………………………………………………………………………………....……………………………………………………………………………………....……………………………………………………………………………………....……………………………………………………………………………………....……………………………………………………………………………………....……………………………………………………………………………………....……………………………………………………………………………………....……………………………………………………………………………………....

UNIVERSITI TUN HUSSEIN ONN MALAYSIAFaculty of Mechanical and Manufacturing Engineering
__________________________________________________________________
BDA27101-Edition III/2011 37
……………………………………………………………………………………....
……………………………………………………………………………………....……………………………………………………………………………………....……………………………………………………………………………………....……………………………………………………………………………………....……………………………………………………………………………………....……………………………………………………………………………………....……………………………………………………………………………………....……………………………………………………………………………………....……………………………………………………………………………………....……………………………………………………………………………………....……………………………………………………………………………………....……………………………………………………………………………………....……………………………………………………………………………………....……………………………………………………………………………………....……………………………………………………………………………………....……………………………………………………………………………………....……………………………………………………………………………………....……………………………………………………………………………………....……………………………………………………………………………………....……………………………………………………………………………………....……………………………………………………………………………………....……………………………………………………………………………………....……………………………………………………………………………………....……………………………………………………………………………………....……………………………………………………………………………………....……………………………………………………………………………………....……………………………………………………………………………………....……………………………………………………………………………………....……………………………………………………………………………………....……………………………………………………………………………………....……………………………………………………………………………………....……………………………………………………………………………………....……………………………………………………………………………………....……………………………………………………………………………………....……………………………………………………………………………………....……………………………………………………………………………………....……………………………………………………………………………………....……………………………………………………………………………………....……………………………………………………………………………………....……………………………………………………………………………………....……………………………………………………………………………………....……………………………………………………………………………………....……………………………………………………………………………………....……………………………………………………………………………………....……………………………………………………………………………………....……………………………………………………………………………………....……………………………………………………………………………………....

UNIVERSITI TUN HUSSEIN ONN MALAYSIAFaculty of Mechanical and Manufacturing Engineering
__________________________________________________________________
BDA27101-Edition III/2011 38
……………………………………………………………………………………....
6. APPARATUS.
Figure 2 shows the Bending Stress in a Beam experiment, while Figure 3 showsthe Bending Stress in a Beam experiment in the structures frame. It consists of aninverted Aluminum T-beam, with strain gauges fixed on the section. The panelassembly and Load Cell apply load to the top of the beam at two positions eachside of the strain gauges. Strain gauges are sensors that experience a change inelectrical resistance when stretched or compressed. T-beam has strain gaugesbonded to it. These stretch and compress the same amount as the beam, thus itmeasure strain in the beam. The Digital Strain Display converts the change inelectrical resistance of the strain gauges to show it as displacement (strain). Itshows all the strains sensed by the strain gauges, reading in micro strain (με).
Figure 2: Bending stress in a beam experiment
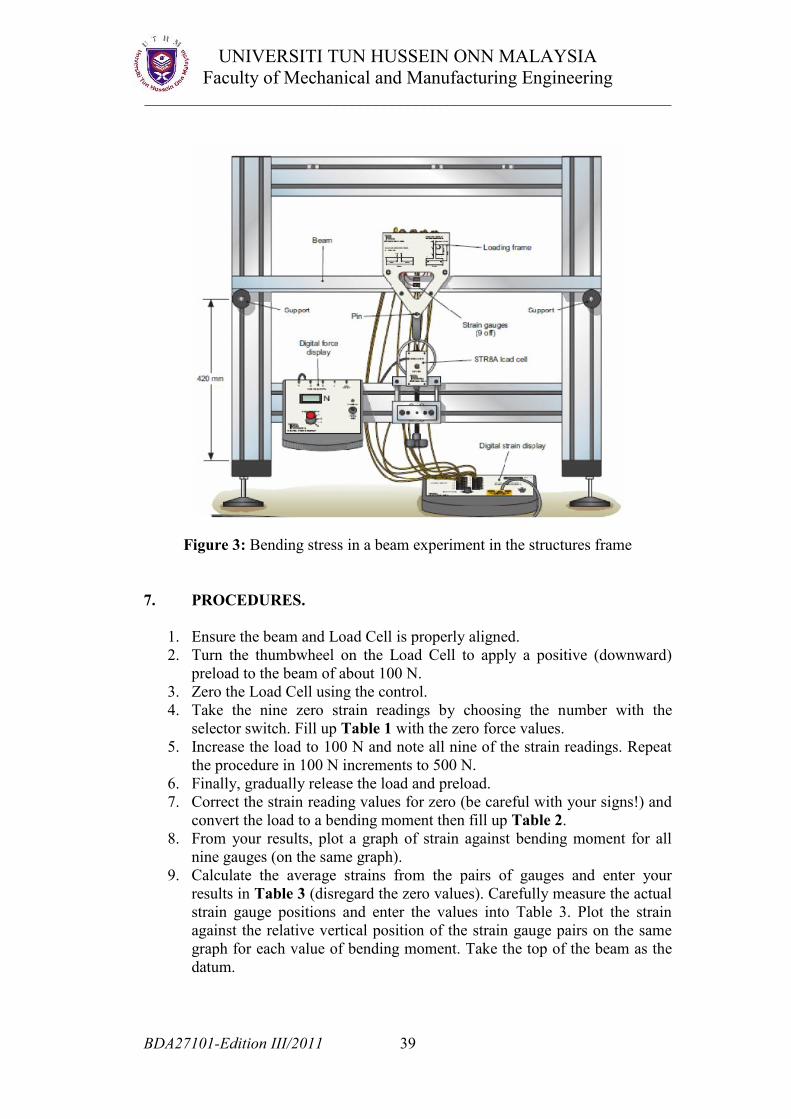
UNIVERSITI TUN HUSSEIN ONN MALAYSIAFaculty of Mechanical and Manufacturing Engineering
__________________________________________________________________
BDA27101-Edition III/2011 39
Figure 3: Bending stress in a beam experiment in the structures frame
7. PROCEDURES.
1. Ensure the beam and Load Cell is properly aligned.2. Turn the thumbwheel on the Load Cell to apply a positive (downward)
preload to the beam of about 100 N.3. Zero the Load Cell using the control.4. Take the nine zero strain readings by choosing the number with the
selector switch. Fill up Table 1 with the zero force values.5. Increase the load to 100 N and note all nine of the strain readings. Repeat
the procedure in 100 N increments to 500 N.6. Finally, gradually release the load and preload.7. Correct the strain reading values for zero (be careful with your signs!) and
convert the load to a bending moment then fill up Table 2.8. From your results, plot a graph of strain against bending moment for all
nine gauges (on the same graph).9. Calculate the average strains from the pairs of gauges and enter your
results in Table 3 (disregard the zero values). Carefully measure the actualstrain gauge positions and enter the values into Table 3. Plot the strainagainst the relative vertical position of the strain gauge pairs on the samegraph for each value of bending moment. Take the top of the beam as thedatum.

UNIVERSITI TUN HUSSEIN ONN MALAYSIAFaculty of Mechanical and Manufacturing Engineering
__________________________________________________________________
BDA27101-Edition III/2011 40
10. Calculate the second moment of area and position of the neutral axis forthe section (use a vernier to measure the exact size of the section) and addthe position of the neutral axis to the plot.
*Never apply excessive loads to any part of the equipment.
8. RESULTS AND OBSERVATIONS
Table 1: Results for Experiment 1 (uncorrected)
Gaugenumber
Load (N)0 100 200 300 400 500
123456789
Table 2: Results for Experiment 1 (corrected)
GaugeNumber
Bending moment (Nm)0 17.5 35 52.5 70 87.5
1 02 03 04 05 06 07 08 09 0

UNIVERSITI TUN HUSSEIN ONN MALAYSIAFaculty of Mechanical and Manufacturing Engineering
__________________________________________________________________
BDA27101-Edition III/2011 41
Table 3: Averaged strain readings for Experiment 1
GaugeNumber
NominalVerticalposition
(mm)
ActualVerticalposition
(mm)
Bending moment (Nm)
0
1 0 02,3 6.4 84,5 23 236,7 31.7 31.78,9 38.1 38.1
………………………………………………………………………………………………………………………………………………………………………………………………………………………………………………………………………………………………………………………………………………………………………………………………………………………………………………………………………………………………………………………………………………………………………………………………………………………………………………………………………………………………………………………………………………………………………………………………………………………………………………………………………………………………………………………………………………………………………………………………………………………………………………………………………………………………………………………………………………………………………………………………………………………………………………………………………………………………………………………………
9. DISCUSSIONS
1. What is the relationship between the bending moment and the strain at thevarious positions?
………………………………………………………………………………………………………………………………………………………………………………………………………………………………………………………………………………………………………………………………………………………………………………………………………………………………………………………………………………………………………………………………………………………………………………………………………………………………………………………………………………………………………………………………………………………………………………………………………………………………

UNIVERSITI TUN HUSSEIN ONN MALAYSIAFaculty of Mechanical and Manufacturing Engineering
__________________________________________________________________
BDA27101-Edition III/2011 42
………………………………………………………………………………………………………………………………………………………………
2. What do you notice about the strain gauge readings on opposite sides ofthe section? Should they be identical? If the readings are not identical, givetwo reasons why.
………………………………………………………………………………………………………………………………………………………………………………………………………………………………………………………………………………………………………………………………………………………………………………………………………………………………………………………………………………………………………………………………………………………………………………………………………………………………………………………………………………………………………………………………………………………………………………………………………………………………………………………………………………………………………………………………………………………………………………………………………………………………………………………………………………………………………………………………………………………………………………………………………………………………………………………………………………………………………………………………………………………………………………………………………………………………………………………………………………………………………………………………………………………………………………………………………………………………………………………………………………………………………………………………………………………………………………………………………………………………………………………………………………………………………………………………………………………………………………………………………………………………………………………………………………………………………………………………………………………………………………………………………………………………………………………………………………………………………………………………………………………………………………………………………………………………………………………………………………………………………………………………………………………………………………………………………………………………………………………………
3. Calculate the maximum stress in the section by turning the strains intostress values (at the maximum load). Compare this to the theoreticalvalue.
………………………………………………………………………………………………………………………………………………………………………………………………………………………………………………………………………………………………………………………………………………………………………………………………………………

UNIVERSITI TUN HUSSEIN ONN MALAYSIAFaculty of Mechanical and Manufacturing Engineering
__________________________________________________________________
BDA27101-Edition III/2011 43
………………………………………………………………………………………………………………………………………………………………
………………………………………………………………………………………………………………………………………………………………………………………………………………………………………………………………………………………………………………………………………………………………………………………………………………………………………………………………………………………………………………………………………………………………………………………………………………………………………………………………………………………………………………………………………………………………………………………………………………………………………………………………………………………………………………………………………………………………………………………………………………………………………………………………………………………………………………………………………………………………………………………………………………………………………………………………………………………………………………………………………………………………………………………………………………………………………………………………………………………………………………………………………………………………………………………………………………………………………………………………………………………………………………………………………………………………………………………………………………………………………………………………………………………………………………………………………………………………………………………………
4. Does the bending equation accurately predict the stress in the beam?
………………………………………………………………………………………………………………………………………………………………………………………………………………………………………………………………………………………………………………………………………………………………………………………………………………………………………………………………………………………………………………………………………………………………………………………………………………………………………………………………………………………………………………………………………………………………………………………………………………………………………………………………………………………………………………………………………………………………………………………………………………………………………………………………………………………………………………………………………………………………………………………………………………………………………………………………………………………………………………………………………………………………………………………………………………………………………………………………………………………………

UNIVERSITI TUN HUSSEIN ONN MALAYSIAFaculty of Mechanical and Manufacturing Engineering
__________________________________________________________________
BDA27101-Edition III/2011 44
10. CONCLUSION.
Write your observations and comments whenever possible in your discussion interm of achievement, problems facing throughout the experiment andrecommendation for improvement.
……………………………………………………………………………………....……………………………………………………………………………………....……………………………………………………………………………………....……………………………………………………………………………………....……………………………………………………………………………………....……………………………………………………………………………………....……………………………………………………………………………………....……………………………………………………………………………………....……………………………………………………………………………………....……………………………………………………………………………………....……………………………………………………………………………………....……………………………………………………………………………………....……………………………………………………………………………………....……………………………………………………………………………………....……………………………………………………………………………………....……………………………………………………………………………………....……………………………………………………………………………………....……………………………………………………………………………………....……………………………………………………………………………………....……………………………………………………………………………………....……………………………………………………………………………………....……………………………………………………………………………………....……………………………………………………………………………………....……………………………………………………………………………………....……………………………………………………………………………………....……………………………………………………………………………………....……………………………………………………………………………………....……………………………………………………………………………………....……………………………………………………………………………………....……………………………………………………………………………………....……………………………………………………………………………………....……………………………………………………………………………………....……………………………………………………………………………………....……………………………………………………………………………………....……………………………………………………………………………………....……………………………………………………………………………………....……………………………………………………………………………………....……………………………………………………………………………………....……………………………………………………………………………………....……………………………………………………………………………………....

UNIVERSITI TUN HUSSEIN ONN MALAYSIAFaculty of Mechanical and Manufacturing Engineering
__________________________________________________________________
BDA27101-Edition III/2011 45
……………………………………………………………………………………....……………………………………………………………………………………....
……………………………………………………………………………………....……………………………………………………………………………………....……………………………………………………………………………………....……………………………………………………………………………………....……………………………………………………………………………………....……………………………………………………………………………………....……………………………………………………………………………………....……………………………………………………………………………………....……………………………………………………………………………………....……………………………………………………………………………………....……………………………………………………………………………………....……………………………………………………………………………………....……………………………………………………………………………………....……………………………………………………………………………………....……………………………………………………………………………………....……………………………………………………………………………………....
11. REFERENCES

UNIVERSITI TUN HUSSEIN ONN MALAYSIAFaculty of Mechanical and Manufacturing Engineering
__________________________________________________________________
BDA27101-Edition III/2011 46
COURSE INFORMATION
COURSE TITLE: ENGINEERING LABORATORY III (BDA 27101)
TOPIC 5: THIN CYLINDER
1. INTRODUCTION
The analysis of the stress distribution in a thin walled cylinder is of considerableimportance in pressure vessels and gun barrels. Strain gauges mounted on variousradius and at different alignments throughout the cylinder wall provide themeasurement of the strains. Thus stress distribution throughout the wall of acylinder subjected to an internal pressure could be analyzed.
2. OBJECTIVES.
The objectives of this experiment are as follows:
1. To enable comprehensive analysis of stresses and strains in a thin cylinderunder internal pressure.
2. To allow investigations with the cylinder in both open-ends and closed-ends conditions
3. LEARNING OUTCOMES
At the end of this experiment, students should be able to get an appreciation of:
1. A biaxial stress system2. The use of strain gauges3. Young’s Modulus4. Poisson’s ratio
4. THEORY
Consider a thin cylinder of plate thickness t, mean diameter d and length l,subjected to internal pressure p. Now consider that the cylinder is sectioned by thex-plane of symmetry and by the two z-planes (of distance z apart) as shown inFigure 1.

UNIVERSITI TUN HUSSEIN ONN MALAYSIAFaculty of Mechanical and Manufacturing Engineering
__________________________________________________________________
BDA27101-Edition III/2011 47
Consider the equilibrium of forces in the x-direction acting on the sectionedcylinder shown in Figure 2. It is assumed that the circumferential stress isconstant through the thickness of the cylinder.
Force due to internal pressure p acting on area dz = pdz
Force due to circumferential/Hoop stress ( H ) acting on area 2tz = H. 2tz
Equating: , Therefore:- or
Figure 1
Figure 2
tpr
H t
pdH 2pdztzH 2

UNIVERSITI TUN HUSSEIN ONN MALAYSIAFaculty of Mechanical and Manufacturing Engineering
__________________________________________________________________
BDA27101-Edition III/2011 48
Now consider the equilibrium of forces in the z-direction acting on the partcylinder shown in Figure 3.
Force due to internal pressure p acting on area d2/4 = p. d2/4
Force due to longitudinal stress ( L ) acting on area dt =L. dt
Equating: , Therefore:- or
In the “open” ends condition, there is no obstruction to the end of cylinder.
Therefore,
But . Therefore:-
Hoop Strain,
Longitudinal Strain,
While, in the “closed” ends condition, the force applied onto element are due toand .
Therefore:-
Hoop Strain,
Longitudinal Strain,
Figure 3
tpr
H
tpd
L 4
4
2dpdtL
0L
HH E 1
HL E
1
HL
tpr
L 2
HLL E
1 LHH E
1

UNIVERSITI TUN HUSSEIN ONN MALAYSIAFaculty of Mechanical and Manufacturing Engineering
__________________________________________________________________
BDA27101-Edition III/2011 49
5. ADDITIONAL THEORY
……………………………………………………………………………………....……………………………………………………………………………………....……………………………………………………………………………………....……………………………………………………………………………………....……………………………………………………………………………………....……………………………………………………………………………………....……………………………………………………………………………………....……………………………………………………………………………………....……………………………………………………………………………………....……………………………………………………………………………………....……………………………………………………………………………………....……………………………………………………………………………………....……………………………………………………………………………………....……………………………………………………………………………………....……………………………………………………………………………………....……………………………………………………………………………………....……………………………………………………………………………………....……………………………………………………………………………………....……………………………………………………………………………………....……………………………………………………………………………………....……………………………………………………………………………………....……………………………………………………………………………………....……………………………………………………………………………………....……………………………………………………………………………………....……………………………………………………………………………………....……………………………………………………………………………………....……………………………………………………………………………………....……………………………………………………………………………………....……………………………………………………………………………………....……………………………………………………………………………………....……………………………………………………………………………………....……………………………………………………………………………………....……………………………………………………………………………………....……………………………………………………………………………………....……………………………………………………………………………………....……………………………………………………………………………………....……………………………………………………………………………………....……………………………………………………………………………………....……………………………………………………………………………………....……………………………………………………………………………………....……………………………………………………………………………………....……………………………………………………………………………………....……………………………………………………………………………………....……………………………………………………………………………………....

UNIVERSITI TUN HUSSEIN ONN MALAYSIAFaculty of Mechanical and Manufacturing Engineering
__________________________________________________________________
BDA27101-Edition III/2011 50
……………………………………………………………………………………....……………………………………………………………………………………....
6. APPARATUS
Figure 4: The SM1007 Thin Cylinder apparatus.
In the “open” ends condition the hand wheel is fully screwed in. This pushes thetwo pistons away from the cylinder end caps so that there is no contact betweenthem. Therefore, the axial force is transmitted from the pressurized oil into theframe rather than the cylinder. See Figure 5.
Figure 5: Open Ends Condition
In the “closed” ends condition the hand wheel is wound out. This allows thepistons to move outward against the cylinder end caps so that there is no contactwith the frame. Therefore the axial force is transmitted from the pressurized oilinto the cylinder itself. See Figure 6.

UNIVERSITI TUN HUSSEIN ONN MALAYSIAFaculty of Mechanical and Manufacturing Engineering
__________________________________________________________________
BDA27101-Edition III/2011 51
Figure 6: Closed Ends Condition
Technical Information
Length 358.8 mmWall Thickness 3 mmInner diameter, D1 80 mmGuage factors 2.105Cylinder material Aluminium alloy 6063Young’s Modulus 69 GN/m2
Poisson’s ratio 0.33Maximum allowable test pressure 3.5 MN/m2
Strain gauges Electrical Resistance Type
7. PROCEDURES
7.1 Experiment 1 – Thin Cylinder with Open Ends
In this experiment we will pressurize the cylinder in the open ends condition andreadings from all six strain gauges are taken, we will then analyze the results invarious ways to establish some important relationships. Examine the cylinder andthe diagram on the front panel to understand the notation and placement of thestrain gauges in relation to the axis of the cylinder. The experimental methodutilizes the SM1007 software to display and take readings
1. In the SM1007 software choose OPEN ENDS CONDITION from theEXPERIMENTS menu option. Then connect the SM1007 unit by selecting

UNIVERSITI TUN HUSSEIN ONN MALAYSIAFaculty of Mechanical and Manufacturing Engineering
__________________________________________________________________
BDA27101-Edition III/2011 52
CONNECT TO SM1007 from the same menu. The virtual meters on thescreen should now display values of pressure and strain.
2. Close the pump release valve and zero the readings by selecting ZEROALL GAUGES from the EXPERIMENTS menu option. All the virtualstrain meters should now read 0±0.3με, and the pressure meter should read0±0.01MPa.
3. Take the first set of readings (at zero) into the data table by selectingRECORD GAUGE READINGS from the EXPERIMENTS menu option.Display the data table by selecting DATA TABLE in the RESULTS menu.
4. Pump the handle slowly until a pressure of around 0.5 MPa and record thereadings into the data table again by selecting RECORD GAUGEREADINGS from the EXPERIMENT menu option. Wait a few secondsbetween pumps for the gauges to stabilize.
5. Carefully increase the pressure in 0.5 MPa increment, record the readingsinto the data table until you have reached a value of 3 MPa (Do not exceeda maximum cylinder pressure of 3.5 MPa). Record all data in Table 1.
7.2 Experiment 2 – Thin Cylinder with Closed Ends
We will now test the cylinder by taking the same readings as in experiment 1 butwith the cylinder in the closed ends condition to show the effect of the biaxialstress system.
1. Open the pump release valve and carefully unscrew the hand wheelenough to set up the closed ends condition. To check that the frame is nottransmitting any load, close the pump release valve and pump the handleand observe the pressure gauge, you may need to pump a number of timesas the oil pushes the pistons outward.
2. Once a pressure of around 3MPa has been achieved, gently push and pullthe cylinder along its axis, the cylinder should move in the frameindicating that the frame is not transmitting any load. If it doesn’t move,wind the hand wheel out some and try again.
3. Release the pressure from cylinder by opening the pump release valve.4. In the SM1007 software choose CLOSED ENDS CONDITION from the
EXPERIMENTS menu option. Then connect the SM1007 unit by selectingCONNECT TO SM1007 from the same menu. The virtual meters on thescreen should now display values of pressure and strain.
5. Repeat steps 3 to 5 in Experiment 1.

UNIVERSITI TUN HUSSEIN ONN MALAYSIAFaculty of Mechanical and Manufacturing Engineering
__________________________________________________________________
BDA27101-Edition III/2011 53
8. RESULTS AND OBSERVATIONS
Table 1: Thin Cylinder with Open Ends Experiment 1
Table 2: Thin Cylinder with Closed Ends Experiment 2
………………………………………………………………………………………………………………………………………………………………………………………………………………………………………………………………………………………………………………………………………………………………………………………………………………………………………………………………………………………………………………………………………………………………………………………………………………………………………………………………………………………………………………………………………………………………………………………………………………………………………………………………………………………………………………………………………………………………………………………………………………………………………………………………………………
Pressure
Gauge
1 2 3 4 5 6
0.5
1.0
1.5
2.0
2.5
3.0
PressureGauge
1 2 3 4 5 6
3.0

UNIVERSITI TUN HUSSEIN ONN MALAYSIAFaculty of Mechanical and Manufacturing Engineering
__________________________________________________________________
BDA27101-Edition III/2011 54
………………………………………………………………………………………………………………………………………………………………………………………………………………………………………………
9. DISCUSSIONS
1. Explain the difference between the “Open End” and “Closed End”conditions?
………………………………………………………………………………………………………………………………………………………………………………………………………………………………………………………………………………………………………………………………………………………………………………………………………………………………………………………………………………………………………………………………………………………………………………………………………………………………………………………………………………………………………………………………………………………………………………………………………………………………………………………………………………………………………………………………………………………………………………………………………………………………………………………………………………………………………………………………………………………………………………………………………………………………………………………………………………………………………………………………
2. Which case experiences “uniaxial state of stress” and which caseexperiences “biaxial state of stress”?
………………………………………………………………………………………………………………………………………………………………………………………………………………………………………………………………………………………………………………………………………………………………………………………………………………………………………………………………………………………………………………………………………………………………………………………………………………………………………………………………………………………………………………………………………………………………………………………………………………………………………………………………………………………………………………………………………………………………………………………………………………………………………………………………………………………………………………………………………………………………………………………………………………………………………………………………………………………………………………………………
3. Briefly explain what the possible sources of error in this experiment are.
………………………………………………………………………………

UNIVERSITI TUN HUSSEIN ONN MALAYSIAFaculty of Mechanical and Manufacturing Engineering
__________________________________________________________________
BDA27101-Edition III/2011 55
………………………………………………………………………………………………………………………………………………………………………………………………………………………………………………
………………………………………………………………………………………………………………………………………………………………………………………………………………………………………………………………………………………………………………………………………………………………………………………………………………………………………………………………………………………………………………………………………………………………………………………………………………………………………………………………………………………………………………………………………………………………………………………………………………………………………………………………………………………………………………………………………………………………………………………………………………………………………………………………………………………………………………………………………………………………………………………………………………………………………………
10. CONCLUSION.
Write your observations and comments whenever possible in your discussion interm of achievement, problems facing throughout the experiment andrecommendation for improvement.
……………………………………………………………………………………....……………………………………………………………………………………....……………………………………………………………………………………....……………………………………………………………………………………....……………………………………………………………………………………....……………………………………………………………………………………....……………………………………………………………………………………....……………………………………………………………………………………....……………………………………………………………………………………....……………………………………………………………………………………....……………………………………………………………………………………....……………………………………………………………………………………....……………………………………………………………………………………....……………………………………………………………………………………....……………………………………………………………………………………....……………………………………………………………………………………....……………………………………………………………………………………....……………………………………………………………………………………....……………………………………………………………………………………....……………………………………………………………………………………....……………………………………………………………………………………....……………………………………………………………………………………....……………………………………………………………………………………....

UNIVERSITI TUN HUSSEIN ONN MALAYSIAFaculty of Mechanical and Manufacturing Engineering
__________________________________________________________________
BDA27101-Edition III/2011 56
……………………………………………………………………………………....……………………………………………………………………………………....……………………………………………………………………………………....
……………………………………………………………………………………....……………………………………………………………………………………....……………………………………………………………………………………....……………………………………………………………………………………....……………………………………………………………………………………....……………………………………………………………………………………....……………………………………………………………………………………....……………………………………………………………………………………....……………………………………………………………………………………....……………………………………………………………………………………....……………………………………………………………………………………....……………………………………………………………………………………....……………………………………………………………………………………....……………………………………………………………………………………....……………………………………………………………………………………....……………………………………………………………………………………....……………………………………………………………………………………....……………………………………………………………………………………....……………………………………………………………………………………....……………………………………………………………………………………....……………………………………………………………………………………....……………………………………………………………………………………....……………………………………………………………………………………....……………………………………………………………………………………....……………………………………………………………………………………....……………………………………………………………………………………....……………………………………………………………………………………....……………………………………………………………………………………....……………………………………………………………………………………....……………………………………………………………………………………....……………………………………………………………………………………....……………………………………………………………………………………....……………………………………………………………………………………....……………………………………………………………………………………....……………………………………………………………………………………....……………………………………………………………………………………....
11. REFERENCES
UNIVERSITI TUN HUSSEIN ONN MALAYSIAFaculty of Mechanical and Manufacturing Engineering
__________________________________________________________________
REFERENCESREFERENCES
SOLID MECHANICS I:
1. Gere, J.M. and Goodno, B.J., 2009. “Mechanics of Materials”, 7th Edition,Cengage Learning.
2. Beer, F.P., Johnston, E. R. and Deworlf, J.T., 2009. “Mechanics ofMaterials”, 5th Edition, Mc Graw Hill.
3. Hibbeler, R.C., 2008. “Mechanics of Materials”, 7th Edition, PearsonPrentice Hall.
4. Ugural, A.C., 2008. “Mechanics of Materials”, John Wiley & Sons Inc.
5. Riley, W.F., Sturges, L.D., and Morris, D.H., 2007. “Mechanics ofMaterials”, 6th Edition, John Wiley & Sons Inc.

UNIVERSITI TUN HUSSEIN ONN MALAYSIAFaculty of Mechanical and Manufacturing Engineering
__________________________________________________________________APPENDICES
DEPARTMENT OF ENGINEERING MECHANICS
SOLID MECHANICS I LABORATORY
LAPORAN MAKMAL/LABORATORY REPORT
Kod M/Pelajaran/Subject Code
ENGINEERINGLABORATORY III BDA 27101
Kod & Tajuk Ujikaji/Code & Title of ExperimentKod Kursus/Course Code
Seksyen /Section
Kumpulan/Group No. K.P / I.C No.
Nama Pelajar/Name ofStudent
No. Matrik
Lecturer/Instructor/Tutor’sName
1.2.
Nama Ahli Kumpulan/Group Members
No.Matrik Penilaian / Assesment
1. Teori / Theory 10 %
2. Keputusan /Results 15 %
3. Pemerhatian/Observation 20 %
4. Pengiraan /Calculation 10 %
5. Perbincangan /Discussions 25 %
Tarikh Ujikaji /Date of Experiment
Kesimpulan /Conclusion 15 %
Tarikh Hantar /Date of Submission
Rujukan /References 5 %
JUMLAH / TOTAL 100%
COP DITERIMA/APPROVEDSTAMP
ULASAN PEMERIKSA/COMMENTS