universiti putra malaysia welfare impact of …ibms. the welfare analysis showed that the ibms...
TRANSCRIPT

UNIVERSITI PUTRA MALAYSIA
WELFARE IMPACT OF IMPROVED BOAT MODERNISATION SCHEMES (IBMS) IN PEMALANG REGENCY, CENTRAL JAVA,
INDONESIA
INDAH SUSILOWATI
FEP 1991 5

VlLFARE IMPACT OF IMPROVED BOAT KODERNISATION SCREBES ( IBKS) IN PEKALAHG REGERCY , CENTRAL JAVA ,
IRDOHISIA
BY
IRDAH SUSILOVATI
Thesis Submitted in Partial Fulf ilment of the Requirements for the Degree of Kaster of Science
in the Faculty of Economics and Kanageaent , Universiti Pertanian Kalaysia
August 1991

Dedicated to my beloved :
Papi and Ibu , brothers and sisters ,
my perpetual husband Mas-Udin , my l ovely daughter Dinda (Thol i t 2 ) and ,
S imbah 'Kung and 'Ti Pemalang
ii

ACKHOVLEDGKEHTS
I wish to thank the Dean and the entire members of the
F a c u l t y o f E c o n om i c s a n d M a n a g e m e n t f o r p r o v i d i n g t h e
opportunity and assistance during my graduate study a t UPM .
I extend my sincere gratitude to my chief supervisor , Dr .
Nik Mustapha Raj a Abdullah , for his guidance and supervision
throughout the preparation of this thesis . Despi t e his t ight
work schedule he had t ime for discussion and deliberation of
the various aspects of this study .
My heart felt appreciation and gratitude go to Dr . Roslan
A . Gha f f ar , a member of my sup e r v i s o r y c omm i t t e e f or h i s
cons truct ive insigh t o n d a t a a n a l ys i s . H i s k n ow l e d g e o f
econometric modeling has been greatly valuable especially in
the construction of the simultaneous equation model .
My deep appreciation is accorded to Prof . Dr . Mohd . Ariff
Hussein , the dean and a member of my supervisory commit tee . His
cooperat ion in providing crucial suggestions and construct ive
criticisms are invaluable to this study .
My Sincere gratitude is also extended to International
Developmen t Research Center ( IDRC ) for providing a two-years
f inancial support for me to undertake this graduate study; and
Universitas Diponegoro (UNDIP ) for granting t he study leave . My
iii

gratitudes are extended to the Dean and entire members of the
Faculty of Economics at UNDIP and to Prof . Harlan Lampe , the
former coordinator of ICLARM-AFSSRN for their encouragement in
pursuing my graduate s t udi e s . I wou l d l i ke t o e x t e n d my
appreciat ion to Prof . Dr . Sudarsono at the Economics Faculty of
G a j a h M a d a U n i v e r s i t y ( U G M ) f o r h i s u s e f u l a d v i c e a n d
inspiration i n planning the data collect ion .
My special thanks are a l s o d u e t o t h e P r o v i n c i a l and
Pemalang Fisheries Of f ices in Central Java and KUD Misoyo Sari
Pemalang which has permitted me to utilize their data for this
study . I am indebted to its of ficers namely, Mr . Tj iptono , Mr .
Kasadi , Ir . Dj oko Setiadj i , Mr . Kasdu , Ir . Ramdon , Mr . Abu
Sudj angi all of whom have helped me in data collect ion .
lowe a great deal of gratitude to Mr . Kusairi Mohd. Noh ,
his guidance in the construction of programming model using TSP
package and Dr . Khalid Abdul Rahim for his point of view on the
2SLS model . My sincere thanks are also given to Dr . Ishak Hj .
Omar , Dr . Abd . Aziz Abd . Rahman , Mr . Siow , Encik Zol , Alias ,
Kak Kam , Kak Fat i ah , Aziah , Noraini , Rosnani , Amirah , Zalilah ,
Salwana , and Encik Halwi for their cooperat ion during my stay.
My regards are due to Mr . Abd u l A z i z B a h s i r a n d Ms .
Fadzlon Yusof , of Graduate School , UPM for edit ing the thesis
format ; Mr . Rahmat Ismail and Mr . Zulki f l i Ibrahim , the provost
a n d M a n a g e r o f t h e S e v e n t h C o l l e g e f o r p r o v i d i n g g o o d
iv

at the UPH campus ; and Hr . Kapi Sudar for administering the
UPH-IDRC fellowship award . My sincere thanks are also due to my
class mates , Rodel and Devendra for helping me in the editorial
of earl i e r draf t s ; my count ry m a t e s: A m i e , V i c t o r , A r m e n ,
S a t r a , Pong , Eddy , Mumuk , Sya f r ud i n , M r . W i r a t no , a n d D r .
Myasto for t h e i r generous i t y a n d symp a t h y . My I n d on e s i an
f riends at Universit i Pertanian Malaysia are remembered for
their friendship and encouragement during the study .
Finally , my sincere appreciation goes to my husband Udin ,
and the entire members of my f amily in Semarang and Pemalang
for their forbearance , inspirat ion and understanding . My t iny
daught er Dinda whom I left back at the age of three months has
always been in my memory during the ent ire period of my s t ay in
Malaysi a . Her lost hours of love can hardly be compensated . I
preserve all my love for her . It is their perpetual love and
encour ageme n t which i n s p i r e d me t o comp l e t e my m a s t e r a l
studies .
Host o f all , t o the Almighty God, Allah , who has given me
all the things I need in life , including the opportunity to
undertake this M. S . studies
v

ACKNOWLEDGMENTS
LIST OF TABLES
LIST OF FIGURES
TABLE OF CONTENTS
· . . . . . . . . . . . . . . . . . . . . . . . . . . . . . . . . .
· . . . . . . . . . . . . . . . . . . . . . . . . . . . . . . . . . .
· . . " . . . . . . . . . . . . . . .... . . .. . . . . . . . . .
i i i
x
xi
LIST OF ABBREVIATIONS ...... " ........ " ............. Xlll
ABSTRACT . . . . . . . . . . . . . . . . . . . . . . . . . . . . . " . . . . . . . . . . . . . xiv
ABSTRAK . . . . . . . . . . . . . . . . . . . . . . . . . . . . . . . . . . . . . . " . . . . xvi
CHAPTER
I INTRODUCTION 1
The Role of Marine Fisheries in Indonesia 2
Marine Fisheries Management and Development . . . . . . . . . . . . . . . . . . . . . . . . . . . . . . 1
The Socio-Economic Conditions of Pemalang Regency • . • • • • . . • • . • . • • . • • • • • • • • • • • . • 13
Marine Fisheries Profile 1 5
Fish Market ing and Distribut ion 30
S t atement of the Research Problem 33
Obj ectives of the Study . . . . . . . . . . . . . . . . . . . . . . 37
Hypotheses of the Study . . . . . . . . . . . . . . . . . . . . . . 3 8
S igni ficance of the Study . . . . . . . . . . . . . . . . . . . . 3 8
Organisation of the Study . . . . . . . . . . . . . . . . . . . . 3 9
vi

II REVIEW OF LITERATURE . . . . . . . . . . . . . . . . . . . . . . . . .
Technological Change in Fishery
Welfare Economics and Surplus Concepts
Wel f are . . . . . . . . . . . . . . . . . . . . . . . . . . . . . . . . . .
Surplus Concepts . . . . . . . . . . . . . . . . . . . . . . . . .
Alternative Measurement f or
40
40
45
45
46
Producer 's Welf are . • • • . • • • • • • • . • . . • • • • • • • . • . • 49
Prof i t 5 0
Producer ' s Surplus and Quasi-Rent 5 1
Alternative Measurement for Consumer ' s Welf are • • • • . • • • • . . • • • . • • • • • • • • • . • • 53
Welfare Analysis of Stable Market Condition • . • • • . • . • • . . • • • • • • • • • . . • • • • • • • • • • • • • 57
Welfare Analysis of Technological Change 59
Studies on Welfare Impact and Technological Change • • • • • • • • • • • • • • • • • • • • • • • • • 6 2
I I I METHODOLOGY 71
Model Construction and Data Requirements . . . . . . . • . . . . . . . . . . . . . . . . . . • . . . . . . . 72
Model Construction
Data Requirements
Est imation Procedure and Statistical Considerations
Est imation Procedure
Statistical Considerations
Det ermination of Welf are
Data Collection
vii
72
78
84
84
89
92
95

IV
V
EMPIRICAL RESULTS AND DISCUSSION 97
Supply Model 97
Demand Model 102
Forecast ing Performance of Est imated Supply and Demand Models . . . . . . . . . • • . • . • • . . . . . 108
Estimat ion of Welf are Impact 1 1 6
Estimat ion o f Equilibrium Price and Quantity of Fish Before IBMS . • • . • . • • • • . . . 1 1 6
Supply Funct ion 1 1 6
Demand Funct ion 1 1 7
Equilibrium 118
Es timat ion of Equi librium Price and Quantity of Fish After IBMS • • • • • . . • • . . . . . 1 1 8
Supply Funct ion 119
Demand Function 1 1 9
Equ i librium 1 1 9
Est imat ion o f Producer ' s and Consumer ' s Surplus . • . • . . . . . . . . • . . • . . . . . . • 1 2 3
Before IBMS 124
After IBMS 1 2 6
SUMMARY , CONCLUSIONS AND POLICY IMPLICATIONS 1 3 2
Summary and Conclusions 1 3 2
Policy Implications and Recommendat ions 1 3 8
Limi tat ion o f the Study 141
BIBLIOGRAPHY . . . . . . . . . . . . . . . . . . . . . . . . . . . . . . . . . . . . . . 143
viii

APPENDICES
A Summary of Data Input • • • . . • • • • • . • • • • . • • • . • • 148
B Specif ication of the Marketing Units in Pemalang Regency . . . . • • • . . . • . . • . . • • • • • 151
C Test of Equality Between Coe f ficients Obtained from Dif ferent Samples Using Chow Tes t . . . • . . . • . . . • . . . • • . • • • • • . • 1 5 6
D Identif ication Status of Models
E Estimated Supply and Demand Models :
159
Method 0 • • • • . • • • • • • . . • • . . • • • • • . . • • . • • . • 162
F Run Test for the Determination of Autocorrelation in the Models
G Zero-order Correlation Matrix Coeff icients of Estimated Supply and
1 6 5
Demand Models . . . • • • . • • . • . . . . • . • . • • • • • • . . 1 1 1
H Determination of Numbers of the Principle Components ( PC ) Used in the Models Before and Af ter IBMS • . . . . . • • 114
I Derivat ion of Validity Measurement of the models . . • . • . . . . • . • . . • . • . . • . • • . . . • 1 1 6
K Glossary
J Major Types of Operated Boats and
183
Gears in Pemalang Regency . • • • • . . . • • . . . • 1 8 6
BIOGRAPHICAL SKETCH . . . . . . . . . . . . . . . . . . . . . . . . . . . . . . . 197
ix

LIST OF TABLES
Table
1 Fish Production in Indonesi a , 1970-1987 . . . . . .
2 Fishery Contribution to the Local Income During REPELITA IV (1984 to 1988) . . . . . . . . . . . .
3 Statist ics of Potential Fisheries of North Coast of Central Java Regency, 1988 . . . . . . . . . .
4 Fisheries Product ion Composit ion of Pemalang Regency During REPELITA IV (1984 to 1988) . . . . . .
5 Composit ion of Fisheries Export of Pemalang Regency from 1986 to 1989
6 Statist ics of Pot ent ial Fisheries of
Page
6
16
17
19
22
Pemalang Regency as of 1989 • • . . . • • • • • . . . . . . . . 25
7 Code Names and Definit ions of the
8
9
10
11
Standardised Variables Used in the Models 74
Estimated Supply Model . . . . . . . . . . . . . . . . . . . . . . . 98
Es timated Demand Model . . . . . . . . . . . . . . . . . . . . . . . 104
Summary of Forecas ting Performance of Estimated Models . . . . . . . . . . . . . . . . . . . . . . . . . . . . . 109
Summary of Wel f are Est imation Results 127
x

LIST OF FIGURES
Figure
1
2
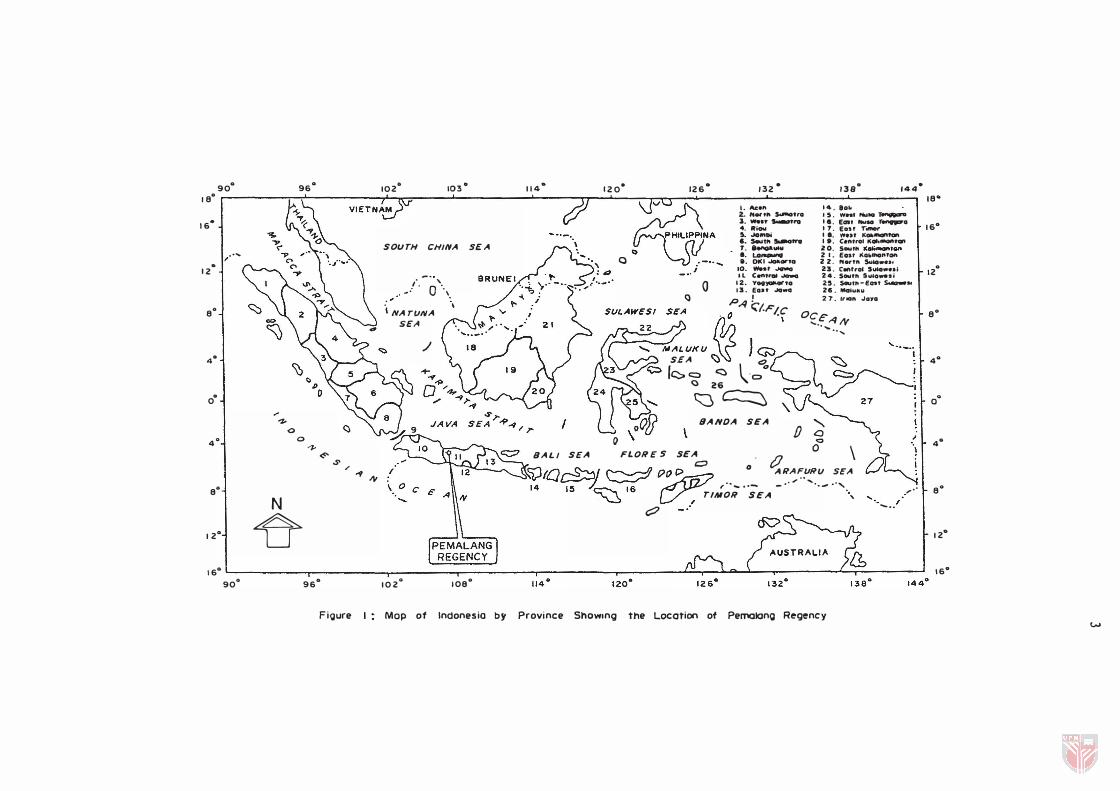
Map of Indonesia by Province Showing the Locat ion of Pemalang Regency . . . • . . . . . . . • . . . . .
Map of Pemalang Regency Showing the Locat ion of the Five fish landing
3 Fisheries Product ion Composi t ion of
Page
3
14
Pemalang Regency (1984-1988) • . . . • • • • . . . . . . . • 20
4 Composi t ion of Fisheries Export of Pemalang Regency (1986-1990) . . . . • • . • • • • . . . • • • 23
5 Structure of Fish Marketing in Pemalang Regency . . . . . . . • • . . . . . . • . . . . . . . . • • . . . 32
6 Sustainable Yield Curve for the Unregulated Fishery • . . . . . . • • . . . . . . . . . . • • . • . . . 42
7 Comparat ive Statistics : Change in Product i vi ty . • . . . . • • . . . . • . • • . • . • . . . • • . . • . • 43
8 The Demand Curve
9 Consumer ' s and Producer ' s Surplus
10 The Level of Production for the Firm
11 Consumer ' s Surplus, Compensated Variat ion
47
48
49
and Equivalent Variat ion • . . . . . . . . . • . • . . . . . . . . 55
12
13
Producer ' s Surplus with Dif f erent Intercept Values of Supply Funct ion
Welfare Changes Obtained from Technological Improvement
14 Actual and Predicted Supply Models
58
61
Before the IBMS . . . . . . . . . . . . . . . . . • . • . . . . • . . . . . 112
Xl

1 5 Actual and Predicted Supply Models Af ter the IBMS . • • • • • . . . • . • . • • . • . • • . . . . . . . . . . •
1 6 Actual and Predicted Demand Models Before the IBMS . . • • • . • • . • . . . . • • . • • • • • • • • • • • • •
1 7 Actual and Predicted Demand Models Af ter the IBMS . . . . . .. . . . . . . . . . . . . . . . . . . . . . . . . .
18 Structural Changes of Est imated
113
114
115
Supply and Demand ot fish In the Market . • . . . . . 121
xii

CS
CV
EEZ
EV
FYDP
GI
GRDP
GT
HP
IBMS
KIK
KMKP
MEY
MSY
mt
NSW
PC
PERDA
PS
RCP
IBMS
TPI
LIST or ABBREVIATIONS
Consumers ' Surplus
Compensating Variation
Exclusive Economic Zone
Equivalent Variation
Five Years Development Plans (in bahasa Indonesia
is called as REPELITA)
Geometric Index
Gross Regional Domestic Product
Gross Ton
Horse Power
Improved Boat Modernisation Schemes
Kredit Invest asi Kecil ( small-scale credit )
Kredit Modal Kerja Permanen ( permanent
working capita credi t )
Maximum Economic Yields
Maximum Sustainable Yields
Metric Ton
Net Social Welfare/ loss
Principle Component
Peraturan Daerah ( local regulation)
Producers ' Surplus
Rural Credit Proj ect
Improved Boat Modernisation Schemes
Tempat Pele1angan Ikan ( f ish landing and
f ish auction)
xiii

A b s t r a c t o f t h e s i s s u b m i t t e d t o t h e S e n a t e o f t h e Universi t i Per t an i an Mal ays i a i n p a r t i a l f u l f i l m e n t o f t h e requirement s for the degree o f Master o f Science.
WELFARE IKP1CT OF IMPROVED BOAT MODERNISATION SCREMES ( IBKS) IN PEKALlBG REGENCY , CENTRAL JAVA,
INDONESIA
by
INDAR SUSlLOVATI
August 1991
Supervisor : Dr . Nik Mustapha Raj a Abdullah
Faculty Economics and Management
The overall obj ect ive of this study is to examine the
wel f are impac t of the IBMS progr amme i n P e m a l an g R e g e n c y
Central Java , Indonesia . T o achieve this obj ective , supply and
demand mod e l s f or f is h were es t i m a t e d . T h e' s i mu l t a n e o u s
equ a t ion model cons i s t s of supp l y , d e m a n d , a n d i d e.n t i t y
equations . The Two Stage Least Square ( 2 SLS) was utilized to
estimate the model using time series quarterly data f rom 1 9 7 6 . 2
to 1 9 90 . 2 . All the key variables in the model were found to be
c o n s i s t e n t w i t h p o s t u l a t e d b e h a v i o u r a n d t h e o r e t i c a l
expectat ions .
All variables specified in the supply model had expected
signs and signif icant except for the f i shing effor t and the
probability to catch f ish . As expected the supply funct ion was
xiv

f ound to be positively related with respect to its own price .
However , its price elasticity in pre-IBMS is greater �0 . 224 )
than in post-IBMS ( 0 . 1 2 6 ) . This shows that the rate of increase
in f ish production f rom additional input is diminishing af ter
IBMS as evidence to the existence of overexploi tat ion of the
resource in the study area .
All of the signs of est imated parameters in the demand
model were consistent with the theory except for the lagged
p r i c e of f ish variabl e . Resu l t s a l s o s howed t h a t a l l o f
coeff icient parameters were greater than half o f their s tandard
errors except for the intercept and lagged quantity demand at
pre-ISMS . Furthermore , the price of substitute goods and income
were found to be the major determinants of the quantity of fish
demanded . The elasticity of f ish demanded with respect to its
own price is greater ( - 0 . 6 7 6 ) at pos t-ISMS than at pre-ISMS ( -
0 . 2 9 5 ) . However , the income elasticity of demand for f i sp was
found to be more elastic before ( 0 . 740) than af ter ( 0 . 580 )
IBMS .
The wel fare analysis showed that the IBMS programme was
ineffective . The overall impact showed that welfare loss to the
society was 142 . 86 percent from the original condi tion . The
bigge s t loss ( two-thi r d ) was i n c u r r e d by c o n sume r s a n d t h e
remainder was incurred b y producers .
xv
Abstrak thesis yang dikemukakan kepada Senat Universiti Pertanian Kalaysia sebagai memenuhi sebahagian daripada syarat dikurniakan Ijazah Sarjana Sains .
Dsn DB1JIIWf DlRIPlDA PEKBAIIWf SKIK PIIIODElfAH BOT DI RIGElfSI PIllALDG , JAVA TElfGAB ,
IHDORISIA
oleh
Indah Sus ilowati
Ogos 1991
Penyelia Dr . Nik Mustapha Raja Abdullah
Fakulti Ekonomi dan Pengurusan
Objekt i f umum kajian i n i i a l ah u n t u k m e l i h a t k e s a n
kebajikan p rogram IBKS di w i l ayah P e ma l an g , J a w a Tengah ,
I ndone s i a . Un tuk mencapai obje k t i f i n i mod e l p e n a w a r an d a n
permint aan u n t u k ikan t e l ah d i a n gg a r k a n . Mod e l p e r s amaan
serentak t e l ah dibentuk yang t e r d i r i d a r i p ad a p e r s am a a n
penawaran , permintaan d an persamaan ident i t i . Kaedah Kuasadua
Terkecil Dua Peringkat ( 2SLS) digunakan untuk menganggarkan
model di atas dengan menggunakan data siri masa suku tahun dari
tahun 1 91 6 . 2 hingga 1 9 90 . 2 . Semua variabel penting di dalam
model didapati konsisten dengan gelagat sebenar dan jangkaan
daripada teori.
xvi

Kesemua variabel di d a l am mod e l ini mempunyai t an d a a n
s eperti yang dijangkakan d a n signifi k a n k e cu a l i v ar i a b e l
keupayaan perikanan dan kebarangkalian untuk menangkap ikan .
S eperti mana yang dijangkakan , m o d e l p e n aw a r a n did a p a t i
berhubung secara positif dengan harga ikan. Walau bagaimanapun
keanjalan harga bagi masa sebelum IBMS ( 0 . 224 ) adalah lebih
besar daripada sel epas IBMS ( 0 . 1 2 6 ) . I n i menunju k k a n Kad a r
pertambahan d i dalam pengeluaran ikan daripada penambahan input
adalah menurun selepas IBMS . Penemuan ini membuktikan keadaan
eksploitasi sumber yang berlebihan di kawasan kajian .
Semua parameter yang dianggarkan di dalam model permintaan
memberikan tandaan yang konsisten dengan teori kecuali variabel
harga ikan untuk jangka masa lepas . Keputusan kajian juga
menunjukkan semua angkali parameter adalah lebih besar daripada
setengah sisihan piawainya kecuali bagi intersep dan kuantiti
permintaan di masa lepas untuk masa sebelum IBMS . Sementara
itu , harga barangan pengganti dan pendapatan merupakan penentu
utama bagi kuan titi ikan yang dimin t a . K e anja l a n h a r g a
permintaan ikan didapati lebih besar ( -0 . 67 6 ) pada masa selepas
I BM S b e r b a n di n g d e n g an s e b e l u m I B M S ( -0 . 2 95) . W a l au
bagaimanapun , keanjalan pendapatan permintaan ikan didapati
l ebih anjal pada sebelum ( 0 . 7 4 0 ) b e r b anding d e n g a n s e l e p a s
( 0 . 580 ) IBMS .
xvii

Analisis kebajikan menunjukkan program IBMS adalah t idak
efektif . Kesan keseluruhan menunjukkan kerugian kebajikan ke
at as masyarakat adalah 142 . 86 peratus daripada keadaan asal .
Kerugian paling besar (iaitu dua pertiga) adalah ditanggung
oleh pengguna manakala selebihnya oleh pengeluar .
xviii

CHAPTER I
INTRODUCTION
Agri cul ture p l ays an impor t an t r o l e i n t h e I nd on e s i a n
economy. I t contributed 24 . 09 percent t o Gross Domestic Product
(GDP) and 5 5 . 80 percent to employment in 1 9 8 8 ( BPS , 1 9 8 9 ) .
Among the agricultural sub-sectors , the f i shery contributed
1.70 percent of the total GDP . Nonetheless the number of people
involved in the f isheries sector reached 1 . 3 million people
excluding those engage in the p r o c e s s i n g p l a n t i n 1 9 8 6
(Martosubroto, 1 9 87 ) .
Fish is the primary source of animal protein . I t provides
67 percent of animal protein of the total Indonesian diet ,
whereas meat , milk and egg contribute 2 1 , 7 , and 5 percent
respectively (Naamin , 1 9 8 7 ) . Moreover , it is relatively cheaper
compared to other source of animal protein . In 1 9 8 4 the annual
f ish consumpt ion was estimated to be about 1 5 kg per capita per
year but f ell short of the national target of 1 8 Kg .
The Indonesian archipelagic and territorial sea covers an
area o f about 3 . 1 million sq km , excluding 2 . 7 million sq km
area of marine water which is under the Exclusive Economic Zone
( EEZ ) ( Anon , 1 9 83 ) . Ther e f or e , I n d on e s i a i s c on s i d e r e d a s
having a high potential i n water resources with various stock
1

2
o f f i s h a n d o t h e r m a r i n e a n im a l s ( C o s t a , 1 9 8 8 ) . T h e
geographical location o f Indonesia is shown in Figure 1 .
The Role of Karine Fisheries in Indonesia
Like many other developing countries , Indonesia also has
National Development Plans , embodied under REPELITA . The first
of these plans known as the First Five Year Development Plan
(FYDP I ) , covered the period between 1 9 6 9 to 1 9 7 3 . This was
then followed by FYDP II ( 1974-197 8 ) , FYDP I I I ( 1 9 7 9-1983 ) ,
FYDP IV ( 1 984-1 9 8 8 ) , and to the present FYDP V ( 1989-1993 ) .
These p lans consist of developm e n t programm e s a n d proj e c t s
w h i c h i n c l u d e i n f r a s t ru c t ur a l a n d n o n - i n f r a s t ru c t ur a l
developments .
I n addition , the obj e c tives o f f i s h ery d e v e l opment
strategy underlined in FYDP V are as follows :
( 1 ) To increase production i n t erms o f quan t i t y a n d
quality i n order to fulfill t h e f ood , nutrition , raw material
and or export requirements ,
( 2 ) To increase the productivity of fisheries and value
added activities and fishermen income ,
(3 ) To extend the productive employment opportunity in the
fisheries and to support the regional development , and
( 4 ) To promot e resource manag e m e n t and a c hi e v e b e t t e r
control of resource utilization throughout the country .
96° 9 0° I fl
A9va I 102
0 1030 114
° /2 0
· 126° /32
· /38" /44"
leo h " 7 Y I
Q • PH"�:�_
I. Ace" a. If.,.'" s.ar-otro 1 . ... t' �ro 4. Riov 14. 8D" 15. wn. Hu. T� I •. East Nu .. 1"ef'art9aro • ,. East T"1IftOf' 16°
.....
, 12
°
eO
4"
0"
-z,. .:> 4°
o ".. � oS' "
SOIJTH CHINA
/'-" , �: 0 \ '\ NArlJNA
SEA
,/
-fN .
SEA
, o
Q
!l. .JQmDi .. _ ... _ .... r._ ..... •. l.a_ •• Df(1 ........ '0 10. _.t ..IeWo • L Central..towel 12. y"",-"a 13. Eo.' .....
P I A (;/'F'/C
I •. W.,,' KOI. .... ton 1.0 ( .... trot K ....... . 2 O. Sou'h 1iCott, .... "on 2 I. EOSf J(ollmcu"Oft 2 2. "or'n SuIo ..... 23. CIIf\,rOl 5uto ••• i 24. South ''''0 ..... 2'. SOufft-Eost �s. 28. Moluku 2.,. ,rlOn ..Iayo
. () . �ALIJKIJ fli?
SEA � C
OCeAN ...... ..... . . ..... "-
'� I� <:::I � �'c:/' <:) 26 C0�
SANDA SEA � Q , \ f) �
SALI SEA FLORE S SEA 0 \ CJ ' tJ /)
1 I
,
eO \ 0 �/Q��� p� , .. _.�_ ����.IJ::�_.��
A C-/I � V, TIMOR SEA ", ,.'
N 1 2 ° ft '6° I
.... c? , / -..
leo
16°
12°
eO
4°
o·
4°
eO
12"
16 " L __ � ____ ����� __ � __ �(�-�D�����, 9 0° 96° 102° 144° 10e
O 114° 120° 126° 132
0 13e o
FiQure Mop of Indonesia by Province ShOWing the Location of Pemolong Regency w

4
Real i z ing the Nat ional impo r t a n c e o f t h i s s e c t o r , t h e
gove rnmen t h a s s et a t arget in R E P E L I TA V ( 1 9 8 9 - 1 9 9 3 ) 1 t o
increase f isheries production by 5 . 78 percent per annum
( from 3 , 007 . 9 thousand ton in 1 9 8 9 to 3 , 765 . 7 thousand ton in
1 9 93) . The highest estimated growth rate however is assumed to
be recorded by culture f i sheries at a rate of 1 7 . 12 percent per
annum , while the lowest is to be achieved by inland fishery at
2 percent per annum.
In addition , the objectives aboved are considered to be
the goals of the long-term planning strategy . To fulfil these
objectives , a range of government policies and programmes have
been implemented with the aim at providing enough nutrition to
the society a s well as increa s i ng i n come and e m p l oym e n t
oppor t un i t i e s t o t h e small- s c a l e f i s h e r me n . I m p r o v e d B o a t
Modernisation Schemes ( IBMS ) have been part o f this programmes ,
which among others , have been launched to benef i t the small-
scale fishermen who have been playing a significant role in
enhancing fishery product ion.
Since the second REPELITA ( 1974-19 7 9 ) the government has
provided additional fishery infrastructures such as landing
s i t e , f i s h i n g a n d p r o c e s s i n g f a c i l i t i e s . To d a t e , t h e
government has built 24 fishing ports and 149 landing si tes
which are scattered along the coastal areas , especially those
1 Bina P rogram i s sues , Di rec t o r a t e G e n e r a l of F i s h e r y . 1 9 8 8

5
in the vicinity of potential fishing grou n d s a r ound J a v a ,
Suma t r a , Kaliman t an and Sulaw e s i . D u r ing t hi s p e r i o d , t h e
government has also established six fishing companies , two of
which deal t w i t h shrimp fish i ng a n d four o t h e r w i t h t u n a
fishing. Besides undertaking fishing business , they also serve
as development agencies to help small-scale fishermen to market
their c a t c h . All of these effo r t s a r e b a s ic a l ly a i m e d a t
uplifting the economic well being of the fishermen community.
Table 1 shows the t rend in fis h e r i e s p r o duc t i o n in
Indonesia from 1970-1987 . In 1987 , total fish production was
about 2 . 67 million mt , with the largest production coming from
North Coast Java ( 0 . 76 million mt ) and Malacca Straits ( 0 . 47
million mt ) . In terms of share of production by sector , the
marine and inland fisheries contributed 2 . 02 million mt ( 75 . 54
percent ) and 0 . 65 million mt ( 24 . 46 percent ) , respectively .
This clearly indica t e s the predomina n c e of t h e m a r i n e s ub
sector in Indonesian fisheries .
The estimated potential product ion of marine fishery in
Indonesian territory is about 4 . 5 million ton per year . ( with
excluding the EEZ amoun t ing to 2 . 1 m i l l i on ton p e r y e a r )
Nonetheless , this potential seems to be primarily dominated by
sma l l - s c a l e oper a t ions , whi c h a r e t yp i c a l of I n do n e s i a n
fisheries , which are dictated by low technical input as well
a s p r o d u c t i v i t y a n d i n c om e . H o w e v e r , t h e p o t e n t i a l
cont ribut ion of small-scale fishe r i e s t o t h e N a t i o n a l fish
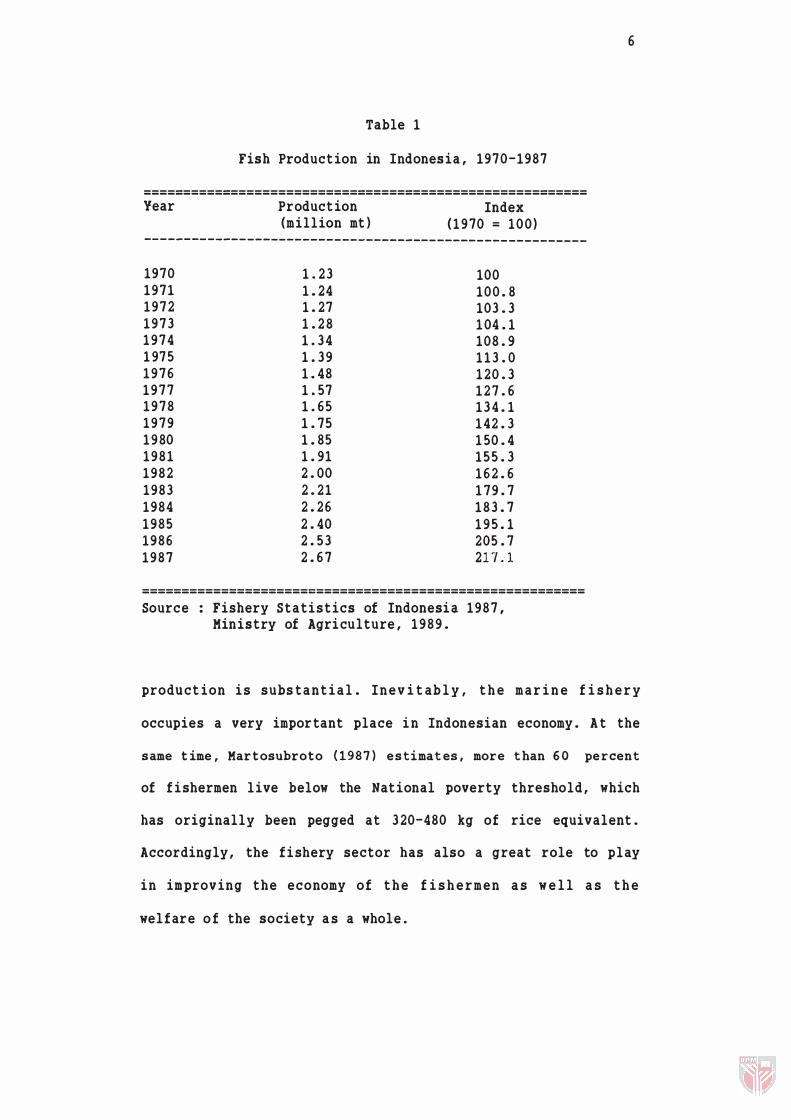
Table 1
Fish Product ion in Indonesia, 1970-1987
======================================================== Year Product ion
(million mt ) Index
( 1 970 = 100) --------------------------------------------------------
1970 1971 1972 1 9 7 3 1974 1 97 5 1 9 7 6 1 9 7 7 1 9 7 8 1979 1 9 80 1981 1982 1983 1984 1985 1986 1987
1 . 23 1 . 24 1 . 27 1 . 2 8 1 . 34 1 . 39 1 . 48 1.57 1 . 65 1 . 75 1 . 85 1 . 91 2 . 00 2 . 21 2 . 26 2 . 40 2 . 53 2 . 6 7
100 100 . 8 103 . 3 1 04 . 1 108 . 9 1 1 3 . 0 1 20 . 3 1 2 7 . 6 1 3 4 . 1 1 42 . 3 1 50 . 4 1 5 5 . 3 1 6 2 . 6 1 79 . 7 1 8 3 . 7 1 9 5 . 1 205 . 7 217 .1
=====================c================================== Source : Fishery Statistics of Indonesia 1987 ,
Ministry of Agriculture, 1 9 8 9 .
6
product ion is subs tant i a l . I n ev i t ab l y , t h e m a r i n e f i s h e r y
occupies a very important place i n Indonesian economy . A t the
same t ime, Mar tosubroto (1987) estimates, more than 60 percent
of f ishermen live below the National poverty threshold, which
has originally been pegged at 3 20-480 kg of rice equivalent .
Accordingly, the fishery sector has also a great role to play
in improving the economy of t h e f i s h e rmen a s w e l l a s t h e
welfare o f the society a s a whole.