universiti putra malaysia wave spectra and...
TRANSCRIPT

UNIVERSITI PUTRA MALAYSIA
WAVE SPECTRA AND SHORELINE CHANGE STUDIES BY REMOTE SENSING
MAGED MAHMOUD MARGHANY
FSAS 2000 1
WA VE SPECTRA AND SHORELINE CHANGE STUDIES BY REMOTE SENSING
By
MAGED MAHMOUD MARGHANY
Thesis Submitted in Fulfilment of the Requirements for the Degree of Doctor of Philosophy in the Faculty of Science and Environmental Studies
Universiti Putra Malaysia
February 2000
Abstract of the thesis presented to the Senate ofUniveristi Putra Malaysia in fulfilment of the requirements for the degree of Doctor of Philosophy.
WAVE SPECTRA AND SHORELINE CHANGE STUDIES BY REMOTE SENSING
By
MAGED MAHMOUD MARGHANY
February 2000
Chairman: Dr. Zelina Zaiton Ibrahim
Faculty: Science and Environmental Studies
Waves play an important role in shoreline configuration. The wave pattern can
induce erosion and sedimentation. Wave pattern studies using radar imagery have a
potential application for coastal areas. This study investigates if the shoreline change
can be modeled by wave spectra information extracted from radar images. The study
area is Kuala Terengganu, located on the East Coast of Peninsular Malaysia.
Mathematical modeling was carried out to extract wave spectra from radar
(ERS-l and AIRSARfTOPSAR) data. The two-dimension Fast Fourier Transform (2-
DFFI) was applied over selected windows on radar data. The results of the transform
were wavelength and power spectra. The quasi-linear modulation model was used to
map the radar wave spectra to ground-truth wave spectra to obtain the actual wave
ii

spectra. The result showed that there was a significant difference between the quasi
linear model and the velocity bunching model. It suggests that the AIRSARffOPSAR
data are better than ERS-l data for wave spectra investigation. This is probably because
the Doppler shift effects are smaller in AIRSARffOPSAR data than in ERS-ldata.
The wave spectra information was then used to predict shoreline change based
on wave refraction and sediment transport. Both the wave spectra pattern derived from
radar data and the wave spectra change derived from ship observations, were used to
model the shoreline sedimentation and erosion pattern. Actual shoreline change was
estimated from remotely sensed data by using vectorization, overlaying techniques and
field measurements. The estimated shoreline change gave a rate of erosion along
Chendering of 3.5 m/year between 1959 and 1994. The rate of erosion was 1 m/year
along the Sultan Mahmud Airport shoreline between 1970 and 1996. The areas of
erosion are similar to observations made in the field. The predicted shoreline change,
from wave modeling, gave a rate of erosion from Batu Burok to Batu Rakit of less than
2 m/year and a rate of erosion to the south of Chendering of 4 m/year. The predicted and
estimated result showed that the shoreline south of Chendering was always dominated
by erosion throughout the year. However, overall, the beach changes along the
Terengganu shoreline studied was in a state of equilibrium. The periods of erosion were
balanced by periods of accretion.
In conclusion, radar data (ERS-I and AIRSARffOPSAR) can be used to extract
wave spectra for shoreline change modeling. Verification can be done with the
assistance of other sources of data such as ship observation, ground truth data, aerial
photography, other remotely sensed data, beach profiling, and sediment sampling. The
iii

combination of classical techniques, predictive modeling methods, and remote sensing
technology as used in this study allows for better understanding of the interaction
between ocean wave and shoreline change over a larger spatial scale and in a shorter
time frame.
iv
Abstrak tesis yang di kemukakan kepada Senat Universiti Putra Malaysia sebagi memenuhi syarat untuk ijazah Doktor Falsafah
GELOMBANG-GELOMBANG DAN KESAN GELOMBANG OLEH KAWALAN JAUH
OIeh
MAGED MAHMOUD MARGHANY
Februari 2000
Pengerusi : Dr. Zelina Zaiton Ibrahim
Fakulti : Sains Alam dan Kajian Sekitar
Gelombang-gelombang mempunyai peranan penting di dalam penyusunan garis
pantai. Bentuk gelombang dapat menyebabkan hakisan dan pemendapan. Bentuk
gelombang dikaj i mnggunakan gambaran-gambaran radar yang berpotensi kepada hal
mengenakan kawasan pantai. Kajian ini menyelidiki perubahan garisan pantai dapat
menjadi model melalui penerangan gelombang spektra diperoleh daripada gambar radar.
Kawasa kajian ini ialah Kuala Trengganu, Pantai Timur Semenanjung Malaysia.
Model matematika didapati untuk memperoleh gelombang spektra daripada data
radar (ERS-l dan AIRSARffOPSAR). Dua dimensi mengubah bentuk data fourier (2-
v
DFFT) telah diguna seluruh jendela dipilih oleh data radar. Hasil daripada mengubah
bentuk ialah panjang gelombang dan spektra gelombang. Garis quasi model perubah
digunakan untuk memetakan radar spektra gelombang kepada tanah sebenar untuk
memperoleh spektra gelombang sebenar. Keputusan menunjukkan bahawa terdapat
perbezaan signifikan diantara model keeepatan gabungan. Ini meneadangkan bahawa
data AIRSARITOPSAR adalah lebih baik daripada data penyelidikan gelombang
spektra. Hal ini m}.mgkin disebabkan oleh kesan pertukaran Doppler lebih keeil dalam
data AIRSARITOPSAR berbanding dengan data ERS-l.
Maklumat panjang gelombang telah diguna untuk meramalkan perubahan asas
garis pantai pada pembiasan gelombang dan pengangkutan endapan. Kedua pol a spektra
gelombang didapat daripada data radar dan perubahan spektra gel om bang didapat
daripada peninjauan kapal laut, model pemendapan garis pantai dan pola hakisan. Garis
pantai sebenar berubah dianggar daripada data indera jauh dengan menggunakan vektor,
teknik penutupan dan ukuran tapak. Anggaran perubahan garis pantai memberi purata
hakisan sepanjang Chendering adalah 3.5 m1tahun diantara tahun 1 959 dan 1 994. Purata
hakisan ialah 1 m/tahun sepanjang garis pantai lapangan terbang Sultan Mahmod
diantara tahun 1 970 dan 1996. Kawasan hakisan serupa kepada pengawasan dibuatdi
tapak. Peramalan perubahan garis pantai, daripada model gelombang, memberi purata
hakisan daripada Batu Burok kepada Batu Rakit lebih keeil daripada 2 m/tahun dan
purata hakisan Chendering Selatan adalah 4 m1tahun. Keputusan peramalan dan
anggaran menunjukkan bahawa garis pantai Chendering Selatan selalu mempengaruhi
hakisan sepanjang tahun. Bagaimanapun, seeara keseluruhan kajian, perubahan pantai
vi
sepanjang garis pantai Terengganu dikaji dalam bahagian keseimbangan. Masa hakisan
adalah seimbang dengan masa permukaan baru.
Kesimpulan, data radar (ERS-I dan AIRSARffOPSAR) dapat diguna untuk
memperoleh spelctra gelombang bagi perubahan model garis pantai. Vertikasi dapat
dibuat dengan bantuan sumber data lain seperti peninjauan kapal laut, data sebenar
bumi, fotograf udara, data indera jauhm tampang muka pantai, dan contoh endapan.
Gabungan teknik terbaik, menganggar kaedah model, dan teknologi kapal angkasa
(gambar radar) diguna dalam kajian ini dibenarkan bagi pemahaman lebih baik pada
interaksi diantara gelombang samudera dan perubahan garis pantai seluruh skala
angkasa lebih besar dan dalam bingkai masa lebih pendek.
vii

ACKNOWLEDGEMENTS
I would like to thank Allah Almighty for enabling me to further my study to
Ph.D degree and to complete this dissertation. Everything has been done by the action
of Allah who has given patience to me to strive for my goal.
In the course of completing this dissertation, I have seeked the assistance of
several individuals. They have the contributed significantly to the success of my
project. I would like to thank them and mention their names here. First, I would like, to
thank Dr Zelina Zation Ibrahim who gave me a lot of support and who has mooted the
idea for this research. I am very indebted to her. Without her help to get the funding for
this project, this study would never be completed. I would also like to express my
gratitude and thanks to the committee member, Professor Dr. Mohd. Ibrahim Hj.
Mohamed for his sincere support. Without Professor Dr. Mohd. constructive comments
and help, I woud not be able to obtain the fund for this project. I would also like to
express my gratitude to Dr. Shattri Mansor from Faculty of Engineering for his support
in the study of radar imagery data and software for image processing.
I would also like to thank the Head of Department of Environmental Studies Dr.
Ramadzani Abdullah who provided the funding for this project.
Subsequently, I would like to thank the center of remote sensing at Univeristi
Technologi Malaysia, especially, Professor Dr . Ibrahim Seeni Mohd., Professor Dr
viii

Mazlan Hashim, and Mr. Samsudin Ahmad for their support in obtaining ERS-l data
and their assistance in image processing.
Last but not least, I am very grateful to Mr. Zakari Gazali and Mr. Mohd. Zul
Kafli for their support and assistance.
ix

I certify that an Examination Committee met on 10 February, 2000 to conduct the final examination of Maged Mahmoud Marghany on his Doctor of Philosophy thesis entitled "Wave Spectra and Shoreline Change Studies by Remote Sensing" in accordance with Universiti Pertanian Malaysia (Higher Degree) Act 1 980 and Universiti Pertanian Malaysia (Higher Degree) Requlations 1 981 . The Committee recommends that the candidate be awarded the relevant degree. Members of the Eximination Committee are as follows:
ZELINA BINTI ZAITON IBRAHIM, PhD. Lecturer F caulty of Science and Environmental Studies Universiti Pertanian Malaysia (Chairman)
MOHD. IBRAHIM Hj. MOHAMED, PhD. Professor Fcaulty of Science and Environmental Studies Universiti Pertanian Malaysia (Member)
SHATTRI BIN MANS OR, PhD. Associate Professor Faculty of Engineering Universiti Pertanian Malaysia (Member)
MOHD. IBRAHIM SEENI, PhD. Professor Faculty of Geoinformation Science and Engineering Universiti Teknologi Malaysia (External Examiner)
• GHAZALI MOHYIDIN, Ph.D. Pro essorlDeputy Dean of Graudate School
Date: 2 MAR 2000
x

This thesis was submitted to the Senate of the universiti Putra Malaysia and was accepted as fulfillment of the requirements for the degree of Doctor of Philosophy.
xi
KAMIS A WANG, Ph.D. Associate Professor, Dean of Graduate School, Universiti Putra Malaysia
11M AY 2000
DECLARATION
I hereby declare that the thesis is based on my orginal work except for quotations and citations which have been duly acknowledged. I also declare that it has not been previously or concurrently submitted for any other degree at UPM or other institutions.
xii
(MAG ED MAHMOUD MARGHANY)
Date: \ I 3 { 20 <:> b
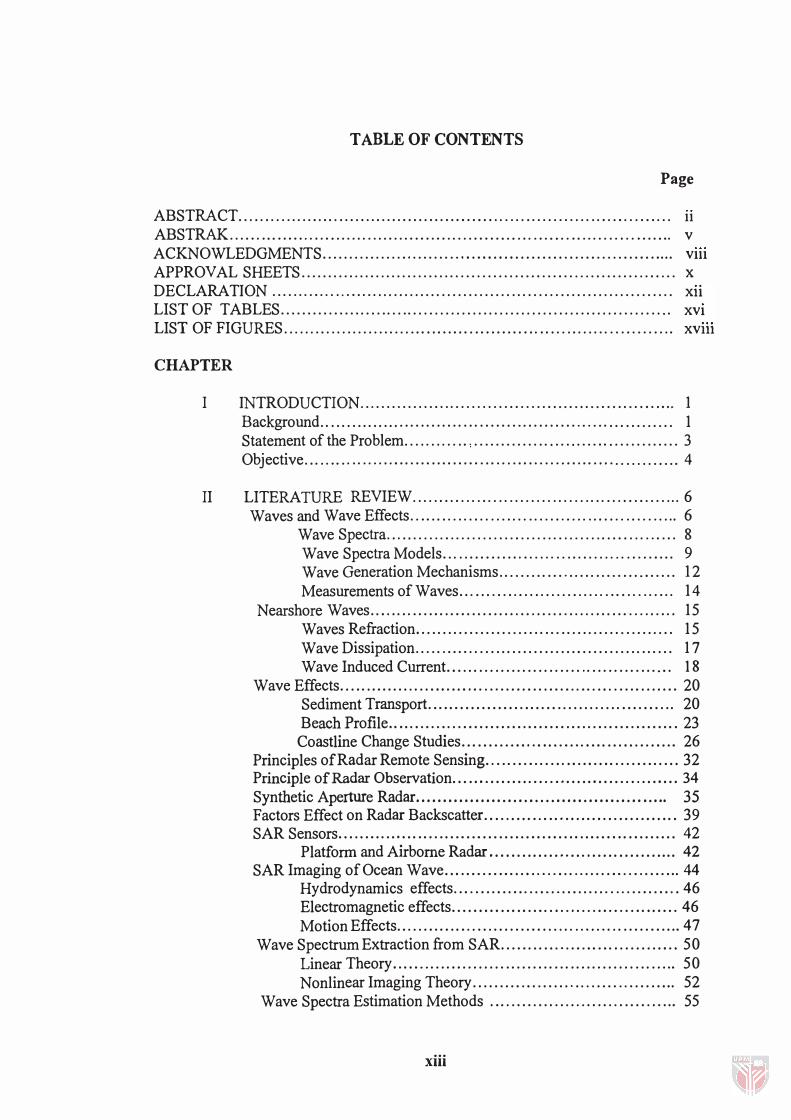
TABLE OF CONTENTS
Page
ABSTRACT . .. . . . . . . ........ . . . ... . . . . . . . . . . . . . . . . . . . ........ . ... . . . . . . . . . . .... . .... . ....... 11 ABSTRAK . . . . . . . . . . . . . . . . . . . . . . . . . . . . . . . . . . . . . . . . . . . . . . . . . . . . . . . . . . . . . . . . . . . . . . . . . . . . . . . . . .. v ACKNOWLEDGMENTS.............................................................. .... VIlI APPROVAL SHEETS ...................................................................... x DECLARATION . . ... . . . . ... . . . . . . . . ... ......... ............. ... ...... .............. .... ... XlI LIST OF TABLES............... ..... .... ............... .............................. .... XVI LIST OF FIGURES .... .. . . . ... . . . . . . .... . .. . . . . . . . . . . .. . . . . . . . . . . . . . . . . . . .. .. . . .. . ... . ... . . XVIll
CHAPTER
I INTRODUCTION.................................... . . . . .. . ... . . . . .. . . . . . . . 1 Background. . . . . . . . . . . . . . . . . . . . . . . . . . . . . . . . . . . . . . . . . . . . . . . . . . . . . . . . . . . . . . . . . . 1 Statement of the Problem .......... . . , . . . . . . . . . . . . . . .. . . .. . . . . . .. . . . . . . . . . . . 3 Objective ... .. . . .. . . . . . . . . .. . . . . .. . .. . . . . . . . . ..... . . . . . . . .... . . . . . .. . .. .... . ... 4
II LITERATURE REVIEW ..... . .... ... . . . .......... ... . . . . . .. ... . . .... . .... 6 Waves and Wave Effects .. . . . . . . .... . . . . . . . . .. . . .. . . . . . . . . . .. . . . . . .. . .. ... 6
Wave Spectra . . . . . ... . . . . .............. ... . . . . . .. . . . . . . . . . . ... . . . .. 8 Wave Spectra Models . .. . . . .. . . . . . . . .. . . . . . . . . . . . . . .. . . . . . ... . . . 9 Wave Generation Mechanisms. . . . . . . . . . . . . . . . . . . . . . . . . . . . . . . . . 12 Measurements of Waves ... . . . ....... . . . . . . . . .... . . . . . ... . . . . . .. 14
Nearshore Waves . . .... . .. . . . .. . ..... . ... . ...... . .. . . . . .... . . . ... . . .. . . . . . 15 Waves Refraction. . . . . . . . . . . . . . . . . . . . . . . . . . . . . . . . . . . . . . . . . . . . . . . . 15 Wave Dissipation... . . ... . . .. . . . . . . . . . . . . . . . . . . . . . . . . . . . . . . . . . . . . 17 Wave Induced Current.... . . . . . . . . . . . . . . . . . . . . . .. . . . . . . . . . . . . .. . 1 8
Wave Effects .... . . ........ . . . ... . . .. . . . . . . . . . . . .. . . .. . .. . . . .. ... . . . . . ... ... 20 Sediment Transport . ... . , . . . . . . . . . . . . . . . . . . . . . . . . . . . . . . . . . . . . . . . . 20 Beach Profile. .. . . . . . . . . . . . . . . . . . . . . . . . . . . . . . . . . . . . . . . . . . . . . . . . . . . . 23
Coastline Change Studies . .. . . . . . . ... . . ... . . . . . .. . .. . ... . . . . .. . . . 26 Principles of Radar Remote Sensing .. . . . . . . . . . .. .. ..... . ... . ........ . . . 32 Principle of Radar Observation .. . ... ....... . . .. . . . ... . ...... . ..... ...... 34 Synfuetic Aperture Radar.......................................... ..... 35 Factors Effect on Radar Backscatter ... . . .. ... . .. . . ... .. .. . . . .. . . . .. ... . 39 SAR Sensors . . .. ... . . . . . . . . . .. . . . ... . . . . . . . . . . . ... ... .... . .. . ..... .. . . . . . . . 42
Platform and Airborne Radar..... . . . . .. . . .. . .. . . . . . . . . . ... . .... 42 SAR Imaging of Ocean Wave . .. . . ....... . .... . . . . . . . . . . . . . . . ..... . . ..... 44
Hydrodynamics effects . . . . ... . . ... ... . . . . . .. . . . . . . ..... . . .... . . . 46 Electromagnetic effects .. . ...... . .. ... . . ... .. . ...... . .. .... .... . . 46 Motion Effects ....... . ....... . . . . . . . . . . . ..... . . .. . . . . .. . . . . . ....... 47
Wave Spectrum Extraction from SAR . . . . .. . .. .. . .... . . . .. . ....... .. . . 50 Linear Theory. . . . . . . . . . . . . . . . . . . . . . . . . . . . . . . . . . . . . . . . . . . . . . . . . . . . . 50 Nonlinear Imaging Theory . . . . . ... .. ... . . . . . . ....... . . . . . . .. . . . . 52
Wave Spectra Estimation Methods . .... . . . . . . . . . ... .. . . ... . . .... . . . .. 55
xiii
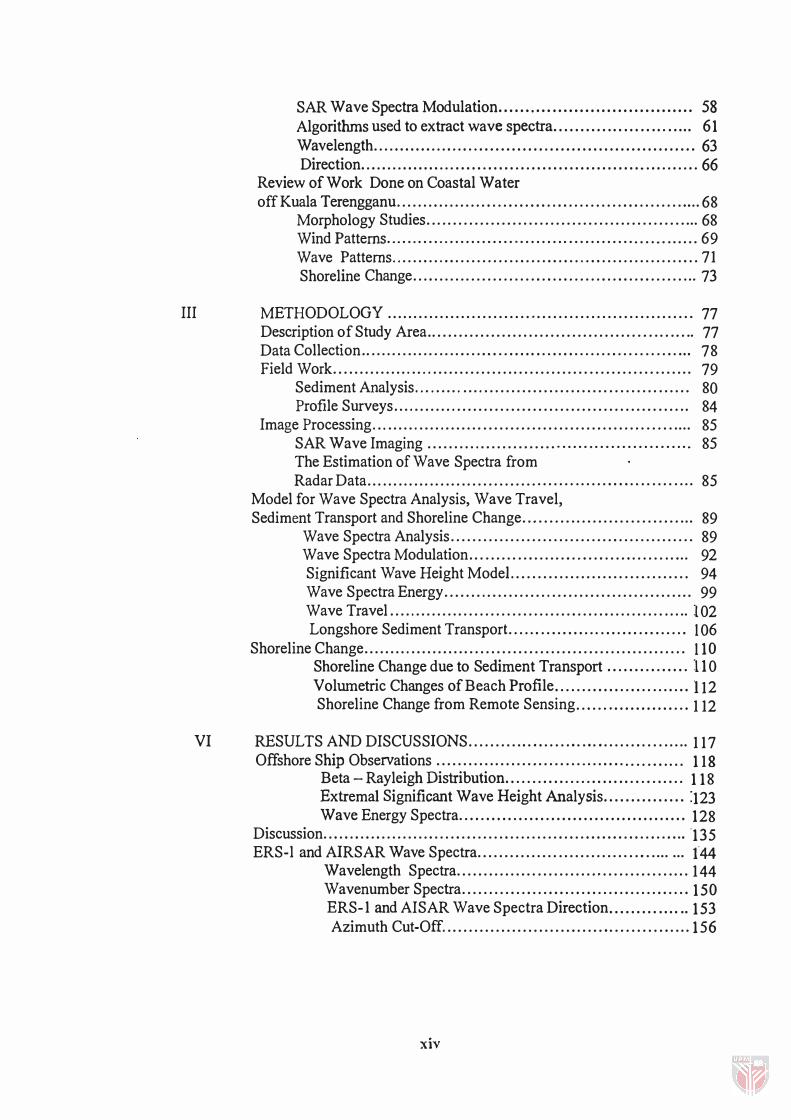
SAR Wave Spectra Modulation. . . . . . . . . . . . . . . . . ... . . . . . . . . . . . . . . . . 58 Algorithms used to extract wave spectra.......... . . . . . . . . . . . . . ... 61 Wavelength ............................................................ 63 Direction .................................................... , .......... 66
Review of Work Done on Coastal Water off Kuala Terengganu ......................................................... 68
Morphology Studies . .... . . . . . . . . . . . . . . . . . . . . . . . . . . . . . . . . . . . . . . . . . . .... 68 Wind Patterns . . . . ... . . .... . . . ... . . . . . . . . . . . . . ... . . . . . . . . . . . . . . . . . .. . . . . 69 Wave Patterns ......................................................... 71 Shoreline Change ..................................................... 73
III METHODOLOGy ...... . . . . . . . . . ... . . . . . . . . . . . . . . . . . . . . . . . . . . . . . . . . . . . . . . . 77 Description of Study Area.. . . . . . . . . . . . . . . . . . . . . . . . . . . . . . . . . . . . . . . . . .. . .. . .. 77 Data Collection.. . ... .... . . . . . .. . . . . . . .. . . . . . . . . . . . . .. . . . . .. ... .. . . .. . . . . . ... 78 Field Work.. . ... . . . . . . ......... . . . . . . . . . . . . .. . . . . . . . . . . . . . . . . . . . . . . . . . . . . . ... 79
Sediment Analysis... .. ......... . . . . . . . . . . . . . . . . . . . . . . . . . . . . . . . . . . . . . 80 Profile Surveys...... . . . . ... . . . . . . . . . . . . . . . . . . . . . . . . . . . . . . . . . . . . . . . . .. 84
Image Processing.. ......... . ... . . . . . . . . . . . . . . . . . . . . . . . . . . . . . . . . . . . . . . . . . .... 85 SAR Wave Imaging . . . . . . . . ... . . . . . . . . . . . . . . . . . . . . . . . . . . . . . . . . . . ... . 85 The Estimation of Wave Spectra from Radar Data. . . . . . . . . . . . .. . . . . . . . . . . . . . . . . . . . . . . . . . . . . . . . . .. . . . . . . . . . . ... 85
Model for Wave Spectra Analysis, Wave Travel, Sediment Transport and Shoreline Change.. . . . . . . . .. . . . . . . . . . . . . . . . . . . ... 89
Wave Spectra Analysis ............................................. 89 Wave Spectra Modulation.. . . ..... ....... .............. ...... ..... 92 Significant Wave Height ModeL.. . . . . . . . . . . . . . . . . . . . . . . . . . . . . . . 94 Wave Spectra Energy.. . . . . ... . . . . . . . . . . .. . . . . . . . . . . . . . . . . . . . . . . ... 99 Wave Travel ........................................................ 102 Longshore Sediment Transport. .. ... .. . .. . . . . . . . . . . . . . . . . . .. . .. 106
Shoreline Change.......... . . . . . . . . .. . . . . . . . . . . . . . . . . . . . . . . . . . . . . . . . . . . . . . . . . 110 Shoreline Change due to Sediment Transport ............... 110 Volumetric Changes of Beach Profile ......................... 112 Shoreline Change from Remote Sensing ..................... 112
VI RESULTS AND DISCUSSIONS . . . . . . . . . ... . ... . . . .. . .. .. . . . . ... . . . ..... 117 Offshore Ship Observations .. . . . . . . . . .. . . . . . ... . . . . . .. ...... .. . . . . . .. . ... 118
Beta - Rayleigh Distribution... ... ... . . . ... ... ... .. . .. .. . . ... 118 Extremal Significant Wave Height Analysis ............... :123 Wave Energy Spectra .......................................... 128
Discussion .................................................................... "135 ERS-l and AIRSAR Wave Spectra. . . . . . . . . . . . . . . . . . . . . . . . . . . . . . . . .... ... 144
Wavelength Spectra . . . . . . . . . . . . . . . . . . . . . . . . . ... . . . . . . . . . . . .. . . 144 Wavenumber Spectra .......................................... 150 ERS-l and AISAR Wave Spectra Direction ............... 153 Azimuth Cut-Off ... . . . . . . . . . . . . . . . . . . . . ... . . . . .. . . . . . . . . ...... 156
xiv
Comparison between Wave Model Spectra, Quasi liner
Spectra and Velocity Bunching............ . . . . . . . . . . . . . . . . . . . . . . . . . . . . . 162 Discussion........................................................................ 168
Radar Wave Spectra .... .. . .. . . . . . ... . . . . .. . '" . . . . . . . . . . . . . . . . . . . . . . . . . . 1 68 Nonlinearity of Radar Data. . ....... ..... . . .. . .. . .... . .. ......... ... . . . . 1 72
Wave Spectra Modulation............................................... 1 75 Comparison between Wave Model,Quasi-linear Spectra and Velocity Bunching . . .. . . ... . . . . . . .. . .. . '" . . . . . . . . . . . . . . . . . . . . . . . . . . . 179
Nearshore Waves. . . . . . . . . . . . .. . . . . ....... . . . . . . . . . . . . . . . . . . . . . . . . . . . . . . . . . . . . . . . . . 1 82 Wave Travel.... . . ... . . . . . . .. . . . . . . . . . . . . . . . . . . . . . . . . . . . . . . . . . . . . . . . . . . . . . . 1 82 Longshore Current. . . . . . . . . . . . . . . . . . . . . . . . . . . . . . . . . . . . . . . . . . . . . . . . . . . . . . . 1 89 Volume Change of Sediment Transport . . . . . . . . . . . . . . . . . . . . . . . . . . . . . . .. 1 99
Discusion .. . . . . . . . .. . . . . . . . . . . . . . . . . . . . . . . . . . . . . . . . . . . . . . . . . . . . . . . . . . . . . . . . . . . . . . . . . 202 Wave Refraction Pattern. . . . . . .. . . . . . . . . . . . . . . . . . . . . . . .. . . . . . . . . . . . . . . . . . 202 Variation of Refraction Coefficient and Longshore Radiation Stress . . . . . . . . . . . . . . . . . . . . . . . . . . . . . . . . . . . . . . . . . . . . . . 203 Longshore Current and Sediment Transport . . . . . . '" . . . . . . . . . . . . . . . . . . 206
Shoreline Volume Change ModeI.. . .. . . . . . . . . . . . . . . . . . . . .. . . . . . . . . . . . . . . . . . . . . . 209 Wave Spectra Data . . . . . . . . . . . . . . , . . . . . . . . . . . . . . . . . . . . . . . . . . . . . . . . . . . . . . . . . . 209 Remotely Sensed Data.. . . . . . . . . . . . . . . . . . . . . . . . . . . . . . . . . . . . . . . . . . . . . . . . . . . 2 1 2
Beach Profiles . . . . . . . . . . . . . . . . . . . . . . . . . . . . . . . . . . . . . . . . . . . . . . . . . . . . . . . . . . . . . . . . . . . . . . 220 Beach Sediment Characteristics. . . . . . . . . .. . . . . . . . . . . . . . . . . . .. . ...... . . .. 222
Discussion. . . . . . . . . . . . . . . . . . . . . . . . . . . . . . . . . . . . . . . . . . . . . . . . . . . . . . . . . . . . . . . . . . . . . . . . . 23 1 Beach Profile Change . . . . . . . . . . . . . . . . . . . . . . . . . . . . . . . . . . . .. . . . . . . . . . . . . . . . 235
Beach Profile and Sediment Characteristcs. . . . . . . . . . . . . . . . . . . . . . . . . . . 236 Immersed Weight and Porosity . . . . .. ... . . . .... .. .. .. ..... . . . . . . . . . . . . . . 237
Observed and predicted Shorline . . ... . . .. . .. . . . . . . . . . . .. . . . . . . . . . . . . . . ..... . .. . . 239
V SUMMARY AND CONCLUSION ..... ..... . . ........ . ..... . . ... .. .. .... ...... 242 Wave Spectra Pattern . . . . . . . . . . . . . . . . . . . . . . . . . . . . . . . . . . . . . . . . . . . . . . . . . . . . 243 Wave Spectra Effects . . . . . . . . . . . . . . . . . . . . . . . . . . . . . . . . . . . . . . . . . . . . . . . . . . . . 244
Recommendations . . . . . . . . . . . . . . . . . . . . . . . . . . . . . . . . . . . . . . . . . . . . . . . . . . . . . . . . . . . . . . . . . . . 247
REFERENCES .. . . . ................ ... . . . . ...... .. . .......... . . . . . ... ... ................. ..... 249
VITA ........................................................................................... 272
xv
LIST OF TABLES
Table Page
1. ERS-l AIRSARffOPSAR Parameters . . . . . . . . . . . . . . . . . . . . . . . . . . . . . . . . . . . . . . . . . . . . . 43
2. Data Collection and their Purpose. . . . . . . . . . . . . . . . . . . . . . . . . . . . . . . . . . . . . . . . . . . . . . . . . . . 76
3. Data used for Shoreline Change. . . . . . . . . . . . . . . . . . . . . . . . . . . . . . . . . . . . . . . . . . . . . . . . . . . . . . 110
4. Remote Sensing Data for Shoreline Change . . . . . . . . . . . . . . . . . . . . . . . . . . . . . . . . . . . . . . . 114
5. Significant Wave Height Distributions. . . . . . . . . . . . . . . . . . . . . . . . . . . . . . . . . . . . . . . . . . . . . 122
6. Correlation of Extremal Significant Wave Height Distribution among a Season. . . . . . . . . . . . . . . . . . . . . . . . . . . . . . . . . . . . . . . . . . . . . . . . . . . . . . . . 127
7. Maximum of Extremal Significant Wave Height with Different Models. . . . . . . . . . . . . . . . . . . . . . . . . . . . . . . .. . . . . . . . . . . . . . . . . . . . . .. . . . . . . . . . . 127
8. Probability Occurrence of 100Year Return Values of Significant Wave Height . . . . . . . . . . .. . . . . . . . . . . . . . . . . . . . . . . . . . . . . . . . . . . . . . . . . . . . . . . . . 128
9. Maximum Wind Wave Spectra Energy Peale . . . . . . . . . . . . . . . . . . . . . . . . . . . . . . . . . . . . . . . 132
10. Offshore and Onshore Wavelength . . . . . . . . . . . . . . . . . . . . . . . . . . . . . . . . . . . . . . . . . . . . . . . . . . . 149
11. Average ERS-l Offshore Wavenumber Spectra . . . . . . . . . . . . . . . . . . . . . . . . . . . . . . . , . . . . 150
12. Average ERS-I and AIRSAR Onshore Wave Spectra . . . . . . . . . . . . . . . . . . . . . . . . . . . . . 153
13. Correlation Analysis between Modeled Significant Wave Height and Estimated Significant Wave Height from Radar Imageries. . . .. . . . . . . . . . . . . . . . . . . . . . . . . . . . . . . . . . . . . . . . . . . . . . . . . . . . . . . . . . . . . . 161
14. Comparison of Density Spectra Peaks Simulated by Different Models. . . . . . . . . . . . . . . . . . . . . . . . . . . . . . . . . . . . . . . . . . . . . . . . . . . . . . . 168
15. Wind Stress and Wavelength Estimated from ERS-I and AIRSARffOPSAR. . . . . . . . . . . . . . . . . . . . . . . . . . . . . . . . . . . . . . . . . . . . . . . . . . . . . . . . . . . . . . . 168
16. Average Wavelength Spectra Derived from Radar data and Wave Model . . . . . . . . . . . . . . . . . . . . . . . . . . . . . . . . . . . . . . . . . . . . . . . . . . . . . . . . . . 173
xvi
17. Correlation between SAR wavelength and Modeled Wavelength . . . . . . . . . . . . . . . . . . . . . . . . . . . . . . . . . . . . . . . . . . . . . . . . . . .. . . . . . . . . . . . 173
18. Significant relation between Measured Cut-off and Modeled Cut-off. . . . . . . . . . . . . . . . . . . . . . . . . . . .. . . . . . . . . . . . . . . .. . . . . . . .. . . . . 189
19. Comparison between Average Hs Estimated from Wave Model, Quasi-linear Transform and Least Square Model . . . . . . . . . . . . . . . . . . . . . . . . . . . . . . . . . 176
20. Significant Differences between Wave Spectra Models . . . . . . . . . . . . . . . .. . . . .. . . .. 180
21. Significant Difference between Velocity Bunching Model and Quasi-linear . . .. . . . . . . . . . . . . . . . . . . . . .. . . . . . . . . . . . . . . . . . . . . . . . . . . . . . . . . .. . . . . . . . . . . . . 181
. .
22. Longshore Current Velocities and Direction. . . . . . . . . . . . . . . . . . . . . . . . . . . . . . . . . . . . . . . 194
23 . Net Volume Rate Change of the Sediment Transport. . . . . . . . . . . . . . . . . . . . . . . .. . . . 201
24. Comparison between Predicted and Observed Shoreline Change. . . . . . . . . . . . . . . . . . .. . . . . . . . .. . . . . .. . . . . . . . . .. . . . .. . . . . .. . . . . . . .•. . . . ... 24 1
xvii

LIST OF FIGURES
Figure Page
1. Electromagnetic Spectrum and Radar Bands. . . . . . . . . . . . . . . . . . . . . . . . . . . . . . . . . . . . . 33
2. Scattering Mechanism . . . . . . . . . . . . . . . . . . . . . . . . . . . . . . . . . . . . . . . . . . . . . . . . . . . . . . . . . . . . . . . . 37
3. Bragg Scatter . . . . . . . . . . . . . . . . . . . . . . . . . . . . . . . . . . . . . . . . . . . . . . . . . . . . . . . . . . . . . . . . . . . . . . . . . 38
4. Bottom Topography of Coastal Waters of Kuala Terengganu . . . . . . . . . . . . . . . .. . . . . . . . . . . . . . . . . . . . . . . . . . . . . . . . . . . . . . . . . 77
5. Location of Field Sampling along Shoreline of Kuala Terengganu . . . . . . . . . . . . . . . . . . . . . . . . . . . . . . . . . . . . . . . . . . . . . . . . . . . . . . 81
6. Sieving Analysis Form. . . . . . . . . . . . . . . . . . . . . . . . . . . . . . . . . .. . . . . . . . . . . . . . . . . . . . . . . . . . . . . 82
7. Procedure Used to Estimate Wave Spectra. . . . . . . . . . . . . . . . . . . . . . . . . . . . . . . . . . . . . . . . 87
8. Output of 2 - DFFT on ERS-l and AIRSARITOPSAR DATA . . . . . . . . . . . . 88
9. Model Concept Used in this Study . . . . . . . . . . . . . . . . . . . . . . . . . . . . . . . . .. . . . . . . . . . . . . . . . . . 90
10. Fourier Analysis to Extract Wavelength and Wave Direction.. . . . . . . . . . . . . . . . . . 91
11. Shoreline Change Model . . . . . . . . . . . . . . . . . . . . . . . . . . . . . . . . . . . . . . . . . . . . . . . . . . . . . . . . . . . . . 111
12. Steps for Georefference Database . . . . . . . . . . . . . . . . . . . . . . . . . . . . . . . . . . . . . . . . .. . . . . . . . . . . 114
13. Overlaying Technique for Shoreline Change . . . . . . . . . . . . . . . . . . . . . . . . . . . . . . . . . . . . . . . 116
14. Beta Rayleigh Distribution during the Southwest Monsoon. . . . . . . . . . . . . . . . . . . . . 119
15. Beta Rayleigh Distribution during the Northeast Monsoon...................... 120
16. Beta Rayleigh Distribution during the Transitional Periods. . . . . . . . . . . . . . . . . . . . . . 121
17. Return period of Significant Wave Height (a) Southwest and Northeast Monsoon (b) Transitional period. . . ... . . . . ...... .... . ... . . . ... .. .. 125
xviii

1 8. Probability Occurrence of Significant Wave height during Southwest, Northeast Monsoon And Transitional Periods. . . . . . . . . . . . . . . . . . . . . . . . . . . . . . . . . . . . . . . . . . . . . . . . . . . . . . . . . . . . . . . 1 26
1 9. Wind Wave Spectra Energy during Southwest Monsoon . . . . . . . . . . . . . . . . . . . . . . . . . 1 29
20. Wind Wave Spectra Energy during Northeast Monsoon . . . . . . . . . . . . . . . . . . . . . . . . . . 130
2 1 . Wind Wave Spectra Energy during Transitional Period . . . . . . . . . . . . . . . . . . . . . . . . . . . . 1 3 1
22. Time Series Analysis of wind Wave Spectra. . . . . . . . . . . . . . . . . . . . . . . . . . . . . . . . . . . . . . . . 133
23. Time series Analysis of Wave Energy Derived from Airy Theory. . . . . . . . . . . . . . 134
24. Frequency Distribution of Wave Energy with Direction . . . . . . . . . . . . . . . . . . . . . . . . . . 136
25. Probability Distribution Function of Significant Wave Height Occurrence during Northeast,Monsoon. . . . . . . . . . . . . . . . . . . . . . . . . . . . . . . . . . . . . . . . . . . . . . . 1 37
26. Distribution of Wind Speed and Significant Wave Height . . . . . . . . . . . . . . . . . . . . . . . . . 1 39
27. Nearshore Significant Wave Height. . . . . . .. . . . . . . . . . . . . . . . . . . . . . . . . . . . . . . . . . . . . . . . . . . . 1 4 1
2 8 . ERS-1 Wave Spectra in August 1 993 . . . . . . . . . . . . . . . . . . . . . . . . . . . . . . . . . . . . . . . . . . . . . . . . . 1 45
29. ERS-I Wave Spectra in September 1 993 . . . . . . . . . . . . . . . . . . . . . . . . . . . . . . . . . . . . . . . . . . . . . 1 46
30. ERS- 1 Wave Spectra in October 1993 . . . . . . . . . . . . .. . . . . ... . . . . . . . . . . . . . . . . . . . . . . . . . . . 1 47
3 1 . AIRSARITOPSAR Wave Spectra in December 1996 . . . . . . . . . . . . . . . . . . . . . . . . . . . . . . 1 48
32. Average offshore Wave Spectra Extracted from ERS-1 Data . . . . . . . . . . . . . . . . . . . . . 1 5 1
33. Average Nearshore Wave Spectra Extracted from ERS-l Data. . . . . . . . . . . . . . . . . . 1 52
34. Wave Spectra Direction Derived from ERS-l Data. . . . . . . . . .. . . .. . . . . . . . . . . . . . . . . . 1 54
35 . Wave Spectra Direction Derived from AIRSARffOPSAR Data . . . . . . . . . . . . . . . . 1 55
3 6. Regression Models of Azimuth Cut-off Wavelength and Measured Cut-off Wavelength in August, September and October 1 993, Respectively . . . . . . . . . . . . . . . . . . . . . . . . . . . . . . . . . . . . . . . . . . 1 57
37. Regression Models of Azimuth Cut-off Wavelength and Measured Cut-off Wavelength in December 1 996 . . . . . . . . . . . . . . . . . . . . . . . . . . . . . 1 58
3 8 . Regression Model of ERS-l Significant Wave Height and Wave model Significant Wave Height in August, September and October 1993, Respectively . . . . . . . . . . . , . . . . . . . . . . . . . . . . . . . . . . . . . . . . . . 1 59
xix

39. Regression Model of AIRSAR Significant Wave Height and Wave Model Significant Wave Height in December 1996 . . . . . . . . . . . . . . . . . . . . . . . . . . . . .. . . . .. . . . . . . . . . . . . . . . . . . . . . . . . . . . . . . . . . . 160
40. Offshore Wave Spectra Simulated from Wave Model, Quasi-linear and Velocity Bunching. . . . . . . . . . . . . . . . . . . . . . . . . . . . . . . . . . . . . . . . 177
41. Nearshore Wave Spectra Simulated from Wave Model, Quasi-linear and Velocity Bunching in August, September, October 1993 and December 1996, Respectively. . . . . . . . . . . . . . . . . . . . 164
42. Wave Spectra Energy in the Month of August, September and October 1993, Respectively. . . . . . . . . . . . . . . . . . . . . . . . . . . . . . . . . . . . . . . . . . . . . . . . . . . . . . 166
43. Wave Spectra Energy in December 1996 . . . . . . . . . . . . . . . . . . . . . . . . . . . . . . . . . . . . . . . . . . . 167
44. (a) Weak Linear Regression and (b) Least Square Fit Results . . . . . . . . . . . . . . . . . . . . 174
45. Wave refraction Pattern during Northeast Monsoon . . . . . . . . . . . . . . . . . . . . . . . . . . . . . . . . 183
46. Wave Refraction Pattern during Southwest Monsoon . . . . . . . . . . . . . . . . . . . . . . . . . . ... 184
47. Wave Refraction Pattern during Transitional Period . . . . . . . . . .. . . . . . . . . . . . . , . . . . . . . 186
48. Wave Refraction Pattern Modeled from ERS-l Data in August, September and October 1993, Respectively . . . . . . . . . . . . . . . . . . . . . . . . . . . 187
49. Wave Refraction Pattern Modeled from (a) Ship Observation Data and (b) AIRSARffOPSAR Data in December 1996 . . . . . . . . . . . . . . . . . . . . . . . . . . . . . . . . . . . . . . . . . . . . . . . . . . . . . . . . . . . . . . . . . . . . . .. 188
50. Longshore Current Velocity during Northeast Monsoon . .. . . .. . . . . . . . . . . . . . . . .... 190
51. Longshore Current Velocity during Southwest Monsoon. . . . . . . . . . . . . . . . . . . . . . . . . 191
52. Longshore Current Velocity during Transitional Period . . . . . . . . . . . . . . . . . . . . . . . . . . . . 192
53. Longshore Current Vectors during Northeast Monsoon, Southwest Monsoon and Transitional Period . . . .. .. . . ... ... .. . ..... .. . . . . . . . . . . . . . . 193
54. Longshore Current Vectors Simulated from Quasi-linear and Wave Model in December 1996 . . . . . . . . . . . . . . . . . . . . . . . . . . . . . . . . . . . . . . . . . . . . . . . . . . 196
55. Longshore Current Vectors Simulated from Quasi-linear and Wave Model in August, September and October 1993 . . . . . . . . . . . . . . . . . . . . . . . . 197
xx
56. Longshore Current Velocity. Vector Simulated from ERS-1 data and AIRSARffOPSAR Data ................•........................... 198
57. Volume Rate Change of Sediment transport (a) Ship Observation (b) Radar Data . .............. ....................... . .... . ....................... . ........ 200
58. Wave Refraction during Northeast Monsoon, Southwest Monsoon and Transitional Period . . . . . ... .. .. .. . . . . . . .. ........... .. ... . . 204
59. Distribution of Wave Refraction Coefficient and Energy along the Coastal Water of Chendering . . . .. . ... . . . . . . . . .... ... . ........ . . . ... . . . . .... 205
60. Shoreline Change Model (a) Monsoon periods (b) ERS-1 Data and (c) Comparison between Aerial Photography, Quasi-linear,.Wave mode� and Ship Observation along Chendering "Shoreline. . . . . . . . . . . . . . . . . . . . . . . . . . . . .. . . . . . . . . . . . . . . . . . . . . . . . . . . . . . . . . . . . . 2 10
61. Shoreline Change Model from (a) Ship Observation (b) AIRSARffOPSAR, Aerial Photography, Wave Model and Quasi-linear Model along the Shoreline of Kuala Terengganu . . . . . . . . . . . . . . . . . . . . . . . . . . . . . . . . . . . . . . . . . . . . . . . . . . .. . . . 213
62. Shoreline Change Estimated from Aerial Photography and Topographic Map during (a) 1959 to 1980 and (b) 1959 to 1994. . . . . . . . . . . . . 2 14
63. Shoreline Change along Marang to Headland of Chendearing during (a) 1970 to 1994 and (b) 1970 to October 1993 . . . . . . . . . . . . . . . . . . . . . . . . . . . 216
64. Shoreline Change along Kuala Terengganu. . . . . . . . . . . . . . . . . . . . . . . . . . . . . . . . . . . . . . . . 21 T
65. Volume Rate Change Estimated from Remotely Sensed Data. . . . . . . . . . . . . . . .. . 2 19
66. Beach Profile during March and December 1997 . . . . . . . . . . . . . . . . . . . . . . . . . . . . . . . . . . 221
67. Sediment Sorting and Grain Size in March and December 1996 . .. .. . . . . . . . . . ... 223
68. Comparison between Tangent slope and Sorting and Mean Grain Size. . . . . . . . . . . . . . . . . . . . . . . . . . . . . . . . . . . . . . . . . . . . . . . . . . . . . . . . . . . . . . . . . . . 225
69. Comparison between Sorting and Mean Grain Size with Slope along the Cross-distance . . .. . . .... . . . . . . . . . . . .. . . .. . . .... . .. . . . . .... 226
70. Regression Model of Sorting and Grain Size with Tangent Slope ... . . . . . . . . . . . . . . . . . . . . . ....... . . . .. . . . . . . . ....... . . . . . . . . . . . . . . .. . . . . . . . ..... 228
xxi
71. Regression Model of Beach Slope, Wave Energy and Volume Transport Rate. . . . ... ..... .. ..... .. ... . . . . . . . . . .. . . . . . . . ... .. . . ..... . . . . . . . . .. 229
72. Beach Volume Change.. . . . . . . . . . . . . . . . . . . . . . . . . . . . . . . . . . . . . . . . . . . . . . . . . . . . . . . . . . . . . . . . 230
73. Distribution of Volume Transport Estimated from Porosity . . . . . . . . . . . . . . . . . . . . . 232
74. Porosity, Volume Transport and Immersed Weight along Coastline of Kuala Terengganu . . . . . . . . . . . . . . . . . . . . . . . . . . . . . . . . . . . . . . . . . . . . . . . . 238
xxii

CHAPTER I
INTRODUCTION
Background
The study of the dynamics of ocean wave is always a challenging and
intriguing process. Features of ocean waves are complex. It is not easy to
understand ocean waves because there are many factors controlling them. Scientists
study the factors separately but this will give them an imperfect answer. Scientists
consider the waves as a most significant parameter of the coastal zone. Waves are
normally the major energy input in the coastal zone. This energy is larger than the
energy of water circulation and tide.
In the South China Sea, tide and tidal currents have small amplitude
variations as compared to wave. For instance, the tidal height amplitude is less than
0.8 m (Taira et aI. , 1 996) while the maximum wave height in the South China Sea is
3 m during the northeast monsoon (Maged and Ibrahim, 1 996). Tidal current is also
slower than wave motion. For instance, Taira et al., ( 1 996) and Maged et al., ( 1 998)
found that tidal current speed in the coast of South China Sea is approximately 1 mls.
Maged et aI., ( 1 998) found that the maximum wavelength is 1 70 m. The estimated
wave speed as function of this wavelength would be 1 0 mls. This means that waves
have more energy input in the coastal zone of the South China Sea. This is because
of the fact that wave energy is a function of the second power of wave height and
proportional directly to wavelength and wave velocity (Komar, 1 976, and Robert,
1 987).
2
Waves travel in many different directions as compared to tide and currents.
Due to the incident angle of wave propagation, longshore currents occur. This can
lead to sediment transport along the shoreline, which subsequently will cause erosion
or sedimentation. Wave measurements and observations have been made from ships,
as well as from onshore and offshore stations. These classical methods of
measurements are unable to cover many factors of interest and are unable to
investigate the wave interaction with the coastal area on a large scale. For instance,
classical methods cannot be used to study a complicated coastal process such as the
interaction between wave refraction, diffraction, reflection, and wave current
interaction. Remote sensing techniques can cover large areas, and can image the
complicated coastal process to provide information that includes wave and shoreline
interaction, which cannot be observed by classical methods (buoy, ships, etc). This
information is vital to the study of coastal erosion and sediment transport.
Microwave remote sensing has an advantage over the other types of remote
sensing particularly in investigating wave spectra. The Synthetic Aperture Radar
(SAR) has been proven accurate for recording wave spectra image over the ocean
(Trevor, 1990). Hasselmann and Hasselman (1991) reviewed the potential and
proven applications of radar satellite image in the coastal areas and over the ocean.
Wave investigations by SAR image take place due to the interest of the scientists and
researchers (Hasselmann and Hasselmann, 1991 and Vachon et al., 1994).
Wave information has a significant role for shoreline configuration. The
classical method of visual observation of wave could contain errors, which could
induce misunderstanding on the nature of the problem. The longshore currents