united states securities and ... - investor.oracle.com · united states securities and exchange...
TRANSCRIPT

UNITED STATESSECURITIES AND EXCHANGE COMMISSION
Washington, D.C. 20549
FORM 10-K☒ ANNUAL REPORT PURSUANT TO SECTION 13 OR 15(d) OF
THE SECURITIES EXCHANGE ACT OF 1934For the fiscal year ended May 31, 2019
OR
☐ TRANSITION REPORT PURSUANT TO SECTION 13 OR 15(d) OFTHE SECURITIES EXCHANGE ACT OF 1934For the transition period from toCommission File Number: 001-35992
Oracle Corporation(Exact name of registrant as specified in its charter)
Delaware 54-2185193(State or other jurisdiction ofincorporation or organization)
(I.R.S. EmployerIdentification No.)
500 Oracle ParkwayRedwood City, California
(Address of principal executive offices)94065
(Zip Code)(650) 506-7000
(Registrant�s telephone number, including area code)
Securities registered pursuant to Section 12(b) of the Act:Title of each class Trading Symbol(s) Name of each exchange on which registered
Common Stock, par value $0.01 per share2.25% senior notes due January 20213.125% senior notes due July 2025
ORCL New York Stock ExchangeNew York Stock ExchangeNew York Stock Exchange
Securities registered pursuant to Section 12(g) of the Act:None
Indicate by check mark if the registrant is a well-known seasoned issuer, as defined in Rule 405 of the Securities Act. YES ⌧ NOIndicate by check mark if the registrant is not required to file reports pursuant to Section 13 or Section 15(d) of the Act. YES NO ⌧
Indicate by check mark whether the registrant (1) has filed all reports required to be filed by Section 13 or 15(d) of the Securities Exchange Actof 1934 during the preceding 12 months (or for such shorter period that the registrant was required to file such reports), and (2) has beensubject to such filing requirements for the past 90 days. YES ⌧ NOIndicate by check mark whether the registrant has submitted electronically every Interactive Data File required to be submitted pursuant toRule 405 of Regulation S-T (§232.405 of this chapter) during the preceding 12 months (or for such shorter period that the registrant wasrequired to submit such files). YES ⌧ NO
Indicate by check mark whether the registrant is a large accelerated filer, an accelerated filer, a non-accelerated filer, a smaller reportingcompany or an emerging growth company. See the definitions of �large accelerated filer,� �accelerated filer,� �smaller reporting company� and�emerging growth company� in Rule 12b-2 of the Exchange Act.
Large accelerated filer ☒ Accelerated filer ☐Non-accelerated filer ☐ Smaller reporting company ☐
Emerging growth company ☐If an emerging growth company, indicate by check mark if the registrant has elected not to use the extended transition period for complyingwith any new or revised financial accounting standards provided pursuant to Section 13(a) of the Exchange Act.Indicate by check mark whether the registrant is a shell company (as defined in Rule 12b-2 of the Exchange Act). YES NO ⌧
The aggregate market value of the voting stock held by non-affiliates of the registrant was $107,968,269,000 based on the number of sharesheld by non-affiliates of the registrant as of May 31, 2019, and based on the closing sale price of common stock as reported by the New YorkStock Exchange on November 30, 2018, which is the last business day of the registrant�s most recently completed second fiscal quarter. Thiscalculation does not reflect a determination that persons are affiliates for any other purposes.Number of shares of common stock outstanding as of June 17, 2019: 3,335,819,000.Documents Incorporated by Reference:Portions of the registrant's definitive proxy statement relating to its 2019 annual stockholders' meeting are incorporated by reference into PartIII of this Annual Report on Form 10-K where indicated.
ORACLE CORPORATION
FISCAL YEAR 2019FORM 10-K
ANNUAL REPORT
TABLE OF CONTENTS
Page
PART I.
Item 1. Business . . . . . . . . . . . . . . . . . . . . . . . . . . . . . . . . . . . . . . . . . . . . . . . . . . . . . . . . . . . . . . . . . . . . . . . . . . . . . . . . . . . . . . . . . . . . . . . . . . . . . . . . . . . . . . . . . . . . . . 3
Item 1A. Risk Factors . . . . . . . . . . . . . . . . . . . . . . . . . . . . . . . . . . . . . . . . . . . . . . . . . . . . . . . . . . . . . . . . . . . . . . . . . . . . . . . . . . . . . . . . . . . . . . . . . . . . . . . . . . . . . . . . . . 16
Item 1B. Unresolved Staff Comments. . . . . . . . . . . . . . . . . . . . . . . . . . . . . . . . . . . . . . . . . . . . . . . . . . . . . . . . . . . . . . . . . . . . . . . . . . . . . . . . . . . . . . . . . . . . . . . . . 32
Item 2. Properties . . . . . . . . . . . . . . . . . . . . . . . . . . . . . . . . . . . . . . . . . . . . . . . . . . . . . . . . . . . . . . . . . . . . . . . . . . . . . . . . . . . . . . . . . . . . . . . . . . . . . . . . . . . . . . . . . . . . 32
Item 3. Legal Proceedings. . . . . . . . . . . . . . . . . . . . . . . . . . . . . . . . . . . . . . . . . . . . . . . . . . . . . . . . . . . . . . . . . . . . . . . . . . . . . . . . . . . . . . . . . . . . . . . . . . . . . . . . . . . . 32
Item 4. Mine Safety Disclosures . . . . . . . . . . . . . . . . . . . . . . . . . . . . . . . . . . . . . . . . . . . . . . . . . . . . . . . . . . . . . . . . . . . . . . . . . . . . . . . . . . . . . . . . . . . . . . . . . . . . . 32
PART II.
Item 5. Market for Registrant�s Common Equity, Related Stockholder Matters and Issuer Purchases of Equity Securities . . . . . . 33
Item 6. Selected Financial Data . . . . . . . . . . . . . . . . . . . . . . . . . . . . . . . . . . . . . . . . . . . . . . . . . . . . . . . . . . . . . . . . . . . . . . . . . . . . . . . . . . . . . . . . . . . . . . . . . . . . . . 35
Item 7. Management�s Discussion and Analysis of Financial Condition and Results of Operations . . . . . . . . . . . . . . . . . . . . . . . . . . . . . . . 36
Item 7A. Quantitative and Qualitative Disclosures About Market Risk . . . . . . . . . . . . . . . . . . . . . . . . . . . . . . . . . . . . . . . . . . . . . . . . . . . . . . . . . . . . . . 59
Item 8. Financial Statements and Supplementary Data. . . . . . . . . . . . . . . . . . . . . . . . . . . . . . . . . . . . . . . . . . . . . . . . . . . . . . . . . . . . . . . . . . . . . . . . . . . . . 61
Item 9. Changes in and Disagreements with Accountants on Accounting and Financial Disclosure . . . . . . . . . . . . . . . . . . . . . . . . . . . . . . 61
Item 9A. Controls and Procedures . . . . . . . . . . . . . . . . . . . . . . . . . . . . . . . . . . . . . . . . . . . . . . . . . . . . . . . . . . . . . . . . . . . . . . . . . . . . . . . . . . . . . . . . . . . . . . . . . . . . 61
Item 9B. Other Information . . . . . . . . . . . . . . . . . . . . . . . . . . . . . . . . . . . . . . . . . . . . . . . . . . . . . . . . . . . . . . . . . . . . . . . . . . . . . . . . . . . . . . . . . . . . . . . . . . . . . . . . . . . 62
PART III.
Item 10. Directors, Executive Officers and Corporate Governance . . . . . . . . . . . . . . . . . . . . . . . . . . . . . . . . . . . . . . . . . . . . . . . . . . . . . . . . . . . . . . . . . . 63
Item 11. Executive Compensation . . . . . . . . . . . . . . . . . . . . . . . . . . . . . . . . . . . . . . . . . . . . . . . . . . . . . . . . . . . . . . . . . . . . . . . . . . . . . . . . . . . . . . . . . . . . . . . . . . . . 63
Item 12. Security Ownership of Certain Beneficial Owners and Management and Related Stockholder Matters . . . . . . . . . . . . . . . . . 63
Item 13. Certain Relationships and Related Transactions, and Director Independence . . . . . . . . . . . . . . . . . . . . . . . . . . . . . . . . . . . . . . . . . . . . 63
Item 14. Principal Accounting Fees and Services . . . . . . . . . . . . . . . . . . . . . . . . . . . . . . . . . . . . . . . . . . . . . . . . . . . . . . . . . . . . . . . . . . . . . . . . . . . . . . . . . . . . . 63
PART IV.
Item 15. Exhibits and Financial Statement Schedules . . . . . . . . . . . . . . . . . . . . . . . . . . . . . . . . . . . . . . . . . . . . . . . . . . . . . . . . . . . . . . . . . . . . . . . . . . . . . . . . 64
Item 16. Form 10-K Summary . . . . . . . . . . . . . . . . . . . . . . . . . . . . . . . . . . . . . . . . . . . . . . . . . . . . . . . . . . . . . . . . . . . . . . . . . . . . . . . . . . . . . . . . . . . . . . . . . . . . . . . . . 118
Signatures . . . . . . . . . . . . . . . . . . . . . . . . . . . . . . . . . . . . . . . . . . . . . . . . . . . . . . . . . . . . . . . . . . . . . . . . . . . . . . . . . . . . . . . . . . . . . . . . . . . . . . . . . . . . . . . . . . . 124

1
Cautionary Note on Forward-Looking Statements
For purposes of this Annual Report, the terms �Oracle,� �we,� �us� and �our� refer to Oracle Corporation and itsconsolidated subsidiaries. This Annual Report on Form 10-K contains statements that are not historical in nature,are predictive in nature, or that depend upon or refer to future events or conditions or otherwise contain forward-looking statements within the meaning of Section 21 of the Securities Exchange Act of 1934, as amended, and thePrivate Securities Litigation Reform Act of 1995. These include, among other things, statements regarding:
� our expectation that we will continue to acquire companies, products, services and technologies tofurther our corporate strategy;
� our belief that our acquisitions enhance the products and services that we can offer to customers, expandour customer base, provide greater scale to accelerate innovation, grow our revenues and earnings, andincrease stockholder value;
� our expectation that, on a constant currency basis, our total cloud and license revenues generally willcontinue to increase due to expected growth in our cloud services and our license support offerings,continued demand for our cloud license and on-premise license offerings, and contributions fromacquisitions;
� our belief that our Oracle Cloud Software-as-a-Service and Infrastructure-as-a-Service (SaaS and IaaS,respectively, and collectively, Oracle Cloud Services) offerings are opportunities for us to expand ourcloud and license business, and that demand for our Oracle Cloud Services will continue to increase;
� our belief that we can market and sell our SaaS and IaaS offerings together to help customers migratetheir extensive installed base of on-premise applications and infrastructure technologies to the OracleCloud while at the same time reaching a broader ecosystem of developers and partners;
� our belief that we can market our SaaS and IaaS services to small and medium-sized businesses and non-IT lines of business purchasers;
� our expectation that substantially all of our customers will renew their license support contracts annually;
� our belief that our cloud ERP offerings drive adoption of our other SaaS offerings as our customers realizebenefits of a common data model utilized across our SaaS offerings;
� our expectations regarding the performance of our Oracle Autonomous Database, including its ability toreduce customer downtime and cost;
� our expectation that our hardware business will have lower operating margins as a percentage ofrevenues than our cloud and license business;
� our expectation that we will continue to make significant investments in research and development, andour belief that research and development efforts are essential to maintaining our competitive position;
� our expectation that our international operations will continue to provide a significant portion of our totalrevenues and expenses;
� the sufficiency of our sources of funding for working capital, capital expenditures, contractual obligations,acquisitions, dividends, stock repurchases, debt repayments and other matters;
� our expectation that the U.S. Tax Cuts and Jobs Act of 2017 will continue to have a meaningful impact onour provision for income taxes;
� our belief that we have adequately provided under U.S. generally accepted accounting principles foroutcomes related to our tax audits and that the final outcome of our tax related examinations,agreements or judicial proceedings will not have a material effect on our results of operations, and ourbelief that our net deferred tax assets will be realized in the foreseeable future;

2
� our belief that the outcome of certain legal proceedings and claims to which we are a party will not,individually or in the aggregate, result in losses that are materially in excess of amounts alreadyrecognized, if any;
� the possibility that certain legal proceedings to which we are a party could have a material impact on ourfuture cash flows and results of operations;
� our expectations regarding the timing and amount of expenses relating to the Fiscal 2019 OracleRestructuring Plan and the improved efficiencies in our operations that such a plan will create;
� the timing and amount of future cash dividend payments and stock repurchases, including ourexpectation that the levels of our future stock repurchase activity may be modified in comparison to pastperiods in order to use available cash for other purposes;
� our expectations regarding the impact of recent accounting pronouncements on our consolidatedfinancial statements;
� our expectation that, to the extent customers renew support contracts or cloud SaaS and IaaS contractsfrom companies that we have acquired, we will recognize revenues for the full contracts� values over therespective renewal periods;
� our ability to predict quarterly hardware revenues;
� the percentage of remaining performance obligations that we expect to recognize as revenues over thenext twelve months;
as well as other statements regarding our future operations, financial condition and prospects, and businessstrategies. Forward-looking statements may be preceded by, followed by or include the words �expects,��anticipates,� �intends,� �plans,� �believes,� �seeks,� �strives,� �endeavors,� �estimates,� �will,� �should,� �isdesigned to� and similar expressions. We claim the protection of the safe harbor for forward-looking statementscontained in the Private Securities Litigation Reform Act of 1995 for all forward-looking statements. We havebased these forward-looking statements on our current expectations and projections about future events. Theseforward-looking statements are subject to risks, uncertainties and assumptions about our business that couldaffect our future results and could cause those results or other outcomes to differ materially from those expressedor implied in the forward-looking statements. Factors that might cause or contribute to such differences include,but are not limited to, those discussed in �Risk Factors� included elsewhere in this Annual Report and as may beupdated in filings we make from time to time with the U.S. Securities and Exchange Commission (the SEC),including our Quarterly Reports on Form 10-Q to be filed by us in our fiscal year 2020, which runs from June 1,2019 to May 31, 2020.
We have no obligation to publicly update or revise any forward-looking statements, whether as a result of newinformation, future events or risks, except to the extent required by applicable securities laws. If we do update oneor more forward-looking statements, no inference should be drawn that we will make additional updates withrespect to those or other forward-looking statements. New information, future events or risks could cause theforward-looking events we discuss in this Annual Report not to occur. You should not place undue reliance onthese forward-looking statements, which reflect our expectations only as of the date of this Annual Report.

3
PART I
Item 1. Business
Oracle provides products and services that address enterprise information technology (IT) environments. Ourproducts and services include applications and infrastructure offerings that are delivered worldwide through avariety of flexible and interoperable IT deployment models. These models include on-premise deployments, cloud-based deployments, and hybrid deployments (an approach that combines both on-premise and cloud-baseddeployment) such as our Oracle Cloud at Customer offering (an instance of Oracle Cloud in a customer�s own datacenter). Accordingly, we offer choice and flexibility to our customers and facilitate the product, service anddeployment combinations that best suit our customers� needs. Our customers include businesses of many sizes,government agencies, educational institutions and resellers that we market and sell to directly through ourworldwide sales force and indirectly through the Oracle Partner Network.
Oracle Cloud Software-as-a-Service and Infrastructure-as-a-Service (SaaS and IaaS, respectively, and collectively,Oracle Cloud Services) offerings provide a comprehensive and integrated stack of applications and infrastructureservices delivered via a cloud-based deployment model. Oracle Cloud Services integrate the software, hardwareand services on a customer�s behalf in a cloud-based IT environment that Oracle deploys, upgrades, supports andmanages for the customer. Oracle Cloud Services are designed to be rapidly deployable to enable customersshorter time to innovation; intuitive for casual and experienced users; easily maintainable to reduce upgrade,integration and testing work; connectable among differing deployment models to enable interchangeability andextendibility between IT environments; compatible to easily move workloads between the Oracle Cloud and otherIT environments; cost-effective by requiring lower upfront customer investment; and secure, standards-based andreliable.
Oracle cloud license and on-premise license deployment offerings include Oracle Applications, Oracle Databaseand Oracle Middleware software offerings, among others, which customers deploy using IT infrastructure from theOracle Cloud or their own cloud-based or on-premise IT environments. Substantially all customers, at their option,purchase license support contracts when they purchase an Oracle license.
Oracle hardware product offerings include Oracle Engineered Systems, servers, storage and industry-specificproducts, among others, and customers generally opt to purchase hardware support contracts when theypurchase Oracle hardware.
Oracle also offers services to assist our customers and partners to maximize the performance of their Oraclepurchases.
Providing choice and flexibility to Oracle customers as to when and how they deploy Oracle applications andinfrastructure technologies is an important element of our corporate strategy. We believe that offering customersbroad, comprehensive, flexible and interoperable deployment models for Oracle applications and infrastructuretechnologies is important to our growth strategy and better addresses customer needs relative to our competitors,many of whom provide fewer offerings and more restrictive deployment models.
Our investments in, and innovation with respect to, Oracle products and services that we offer through our cloudand license, hardware and services businesses (described further below) are another important element of ourcorporate strategy. In fiscal 2019, 2018 and 2017, we invested $6.0 billion, $6.1 billion and $6.2 billion,respectively, in research and development to enhance our existing portfolio of offerings and products and todevelop new technologies and services. We have a deep understanding as to how applications and infrastructuretechnologies interact and function with one another. We focus our development efforts on improving theperformance, security, operation and integration of our technologies to improve the computing performance ofour products and services relative to our competitors� offerings, to be more cost-effective, and to be easier forcustomers to deploy, manage and maintain. For example, we believe that Oracle applications and platformtechnologies, such as the Oracle Database, when combined with other Oracle infrastructure technologies deliverimproved performance at a lower cost relative to competing infrastructure technologies and provide customersflexibility through a choice of cloud-based and on-premise deployment models. After the initial purchase of Oracleproducts and services, our customers can continue to benefit from our research and development efforts and deepIT expertise by electing to purchase and renew Oracle support offerings for their license and hardwaredeployments, which may include product enhancements that we periodically deliver to our products, and byrenewing their Oracle Cloud Services contracts with us.

4
Our selective and active acquisition program is another important element of our corporate strategy. We believethat our acquisitions enhance the products and services that we can offer to customers, expand our customerbase, provide greater scale to accelerate innovation, grow our revenues and earnings, and increase stockholdervalue. In recent years, we have collectively invested billions of dollars to acquire a number of companies, products,services and technologies that add to, are complementary to, or have otherwise enhanced our existing offerings.We expect to continue to acquire companies, products, services and technologies to further our corporatestrategy.
We have three businesses:
� our cloud and license business, which is comprised of a single operating segment and includes our OracleCloud Services offerings, cloud license and on-premise license offerings, and license support offerings,represented 83%, 81% and 80% of our total revenues in fiscal 2019, 2018 and 2017, respectively;
� our hardware business, which is comprised of a single operating segment and includes our hardwareproducts and related hardware support services offerings, represented 9%, 10% and 11% of our totalrevenues in fiscal 2019, 2018 and 2017, respectively; and
� our services business, which is comprised of a single operating segment, represented 8% of our totalrevenues in fiscal 2019 and 9% of our total revenues in each of fiscal 2018 and 2017.
Management�s Discussion and Analysis of Financial Condition and Results of Operations and Note 15 of Notes toConsolidated Financial Statements, both included elsewhere in this Annual Report, provide additional informationrelated to our businesses and operating segments.
Oracle Corporation was incorporated in 2005 as a Delaware corporation and is the successor to operationsoriginally begun in June 1977.
Applications and Infrastructure Technologies
Oracle�s comprehensive portfolio of applications and infrastructure technologies is designed to address anorganization�s IT environment needs including business process, infrastructure and applications developmentrequirements, among others. Oracle technologies are based upon industry standards and are designed to beenterprise-grade, reliable, scalable and secure. Oracle applications and infrastructure technologies includingdatabase and middleware software as well as enterprise applications, virtualization, clustering, large-scale systemsmanagement and related infrastructure products and services are the building blocks of Oracle Cloud Services, ourpartners� cloud services, and our customers� cloud IT environments. Oracle applications and infrastructureofferings are marketed and sold through our cloud and license, hardware, and services businesses and aredelivered through the Oracle Cloud, or through other IT deployment models including cloud-based, hybrid and on-premise. We believe Oracle applications and infrastructure offerings enable flexibility, interoperability and choiceto best meet customer IT needs.
We believe that our Oracle Cloud Services offerings are opportunities for us to expand our cloud and licensebusiness. We believe that our customers increasingly recognize the value of access to cloud-based applications andinfrastructure capabilities via a lower cost, rapidly deployable, flexible and interoperable services model thatOracle manages and maintains on the customer�s behalf. We believe that we can market and sell our SaaS and IaaSofferings together to help customers migrate their extensive installed base of on-premise applications andinfrastructure technologies to the Oracle Cloud while at the same time reaching a broader ecosystem ofdevelopers and partners. We also believe we can market our SaaS and IaaS services to small and medium-sizedbusinesses and non-IT lines of business purchasers due to the highly available, intuitive design, low touch and lowcost characteristics of the Oracle Cloud.

5
In recent periods, customer demand for our applications and infrastructure technologies delivered through ourOracle Cloud Services deployment models has increased. To address customer demand and enable customerchoice, we have introduced certain programs for customers to pivot their applications and infrastructure licensesand license support contracts to the Oracle Cloud for new deployments and to migrate to and expand with theOracle Cloud for their existing workloads. We expect these trends to continue.
Oracle License Support
Oracle license support offerings are marketed and sold as a part of our cloud and license business. Substantially allof our customers opt to purchase license support contracts when they purchase Oracle applications andinfrastructure licenses to run within the Oracle Cloud or other cloud-based and on-premise IT environments. Webelieve our license support offerings protect and enhance our customers� investments in Oracle applications andinfrastructure technologies because they provide proactive and personalized support services including OracleLifetime Support and unspecified license enhancements and upgrades during the term of the support period.Substantially all license support customers renew their support contracts with us upon expiration in order tocontinue to benefit from technical support services and the periodic issuance of unspecified updates andenhancements, which current license support customers are entitled to receive. Our license support contracts aregenerally priced as a percentage of the net fees paid by the customer to access the license and are typically oneyear in duration.
Applications Technologies
Oracle applications technologies are marketed, sold and delivered through our cloud and license business andrepresented 35%, 34% and 33% of our cloud and license business revenues during fiscal 2019, 2018 and 2017,respectively. Oracle applications technologies consist of comprehensive cloud-based offerings including our OracleCloud SaaS offerings, which are available for customers as a subscription, and Oracle Applications license offerings,which are available for customers to purchase for use in Oracle Cloud IaaS, other cloud-based, and on-premise ITenvironments with the option to purchase related license support. Regardless of the deployment model selected,our applications technologies are designed to reduce the risk, cost and complexity of our customers� ITinfrastructures, while supporting customer choice with flexible deployment models that readily enableperformance, agility, compatibility and extendibility. Our applications technologies are generally designed usingindustry standard architectures to manage and automate core business functions across the enterprise, as well asto help customers differentiate and innovate in those processes unique to their industries or organizations. Weoffer applications that are deployable to meet a number of business automation requirements across a broadrange of industries. We also offer industry-specific applications through a focused strategy of investments ininternal development and strategic acquisitions, which provide solutions to customers in communications,construction and engineering, financial services, health sciences, hospitality, manufacturing, public sector, retailand utilities, among other industries.
Oracle Cloud Software as a Service (SaaS)
Oracle�s broad spectrum of Oracle Cloud SaaS offerings provides customers a choice of software applications thatare delivered via a cloud-based IT environment that we host, manage, upgrade and support, and that customersaccess by entering into a subscription agreement with us for a stated period. Our SaaS offerings are built uponopen industry standards such as SQL, Java and HTML5 for easier application accessibility, integration anddevelopment. Our SaaS offerings include a broad suite of modular, next-generation cloud software applicationsthat span core business functions including enterprise resource planning (ERP), human capital management (HCM),customer experience (CX), and supply chain management (SCM), among others. We also offer a number of cloud-based industry solutions to address specific customer needs within certain industries.

6
We believe that the comprehensiveness and breadth of our SaaS offerings differentiate us from many of ourcompetitors that offer more limited or specialized applications. Our SaaS offerings are designed to supportconnected business processes in the cloud and are centered on a responsive and flexible business core and acommon data model. We believe our cloud ERP offerings drive adoption of our other SaaS offerings as ourcustomers realize benefits of a common data model utilized across our SaaS offerings. Our SaaS offerings aredesigned to deliver a secure data isolation architecture and flexible upgrades; self-service access controls for users;a Service-Oriented Architecture (SOA); built-in social, mobile and business insight capabilities; and a highperformance, high availability infrastructure based on our infrastructure technologies, including Oracle EngineeredSystems. These SaaS capabilities are designed to simplify IT environments, reduce time to implementation and risk,provide an intuitive user experience for casual and experienced users, and enable customers to focus resources onbusiness growth opportunities. Our SaaS offerings are also designed to incorporate emerging technologies such asInternet-of-Things (IoT), Artificial Intelligence (AI), Machine Learning (ML), blockchain, and advances in the �humaninterface� and how users interact with Oracle Cloud SaaS offerings.
Our Oracle Cloud SaaS offerings include, among others:
� Oracle ERP Cloud, which is designed to be a complete, global and integrated ERP solution to helporganizations improve decision making and workforce productivity, and to optimize back-officeoperations by utilizing a single data and security model with a common user interface. We also offerNetSuite ERP, which is a cloud-based ERP product that is generally marketed to small to medium-sizedorganizations and is designed to run back-office operations and financial processes and includes financialmanagement, revenue management and billing, inventory, supply chain and warehouse managementcapabilities, among others;
� Oracle HCM Cloud, which is designed to help organizations find, develop and retain their talent, enablecollaboration, provide complete workforce insights, improve business process efficiency, and enable usersto connect to an integrated suite of HCM applications from any device;
� Oracle CX Cloud, which is designed to be a complete and integrated solution to help organizations deliverconsistent and personalized customer experiences across their customer channels, touch points andinteractions;
� Oracle SCM Cloud, which is designed to help organizations create, optimize and digitize their supplychains and innovate products quickly; and
� Oracle Data Cloud, which is designed to enable organizations to leverage their own data and consumerdata to inform and measure marketing strategies and programs.
Oracle Applications
Customers have the ability to license Oracle Applications for use within the Oracle Cloud or within their own cloud-based or on-premise IT environments. Oracle Applications are designed to manage and automate core businessfunctions across the enterprise, including HCM; ERP; financial management and governance, risk and compliance;procurement; project portfolio management; SCM; business analytics and enterprise performance management;CX and customer relationship management; and industry-specific applications, among others.
As described above, we provide customers with an option to purchase license support contracts in connection withthe purchase of Oracle Applications licenses.

7
Infrastructure Technologies
Oracle infrastructure technologies are marketed, sold and delivered through our cloud and license business andthrough our hardware business.
Our cloud and license business� infrastructure technologies include the Oracle Database, which is the world�s mostpopular enterprise database; Java, which is the computer industry�s most widely-used software developmentlanguage; middleware; and development tools, among others. These technologies are available throughsubscription to our Oracle Cloud IaaS offerings or with the purchase of a license to run within the Oracle Cloud orother cloud-based and on-premise IT environments and related license support at the customer�s option. Ourinfrastructure technologies are designed to provide cost-effective, standards-based, high-performance platformsand infrastructure to develop, run, integrate, manage and extend business applications. Our cloud and licenseinfrastructure technologies also provide cloud-based compute, storage and networking capabilities through ourOracle Cloud IaaS offerings. Our customers are increasingly focused on developing innovations and reducing thetotal cost of their IT infrastructure, and we believe that Oracle infrastructure technologies help them achieve thisgoal.
In addition to utilizing our cloud and license business� infrastructure technologies to modernize approaches to theirIT environments, customer interest is increasing for emerging technologies such as IoT, chatbots and AI/ML toautomate business processes, reduce human error and provide a platform to build new and innovativeapplications. We deliver emerging technologies through certain of our applications and infrastructuretechnologies, including as a part of Oracle Autonomous Data Warehouse Cloud Service, which is described furtherbelow.
Our hardware business� infrastructure technologies include hardware products and certain unique hardware-related software offerings, such as Oracle Engineered Systems, servers, storage, industry-specific hardware,virtualization software, operating systems, management software, and related hardware services includingsupport at the customer�s option.
We design our infrastructure technologies to work in customer environments that may include other Oracle ornon-Oracle hardware or software components. Our flexible and open approach provides Oracle customers achoice as to how they can utilize and deploy Oracle infrastructure technologies: through the use of Oracle Cloudofferings; in our customers� data centers; or a hybrid combination of these two deployment models, such as in theOracle Cloud at Customer deployment model. We focus on the operation and integration of Oracle infrastructuretechnologies to make them easier to deploy, extend, interconnect, manage and maintain for our customers and toimprove computing performance relative to our competitors� offerings. For example, we design Oracle EngineeredSystems to integrate multiple Oracle technology components to work together to deliver improved performance,availability, security and operational efficiency relative to our competitors� products.
Oracle Infrastructure Technologies � Cloud and License Business Offerings
Oracle infrastructure technologies are marketed, sold and delivered through our cloud and license business andrepresented 65%, 66% and 67% of our cloud and license business� total revenues in fiscal 2019, 2018 and 2017,respectively.
Oracle Cloud Infrastructure as a Service (IaaS)
Oracle Cloud IaaS is based upon Oracle�s Generation 2 Cloud technology and is designed to deliver platform,compute, storage and networking services, among others, that Oracle runs, manages, upgrades and supports onbehalf of the customer for a fee for a stated time period, or for certain of our IaaS services, on a �pay-as-you-go�basis for services at a specified rate. By utilizing Oracle Cloud IaaS, customers leverage the Oracle Cloud forenterprise-grade, scalable, cost-effective and secure infrastructure technologies that are designed to be rapidlydeployable while reducing the amount of time and resources normally consumed by IT processes within on-premise environments. Oracle Generation 2 Cloud infrastructure technology is designed to be differentiated fromother cloud vendors to provide better security by separating control code from customer data on separate

8
computers with a different architecture. We continue to invest in Oracle Cloud IaaS to expand the catalog of toolsand services we provide to simplify the process of migrating workloads to the Oracle Cloud, as well as to providecustomers with the ability to run workloads across on-premise IT environments and the Oracle Cloud in a hybriddeployment model. Customers use Oracle Cloud IaaS offerings to build and operate new cloud-native applications,to run new workloads and to move their existing Oracle or non-Oracle workloads to the Oracle Cloud from theirdata centers or from other cloud-based IT environments, among other uses.
Oracle customers and partners utilize Oracle�s open, standards-based IaaS offerings for platform related servicesthat are based upon the Oracle Database, Oracle Middleware including Java, open source, and other tools for avariety of use cases across data management, applications development, integration, content and experience,business analytics, IT operations management and security.
Oracle customers and partners also utilize Oracle Cloud IaaS for enterprise-grade compute, storage andnetworking services. Our Oracle Cloud IaaS offerings� compute services range from virtual machines to GPU-basedofferings to bare metal servers and include options for dense I/O workloads and high performance computing.Oracle Cloud IaaS also includes a range of storage offerings including block, object and archive storage services, aswell as containers, networking and edge services to help mitigate denial of service attacks on customer networks.
Oracle Cloud at Customer offerings are a direct response to restrictions imposed upon cloud-based IT environmentadoption by businesses that operate within certain regulated industries or jurisdictions. Oracle Cloud at Customerenables customers to access certain IaaS capabilities of the Oracle Cloud in their own data centers behind theirfirewalls while having the services managed by Oracle. Oracle Cloud at Customer offerings allow customers to takeadvantage of the agility, innovation and subscription-based pricing of Oracle Cloud Services while meeting datasovereignty, data residency, data protection and regulatory business policy requirements.
Oracle also offers Oracle Managed Cloud Services, which are designed to provide comprehensive software andhardware management, maintenance and security services for customer cloud-based, hybrid or otherinfrastructure for a fee for a stated term. Oracle Managed Cloud Services may be hosted at our Oracle data centerfacilities, select partner data centers or physically at our customers� facilities.
Oracle Database
The Oracle Database is the world�s most popular enterprise database and is designed to enable reliable and securestorage, retrieval and manipulation of all forms of data. The Oracle Database is licensed throughout the world bybusinesses and organizations of different sizes for a multitude of purposes, including, among others: for use withinthe Oracle Cloud to deliver our Cloud SaaS and Cloud IaaS offerings; for use by a number of cloud-based vendors inoffering their cloud services; for packaged and custom applications for transactions processing; and for datawarehousing and business intelligence. The Oracle Database may be deployed within different IT environmentsincluding Oracle Cloud and Oracle Cloud at Customer environments, other cloud-based IT environments, and on-premise data centers, among others. Customers may elect to purchase license support for Oracle Databaselicenses that are purchased at their option.
Oracle Database Enterprise Edition is available with a number of optional add-on products to address specificcustomer requirements. In addition to the Oracle Database, we also offer a portfolio of specialized databaseproducts to address particular customer requirements including MySQL, Oracle TimesTen In-Memory Database,Oracle Berkeley DB and Oracle NoSQL Database.

9
Oracle Autonomous Database
Oracle Autonomous Database is an Oracle Cloud IaaS offering that utilizes Oracle�s Generation 2 Cloudinfrastructure and is designed to deliver performance and scale with automated database operations and policy-driven optimization implemented with machine learning to lower labor costs and reduce human error for routinedatabase administration tasks including maintenance, tuning, patching, security and backup, among others. OracleAutonomous Database uses self-driving diagnostics for fault prediction and error handling. We believe OracleAutonomous Database can deliver rapid insights and innovation by enabling organizations to quickly provision adata warehouse that automatically and elastically scales to millions of transactions per second while enablingorganizations to pay only for the capacity used. Oracle Autonomous Database offerings include:
• Oracle Autonomous Data Warehouse Cloud Service (ADW), which is designed to be a fully managed, high-performance and elastic service optimized for data warehouse workloads. ADW�s self-patching and self-tuning capabilities are designed to enable upgrades while the database is running, eliminating humanerror. Oracle ADW automates manual IT tasks such as storing, securing, scaling and backing-up. Inaddition, the machine learning based technology of ADW is designed to enable customers to deploy newor move existing data marts and data warehouses to the cloud; and
• Oracle Autonomous Transaction Processing Cloud Service (ATP), which is designed to enable businesses tosafely run a complex mix of high-performance transactions, reporting and batch processing using instant,elastic compute and storage through an Oracle Database running on an Oracle Exadata cloud-basedinstance. Oracle ATP is designed to enable organizations to conduct real-time transactional data analysisfor faster results and lower administration costs, and to eliminate cyber-attacks on unpatched orunencrypted databases. Oracle ATP is designed to be simple and agile to develop and deploy newapplications because no complex management or tuning is required. The integration of Oracle ATP withother Oracle Cloud services, such as Java Cloud and Oracle APEX, and the open interfaces and integrationsof Oracle ATP provide developers with a modern, open platform to develop new innovative applications.
Oracle Big Data and Analytics
Big data generally refers to a massive amount of unstructured, streaming and structured data that is so large that itis difficult to process using traditional IT techniques. Oracle offers big data and analytics solutions to complementand extend Oracle applications and infrastructure technologies. We believe that most businesses view big data as apotentially high-value source of analytics that can be used to gain new insights into their customers� behaviors, toanticipate future demand more accurately, to align workforce deployment with business activity forecasts and toaccelerate the pace of operations, among other benefits. We offer a broad portfolio of offerings to address anorganization�s big data requirements including, among others, cloud-based services for data integration, datamanagement, analytics and integrated machine learning.
Oracle Middleware
We license our Oracle Middleware, which is a broad family of integrated application infrastructure software, foruse in the Oracle Cloud, other cloud-based environments, on-premise data centers and related IT environments.Oracle Middleware is designed to form a reliable and scalable foundation on which customers can build, deploy,secure, access, extend and integrate business applications and automate their business processes. Built withOracle�s Java technology platform, Oracle Middleware products are designed to be flexible across differentdeployment environments�cloud, on-premise or hybrid�as a foundation for custom, packaged and compositeapplications, thereby simplifying and reducing time to deployment. Oracle Middleware is designed to protectcustomers� IT investments and work with both Oracle and non-Oracle database, middleware and applicationssoftware through an open architecture and adherence to industry standards. Specifically, Oracle Middleware isdesigned to enable customers to integrate Oracle and non-Oracle business applications, automate businessprocesses, scale applications to meet customer demand, simplify security and compliance, manage lifecycles ofdocuments and get actionable, targeted business intelligence. In addition, Oracle Middleware supports multipledevelopment languages and tools, which enables developers to flexibly build and deploy web services, websites,portals and web-based applications globally across different IT environments.

10
Among our other middleware license offerings, we license a wide range of development tools, such as identitymanagement and business analytics software for mobile computing development that are designed to address theneeds of businesses that are increasingly focused on delivering mobile device applications to their customers. Wealso offer certain of these mobile development capabilities as a cloud service, including Oracle Mobile CloudService, among others.
Customers may elect to purchase license support, as described above, for Oracle Middleware licenses at theiroption.
Java
Java is the computer industry�s most widely-used software development language and is viewed as a globalstandard. We believe the Java programming language and platform together represent one of the most popularand powerful development environments in the world, one that is used by millions of developers globally todevelop embedded applications, web content, enterprise software and games. Oracle Middleware softwareproducts and certain of our Oracle Applications are built using the Oracle Java technology platform, which webelieve is a key advantage for our business. Customers may license the use of Java or access Java through OracleJava Cloud Service.
Java is designed to enable developers to write software on a single platform and run it on many other differentplatforms, independent of operating system and hardware architecture. Java has been adopted by bothindependent software vendors (ISVs) that have built their products on Java and by enterprise organizationsbuilding custom applications or consuming Java-based ISV products.
Oracle Infrastructure Technologies � Hardware Business Offerings
Oracle infrastructure technologies are also marketed, sold and delivered through our hardware business, includinga broad selection of hardware products and related hardware support services for cloud-based IT environments,data centers and related IT environments.
Oracle Engineered Systems
Oracle Engineered Systems are core to our cloud-based and on-premise data center infrastructure offerings.Oracle Engineered Systems are pre-integrated products, combining multiple unique Oracle technologycomponents, including database, storage, operating system or middleware software with server, storage andnetworking hardware and other technologies. Oracle Engineered Systems are designed to work together to deliverimproved performance, scalability, availability, security and operational efficiency relative to our competitors�products; to be upgraded effectively and efficiently; and to simplify maintenance cycles by providing a singlesolution for software patching. For example, Oracle Exadata Database Machine is a computing platform that isdesigned to be optimized for running Oracle Database to achieve higher performance and availability at a lowercost by combining Oracle Database, storage and operating system software with Oracle server, storage andnetworking hardware. We offer certain of our Oracle Engineered Systems, including Oracle Exadata DatabaseMachine, among others, through flexible deployment options, including on-premise, and as an infrastructure cloudservice and cloud at customer service.
Servers
We offer a wide range of server products that are designed for mission-critical enterprise environments and thatare key components of our engineered systems offerings and cloud offerings. We have two families of serverproducts: those based on the Oracle SPARC microprocessor, which are designed to be differentiated by theirreliability, security and scalability for UNIX environments; and those using microprocessors from Intel Corporation.By offering a range of server sizes and microprocessors, customers are offered the flexibility to choose the types ofservers that they believe will be most appropriate and valuable for their particular IT environments. We believe thecombination of Oracle server systems with Oracle software enhances our customers� ability to shift data andworkloads between data center and cloud deployments based on business requirements.

11
Storage
Oracle storage products are engineered for the cloud and designed to securely store, manage, protect and archivecustomers� mission-critical data assets generated by any database or application. Oracle storage products combineflash, disk, tape and server technologies with optimized software and unique integrations with Oracle Databasedesigned to offer greater performance and efficiency, and lower total cost relative to our competitors� storageproducts. Certain of our storage products are also offered as cloud-based services through the Oracle Cloud. Ourstorage offerings include, among others, Oracle ZFS Storage Appliance, a unified storage system that combinesnetwork attached storage, storage area network and object storage capabilities; Oracle�s Zero Data Loss RecoveryAppliance that provides unique, recovery-focused data protection for Oracle Database; and Oracle�s StorageTektape storage and automation product line which includes tape drives, tape libraries, media and software packagesthat provide lifecycle data management and security for enterprise backup and archive requirements.
Industry-Specific Hardware Offerings
We offer hardware products and services designed for certain specific industries including our point-of-saleterminals and related hardware that are designed for managing businesses within the food and beverage, hoteland retail industries; and hardware products and services for communications networks including networksignaling, policy control and subscriber data management solutions, and session border control technology, amongothers.
Operating Systems, Virtualization, Management and Other Hardware-Related Software
We offer a portfolio of operating systems, including Oracle Linux and Oracle Solaris, virtualization softwareincluding Oracle VM, and other hardware-related software including development, management and file systemstools that are designed to optimize the performance, efficiency, and security of customers� hardware productswhile providing customers with high levels of flexibility, reliability and availability. We also offer a range ofmanagement technologies and products, including Oracle Enterprise Manager, designed to help customersefficiently operate complex IT environments, including both end users� and service providers� cloud environments.
Hardware Support
Our hardware support offerings provide customers with unspecified software updates for software componentsthat are essential to the functionality of our hardware products and associated software products such as OracleSolaris. These offerings can also include product repairs, maintenance services and technical support services. Wecontinue to evolve hardware support processes that are intended to proactively identify and solve quality issuesand to increase the amount of new and renewed hardware support contracts sold in connection with the sales ofour hardware products. Hardware support contracts are generally priced as a percentage of the net hardwareproducts fees.
Services
We offer services solutions to help customers and partners maximize the performance of their investments inOracle applications and infrastructure technologies. We believe that our services are differentiated based on ourfocus on Oracle technologies, extensive experience and broad sets of intellectual property and best practices. Ourservices offerings include, among others:
� consulting services, which are designed to help our customers and global system integrator partners moresuccessfully architect and deploy our cloud and license offerings, including IT strategy alignment,enterprise architecture planning and design, initial software implementation and integration, applicationdevelopment and integration services, security assessments and ongoing software enhancements andupgrades. We utilize a global, blended delivery model to optimize value for our customers and partners,consisting of consultants from local geographies, industry specialists and consultants from our globaldelivery and solution centers;

12
� advanced customer support services, which are provided at customer facilities and remotely to enableincreased performance and higher availability of their Oracle products and services; and
� education services for Oracle�s cloud and license offerings, including training and certification programsthat are offered to customers, partners and employees through a variety of formats including instructor-led classes, live virtual training, video-based training on demand, online learning subscriptions, privateevents and custom training.
Oracle Cloud Operations
Oracle Cloud Operations deliver our Oracle Cloud Services to customers through a secure, reliable, scalable,enterprise grade cloud infrastructure platform managed by our employees within a global network of data centers,which we refer to as the Oracle Cloud. Oracle Cloud Operations leverage automated software tools to enable therapid delivery of the latest cloud technology capabilities to the Oracle Cloud as they become available. The OracleCloud enables secure and isolated cloud-based instances for each of our customers to access the functionality ofour Oracle Cloud Services via a broad spectrum of devices.
Manufacturing
To produce our hardware products that we market and sell to third-party customers and that we utilize internallyto deliver as a part of our Oracle Cloud operations, we rely on both our internal manufacturing operations as wellas third-party manufacturing partners. Our internal manufacturing operations consist primarily of materialsprocurement, assembly, testing and quality control of our Oracle Engineered Systems and certain of our enterpriseand data center servers and storage products. For all other manufacturing, we generally rely on third-partymanufacturing partners to produce our hardware-related components and hardware products and we may involveour internal manufacturing operations in the final assembly, testing and quality control processes for thesecomponents and products. We distribute most of our hardware products from either our facilities or partnerfacilities. Our manufacturing processes are substantially based on standardization of components across producttypes, centralization of assembly and distribution centers and a �build-to-order� methodology in which productsgenerally are built only after customers have placed firm orders. Production of our hardware products requiresthat we purchase materials, supplies, product subassemblies and full assemblies from a number of vendors. Formost of our hardware products, we have existing alternate sources of supply or such sources are readily available.However, we do rely on sole sources for certain of our hardware products. As a result, we continue to evaluatepotential risks of disruption to our supply chain operations. Refer to �Risk Factors� included in Item 1A within thisAnnual Report for additional discussion of the challenges we encounter with respect to the sources and availabilityof supplies for our products and the related risks to our business.
Sales and Marketing
We directly market and sell our cloud, license, hardware and services offerings to businesses of many sizes and inmany industries, government agencies and educational institutions. We also market and sell our offerings throughindirect channels. No single customer accounted for 10% or more of our total revenues in fiscal 2019, 2018 and2017.
In the United States (U.S.), our sales and services employees are based in our headquarters and in field officesthroughout the country. Outside the U.S., our international subsidiaries sell, support and service our offerings intheir local countries as well as within other foreign countries where we do not operate through a direct salessubsidiary. Our geographic coverage allows us to draw on business and technical expertise from a globalworkforce, provides stability to our operations and revenue streams to offset geography specific economic trendsand offers us an opportunity to take advantage of new markets for our offerings. Our international operationssubject us to certain risks, which are more fully described in �Risk Factors� included in Item 1A of this AnnualReport. A summary of our domestic and international revenues and long-lived assets is set forth in Note 15 ofNotes to Consolidated Financial Statements included elsewhere in this Annual Report.
13
We also market our product offerings worldwide through indirect channels. The companies that comprise ourindirect channel network are members of the Oracle Partner Network. The Oracle Partner Network is a globalprogram that manages our business relationships with a large, broad-based network of companies, includingindependent software and hardware vendors, system integrators and resellers that deliver innovative solutionsand services based upon our product offerings. By offering our partners access to our product offerings,educational information, technical services, marketing and sales support, the Oracle Partner Network programextends our market reach by providing our partners with the resources they need to be successful in deliveringsolutions to customers globally. The majority of our hardware products are sold through indirect channelsincluding independent distributors and value-added resellers.
Research and Development
We develop the substantial majority of our product offerings internally. In addition, we have extended our productofferings and intellectual property through acquisitions of businesses and technologies. We also purchase orlicense intellectual property rights in certain circumstances. Internal development allows us to maintain technicalcontrol over the design and development of our products. We have a number of U.S. and foreign patents andpending applications that relate to various aspects of our products and technology. While we believe that ourpatents have value, no single patent is essential to us or to any of our principal businesses. Rapid technologicaladvances in hardware and software development, evolving standards in computer hardware and softwaretechnology, changing customer needs and frequent new product introductions, offerings and enhancementscharacterize the markets in which we compete. We plan to continue to dedicate a significant amount of resourcesto research and development efforts to maintain and improve our current product and service offerings.
Employees
As of May 31, 2019, we employed approximately 136,000 full-time employees, including approximately 39,000 insales and marketing, approximately 18,000 in our cloud services and license support operations, approximately4,000 in hardware, approximately 24,000 in services, approximately 38,000 in research and development andapproximately 13,000 in general and administrative positions. Of these employees, approximately 48,000 wereemployed in the U.S. and approximately 88,000 were employed internationally. None of our employees in the U.S.is represented by a labor union; however, in certain foreign subsidiaries, labor unions or workers� councilsrepresent some of our employees.
Seasonality and Cyclicality
Our quarterly revenues have historically been affected by a variety of seasonal factors, including the structure ofour sales force incentive compensation plans, which are common in the technology industry. In each fiscal year,our total revenues and operating margins are typically highest in our fourth fiscal quarter and lowest in our firstfiscal quarter. The operating margins of our businesses (in particular, our cloud and license business and hardwarebusiness) are generally affected by seasonal factors in a similar manner as our revenues because certain expenseswithin our cost structure are relatively fixed in the short term. See �Cloud and License Business� and �SelectedQuarterly Financial Data� in Item 7 of this Annual Report for more information regarding the seasonality andcyclicality of our revenues, expenses and margins.
Competition
We face intense competition in all aspects of our business. The nature of the IT industry creates a competitivelandscape that is constantly evolving as firms emerge, expand or are acquired, as technology evolves and ascustomer demands and competitive pressures otherwise change.

14
Our customers are demanding less complexity and lower total cost in the implementation, sourcing, integrationand ongoing maintenance of their enterprise software and hardware. Our enterprise cloud license and on-premiselicense, and hardware offerings compete directly with certain offerings from some of the largest and mostcompetitive companies in the world, including Amazon.com, Inc., Microsoft Corporation, International BusinessMachines Corporation (IBM), Intel Corporation, Cisco Systems, Inc., Adobe Systems Incorporated, Alphabet Inc.and SAP SE, as well as other companies like Hewlett-Packard Enterprise, salesforce.com, inc. and Workday, Inc. Inaddition, due to the low barriers to entry in many of our market segments, new technologies and new and growingcompetitors frequently emerge to challenge our offerings. Our competitors range from companies offering broadIT solutions across many of our lines of business to vendors providing point solutions, or offerings focused on aspecific functionality, product area or industry. In addition, as we expand into new market segments, we faceincreased competition as we compete with existing competitors, as well as firms that may be partners in otherareas of our business and other firms with whom we have not previously competed. Moreover, we or ourcompetitors may take certain strategic actions�including acquisitions, partnerships and joint ventures, orrepositioning of product lines�which invite even greater competition in one or more product offering categories.
Key competitive factors in each of the segments in which we currently compete and may compete in the futureinclude: total cost of ownership, performance, scalability, reliability, security, functionality, efficiency, speed toproduction and quality of technical support. Our product and service sales (and the relative strength of ourproducts and services versus those of our competitors) are also directly and indirectly affected by the following,among other things:
� the adoption of cloud-based IT offerings including SaaS and IaaS offerings;
� ease of deployment, use and maintenance of our products and services offerings;
� compatibility between Oracle products and services deployed within local IT environments and publiccloud IT environments, including our Oracle Cloud environments;
� the adoption of commodity servers and microprocessors;
� the broader �platform� competition between our industry standard Java technology platform and the.NET programming environment of Microsoft;
� operating system competition among our Oracle Solaris and Linux operating systems, with alternativesincluding Microsoft�s Windows Server, and other UNIX and Linux operating systems;
� the adoption of open source alternatives to commercial software by enterprise software customers;
� products, features and functionality developed internally by customers and their IT staff;
� products, features and functionality customized and implemented for customers by consultants, systemsintegrators or other third parties; and
� attractiveness of offerings from business processing outsourcers.
For more information about the competitive risks we face, refer to Item 1A. �Risk Factors� included elsewhere inthis Annual Report.
Available Information
Our Annual Report on Form 10-K, Quarterly Reports on Form 10-Q, Current Reports on Form 8-K and amendmentsto those reports filed pursuant to Sections 13(a) and 15(d) of the Securities Exchange Act of 1934, as amended, areavailable, free of charge, on the SEC�s website at www.sec.gov and our Investor Relations website atwww.oracle.com/investor as soon as reasonably practicable after we electronically file such materials with, orfurnish it to, the SEC. We use our Investor Relations website as a means of disclosing material non-publicinformation. Accordingly, investors should monitor our Investor Relations website, in addition to following ourpress releases, SEC filings and public conference calls and webcasts. In addition, information regarding ourenvironmental policy and global sustainability initiatives and solutions are also available on our websitewww.oracle.com/corporate/citizenship. The information posted on or accessible through our website is notincorporated into this Annual Report.

15
Information about our Executive Officers
Our executive officers are listed below.
Name Office(s)
Lawrence J. Ellison. . . . . . . . . . . . . . . . . Chairman of the Board of Directors and Chief Technology OfficerSafra A. Catz. . . . . . . . . . . . . . . . . . . . . . . . Chief Executive Officer and DirectorMark V. Hurd . . . . . . . . . . . . . . . . . . . . . . Chief Executive Officer and DirectorJeffrey O. Henley . . . . . . . . . . . . . . . . . . Vice Chairman of the Board of DirectorsEdward Screven. . . . . . . . . . . . . . . . . . . . Executive Vice President, Chief Corporate ArchitectDorian E. Daley . . . . . . . . . . . . . . . . . . . . Executive Vice President and General CounselWilliam Corey West . . . . . . . . . . . . . . . Executive Vice President, Corporate Controller and Chief Accounting Officer
Mr. Ellison, 74, has been our Chairman of the Board and Chief Technology Officer since September 2014. He servedas our Chief Executive Officer from June 1977, when he founded Oracle, until September 2014. He has served as aDirector since June 1977. He previously served as our Chairman of the Board from May 1995 to January 2004. Hecurrently serves as a director of Tesla, Inc.
Ms. Catz, 57, has been our Chief Executive Officer since September 2014. She served as our President from January2004 to September 2014, our Chief Financial Officer most recently from April 2011 until September 2014 and aDirector since October 2001. She was previously our Chief Financial Officer from November 2005 until September2008 and our Interim Chief Financial Officer from April 2005 until July 2005. Prior to being named our President,she held various other positions with us since joining Oracle in 1999. She currently serves as a director of The WaltDisney Company and she previously served as a director of HSBC Holdings plc.
Mr. Hurd, 62, has been our Chief Executive Officer since September 2014. He served as our President fromSeptember 2010 to September 2014 and a Director since September 2010. Prior to joining us, he served asChairman of the Board of Directors of Hewlett-Packard Company from September 2006 to August 2010 and asChief Executive Officer, President and a member of the Board of Directors of Hewlett-Packard Company from April2005 to August 2010.
Mr. Henley, 74, has served as our Vice Chairman of the Board since September 2014. He previously served as ourChairman of the Board from January 2004 to September 2014 and has served as a Director since June 1995. Heserved as our Executive Vice President and Chief Financial Officer from March 1991 to July 2004.
Mr. Screven, 54, has been Executive Vice President, Chief Corporate Architect since May 2015. He served as ourSenior Vice President, Chief Corporate Architect from November 2006 to April 2015 and as Vice President, ChiefCorporate Architect from January 2003 to November 2006. He held various other positions with us since joiningOracle in 1986.
Ms. Daley, 60, has been our Executive Vice President and General Counsel since April 2015. She served as ourSecretary from October 2007 until October 2017 and she was our Senior Vice President, General Counsel fromOctober 2007 to April 2015. She served as our Vice President, Legal, Associate General Counsel and AssistantSecretary from June 2004 to October 2007, as Associate General Counsel and Assistant Secretary from October2001 to June 2004 and as Associate General Counsel from February 2001 to October 2001. She held various otherpositions with us since joining Oracle�s Legal Department in 1992.
Mr. West, 57, has been our Executive Vice President, Corporate Controller and Chief Accounting Officer since April2015. He served as our Senior Vice President, Corporate Controller and Chief Accounting Officer from February2008 to April 2015 and served as our Vice President, Corporate Controller and Chief Accounting Officer from April2007 to February 2008. His previous experience includes 14 years with Arthur Andersen LLP, most recently as apartner.

16
Item 1A. Risk Factors
We operate in rapidly changing economic and technological environments that present numerous risks, many ofwhich are driven by factors that we cannot control or predict. The following discussion, as well as our �CriticalAccounting Policies and Estimates� discussion in Management�s Discussion and Analysis of Financial Condition andResults of Operations (Item 7), highlights some of these risks. The risks described below are not exhaustive and youshould carefully consider these risks and uncertainties before investing in our securities.
Our success depends upon our ability to develop new products and services, integrate acquired products andservices and enhance our existing products and services. Rapid technological advances, intense competition,changing delivery models and evolving standards in computer hardware and software development andcommunications infrastructure, changing and increasingly sophisticated customer needs and frequent newproduct introductions and enhancements characterize the industries in which we compete. If we are unable todevelop new or sufficiently differentiated products and services, enhance and improve our product offerings andsupport services in a timely manner or position and price our products and services to meet demand, customersmay not purchase or subscribe to our license, hardware or cloud offerings or renew license support, hardwaresupport or cloud subscriptions contracts. Renewals of these contracts are important to the growth of our business.In addition, we cannot provide any assurance that the standards on which we choose to develop new products willallow us to compete effectively for business opportunities in emerging areas.
We have continued to refresh and release new offerings of our cloud products and services, including the launch ofthe Oracle Autonomous Data Warehouse Cloud Service. The Oracle Autonomous Data Warehouse Cloud Serviceoffers automation based on machine learning and we have guaranteed, among other matters, that it will reducecustomer downtime to less than 30 minutes a year and that Amazon Data Warehouse customers will see asignificant cost reduction if they migrate their workloads to our offering. Machine learning and artificialintelligence are increasingly driving innovations in technology but if they fail to operate as anticipated or theOracle Autonomous Data Warehouse Cloud Service or our other products do not perform as promised, ourbusiness and reputation may be harmed.
In addition, our business may be adversely affected if:
� we do not continue to develop and release new or enhanced products and services within the anticipatedtime frames;
� infrastructure costs to deliver new or enhanced products and services take longer or result in greatercosts than anticipated;
� there is a delay in market acceptance of and difficulty in transitioning new and existing customers to new,enhanced or acquired product lines or services;
� there are changes in information technology (IT) trends that we do not adequately anticipate or addresswith our product development efforts;
� we do not optimize complementary product lines and services in a timely manner; or
� we fail to adequately integrate, support or enhance acquired product lines or services.
Our Oracle Cloud strategy, including our Oracle Software-as-a-Service (SaaS) and Infrastructure-as-a-Service(IaaS) offerings, may adversely affect our revenues and profitability. We provide our cloud and other offeringsto customers worldwide via deployment models that best suit their needs, including via our cloud-based SaaS andIaaS offerings. As these business models continue to evolve, we may not be able to compete effectively, generatesignificant revenues or maintain the profitability of our cloud offerings. Additionally, the increasing prevalence ofcloud and SaaS delivery models offered by us and our competitors may unfavorably impact the pricing of our cloudand license offerings. If we do not successfully execute our cloud computing strategy or anticipate the cloudcomputing needs of our customers, our reputation as a cloud services provider could be harmed and our revenuesand profitability could decline.

17
As customer demand for our cloud offerings increases, we experience volatility in our reported revenues andoperating results due to the differences in timing of revenue recognition between our cloud license and on-premise license, and hardware product arrangements relative to our cloud offering arrangements. Customersgenerally purchase our cloud offerings on a subscription basis and revenues from these offerings are generallyrecognized ratably over the terms of the subscriptions. Consequently, any deterioration in sales activity associatedwith our cloud offerings may not be immediately observable in our consolidated statement of operations. This is incontrast to revenues associated with our license and hardware product arrangements, which are generallyrecognized in full at the time of delivery of the related licenses and hardware products.
We have also acquired a number of cloud computing companies, and the integration of these companies into ourOracle Cloud strategy may not be as efficient or scalable as anticipated, which could adversely affect our ability tofully realize the benefits anticipated from these acquisitions.
We might experience significant coding, manufacturing or configuration errors in our cloud, license andhardware offerings. Despite testing prior to the release and throughout the lifecycle of a product or service, ourcloud, license and hardware offerings sometimes contain coding or manufacturing errors that can impact theirfunction, performance and security, and result in other negative consequences. The detection and correction ofany errors in released cloud, license or hardware offerings can be time consuming and costly. Errors in our cloud,license or hardware offerings could affect their ability to properly function, integrate or operate with other cloud,license or hardware offerings, could delay the development or release of new products or services or new versionsof products or services, could create security vulnerabilities in our products or services, and could adversely affectmarket acceptance of our products or services. This includes third-party software products or servicesincorporated into our own. If we experience errors or delays in releasing our cloud, license or hardware offeringsor new versions of these offerings, our sales could be affected and revenues could decline. In addition, we runOracle�s business operations as well as cloud and other services that we offer to our customers on our productsand networks. Therefore, any flaws could affect our and our customers� abilities to conduct business operationsand to ensure accuracy in financial processes and reporting, and may result in unanticipated costs. Enterprisecustomers rely on our cloud, license and hardware offerings and related services to run their businesses and errorsin our cloud, license and hardware offerings and related services could expose us to product liability, performanceand warranty claims as well as significant harm to our brand and reputation, which could impact our future sales.
If our security measures for our products and services are compromised and as a result, our data, our customers�data or our IT systems are accessed improperly, made unavailable, or improperly modified, our products andservices may be perceived as vulnerable, our brand and reputation could be damaged, the IT services we provideto our customers could be disrupted, and customers may stop using our products and services, all of which couldreduce our revenue and earnings, increase our expenses and expose us to legal claims and regulatoryactions. We are in the IT business, and our products and services, including our Oracle Cloud Services, store,retrieve, manipulate and manage our customers� information and data, external data, as well as our own data. Wehave a reputation for secure and reliable product offerings and related services and we have invested a great dealof time and resources in protecting the integrity and security of our products, services and the internal andexternal data that we manage. At times, we encounter attempts by third parties (which may include individuals orgroups of hackers and sophisticated organizations, such as state-sponsored organizations, nation states andindividuals sponsored by them) to identify and exploit product and service vulnerabilities, penetrate or bypass oursecurity measures, and gain unauthorized access to our or our customers�, partners� and suppliers� software,hardware and cloud offerings, networks and systems, any of which could lead to the compromise of personalinformation or the confidential information or data of Oracle or our customers. Computer hackers and others maybe able to develop and deploy IT related viruses, worms, and other malicious software programs that could attackour networks, systems, products and services, exploit potential security vulnerabilities of our networks, systems,products and services, create system disruptions and cause shutdowns or denials of service. This is also true forthird-party data, products or services incorporated into our own. Our products and services, including our OracleCloud Services may also be accessed or modified improperly as a result of customer, partner, employee or suppliererror or malfeasance and third parties may attempt to fraudulently induce customers, partners, employees orsuppliers into disclosing sensitive information such as user names, passwords or other information in order to gainaccess to our data, our customers�, suppliers� or partners� data or the IT systems of Oracle, our customers,suppliers or partners.

18
Security industry experts and government officials have warned about the risks of hackers and cyber-attackstargeting IT products and businesses. Although this is an industry-wide problem that affects software andhardware companies generally, it affects Oracle in particular because computer hackers tend to focus their effortson the most prominent IT companies, and they may focus on Oracle because of our reputation for, and marketingefforts associated with, having secure products and services. These risks will increase as we continue to grow ourcloud offerings and store and process increasingly large amounts of data, including personal information and ourcustomers� confidential information and data, and host or manage parts of our customers� businesses in cloud-based IT environments, especially in customer sectors involving particularly sensitive data such as health sciences,financial services, retail, hospitality and the government. We also have an active acquisition program and haveacquired a number of companies, products, services and technologies over the years. While we make significantefforts to address any IT security issues with respect to our acquired companies, we may still inherit such riskswhen we integrate these companies within Oracle.
Because the techniques used to obtain unauthorized access to, or sabotage IT systems change frequently, growmore complex over time, and often are not recognized until launched against a target, we may be unable toanticipate or implement adequate measures to prevent against such techniques. Our internal IT systems continueto evolve and we are often early adapters of new technologies. However, our business policies and internalsecurity controls may not keep pace with these changes as new threats emerge. In addition, we may not discoverany security breach and loss of information for a significant period of time after the security breach.
We could suffer significant damage to our brand and reputation if a cyber-attack or other security incident were toallow unauthorized access to or modification of our customers� or suppliers� data, other external data, or our owndata or our IT systems or if the services we provide to our customers were disrupted, or if our products or servicesare reported to have or are perceived as having security vulnerabilities. Customers could lose confidence in thesecurity and reliability of our products and services, including our cloud offerings, and perceive them to not besecure. This could lead to fewer customers using our products and services and result in reduced revenues andearnings. The costs we would incur to address and fix these security incidents would increase our expenses. Thesetypes of security incidents could also lead to loss or destruction of information, inappropriate use of proprietaryand sensitive data, lawsuits, indemnity obligations, regulatory investigations and financial penalties, and claimsand increased legal liability, including in some cases contractual costs related to customer notification and fraudmonitoring.
Our products operate in conjunction with and are dependent on products and components across a broadecosystem. If there is a security vulnerability in one of these components, and if there is a security exploit targetingit, we could face increased costs, liability claims, customer dissatisfaction, reduced revenue, or harm to ourreputation or competitive position.
Our business practices with respect to data could give rise to operational interruption, liabilities or reputationalharm as a result of governmental regulation, legal requirements or industry standards relating to consumerprivacy and data protection. As regulatory focus on privacy issues continues to increase and worldwide laws andregulations concerning the handling of personal information expand and become more complex, potential risksrelated to data collection and use within our business will intensify. In addition, U.S. and foreign governments haveenacted or are considering enacting legislation or regulations, or may in the near future interpret existinglegislation or regulations, in a manner that could significantly impact our ability, as well as the ability of ourcustomers, partners and data providers, to collect, augment, analyze, use, transfer and share personal and otherinformation that is integral to certain services we provide. For example, certain data transfer mechanisms arecurrently subject to challenges in European courts, which may lead to uncertainty about the legal basis for datatransfers to the U.S. or interruption of such transfers. In the event any court blocks transfers to or from a particularjurisdiction on the basis that no transfer mechanisms are legally adequate, this could give rise to operationalinterruption in the performance of services for customers and internal processing of employee information,regulatory liabilities or reputational harm. This impact could also occur in those jurisdictions where privacy laws orregulators take a broader view of how personal information is defined, therefore subjecting the handling of suchdata to heightened restrictions that may be obstructive to our operations and the operations of our customers,partners and data providers. This impact could be acute in countries that have passed or are considering passinglegislation that requires data to remain localized �in country,� as this imposes financial costs on any serviceprovider that is required to store data in jurisdictions not of its choosing and nonstandard operational processesthat are difficult and costly to integrate with global processes.

19
In the wake of the European Union General Data Protection Regulation (GDPR), the rate of global considerationand adoption of privacy laws has increased, giving rise to more global jurisdictions in which regulatory inquiriesand audits may be requested of Oracle, and if not deemed to be in compliance, could result in enforcement actionsand/or fines. This is true in the U.S. where California recently enacted the California Consumer Privacy Act (CCPA)effective in January 2020, Congress is considering several privacy bills at the federal level, and other statelegislatures are considering privacy laws. Regulators globally are also imposing greater monetary fines for privacyviolations. The GDPR, which became effective in May 2018, provides for monetary penalties of up to 4% of anorganization�s worldwide revenue. One European data protection regulator has fined a major U.S. technologycompany EUR 50 million for its data handling practices. The U.S. Federal Trade Commission continues to finecompanies on a regular basis for unfair and deceptive data protection practices, and these fines may increase insize. The CCPA provides for statutory damages on a per violation basis that could be very large in the event of asignificant data security breach or other CCPA violation. Taken together, the changes in laws or regulationsassociated with the enhanced protection of personal and other types of data could greatly increase the size ofpotential fines related to data protection, and our cost of providing our products and services could result inchanges to our business practices or even prevent us from offering certain services in jurisdictions in which weoperate. Although we have implemented contracts, policies and procedures designed to ensure compliance withapplicable laws and regulations, there can be no assurance that our employees, contractors, partners, dataproviders or agents will not violate such laws and regulations or our contracts, policies and procedures.Additionally, public perception and standards related to the privacy of personal information can shift rapidly, inways that may affect our reputation or influence regulators to enact regulations and laws that may limit our abilityto provide certain products.
We make statements about our use and disclosure of personal information through our privacy policy, informationprovided on our website and press statements. Any failure, or perceived failure, by us to comply with these publicstatements or with U.S. federal, state, or foreign laws and regulations, including laws and regulations regulatingprivacy, data security, or consumer protection, public perception, standards, self-regulatory requirements or legalobligations, could result in lost or restricted business, proceedings, actions or fines brought against us or levied bygovernmental entities or others, or could adversely affect our business and harm our reputation.
Economic, political and market conditions can adversely affect our business, results of operations and financialcondition, including our revenue growth and profitability, which in turn could adversely affect our stock price.Our business is influenced by a range of factors that are beyond our control and that we have no comparativeadvantage in forecasting. These include:
� general economic and business conditions;
� overall demand for enterprise cloud, license and hardware products and services;
� governmental budgetary constraints or shifts in government spending priorities; and
� general legal, regulatory and political developments.
Macroeconomic developments like the developments associated with the United Kingdom�s vote to exit the EU(Brexit), evolving trade policies between the U.S. and international trade partners, or the occurrence of similarevents in other countries that lead to uncertainty or instability in economic, political or market conditions couldnegatively affect our business, operating results, financial condition and outlook, which, in turn, could adverselyaffect our stock price. Any general weakening of, and related declining corporate confidence in, the globaleconomy or the curtailment of government or corporate spending could cause current or potential customers toreduce or eliminate their IT budgets and spending, which could cause customers to delay, decrease or cancelpurchases of our products and services or cause customers not to pay us or to delay paying us for previouslypurchased products and services.

20
In addition, international, regional or domestic political unrest and the related potential impact on global stability,terrorist attacks and the potential for other hostilities in various parts of the world, potential public health crisesand natural disasters continue to contribute to a climate of economic and political uncertainty that could adverselyaffect our results of operations and financial condition, including our revenue growth and profitability. Thesefactors generally have the strongest effect on our sales of cloud license and on-premise license, hardware andrelated services and, to a lesser extent, also may affect our renewal rates for license support and our subscription-based cloud offerings.
If we are unable to compete effectively, the results of operations and prospects for our business could beharmed. We face intense competition in all aspects of our business. The nature of the IT industry creates acompetitive landscape that is constantly evolving as firms emerge, expand or are acquired, as technology evolvesand as delivery models change. Many vendors spend amounts in excess of what Oracle spends to develop andmarket applications and infrastructure technologies including databases, middleware products, applicationdevelopment tools, business applications, collaboration products and business intelligence, compute, storage andnetworking products, among others, which compete with Oracle applications and infrastructure offerings. Use ofour competitors� technologies may influence a customer�s purchasing decision or create an environment thatmakes it less efficient to utilize or migrate to Oracle products and services. Our competition may also adoptbusiness practices that provide customers access to competing products and services at a risk profile that we maynot generally find acceptable, which may convince customers to purchase competitor products and services. Wecould lose customers if our competitors introduce new competitive products, add new functionality, acquirecompetitive products, reduce prices, better execute on their sales and marketing strategies, offer more flexiblebusiness practices or form strategic alliances with other companies. We may also face increasing competition fromopen source software initiatives in which competitors may provide software and intellectual property for free.Existing or new competitors could gain sales opportunities or customers at our expense.
We may need to change our pricing models to compete successfully. The intense competition we face in thesales of our products and services and general economic and business conditions can put pressure on us to changeour prices. If our competitors offer deep discounts on certain products or services or develop products that themarketplace considers more valuable, we may need to lower prices or offer other favorable terms in order tocompete successfully. Any such changes may reduce margins and could adversely affect operating results.Additionally, the increasing prevalence of cloud delivery models offered by us and our competitors mayunfavorably impact the pricing of our other cloud and license, hardware and services offerings, and we may alsoincur increased cloud delivery expenses as we expand our cloud operations and update our infrastructure, all ofwhich could reduce our revenues and/or profitability. Our license support fees and hardware support fees aregenerally priced as a percentage of our net license fees and net new hardware products fees, respectively. Ourcompetitors may offer lower pricing on their support offerings, which could put pressure on us to further discountour offerings.
We introduced Oracle Bring Your Own License (BYOL) and Universal Credit Pricing to simplify the way customerspurchase and consume our cloud services. Oracle BYOL enables customers to maintain their existing softwarelicenses for Oracle Infrastructure while expanding their platform technology footprint at a discounted price. OracleUniversal Credit Pricing provides a flexible model for customers to access Oracle Infrastructure services on demandvia a single contract. Any future changes to our prices and pricing policies could cause our revenues to decline orbe delayed as our sales force implements and our customers adjust to the new pricing policies. Some of ourcompetitors may bundle products for promotional purposes or as a long-term pricing strategy, commit to largecustomer deployments at prices that are unprofitable, or provide guarantees of prices and productimplementations. These practices could, over time, significantly constrain the prices that we can charge for certainof our products. If we do not adapt our pricing models to reflect changes in customer use of our products orchanges in customer demand, our revenues could decrease. The increase in open source software distribution mayalso cause us to change our pricing models.
21
Our international sales and operations subject us to additional risks that can adversely affect our operatingresults. We derive a substantial portion of our revenues from, and have significant operations, outside of theU.S. Our international operations include cloud operations, cloud, software and hardware development,manufacturing, assembly, sales, customer support, consulting and other services and shared administrative servicecenters.
Compliance with international and U.S. laws and regulations that apply to our international operations increasesour cost of doing business in foreign jurisdictions. These laws and regulations include U.S. laws and local lawswhich include data privacy requirements, labor relations laws, tax laws, foreign currency-related regulations, anti-competition regulations, prohibitions on payments to governmental officials, market access, tariffs, import, exportand general trade regulations, including but not limited to economic sanctions and embargos. Violations of theselaws and regulations could result in fines and penalties, criminal sanctions against us, our officers or ouremployees, and prohibitions on the conduct of our business, including the loss of trade privileges. Any suchviolations could result in prohibitions on our ability to offer our products and services in one or more countries,could delay or prevent potential acquisitions and could also materially damage our reputation, our brand, ourinternational expansion efforts, our ability to attract and retain employees, our business and our operating results.Compliance with these laws requires a significant amount of management attention and effort, which may divertmanagement�s attention from running our business operations and could harm our ability to grow our business, ormay increase our expenses as we engage specialized or other additional resources to assist us with our complianceefforts. Our success depends, in part, on our ability to anticipate these risks and manage these difficulties. Wemonitor our operations and investigate allegations of improprieties relating to transactions and the way in whichsuch transactions are recorded. Where circumstances warrant, we provide information and report our findings togovernment authorities, but no assurance can be given that action will not be taken by such authorities.
We are also subject to a variety of other risks and challenges in managing an organization operating globally,including those related to:
� general economic conditions in each country or region;
� fluctuations in currency exchange rates and related impacts on customer demand and our operatingresults;
� difficulties in transferring funds from or converting currencies in certain countries that could lead to adevaluation of our net assets, in particular our cash assets, in that country�s currency;
� regulatory changes, including government austerity measures in certain countries that we may not beable to sufficiently plan for or avoid that may unexpectedly impair bank deposits or other cash assets thatwe hold in these countries or that impose additional taxes that we may be required to pay in thesecountries;
� political unrest, terrorism and the potential for other hostilities;
� common local business behaviors that are in direct conflict with our business ethics, practices andconduct policies;
� natural disasters;
� the effects of climate change (such as sea level rise, drought, flooding, wildfires and increased stormsensitivity);
� longer payment cycles and difficulties in collecting accounts receivable;
� overlapping tax regimes;
� public health risks, social risks and supporting infrastructure stability risks, particularly in areas in whichwe have significant operations; and
� reduced protection for intellectual property rights in some countries.

22
The variety of risks and challenges listed above could also disrupt or otherwise negatively impact the supply chainoperations for our hardware business and the sales of our products and services in affected countries or regions.
As the majority shareholder of Oracle Financial Services Software Limited, a publicly traded company in India, andOracle Corporation Japan, a publicly traded company in Japan, we are faced with several additional risks, includingbeing subject to local securities regulations and being unable to exert full control that we would otherwise have ifthese entities were wholly-owned subsidiaries.
Any failure to offer high-quality technical support services may adversely affect our relationships with ourcustomers and our financial results. Our customers depend on our support organization to resolve technicalissues relating to our applications and infrastructure offerings. We may be unable to respond quickly enough toaccommodate short-term increases in customer demand for support services. Increased customer demand forthese services, without corresponding revenues, could increase costs and adversely affect our operating results.Any failure to maintain high-quality technical support, or a market perception that we do not maintain high-qualitytechnical support, could adversely affect our reputation, our ability to sell our applications to existing andprospective customers, and our business, operating results, and financial position.
We may fail to achieve our financial forecasts due to inaccurate sales forecasts or other factors. Our revenues,particularly certain of our cloud license and on-premise license revenues and hardware revenues, can be difficultto forecast. As a result, our quarterly operating results can fluctuate.
For our Oracle Cloud Services, our actual conversion or renewal rates may differ from those used in our forecastsbecause this business is continuing to evolve and such rates may be unpredictable which could have an adverseeffect on our long-term results. For our license business, we use a �pipeline� system, a common industry practice,to forecast sales and trends in that business. Our sales personnel monitor the status of all proposals and estimatewhen a customer will make a purchase decision and the dollar amount of the sale. These estimates are aggregatedperiodically to generate a sales pipeline. Our pipeline estimates can be unreliable both in a particular quarter andover a longer period of time, in part because the conversion rate or closure rate of the pipeline into contracts canbe very difficult to estimate. A reduction in the conversion rates, renewal rates, or in the pipeline itself, couldadversely affect our business or results of operations. In particular, a slowdown in IT spending or economicconditions generally can unexpectedly reduce the conversion rates and renewal rates in particular periods aspurchasing decisions are delayed, reduced in amount or cancelled. The conversion rates can also be affected bythe tendency of some of our customers to wait until the end of a fiscal period in the hope of obtaining morefavorable terms, which can also impede our ability to negotiate, execute and deliver upon these contracts in atimely manner. In addition, for newly acquired companies, we have limited ability to predict how their pipelineswill convert into sales or revenues for a number of quarters following the acquisition. Conversion rates andrenewal rates post-acquisition may be quite different from the acquired companies� historical conversion rates.Differences in conversion rates and renewal rates can also be affected by changes in business practices that weimplement in our newly acquired companies. These changes may negatively affect customer behavior.
A substantial portion of the revenue value of our cloud license and on-premise license, and hardware contracts iscompleted in the latter part of a quarter and a significant percentage of these are larger value orders. Because asignificant portion of our cost structure is largely fixed in the short term, sales and revenue shortfalls tend to havea disproportionately negative impact on our profitability. The number of large license transactions and, to a lesserextent, hardware products transactions increases the risk of fluctuations in our quarterly results because a delay ineven a small number of these transactions could cause our quarterly sales, revenues and profitability to fallsignificantly short of our predictions.

23
We may experience foreign currency gains and losses. Changes in currency exchange rates can adversely affectcustomer demand and our revenue and profitability. We conduct a significant number of transactions and holdcash in currencies other than the U.S. Dollar. Changes in the values of major foreign currencies, particularly theEuro, Japanese Yen and British Pound, relative to the U.S. Dollar can significantly affect our total assets, revenues,operating results and cash flows, which are reported in U.S. Dollars. In particular, the economic uncertaintiesrelating to Brexit and European sovereign and other debt obligations may cause the value of the British Pound andEuro to fluctuate relative to the U.S. Dollar. Fluctuations in foreign currency rates, including the strengthening ofthe U.S. Dollar against the Euro and most other major international currencies, adversely affects our revenuegrowth in terms of the amounts that we report in U.S. Dollars after converting our foreign currency results intoU.S. Dollars and in terms of actual demand for our products and services as certain of these products may becomerelatively more expensive for foreign currency-based enterprises to purchase. In addition, currency variations canadversely affect margins on sales of our products in countries outside of the U.S. Generally, our reported revenuesand operating results are adversely affected when the dollar strengthens relative to other currencies and arepositively affected when the dollar weakens. In addition, our reported assets generally are adversely affectedwhen the dollar strengthens relative to other currencies as a portion of our consolidated cash and bank deposits,among other assets, are held in foreign currencies.
In addition, we incur foreign currency transaction gains and losses, primarily related to sublicense fees and otherintercompany agreements among us and our subsidiaries that we expect to cash settle in the near term, which arecharged against earnings in the period incurred. We have a program which primarily utilizes foreign currencyforward contracts designed to offset the risks associated with certain foreign currency exposures. We may suspendthe program from time to time. As part of this program, we enter into foreign currency forward contracts so thatincreases or decreases in our foreign currency exposures are offset at least in part by gains or losses on the foreigncurrency forward contracts in an effort to mitigate the risks and volatility associated with our foreign currencytransaction gains or losses. A large portion of our consolidated operations are international, and we expect that wewill continue to realize gains or losses with respect to our foreign currency exposures, net of gains or losses fromour foreign currency forward contracts. For example, we will experience foreign currency gains and losses incertain instances if it is not possible or cost-effective to hedge our foreign currency exposures, if our hedgingefforts are ineffective, or should we suspend our foreign currency forward contract program. Our ultimate realizedloss or gain with respect to currency fluctuations will generally depend on the size and type of cross-currencyexposures that we enter into, the currency exchange rates associated with these exposures and changes in thoserates, whether we have entered into foreign currency forward contracts to offset these exposures and otherfactors. All of these factors could materially impact our results of operations, financial position and cash flows.
We have incurred foreign currency losses associated with the devaluation of currencies in certain highlyinflationary economies relative to the U.S. Dollar. We could incur future losses in emerging market countrieswhere we do business should their currencies become designated as highly inflationary.
Our periodic workforce restructurings and reorganizations can be disruptive. We have in the past restructuredor made other adjustments to our workforce in response to management changes, product changes, performanceissues, change in strategies, acquisitions and other internal and external considerations. In the past, these types ofrestructurings have resulted in increased restructuring costs and temporary reduced productivity while theemployees adjusted to their new roles and responsibilities. In addition, we may not achieve or sustain theexpected growth, resource redeployment or cost savings benefits of these restructurings, or may not do so withinthe expected timeframe. These effects could recur in connection with future acquisitions and other restructuringsand our revenues and other results of operations could be negatively affected.

24
We may lose key employees or may be unable to hire enough qualified employees. We rely on hiring qualifiedemployees and the continued service of our senior management, including our Chairman of the Board of Directors,Chief Technology Officer and founder; our Chief Executive Officers; other members of our executive team; andother key employees. In the technology industry, there is substantial and continuous competition for highly skilledbusiness, product development, technical and other personnel. We may also experience increased compensationcosts that are not offset by either improved productivity or higher sales. We may not be successful in recruitingnew personnel and in retaining and motivating existing personnel. With rare exceptions, we do not have long-termemployment or non-competition agreements with our employees. Members of our senior management team haveleft Oracle over the years for a variety of reasons, and we cannot guarantee that there will not be additionaldepartures, which may be disruptive to our operations.
We continually focus on improving our cost structure by hiring personnel in countries where advanced technicalexpertise and other expertise are available at lower costs. When we make adjustments to our workforce, we mayincur expenses associated with workforce reductions that delay the benefit of a more efficient workforcestructure. We may also experience increased competition for employees in these countries as the trend towardglobalization continues, which may affect our employee retention efforts and increase our expenses in an effort tooffer a competitive compensation program. In addition, changes to immigration and labor law policies mayadversely impact our access to technical and professional talent.
Our general compensation program includes restricted stock units and performance-based equity, which areimportant tools in attracting and retaining employees in our industry. If our stock price performs poorly, it mayadversely affect our ability to retain or attract employees. We continually evaluate our compensation practices andconsider changes from time to time, such as reducing the number of employees granted equity awards or thenumber of equity awards granted per employee and granting alternative forms of stock-based compensation,which may have an impact on our ability to retain employees and the amount of stock-based compensationexpense that we record. Any changes in our compensation practices or those of our competitors could affect ourability to retain and motivate existing personnel and recruit new personnel.
Our sales to government clients expose us to business volatility and risks, including government budgeting cyclesand appropriations, procurement regulations, governmental policy shifts, early termination of contracts, audits,investigations, sanctions and penalties. We derive revenues from contracts with the U.S. government, state andlocal governments, and foreign governments and are subject to procurement laws and regulations relating to theaward, administration and performance of those contracts.
Governmental entities are variously pursuing policies that affect our ability to sell our products and services.Changes in government procurement policy, priorities, technology initiatives, and/or contract award criteria maynegatively impact our potential for growth in the government sector.
We are also subject to early termination of our contracts. Many governmental entities have the right to terminatecontracts at any time, without cause. For example, the U.S. federal government may terminate any of ourgovernment contracts and subcontracts at its convenience, or for default based on our performance.
U.S. federal contracts are subject to the congressional approval of appropriations to fund the expenditures underthese contracts. Similarly, our contracts with U.S. state and local governments, foreign governments and theiragencies are generally subject to government funding authorizations. Contracts may be terminated based upon alack of appropriated funds.
There is increased pressure on governments and their agencies, both domestically and internationally, to reducespending as governments continue to face significant deficit reduction pressures. This may adversely impactspending on government programs.
Government contracts laws and regulations impose certain risks, and contracts are generally subject to audits andinvestigations. If violations of law are found, they could result in civil and criminal penalties and administrativesanctions, including termination of contracts, refund of a portion of fees received, forfeiture of profits, suspensionof payments, fines and suspensions or debarment from future government business.

25
Acquisitions present many risks and we may not achieve the financial and strategic goals that werecontemplated at the time of a transaction. We continue to make strategic acquisitions of companies, products,services and technologies. We have a selective and active acquisition program and we expect to continue to makeacquisitions in the future because acquisitions are an important element of our overall corporate strategy. Riskswe may face in connection with our acquisition program include:
� our ongoing business may be disrupted and our management�s attention may be diverted by acquisition,transition or integration activities;
� we may have difficulties (1) managing an acquired company�s technologies or lines of business;(2) entering new markets where we have no, or limited, direct prior experience or where competitorsmay have stronger market positions; or (3) retaining key personnel from the acquired companies;
� an acquisition may not further our business strategy as we expected, we may not integrate an acquiredcompany or technology as successfully as we expected, we may impose our business practices or alter go-to-market strategies that adversely impact the acquired business or we may overpay for, or otherwise notrealize the expected return on our investments, which could adversely affect our business or operatingresults and potentially cause impairment to assets that we recorded as a part of an acquisition includingintangible assets and goodwill;
� our operating results or financial condition may be adversely impacted by (1) claims or liabilities that weassume from an acquired company or technology or that are otherwise related to an acquisition,including, among others, claims from government agencies, terminated employees, current or formercustomers, former stockholders or other third parties; (2) pre-existing contractual relationships that weassume from an acquired company that we would not have otherwise entered into, the termination ormodification of which may be costly or disruptive to our business; (3) unfavorable revenue recognition orother accounting treatment as a result of an acquired company�s practices; and (4) intellectual propertyclaims or disputes;
� we may fail to identify or assess the magnitude of certain liabilities, shortcomings or other circumstancesprior to acquiring a company or technology, which could result in (1) unexpected litigation or regulatoryexposure, (2) unfavorable accounting treatment, unexpected increases in taxes due, (3) the loss ofanticipated tax benefits or (4) other adverse effects on our business, operating results or financialcondition;
� we may not realize any anticipated increase in our revenues from an acquisition for a number of reasons,including (1) if a larger than predicted number of customers decline to renew cloud-based subscriptioncontracts or license support or hardware support contracts, (2) if we are unable to sell the acquiredproducts or service offerings to our customer base, (3) if acquired customers do not elect to purchase ourtechnologies due to differing business practices or (4) if contract models utilized by an acquired companydo not allow us to recognize revenues on a timely basis;
� we may have difficulty incorporating acquired technologies, products, services and their related supplychain operations with our existing lines of business and supply chain infrastructure and maintaininguniform standards, architecture, controls, procedures and policies;
� we may have multiple product lines or services offerings as a result of our acquisitions that are offered,priced, delivered and supported differently, which could cause customer confusion and delays;
� we may incur higher than anticipated costs (1) to support, develop and deliver acquired products orservices, (2) for general and administrative functions that support new business models, or (3) to complywith regulations applicable to an acquired business that are more complicated than we had anticipated;
� we may be unable to obtain timely approvals from, or may otherwise have certain limitations,restrictions, penalties or other sanctions imposed on us by worker councils or similar bodies underapplicable employment laws as a result of an acquisition, which could adversely affect our integrationplans in certain jurisdictions and potentially increase our integration and restructuring expenses;

26
� we may be unable to obtain required approvals from governmental authorities under competition andantitrust laws on a timely basis, if at all, which could, among other things, (1) delay or prevent us fromcompleting a transaction, (2) adversely affect our integration plans in certain jurisdictions, (3) restrict ourability to realize the expected financial or strategic goals of an acquisition, or (4) have other adverseeffects on our current business and operations;
� our use of cash to pay for acquisitions may limit other potential uses of our cash, including (1) stockrepurchases, (2) dividend payments and (3) retirement of outstanding indebtedness, among others;
� we may significantly increase our interest expense, leverage and debt service requirements if we incuradditional debt to pay for an acquisition and we may have to delay or not proceed with a substantialacquisition if we cannot obtain the necessary funding to complete the acquisition in a timely manner oron favorable terms;
� to the extent that we issue a significant amount of equity securities in connection with future acquisitions,existing stockholders may be diluted and earnings per share may decrease; and
� we may experience additional or unexpected changes in how we are required to account for ouracquisitions pursuant to U.S. generally accepted accounting principles, including arrangements that wemay assume in an acquisition.
The occurrence of any of these risks could have a material adverse effect on our business, results of operations,financial condition or cash flows, particularly in the case of a larger acquisition or several concurrent acquisitions.
Our hardware revenues and profitability have declined and could continue to decline. Our hardware businessmay adversely affect our overall profitability. We may not achieve our estimated revenue, profit or other financialprojections with respect to our hardware business in a timely manner or at all due to a number of factors,including:
� our changes in hardware strategies, offerings and technologies which could adversely affect demand forour hardware products;
� our hardware business has higher expenses as a percentage of revenues, and thus has been lessprofitable, than our cloud and license business;
� our focus on our more profitable Oracle Engineered Systems and the de-emphasis of our lower profitmargin commodity hardware products could adversely affect our hardware revenues;
� changes in strategies and frequency for the development and introduction of new versions or nextgenerations of our hardware products could adversely affect our hardware revenues;
� a greater risk of material charges that could adversely affect our operating results, such as potential write-downs and impairments of our inventories; higher warranty expenses than what we experience in ourcloud and license and services businesses; and amortization and potential impairment of intangible assetsassociated with our hardware business;
� decreased customer demand for related hardware support as hardware products approach the end oftheir useful lives could adversely affect our hardware revenues; and
� we may acquire hardware companies that are strategically important to us but (1) operate in hardwarebusinesses with historically lower operating margins than our own; (2) have different legacy businesspractices and go-to-market strategies than our own that we may alter as a part of our integration efforts,which may significantly impact our estimated revenues and profits from the acquired company;(3) leverage different platforms or competing technologies that we may encounter difficulties inintegrating; or (4) utilize unique manufacturing processes that affect our ability to scale these acquiredproducts within our own manufacturing operations.

27
Our hardware offerings are complex products, and if we cannot successfully manage this complexity, the resultsof our hardware business will suffer. We depend on suppliers to develop, manufacture and deliver on a timelybasis the necessary technologies and components for our hardware products, and there are some technologiesand components that can only be purchased from a single vendor due to price, quality, technology, availability orother business constraints. As a result, our supply chain operations could be disrupted or negatively impacted byindustry consolidation and component constraints or shortages, natural disasters, political unrest, port stoppagesor other transportation disruptions or slowdowns, or other factors affecting the countries or regions where thesesingle source component vendors are located or where the products are being shipped. We may be unable topurchase these items from the respective single vendors on acceptable terms or may experience significantshortages, delays or quality issues in the delivery of necessary technologies, parts or components from a particularvendor. If one or more of the risks described above occurs, our hardware business and related operating resultscould be materially and adversely affected.
We are susceptible to third-party manufacturing and logistics delays, which could result in the loss of sales andcustomers. We outsource the manufacturing, assembly, delivery and technology or component design of certainof our hardware products to a variety of companies, many of which are located outside the U.S. If these partnersexperience production problems or delays or cannot meet our demand for products, we may not be able to findalternate manufacturing sources in a timely or cost-effective manner, if at all. Therefore, we continue to exploreadditional third-party manufacturing partners to drive supply chain continuity. This could cause the loss of salesand existing or potential customers, delayed revenue recognition or an increase in our hardware productsexpenses, all of which could adversely affect the margins of our hardware business.
These challenges and risks also exist when we acquire companies with hardware products and related supply chainoperations. In some cases, we may be dependent, at least initially, on these acquired companies� supply chainoperations that we are less familiar with and thus we may be slower to adjust or react to these challenges andrisks.
Our cloud and license, and hardware indirect sales channel could affect our future operating results. Our cloudand license, and hardware indirect channel network is comprised primarily of resellers, systemintegrators/implementers, consultants, education providers, internet service providers, network integrators andindependent software vendors. Our relationships with these channel participants are important elements of ourcloud, software and hardware marketing and sales efforts. Our financial results could be adversely affected if ourcontracts with channel participants were terminated, if our relationships with channel participants were todeteriorate, if any of our competitors enter into strategic relationships with or acquire a significant channelparticipant, if the financial condition or operations of our channel participants were to weaken or if the level ofdemand for our channel participants� products and services were to decrease. There can be no assurance that wewill be successful in maintaining, expanding or developing our relationships with channel participants. If we are notsuccessful, we may lose sales opportunities, customers and revenues.
We may not be able to protect our intellectual property rights. We rely on copyright, trademark, patent andtrade secret laws, confidentiality procedures, controls and contractual commitments to protect our intellectualproperty rights. Despite our efforts, these protections may be limited. Unauthorized third parties may try to copyor reverse engineer portions of our products or otherwise obtain and use our intellectual property. Any patentsowned by us may be invalidated, circumvented or challenged. Any of our pending or future patent applications,whether or not being currently challenged, may not be issued with the scope of the claims we seek, if at all. Inaddition, the laws of some countries do not provide the same level of protection of our intellectual property rightsas do the laws and courts of the U.S. If we cannot protect our intellectual property rights against unauthorizedcopying or use, or other misappropriation, we may not remain competitive.

28
Third parties have claimed, and in the future may claim, infringement or misuse of intellectual property rightsand/or breach of license agreement provisions. We periodically receive notices from, or have lawsuits filedagainst us by, others claiming infringement or other misuse of their intellectual property rights and/or breach ofour agreements with them. These third parties include entities that do not have the capabilities to design,manufacture, or distribute products or services or that acquire intellectual property like patents for the solepurpose of monetizing their acquired intellectual property through asserting claims of infringement and misuse.We expect to continue to receive such claims as:
� we continue to expand into new businesses and acquire companies;
� the number of products and competitors in our industry segments grows;
� the use and support of third-party code (including open source code) becomes more prevalent in theindustry;
� the volume of issued patents continues to increase; and
� non-practicing entities continue to assert intellectual property infringement in our industry segments.
Responding to any such claim, regardless of its validity, could:
� be time consuming, costly and result in litigation;
� divert management�s time and attention from developing our business;
� require us to pay monetary damages or enter into royalty and licensing agreements that we would notnormally find acceptable;
� require us to stop selling or to redesign certain of our products;
� require us to release source code to third parties, possibly under open source license terms;
� require us to satisfy indemnification obligations to our customers; or
� otherwise adversely affect our business, results of operations, financial condition or cash flows.
We may not receive significant revenues from our current research and development efforts for several years, ifat all. Developing our various product offerings is expensive and the investment in the development of theseofferings often involves a long return on investment cycle. An important element of our corporate strategy is tocontinue to dedicate a significant amount of resources to research and development and related product andservice opportunities both through internal investments and the acquisition of intellectual property fromcompanies that we have acquired. Accelerated product and service introductions and short life cycles require highlevels of expenditures for research and development that could adversely affect our operating results if not offsetby revenue increases. We believe that we must continue to dedicate a significant amount of resources to ourresearch and development efforts to maintain our competitive position. However, we do not expect to receivesignificant revenues from these investments for several years, if at all.
Business disruptions could adversely affect our operating results. A significant portion of our critical businessoperations are concentrated in a few geographic areas, some of which include emerging market internationallocations that may be less stable relative to running such business operations solely within the U.S. We are a highlyautomated business and a disruption or failure of our systems and processes could cause delays in completingsales, providing services, including some of our cloud offerings, and enabling a seamless customer experience withrespect to our customer facing back office processes. A major earthquake or fire, political, social or otherdisruption to infrastructure that supports our operations or other catastrophic event or the effects of climatechange (such as increased storm severity, drought and pandemics) that results in the destruction or disruption ofany of our critical business or IT systems could severely affect our ability to conduct normal business operationsand, as a result, our future operating results could be materially and adversely affected.

29
Adverse litigation results could affect our business. We are subject to various legal proceedings. Litigation canbe lengthy, expensive and disruptive to our operations, and can divert our management�s attention away fromrunning our core business. The results of our litigation also cannot be predicted with certainty. An adverse decisioncould result in monetary damages or injunctive relief that could affect our business, operating results or financialcondition. Additional information regarding certain of the lawsuits we are involved in is discussed under Note 17 ofNotes to Consolidated Financial Statements included elsewhere in this Annual Report.
We may have exposure to additional tax liabilities. As a multinational corporation, we are subject to incometaxes as well as non-income based taxes, in both the U.S. and various foreign jurisdictions. Significant uncertaintiesexist with respect to the amount of our tax liabilities, including those arising from potential changes in laws in thecountries in which we do business and the possibility of adverse determinations with respect to the application ofexisting laws. Many judgments are required in determining our worldwide provision for income taxes and other taxliabilities, and we are regularly under audit by tax authorities, which often do not agree with positions taken by uson our tax returns. Any unfavorable resolution of these uncertainties may have a significant adverse impact on ourtax rate.
Increasingly, countries around the world are actively considering or have enacted changes in relevant tax,accounting and other laws, regulations and interpretations. In particular, the U.S. Tax Cuts and Jobs Act of 2017(the Tax Act) significantly changed how corporations are taxed in the U.S., which has had and we expect willcontinue to have a meaningful impact on our provision for income taxes. Due to the complexity involved inapplying the provisions of the Tax Act, we made reasonable estimates of the effects and recorded provisionalamounts in our financial statements for the year ended May 31, 2018. The U.S. Treasury Department and theInternal Revenue Service (IRS), and other standards-setting bodies may issue guidance on how the provisions ofthe Tax Act will be applied that is different from our interpretation. The Tax Act requires complex computationsnot previously required or produced, and significant judgments and assumptions in the interpretation of the lawwere made in producing our provisional estimates. We have adjusted the provisional amounts and reflected theadjustments in our financial statements for the year ended May 31, 2019 based on the regulatory and otherguidance issued to date by the Treasury Department and IRS, but also on judgments and assumptions whereuncertainty continues to exist. Such uncertainty in the application of the Tax Act to our ongoing operations as wellas possible adverse future law changes attributable to changes in the U.S. political environment could have anadverse impact on our future tax rate.
Other countries also continue to consider enacting changes to their tax laws that could adversely affect us byincreasing taxes imposed on our foreign subsidiaries, including changes in withholding tax regimes and theimposition of taxes targeted at certain technology businesses. More fundamentally, longstanding international taxprinciples that determine each country�s right to tax cross-border transactions are being reconsidered, creatingsignificant uncertainty as to the future level of corporate income tax on our international operations. This re-examination is driven by a perceived need to provide greater taxing rights to market jurisdictions where customersor users are located. Various measures are being discussed, including adjustments to transfer pricing rules,limitations on deductions, and imposition of additional withholding taxes.
As a part of our income tax structure, there are many intercompany transactions and calculations made in theordinary course of business where the ultimate tax determination is uncertain. Our intercompany transfer pricinghas been and is currently being reviewed by the IRS and by foreign tax jurisdictions and will likely be subject toadditional audits in the future. Although we have negotiated a number of agreements with certain taxingjurisdictions, these agreements do not cover substantial elements of our transfer pricing. In recent periods,transfer pricing audits in many foreign jurisdictions have become increasingly contentious. Similarly, certainjurisdictions are increasingly raising concerns about certain withholding tax matters under current law. In addition,our provision for income taxes could be adversely affected by shifts of earnings from jurisdictions or regimes thathave relatively lower statutory tax rates to those in which the rates are relatively higher.

30
We are also subject to non-income based taxes, such as payroll, sales, use, value-added, net worth, property andgoods and services taxes, in both the U.S. and various foreign jurisdictions that have uncertain applicability to thebusinesses in which we are engaged. Although we believe that our income and non-income based tax estimatesare reasonable, there is no assurance that the final determination of tax audits or tax disputes will not be differentfrom what is reflected in our historical income tax provisions and accruals.
Charges to earnings resulting from acquisitions may adversely affect our operating results. Under businesscombination accounting standards pursuant to Accounting Standards Codification (ASC) 805, BusinessCombinations, we recognize the identifiable assets acquired, the liabilities assumed and any non-controllinginterests in acquired companies generally at their acquisition date fair values and, in each case, separately fromgoodwill. Goodwill as of the acquisition date is measured as the excess amount of consideration transferred, whichis also generally measured at fair value, and the net of the acquisition date amounts of the identifiable assetsacquired and the liabilities assumed. Our estimates of fair value are based upon assumptions believed to bereasonable but which are inherently uncertain. After we complete an acquisition, the following factors could resultin material charges and adversely affect our operating results and may adversely affect our cash flows:
� costs incurred to combine the operations of companies we acquire, such as transitional employeeexpenses and employee retention, redeployment or relocation expenses;
� impairment of goodwill or impairment of intangible assets;
� amortization of intangible assets acquired;
� a reduction in the useful lives of intangible assets acquired;
� identification of, or changes to, assumed contingent liabilities, both income tax and non-income taxrelated, after our final determination of the amounts for these contingencies or the conclusion of themeasurement period (generally up to one year from the acquisition date), whichever comes first;
� charges to our operating results to maintain certain duplicative pre-merger activities for an extendedperiod of time or to maintain these activities for a period of time that is longer than we had anticipated,charges to eliminate certain duplicative pre-merger activities, and charges to restructure our operationsor to reduce our cost structure;
� charges to our operating results due to expenses incurred to effect the acquisition; and
� charges to our operating results due to the expensing of certain stock awards assumed in an acquisition.
Substantially all of these costs will be accounted for as expenses that will adversely impact our operating resultsfor the periods in which those costs are incurred. Charges to our operating results in any given period could differsubstantially from other periods based on the timing and size of our future acquisitions and the extent ofintegration activities. A more detailed discussion of our accounting for business combinations and other items ispresented in the �Critical Accounting Policies and Estimates� section of Management�s Discussion and Analysis ofFinancial Condition and Results of Operations (Item 7) included elsewhere in this Annual Report.
There are risks associated with our outstanding and future indebtedness. As of May 31, 2019, we had anaggregate of $56.3 billion of outstanding indebtedness that will mature between calendar year 2019 and calendaryear 2055 and we may incur additional indebtedness in the future. Our ability to pay interest and repay theprincipal for our indebtedness is dependent upon our ability to manage our business operations, generatesufficient cash flows to service such debt and the other factors discussed in this section. There can be no assurancethat we will be able to manage any of these risks successfully.
31
We may also need to refinance a portion of our outstanding debt as it matures. There is a risk that we may not beable to refinance existing debt or that the terms of any refinancing may not be as favorable as the terms of ourexisting debt. Furthermore, if prevailing interest rates or other factors at the time of refinancing result in higherinterest rates upon refinancing, then the interest expense relating to that refinanced indebtedness would increase.
Should we incur future increases in interest expense, our ability to utilize certain of our foreign tax credits toreduce our U.S. federal income tax could be limited, which could unfavorably affect our provision for income taxesand effective tax rate. In addition, changes by any rating agency to our outlook or credit rating could negativelyaffect the value of both our debt and equity securities and increase the interest amounts we pay on certainoutstanding or future debt. These risks could adversely affect our financial condition and results of operations.
Environmental and other related laws and regulations subject us to a number of risks and could result insignificant liabilities and costs. Some of our cloud and hardware operations are subject to state, federal andinternational laws governing protection of the environment, proper handling and disposal of materials used forthese products, human health and safety, the use of certain chemical substances and the labor practices ofsuppliers, as well as local testing and labelling requirements. Compliance with these ever-changing environmentaland other laws in a timely manner could increase our product design, development, procurement, manufacturing,delivery, cloud operations and administration costs, limit our ability to manage excess and obsolete non-compliantinventory, change our sales activities, or otherwise impact future financial results of our cloud and hardwarebusinesses. Any violation of these laws can subject us to significant liability, including fines, penalties and possibleprohibition of sales of our products and services into one or more states or countries and result in a materialadverse effect on the financial condition or results of operations of our cloud and hardware businesses.Regulatory, market, and competitive pressures regarding the energy intensity and energy mix for our data centeroperations may also grow.
The SEC has adopted disclosure requirements for companies that use certain �conflict minerals� (tantalum, tin,tungsten and gold) in their products. Our supply chain is multi-tiered, global and highly complex. As a provider ofhardware end-products, we are several steps removed from the mining and smelting or refining of any conflictminerals in our supply chain. Accordingly, our ability to determine with certainty the origin and chain of custody ofconflict minerals is limited. Our relationships with customers and suppliers could suffer if we are unable todescribe our products as �conflict-free.� We may also face increased costs in complying with conflict mineralsdisclosure requirements.
A significant portion of our hardware revenues come from international sales. Environmental legislation, such asthe EU Directive on Restriction of Hazardous Substances (RoHS), the EU Waste Electrical and Electronic EquipmentDirective (WEEE Directive) and China�s regulation on Management Methods for Controlling Pollution Caused byElectronic Information Products, may increase our cost of doing business internationally and impact our hardwarerevenues from the EU, China and other countries with similar environmental legislation as we endeavor to complywith and implement these requirements. The cumulative impact of international environmental legislation couldbe significant.
Our stock price could become more volatile and your investment could lose value. All of the factors discussed inthis section could affect our stock price. The timing of announcements in the public market by us or by ourcompetitors regarding new products, product enhancements, technological advances, acquisitions or majortransactions could also affect our stock price. Changes in the amounts and frequency of share repurchases ordividends could affect our stock price. Our stock price could also be affected by factors, some of which are beyondour control, including, among others: speculation in the press and the analyst community, changes inrecommendations or earnings estimates by financial analysts, changes in investors� or analysts� valuation measuresfor our stock, earnings announcements where our financial results differ from our guidance or investors�expectations, our credit ratings and market trends unrelated to our performance. A significant drop in our stockprice could also expose us to the risk of securities class action lawsuits, which could result in substantial costs anddivert management�s attention and resources, which could adversely affect our business.

32
We cannot guarantee that our stock repurchase program will be fully implemented or that it will enhance long-term stockholder value. In fiscal 2019, our Board of Directors approved expansions of our stock repurchaseprogram totaling $24.0 billion. The repurchase program does not have an expiration date and we are not obligatedto repurchase a specified number or dollar value of shares. Our repurchase program may be suspended orterminated at any time and, even if fully implemented, may not enhance long-term stockholder value.
Item 1B. Unresolved Staff Comments
None.
Item 2. Properties
Our properties consist of owned and leased office facilities for sales, support, research and development, services,manufacturing, cloud operations and administrative and other functions. Our headquarters facility consists ofapproximately 2.1 million square feet in Redwood City, California, substantially all of which we own. We also ownor lease other facilities for current use consisting of approximately 27.7 million square feet in various otherlocations in the U.S. and abroad. Approximately 3.1 million square feet, or 10%, of our total owned and leasedspace is sublet or is being actively marketed for sublease or disposition. We lease our principal internalmanufacturing facility for our hardware products in Hillsboro, Oregon. Our cloud operations deliver our OracleCloud Services through the use of global data centers including those that we own and operate and those that weutilize through colocation suppliers. We believe that our facilities are in good condition and suitable for theconduct of our business.
Item 3. Legal Proceedings
The material set forth in Note 14 (pertaining to information regarding contingencies related to our income taxes)and Note 17 (pertaining to information regarding legal contingencies) of Notes to Consolidated FinancialStatements in Item 15 of this Annual Report on Form 10-K is incorporated herein by reference.
Item 4. Mine Safety Disclosures
Not applicable.
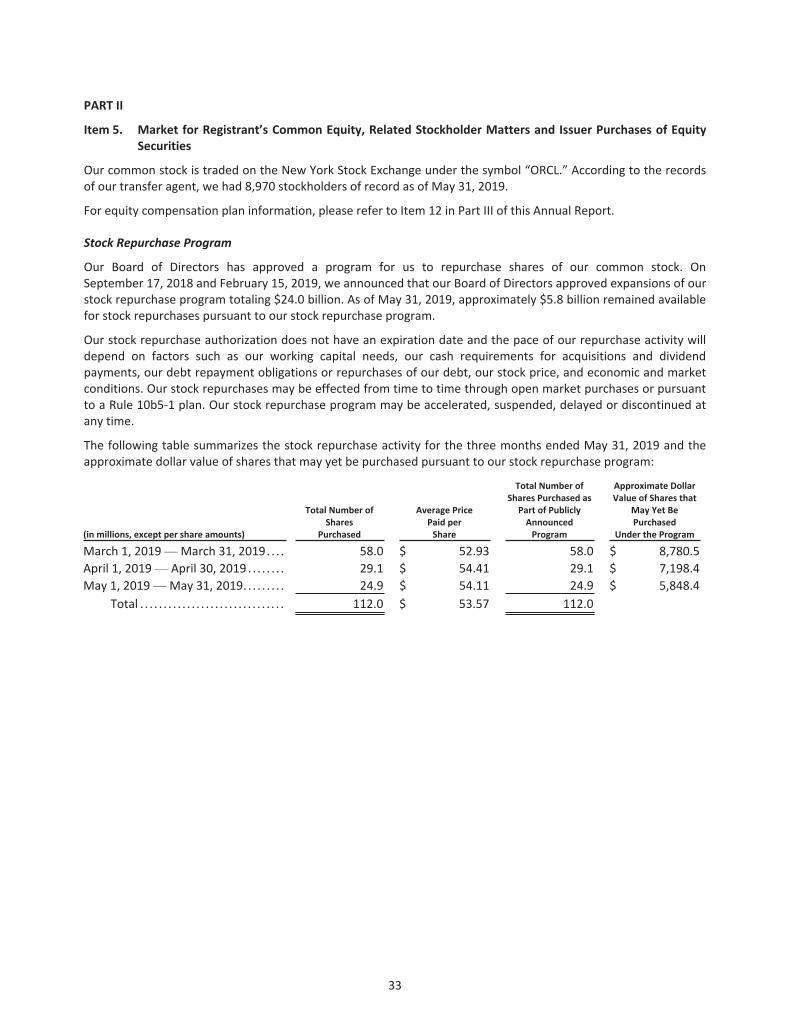
33
PART II
Item 5. Market for Registrant�s Common Equity, Related Stockholder Matters and Issuer Purchases of EquitySecurities
Our common stock is traded on the New York Stock Exchange under the symbol �ORCL.� According to the recordsof our transfer agent, we had 8,970 stockholders of record as of May 31, 2019.
For equity compensation plan information, please refer to Item 12 in Part III of this Annual Report.
Stock Repurchase Program
Our Board of Directors has approved a program for us to repurchase shares of our common stock. OnSeptember 17, 2018 and February 15, 2019, we announced that our Board of Directors approved expansions of ourstock repurchase program totaling $24.0 billion. As of May 31, 2019, approximately $5.8 billion remained availablefor stock repurchases pursuant to our stock repurchase program.
Our stock repurchase authorization does not have an expiration date and the pace of our repurchase activity willdepend on factors such as our working capital needs, our cash requirements for acquisitions and dividendpayments, our debt repayment obligations or repurchases of our debt, our stock price, and economic and marketconditions. Our stock repurchases may be effected from time to time through open market purchases or pursuantto a Rule 10b5-1 plan. Our stock repurchase program may be accelerated, suspended, delayed or discontinued atany time.
The following table summarizes the stock repurchase activity for the three months ended May 31, 2019 and theapproximate dollar value of shares that may yet be purchased pursuant to our stock repurchase program:
(in millions, except per share amounts)
Total Number ofShares
Purchased
Average PricePaid perShare
Total Number ofShares Purchased as
Part of PubliclyAnnouncedProgram
Approximate DollarValue of Shares that
May Yet BePurchased
Under the Program
March 1, 2019�March 31, 2019. . . . 58.0 $ 52.93 58.0 $ 8,780.5April 1, 2019� April 30, 2019 . . . . . . . . 29.1 $ 54.41 29.1 $ 7,198.4May 1, 2019�May 31, 2019. . . . . . . . . 24.9 $ 54.11 24.9 $ 5,848.4
Total . . . . . . . . . . . . . . . . . . . . . . . . . . . . . . . 112.0 $ 53.57 112.0

34
Stock Performance Graph and Cumulative Total Return
The graph below compares the cumulative total stockholder return on our common stock with the cumulativetotal return of the S&P 500 Index and the S&P Information Technology Index for each of the last five fiscal yearsended May 31, 2019, assuming an investment of $100 at the beginning of such period and the reinvestment of anydividends. The comparisons in the graphs below are based upon historical data and are not indicative of, norintended to forecast, future performance of our common stock.
5/14 5/15 5/16 5/17 5/18 5/19$0
$50
$100
$150
$200
$250
DOLLARS
COMPARISON OF 5 YEAR CUMULATIVE TOTAL RETURN*Among Oracle Corporation, the S&P 500 Index and the S&P Information Technology Index
*$100 INVESTED ON MAY 31, 2014 IN STOCK ORINDEX-INCLUDING REINVESTMENT OF DIVIDENDS
5/14 5/15 5/16 5/17 5/18 5/19
Oracle Corporation . . . . . . . . . . . . . . . . . . . . . . . . . . . . . . . . . . . . 100.0 104.8 98.4 112.8 118.0 129.9S&P 500 Index . . . . . . . . . . . . . . . . . . . . . . . . . . . . . . . . . . . . . . . . . 100.0 111.8 113.7 133.6 152.8 158.6S&P Information Technology Index. . . . . . . . . . . . . . . . . . . 100.0 118.8 122.5 163.9 210.2 219.4
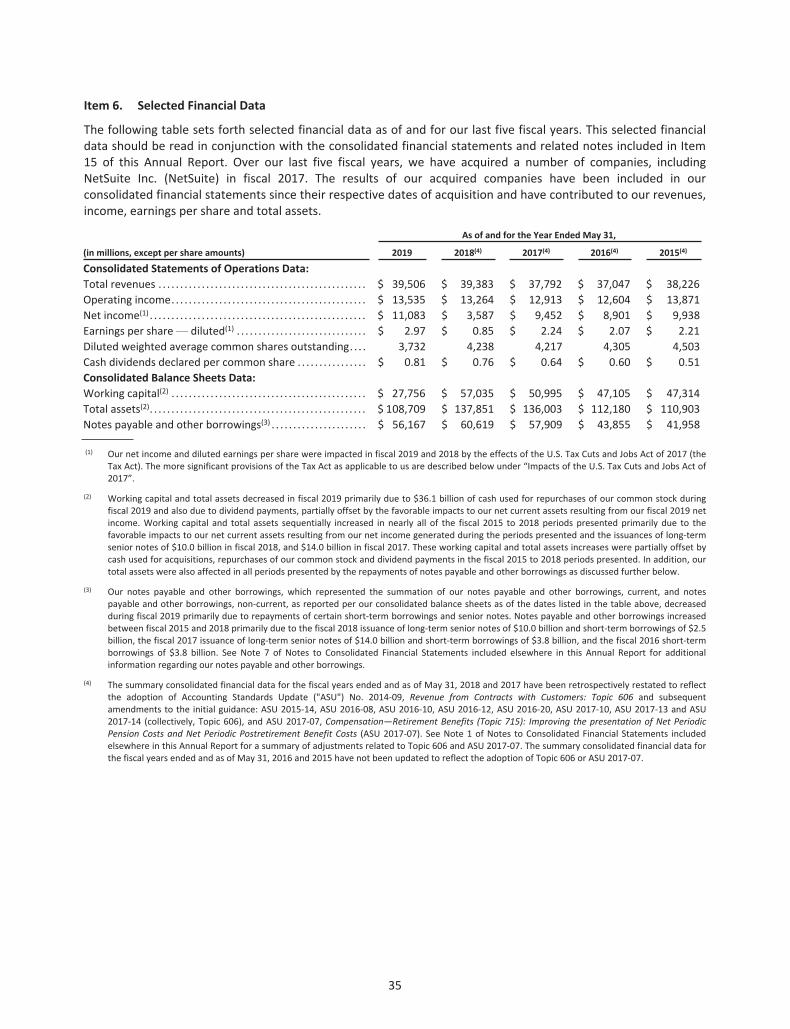
35
Item 6. Selected Financial Data
The following table sets forth selected financial data as of and for our last five fiscal years. This selected financialdata should be read in conjunction with the consolidated financial statements and related notes included in Item15 of this Annual Report. Over our last five fiscal years, we have acquired a number of companies, includingNetSuite Inc. (NetSuite) in fiscal 2017. The results of our acquired companies have been included in ourconsolidated financial statements since their respective dates of acquisition and have contributed to our revenues,income, earnings per share and total assets.
As of and for the Year Ended May 31,
(in millions, except per share amounts) 2019 2018(4) 2017(4) 2016(4) 2015(4)
Consolidated Statements of Operations Data:Total revenues . . . . . . . . . . . . . . . . . . . . . . . . . . . . . . . . . . . . . . . . . . . . . . . . $ 39,506 $ 39,383 $ 37,792 $ 37,047 $ 38,226Operating income. . . . . . . . . . . . . . . . . . . . . . . . . . . . . . . . . . . . . . . . . . . . . $ 13,535 $ 13,264 $ 12,913 $ 12,604 $ 13,871Net income(1) . . . . . . . . . . . . . . . . . . . . . . . . . . . . . . . . . . . . . . . . . . . . . . . . . . $ 11,083 $ 3,587 $ 9,452 $ 8,901 $ 9,938Earnings per share� diluted(1) . . . . . . . . . . . . . . . . . . . . . . . . . . . . . . $ 2.97 $ 0.85 $ 2.24 $ 2.07 $ 2.21Diluted weighted average common shares outstanding. . . . 3,732 4,238 4,217 4,305 4,503Cash dividends declared per common share . . . . . . . . . . . . . . . . $ 0.81 $ 0.76 $ 0.64 $ 0.60 $ 0.51Consolidated Balance Sheets Data:Working capital(2) . . . . . . . . . . . . . . . . . . . . . . . . . . . . . . . . . . . . . . . . . . . . . $ 27,756 $ 57,035 $ 50,995 $ 47,105 $ 47,314Total assets(2). . . . . . . . . . . . . . . . . . . . . . . . . . . . . . . . . . . . . . . . . . . . . . . . . . $ 108,709 $ 137,851 $ 136,003 $ 112,180 $ 110,903Notes payable and other borrowings(3) . . . . . . . . . . . . . . . . . . . . . . $ 56,167 $ 60,619 $ 57,909 $ 43,855 $ 41,958
(1) Our net income and diluted earnings per share were impacted in fiscal 2019 and 2018 by the effects of the U.S. Tax Cuts and Jobs Act of 2017 (theTax Act). The more significant provisions of the Tax Act as applicable to us are described below under �Impacts of the U.S. Tax Cuts and Jobs Act of2017�.
(2) Working capital and total assets decreased in fiscal 2019 primarily due to $36.1 billion of cash used for repurchases of our common stock duringfiscal 2019 and also due to dividend payments, partially offset by the favorable impacts to our net current assets resulting from our fiscal 2019 netincome. Working capital and total assets sequentially increased in nearly all of the fiscal 2015 to 2018 periods presented primarily due to thefavorable impacts to our net current assets resulting from our net income generated during the periods presented and the issuances of long-termsenior notes of $10.0 billion in fiscal 2018, and $14.0 billion in fiscal 2017. These working capital and total assets increases were partially offset bycash used for acquisitions, repurchases of our common stock and dividend payments in the fiscal 2015 to 2018 periods presented. In addition, ourtotal assets were also affected in all periods presented by the repayments of notes payable and other borrowings as discussed further below.
(3) Our notes payable and other borrowings, which represented the summation of our notes payable and other borrowings, current, and notespayable and other borrowings, non-current, as reported per our consolidated balance sheets as of the dates listed in the table above, decreasedduring fiscal 2019 primarily due to repayments of certain short-term borrowings and senior notes. Notes payable and other borrowings increasedbetween fiscal 2015 and 2018 primarily due to the fiscal 2018 issuance of long-term senior notes of $10.0 billion and short-term borrowings of $2.5billion, the fiscal 2017 issuance of long-term senior notes of $14.0 billion and short-term borrowings of $3.8 billion, and the fiscal 2016 short-termborrowings of $3.8 billion. See Note 7 of Notes to Consolidated Financial Statements included elsewhere in this Annual Report for additionalinformation regarding our notes payable and other borrowings.
(4) The summary consolidated financial data for the fiscal years ended and as of May 31, 2018 and 2017 have been retrospectively restated to reflectthe adoption of Accounting Standards Update ("ASU") No. 2014-09, Revenue from Contracts with Customers: Topic 606 and subsequentamendments to the initial guidance: ASU 2015-14, ASU 2016-08, ASU 2016-10, ASU 2016-12, ASU 2016-20, ASU 2017-10, ASU 2017-13 and ASU2017-14 (collectively, Topic 606), and ASU 2017-07, Compensation�Retirement Benefits (Topic 715): Improving the presentation of Net PeriodicPension Costs and Net Periodic Postretirement Benefit Costs (ASU 2017-07). See Note 1 of Notes to Consolidated Financial Statements includedelsewhere in this Annual Report for a summary of adjustments related to Topic 606 and ASU 2017-07. The summary consolidated financial data forthe fiscal years ended and as of May 31, 2016 and 2015 have not been updated to reflect the adoption of Topic 606 or ASU 2017-07.
36
Item 7. Management�s Discussion and Analysis of Financial Condition and Results of Operations
We begin Management�s Discussion and Analysis of Financial Condition and Results of Operations with anoverview of our businesses and significant trends. This overview is followed by a summary of our criticalaccounting policies and estimates that we believe are important to understanding the assumptions and judgmentsincorporated in our reported financial results. We then provide a more detailed analysis of our results ofoperations and financial condition.
Business Overview
Oracle provides products and services that address enterprise information technology (IT) environments. Ourproducts and services include applications and infrastructure offerings that are delivered worldwide through avariety of flexible and interoperable IT deployment models. These models include on-premise deployments, cloud-based deployments, and hybrid deployments (an approach that combines both on-premise and cloud-baseddeployment) such as our Oracle Cloud at Customer offering (an instance of Oracle Cloud in a customer�s own datacenter). Accordingly, we offer choice and flexibility to our customers and facilitate the product, service anddeployment combinations that best suit our customers� needs. Our customers include businesses of many sizes,government agencies, educational institutions and resellers that we market and sell to directly through ourworldwide sales force and indirectly through the Oracle Partner Network.
We have three businesses: cloud and license; hardware; and services; each of which comprises a single operatingsegment. The descriptions set forth below as a part of Management�s Discussion and Analysis of FinancialCondition and Results of Operations and the information contained within Note 15 of Notes to ConsolidatedFinancial Statements included elsewhere in this Annual Report provide additional information related to ourbusinesses and operating segments and align as to how our chief operating decision makers (CODMs), whichinclude our Chief Executive Officers and Chief Technology Officer, view our operating results and allocateresources.
Cloud and License Business
Our cloud and license line of business, which represented 83%, 81% and 80% of our total revenues in fiscal 2019,2018 and 2017, respectively, markets, sells and delivers a broad spectrum of applications and infrastructuretechnologies through our cloud and license offerings.
Cloud services and license support revenues include:
� license support revenues, which are earned by providing Oracle license support services to customers thathave elected to purchase support services in connection with the purchase of Oracle applications andinfrastructure software licenses for use in cloud, on-premise and other IT environments. Substantially alllicense support customers renew their support contracts with us upon expiration in order to continue tobenefit from technical support services and the periodic issuance of unspecified updates andenhancements, which current license support customers are entitled to receive. License support contractsare generally priced as a percentage of the net fees paid by the customer to purchase a cloud licenseand/or on-premise license; are generally billed in advance of the support services being performed; aregenerally renewed at the customer�s option; and are generally recognized as revenues ratably over thecontractual period that the support services are provided, which is generally one year; and
� cloud services revenues, which provide customers access to Oracle Cloud applications and infrastructuretechnologies via cloud-based deployment models that Oracle develops, provides unspecified updates andenhancements for, hosts, manages and supports and that customers access by entering into asubscription agreement with us for a stated period. The majority of our Oracle Cloud Servicesarrangements are generally billed in advance of the cloud services being performed; have durations ofone to three years; are generally renewed at the customer�s option; and are generally recognized asrevenues ratably over the contractual period of the cloud contract or, in the case of usage modelcontracts, as the cloud services are consumed over time.

37
Cloud license and on-premise license revenues include revenues from the licensing of our software productsincluding Oracle Applications, Oracle Database, Oracle Middleware and Java, among others, which our customersdeploy within cloud-based, on-premise and other IT environments. Our cloud license and on-premise licensetransactions are generally perpetual in nature and are generally recognized upfront at the point in time when thesoftware is made available to the customer to download and use. Revenues from usage-based royaltyarrangements for distinct cloud licenses and on-premise licenses are recognized at the point in time when thesoftware end user usage occurs. The timing of a few large license transactions can substantially affect our quarterlylicense revenues due to the point in time for revenue recognition of license transactions, which is different thanthe typical revenue recognition pattern for our cloud services and license support revenues in which revenues aregenerally recognized ratably over the contractual terms. Cloud license and on-premise license customers have theoption to purchase and renew license support contracts, as described above.
Providing choice and flexibility to our customers as to when and how they deploy our applications andinfrastructure technologies is an important element of our corporate strategy. In recent periods, customer demandfor our applications and infrastructure technologies delivered through our Oracle Cloud Services has increased. Toaddress customer demand and enable customer choice, we have introduced certain programs for customers topivot their applications and infrastructure licenses and the related license support to the Oracle Cloud for newdeployments and to migrate to and expand with the Oracle Cloud for their existing workloads. We expect thesetrends to continue.
Our cloud and license business� revenue growth is affected by many factors, including the strength of generaleconomic and business conditions; governmental budgetary constraints; the strategy for and competitive positionof our offerings; our acquisitions; the continued renewal of our cloud services and license support customercontracts by the customer contract base; substantially all customers continuing to purchase license supportcontracts in connection with their license purchases; the pricing of license support contracts sold in connectionwith the sales of licenses; the pricing, amounts and volumes of licenses and cloud services sold; and foreigncurrency rate fluctuations.
On a constant currency basis, we expect that our total cloud and license revenues generally will continue toincrease due to:
� expected growth in our cloud services and license support offerings;
� continued demand for our cloud license and on-premise license offerings; and
� contributions from our acquisitions.
We believe all of these factors should contribute to future growth in our cloud and license revenues, which shouldenable us to continue to make investments in research and development to develop and improve our cloud andlicense products and services.
Our cloud and license business� margin has historically trended upward over the course of the four quarters withina particular fiscal year due to the historical upward trend of our cloud and license business� revenues over thosequarterly periods and because the majority of our costs for this business are generally fixed in the short term. Thehistorical upward trend of our cloud and license business� revenues over the course of the four quarters within aparticular fiscal year is primarily due to the addition of new cloud services and license support contracts to thecustomer contract base that we generally recognize as revenues ratably; the renewal of existing customers� cloudservices and license support contracts over the course of each fiscal year that we generally recognize as revenuesratably; and the historical upward trend of our cloud license and on-premise license revenues, which we generallyrecognize at a point in time upon delivery, over those four quarterly periods.
Hardware Business
Our hardware business, which represented 9%, 10% and 11% of our total revenues in fiscal 2019, 2018 and 2017,respectively, provides a broad selection of hardware products and hardware-related software products includingOracle Engineered Systems, servers, storage, industry-specific hardware, operating systems, virtualization,
38
management and other hardware related software, and related hardware support. Each hardware product and itsrelated software, such as an operating system or firmware, are highly interdependent and interrelated and areaccounted for as a combined performance obligation. The revenues for this combined performance obligation aregenerally recognized at the point in time that the hardware product and its related software are delivered to thecustomer and ownership is transferred to the customer. We expect to make investments in research anddevelopment to improve existing hardware products and services and to develop new hardware products andservices. The majority of our hardware products are sold through indirect channels, including independentdistributors and value-added resellers. Our hardware support offerings provide customers with unspecifiedsoftware updates for software components that are essential to the functionality of our hardware products andassociated software products such as Oracle Solaris. Our hardware support offerings can also include productrepairs, maintenance services and technical support services. Hardware support contracts are entered into andrenewed at the option of the customer, are generally priced as a percentage of the net hardware products feesand are generally recognized as revenues ratably as the hardware support services are delivered over thecontractual terms.
We generally expect our hardware business to have lower operating margins as a percentage of revenues than ourcloud and license business due to the incremental costs we incur to produce and distribute these products and toprovide support services, including direct materials and labor costs.
Our quarterly hardware revenues are difficult to predict. Our hardware revenues, cost of hardware and hardwareoperating margins that we report are affected by, among others: our ability to timely manufacture or deliver a fewlarge hardware transactions; our strategy for and the position of our hardware products relative to competitorofferings; customer demand for competing offerings, including IaaS; the strength of general economic andbusiness conditions; governmental budgetary constraints; whether customers decide to purchase hardwaresupport contracts at or in close proximity to the time of hardware product sale; the percentage of our hardwaresupport contract customer base that renews its support contracts and the close association between hardwareproducts, which have a finite life, and customer demand for related hardware support as hardware products age;customer decisions to either maintain or upgrade their existing hardware infrastructure to newly developedtechnologies that are available; certain of our acquisitions; and foreign currency rate fluctuations.
Services Business
Our services business, which represented 8% of our total revenues in fiscal 2019 and 9% of our total revenues ineach of fiscal 2018 and 2017, helps customers and partners maximize the performance of their investments inOracle applications and infrastructure technologies. We believe that our services are differentiated based on ourfocus on Oracle technologies, extensive experience, broad sets of intellectual property, and best practices. Ourservices offerings include consulting services, advanced customer support services and education services. Ourservices business has lower margins than our cloud and license and hardware businesses. Our services revenuesare impacted by, among others: our strategy for, and the competitive position of, our services; customer demandfor our cloud and license and hardware offerings and the associated services for these offerings; certain of ouracquisitions; general economic conditions; governmental budgetary constraints; personnel reductions in ourcustomers� IT departments; and tighter controls over customer discretionary spending.
Acquisitions
Our selective and active acquisition program is another important element of our corporate strategy. In recentyears, we have invested billions of dollars to acquire a number of complementary companies, products, servicesand technologies, including NetSuite in fiscal 2017.
We expect to continue to acquire companies, products, services and technologies in furtherance of our corporatestrategy. Note 2 of Notes to Consolidated Financial Statements included elsewhere in this Annual Report providesadditional information related to our recent acquisitions.
We believe that we can fund our future acquisitions with our internally available cash, cash equivalents andmarketable securities, cash generated from operations, additional borrowings or from the issuance of additional

39
securities. We estimate the financial impact of any potential acquisition with regard to earnings, operating margin,cash flow and return on invested capital targets before deciding to move forward with an acquisition.
Critical Accounting Policies and Estimates
Our consolidated financial statements are prepared in accordance with U.S. generally accepted accountingprinciples (GAAP) as set forth in the Financial Accounting Standards Board�s (FASB), ASC, and we consider thevarious staff accounting bulletins and other applicable guidance issued by the SEC. Note 1 of Notes to ConsolidatedFinancial Statements included elsewhere in this Annual Report includes a description of our significant accountingpolicies. GAAP, as set forth within the ASC, requires us to make certain estimates, judgments and assumptions aswe apply our significant accounting policies. The accounting policies that reflect estimates, judgments andassumptions that we believe are the most critical to aid in fully understanding and evaluating our reportedfinancial results and for which we include additional discussion below are:
� Revenue Recognition;
� Business Combinations;
� Goodwill and Intangible Assets�Impairment Assessments;
� Accounting for Income Taxes; and
� Legal and Other Contingencies.
Our senior management has reviewed our critical accounting policies and related disclosures with the Finance andAudit Committee of the Board of Directors.
Revenue Recognition
The most critical judgments required in applying Topic 606 and our revenue recognition policy relate to thedetermination of distinct performance obligations and the evaluation of the standalone selling price (SSP) for eachperformance obligation.
Many of our customer contracts include multiple performance obligations. Judgment is required in determiningwhether each performance obligation within a customer contract is distinct. Oracle products and services generallydo not require a significant amount of integration or interdependency. Therefore, multiple products and servicescontained within a customer contract are generally considered to be distinct and are not combined for revenuerecognition purposes. We allocate the transaction price for each customer contract to each performanceobligation based on the relative SSP (the determination of SSP is discussed below) for each performance obligationwithin each contract. We recognize the amount of transaction price allocated to each performance obligationwithin a customer contract as revenue as each performance obligation is delivered.
We use judgment in determining the SSP for products and services. For substantially all performance obligationsexcept cloud licenses and on-premise licenses, we are able to establish the SSP based on the observable prices ofproducts or services sold separately in comparable circumstances to similar customers. We typically establish anSSP range for our products and services, which is reassessed on a periodic basis or when facts and circumstanceschange. SSP for our products and services can evolve over time due to changes in our pricing practices that areinfluenced by intense competition, changes in demand for our products and services, and economic factors,among others. Our cloud licenses and on-premise licenses have not historically been sold on a standalone basis, assubstantially all customers elect to purchase license support contracts at the time of a cloud license and on-premise license purchase. License support contracts are generally priced as a percentage of the net fees paid bythe customer to access the license. We are unable to establish the SSP for our cloud licenses and on-premiselicenses based on observable prices given the same products are sold for a broad range of amounts (that is, theselling price is highly variable) and a representative SSP is not discernible from past transactions or otherobservable evidence. As a result, the SSP for a cloud license and an on-premise license included in a contract withmultiple performance obligations is determined by applying a residual approach whereby all other performance

40
obligations within a contract are first allocated a portion of the transaction price based upon their respective SSPs,with any residual amount of transaction price allocated to cloud license and on-premise license revenues.
Business Combinations
We apply the provisions of ASC 805, Business Combinations, in accounting for our acquisitions. ASC 805 requiresthat we evaluate whether a transaction pertains to an acquisition of assets, or to an acquisition of a business. Abusiness is defined as an integrated set of assets and activities that is capable of being conducted and managed forthe purpose of providing a return to investors. Asset acquisitions are accounted for by allocating the cost of theacquisition to the individual assets and liabilities assumed on a relative fair value basis; whereas the acquisition ofa business requires us to recognize separately from goodwill the assets acquired and the liabilities assumed at theacquisition date fair values. Goodwill as of the acquisition date is measured as the excess of considerationtransferred over the net of the acquisition date fair values of the assets acquired and the liabilities assumed. Whilewe use our best estimates and assumptions to accurately value assets acquired and liabilities assumed at theacquisition date as well as any contingent consideration, where applicable, our estimates are inherently uncertainand subject to refinement. As a result, during the measurement period, which may be up to one year from theacquisition date, we record adjustments to the assets acquired and liabilities assumed with the correspondingoffset to goodwill. Upon the conclusion of the measurement period or final determination of the values of assetsacquired or liabilities assumed, whichever comes first, any subsequent adjustments are recorded to ourconsolidated statements of operations.
Accounting for business combinations requires our management to make significant estimates and assumptions,especially at the acquisition date, including our estimates for intangible assets, contractual obligations assumed,pre-acquisition contingencies and any contingent consideration, where applicable. Although we believe that theassumptions and estimates we have made in the past have been reasonable and appropriate, they are based inpart on historical experience and information obtained from the management of the acquired companies and areinherently uncertain. Unanticipated events and circumstances may occur that may affect the accuracy or validity ofsuch assumptions, estimates or actual results.
For a given acquisition, we may identify certain pre-acquisition contingencies as of the acquisition date and mayextend our review and evaluation of these pre-acquisition contingencies throughout the measurement period inorder to obtain sufficient information to assess whether we include these contingencies as a part of the fair valueestimates of assets acquired and liabilities assumed and, if so, to determine their estimated amounts.
If we cannot reasonably determine the fair value of a non-income tax related pre-acquisition contingency by theend of the measurement period, which is generally the case given the nature of such matters, we will recognize anasset or a liability for such pre-acquisition contingency if: (1) it is probable that an asset existed or a liability hadbeen incurred at the acquisition date and (2) the amount of the asset or liability can be reasonably estimated.Subsequent to the measurement period, changes in our estimates of such contingencies will affect earnings andcould have a material effect on our results of operations and financial position.
In addition, uncertain tax positions and tax related valuation allowances assumed in connection with a businesscombination are initially estimated as of the acquisition date. We reevaluate these items quarterly based uponfacts and circumstances that existed as of the acquisition date with any adjustments to our preliminary estimatesbeing recorded to goodwill if identified within the measurement period. Subsequent to the measurement periodor our final determination of the tax allowance�s or contingency�s estimated value, whichever comes first, changesto these uncertain tax positions and tax related valuation allowances will affect our provision for income taxes inour consolidated statement of operations and could have a material impact on our results of operations andfinancial position.
Goodwill and Intangible Assets�Impairment Assessments
We review goodwill for impairment annually and whenever events or changes in circumstances indicate itscarrying value may not be recoverable. We make certain judgments and assumptions to determine our reportingunits and in allocating shared assets and liabilities to determine the carrying values for each of our reporting units.

41
Judgment in the assessment of qualitative factors of impairment include cost factors; financial performance; legal,regulatory, contractual, political, business, and other factors; entity specific factors; industry and marketconsiderations, macroeconomic conditions, and other relevant events and factors affecting the reporting unit. Tothe extent we determine that it is more likely than not that the fair value of the reporting unit is less than itscarrying value, a quantitative test is then performed.
Determining the fair value of a reporting unit involves the use of significant estimates and assumptions. Theseestimates and assumptions include, among others, revenue growth rates and operating margins used to calculateprojected future cash flows, risk-adjusted discount rates, future economic and market conditions, and thedetermination of appropriate market comparables.
We make judgments about the recoverability of purchased finite lived intangible assets whenever events orchanges in circumstances indicate that impairment may exist. In such situations, we are required to evaluatewhether the net book values of our finite lived intangible assets are recoverable. We determine whether finitelived intangible assets are recoverable based upon the forecasted future cash flows that are expected to begenerated by the lowest level associated asset grouping. Assumptions and estimates about future values andremaining useful lives of our intangible assets are complex and subjective and include, among others, forecastedundiscounted cash flows to be generated by certain asset groupings. These assumptions and estimates can beaffected by a variety of factors, including external factors such as industry and economic trends and internalfactors such as changes in our business strategy and our internal forecasts.
Accounting for Income Taxes
Judgment is required in determining our worldwide income tax provision. In the ordinary course of a globalbusiness, there are many transactions and calculations where the ultimate tax outcome is uncertain. Some ofthese uncertainties arise as a consequence of revenue sharing and cost reimbursement arrangements amongrelated entities, the process of identifying items of revenues and expenses that qualify for preferential taxtreatment, and the segregation of foreign and domestic earnings and expenses to avoid double taxation. Althoughwe believe that our estimates are reasonable, the final tax outcome of these matters could be different from thatwhich is reflected in our historical income tax provisions and accruals. Such differences could have a material effecton our income tax provision and net income in the period in which such determination is made.
We record a valuation allowance to reduce our deferred tax assets to the amount that is more likely than not to berealized. In order for us to realize our deferred tax assets, we must be able to generate sufficient taxable income inthose jurisdictions where the deferred tax assets are located. We consider future growth, forecasted earnings,future taxable income, the mix of earnings in the jurisdictions in which we operate, historical earnings, taxableincome in prior years, if carryback is permitted under the law, and prudent and feasible tax planning strategies indetermining the need for a valuation allowance. In the event we were to determine that we would not be able torealize all or part of our net deferred tax assets in the future, an adjustment to the deferred tax assets valuationallowance would be charged to earnings in the period in which we make such a determination, or goodwill wouldbe adjusted at our final determination of the valuation allowance related to an acquisition within themeasurement period. If we later determine that it is more likely than not that the net deferred tax assets would berealized, we would reverse the applicable portion of the previously provided valuation allowance as an adjustmentto our provision for income taxes at such time.
We calculate our current and deferred tax provision based on estimates and assumptions that could differ fromthe actual results reflected in income tax returns filed during the subsequent year. Adjustments based on filedreturns are generally recorded in the period when the tax returns are filed and the global tax implications areknown, which can materially impact our effective tax rate.
The amount of income tax we pay is subject to ongoing audits by federal, state and foreign tax authorities, whichoften result in proposed assessments. Our estimate of the potential outcome for any uncertain tax issue mayrequire certain judgments. A description of our accounting policies associated with tax related contingenciesassumed as a part of a business combination is provided under �Business Combinations� above. For those taxrelated contingencies that are not a part of a business combination, we account for these uncertain tax issues
42
pursuant to ASC 740, Income Taxes, which contains a two-step approach to recognizing and measuring uncertaintax positions taken or expected to be taken in a tax return. The first step is to determine if the weight of availableevidence indicates that it is more likely than not that the tax position will be sustained in an audit, includingresolution of any related appeals or litigation processes. The second step is to measure the tax benefit as thelargest amount that is more than 50% likely to be realized upon ultimate settlement. Although we believe that wehave adequately reserved for our uncertain tax positions, no assurance can be given with respect to the finaloutcome of these matters. We adjust reserves for our uncertain tax positions due to changing facts andcircumstances, such as the closing of a tax audit, judicial rulings, and refinement of estimates or realization ofearnings or deductions that differ from our estimates. To the extent that the final outcome of these matters isdifferent than the amounts recorded, such differences generally will impact our provision for income taxes in theperiod in which such a determination is made. Our provisions for income taxes include the impact of reserveprovisions and changes to reserves that are considered appropriate and also include the related interest andpenalties.
Legal and Other Contingencies
We are currently involved in various claims and legal proceedings. Quarterly, we review the status of eachsignificant matter and assess our potential financial exposure. A description of our accounting policies associatedwith contingencies assumed as a part of a business combination is provided under �Business Combinations� above.For legal and other contingencies that are not a part of a business combination, we accrue a liability for anestimated loss if the potential loss from any claim or legal proceeding is considered probable, and the amount canbe reasonably estimated. Significant judgment is required in both the determination of probability and thedetermination as to whether the amount of an exposure is reasonably estimable. Because of uncertainties relatedto these matters, accruals are based only on the best information available at the time the accruals are made. Asadditional information becomes available, we reassess the potential liability related to our pending claims andlitigation and may revise our estimates. Such revisions in the estimates of the potential liabilities could have amaterial impact on our results of operations and financial position.
Results of Operations
Impacts of the U.S. Tax Cuts and Jobs Act of 2017
The comparability of our operating results in fiscal 2019 compared to the corresponding prior year periods, and ofour consolidated balance sheets as of May 31, 2019 relative to May 31, 2018, was impacted by the U.S. Tax Cutsand Jobs Act of 2017 (the Tax Act), which was effective for us in our third quarter of fiscal 2018. Informationregarding our adoption and the impacts of the Tax Act are included in Notes 1 and 14 of Notes to ConsolidatedFinancial Statements included elsewhere in this Annual Report.
Impacts of Acquisitions
The comparability of our operating results in fiscal 2019 compared to fiscal 2018 was impacted by our recentacquisitions. In our discussion of changes in our results of operations from fiscal 2019 compared to fiscal 2018, wemay qualitatively disclose the impact of our acquired products and services revenues (for the one-year periodsubsequent to the acquisition date) to certain of our businesses� revenues where such qualitative discussionswould be meaningful for an understanding of the factors that influenced the changes in our results of operations.When material, we may also provide quantitative disclosures related to such acquired products and services.Expense contributions from our recent acquisitions for each of the respective period comparisons may not beseparately identifiable due to the integration of these businesses into our existing operations, and/or wereinsignificant to our results of operations during the periods presented.
43
We caution readers that, while pre- and post-acquisition comparisons, as well as any quantified amountsthemselves, may provide indications of general trends, any acquisition information that we provide has inherentlimitations for the following reasons:
� any qualitative and quantitative disclosures cannot specifically address or quantify the substantial effectsattributable to changes in business strategies, including our sales force integration efforts. We believethat if our acquired companies had operated independently and sales forces had not been integrated, therelative mix of products and services sold would have been different; and
� the amounts shown as cloud services and license support deferred revenues in our �SupplementalDisclosure Related to Certain Charges� (presented below) are not necessarily indicative of revenueimprovements we will achieve upon contract renewals to the extent customers do not renew.
Presentation of Operating Segment Results and Other Financial Information
In our fiscal 2019 compared to fiscal 2018 results of operations discussion below, we provide an overview of ourtotal consolidated revenues, total consolidated expenses and total consolidated operating margin, all of which arepresented on a GAAP basis. We also present a GAAP-based discussion below for substantially all of the otherexpense items as presented in our consolidated statement of operations that are not directly attributable to ourthree businesses.
In addition, we discuss below the fiscal 2019 compared to fiscal 2018 results of each our three businesses�cloudand license, hardware and services�which are our operating segments as defined pursuant to ASC 280, SegmentReporting. The financial reporting for our three businesses that is presented below is presented in a manner that isconsistent with that used by our CODMs. Our operating segment presentation below reflects revenues, directcosts and sales and marketing expenses that correspond to and are directly attributable to each of our threebusinesses. We also utilize these inputs to calculate and present a segment margin for each business in thediscussion below.
Consistent with our internal management reporting processes, the below operating segment presentation includesrevenues adjustments related to cloud services and license support contracts that would have otherwise beenrecorded by the acquired businesses as independent entities but were not recognized in our consolidatedstatements of operations for the periods presented due to business combination accounting requirements. Referto �Supplemental Disclosure Related to Certain Charges� below for additional discussion of these items and Note15 of Notes to Consolidated Financial Statements included elsewhere in this Annual Report for a reconciliation ofthe summations of our total operating segment revenues as presented in the discussion below to total revenues aspresented per our consolidated statements of operations for all periods presented.
In addition, research and development expenses, general and administrative expenses, stock-based compensationexpenses, amortization of intangible assets, certain other expense allocations, acquisition related and otherexpenses, restructuring expenses, interest expense, non-operating income, net and provision for income taxes arenot attributed to our three operating segments because our management does not view the performance of ourthree businesses including such items and/or it is impractical to do so. Refer to �Supplemental Disclosure Relatedto Certain Charges� below for additional discussion of certain of these items and Note 15 of Notes to ConsolidatedFinancial Statements included elsewhere in this Annual Report for a reconciliation of the summations of totalsegment margin as presented in the discussion below to total income before provision of income taxes aspresented per our consolidated statements of operations for all periods presented.
A discussion regarding our financial condition and results of operations for fiscal 2019 compared to fiscal 2018 ispresented below and the results for both fiscal 2019 and 2018 have been accounted for and presented to reflectour adoption of Topic 606 and ASU 2017-07, neither of which materially impacted our financial condition or resultsof operations for fiscal 2019 or 2018. A discussion regarding our financial condition and results of operations forfiscal 2018 compared to fiscal 2017 can be found under Item 7 in our Annual Report on Form 10-K for the fiscalyear ended May 31, 2018, filed with the SEC on June 22, 2018, which is available free of charge on the SEC�swebsite at www.sec.gov and our Investor Relations website at www.oracle.com/investor. Our consolidated

44
financial statements for the fiscal years ended and as of May 31, 2018 and 2017 included elsewhere in this AnnualReport have been retrospectively restated to reflect the adoption of Topic 606 and ASU 2017-07. The adoption ofTopic 606 and ASU 2017-07 did not have a material impact on the comparability of our financial condition andresults of operations for fiscal 2018 relative to fiscal 2017 as presented in Item 7 of our Annual Report on Form 10-K for the fiscal year ended May 31, 2018. Additional information regarding our adoption of Topic 606 and ASU2017-07 is included in Note 1 of Notes to Consolidated Financial Statements included elsewhere in this AnnualReport.
Constant Currency Presentation
Our international operations have provided and are expected to continue to provide a significant portion of eachof our businesses� revenues and expenses. As a result, each businesses� revenues and expenses and our totalrevenues and expenses will continue to be affected by changes in the U.S. Dollar against major internationalcurrencies. In order to provide a framework for assessing how our underlying businesses performed excluding theeffects of foreign currency rate fluctuations, we compare the percent change in the results from one period toanother period in this Annual Report using constant currency disclosure. To present this information, current andcomparative prior period results for entities reporting in currencies other than U.S. Dollars are converted into U.S.Dollars at constant exchange rates (i.e., the rates in effect on May 31, 2018, which was the last day of our priorfiscal year) rather than the actual exchange rates in effect during the respective periods. For example, if an entityreporting in Euros had revenues of 1.0 million Euros from products sold on May 31, 2019 and 2018, our financialstatements would reflect reported revenues of $1.11 million in fiscal 2019 (using 1.11 as the month-end averageexchange rate for the period) and $1.16 million in fiscal 2018 (using 1.16 as the month-end average exchange ratefor the period). The constant currency presentation, however, would translate the fiscal 2019 results using thefiscal 2018 exchange rate and indicate, in this example, no change in revenues during the period. In each of thetables below, we present the percent change based on actual, unrounded results in reported currency and inconstant currency.

45
Total Revenues and Operating Expenses
Year Ended May 31,Percent Change
(Dollars in millions) 2019 Actual Constant 2018
Total Revenues by Geography:Americas. . . . . . . . . . . . . . . . . . . . . . . . . . . . . . . . . . . . . . . . . . . . . . . . . . . . . . . . . . . . . $ 21,856 1% 2% $ 21,648EMEA(1) . . . . . . . . . . . . . . . . . . . . . . . . . . . . . . . . . . . . . . . . . . . . . . . . . . . . . . . . . . . . . . 11,270 -1% 3% 11,409Asia Pacific. . . . . . . . . . . . . . . . . . . . . . . . . . . . . . . . . . . . . . . . . . . . . . . . . . . . . . . . . . . 6,380 1% 5% 6,326
Total revenues . . . . . . . . . . . . . . . . . . . . . . . . . . . . . . . . . . . . . . . . . . . . . . . . 39,506 0% 3% 39,383Total Operating Expenses . . . . . . . . . . . . . . . . . . . . . . . . . . . . . . . . . . . . . . . . . . 25,971 -1% 2% 26,119Total Operating Margin . . . . . . . . . . . . . . . . . . . . . . . . . . . . . . . . . . . . . . . . . . . . $ 13,535 2% 5% $ 13,264Total Operating Margin % . . . . . . . . . . . . . . . . . . . . . . . . . . . . . . . . . . . . . . . . . 34% 34%% Revenues by Geography:Americas. . . . . . . . . . . . . . . . . . . . . . . . . . . . . . . . . . . . . . . . . . . . . . . . . . . . . . . . . . . . . 55% 55%EMEA . . . . . . . . . . . . . . . . . . . . . . . . . . . . . . . . . . . . . . . . . . . . . . . . . . . . . . . . . . . . . . . . 29% 29%Asia Pacific. . . . . . . . . . . . . . . . . . . . . . . . . . . . . . . . . . . . . . . . . . . . . . . . . . . . . . . . . . . 16% 16%Total Revenues by Business:Cloud and license . . . . . . . . . . . . . . . . . . . . . . . . . . . . . . . . . . . . . . . . . . . . . . . . . . . $ 32,562 2% 4% $ 31,994Hardware . . . . . . . . . . . . . . . . . . . . . . . . . . . . . . . . . . . . . . . . . . . . . . . . . . . . . . . . . . . . 3,704 -7% -5% 3,994Services . . . . . . . . . . . . . . . . . . . . . . . . . . . . . . . . . . . . . . . . . . . . . . . . . . . . . . . . . . . . . . 3,240 -5% -2% 3,395
Total revenues . . . . . . . . . . . . . . . . . . . . . . . . . . . . . . . . . . . . . . . . . . . . . . . . $ 39,506 0% 3% $ 39,383% Revenues by Business:Cloud and license . . . . . . . . . . . . . . . . . . . . . . . . . . . . . . . . . . . . . . . . . . . . . . . . . . . 83% 81%Hardware . . . . . . . . . . . . . . . . . . . . . . . . . . . . . . . . . . . . . . . . . . . . . . . . . . . . . . . . . . . . 9% 10%Services . . . . . . . . . . . . . . . . . . . . . . . . . . . . . . . . . . . . . . . . . . . . . . . . . . . . . . . . . . . . . . 8% 9%
(1) Comprised of Europe, the Middle East and Africa
Excluding the effects of currency rate fluctuations, our total revenues increased in fiscal 2019 relative to fiscal 2018due to growth in our cloud and license revenues, partially offset by decreases in our hardware revenues andservices revenues. The constant currency increase in our cloud and license revenues during fiscal 2019 relative tofiscal 2018 was attributable to growth in our cloud services and license support revenues as customers purchasedour applications and infrastructure technologies via cloud deployment models and license deployment models andrenewed their related cloud and license support contracts to continue to gain access to our latest technology andsupport services, and was also attributable to growth in our cloud license and on-premise license revenues. Theconstant currency decreases in our hardware revenues during fiscal 2019 relative to fiscal 2018 were due to areduction in our hardware products revenues and hardware support revenues primarily due to the emphasis weplaced on the marketing and sale of our cloud-based infrastructure technologies, which resulted in reduced salesvolumes of certain of our hardware product lines and also impacted the volume of customers that purchasedhardware support contracts. The constant currency decrease in our services revenues during fiscal 2019 relative tofiscal 2018 was attributable to declines in our consulting and education services revenues. In constant currency,the Americas, EMEA and Asia Pacific regions contributed 40%, 33% and 27%, respectively, to the growth in ourfiscal 2019 total revenues.
Excluding the effects of currency rate fluctuations, our total operating expenses increased during fiscal 2019relative to fiscal 2018 primarily due to higher expenses related to our cloud and license business, which resultedprimarily from increased headcount and infrastructure expenses to support the increase in our cloud and licensebusiness� revenues. This constant currency expense increase was partially offset by certain expense decreases infiscal 2019 relative to fiscal 2018, primarily lower expenses related to our hardware business and lowerrestructuring expenses.
In constant currency, our total operating margin increased during fiscal 2019 relative to fiscal 2018 primarily due tothe increase in revenues and total operating margin as a percentage of total revenues remained flat.

46
Supplemental Disclosure Related to Certain Charges
To supplement our consolidated financial information, we believe that the following information is helpful to anoverall understanding of our past financial performance and prospects for the future. You should review theintroduction under �Impacts of Acquisitions� (above) for a discussion of the inherent limitations in comparing pre-and post-acquisition information.
Our operating results reported pursuant to GAAP included the following business combination accountingadjustments and expenses related to acquisitions and certain other expense and income items that affected ourGAAP net income:
Year Ended May 31,(in millions) 2019 2018
Cloud services and license support deferred revenues(1) . . . . . . . . . . . . . . . . . . . . . . . . . . . . . . . . $ 20 $ 47Acquired deferred sales commissions amortization(2) . . . . . . . . . . . . . . . . . . . . . . . . . . . . . . . . . . . . � (22)Amortization of intangible assets(3) . . . . . . . . . . . . . . . . . . . . . . . . . . . . . . . . . . . . . . . . . . . . . . . . . . . . . . . . . . 1,689 1,620Acquisition related and other(4)(6) . . . . . . . . . . . . . . . . . . . . . . . . . . . . . . . . . . . . . . . . . . . . . . . . . . . . . . . . . . . . 44 52Restructuring(5) . . . . . . . . . . . . . . . . . . . . . . . . . . . . . . . . . . . . . . . . . . . . . . . . . . . . . . . . . . . . . . . . . . . . . . . . . . . . . . . . . . 443 588Stock-based compensation, operating segments(6) . . . . . . . . . . . . . . . . . . . . . . . . . . . . . . . . . . . . . . . 518 505Stock-based compensation, R&D and G&A(6) . . . . . . . . . . . . . . . . . . . . . . . . . . . . . . . . . . . . . . . . . . . . . . 1,135 1,101Income tax effects(7) . . . . . . . . . . . . . . . . . . . . . . . . . . . . . . . . . . . . . . . . . . . . . . . . . . . . . . . . . . . . . . . . . . . . . . . . . . . . (1,406) (1,431)Income tax reform(8). . . . . . . . . . . . . . . . . . . . . . . . . . . . . . . . . . . . . . . . . . . . . . . . . . . . . . . . . . . . . . . . . . . . . . . . . . . . (389) 6,870
$ 2,054 $ 9,330
(1) In connection with our acquisitions, we have estimated the fair values of the cloud services and license support contracts assumed. Due to ourapplication of business combination accounting rules, we did not recognize the cloud services and license support revenue amounts as presented inthe above table that would have otherwise been recorded by the acquired businesses as independent entities upon delivery of the contractualobligations. To the extent customers for which these contractual obligations pertain renew these contracts with us, we expect to recognizerevenues for the full contracts� values over the respective contracts� renewal periods.
(2) Certain acquired companies capitalized sales commissions associated with subscription agreements and amortized these amounts over the relatedcontractual terms. Business combination accounting rules generally require us to eliminate these acquired capitalized sales commissions balancesas of the acquisition date and our post-combination GAAP sales and marketing expenses generally do not reflect the amortization of these acquireddeferred sales commissions balances. This adjustment is intended to include, and thus reflect, the full amount of amortization related to suchbalances as though the acquired companies operated independently in the periods presented.
(3) Represents the amortization of intangible assets, substantially all of which were acquired in connection with our acquisitions. As of May 31, 2019,estimated future amortization related to intangible assets was as follows (in millions):
Fiscal 2020 . . . . . . . . . . . . . . . . . . . . . . . . . . . . . . . . . . . . . . . . . . . . . . . . . . . . . . . . . . . . . . . . . . . . . . . . . . . . . . . . . . . . . . . . . . . . . . . . . . . . . . . . . . . . . . . . . . . . . . . . $ 1,583Fiscal 2021 . . . . . . . . . . . . . . . . . . . . . . . . . . . . . . . . . . . . . . . . . . . . . . . . . . . . . . . . . . . . . . . . . . . . . . . . . . . . . . . . . . . . . . . . . . . . . . . . . . . . . . . . . . . . . . . . . . . . . . . . 1,339Fiscal 2022 . . . . . . . . . . . . . . . . . . . . . . . . . . . . . . . . . . . . . . . . . . . . . . . . . . . . . . . . . . . . . . . . . . . . . . . . . . . . . . . . . . . . . . . . . . . . . . . . . . . . . . . . . . . . . . . . . . . . . . . . 1,090Fiscal 2023 . . . . . . . . . . . . . . . . . . . . . . . . . . . . . . . . . . . . . . . . . . . . . . . . . . . . . . . . . . . . . . . . . . . . . . . . . . . . . . . . . . . . . . . . . . . . . . . . . . . . . . . . . . . . . . . . . . . . . . . . 668Fiscal 2024 . . . . . . . . . . . . . . . . . . . . . . . . . . . . . . . . . . . . . . . . . . . . . . . . . . . . . . . . . . . . . . . . . . . . . . . . . . . . . . . . . . . . . . . . . . . . . . . . . . . . . . . . . . . . . . . . . . . . . . . . 440Thereafter . . . . . . . . . . . . . . . . . . . . . . . . . . . . . . . . . . . . . . . . . . . . . . . . . . . . . . . . . . . . . . . . . . . . . . . . . . . . . . . . . . . . . . . . . . . . . . . . . . . . . . . . . . . . . . . . . . . . . . . . 159
Total intangible assets, net . . . . . . . . . . . . . . . . . . . . . . . . . . . . . . . . . . . . . . . . . . . . . . . . . . . . . . . . . . . . . . . . . . . . . . . . . . . . . . . . . . . . . . . . . . . . . . . . $ 5,279
(4) Acquisition related and other expenses primarily consist of personnel related costs and stock-based compensation expenses for transitional andcertain other employees, integration related professional services, certain business combination adjustments including certain adjustments afterthe measurement period has ended and certain other operating items, net.
(5) Restructuring expenses during fiscal 2019 primarily related to employee severance in connection with our Fiscal 2019 Oracle Restructuring Plan(2019 Restructuring Plan). Restructuring expenses during fiscal 2018 primarily related to employee severance in connection with our Fiscal 2017Oracle Restructuring Plan (2017 Restructuring Plan). Additional information regarding certain of our restructuring plans is provided in thediscussion below under �Restructuring Expenses� and in Note 8 of Notes to Consolidated Financial Statements included elsewhere in this AnnualReport.

47
(6) Stock-based compensation was included in the following operating expense line items of our consolidated statements of operations (in millions):
Year Ended May 31,2019 2018
Cloud services and license support. . . . . . . . . . . . . . . . . . . . . . . . . . . . . . . . . . . . . . . . . . . . . . . . . . . . . . . . . . . . . . . . . . . . . . . . . . $ 99 $ 82Hardware . . . . . . . . . . . . . . . . . . . . . . . . . . . . . . . . . . . . . . . . . . . . . . . . . . . . . . . . . . . . . . . . . . . . . . . . . . . . . . . . . . . . . . . . . . . . . . . . . . . 10 10Services . . . . . . . . . . . . . . . . . . . . . . . . . . . . . . . . . . . . . . . . . . . . . . . . . . . . . . . . . . . . . . . . . . . . . . . . . . . . . . . . . . . . . . . . . . . . . . . . . . . . . 49 52Sales and marketing. . . . . . . . . . . . . . . . . . . . . . . . . . . . . . . . . . . . . . . . . . . . . . . . . . . . . . . . . . . . . . . . . . . . . . . . . . . . . . . . . . . . . . . . . 360 361
Stock-based compensation, operating segments . . . . . . . . . . . . . . . . . . . . . . . . . . . . . . . . . . . . . . . . . . . . . . . . . . . . 518 505Research and development . . . . . . . . . . . . . . . . . . . . . . . . . . . . . . . . . . . . . . . . . . . . . . . . . . . . . . . . . . . . . . . . . . . . . . . . . . . . . . . . . 963 921General and administrative . . . . . . . . . . . . . . . . . . . . . . . . . . . . . . . . . . . . . . . . . . . . . . . . . . . . . . . . . . . . . . . . . . . . . . . . . . . . . . . . . 172 180Acquisition related and other . . . . . . . . . . . . . . . . . . . . . . . . . . . . . . . . . . . . . . . . . . . . . . . . . . . . . . . . . . . . . . . . . . . . . . . . . . . . . . . � 1
Total stock-based compensation. . . . . . . . . . . . . . . . . . . . . . . . . . . . . . . . . . . . . . . . . . . . . . . . . . . . . . . . . . . . . . . . . . . . . $ 1,653 $ 1,607
Stock-based compensation included in acquisition related and other expenses resulted from unvested stock options and restricted stock-basedawards assumed from acquisitions whose vesting was accelerated generally upon termination of the employees pursuant to the terms of thosestock options and restricted stock-based awards.
(7) For fiscal 2019 and 2018, the applicable jurisdictional tax rates applied to our income before provision for income taxes after excluding the taxeffects of items within the table above such as for stock-based compensation, amortization of intangible assets, restructuring, and certain otheracquisition related items; after excluding the effects of income tax reform (see footnote (8) below); and, for fiscal 2019, after excluding a taxbenefit arising from the increase of a deferred tax asset associated with a partial realignment of our legal structure; resulted in an effective tax rateof 18.5% and 20.8% in fiscal 2019 and 2018, respectively, instead of 9.7% and 71.1%, respectively, which represented our effective tax rates asderived per our consolidated statements of operations.
(8) The income tax reform adjustments presented in the table above were due to the enactment of the Tax Act (refer to Note 1 of Notes toConsolidated Financial Statements included elsewhere in this Annual Report), which was effective for us in fiscal 2018, and also due to subsequentincome tax expense adjustments made pursuant to SAB 118 during fiscal 2019.
Cloud and License Business
Our cloud and license business engages in the sale, marketing and delivery of our applications and infrastructuretechnologies through various deployment models, including Oracle Cloud Services offerings, cloud license and on-premise license offerings and license support offerings. Oracle Cloud Services deliver certain of our applicationsand infrastructure technologies on a subscription basis via cloud-based deployment models that we develop,provide unspecified updates and enhancements for, host, manage, upgrade and support. Our cloud servicesrevenues are generally recognized over the contractual term, which is generally one to three years, or in the caseof usage model contracts, as the cloud services are consumed. Cloud license and on-premise license revenuesrepresent fees earned from granting customers licenses, generally on a perpetual basis, to use our database andmiddleware and our applications software products within cloud and on-premise IT environments and aregenerally recognized upfront at the point in time when the software is made available to the customer todownload and use. License support revenues are typically generated through the sale of license support contractsrelated to cloud licenses and on-premise licenses purchased and renewed by our customers at their option and aregenerally recognized as revenues ratably over the contractual term, which is generally one year. We continue toplace significant emphasis, both domestically and internationally, on direct sales through our own sales force. Wealso continue to market certain of our offerings through indirect channels. Costs associated with our cloud andlicense business are included in cloud services and license support expenses, and sales and marketing expenses.These costs are largely personnel and infrastructure related including the cost of providing our cloud services andlicense support offerings, salaries and commissions earned by our sales force for the sale of our cloud and licenseofferings, and marketing program costs.

48
Year Ended May 31,Percent Change
(Dollars in millions) 2019 Actual Constant 2018
Cloud and License Revenues:Americas(1) . . . . . . . . . . . . . . . . . . . . . . . . . . . . . . . . . . . . . . . . . . . . . . . . . . . $ 18,410 2% 3% $ 18,030EMEA(1) . . . . . . . . . . . . . . . . . . . . . . . . . . . . . . . . . . . . . . . . . . . . . . . . . . . . . . . 9,168 0% 4% 9,163Asia Pacific(1) . . . . . . . . . . . . . . . . . . . . . . . . . . . . . . . . . . . . . . . . . . . . . . . . . 5,004 3% 7% 4,848
Total revenues(1) . . . . . . . . . . . . . . . . . . . . . . . . . . . . . . . . . . . . . . . 32,582 2% 4% 32,041Expenses:Cloud services and license support(2) . . . . . . . . . . . . . . . . . . . . . . . 3,597 5% 6% 3,441Sales and marketing(2) . . . . . . . . . . . . . . . . . . . . . . . . . . . . . . . . . . . . . . . 7,398 3% 5% 7,213
Total expenses(2) . . . . . . . . . . . . . . . . . . . . . . . . . . . . . . . . . . . . . . . 10,995 3% 6% 10,654Total Margin . . . . . . . . . . . . . . . . . . . . . . . . . . . . . . . . . . . . . . . . . . . . . . . . . $ 21,587 1% 3% $ 21,387Total Margin % . . . . . . . . . . . . . . . . . . . . . . . . . . . . . . . . . . . . . . . . . . . . . . 66% 67%% Revenues by Geography:Americas . . . . . . . . . . . . . . . . . . . . . . . . . . . . . . . . . . . . . . . . . . . . . . . . . . . . . 57% 56%EMEA . . . . . . . . . . . . . . . . . . . . . . . . . . . . . . . . . . . . . . . . . . . . . . . . . . . . . . . . . 28% 29%Asia Pacific . . . . . . . . . . . . . . . . . . . . . . . . . . . . . . . . . . . . . . . . . . . . . . . . . . . 15% 15%Revenues by Offerings:Cloud services and license support(1) . . . . . . . . . . . . . . . . . . . . . . . $ 26,727 2% 4% $ 26,269Cloud license and on-premise license . . . . . . . . . . . . . . . . . . . . . . 5,855 1% 4% 5,772
Total revenues(1) . . . . . . . . . . . . . . . . . . . . . . . . . . . . . . . . . . . . . . . $ 32,582 2% 4% $ 32,041Revenues by Ecosystem:Applications revenues(1) . . . . . . . . . . . . . . . . . . . . . . . . . . . . . . . . . . . . . $ 11,510 4% 6% $ 11,065Infrastructure revenues(1) . . . . . . . . . . . . . . . . . . . . . . . . . . . . . . . . . . . 21,072 0% 3% 20,976
Total revenues(1) . . . . . . . . . . . . . . . . . . . . . . . . . . . . . . . . . . . . . . . $ 32,582 2% 4% $ 32,041
(1) Includes cloud services and license support revenue adjustments related to certain cloud services and license support contracts that would haveotherwise been recorded as revenues by the acquired businesses as independent entities but were not recognized in our GAAP-based consolidatedstatements of operations for the periods presented due to business combination accounting requirements. Such revenue adjustments wereincluded in our operating segment results for purposes of reporting to and review by our CODMs. See �Presentation of Operating Segment Resultsand Other Financial Information� above for additional information.
(2) Excludes stock-based compensation and certain expense allocations. Also excludes amortization of intangible assets and certain other GAAP-basedexpenses, which were not allocated to our operating segment results for purposes of reporting to and review by our CODMs, as further describedunder �Presentation of Operating Segment Results and Other Financial Information� above.
Excluding the effects of currency rate fluctuations, our cloud and license business� total revenues increased in fiscal2019 relative to fiscal 2018 due to growth in our cloud services and license support revenues, which was primarilydue to increased customer purchases and renewals of cloud-based services and license support services in recentperiods, contributions from our recent acquisitions and increased cloud license and on-premise license revenues.In constant currency, our total applications revenues and our total infrastructure revenues each grew during fiscal2019 relative to fiscal 2018 as customers continued to deploy our applications technologies and infrastructuretechnologies through different deployment models that we offer that enable customer choice. The Americasregion contributed 43%, the EMEA region contributed 31% and the Asia Pacific region contributed 26% of theconstant currency revenues growth for this business in fiscal 2019.
In constant currency, total cloud and license expenses increased in fiscal 2019 compared to fiscal 2018 due tohigher sales and marketing expenses and higher cloud services and license support expenses, each of whichincreased primarily due to higher employee related expenses from higher headcount and due to higher technologyinfrastructure expenses.
Excluding the effects of currency rate fluctuations, our cloud and license segment�s total margin increased in fiscal2019 compared to fiscal 2018 primarily due to increased revenues, while total margin as a percentage of revenuesdecreased slightly due to expenses growth.

49
Hardware Business
Our hardware business� revenues are generated from the sales of our Oracle Engineered Systems, server, storage,and industry-specific hardware products. Each hardware product and its related software, such as an operatingsystem or firmware, are highly interdependent and interrelated and are accounted for as a combined performanceobligation. The revenues for this combined performance obligation are generally recognized at the point in timethat the hardware product and its related software are delivered to the customer and ownership is transferred tothe customer. Our hardware business also earns revenues from the sale of hardware support contracts purchasedand renewed by our customers at their option and are generally recognized as revenues ratably as the hardwaresupport services are delivered over the contractual term, which is generally one year. The majority of ourhardware products are sold through indirect channels such as independent distributors and value-added resellers,and we also market and sell our hardware products through our direct sales force. Operating expenses associatedwith our hardware business include the cost of hardware products, which consists of expenses for materials andlabor used to produce these products by our internal manufacturing operations or by third-party manufacturers,warranty expenses and the impact of periodic changes in inventory valuation, including the impact of inventorydetermined to be excess and obsolete; the cost of materials used to repair customer products; the cost of laborand infrastructure to provide support services; and sales and marketing expenses, which are largely personnelrelated and include variable compensation earned by our sales force for the sales of our hardware offerings.
Year Ended May 31,Percent Change
(Dollars in millions) 2019 Actual Constant 2018
Hardware Revenues:Americas . . . . . . . . . . . . . . . . . . . . . . . . . . . . . . . . . . . . . . . . . . . . . . . . . . . . . . . . . . . . $ 1,889 -6% -4% $ 2,003EMEA . . . . . . . . . . . . . . . . . . . . . . . . . . . . . . . . . . . . . . . . . . . . . . . . . . . . . . . . . . . . . . . . 1,082 -10% -5% 1,201Asia Pacific . . . . . . . . . . . . . . . . . . . . . . . . . . . . . . . . . . . . . . . . . . . . . . . . . . . . . . . . . . 733 -7% -4% 790
Total revenues . . . . . . . . . . . . . . . . . . . . . . . . . . . . . . . . . . . . . . . . . . . . . . . 3,704 -7% -5% 3,994Expenses:Hardware products and support(1). . . . . . . . . . . . . . . . . . . . . . . . . . . . . . 1,327 -14% -11% 1,547Sales and marketing(1) . . . . . . . . . . . . . . . . . . . . . . . . . . . . . . . . . . . . . . . . . . . . 520 -19% -16% 643
Total expenses(1). . . . . . . . . . . . . . . . . . . . . . . . . . . . . . . . . . . . . . . . . . . . . 1,847 -16% -13% 2,190Total Margin . . . . . . . . . . . . . . . . . . . . . . . . . . . . . . . . . . . . . . . . . . . . . . . . . . . . . . . $ 1,857 3% 6% $ 1,804Total Margin % . . . . . . . . . . . . . . . . . . . . . . . . . . . . . . . . . . . . . . . . . . . . . . . . . . . . 50% 45%% Revenues by Geography:Americas . . . . . . . . . . . . . . . . . . . . . . . . . . . . . . . . . . . . . . . . . . . . . . . . . . . . . . . . . . . . 51% 50%EMEA . . . . . . . . . . . . . . . . . . . . . . . . . . . . . . . . . . . . . . . . . . . . . . . . . . . . . . . . . . . . . . . . 29% 30%Asia Pacific . . . . . . . . . . . . . . . . . . . . . . . . . . . . . . . . . . . . . . . . . . . . . . . . . . . . . . . . . . 20% 20%(1) Excludes stock-based compensation and certain expense allocations. Also excludes amortization of intangible assets and certain other GAAP-based
expenses, which were not allocated to our operating segment results for purposes of reporting to and review by our CODMs, as further describedunder �Presentation of Operating Segments and Other Financial Information� above.
Excluding the effects of currency rate fluctuations, total hardware revenues decreased in fiscal 2019 relative tofiscal 2018 due to lower hardware products revenues and, to a lesser extent, lower hardware support revenues.The decrease in hardware products revenues in fiscal 2019 relative to fiscal 2018 was primarily attributable to ourcontinued emphasis on the marketing and sale of our cloud-based infrastructure technologies, which resulted inreduced sales volumes of certain of our hardware product lines and also impacted the volume of hardware supportcontracts sold in recent periods. This constant currency hardware revenue decrease was partially offset by certainhardware revenue increases related to our Oracle Engineered Systems offerings, primarily Oracle Exadata.
Excluding the effects of currency rate fluctuations, total hardware expenses decreased in fiscal 2019 compared tofiscal 2018 primarily due to lower hardware products and support costs and lower sales and marketing employeerelated expenses, all of which aligned to lower hardware revenues.

50
In constant currency, total margin and total margin as a percentage of revenues for our hardware segmentincreased in fiscal 2019 due to lower expenses.
Services Business
We offer services to customers and partners to help to maximize the performance of their investments in Oracleapplications and infrastructure technologies. Services revenues are generally recognized as the services areperformed. The cost of providing our services consists primarily of personnel related expenses, technologyinfrastructure expenditures, facilities expenses and external contractor expenses.
Year Ended May 31,Percent Change
(Dollars in millions) 2019 Actual Constant 2018
Services Revenues:Americas . . . . . . . . . . . . . . . . . . . . . . . . . . . . . . . . . . . . . . . . . . . . . . . . . . . . . . . . $ 1,576 -5% -3% $ 1,654EMEA.. . . . . . . . . . . . . . . . . . . . . . . . . . . . . . . . . . . . . . . . . . . . . . . . . . . . . . . . . . . 1,021 -2% 2% 1,046Asia Pacific. . . . . . . . . . . . . . . . . . . . . . . . . . . . . . . . . . . . . . . . . . . . . . . . . . . . . . 643 -7% -4% 695
Total revenues. . . . . . . . . . . . . . . . . . . . . . . . . . . . . . . . . . . . . . . . . . . . 3,240 -5% -2% 3,395Total Expenses(1) . . . . . . . . . . . . . . . . . . . . . . . . . . . . . . . . . . . . . . . . . . . . . . . 2,703 -1% 2% 2,729Total Margin . . . . . . . . . . . . . . . . . . . . . . . . . . . . . . . . . . . . . . . . . . . . . . . . . . . $ 537 -19% -18% $ 666Total Margin % . . . . . . . . . . . . . . . . . . . . . . . . . . . . . . . . . . . . . . . . . . . . . . . . 17% 20%% Revenues by Geography:Americas . . . . . . . . . . . . . . . . . . . . . . . . . . . . . . . . . . . . . . . . . . . . . . . . . . . . . . . . 49% 49%EMEA.. . . . . . . . . . . . . . . . . . . . . . . . . . . . . . . . . . . . . . . . . . . . . . . . . . . . . . . . . . . 31% 31%Asia Pacific. . . . . . . . . . . . . . . . . . . . . . . . . . . . . . . . . . . . . . . . . . . . . . . . . . . . . . 20% 20%(1) Excludes stock-based compensation and certain expense allocations. Also excludes amortization of intangible assets and certain other GAAP-based
expenses, which were not allocated to our operating segment results for purposes of reporting to and review by our CODMs, as further describedunder �Presentation of Operating Segments and Other Financial Information� above.
Excluding the effects of currency rate fluctuations, our total services revenues decreased in fiscal 2019 relative tofiscal 2018 primarily due to revenue declines in our education services and, to a lesser extent, our consultingservices. During fiscal 2019, constant currency increases in our EMEA-based services revenues were offset byconstant currency services revenue decreases in the Americas and the Asia Pacific regions.
In constant currency, total services expenses increased in fiscal 2019 compared to fiscal 2018 primarily due to anincrease in employee related expenses and external contractor expenses associated with investments in ourconsulting services that support our cloud offerings. In constant currency, total margin and total margin as apercentage of total services revenues decreased during fiscal 2019 relative to fiscal 2018 due to decreasedrevenues and increased expenses for this business.
Research and Development Expenses: Research and development expenses consist primarily of personnel relatedexpenditures. We intend to continue to invest significantly in our research and development efforts because, inour judgment, they are essential to maintaining our competitive position.
Year Ended May 31,Percent Change
(Dollars in millions) 2019 Actual Constant 2018
Research and development(1) . . . . . . . . . . . . . . . . . . . . . . . . . . . . . . . . . $ 5,063 -2% 0% $ 5,163Stock-based compensation . . . . . . . . . . . . . . . . . . . . . . . . . . . . . . . . . . . 963 5% 5% 921
Total expenses. . . . . . . . . . . . . . . . . . . . . . . . . . . . . . . . . . . . . . . . . . . . $ 6,026 -1% 0% $ 6,084% of Total Revenues . . . . . . . . . . . . . . . . . . . . . . . . . . . . . . . . . . . . . . . . . . . 15% 15%(1) Excluding stock-based compensation
51
On a constant currency basis, total research and development expenses were flat in fiscal 2019, as lower employeerelated expenses including lower variable compensation were offset by an increase in stock-based compensationexpenses.
General and Administrative Expenses: General and administrative expenses primarily consist of personnel relatedexpenditures for IT, finance, legal and human resources support functions; and professional services fees.
Year Ended May 31,Percent Change
(Dollars in millions) 2019 Actual Constant 2018
General and administrative(1) . . . . . . . . . . . . . . . . . . . . . . . . . . . . . . . . . $ 1,093 -1% 2% $ 1,102Stock-based compensation . . . . . . . . . . . . . . . . . . . . . . . . . . . . . . . . . . . 172 -5% -5% 180
Total expenses. . . . . . . . . . . . . . . . . . . . . . . . . . . . . . . . . . . . . . . . . . . . $ 1,265 -1% 1% $ 1,282% of Total Revenues . . . . . . . . . . . . . . . . . . . . . . . . . . . . . . . . . . . . . . . . . . . 3% 3%(1) Excluding stock-based compensation
Excluding the effects of currency rate fluctuations, total general and administrative expenses increased in fiscal2019 compared to fiscal 2018 primarily due to increased professional services fees.
Amortization of Intangible Assets: Substantially all of our intangible assets were acquired through our businesscombinations. We amortize our intangible assets over, and monitor the appropriateness of, the estimated usefullives of these assets. We also periodically review these intangible assets for potential impairment based uponrelevant facts and circumstances. Note 6 of Notes to Consolidated Financial Statements included elsewhere in thisAnnual Report has additional information regarding our intangible assets and related amortization.
Year Ended May 31,Percent Change
(Dollars in millions) 2019 Actual Constant 2018Developed technology . . . . . . . . . . . . . . . . . . . . . . . . . . . . . . . . . . . . . . . . . . . . . . . . . . . . . . . . . $ 857 13% 14% $ 758Cloud services and license support agreements and related relationships . . . . . 712 -3% -3% 731Other . . . . . . . . . . . . . . . . . . . . . . . . . . . . . . . . . . . . . . . . . . . . . . . . . . . . . . . . . . . . . . . . . . . . . . . . . . . 120 -9% -9% 131
Total amortization of intangible assets. . . . . . . . . . . . . . . . . . . . . . . . . . . . . . . . . . $ 1,689 4% 4% $ 1,620
Amortization of intangible assets increased in fiscal 2019 compared to fiscal 2018 primarily due to additionalamortization from intangible assets, which primarily included developed technology that we acquired inconnection with our recent acquisitions, partially offset by a reduction in expenses associated with certain of ourintangible assets that became fully amortized.
Acquisition Related and Other Expenses: Acquisition related and other expenses consist of personnel related costsand stock-based compensation for transitional and certain other employees, integration related professionalservices, and certain business combination adjustments including certain adjustments after the measurementperiod has ended and certain other operating items, net. Stock-based compensation expenses included inacquisition related and other expenses resulted from unvested restricted stock-based awards and stock optionsassumed from acquisitions whereby vesting was accelerated generally upon termination of the employeespursuant to the original terms of those restricted stock-based awards and stock options.
Year Ended May 31,Percent Change
(Dollars in millions) 2019 Actual Constant 2018
Transitional and other employee related costs . . . . . . . . . . . . . . $ 49 3% 4% $ 48Stock-based compensation . . . . . . . . . . . . . . . . . . . . . . . . . . . . . . . . . . . . � -100% -100% 1Professional fees and other, net . . . . . . . . . . . . . . . . . . . . . . . . . . . . . . 16 373% 426% 3Business combination adjustments, net . . . . . . . . . . . . . . . . . . . . . . (21) * * �
Total acquisition related and other expenses . . . . . . . . . . $ 44 -15% -13% $ 52* Not meaningful

52
On a constant currency basis, acquisition related and other expenses decreased in fiscal 2019 compared to fiscal2018 primarily due to certain favorable business combination related adjustments that were recorded in fiscal2019.
Restructuring Expenses: Restructuring expenses resulted from the execution of management approvedrestructuring plans that were generally developed to improve our cost structure and/or operations, often inconjunction with our acquisition integration strategies. Restructuring expenses consist of employee severancecosts and may also include charges for duplicate facilities and other contract termination costs to improve our coststructure prospectively. For additional information regarding our restructuring plans, see Note 8 of Notes toConsolidated Financial Statements included elsewhere in this Annual Report.
Year Ended May 31,Percent Change
(Dollars in millions) 2019 Actual Constant 2018
Restructuring expenses. . . . . . . . . . . . . . . . . . . . . . . . . . . . . . . . . . . . . . . . $ 443 -25% -22% $ 588
Restructuring expenses in fiscal 2019 primarily related to our 2019 Restructuring Plan. Restructuring expenses infiscal 2018 primarily related to our 2017 Restructuring Plan, which is substantially complete. Our managementapproved, committed to and initiated these plans in order to restructure and further improve efficiencies in ouroperations. In the fourth quarter of fiscal 2019, our management supplemented the 2019 Restructuring Plan toreflect additional actions that we expect to take. The total estimated restructuring costs associated with the 2019Restructuring Plan are up to $584 million, of which approximately $108 million remained as of May 31, 2019, andwill be recorded to the restructuring expense line item within our consolidated statements of operations as thecosts are incurred through an expected end date during fiscal 2020. Our estimated costs are subject to change infuture periods. We may incur additional restructuring expenses in future periods due to the initiation of newrestructuring plans or from changes in estimated costs associated with existing restructuring plans.
Interest Expense:
Year Ended May 31,Percent Change
(Dollars in millions) 2019 Actual Constant 2018
Interest expense . . . . . . . . . . . . . . . . . . . . . . . . . . . . . . . . . . . . . . . . . . . . . . . $ 2,082 3% 3% $ 2,025
Interest expense increased in fiscal 2019 compared to fiscal 2018 primarily due to higher average borrowingsresulting from our issuance of $10.0 billion of senior notes in November 2017, which was partially offset by areduction in interest expense resulting primarily from the maturities and repayments of $2.0 billion of senior notesduring fiscal 2019 and $6.0 billion of senior notes during fiscal 2018.
Non-Operating Income, net: Non-operating income, net consists primarily of interest income, net foreign currencyexchange losses, the noncontrolling interests in the net profits of our majority-owned subsidiaries (primarily OracleFinancial Services Software Limited and Oracle Corporation Japan) and net other income, including net recognizedgains and losses related to all of our investments, net unrealized gains and losses related to the small portion ofour investment portfolio related to our deferred compensation plan, net unrealized gains and losses related tocertain equity securities and non-service net periodic pension income (losses).
Year Ended May 31,Percent Change
(Dollars in millions) 2019 Actual Constant 2018
Interest income . . . . . . . . . . . . . . . . . . . . . . . . . . . . . . . . . . . . . . . . . . . . . . . . $ 1,092 -9% -9% $ 1,203Foreign currency losses, net . . . . . . . . . . . . . . . . . . . . . . . . . . . . . . . . . . (111) 50% 62% (74)Noncontrolling interests in income. . . . . . . . . . . . . . . . . . . . . . . . . . . (152) 12% 12% (135)Other income, net . . . . . . . . . . . . . . . . . . . . . . . . . . . . . . . . . . . . . . . . . . . . . (14) -107% -42% 191
Total non-operating income, net . . . . . . . . . . . . . . . . . . . . . . . $ 815 -31% -31% $ 1,185

53
On a constant currency basis, our non-operating income, net decreased in fiscal 2019 compared to fiscal 2018primarily due to decreases in other income, net in fiscal 2019, which was primarily attributable to realized gains onthe sale of certain marketable securities during fiscal 2018, and lower interest income in fiscal 2019 primarily dueto lower average cash, cash equivalent and marketable securities balances during fiscal 2019.
Provision for Income Taxes: Our effective income tax rates for each of the periods presented were the result of themix of income earned in various tax jurisdictions that apply a broad range of income tax rates. In fiscal 2018, theTax Act was signed into law. The more significant provisions of the Tax Act as applicable to us are described aboveunder �Impacts of the U.S. Tax Cuts and Jobs Act of 2017�. Refer to Note 14 of Notes to Consolidated FinancialStatements included elsewhere in this Annual Report for a discussion regarding the differences between theeffective income tax rates as presented for the periods below and the U.S. federal statutory income tax rates thatwere in effect during these periods. Future effective income tax rates could be adversely affected by anunfavorable shift of earnings weighted to jurisdictions with higher tax rates, by unfavorable changes in tax lawsand regulations, by adverse rulings in tax related litigation, or by shortfalls in stock-based compensation realized byemployees relative to stock-based compensation that was recorded for book purposes, among others.
Year Ended May 31,Percent Change
(Dollars in millions) 2019 Actual Constant 2018
Provision for income taxes . . . . . . . . . . . . . . . . . . . . . . . . . . . . . . . . . . . . $ 1,185 -87% -86% $ 8,837Effective tax rate . . . . . . . . . . . . . . . . . . . . . . . . . . . . . . . . . . . . . . . . . 9.7% 71.1%
Provision for income taxes decreased in fiscal 2019 relative to fiscal 2018 primarily due to the absence of the initialaccounting charges related to the Tax Act that were recorded in fiscal 2018. To a lesser extent, provision forincome taxes also decreased in fiscal 2019 due to the net favorable impacts of our final accounting for the Tax Actin fiscal 2019; the net favorable impacts of the Tax Act on our tax profile during fiscal 2019; the favorable impact ofa tax benefit arising from an increase in a deferred tax asset associated with a partial realignment of our legalstructure in fiscal 2019; and lower income before provision for income taxes in fiscal 2019. These decreases to ourprovision for income taxes in fiscal 2019 relative to fiscal 2018 were partially offset both by lower excess taxbenefits related to stock-based compensation expense in fiscal 2019, and by less favorable changes in netunrecognized tax benefits due to settlements with tax authorities and other events in fiscal 2019 relative to fiscal2018.
Liquidity and Capital Resources
As of May 31,(Dollars in millions) 2019 Change 2018
Working capital . . . . . . . . . . . . . . . . . . . . . . . . . . . . . . . . . . . . . . . . . . . . . . . . . . . . . . . . . . . . . . . . . $ 27,756 -51% $ 57,035Cash, cash equivalents and marketable securities . . . . . . . . . . . . . . . . . . . . . . . . . . . $ 37,827 -44% $ 67,261
Working capital: The decrease in working capital as of May 31, 2019 in comparison to May 31, 2018 was primarilydue to $36.1 billion of cash used for repurchases of our common stock, the reclassification of $4.5 billion of long-term senior notes as a current liability and cash used to pay dividends to our stockholders during fiscal 2019. Theseunfavorable impacts were partially offset by the favorable effects to our net current assets resulting from our netincome during fiscal 2019 and, to a lesser extent, proceeds from stock option exercises.
Our working capital may be impacted by some or all of the aforementioned factors in future periods, the amountsand timing of which are variable.
Cash, cash equivalents and marketable securities: Cash and cash equivalents primarily consist of deposits held atmajor banks, Tier-1 commercial paper and other securities with original maturities of 90 days or less. Marketablesecurities consist of Tier-1 commercial paper debt securities, corporate debt securities and certain other securities.The decrease in cash, cash equivalents and marketable securities at May 31, 2019 in comparison to May 31, 2018was primarily due to $36.1 billion used for repurchases of our common stock, the repayment of $4.5 billion ofborrowings, payments of cash dividends to our stockholders and cash used for capital expenditures. These cash

54
outflows were partially offset by certain fiscal 2019 cash inflows, primarily cash inflows generated by ouroperations and cash inflows from stock option exercises during fiscal 2019.
The amount of cash, cash equivalents and marketable securities that we report in U.S. Dollars for a significantportion of the cash, cash equivalents and marketable securities balances held by our foreign subsidiaries is subjectto translation adjustments caused by changes in foreign currency exchange rates as of the end of each respectivereporting period (the offset to which is substantially recorded to accumulated other comprehensive loss (AOCL) inour consolidated balance sheets and is also presented as a line item in our consolidated statements ofcomprehensive income included elsewhere in this Annual Report). As the U.S. Dollar generally strengthenedagainst certain major international currencies during fiscal 2019, the amount of cash, cash equivalents andmarketable securities that we reported in U.S. Dollars for these subsidiaries decreased on a net basis as of May 31,2019 relative to what we would have reported using constant currency rates from the May 31, 2018 balance sheetdate.
Year Ended May 31,(Dollars in millions) 2019 Change 2018
Net cash provided by operating activities . . . . . . . . . . . . . . . . . . . . . . . . . . . . . . . . . . . . . $ 14,551 -5% $ 15,386Net cash provided by (used for) investing activities . . . . . . . . . . . . . . . . . . . . . . . . . . $ 26,557 572% $ (5,625)Net cash used for financing activities . . . . . . . . . . . . . . . . . . . . . . . . . . . . . . . . . . . . . . . . . . $ (42,056) 321% $ (9,982)
Cash flows from operating activities: Our largest source of operating cash flows is cash collections from ourcustomers following the purchase and renewal of their license support agreements. Payments from customers forthese support agreements are generally received near the beginning of the contracts� terms, which are generallyone year in length. Over the course of a fiscal year, we also have historically generated cash from the sales of newlicenses, cloud services, hardware offerings and services. Our primary uses of cash from operating activities are foremployee related expenditures, material and manufacturing costs related to the production of our hardwareproducts, taxes, interest payments and leased facilities.
Net cash provided by operating activities decreased during fiscal 2019 compared to fiscal 2018 primarily due tocertain unfavorable cash changes in working capital balances, primarily unfavorable changes associated withincome taxes including the first installment payment made pursuant to the transition tax provisions of the Tax Actduring fiscal 2019 (see additional discussion of future installment payments pursuant to the Tax Act�s transition taxunder �Contractual Obligations� below).
Cash flows from investing activities: The changes in cash flows from investing activities primarily relate to ouracquisitions, the timing of our purchases, maturities and sales of our investments in marketable debt securities andinvestments in capital and other assets, including certain intangible assets, to support our growth.
Net cash provided by investing activities was $26.6 billion during fiscal 2019 compared to $5.6 billion of net cashused for investing during fiscal 2018. The increase in net cash provided by investing activities during fiscal 2019was primarily due to an increase in sales and maturities of, and a decrease in purchases of, marketable securitiesand other investments.
Cash flows from financing activities: The changes in cash flows from financing activities primarily relate toborrowings and repayments related to our debt instruments as well as stock repurchases, dividend payments andnet proceeds related to employee stock programs.
Net cash used for financing activities during fiscal 2019 increased compared to fiscal 2018 primarily due toincreased stock repurchases as we used $36.1 billion of cash to repurchase common stock during fiscal 2019compared to $11.3 billion during fiscal 2018.

55
Free cash flow: To supplement our statements of cash flows presented on a GAAP basis, we use non-GAAPmeasures of cash flows on a trailing 4-quarter basis to analyze cash flows generated from our operations. Webelieve that free cash flow is also useful as one of the bases for comparing our performance with our competitors.The presentation of non-GAAP free cash flow is not meant to be considered in isolation or as an alternative to netincome as an indicator of our performance, or as an alternative to cash flows from operating activities as ameasure of liquidity. We calculate free cash flow as follows:
Year Ended May 31,(Dollars in millions) 2019 Change 2018
Net cash provided by operating activities . . . . . . . . . . . . . . . . . . . . . . . . . . . . . . . . . . . . . $ 14,551 -5% $ 15,386Capital expenditures . . . . . . . . . . . . . . . . . . . . . . . . . . . . . . . . . . . . . . . . . . . . . . . . . . . . . . . . . . . . (1,660) -4% (1,736)Free cash flow . . . . . . . . . . . . . . . . . . . . . . . . . . . . . . . . . . . . . . . . . . . . . . . . . . . . . . . . . . . . . . . . . . . $ 12,891 -6% $ 13,650Net income. . . . . . . . . . . . . . . . . . . . . . . . . . . . . . . . . . . . . . . . . . . . . . . . . . . . . . . . . . . . . . . . . . . . . . . $ 11,083 $ 3,587Free cash flow as a percent of net income .. . . . . . . . . . . . . . . . . . . . . . . . . . . . . . . . . . . 116% 381%
Long-Term Customer Financing: We offer certain of our customers the option to acquire licenses, cloud services,hardware and services offerings through separate long-term payment contracts. We generally sell these contractsthat we have financed for our customers on a non-recourse basis to financial institutions within 90 days of thecontracts� dates of execution. We generally record the transfers of amounts due from customers to financialinstitutions as sales of financing receivables because we are considered to have surrendered control of thesefinancing receivables. We financed $1.0 billion in fiscal 2019, $1.5 billion in 2018 and $912 million in fiscal 2017,respectively, or approximately 17%, 25% and 14%, respectively, of our cloud license and on-premise licenserevenues in fiscal 2019, 2018 and 2017, respectively.
Recent Financing Activities:
Cash Dividends: In fiscal 2019, we declared and paid cash dividends of $0.81 per share that totaled $2.9 billion. InJune 2019, our Board of Directors declared a quarterly cash dividend of $0.24 per share of our outstandingcommon stock payable on July 31, 2019 to stockholders of record as of the close of business on July 17, 2019.Future declarations of dividends and the establishment of future record and payment dates are subject to the finaldetermination of our Board of Directors.
Common Stock Repurchase Program: Our Board of Directors has approved a program for us to repurchase sharesof our common stock. On September 17, 2018 and February 15, 2019, we announced that our Board of Directorsapproved expansions of our stock repurchase program collectively totaling $24.0 billion. As of May 31, 2019,approximately $5.8 billion remained available for stock repurchases pursuant to our stock repurchase program.We repurchased 733.8 million shares for $36.0 billion, 238.0 million shares for $11.5 billion, and 85.6 millionshares for $3.5 billion in fiscal 2019, 2018 and 2017, respectively. Our stock repurchase authorization does nothave an expiration date and the pace of our repurchase activity will depend on factors such as our working capitalneeds, our cash requirements for acquisitions and dividend payments, our debt repayment obligations orrepurchases of our debt, our stock price, and economic and market conditions. Our stock repurchases may beeffected from time to time through open market purchases and pursuant to a Rule 10b5-1 plan. Our stockrepurchase program may be accelerated, suspended, delayed or discontinued at any time.

56
Contractual Obligations: The contractual obligations presented in the table below represent our estimates offuture payments under our fixed contractual obligations and commitments. Changes in our business needs,cancellation provisions, changing interest rates and other factors may result in actual payments differing fromthese estimates. We cannot provide certainty regarding the timing and amounts of payments. We have presentedbelow a summary of the most significant assumptions used in preparing this information within the context of ourconsolidated financial position, results of operations and cash flows. The following is a summary of our materialcontractual obligations as of May 31, 2019:
Year Ending May 31,(in millions) Total 2020 2021 2022 2023 2024 Thereafter
Principal payments on borrowings(1) . . . . . . . $ 56,615 $ 4,500 $ 2,631 $ 8,250 $ 3,750 $ 3,500 $ 33,984Interest payments on borrowings(1). . . . . . . . 25,333 1,860 1,771 1,644 1,507 1,395 17,156Operating leases(2) . . . . . . . . . . . . . . . . . . . . . . . . . 2,381 658 538 425 262 165 333Tax obligations(3). . . . . . . . . . . . . . . . . . . . . . . . . . . 6,462 416 576 576 576 1,080 3,238Purchase obligations and other(4) . . . . . . . . . . 1,045 661 57 22 23 23 259
Total contractual obligations. . . . . . . . . . . $ 91,836 $ 8,095 $ 5,573 $ 10,917 $ 6,118 $ 6,163 $ 54,970
(1) Represents the principal balances and interest payments to be paid in connection with our senior notes and other borrowings outstanding as ofMay 31, 2019 after considering:
� certain interest rate swap agreements for certain series of senior notes that have the economic effect of modifying the fixed-interestobligations associated with these senior notes so that they effectively became variable pursuant to a LIBOR-based index. Interest paymentson these senior notes have been presented in the table above after consideration of these fixed to variable interest rate swap agreementsbased upon the interest rates applicable as of May 31, 2019 and are subject to change in future periods;
� interest payments on our floating-rate senior notes that are based upon the interest rates applicable to the senior notes as of May 31, 2019and are subject to change in future periods;
� certain cross-currency swap agreements for our �1.25 billion 2.25% senior notes due 2021 that have the economic effect of converting ourfixed-rate, Euro-denominated debt, including annual interest payments and the payment of principal at maturity, to a fixed-rate, U.S. Dollar-denominated debt with a fixed annual interest rate. Principal and interest payments for these senior notes were calculated and presented inthe table above based on the terms of these cross-currency swap agreements; and
� certain cross-currency interest rate swap agreements for our �750 million 3.125% senior notes due July 2025 that have the economic effectof converting our fixed-rate, Euro-denominated debt, including annual interest payments and the payment of principal at maturity, to avariable-rate, U.S. Dollar-denominated debt. Principal and interest payments for these senior notes were calculated and presented in thetable above based on the terms of these cross-currency interest rate swap agreements as of May 31, 2019 and the interest payments aresubject to change in future periods.
Refer to Notes 7 and 10 of Notes to Consolidated Financial Statements included elsewhere in this Annual Report for additional information relatedto our notes payable and other borrowings and related derivative agreements.
(2) Primarily represents leases of facilities, land, data centers, and vehicles and includes future minimum rent payments for facilities that we havevacated pursuant to our restructuring activities. We have approximately $58 million in facility obligations, net of estimated sublease income, forcertain vacated locations in accrued restructuring on our consolidated balance sheet at May 31, 2019.
(3) Represents the future cash payments related to the transition tax payable incurred as a result of the Tax Act. Refer to Note 1 of Notes toConsolidated Financial Statements included elsewhere in this Annual Report for additional information.
(4) Primarily represents amounts associated with agreements that are enforceable and legally binding; terms include: fixed or minimum quantities tobe purchased; fixed, minimum or variable price provisions; and the approximate timing of the payment. We utilize several external manufacturersto manufacture sub-assemblies for our hardware products and to perform final assembly and testing of finished hardware products. We also obtainindividual hardware components for our products from a variety of individual suppliers based on projected demand information. Such purchasecommitments are based on our forecasted component and manufacturing requirements and typically provide for fulfillment within agreed uponlead-times and/or commercially standard lead-times for the particular part or product and have been included in the amount presented in theabove contractual obligations table. Routine arrangements for other materials and goods that are not related to our external manufacturers andcertain other suppliers and that are entered into in the ordinary course of business are not included in the amounts presented above, as they aregenerally entered into in order to secure pricing or other negotiated terms and are difficult to quantify in a meaningful way.
As of May 31, 2019, we had $7.6 billion of gross unrecognized income tax benefits, including related interest andpenalties, recorded on our consolidated balance sheet, and all such obligations have been excluded from thecontractual obligations table above due to the uncertainty as to when they might be settled. We cannot make areasonably reliable estimate of the period in which the remainder of our unrecognized income tax benefits will besettled or released with the relevant tax authorities, although we believe it is reasonably possible that certain ofthese liabilities could be settled or released during fiscal 2020. We are involved in claims and legal proceedings. All
57
such claims and obligations have been excluded from the contractual obligations table above due to theuncertainty of claims and legal proceedings and associated estimates and assumptions, all of which are inherentlyunpredictable and many aspects of which are out of our control. Notes 14 and 17 of Notes to ConsolidatedFinancial Statements included elsewhere in this Annual Report includes additional information regarding thesecontingencies.
We believe that our current cash, cash equivalents and marketable securities and cash generated from operationswill be sufficient to meet our working capital, capital expenditures and contractual obligation requirements. Inaddition, we believe that we could fund our future acquisitions, dividend payments and repurchases of commonstock or debt with our internally available cash, cash equivalents and marketable securities, cash generated fromoperations, additional borrowings or from the issuance of additional securities.
Off-Balance Sheet Arrangements: We do not have any off-balance sheet arrangements that have or arereasonably likely to have a current or future effect on our financial condition, changes in financial condition,revenues or expenses, results of operations, liquidity, capital expenditures or capital resources that are material toinvestors.
Selected Quarterly Financial Data
The following tables set forth selected unaudited quarterly information for our last eight fiscal quarters. Webelieve that all necessary adjustments, which consisted only of normal recurring adjustments, have been includedin the amounts stated below to present fairly the results of such periods when read in conjunction with theconsolidated financial statements and related notes included elsewhere in this Annual Report. The sum of thequarterly financial information may vary from annual data due to rounding. Refer to �Seasonality and Cyclicality� inItem 1 and �Business Overview� in Item 7 included elsewhere within this Annual Report for additional informationregarding the seasonality of our revenues, expenses and margins.
Fiscal 2019 Quarter Ended (Unaudited)(in millions, except per share amounts) August 31 November 30 February 28 May 31
Revenues . . . . . . . . . . . . . . . . . . . . . . . . . . . . . . . . . . . . . . . . . . . . $ 9,193 $ 9,562 $ 9,614 $ 11,136Gross profit . . . . . . . . . . . . . . . . . . . . . . . . . . . . . . . . . . . . . . . . . . $ 7,240 $ 7,561 $ 7,638 $ 9,073Operating income. . . . . . . . . . . . . . . . . . . . . . . . . . . . . . . . . . . $ 2,778 $ 3,101 $ 3,399 $ 4,257Net income . . . . . . . . . . . . . . . . . . . . . . . . . . . . . . . . . . . . . . . . . . $ 2,265 $ 2,333 $ 2,745 $ 3,740Earnings per share� basic . . . . . . . . . . . . . . . . . . . . . . . . $ 0.58 $ 0.63 $ 0.78 $ 1.10Earnings per share� diluted. . . . . . . . . . . . . . . . . . . . . . $ 0.57 $ 0.61 $ 0.76 $ 1.07
Fiscal 2018 Quarter Ended (Unaudited)(in millions, except per share amounts) August 31 November 30 February 28 May 31
Revenues . . . . . . . . . . . . . . . . . . . . . . . . . . . . . . . . . . . . . . . . . . . . $ 9,104 $ 9,589 $ 9,676 $ 11,014Gross profit . . . . . . . . . . . . . . . . . . . . . . . . . . . . . . . . . . . . . . . . . . $ 7,176 $ 7,629 $ 7,680 $ 8,840Operating income. . . . . . . . . . . . . . . . . . . . . . . . . . . . . . . . . . . $ 2,749 $ 3,039 $ 3,315 $ 4,161Net income (loss) . . . . . . . . . . . . . . . . . . . . . . . . . . . . . . . . . . . $ 2,144 $ 2,214 $ (4,047) $ 3,276Earnings (loss) per share� basic . . . . . . . . . . . . . . . . . $ 0.52 $ 0.53 $ (0.98) $ 0.81Earnings (loss) per share� diluted . . . . . . . . . . . . . . . $ 0.50 $ 0.52 $ (0.98) $ 0.79
Restricted Stock-Based Awards and Stock Options
Our stock-based compensation program is a key component of the compensation package we provide to attractand retain certain of our talented employees and align their interests with the interests of existing stockholders.
We recognize that restricted stock-based awards and stock options dilute existing stockholders and have sought tocontrol the number of stock-based awards granted while providing competitive compensation packages.Consistent with these dual goals, our cumulative potential dilution since June 1, 2016 has been a weighted-averageannualized rate of 1.7% per year. The potential dilution percentage is calculated as the average annualized newrestricted stock-based awards or stock options granted and assumed, net of restricted stock-based awards and

58
stock options forfeited by employees leaving the company, divided by the weighted-average outstanding sharesduring the calculation period. This maximum potential dilution will only result if all restricted stock-based awardsvest and stock options are exercised. Of the outstanding stock options at May 31, 2019, which generally have aten-year exercise period, approximately 23% have exercise prices higher than the market price of our commonstock on such date. In recent years, our stock repurchase program has more than offset the dilutive effect of ourstock-based compensation program. However, we may modify the levels of our stock repurchases in the futuredepending on a number of factors, including the amount of cash we have available for acquisitions, to paydividends, to repay or repurchase indebtedness or for other purposes. As of May 31, 2019, the maximum potentialdilution from all outstanding restricted stock-based awards and unexercised stock options, regardless of whengranted and regardless of whether vested or unvested and including stock options where the strike price is higherthan the market price as of such date, was 9.6%.
During fiscal 2019, the Compensation Committee of the Board of Directors reviewed and approved the annualorganization-wide stock-based award grants to selected employees; all stock-based award grants to senior officers;and any individual grant of restricted stock units of 62,500 or greater. The annual organization-wide stock-basedaward grants to selected employees are generally approved by the Compensation Committee during the tenbusiness day period following the second trading day after the announcement of our fiscal fourth quarter earningsreport. Each member of a separate executive officer committee, referred to as the Plan Committee, was allocateda fiscal 2019 equity budget that could be used throughout the fiscal year to grant equity within his or herorganization, subject to certain limitations established by the Compensation Committee.
Restricted stock-based award and stock option activity from June 1, 2016 through May 31, 2019 is summarized asfollows (shares in millions):
Restricted stock-based awards and stock options outstanding at May 31, 2016 . . . . . . . . . . . . . . . . . . . . . . . . . . . . . . . . . . . . . . . . . . . . . . 427Restricted stock-based awards and stock options granted . . . . . . . . . . . . . . . . . . . . . . . . . . . . . . . . . . . . . . . . . . . . . . . . . . . . . . . . . . . . . . . . 241Restricted stock-based awards and stock options assumed . . . . . . . . . . . . . . . . . . . . . . . . . . . . . . . . . . . . . . . . . . . . . . . . . . . . . . . . . . . . . . . 16Restricted stock-based awards vested and issued and stock options exercised . . . . . . . . . . . . . . . . . . . . . . . . . . . . . . . . . . . . . . . . . . (303)Forfeitures, cancellations and other, net . . . . . . . . . . . . . . . . . . . . . . . . . . . . . . . . . . . . . . . . . . . . . . . . . . . . . . . . . . . . . . . . . . . . . . . . . . . . . . . . . . . (60)
Restricted stock-based awards and stock options outstanding at May 31, 2019 . . . . . . . . . . . . . . . . . . . . . . . . . . . . . . . . . . . . . . . . . . . . . . 321
Weighted-average annualized restricted stock-based awards and stock options granted and assumed, net of forfeituresand cancellations . . . . . . . . . . . . . . . . . . . . . . . . . . . . . . . . . . . . . . . . . . . . . . . . . . . . . . . . . . . . . . . . . . . . . . . . . . . . . . . . . . . . . . . . . . . . . . . . . . . . . . . . . . . . . . 66
Weighted-average annualized stock repurchases . . . . . . . . . . . . . . . . . . . . . . . . . . . . . . . . . . . . . . . . . . . . . . . . . . . . . . . . . . . . . . . . . . . . . . . . . . . . . . (353)Shares outstanding at May 31, 2019 . . . . . . . . . . . . . . . . . . . . . . . . . . . . . . . . . . . . . . . . . . . . . . . . . . . . . . . . . . . . . . . . . . . . . . . . . . . . . . . . . . . . . . . . . . . . 3,359Basic weighted-average shares outstanding from June 1, 2016 through May 31, 2019. . . . . . . . . . . . . . . . . . . . . . . . . . . . . . . . . . . . . . . 3,957Restricted stock-based awards and stock options outstanding as a percent of shares outstanding at May 31, 2019. . . . . . . . 9.6%Total restricted stock-based awards and in the money stock options outstanding (based on the closing price of ourcommon stock on the last trading day of fiscal 2019) as a percent of shares outstanding at May 31, 2019 . . . . . . . . . . . . . . . 8.0%
Weighted-average annualized restricted stock-based awards and stock options granted and assumed, net of forfeituresand cancellations and before stock repurchases, as a percent of weighted-average shares outstanding fromJune 1, 2016 through May 31, 2019 . . . . . . . . . . . . . . . . . . . . . . . . . . . . . . . . . . . . . . . . . . . . . . . . . . . . . . . . . . . . . . . . . . . . . . . . . . . . . . . . . . . . . . . . . . 1.7%
Weighted-average annualized restricted stock-based awards and stock options granted and assumed, net of forfeituresand cancellations and after stock repurchases, as a percent of weighted-average shares outstanding fromJune 1, 2016 through May 31, 2019 . . . . . . . . . . . . . . . . . . . . . . . . . . . . . . . . . . . . . . . . . . . . . . . . . . . . . . . . . . . . . . . . . . . . . . . . . . . . . . . . . . . . . . . . . . -7.3%
Recent Accounting Pronouncements
For information with respect to recent accounting pronouncements, if any, and the impact of thesepronouncements on our consolidated financial statements, if any, see Note 1 of Notes to Consolidated FinancialStatements included elsewhere in this Annual Report.

59
Item 7A. Quantitative and Qualitative Disclosures About Market Risk
Cash, Cash Equivalents, Marketable Securities and Interest Income Risk
Cash, cash equivalents, and marketable securities were $37.8 billion and $67.3 billion as of May 31, 2019 and 2018,respectively. Our bank deposits and time deposits are generally held with large, diverse financial institutionsworldwide with high investment-grade credit ratings or financial institutions that meet investment-grade ratingscriteria, which we believe mitigates credit risk and certain other risks. In addition, as of May 31, 2019, substantiallyall of our marketable securities were high quality with approximately 33% having maturity dates within one yearand 67% having maturity dates within one to four years (a description of our marketable securities held is includedin Notes 3 and 4 of Notes to Consolidated Financial Statements included elsewhere in this Annual Report and�Liquidity and Capital Resources� above). We held a mix of both fixed and floating-rate debt securities. Fixed ratesecurities may have their market values adversely impacted as interest rates increase, while floating rate securitiesmay produce less income than expected if interest rates fall. Due in part to these factors, our future investmentincome may vary due to changes in interest rates or we may realize losses if we are forced to sell securities thatdecline in market value due to changes in interest rates. However, because we classify our debt securities as�available for sale,� no gains or losses are recognized due to changes in interest rates unless such securities aresold prior to maturity or declines in fair value are determined to be other-than-temporary. The fair values of ourfixed-rate debt securities are impacted by interest rate movements and if interest rates would have been higher by50 basis points as of each of May 31, 2019 and 2018 we estimate the change would have decreased the fair valuesof our marketable securities holdings by $128 million and $308 million, respectively. We generally do not use ourinvestments for trading purposes.
Changes in the overall level of interest rates affect the interest income that is generated from our cash, cashequivalents and marketable securities. For fiscal 2019 and 2018, total interest income was $1.1 billion and $1.2billion, respectively, with our cash, cash equivalents and marketable securities investments yielding an average2.08% and 1.73%, respectively, on a worldwide basis.
Interest Expense Risk
Interest Expense Risk�Interest Rate Swap Agreements and Cross-Currency Interest Rate Swap Agreements
Our total borrowings were $56.3 billion as of May 31, 2019, consisting of $55.4 billion of fixed-rate borrowings,$750 million of floating-rate borrowings (Floating-Rate Notes) and $113 million of other borrowings. As of May 31,2019, we held certain interest rate swap agreements that have the economic effect of modifying the fixed-interestobligations associated with our $2.0 billion of 2.25% fixed-rate senior notes due October 2019 (October 2019Notes) and our $1.5 billion of 2.80% fixed-rate senior notes due July 2021 (July 2021 Notes), so that the fixed-rateinterest payable on these senior notes effectively became variable based on LIBOR. We have also entered intocross-currency interest rate swap agreements to manage the foreign currency exchange rate risk associated withour �750 million of 3.125% fixed-rate senior notes due July 2025 Notes (July 2025 Notes) by effectively convertingthe fixed-rate, Euro denominated debt, including the annual interest payments and the payment of principal atmaturity, to variable-rate, U.S. Dollar denominated debt based on LIBOR. The critical terms of the swapagreements match the critical terms of the October 2019 Notes, July 2021 Notes and July 2025 Notes that theswap agreements pertain to, including the notional amounts and maturity dates. We do not use these swaparrangements for trading purposes. We are accounting for these swap agreements as fair value hedges pursuant toASC 815, Derivatives and Hedging (ASC 815). The fair values of our outstanding fixed to variable interest rate swapagreements as of May 31, 2019 and 2018 were a $17 million net loss and a $26 million net loss, respectively. Weestimate that the changes in the fair values of these swap agreements during fiscal 2019 and 2018 were primarilyattributable to an increase in forward interest rate prices. If LIBOR-based interest rates would have been higher by100 basis points as of May 31, 2019 and 2018, the change would have decreased the collective fair values of thefixed to variable swap agreements by $90 million and $315 million, respectively.

60
By issuing the Floating-Rate Notes and by entering into the aforementioned swap arrangements, we have assumedrisks associated with variable interest rates based upon LIBOR. Changes in the overall level of interest rates affectthe interest expense that we recognize in our consolidated statements of operations. An interest rate risksensitivity analysis is used to measure interest rate risk by computing estimated changes in cash flows as a result ofassumed changes in market interest rates. As of May 31, 2019 and 2018, if LIBOR-based interest rates would havebeen higher by 100 basis points, the change would have increased our interest expense annually by approximately$52 million and $86 million, respectively, as it relates to our fixed to variable interest rate swap agreements andfloating-rate borrowings. Additional details regarding our senior notes and related swap agreements are includedin Notes 7 and 10 of Notes to Consolidated Financial Statements included elsewhere in this Annual Report.
Currency Risk
Foreign Currency Transaction Risk�Foreign Currency Forward Contracts
We transact business in various foreign currencies and have established a program that primarily utilizes foreigncurrency forward contracts to offset the risks associated with the effects of certain foreign currency exposures.Under this program, our strategy is to enter into foreign currency forward contracts so that increases or decreasesin our foreign currency exposures are offset by gains or losses on the foreign currency forward contracts in orderto mitigate the risks and volatility associated with our foreign currency transactions. We may suspend this programfrom time to time. Our foreign currency exposures typically arise from intercompany sublicense fees,intercompany loans and other intercompany transactions. Our foreign currency forward contracts are generallyshort-term in duration.
We neither use these foreign currency forward contracts for trading purposes nor do we designate these forwardcontracts as hedging instruments pursuant to ASC 815. Accordingly, we record the fair values of these contracts asof the end of our reporting period to our consolidated balance sheet with changes in fair values recorded to ourconsolidated statement of operations. Given the short duration of the forward contracts, amounts recordedgenerally are not significant. The balance sheet classification for the fair values of these forward contracts isprepaid expenses and other current assets for forward contracts in an unrealized gain position and other currentliabilities for forward contracts in an unrealized loss position. The statement of operations classification forchanges in fair values of these forward contracts is non-operating income, net for both realized and unrealizedgains and losses.
We expect that we will continue to realize gains or losses with respect to our foreign currency exposures, net ofgains or losses from our foreign currency forward contracts. Our ultimate realized gain or loss with respect toforeign currency exposures will generally depend on the size and type of cross-currency transactions that we enterinto, the currency exchange rates associated with these exposures and changes in those rates, the net realized gainor loss on our foreign currency forward contracts and other factors. The notional amounts of the forward contractswe held to purchase U.S. Dollars in exchange for other major international currencies were $3.8 billion and $3.4billion as of May 31, 2019 and 2018, respectively, and the notional amounts of forward contracts we held to sellU.S. Dollars in exchange for other major international currencies were $3.3 billion and $1.4 billion as of May 31,2019 and 2018, respectively. The fair values of our outstanding foreign currency forward contracts were nominalat May 31, 2019 and 2018. Net foreign exchange transaction losses included in non-operating income, net in theaccompanying consolidated statements of operations were $111 million, $74 million and $152 million in fiscal2019, 2018 and 2017, respectively. As a large portion of our consolidated operations are international, we couldexperience additional foreign currency volatility in the future, the amounts and timing of which are unknown.
Foreign Currency Translation Risk�Impact on Cash, Cash Equivalents and Marketable Securities
Fluctuations in foreign currencies impact the amount of total assets and liabilities that we report for our foreignsubsidiaries upon the translation of these amounts into U.S. Dollars. In particular, the amount of cash, cashequivalents and marketable securities that we report in U.S. Dollars for a significant portion of the cash held bythese subsidiaries is subject to translation variance caused by changes in foreign currency exchange rates as of theend of each respective reporting period (the offset to which is substantially recorded to accumulated other
61
comprehensive loss on our consolidated balance sheets and is also presented as a line item in our consolidatedstatements of comprehensive income included elsewhere in this Annual Report).
As the U.S. Dollar fluctuated against certain international currencies as of the end of fiscal 2019, the amount ofcash, cash equivalents and marketable securities that we reported in U.S. Dollars for foreign subsidiaries that holdinternational currencies as of May 31, 2019 decreased relative to what we would have reported using a constantcurrency rate from May 31, 2018. As reported in our consolidated statements of cash flows, the estimated effectsof exchange rate changes on our reported cash and cash equivalents balances in U.S. Dollars was a decrease of$158 million for fiscal 2019, an increase of $57 million for fiscal 2018 and a decrease of $86 million in fiscal 2017. Ifoverall foreign currency exchange rates in comparison to the U.S. Dollar uniformly would have been weaker by10% as of May 31, 2019 and May 31, 2018 the amount of cash, cash equivalents and marketable securities wewould report in U.S. Dollars would have decreased by approximately $434 million and $555 million, respectively,assuming constant foreign currency cash, cash equivalents and marketable securities balances.
Item 8. Financial Statements and Supplementary Data
The response to this item is submitted as a separate section of this Annual Report. See Part IV, Item 15.
Item 9. Changes In and Disagreements with Accountants on Accounting and Financial Disclosure
None.
Item 9A. Controls and Procedures
Evaluation of Disclosure Controls and Procedures
As of the end of the period covered by this Annual Report on Form 10-K, we carried out an evaluation under thesupervision and with the participation of our Disclosure Committee and our management, including our PrincipalExecutive Officers (one of whom is our Principal Financial Officer), of the effectiveness of the design and operationof our disclosure controls and procedures pursuant to Exchange Act Rules 13a-15(e) and 15d-15(e).
Based on our management�s evaluation (with the participation of our Principal Executive Officers, one of whom isour Principal Financial Officer), as of the end of the period covered by this report, our Principal Executive Officershave concluded that our disclosure controls and procedures were effective as of May 31, 2019 to providereasonable assurance that information required to be disclosed by us in reports that we file or submit under theExchange Act is (i) recorded, processed, summarized and reported within the time periods specified in the SECrules and forms and (ii) accumulated and communicated to our management, including our Principal ExecutiveOfficers (one of whom is our Principal Financial Officer) as appropriate to allow timely decisions regarding requireddisclosure.
Management�s Report on Internal Control over Financial Reporting
Our management is responsible for establishing and maintaining adequate internal control over financialreporting, as such term is defined in Exchange Act Rules 13a-15(f) and 15d-15(f). Under the supervision and withthe participation of our management, including our Principal Executive Officers (one of whom is our PrincipalFinancial Officer), we conducted an evaluation of the effectiveness of our internal control over financial reportingas of May 31, 2019 based on the guidelines established in Internal Control�Integrated Framework issued by theCommittee of Sponsoring Organizations of the Treadway Commission�s 2013 framework. Our internal control overfinancial reporting includes policies and procedures that provide reasonable assurance regarding the reliability offinancial reporting and the preparation of financial statements for external reporting purposes in accordance withU.S. GAAP.
Based on the results of our evaluation, our management concluded that our internal control over financialreporting was effective as of May 31, 2019. We reviewed the results of management�s assessment with ourFinance and Audit Committee.

62
The effectiveness of our internal control over financial reporting as of May 31, 2019 has been audited by Ernst &Young LLP, an independent registered public accounting firm, as stated in their report which is included in Part IV,Item 15 of this Annual Report.
Changes in Internal Control over Financial Reporting
There were no changes in our internal control over financial reporting identified in connection with the evaluationrequired by paragraph (d) of Exchange Act Rules 13a-15 or 15d-15 that occurred during our last fiscal quarter thathave materially affected, or are reasonably likely to materially affect, our internal control over financial reporting.We implemented internal controls to ensure we adequately evaluated our contracts and properly assessed theimpact of the new accounting standard related to revenue recognition on our financial statements to facilitate itsadoption on June 1, 2018. There were no significant changes to our internal control over financial reporting due tothe adoption of the new standard.
Inherent Limitations on Effectiveness of Controls
Our management, including our Principal Executive Officers (one of whom is our Principal Financial Officer),believes that our disclosure controls and procedures and internal control over financial reporting are designed toprovide reasonable assurance of achieving their objectives and are effective at the reasonable assurance level.However, our management does not expect that our disclosure controls and procedures or our internal controlover financial reporting will prevent all errors and all fraud. A control system, no matter how well conceived andoperated, can provide only reasonable, not absolute, assurance that the objectives of the control system are met.Further, the design of a control system must reflect the fact that there are resource constraints and the benefits ofcontrols must be considered relative to their costs. Because of the inherent limitations in all control systems, noevaluation of controls can provide absolute assurance that all control issues and instances of fraud, if any, havebeen detected. These inherent limitations include the realities that judgments in decision-making can be faulty andthat breakdowns can occur because of a simple error or mistake. Additionally, controls can be circumvented by theindividual acts of some persons, by collusion of two or more people or by management override of the controls.The design of any system of controls also is based in part upon certain assumptions about the likelihood of futureevents and there can be no assurance that any design will succeed in achieving its stated goals under all potentialfuture conditions; over time, controls may become inadequate because of changes in conditions, or the degree ofcompliance with policies or procedures may deteriorate. Because of the inherent limitations in a cost-effectivecontrol system, misstatements due to error or fraud may occur and not be detected.
Item 9B. Other Information
None.

63
PART III
Item 10. Directors, Executive Officers and Corporate Governance
Pursuant to General Instruction G(3) of Form 10-K, the information required by this item relating to our executiveofficers is included under the caption �Executive Officers of the Registrant� in Part I of this Annual Report.
The other information required by this Item 10 is incorporated by reference from the information contained in ourProxy Statement to be filed with the U.S. Securities and Exchange Commission in connection with the solicitationof proxies for our 2019 Annual Meeting of Stockholders (2019 Proxy Statement) under the sections entitled �Boardof Directors�Nominees for Directors,� �Board of Directors�Committees, Membership and Meetings,� �Board ofDirectors�Committees, Membership and Meetings�The Finance and Audit Committee,� �CorporateGovernance�Employee Matters�Code of Conduct,� and �Delinquent Section 16(a) Reports.�
Item 11. Executive Compensation
The information required by this Item 11 is incorporated by reference from the information to be contained in our2019 Proxy Statement under the sections entitled �Board of Directors�Committees, Membership and Meetings�The Compensation Committee�Compensation Committee Interlocks and Insider Participation,� �Board ofDirectors�Director Compensation,� and �Executive Compensation.�
Item 12. Security Ownership of Certain Beneficial Owners and Management and Related Stockholder Matters
The information required by this Item 12 is incorporated herein by reference from the information to be containedin our 2019 Proxy Statement under the sections entitled �Security Ownership of Certain Beneficial Owners andManagement� and �Executive Compensation�Equity Compensation Plan Information.�
Item 13. Certain Relationships and Related Transactions, and Director Independence
The information required by this Item 13 is incorporated herein by reference from the information to be containedin our 2019 Proxy Statement under the sections entitled �Corporate Governance�Board of Directors and DirectorIndependence� and �Transactions with Related Persons.�
Item 14. Principal Accounting Fees and Services
The information required by this Item 14 is incorporated herein by reference from the information to be containedin our 2019 Proxy Statement under the section entitled �Ratification of Selection of Independent Registered PublicAccounting Firm.�

64
PART IV
Item 15. Exhibits and Financial Statement Schedules
(a) 1. Financial Statements
The following financial statements are filed as a part of this report:
Page
Reports of Independent Registered Public Accounting Firm . . . . . . . . . . . . . . . . . . . . . . . . . . . . . . . . . . . . . . . . . . . . . . . . . . . . . . . . . . . . . 65Consolidated Financial Statements:
Balance Sheets as of May 31, 2019 and 2018 . . . . . . . . . . . . . . . . . . . . . . . . . . . . . . . . . . . . . . . . . . . . . . . . . . . . . . . . . . . . . . . . . . . . . . . 67Statements of Operations for the years ended May 31, 2019, 2018 and 2017 . . . . . . . . . . . . . . . . . . . . . . . . . . . . . . . . 68Statements of Comprehensive Income for the years ended May 31, 2019, 2018 and 2017 . . . . . . . . . . . . . . . . 69Statements of Equity for the years ended May 31, 2019, 2018 and 2017 . . . . . . . . . . . . . . . . . . . . . . . . . . . . . . . . . . . . . . 70Statements of Cash Flows for the years ended May 31, 2019, 2018 and 2017 . . . . . . . . . . . . . . . . . . . . . . . . . . . . . . . . 71Notes to Consolidated Financial Statements . . . . . . . . . . . . . . . . . . . . . . . . . . . . . . . . . . . . . . . . . . . . . . . . . . . . . . . . . . . . . . . . . . . . . . . . 72
2. Financial Statement Schedules
The following financial statement schedule is filed as a part of this report:
Page
Schedule II. Valuation and Qualifying Accounts . . . . . . . . . . . . . . . . . . . . . . . . . . . . . . . . . . . . . . . . . . . . . . . . . . . . . . . . . . . . . . . . . . . . . . . . . . . . 118
All other schedules are omitted because they are not required or the required information is shown in the financialstatements or notes thereto.
(b) Exhibits
The information required by this Item is set forth in the Index of Exhibits that is after Item 16 of this Annual Report.

65
Report of Independent Registered Public Accounting Firm
To the Stockholders and the Board of Directors of Oracle Corporation
Opinion on the Financial Statements
We have audited the accompanying consolidated balance sheets of Oracle Corporation (the Company) as of May 31,2019 and 2018, the related consolidated statements of operations, comprehensive income, equity and cash flows foreach of the three years in the period ended May 31, 2019, and the related notes and the financial statement schedulelisted in the Index at Item 15(a)2 (collectively referred to as the �financial statements�). In our opinion, the financialstatements present fairly, in all material respects, the consolidated financial position of the Company at May 31, 2019and 2018, and the consolidated results of its operations and its cash flows for each of the three years in the period endedMay 31, 2019, in conformity with U.S. generally accepted accounting principles.
We also have audited, in accordance with the standards of the Public Company Accounting Oversight Board (UnitedStates) (PCAOB), the Company's internal control over financial reporting as of May 31, 2019, based on criteriaestablished in Internal Control-Integrated Framework issued by the Committee of Sponsoring Organizations of theTreadway Commission (2013 framework) and our report dated June 21, 2019 expressed an unqualified opinion thereon.
Adoption of ASU No. 2014-09
As discussed in Note 1 to the consolidated financial statements, the Company changed its method of accounting forrevenue from contracts with customers and for incremental costs to obtain contracts with customers in each periodpresented, due to the Company�s adoption of ASU No. 2014-09, Revenue from Contracts with Customers.
Basis for Opinion
These financial statements are the responsibility of the Company's management. Our responsibility is to express anopinion on the Company�s financial statements based on our audits. We are a public accounting firm registered with thePCAOB and are required to be independent with respect to the Company in accordance with the U.S. federal securitieslaws and the applicable rules and regulations of the Securities and Exchange Commission and the PCAOB. We conductedour audits in accordance with the standards of the PCAOB. Those standards require that we plan and perform the auditto obtain reasonable assurance about whether the financial statements are free of material misstatement, whether dueto error or fraud. Our audits included performing procedures to assess the risks of material misstatement of the financialstatements, whether due to error or fraud, and performing procedures that respond to those risks. Such proceduresincluded examining, on a test basis, evidence regarding the amounts and disclosures in the financial statements. Ouraudits also included evaluating the accounting principles used and significant estimates made by management, as well asevaluating the overall presentation of the financial statements. We believe that our audits provide a reasonable basis forour opinion.
/s/ Ernst & Young LLPWe have served as the Company�s auditor since 2002.
San Jose, California
June 21, 2019

66
Report of Independent Registered Public Accounting Firm
To the Stockholders and the Board of Directors of Oracle Corporation
Opinion on Internal Control Over Financial Reporting
We have audited Oracle Corporation�s internal control over financial reporting as of May 31, 2019, based on criteriaestablished in Internal Control� Integrated Framework issued by the Committee of Sponsoring Organizations of theTreadway Commission (2013 framework)(the COSO criteria). In our opinion, Oracle Corporation (the Company)maintained, in all material respects, effective internal control over financial reporting as of May 31, 2019, based on theCOSO criteria.
We also have audited, in accordance with the standards of the Public Company Accounting Oversight Board (UnitedStates) (PCAOB), the consolidated balance sheets of Oracle Corporation as of May 31, 2019 and 2018, the relatedconsolidated statements of operations, comprehensive income, equity, and cash flows for each of the three years in theperiod ended May 31, 2019, and the related notes and the financial statement schedule listed in the Index at Item 15(a)2and our report June 21, 2019 expressed an unqualified opinion thereon.
Basis for Opinion
The Company�s management is responsible for maintaining effective internal control over financial reporting and for itsassessment of the effectiveness of internal control over financial reporting included in the accompanying Management�sReport on Internal Control Over Financial Reporting. Our responsibility is to express an opinion on the Company�sinternal control over financial reporting based on our audit. We are a public accounting firm registered with the PCAOBand are required to be independent with respect to the Company in accordance with the U.S. federal securities laws andthe applicable rules and regulations of the Securities and Exchange Commission and the PCAOB.
We conducted our audit in accordance with the standards of the PCAOB. Those standards require that we plan andperform the audit to obtain reasonable assurance about whether effective internal control over financial reporting wasmaintained in all material respects.
Our audit included obtaining an understanding of internal control over financial reporting, assessing the risk that amaterial weakness exists, testing and evaluating the design and operating effectiveness of internal control based on theassessed risk, and performing such other procedures as we considered necessary in the circumstances. We believe thatour audit provides a reasonable basis for our opinion.
Definition and Limitations of Internal Control Over Financial Reporting
A company�s internal control over financial reporting is a process designed to provide reasonable assurance regardingthe reliability of financial reporting and the preparation of financial statements for external purposes in accordance withgenerally accepted accounting principles. A company�s internal control over financial reporting includes those policiesand procedures that (1) pertain to the maintenance of records that, in reasonable detail, accurately and fairly reflect thetransactions and dispositions of the assets of the company; (2) provide reasonable assurance that transactions arerecorded as necessary to permit preparation of financial statements in accordance with generally accepted accountingprinciples, and that receipts and expenditures of the company are being made only in accordance with authorizations ofmanagement and directors of the company; and (3) provide reasonable assurance regarding prevention or timelydetection of unauthorized acquisition, use, or disposition of the company�s assets that could have a material effect onthe financial statements.
Because of its inherent limitations, internal control over financial reporting may not prevent or detect misstatements.Also, projections of any evaluation of effectiveness to future periods are subject to the risk that controls may becomeinadequate because of changes in conditions, or that the degree of compliance with the policies or procedures maydeteriorate.
/s/ Ernst & Young LLP
San Jose, California
June 21, 2019!

ORACLE CORPORATIONCONSOLIDATED BALANCE SHEETSAs of May 31, 2019 and 2018
67
May 31,(in millions, except per share data) 2019 2018
ASSETSCurrent assets:
Cash and cash equivalents. . . . . . . . . . . . . . . . . . . . . . . . . . . . . . . . . . . . . . . . . . . . . . . . . . . . . . . . . . . . . . . . . . $ 20,514 $ 21,620Marketable securities . . . . . . . . . . . . . . . . . . . . . . . . . . . . . . . . . . . . . . . . . . . . . . . . . . . . . . . . . . . . . . . . . . . . . . . 17,313 45,641Trade receivables, net of allowances for doubtful accounts of $371 and $370 as ofMay 31, 2019 and May 31, 2018, respectively . . . . . . . . . . . . . . . . . . . . . . . . . . . . . . . . . . . . . . . . . . 5,134 5,136
Prepaid expenses and other current assets. . . . . . . . . . . . . . . . . . . . . . . . . . . . . . . . . . . . . . . . . . . . . . . . 3,425 3,762Total current assets . . . . . . . . . . . . . . . . . . . . . . . . . . . . . . . . . . . . . . . . . . . . . . . . . . . . . . . . . . . . . . . . . . . . . 46,386 76,159
Non-current assets:Property, plant and equipment, net . . . . . . . . . . . . . . . . . . . . . . . . . . . . . . . . . . . . . . . . . . . . . . . . . . . . . . . 6,252 5,897Intangible assets, net . . . . . . . . . . . . . . . . . . . . . . . . . . . . . . . . . . . . . . . . . . . . . . . . . . . . . . . . . . . . . . . . . . . . . . . 5,279 6,670Goodwill, net . . . . . . . . . . . . . . . . . . . . . . . . . . . . . . . . . . . . . . . . . . . . . . . . . . . . . . . . . . . . . . . . . . . . . . . . . . . . . . . . 43,779 43,755Deferred tax assets . . . . . . . . . . . . . . . . . . . . . . . . . . . . . . . . . . . . . . . . . . . . . . . . . . . . . . . . . . . . . . . . . . . . . . . . . 2,696 1,395Other non-current assets . . . . . . . . . . . . . . . . . . . . . . . . . . . . . . . . . . . . . . . . . . . . . . . . . . . . . . . . . . . . . . . . . . . 4,317 3,975
Total non-current assets. . . . . . . . . . . . . . . . . . . . . . . . . . . . . . . . . . . . . . . . . . . . . . . . . . . . . . . . . . . . . . . . 62,323 61,692Total assets. . . . . . . . . . . . . . . . . . . . . . . . . . . . . . . . . . . . . . . . . . . . . . . . . . . . . . . . . . . . . . . . . . . . . . . . . . $ 108,709 $ 137,851
LIABILITIES AND EQUITYCurrent liabilities:
Notes payable and other borrowings, current. . . . . . . . . . . . . . . . . . . . . . . . . . . . . . . . . . . . . . . . . . . . . $ 4,494 $ 4,491Accounts payable . . . . . . . . . . . . . . . . . . . . . . . . . . . . . . . . . . . . . . . . . . . . . . . . . . . . . . . . . . . . . . . . . . . . . . . . . . . 580 529Accrued compensation and related benefits . . . . . . . . . . . . . . . . . . . . . . . . . . . . . . . . . . . . . . . . . . . . . . 1,628 1,806Deferred revenues . . . . . . . . . . . . . . . . . . . . . . . . . . . . . . . . . . . . . . . . . . . . . . . . . . . . . . . . . . . . . . . . . . . . . . . . . . 8,374 8,341Other current liabilities . . . . . . . . . . . . . . . . . . . . . . . . . . . . . . . . . . . . . . . . . . . . . . . . . . . . . . . . . . . . . . . . . . . . . 3,554 3,957
Total current liabilities. . . . . . . . . . . . . . . . . . . . . . . . . . . . . . . . . . . . . . . . . . . . . . . . . . . . . . . . . . . . . . . . . . 18,630 19,124Non-current liabilities:
Notes payable and other borrowings, non-current . . . . . . . . . . . . . . . . . . . . . . . . . . . . . . . . . . . . . . . 51,673 56,128Income taxes payable . . . . . . . . . . . . . . . . . . . . . . . . . . . . . . . . . . . . . . . . . . . . . . . . . . . . . . . . . . . . . . . . . . . . . . . 13,295 13,429Other non-current liabilities . . . . . . . . . . . . . . . . . . . . . . . . . . . . . . . . . . . . . . . . . . . . . . . . . . . . . . . . . . . . . . . . 2,748 2,297
Total non-current liabilities. . . . . . . . . . . . . . . . . . . . . . . . . . . . . . . . . . . . . . . . . . . . . . . . . . . . . . . . . . . . . 67,716 71,854Commitments and contingenciesOracle Corporation stockholders' equity:
Preferred stock, $0.01 par value�authorized: 1.0 shares; outstanding: none . . . . . . . . . . � �Common stock, $0.01 par value and additional paid in capital�authorized: 11,000shares; outstanding: 3,359 shares and 3,997 shares as of May 31, 2019 andMay 31, 2018, respectively . . . . . . . . . . . . . . . . . . . . . . . . . . . . . . . . . . . . . . . . . . . . . . . . . . . . . . . . . . . . . . . 26,909 28,950
(Accumulated deficit) retained earnings . . . . . . . . . . . . . . . . . . . . . . . . . . . . . . . . . . . . . . . . . . . . . . . . . . . (3,496) 19,111Accumulated other comprehensive loss . . . . . . . . . . . . . . . . . . . . . . . . . . . . . . . . . . . . . . . . . . . . . . . . . . . (1,628) (1,689)
Total Oracle Corporation stockholders' equity . . . . . . . . . . . . . . . . . . . . . . . . . . . . . . . . . . . . . . . . 21,785 46,372Noncontrolling interests . . . . . . . . . . . . . . . . . . . . . . . . . . . . . . . . . . . . . . . . . . . . . . . . . . . . . . . . . . . . . . . . . . . . . . . . . . 578 501
Total equity . . . . . . . . . . . . . . . . . . . . . . . . . . . . . . . . . . . . . . . . . . . . . . . . . . . . . . . . . . . . . . . . . . . . . . . . . . . . . 22,363 46,873Total liabilities and equity . . . . . . . . . . . . . . . . . . . . . . . . . . . . . . . . . . . . . . . . . . . . . . . . . . . . . . . . . . $ 108,709 $ 137,851
See notes to consolidated financial statements.

ORACLE CORPORATIONCONSOLIDATED STATEMENTS OF OPERATIONS
For the Years Ended May 31, 2019, 2018 and 2017
68
Year Ended May 31,(in millions, except per share data) 2019 2018 2017
Revenues:Cloud services and license support . . . . . . . . . . . . . . . . . . . . . . . . . . . . . . . . . . . . . $ 26,707 $ 26,222 $ 23,758Cloud license and on-premise license . . . . . . . . . . . . . . . . . . . . . . . . . . . . . . . . . . 5,855 5,772 6,523Hardware . . . . . . . . . . . . . . . . . . . . . . . . . . . . . . . . . . . . . . . . . . . . . . . . . . . . . . . . . . . . . . . . 3,704 3,994 4,152Services . . . . . . . . . . . . . . . . . . . . . . . . . . . . . . . . . . . . . . . . . . . . . . . . . . . . . . . . . . . . . . . . . . 3,240 3,395 3,359
Total revenues. . . . . . . . . . . . . . . . . . . . . . . . . . . . . . . . . . . . . . . . . . . . . . . . . . . . . 39,506 39,383 37,792Operating expenses:
Cloud services and license support(1) . . . . . . . . . . . . . . . . . . . . . . . . . . . . . . . . . . . 3,782 3,606 3,011Hardware(1) . . . . . . . . . . . . . . . . . . . . . . . . . . . . . . . . . . . . . . . . . . . . . . . . . . . . . . . . . . . . . . 1,360 1,576 1,648Services(1) . . . . . . . . . . . . . . . . . . . . . . . . . . . . . . . . . . . . . . . . . . . . . . . . . . . . . . . . . . . . . . . . 2,853 2,878 2,793Sales and marketing(1) . . . . . . . . . . . . . . . . . . . . . . . . . . . . . . . . . . . . . . . . . . . . . . . . . . . 8,509 8,433 8,085Research and development . . . . . . . . . . . . . . . . . . . . . . . . . . . . . . . . . . . . . . . . . . . . . 6,026 6,084 6,153General and administrative . . . . . . . . . . . . . . . . . . . . . . . . . . . . . . . . . . . . . . . . . . . . . 1,265 1,282 1,172Amortization of intangible assets. . . . . . . . . . . . . . . . . . . . . . . . . . . . . . . . . . . . . . . 1,689 1,620 1,451Acquisition related and other . . . . . . . . . . . . . . . . . . . . . . . . . . . . . . . . . . . . . . . . . . . 44 52 103Restructuring . . . . . . . . . . . . . . . . . . . . . . . . . . . . . . . . . . . . . . . . . . . . . . . . . . . . . . . . . . . . 443 588 463
Total operating expenses . . . . . . . . . . . . . . . . . . . . . . . . . . . . . . . . . . . . . . . . . 25,971 26,119 24,879Operating income. . . . . . . . . . . . . . . . . . . . . . . . . . . . . . . . . . . . . . . . . . . . . . . . . . . . . . . . . . . . . . 13,535 13,264 12,913Interest expense . . . . . . . . . . . . . . . . . . . . . . . . . . . . . . . . . . . . . . . . . . . . . . . . . . . . . . . . . . . . . . . (2,082) (2,025) (1,798)Non-operating income, net . . . . . . . . . . . . . . . . . . . . . . . . . . . . . . . . . . . . . . . . . . . . . . . . . . . 815 1,185 565Income before provision for income taxes . . . . . . . . . . . . . . . . . . . . . . . . . . . . . . . . . . . 12,268 12,424 11,680Provision for income taxes . . . . . . . . . . . . . . . . . . . . . . . . . . . . . . . . . . . . . . . . . . . . . . . . . . . . 1,185 8,837 2,228Net income. . . . . . . . . . . . . . . . . . . . . . . . . . . . . . . . . . . . . . . . . . . . . . . . . . . . . . . . . . . . . . . . . . . . . $ 11,083 $ 3,587 $ 9,452Earnings per share:
Basic . . . . . . . . . . . . . . . . . . . . . . . . . . . . . . . . . . . . . . . . . . . . . . . . . . . . . . . . . . . . . . . . . . . . . . $ 3.05 $ 0.87 $ 2.30Diluted . . . . . . . . . . . . . . . . . . . . . . . . . . . . . . . . . . . . . . . . . . . . . . . . . . . . . . . . . . . . . . . . . . . $ 2.97 $ 0.85 $ 2.24
Weighted average common shares outstanding:Basic . . . . . . . . . . . . . . . . . . . . . . . . . . . . . . . . . . . . . . . . . . . . . . . . . . . . . . . . . . . . . . . . . . . . . . 3,634 4,121 4,115Diluted . . . . . . . . . . . . . . . . . . . . . . . . . . . . . . . . . . . . . . . . . . . . . . . . . . . . . . . . . . . . . . . . . . . 3,732 4,238 4,217
(1) Exclusive of amortization of intangible assets, which is shown separately.
See notes to consolidated financial statements.

ORACLE CORPORATIONCONSOLIDATED STATEMENTS OF COMPREHENSIVE INCOME
For the Years Ended May 31, 2019, 2018 and 2017
69
Year Ended May 31,(in millions) 2019 2018 2017
Net income . . . . . . . . . . . . . . . . . . . . . . . . . . . . . . . . . . . . . . . . . . . . . . . . . . . . . . . . . . . . . . . . $ 11,083 $ 3,587 $ 9,452Other comprehensive income (loss), net of tax:
Net foreign currency translation (losses) gains . . . . . . . . . . . . . . . . . . . (149) (291) 85Net unrealized (losses) gains on defined benefit plans . . . . . . . . . . (70) 34 (102)Net unrealized gains (losses) on marketable securities . . . . . . . . . . 332 (609) (9)Net unrealized (losses) gains on cash flow hedges . . . . . . . . . . . . . . . (52) 37 25
Total other comprehensive income (loss), net. . . . . . . . . . . . . . . . 61 (829) (1)Comprehensive income . . . . . . . . . . . . . . . . . . . . . . . . . . . . . . . . . . . . . . . . . . . . . . . . . . $ 11,144 $ 2,758 $ 9,451
See notes to consolidated financial statements.

ORACLE CORPORATIONCONSOLIDATED STATEMENTS OF EQUITY
For the Years Ended May 31, 2019, 2018 and 2017
70
Common Stock andAdditional Paid in
Capital
(in millions, except per share data)Number ofShares Amount
RetainedEarnings
(AccumulatedDeficit)
AccumulatedOther
ComprehensiveLoss
TotalOracle
CorporationStockholders'
EquityNoncontrolling
InterestsTotalEquity
Balances as of May 31, 2016. . . . . . . . . . . . . . . . . . . . . . . . . . . . . . . . . . . . 4,131 $ 24,217 $ 23,888 $ (816) $ 47,289 $ 501 $ 47,790Cumulative-effect of accounting change . . . . . . . . . . . . . . . . . . . . . . . . � � 820 (43) 777 4 781Common stock issued under stock-based compensation plans . . 95 2,063 � � 2,063 � 2,063Common stock issued under stock purchase plans . . . . . . . . . . . . . . 3 118 � � 118 � 118Assumption of stock-based compensation plan awards in
connection with acquisitions . . . . . . . . . . . . . . . . . . . . . . . . . . . . . . . . � 90 � � 90 � 90Stock-based compensation . . . . . . . . . . . . . . . . . . . . . . . . . . . . . . . . . . . . . � 1,350 � � 1,350 � 1,350Repurchase of common stock . . . . . . . . . . . . . . . . . . . . . . . . . . . . . . . . . . (86 ) (504) (2,988) � (3,492) � (3,492)Shares repurchased for tax withholdings upon vesting of
restricted stock-based awards . . . . . . . . . . . . . . . . . . . . . . . . . . . . . . . (6 ) (283) � � (283) � (283)Cash dividends declared ($0.64 per share) . . . . . . . . . . . . . . . . . . . . . . � � (2,631) � (2,631) � (2,631)Other, net . . . . . . . . . . . . . . . . . . . . . . . . . . . . . . . . . . . . . . . . . . . . . . . . . . . . . � 14 (6) � 8 (247) (239)Other comprehensive (loss) income, net. . . . . . . . . . . . . . . . . . . . . . . . � � � (1 ) (1 ) 14 13Net income . . . . . . . . . . . . . . . . . . . . . . . . . . . . . . . . . . . . . . . . . . . . . . . . . . . . � � 9,452 � 9,452 118 9,570Balances as of May 31, 2017. . . . . . . . . . . . . . . . . . . . . . . . . . . . . . . . . . . . 4,137 27,065 28,535 (860) 54,740 390 55,130Common stock issued under stock-based compensation plans . . 105 2,277 � � 2,277 � 2,277Common stock issued under stock purchase plans . . . . . . . . . . . . . . 3 125 � � 125 � 125Assumption of stock-based compensation plan awards in
connection with acquisitions . . . . . . . . . . . . . . . . . . . . . . . . . . . . . . . . � 3 � � 3 � 3Stock-based compensation . . . . . . . . . . . . . . . . . . . . . . . . . . . . . . . . . . . . . � 1,607 � � 1,607 � 1,607Repurchase of common stock . . . . . . . . . . . . . . . . . . . . . . . . . . . . . . . . . . (238) (1,632) (9,871) � (11,503) � (11,503)Shares repurchased for tax withholdings upon vesting of
restricted stock-based awards . . . . . . . . . . . . . . . . . . . . . . . . . . . . . . . (10 ) (506) � � (506) � (506)Cash dividends declared ($0.76 per share) . . . . . . . . . . . . . . . . . . . . . . � � (3,140) � (3,140) � (3,140)Other, net . . . . . . . . . . . . . . . . . . . . . . . . . . . . . . . . . . . . . . . . . . . . . . . . . . . . . � 11 � � 11 (24) (13)Other comprehensive loss, net . . . . . . . . . . . . . . . . . . . . . . . . . . . . . . . . . � � � (829) (829) � (829)Net income . . . . . . . . . . . . . . . . . . . . . . . . . . . . . . . . . . . . . . . . . . . . . . . . . . . . � � 3,587 � 3,587 135 3,722Balances as of May 31, 2018. . . . . . . . . . . . . . . . . . . . . . . . . . . . . . . . . . . . 3,997 28,950 19,111 (1,689) 46,372 501 46,873Cumulative-effect of accounting change . . . . . . . . . . . . . . . . . . . . . . . . � � (110) � (110) � (110)Common stock issued under stock-based compensation plans . . 103 2,033 � � 2,033 � 2,033Common stock issued under stock purchase plans . . . . . . . . . . . . . . 2 122 � � 122 � 122Assumption of stock-based compensation plan awards in
connection with acquisitions . . . . . . . . . . . . . . . . . . . . . . . . . . . . . . . . � 8 � � 8 � 8Stock-based compensation . . . . . . . . . . . . . . . . . . . . . . . . . . . . . . . . . . . . . � 1,653 � � 1,653 � 1,653Repurchase of common stock . . . . . . . . . . . . . . . . . . . . . . . . . . . . . . . . . . (734) (5,354) (30,646) � (36,000) � (36,000)Shares repurchased for tax withholdings upon vesting of
restricted stock-based awards . . . . . . . . . . . . . . . . . . . . . . . . . . . . . . . (9 ) (503) � � (503) � (503)Cash dividends declared ($0.81 per share) . . . . . . . . . . . . . . . . . . . . . . � � (2,932) � (2,932) � (2,932)Other, net . . . . . . . . . . . . . . . . . . . . . . . . . . . . . . . . . . . . . . . . . . . . . . . . . . . . . � � (2 ) � (2 ) (69 ) (71 )Other comprehensive income (loss), net. . . . . . . . . . . . . . . . . . . . . . . . � � � 61 61 (6 ) 55Net income . . . . . . . . . . . . . . . . . . . . . . . . . . . . . . . . . . . . . . . . . . . . . . . . . . . . � � 11,083 � 11,083 152 11,235Balances as of May 31, 2019. . . . . . . . . . . . . . . . . . . . . . . . . . . . . . . . . . . . 3,359 $ 26,909 $ (3,496) $ (1,628) $ 21,785 $ 578 $ 22,363
See notes to consolidated financial statements.

ORACLE CORPORATIONCONSOLIDATED STATEMENTS OF CASH FLOWS
For the Years Ended May 31, 2019, 2018 and 2017
71
Year Ended May 31,(in millions) 2019 2018 2017Cash flows from operating activities:
Net income . . . . . . . . . . . . . . . . . . . . . . . . . . . . . . . . . . . . . . . . . . . . . . . . . . . . . . . . . . . . . . . . . . . . . . . . . . . . . . . . . . . . . . . . . . . . . . . . . . . . . . . $ 11,083 $ 3,587 $ 9,452Adjustments to reconcile net income to net cash provided by operating activities:
Depreciation . . . . . . . . . . . . . . . . . . . . . . . . . . . . . . . . . . . . . . . . . . . . . . . . . . . . . . . . . . . . . . . . . . . . . . . . . . . . . . . . . . . . . . . . . . . . . . . . . 1,230 1,165 1,000Amortization of intangible assets . . . . . . . . . . . . . . . . . . . . . . . . . . . . . . . . . . . . . . . . . . . . . . . . . . . . . . . . . . . . . . . . . . . . . . . . . . . . 1,689 1,620 1,451Allowances for doubtful accounts receivable . . . . . . . . . . . . . . . . . . . . . . . . . . . . . . . . . . . . . . . . . . . . . . . . . . . . . . . . . . . . . . . . 190 146 129Deferred income taxes. . . . . . . . . . . . . . . . . . . . . . . . . . . . . . . . . . . . . . . . . . . . . . . . . . . . . . . . . . . . . . . . . . . . . . . . . . . . . . . . . . . . . . . (1,191) (847) (440)Stock-based compensation . . . . . . . . . . . . . . . . . . . . . . . . . . . . . . . . . . . . . . . . . . . . . . . . . . . . . . . . . . . . . . . . . . . . . . . . . . . . . . . . . . 1,653 1,607 1,350Other, net . . . . . . . . . . . . . . . . . . . . . . . . . . . . . . . . . . . . . . . . . . . . . . . . . . . . . . . . . . . . . . . . . . . . . . . . . . . . . . . . . . . . . . . . . . . . . . . . . . . . 157 (27) 126Changes in operating assets and liabilities, net of effects from acquisitions:
(Increase) decrease in trade receivables, net. . . . . . . . . . . . . . . . . . . . . . . . . . . . . . . . . . . . . . . . . . . . . . . . . . . . . . . . . . . (272) 267 (67)Decrease (increase) in prepaid expenses and other assets . . . . . . . . . . . . . . . . . . . . . . . . . . . . . . . . . . . . . . . . . . . . . 261 (258) (384)(Decrease) increase in accounts payable and other liabilities . . . . . . . . . . . . . . . . . . . . . . . . . . . . . . . . . . . . . . . . . . (102) (260) 230(Decrease) increase in income taxes payable. . . . . . . . . . . . . . . . . . . . . . . . . . . . . . . . . . . . . . . . . . . . . . . . . . . . . . . . . . . (453) 8,150 732Increase in deferred revenues. . . . . . . . . . . . . . . . . . . . . . . . . . . . . . . . . . . . . . . . . . . . . . . . . . . . . . . . . . . . . . . . . . . . . . . . . . 306 236 547
Net cash provided by operating activities. . . . . . . . . . . . . . . . . . . . . . . . . . . . . . . . . . . . . . . . . . . . . . . . . . . . . . . . . . 14,551 15,386 14,126Cash flows from investing activities:
Purchases of marketable securities and other investments. . . . . . . . . . . . . . . . . . . . . . . . . . . . . . . . . . . . . . . . . . . . . . . . . . . . . . (1,400) (25,282) (25,867)Proceeds from maturities of marketable securities and other investments . . . . . . . . . . . . . . . . . . . . . . . . . . . . . . . . . . . . . 12,681 20,372 15,186Proceeds from sales of marketable securities. . . . . . . . . . . . . . . . . . . . . . . . . . . . . . . . . . . . . . . . . . . . . . . . . . . . . . . . . . . . . . . . . . . . 17,299 2,745 2,429Acquisitions, net of cash acquired . . . . . . . . . . . . . . . . . . . . . . . . . . . . . . . . . . . . . . . . . . . . . . . . . . . . . . . . . . . . . . . . . . . . . . . . . . . . . . . (363) (1,724) (11,221)Capital expenditures . . . . . . . . . . . . . . . . . . . . . . . . . . . . . . . . . . . . . . . . . . . . . . . . . . . . . . . . . . . . . . . . . . . . . . . . . . . . . . . . . . . . . . . . . . . . . (1,660) (1,736) (2,021)
Net cash provided by (used for) investing activities . . . . . . . . . . . . . . . . . . . . . . . . . . . . . . . . . . . . . . . . . . . . . . . 26,557 (5,625) (21,494)Cash flows from financing activities:
Payments for repurchases of common stock . . . . . . . . . . . . . . . . . . . . . . . . . . . . . . . . . . . . . . . . . . . . . . . . . . . . . . . . . . . . . . . . . . . . (36,140) (11,347 ) (3,561)Proceeds from issuances of common stock . . . . . . . . . . . . . . . . . . . . . . . . . . . . . . . . . . . . . . . . . . . . . . . . . . . . . . . . . . . . . . . . . . . . . . 2,155 2,402 2,181Shares repurchased for tax withholdings upon vesting of restricted stock-based awards . . . . . . . . . . . . . . . . . . . . . . . (503) (506) (283)Payments of dividends to stockholders . . . . . . . . . . . . . . . . . . . . . . . . . . . . . . . . . . . . . . . . . . . . . . . . . . . . . . . . . . . . . . . . . . . . . . . . . . (2,932) (3,140) (2,631)Proceeds from borrowings, net of issuance costs . . . . . . . . . . . . . . . . . . . . . . . . . . . . . . . . . . . . . . . . . . . . . . . . . . . . . . . . . . . . . . . . � 12,443 17,732Repayments of borrowings . . . . . . . . . . . . . . . . . . . . . . . . . . . . . . . . . . . . . . . . . . . . . . . . . . . . . . . . . . . . . . . . . . . . . . . . . . . . . . . . . . . . . . (4,500) (9,800 ) (4,094)Other, net . . . . . . . . . . . . . . . . . . . . . . . . . . . . . . . . . . . . . . . . . . . . . . . . . . . . . . . . . . . . . . . . . . . . . . . . . . . . . . . . . . . . . . . . . . . . . . . . . . . . . . . . (136) (34) (258)
Net cash (used for) provided by financing activities . . . . . . . . . . . . . . . . . . . . . . . . . . . . . . . . . . . . . . . . . . . . . . . (42,056) (9,982) 9,086Effect of exchange rate changes on cash and cash equivalents . . . . . . . . . . . . . . . . . . . . . . . . . . . . . . . . . . . . . . . . . . . . . . . . . . . . . . . . . (158) 57 (86)Net (decrease) increase in cash and cash equivalents . . . . . . . . . . . . . . . . . . . . . . . . . . . . . . . . . . . . . . . . . . . . . . . . . . . . . . . . . . . . . . . . . . (1,106) (164) 1,632Cash and cash equivalents at beginning of period . . . . . . . . . . . . . . . . . . . . . . . . . . . . . . . . . . . . . . . . . . . . . . . . . . . . . . . . . . . . . . . . . . . . . . 21,620 21,784 20,152Cash and cash equivalents at end of period. . . . . . . . . . . . . . . . . . . . . . . . . . . . . . . . . . . . . . . . . . . . . . . . . . . . . . . . . . . . . . . . . . . . . . . . . . . . . $ 20,514 $ 21,620 $ 21,784Non-cash investing and financing transactions:
Fair values of restricted stock-based awards and stock options assumed in connection with acquisitions . . . . . . $ 8 $ 3 $ 90Change in unsettled repurchases of common stock. . . . . . . . . . . . . . . . . . . . . . . . . . . . . . . . . . . . . . . . . . . . . . . . . . . . . . . . . . . . . . $ (140) $ 154 $ (69 )Change in unsettled investment purchases . . . . . . . . . . . . . . . . . . . . . . . . . . . . . . . . . . . . . . . . . . . . . . . . . . . . . . . . . . . . . . . . . . . . . . $ � $ (303) $ 73
Supplemental schedule of cash flow data:Cash paid for income taxes . . . . . . . . . . . . . . . . . . . . . . . . . . . . . . . . . . . . . . . . . . . . . . . . . . . . . . . . . . . . . . . . . . . . . . . . . . . . . . . . . . . . . . $ 2,901 $ 1,562 $ 1,983Cash paid for interest . . . . . . . . . . . . . . . . . . . . . . . . . . . . . . . . . . . . . . . . . . . . . . . . . . . . . . . . . . . . . . . . . . . . . . . . . . . . . . . . . . . . . . . . . . . . $ 2,059 $ 1,910 $ 1,612
See notes to consolidated financial statements.

ORACLE CORPORATIONNOTES TO CONSOLIDATED FINANCIAL STATEMENTS
May 31, 2019
72
1. ORGANIZATION AND SIGNIFICANT ACCOUNTING POLICIES
Oracle Corporation provides products and services that substantially address all aspects of enterprise informationtechnology (IT) environments including applications and infrastructure, which are delivered to customersworldwide through a variety of flexible and interoperable IT deployment models, including cloud-based, Cloud atCustomer (an instance of Oracle Cloud in the customer�s own data center), on premise or hybrid. Oracle CloudSoftware-as-a-Service and Infrastructure-as-a-Service (SaaS and IaaS, respectively, and collectively, Oracle CloudServices) offerings provide a comprehensive and integrated stack of applications and infrastructure servicesdelivered via a cloud-based deployment model. Oracle Cloud Services integrate the software, hardware andservices on a customer�s behalf in a cloud-based IT environment that Oracle deploys, upgrades, supports andmanages for the customer. We offer our customers the option to deploy our comprehensive set of cloud offeringsincluding Oracle Cloud Services or to purchase our software and hardware products and related services tomanage their own cloud-based or on-premise IT environments. Customers that purchase our software productsmay elect to purchase license support contracts, which provide our customers with rights to unspecified licenseupgrades and maintenance releases issued during the support period as well as technical support assistance.Customers that purchase our hardware products may elect to purchase hardware support contracts, which providecustomers with software updates and can include product repairs, maintenance services, and technical supportservices. We also offer customers a broad set of services offerings that are designed to improve customerutilization of their investments in Oracle applications and infrastructure technologies.
Oracle Corporation conducts business globally and was incorporated in 2005 as a Delaware corporation and is thesuccessor to operations originally begun in June 1977.
Basis of Financial Statements
The consolidated financial statements included our accounts and the accounts of our wholly- and majority-ownedsubsidiaries. Noncontrolling interest positions of certain of our consolidated entities are reported as a separatecomponent of consolidated equity from the equity attributable to Oracle�s stockholders for all periods presented.The noncontrolling interests in our net income were not significant to our consolidated results for the periodspresented and therefore have been included as a component of non-operating income, net in our consolidatedstatements of operations. Intercompany transactions and balances have been eliminated. Certain other prior yearbalances have been reclassified to conform to the current year presentation. Such reclassifications did not affecttotal revenues, operating income or net income.
In fiscal 2019, we adopted the following Accounting Standards Updates:
• Accounting Standards Update (ASU) 2014-09, Revenue from Contracts with Customers: Topic 606 andsubsequent amendments to the initial guidance: ASU 2015-14, ASU 2016-08, ASU 2016-10, ASU 2016-12,ASU 2016-20, ASU 2017-10, ASU 2017-13 and ASU 2017-14 (collectively, Topic 606), utilizing the fullretrospective method of transition whereby the results and related disclosures for the comparative fiscal2018 and 2017 periods presented in this Form 10-K were recast to be presented as if Topic 606 had been ineffect during fiscal 2018 and 2017. Retrospective adjustments applicable prior to June 1, 2016 wererecorded as a cumulative-effect adjustment that resulted in a $43 million increase in accumulated othercomprehensive loss (AOCL) and an $820 million increase in retained earnings. Refer to the �RevenueRecognition� and �Deferred Sales Commissions� sections below for accounting policy updates upon ouradoption of Topic 606.
• ASU 2017-12, Derivatives and Hedging (Topic 815): Targeted Improvements to Accounting for HedgingActivities (ASU 2017-12), which amends and simplifies existing guidance in order to allow companies tomore accurately present the economic effects of risk management activities in the financial statements.

ORACLE CORPORATIONNOTES TO CONSOLIDATED FINANCIAL STATEMENTS�(Continued)
May 31, 2019
73
We early adopted this new standard on June 1, 2018 using the modified retrospective method, whichrequires us to account for ASU 2017-12 as of the date of adoption with any retrospective adjustmentsapplicable to prior periods included as a cumulative-effect adjustment to AOCL and retained earnings. Theadoption of ASU 2017-12 did not have a material impact on our consolidated financial statements as of theadoption date or for any of the periods presented. As a result of the adoption of ASU 2017-12, we haveelected to modify certain of our hedge documentation to exclude the fair value of certain components ofthe related hedging instrument in our assessment of hedge effectiveness. See Note 10 for additionalexplanations of the impact of adoption.
• ASU 2017-07, Compensation�Retirement Benefits (Topic 715): Improving the Presentation of Net PeriodicPension Costs and Net Periodic Postretirement Benefit Costs (ASU 2017-07), which provides guidance onthe capitalization, presentation and disclosure of net benefit costs related to postretirement benefit plans.We adopted ASU 2017-07 on a full retrospective basis, which resulted in the retrospective reclassificationof $54 million and $42 million, respectively, of non-service net periodic pension cost for fiscal 2018 and2017, respectively, from line items within operating expenses into non-operating income, net.
• ASU 2016-16, Income Taxes (Topic 740): Intra-Entity Transfers of Assets Other Than Inventory (ASU 2016-16), which requires entities to recognize the income tax consequences of an intra-entity transfer of anasset, other than inventory, when the transfer occurs. We adopted ASU 2016-16 effective June 1, 2018 ona modified retrospective basis through a cumulative-effect adjustment that resulted in a $110 milliondecrease in prepaid assets with the corresponding offset to retained earnings.
The impacts of adopting Topic 606 and ASU 2017-07 for select historical consolidated statements of operationsline items were as follows:
Year Ended May 31,2018 2017
(in millions, except per share data)As PreviouslyReported Adjustments As Adjusted
As PreviouslyReported Adjustments As Adjusted
Total revenues. . . . . . . . . . . . . . . . . . . . . . . . $ 39,831 $ (448) $ 39,383 $ 37,728 $ 64 $ 37,792Total operating expenses . . . . . . . . . . . . $ 26,152 $ (33) $ 26,119 $ 25,018 $ (139) $ 24,879Non-operating income, net . . . . . . . . . . $ 1,237 $ (52) $ 1,185 $ 605 $ (40) $ 565Provision for income taxes . . . . . . . . . . . $ 9,066 $ (229) $ 8,837 $ 2,182 $ 46 $ 2,228Net income . . . . . . . . . . . . . . . . . . . . . . . . . . . $ 3,825 $ (238) $ 3,587 $ 9,335 $ 117 $ 9,452Basic earnings per share . . . . . . . . . . . . . $ 0.93 $ (0.06) $ 0.87 $ 2.27 $ 0.03 $ 2.30Diluted earnings per share . . . . . . . . . . . $ 0.90 $ (0.05) $ 0.85 $ 2.21 $ 0.03 $ 2.24
The impact of adopting Topic 606 for select historical consolidated balance sheet line items was as follows:
As of May 31, 2018
(in millions)As PreviouslyReported Adjustments As Adjusted
Trade receivables, net of allowances for doubtful accounts. . . . . . . . . . . $ 5,279 $ (143) $ 5,136Prepaid expenses and other current assets . . . . . . . . . . . . . . . . . . . . . . . . . . . . $ 3,424 $ 338 $ 3,762Deferred tax assets. . . . . . . . . . . . . . . . . . . . . . . . . . . . . . . . . . . . . . . . . . . . . . . . . . . . . . $ 1,491 $ (96) $ 1,395Other non-current assets . . . . . . . . . . . . . . . . . . . . . . . . . . . . . . . . . . . . . . . . . . . . . . . $ 3,487 $ 488 $ 3,975Total current liabilities . . . . . . . . . . . . . . . . . . . . . . . . . . . . . . . . . . . . . . . . . . . . . . . . . . $ 19,195 $ (71) $ 19,124Total non-current liabilities . . . . . . . . . . . . . . . . . . . . . . . . . . . . . . . . . . . . . . . . . . . . . $ 71,845 $ 9 $ 71,854Total equity. . . . . . . . . . . . . . . . . . . . . . . . . . . . . . . . . . . . . . . . . . . . . . . . . . . . . . . . . . . . . . $ 46,224 $ 649 $ 46,873

ORACLE CORPORATIONNOTES TO CONSOLIDATED FINANCIAL STATEMENTS�(Continued)
May 31, 2019
74
In addition, in fiscal 2019, we also adopted the following Accounting Standards Updates, none of which had amaterial impact upon adoption or for any of the periods presented to our reported financial position, results ofoperations or cash flows:
• ASU 2018-15, Intangibles�Goodwill and Other�Internal-Use Software (Subtopic 350-40): Customer�sAccounting for Implementation Costs Incurred in a Cloud Computing Arrangement That Is a Service Contract(ASU 2018-15);
• ASU 2018-14, Compensation�Retirement Benefits�Defined Benefit Plans�General (Topic 715-20):Disclosure Framework�Changes to the Disclosure Requirements for Defined Benefit Plans (ASU 2018-14);
• ASU 2018-13, Fair Value Measurement (Topic 820): Disclosure Framework�Changes to the DisclosureRequirements for Fair Value Measurement (ASU 2018-13);
• ASU 2018-02, Income Statement�Reporting Comprehensive Income (Topic 220): Reclassification of CertainTax Effects from Accumulated Other Comprehensive Income (ASU 2018-02); and
• ASU 2016-01, Financial Instruments�Overall (Subtopic 825-10): Recognition and Measurement of FinancialAssets and Financial Liabilities (ASU 2016-01).
Impacts of the U.S. Tax Cuts and Jobs Act of 2017
The comparability of our operating results in fiscal 2019 compared to the corresponding prior year periods, and ofour consolidated balance sheets as of May 31, 2019 relative to May 31, 2018, was impacted by the U.S. Tax Cutsand Jobs Act of 2017 (the Tax Act), which was effective for us in our third quarter of fiscal 2018. The Tax Actreduced the U.S. federal corporate tax rate from 35% to 21%; created a quasi-territorial tax system that generallyallows companies to repatriate certain foreign source earnings without incurring additional U.S. income tax forsuch earnings generated after December 31, 2017; generally required companies to pay a one-time transition taxpursuant to a payment schedule that settles the tax over multiple future years on certain foreign subsidiaryearnings generated prior to December 31, 2017 that, in substantial part, were previously tax deferred; creatednew taxes on certain foreign sourced earnings; limited deductibility of certain future compensation arrangementsto certain highly compensated employees; and provided tax incentives for the exportation of U.S. products toforeign jurisdictions and for the purchase of qualifying capital equipment, among other provisions. As a result, werecorded a provisional charge to income tax expense of $6.9 billion in fiscal 2018, which, pursuant to SEC StaffAccounting Bulletin No. 118 (SAB 118), included a $7.8 billion provisional charge related to the one-time transitiontax on certain foreign subsidiary earnings and a provisional $911 million of income tax benefit related to theremeasurement of our net deferred tax assets and liabilities. During fiscal 2019, we completed our analysis of theimpacts of the Tax Act and recorded an income tax benefit of $529 million in accordance with SAB 118 related toadjustments to our estimates of the one-time transition tax on certain foreign subsidiary earnings and an incometax expense of $140 million in accordance with SAB 118 related to the remeasurement of our net deferred taxassets and liabilities.
Use of Estimates
Our consolidated financial statements are prepared in accordance with U.S. generally accepted accountingprinciples (GAAP) as set forth in the Financial Accounting Standards Board�s (FASB) Accounting StandardsCodification (ASC), and we consider the various staff accounting bulletins and other applicable guidance issued bythe SEC. These accounting principles require us to make certain estimates, judgments and assumptions. Webelieve that the estimates, judgments and assumptions upon which we rely are reasonable based uponinformation available to us at the time that these estimates, judgments and assumptions are made. Theseestimates, judgments and assumptions can affect the reported amounts of assets and liabilities as of the date of

ORACLE CORPORATIONNOTES TO CONSOLIDATED FINANCIAL STATEMENTS�(Continued)
May 31, 2019
75
the financial statements as well as the reported amounts of revenues and expenses during the periods presented.To the extent that there are differences between these estimates, judgments or assumptions and actual results,our consolidated financial statements will be affected. In many cases, the accounting treatment of a particulartransaction is specifically dictated by GAAP and does not require management�s judgment in its application. Thereare also areas in which management�s judgment in selecting among available alternatives would not produce amaterially different result.
Revenue Recognition
Our sources of revenues include:
• cloud and license revenues, which include the sale of: cloud services and license support; and cloudlicenses and on-premise licenses, which typically represent perpetual software licenses purchased bycustomers for use in both cloud and on-premise IT environments;
• hardware revenues, which include the sale of hardware products, including Oracle Engineered Systems,servers, and storage products, and industry-specific hardware; and hardware support revenues; and
• services revenues, which are earned from providing cloud-, license- and hardware-related servicesincluding consulting, advanced customer support and education services.
License support revenues are typically generated through the sale of license support contracts related to cloudlicense and on-premise licenses purchased by our customers at their option. License support contracts providecustomers with rights to unspecified software product upgrades, maintenance releases and patches releasedduring the term of the support period and include internet access to technical content, as well as internet andtelephone access to technical support personnel. License support contracts are generally priced as a percentage ofthe net cloud license and on-premise license fees. Substantially all of our customers elect to renew their licensesupport contracts annually.
Cloud services revenues include revenues from Oracle Cloud Software-as-a-Service and Infrastructure-as-a-Service(SaaS and IaaS, respectively, and collectively, Oracle Cloud Services) offerings which deliver applications andinfrastructure technologies, respectively, via cloud-based deployment models that we develop functionality for,provide unspecified updates and enhancements for, host, manage, upgrade and support and that customersaccess by entering into a subscription agreement with us for a stated period. Our IaaS offerings also include OracleManaged Cloud Services, which are designed to provide comprehensive software and hardware management,maintenance and security services for customer cloud-based, on-premise or other IT infrastructure for a fee for astated term.
Cloud license and on-premise license revenues primarily represent amounts earned from granting customersperpetual licenses to use our database, middleware, application and industry-specific software products, which ourcustomers use for cloud-based, on-premise and other IT environments. The vast majority of our cloud license andon-premise license arrangements include license support contracts, which are entered into at the customer�soption.
Revenues from the sale of hardware products represent amounts earned primarily from the sale of our OracleEngineered Systems, computer servers, storage, and industry-specific hardware. Our hardware support offeringsgenerally provide customers with software updates for the software components that are essential to thefunctionality of the hardware products purchased and can also include product repairs, maintenance services andtechnical support services. Hardware support contracts are generally priced as a percentage of the net hardwareproducts fees.

ORACLE CORPORATIONNOTES TO CONSOLIDATED FINANCIAL STATEMENTS�(Continued)
May 31, 2019
76
Our services are offered to customers as standalone arrangements or as a part of arrangements to customersbuying other products and services. Our consulting services are designed to help our customers to, among others,deploy, architect, integrate, upgrade and secure their investments in Oracle applications and infrastructuretechnologies. Our advanced customer support services are offered as standalone arrangements or as a part ofarrangements to customers buying other products and services. We offer these advanced customer supportservices to Oracle customers to enable increased performance and higher availability of Oracle products andservices. Education services include instructor-led, media-based and internet-based training in the use of ourcloud, software and hardware products.
Topic 606 is a single standard for revenue recognition that applies to all of our cloud, license, hardware andservices arrangements and generally requires revenues to be recognized upon the transfer of control of promisedgoods or services provided to our customers, reflecting the amount of consideration we expect to receive for thosegoods or services. Pursuant to Topic 606, revenues are recognized upon the application of the following steps:
• identification of the contract, or contracts, with a customer;
• identification of the performance obligations in the contract;
• determination of the transaction price;
• allocation of the transaction price to the performance obligations in the contract; and
• recognition of revenues when, or as, the contractual performance obligations are satisfied.
The timing of revenue recognition may differ from the timing of invoicing to our customers. We record an unbilledreceivable, which is included within accounts receivable on our consolidated balance sheets, when revenue isrecognized prior to invoicing. We record deferred revenues on our consolidated balance sheets when revenues arerecognized subsequent to cash collection for an invoice. Our standard payment terms are generally net 30 days butmay vary. Invoices for cloud license and on-premise licenses and hardware products are generally issued when thelicense is made available for customer use or upon delivery to the customer of the hardware product. Invoices forlicense support and hardware support contracts are generally invoiced annually in advance. Cloud SaaS and IaaScontracts are generally invoiced annually, quarterly or monthly in advance. Services are generally invoiced inadvance or as the services are performed. Most contracts that contain a financing component are contractsfinanced through our financing division. The transaction price for a contract that is financed through our financingdivision is adjusted to reflect the time value of money and interest revenue is recorded as a component of non-operating income, net within our consolidated statements of operations based on market rates in the country inwhich the transaction is being financed.
Our revenue arrangements generally include standard warranty or service level provisions that our arrangementswill perform and operate in all material respects as defined in the respective agreements, the financial impacts ofwhich have historically been and are expected to continue to be insignificant. Our arrangements generally do notinclude a general right of return relative to the delivered products or services. We recognize revenues net of anytaxes collected from customers, which are subsequently remitted to governmental authorities.
Revenue Recognition for Cloud Services
Revenues from cloud services provided on a subscription basis are generally recognized ratably over thecontractual period that the services are delivered, beginning on the date our service is made available to ourcustomers. We recognize revenue ratably because the customer receives and consumes the benefits of the cloudservices throughout the contract period. Revenues from cloud services provided on a consumption basis, such asmetered services, are generally recognized based on the utilization of the services by the customer.

ORACLE CORPORATIONNOTES TO CONSOLIDATED FINANCIAL STATEMENTS�(Continued)
May 31, 2019
77
Revenue Recognition for License Support and Hardware Support
Oracle�s primary performance obligations with respect to license support contracts and hardware supportcontracts are to provide customers with technical support as needed and unspecified software product upgrades,maintenance releases and patches during the term of the support period, if and when they are available. Oracle isobligated to make the license and hardware support services available continuously throughout the contractperiod. Therefore, revenues for license support contracts and hardware support contracts are generally recognizedratably over the contractual periods that the support services are provided.
Revenue Recognition for Cloud License and On-Premise License
Revenues from distinct cloud license and on-premise license performance obligations are generally recognizedupfront at the point in time when the software is made available to the customer to download and use. Revenuesfrom usage-based royalty arrangements for distinct cloud licenses and on-premise licenses are recognized at thepoint in time when the software end user usage occurs. For usage-based royalty arrangements with a fixedminimum guarantee amount, the minimum amount is generally recognized upfront when the software is madeavailable to the royalty customer.
Revenue Recognition for Hardware Products
The hardware product and related software, such as an operating system or firmware, are highly interdependentand interrelated and are accounted for as a combined performance obligation. The revenues for this combinedperformance obligation are generally recognized at the point in time that the hardware product is delivered to thecustomer and ownership is transferred to the customer.
Revenue Recognition for Services
Services revenues are generally recognized over time as the services are performed. Revenues for fixed priceservices are generally recognized over time applying input methods to estimate progress to completion. Revenuesfor consumption-based services are generally recognized as the services are performed.
Allocation of the Transaction Price for Contracts that have Multiple Performance Obligations
Many of our contracts include multiple performance obligations. Judgment is required in determining whethereach performance obligation is distinct. Oracle products and services generally do not require a significant amountof integration or interdependency; therefore, our products and services are generally not combined. We allocatethe transaction price for each contract to each performance obligation based on the relative standalone sellingprice (SSP) for each performance obligation within each contract.
We use judgment in determining the SSP for products and services. For substantially all performance obligationsexcept cloud licenses and on-premise licenses, we are able to establish the SSP based on the observable prices ofproducts or services sold separately in comparable circumstances to similar customers. We typically establish anSSP range for our products and services which is reassessed on a periodic basis or when facts and circumstanceschange. Our cloud licenses and on-premise licenses have not historically been sold on a standalone basis, as thevast majority of all customers elect to purchase license support contracts at the time of a cloud license and on-premise license purchase. License support contracts are generally priced as a percentage of the net fees paid bythe customer to access the license. We are unable to establish the SSP for our cloud licenses and on-premiselicenses based on observable prices given the same products are sold for a broad range of amounts (that is, theselling price is highly variable) and a representative SSP is not discernible from past transactions or otherobservable evidence. As a result, the SSP for a cloud license and an on-premise license included in a contract withmultiple performance obligations is determined by applying a residual approach whereby all other performance

ORACLE CORPORATIONNOTES TO CONSOLIDATED FINANCIAL STATEMENTS�(Continued)
May 31, 2019
78
obligations within a contract are first allocated a portion of the transaction price based upon their respective SSPs,with any residual amount of transaction price allocated to cloud license and on-premise license revenues.
Remaining Performance Obligations from Customer Contracts
Trade receivables, net of allowance for doubtful accounts, and deferred revenues are reported net of relateduncollected deferred revenues in our consolidated balance sheets as of May 31, 2019 and 2018.
The amount of revenues recognized during the year ended May 31, 2019 that were included in the openingdeferred revenues balance as of May 31, 2018 was approximately $8.3 billion. Revenues recognized fromperformance obligations satisfied in prior periods and impairment losses recognized on our receivables wereimmaterial during each year ended May 31, 2019, 2018 and 2017.
Remaining performance obligations represent contracted revenues that had not yet been recognized, and includedeferred revenues; invoices that have been issued to customers but were uncollected and have not beenrecognized as revenues; and amounts that will be invoiced and recognized as revenues in future periods. Thevolumes and amounts of customer contracts that we book and total revenues that we recognize are impacted by avariety of seasonal factors. In each fiscal year, the amounts and volumes of contracting activity and our totalrevenues are typically highest in our fourth fiscal quarter and lowest in our first fiscal quarter. These seasonalimpacts influence how our remaining performance obligations change over time. As of May 31, 2019, ourremaining performance obligations were $36.2 billion, approximately 62% of which we expect to recognize asrevenues over the next twelve months and the remainder thereafter.
Refer to Note 15 for our discussion of revenues disaggregation.
Sales of Financing Receivables
We offer certain of our customers the option to acquire our software products, hardware products and servicesofferings through separate long-term payment contracts. We generally sell these contracts that we have financedfor our customers on a non-recourse basis to financial institutions within 90 days of the contracts� dates ofexecution. We record the transfers of amounts due from customers to financial institutions as sales of financingreceivables because we are considered to have surrendered control of these financing receivables. During fiscal2019, 2018 and 2017, $1.8 billion, $1.7 billion and $1.6 billion, respectively, of our financing receivables were soldto financial institutions.
Business Combinations
We apply the provisions of ASC 805, Business Combinations (ASC 805), in accounting for our acquisitions. ASC 805requires that we evaluate whether a transaction pertains to an acquisition of assets, or to an acquisition of abusiness. A business is defined as an integrated set of assets and activities that is capable of being conducted andmanaged for the purpose of providing a return to investors. Asset acquisitions are accounted for by allocating thecost of the acquisition to the individual assets and liabilities assumed on a relative fair value basis; whereas theacquisition of a business requires us to recognize separately from goodwill the assets acquired and the liabilitiesassumed at the acquisition date fair values. Goodwill as of the acquisition date is measured as the excess ofconsideration transferred over the net of the acquisition date fair values of the assets acquired and the liabilitiesassumed. While we use our best estimates and assumptions to accurately value assets acquired and liabilitiesassumed at the acquisition date as well as any contingent consideration, where applicable, our estimates areinherently uncertain and subject to refinement. As a result, during the measurement period, which may be up toone year from the acquisition date, we record adjustments to the assets acquired and liabilities assumed with thecorresponding offset to goodwill. Upon the conclusion of the measurement period or final determination of thevalues of assets acquired or liabilities assumed, whichever comes first, any subsequent adjustments are recorded

ORACLE CORPORATIONNOTES TO CONSOLIDATED FINANCIAL STATEMENTS�(Continued)
May 31, 2019
79
to our consolidated statements of operations. Costs to exit or restructure certain activities of an acquired companyor our internal operations are accounted for as termination and exit costs pursuant to ASC 420, Exit or DisposalCost Obligations, and are accounted for separately from the business combination. A liability for costs associatedwith an exit or disposal activity is recognized and measured at its fair value in our consolidated statement ofoperations in the period in which the liability is incurred. When estimating the fair value of facility restructuringactivities, assumptions are applied regarding estimated sub-lease payments to be received, which can differ fromactual results. This may require us to revise our initial estimates which may affect our results of operations andfinancial position in the period the revision is made.
For a given acquisition, we may identify certain pre-acquisition contingencies as of the acquisition date and mayextend our review and evaluation of these pre-acquisition contingencies throughout the measurement period inorder to obtain sufficient information to assess whether we include these contingencies as a part of the fair valueestimates of assets acquired and liabilities assumed and, if so, to determine their estimated amounts. If we cannotreasonably determine the fair value of a non-income tax related pre-acquisition contingency by the end of themeasurement period, which is generally the case given the nature of such matters, we will recognize an asset or aliability for such pre-acquisition contingency if: (1) it is probable that an asset existed or a liability had beenincurred at the acquisition date and (2) the amount of the asset or liability can be reasonably estimated.Subsequent to the measurement period, changes in our estimates of such contingencies will affect earnings andcould have a material effect on our results of operations and financial position.
In addition, uncertain tax positions and tax related valuation allowances assumed in connection with a businesscombination are initially estimated as of the acquisition date. We reevaluate these items quarterly based uponfacts and circumstances that existed as of the acquisition date with any adjustments to our preliminary estimatesbeing recorded to goodwill if identified within the measurement period. Subsequent to the measurement periodor our final determination of the tax allowance�s or contingency�s estimated value, whichever comes first, changesto these uncertain tax positions and tax related valuation allowances will affect our provision for income taxes inour consolidated statement of operations and could have a material impact on our results of operations andfinancial position.
Marketable and Non-Marketable Securities
In accordance with ASC 320, Investments�Debt and Equity Securities, and based on our intentions regarding theseinstruments, we classify substantially all of our marketable debt securities as available-for-sale. Marketable debtsecurities classified as available-for-sale are reported at fair value, with all unrealized gains (losses) reflected net oftax in stockholders� equity on our consolidated balance sheets, and as a line item in our consolidated statements ofcomprehensive income. If we determine that an investment has an other than temporary decline in fair value, werecognize the investment loss in non-operating income, net in the accompanying consolidated statements ofoperations. We periodically evaluate our investments to determine if impairment charges are required.Substantially all of our marketable debt investments are classified as current based on the nature of theinvestments and their availability for use in current operations.
Investments in equity securities, other than equity method investments, are recorded at fair value, if fair value isreadily determinable. We hold investments in certain non-marketable equity securities with no readilydeterminable fair values in which we do not have a controlling interest or significant influence. Upon adoption ofASU 2016-01 effective June 1, 2018, we have elected to measure these equity securities at cost, less anyimpairment, adjusted for observable price changes from orderly transactions for identical or similar investments ofthe same issuer. Prior to our adoption of ASU 2016-01 these equity securities were recorded at cost, less anyimpairment. Our non-marketable equity securities are included in other non-current assets in the accompanyingconsolidated balance sheets and are subject to periodic impairment reviews.

ORACLE CORPORATIONNOTES TO CONSOLIDATED FINANCIAL STATEMENTS�(Continued)
May 31, 2019
80
Fair Values of Financial Instruments
We apply the provisions of ASC 820, Fair Value Measurement (ASC 820), to our assets and liabilities that we arerequired to measure at fair value pursuant to other accounting standards, including our investments in marketabledebt and equity securities and our derivative financial instruments.
The additional disclosures regarding our fair value measurements are included in Note 4.
Allowances for Doubtful Accounts
We record allowances for doubtful accounts based upon a specific review of all significant outstanding invoices.For those invoices not specifically reviewed, provisions are provided at differing rates, based upon the age of thereceivable, the collection history associated with the geographic region that the receivable was recorded in andcurrent economic trends. We write-off a receivable and charge it against its recorded allowance when we haveexhausted our collection efforts without success.
Concentrations of Risk
Financial instruments that are potentially subject to concentrations of credit risk consist primarily of cash and cashequivalents, marketable securities, derivatives and trade receivables. Our cash and cash equivalents are generallyheld with large, diverse financial institutions worldwide to reduce the amount of exposure to any single financialinstitution. Investment policies have been implemented that limit purchases of marketable debt securities toinvestment-grade securities. Our derivative contracts are transacted with various financial institutions with highcredit standings and any exposure to counterparty credit-related losses in these contracts is largely mitigated withcollateral security agreements that provide for collateral to be received or posted when the net fair values of thesecontracts fluctuate from contractually established thresholds. We generally do not require collateral to secureaccounts receivable. The risk with respect to trade receivables is mitigated by credit evaluations we perform onour customers, the short duration of our payment terms for the significant majority of our customer contracts andby the diversification of our customer base. No single customer accounted for 10% or more of our total revenues infiscal 2019, 2018 or 2017.
We outsource the manufacturing, assembly and delivery of certain of our hardware products to a variety ofcompanies, many of which are located outside the U.S. Further, we have simplified our supply chain processes byreducing the number of third-party manufacturing partners and the number of locations where these third-partymanufacturers build our hardware products. Any inability of these third-party manufacturing partners to deliverthe contracted services for our hardware products could adversely impact future operating results of our hardwarebusiness.
Inventories
Inventories are stated at the lower of cost or net realizable value. Cost is computed using standard cost, whichapproximates actual cost, on a first-in, first-out basis. We evaluate our ending inventories for estimated excessquantities and obsolescence. This evaluation includes analysis of sales levels by product and projections of futuredemand within specific time horizons (generally six to nine months). Inventories in excess of future demand arewritten down and charged to hardware expenses. In addition, we assess the impact of changing technology to ourinventories and we write down inventories that are considered obsolete. At the point of loss recognition, a new,lower-cost basis for that inventory is established, and subsequent changes in facts and circumstances do not resultin the restoration or increase in that newly established cost basis. Inventories are included in prepaid expenses andother current assets in our consolidated balance sheets and totaled $320 million and $398 million at May 31, 2019and 2018, respectively.

ORACLE CORPORATIONNOTES TO CONSOLIDATED FINANCIAL STATEMENTS�(Continued)
May 31, 2019
81
Other Receivables
Other receivables represent value-added tax and sales tax receivables associated with the sale of our products andservices to third parties. Other receivables are included in prepaid expenses and other current assets in ourconsolidated balance sheets and totaled $776 million and $802 million at May 31, 2019 and 2018, respectively.
Deferred Sales Commissions
We defer sales commissions earned by our sales force that are considered to be incremental and recoverable costsof obtaining a cloud, license support and hardware support contract. Initial sales commissions for the majority ofthese aforementioned contracts are generally deferred and amortized on a straight-line basis over a period ofbenefit that we estimate to be four to five years. We determine the period of benefit by taking into considerationthe historical and expected durations of our customer contracts, the expected useful lives of our technologies, andother factors. Sales commissions for renewal contracts relating to our cloud-based arrangements are generallydeferred and then amortized on a straight-line basis over the related contractual renewal period, which isgenerally one to three years. Amortization of deferred sales commissions is included as a component of sales andmarketing expenses in our consolidated statements of operations.
Property, Plant and Equipment
Property, plant and equipment are stated at the lower of cost or realizable value, net of accumulated depreciation.Depreciation is computed using the straight-line method based on estimated useful lives of the assets, which rangefrom one to 40 years. Leasehold improvements are amortized over the lesser of the estimated useful lives of theimprovements or the lease terms, as appropriate. Property, plant and equipment are periodically reviewed forimpairment whenever events or changes in circumstances indicate that the carrying amount of an asset may notbe recoverable. We did not recognize any significant property impairment charges in fiscal 2019, 2018 or 2017.
Goodwill, Intangible Assets and Impairment Assessments
Goodwill represents the excess of the purchase price in a business combination over the fair value of net tangibleand intangible assets acquired. Intangible assets that are not considered to have an indefinite useful life areamortized over their useful lives, which generally range from one to 10 years. Each period we evaluate theestimated remaining useful lives of purchased intangible assets and whether events or changes in circumstanceswarrant a revision to the remaining periods of amortization.
The carrying amounts of our goodwill and intangible assets are periodically reviewed for impairment (at leastannually for goodwill and indefinite lived intangible assets) and whenever events or changes in circumstancesindicate that the carrying value of these assets may not be recoverable. When goodwill is assessed for impairment,we have the option to perform an assessment of qualitative factors of impairment (optional assessment) prior tonecessitating a quantitative impairment test. Should the optional assessment be used for any given fiscal year,qualitative factors to consider for a reporting unit include: cost factors; financial performance; legal, regulatory,contractual, political, business, or other factors; entity specific factors; industry and market considerations;macroeconomic conditions; and other relevant events and factors affecting the reporting unit. If we determine inthe qualitative assessment that it is more likely than not that the fair value of the reporting unit is less than itscarrying value, a quantitative test is then performed. Otherwise, no further testing is required. For those reportingunits tested using a quantitative approach, we compare the fair value of each reporting unit with the carryingamount of the reporting unit, including goodwill. To determine the fair value of each reporting unit we utilizeestimates, judgments and assumptions including estimated future cash flows the reporting unit is expected togenerate on a discounted basis; the discount rate used as a part of the discounted cash flow analysis; futureeconomic and market conditions; and market comparables of peer companies, among others. If, as per the

ORACLE CORPORATIONNOTES TO CONSOLIDATED FINANCIAL STATEMENTS�(Continued)
May 31, 2019
82
quantitative test, the estimated fair value of the reporting unit is less than the carrying amount of the reportingunit, impairment is recognized for the difference, limited to the amount of goodwill recognized for the reportingunit. Our most recent goodwill impairment analysis was performed on March 1, 2019 and did not result in agoodwill impairment charge. We did not recognize impairment charges in fiscal 2018 or 2017.
Recoverability of finite lived intangible assets is measured by comparison of the carrying amount of the asset tothe future undiscounted cash flows the asset is expected to generate. Recoverability of indefinite lived intangibleassets is measured by comparison of the carrying amount of the asset to its fair value. If the asset is considered tobe impaired, the amount of any impairment is measured as the difference between the carrying value and the fairvalue of the impaired asset. We did not recognize any intangible asset impairment charges in fiscal 2019, 2018 or2017. At least annually, we assess the useful lives of our finite lived intangible assets and may adjust the periodover which these assets are amortized whenever events or changes in circumstances indicate that a shorteramortization period is more reflective of the period in which these assets contribute to our cash flows.
Derivative Financial Instruments
During fiscal 2019, 2018 and 2017, we used derivative financial instruments to manage foreign currency andinterest rate risks (see Note 10 below for additional information). We do not use derivative financial instrumentsfor trading purposes. We account for these instruments in accordance with ASC 815, Derivatives and Hedging (ASC815), which requires that every derivative instrument be recorded on the balance sheet as either an asset orliability measured at its fair value as of each reporting date. ASC 815 also requires that changes in our derivatives�fair values be recognized in earnings, unless specific hedge accounting and documentation criteria are met (i.e.,the instruments are accounted for as hedges).
The accounting for changes in the fair value of a derivative depends on the intended use of the derivative and theresulting designation. For a derivative instrument designated as a fair value hedge, loss or gain attributable to therisk being hedged is recognized in earnings in the period of change with a corresponding earnings offset recordedto the item for which the risk is being hedged.
For a derivative instrument designated as a cash flow hedge, each reporting period we record the change in fairvalue of the derivative to AOCL in our consolidated balance sheets, and the change is reclassified to earnings whenthe hedged item affects earnings.
Legal and Other Contingencies
We are currently involved in various claims and legal proceedings. Quarterly, we review the status of eachsignificant matter and assess our potential financial exposure. Descriptions of our accounting policies associatedwith contingencies assumed as a part of a business combination are provided under �Business Combinations�above. For legal and other contingencies that are not a part of a business combination or related to income taxes,we accrue a liability for an estimated loss if the potential loss from any claim or legal proceeding is consideredprobable, and the amount can be reasonably estimated. Note 17 below provides additional information regardingcertain of our legal contingencies.
Shipping and Handling Costs
Our shipping and handling costs for hardware products sales are included in hardware expenses for all periodspresented.

ORACLE CORPORATIONNOTES TO CONSOLIDATED FINANCIAL STATEMENTS�(Continued)
May 31, 2019
83
Foreign Currency
We transact business in various foreign currencies. In general, the functional currency of a foreign operation is thelocal country�s currency. Consequently, revenues and expenses of operations outside the U.S. are translated intoU.S. Dollars using weighted-average exchange rates while assets and liabilities of operations outside the U.S. aretranslated into U.S. Dollars using exchange rates at the balance sheet dates. The effects of foreign currencytranslation adjustments are included in stockholders� equity as a component of AOCL in the accompanyingconsolidated balance sheets and related periodic movements are summarized as a line item in our consolidatedstatements of comprehensive income. Net foreign exchange transaction losses included in non-operating income,net in the accompanying consolidated statements of operations were $111 million, $74 million and $152 million infiscal 2019, 2018 and 2017, respectively.
Stock-Based Compensation
We account for share-based payments to employees, including grants of service-based restricted stock awards,performance-based restricted stock awards (PSUs), service-based employee stock options, performance-basedstock options (PSOs), and purchases under employee stock purchase plans in accordance with ASC 718,Compensation�Stock Compensation, which requires that share-based payments (to the extent they arecompensatory) be recognized in our consolidated statements of operations based on their fair values. We accountfor forfeitures of stock-based awards as they occur.
For our service-based stock awards, we recognize stock-based compensation expense on a straight-line basis overthe service period of the award, which is generally four years.
For our PSUs and PSOs, we recognize stock-based compensation expense on a straight-line basis over the longer ofthe derived, explicit or implicit service period (which is the period of time expected for the performance conditionto be satisfied). During our interim and annual reporting periods, stock-based compensation expense is recordedbased on expected attainment of performance targets. Changes in our estimates of the expected attainment ofperformance targets that result in a change in the number of shares that are expected to vest, or changes in ourestimates of implicit service periods, may cause the amount of stock-based compensation expense that we recordfor each interim reporting period to vary. Any changes in estimates that impact our expectation of the number ofshares that are expected to vest are reflected in the amount of stock-based compensation expense that werecognize for each PSU or PSO tranche on a cumulative catch up basis during each interim reporting period inwhich such estimates are altered. Changes in estimates of the implicit service periods are recognized prospectively.
We record deferred tax assets for stock-based compensation awards that result in deductions on certain of ourincome tax returns based on the amount of stock-based compensation recognized in each reporting period and thefair values attributable to the vested portion of stock awards assumed in connection with a business combinationat the statutory tax rates in the jurisdictions that we are able to recognize such tax deductions. The impacts of theactual tax deductions for stock-based awards that are realized in these jurisdictions are generally recognized in thereporting period that a restricted stock-based award vests or a stock option is exercised with any shortfall/windfallrelative to the deferred tax asset established recorded as a discrete detriment/benefit to our provision for incometaxes in such period.
Advertising
All advertising costs are expensed as incurred. Advertising expenses, which were included within sales andmarketing expenses, were $169 million, $138 million and $95 million in fiscal 2019, 2018 and 2017, respectively.

ORACLE CORPORATIONNOTES TO CONSOLIDATED FINANCIAL STATEMENTS�(Continued)
May 31, 2019
84
Research and Development Costs and Software Development Costs
All research and development costs are expensed as incurred in accordance with ASC 730, Research andDevelopment. Software development costs required to be capitalized under ASC 985-20, Costs of Software to beSold, Leased or Marketed, and under ASC 350-40, Internal-Use Software, were not material to our consolidatedfinancial statements in fiscal 2019, 2018 and 2017.
Acquisition Related and Other Expenses
Acquisition related and other expenses consist of personnel related costs and stock-based compensation fortransitional and certain other employees, integration related professional services, and certain businesscombination adjustments including certain adjustments after the measurement period has ended and certainother operating items, net.
Year Ended May 31,(in millions) 2019 2018 2017
Transitional and other employee related costs . . . . . . . . . . . . . . . . . . . . . . . $ 49 $ 48 $ 41Stock-based compensation . . . . . . . . . . . . . . . . . . . . . . . . . . . . . . . . . . . . . . . . . . . . . � 1 35Professional fees and other, net . . . . . . . . . . . . . . . . . . . . . . . . . . . . . . . . . . . . . . . 16 3 33Business combination adjustments, net. . . . . . . . . . . . . . . . . . . . . . . . . . . . . . . (21) � (6)
Total acquisition related and other expenses . . . . . . . . . . . . . . . . . . . $ 44 $ 52 $ 103
Non-Operating Income, net
Non-operating income, net consists primarily of interest income, net foreign currency exchange losses, thenoncontrolling interests in the net profits of our majority-owned subsidiaries (primarily Oracle Financial ServicesSoftware Limited and Oracle Corporation Japan) and net other income, including net realized gains and lossesrelated to all of our investments, net unrealized gains and losses related to the small portion of our investmentportfolio related to our deferred compensation plan, net unrealized gains and losses related to certain equitysecurities and non-service net periodic pension income (losses).
Year Ended May 31,(in millions) 2019 2018 2017
Interest income . . . . . . . . . . . . . . . . . . . . . . . . . . . . . . . . . . . . . . . . . . . . . . . . . . . . . . . . . $ 1,092 $ 1,203 $ 804Foreign currency losses, net . . . . . . . . . . . . . . . . . . . . . . . . . . . . . . . . . . . . . . . . . . . (111) (74) (152)Noncontrolling interests in income. . . . . . . . . . . . . . . . . . . . . . . . . . . . . . . . . . . . (152) (135) (118)Other income, net . . . . . . . . . . . . . . . . . . . . . . . . . . . . . . . . . . . . . . . . . . . . . . . . . . . . . . (14) 191 31
Total non-operating income, net . . . . . . . . . . . . . . . . . . . . . . . . . . . . . . . . $ 815 $ 1,185 $ 565
Income Taxes
We account for income taxes in accordance with ASC 740, Income Taxes (ASC 740). Deferred income taxes arerecorded for the expected tax consequences of temporary differences between the tax bases of assets andliabilities for financial reporting purposes and amounts recognized for income tax purposes. We record a valuationallowance to reduce our deferred tax assets to the amount of future tax benefit that is more likely than not to berealized.
A two-step approach is applied pursuant to ASC 740 in the recognition and measurement of uncertain tax positionstaken or expected to be taken in a tax return. The first step is to determine if the weight of available evidenceindicates that it is more likely than not that the tax position will be sustained in an audit, including resolution of

ORACLE CORPORATIONNOTES TO CONSOLIDATED FINANCIAL STATEMENTS�(Continued)
May 31, 2019
85
any related appeals or litigation processes. The second step is to measure the tax benefit as the largest amountthat is more than 50% likely to be realized upon ultimate settlement. We recognize interest and penalties relatedto uncertain tax positions in our provision for income taxes line of our consolidated statements of operations.
During fiscal 2019, we completed our analysis of the accounting policy election required with regard to the TaxAct�s Global Intangible Low-Taxed Income (GILTI) provision. The FASB allows companies to adopt a policy electionto account for GILTI under one of two methods: (i) account for GILTI as a component of tax expense in the periodin which a company is subject to the rules (the period cost method), or (ii) account for GILTI in a company�smeasurement of deferred taxes (the deferred method). We elected the deferred method, under which werecorded the income tax expense impact to our consolidated financial statements during fiscal 2019.
A description of our accounting policies associated with tax related contingencies and valuation allowancesassumed as a part of a business combination is provided under �Business Combinations� above.
Recent Accounting Pronouncements
Financial Instruments: In June 2016, the FASB issued ASU 2016-13, Financial Instruments�Credit Losses (Topic326): Measurement of Credit Losses on Financial Instruments (ASU 2016-13) and also issued subsequentamendments to the initial guidance: ASU 2018-19, ASU 2019-04, and ASU 2019-05 (collectively, Topic 326). Topic326 requires measurement and recognition of expected credit losses for financial assets held. Topic 326 is effectivefor us in our first quarter of fiscal 2021, and earlier adoption is permitted beginning in the first quarter of fiscal2020. We are currently evaluating the impact of our pending adoption of Topic 326 on our consolidated financialstatements.
Leases: In February 2016, the FASB issued ASU 2016-02, Leases (Topic 842) and also issued subsequentamendments to the initial guidance: ASU 2017-13, ASU 2018-10, ASU 2018-11, ASU 2018-20 and ASU 2019-01(collectively, Topic 842). Topic 842 requires companies to generally recognize on the balance sheet operating andfinancing lease liabilities and corresponding right-of-use assets. We intend to adopt Topic ASC 842 using theeffective date of June 1, 2019 as the date of our initial application of the standard. Consequently, financialinformation for the comparative periods will not be updated. We are currently evaluating the impact of ourpending adoption of Topic 842 on our consolidated financial statements. We currently expect that most of ouroperating lease commitments will be subject to the new standard and recognized as operating lease liabilities andright-of-use assets upon our adoption of Topic 842, which will increase our total assets and total liabilities that wereport relative to such amounts prior to adoption.
2. ACQUISITIONS
Fiscal 2019 and 2018 Acquisitions
Fiscal 2018 Acquisition of Aconex Limited
On March 28, 2018, we completed our acquisition of Aconex Limited (Aconex), a provider of cloud-basedcollaboration software for construction projects. We have included the financial results of Aconex in ourconsolidated financial statements from the date of acquisition. These results were not individually material to ourconsolidated financial statements. The total purchase price for Aconex was approximately $1.2 billion, whichconsisted of approximately $1.2 billion in cash and $7 million for the fair values of stock options and restrictedstock-based awards assumed. In allocating the purchase price based on estimated fair values, we recordedapproximately $873 million of goodwill, $377 million of identifiable intangible assets, and $29 million of netliabilities. Goodwill generated from our acquisition of Aconex was primarily attributable to synergies expected toarise after the acquisition and is not expected to be tax deductible.

ORACLE CORPORATIONNOTES TO CONSOLIDATED FINANCIAL STATEMENTS�(Continued)
May 31, 2019
86
Other Fiscal 2019 and 2018 Acquisitions
During fiscal 2019 and 2018, we acquired certain other companies and purchased certain technology anddevelopment assets primarily to expand our products and services offerings. These acquisitions were notsignificant individually or in the aggregate to our consolidated financial statements.
Fiscal 2017 Acquisitions
Acquisition of NetSuite Inc., a Related Party
On November 7, 2016, we completed our acquisition of NetSuite Inc. (NetSuite), a provider of cloud-basedenterprise resource planning (ERP) software and related applications and a related party to Oracle. We acquiredNetSuite to, among other things, expand our cloud SaaS offerings with a complementary set of cloud ERP andrelated cloud software applications for customers.
Lawrence J. Ellison, Oracle�s Chairman of the Board and Chief Technology Officer and Oracle�s largest stockholder,was an affiliate of NetSuite�s largest stockholder, NetSuite Restricted Holdings LLC (a single member LLCinvestment entity whose interests are beneficially owned by a trust controlled by Mr. Ellison), which ownedapproximately 40% of the issued and outstanding NetSuite shares immediately prior to the conclusion of themerger.
The total purchase price for NetSuite was approximately $9.1 billion, which consisted of approximately $9.0 billionin cash and $78 million for the fair values of restricted stock-based awards and stock options assumed. In allocatingthe purchase price based on estimated fair values, we recorded approximately $6.7 billion of goodwill, $3.2 billionof identifiable intangible assets and $763 million of net liabilities. Goodwill generated from our acquisition ofNetSuite was primarily attributable to synergies expected to arise after the acquisition and was not tax deductible.
Other Fiscal 2017 Acquisitions
During fiscal 2017, we acquired certain companies and purchased certain technology and development assetsprimarily to expand our products and services offerings. These acquisitions were not individually or in theaggregate significant. We have included the financial results of the acquired companies in our consolidatedfinancial statements from their respective acquisition dates, and the results from each of these companies werenot individually material to our consolidated financial statements. In the aggregate, the total purchase price forthese acquisitions was approximately $3.0 billion, which consisted of $3.0 billion in cash and $13 million for the fairvalues of restricted stock-based awards and stock options assumed. Based on their estimated fair values, werecorded $243 million of net tangible assets and $948 million of identifiable intangible assets and $1.8 billion ofresidual goodwill related to these fiscal 2017 acquisitions.
Unaudited Pro Forma Financial Information
The unaudited pro forma financial information in the table below summarizes the combined results of operationsfor Oracle, Aconex and certain other companies that we acquired since the beginning of fiscal 2018 that wereconsidered relevant for the purposes of unaudited pro forma financial information disclosure as if the companieswere combined as of the beginning of fiscal 2018. The unaudited pro forma financial information for all periodspresented included the business combination accounting effects resulting from these acquisitions, includingamortization charges from acquired intangible assets (certain of which are preliminary), stock-based compensationcharges for unvested restricted stock-based awards and stock options assumed, if any, and the related tax effectsas though the aforementioned companies were combined as of the beginning of fiscal 2018. The unaudited proforma financial information as presented below is for informational purposes only and is not necessarily indicativeof the results of operations that would have been achieved if the acquisitions had taken place at the beginning offiscal 2018 or 2019.

ORACLE CORPORATIONNOTES TO CONSOLIDATED FINANCIAL STATEMENTS�(Continued)
May 31, 2019
87
The unaudited pro forma financial information for fiscal 2019 presented the historical results of Oracle for fiscal2019 and certain other companies that we acquired since the beginning of fiscal 2019 based upon their respectiveprevious reporting periods and the dates these companies were acquired by us, and the effects of the pro formaadjustments listed above.
The unaudited pro forma financial information for fiscal 2018 combined the historical results of Oracle for fiscal2018 and the historical results of Aconex for the twelve month period ended December 31, 2017 (adjusted due todifferences in reporting periods and considering the date we acquired Aconex) and certain other companies thatwe acquired since the beginning of fiscal 2018 based upon their respective previous reporting periods and thedates these companies were acquired by us, and the effects of the pro forma adjustments listed above. Theunaudited pro forma financial information was as follows:
Year Ended May 31,(in millions, except per share data) 2019 2018
Total revenues . . . . . . . . . . . . . . . . . . . . . . . . . . . . . . . . . . . . . . . . . . . . . . . . . . . . . . . . . . . . . . . . . . . . . $ 39,512 $ 39,546Net income . . . . . . . . . . . . . . . . . . . . . . . . . . . . . . . . . . . . . . . . . . . . . . . . . . . . . . . . . . . . . . . . . . . . . . . . . $ 11,076 $ 3,500Basic earnings per share . . . . . . . . . . . . . . . . . . . . . . . . . . . . . . . . . . . . . . . . . . . . . . . . . . . . . . . . . . $ 3.05 $ 0.85Diluted earnings per share . . . . . . . . . . . . . . . . . . . . . . . . . . . . . . . . . . . . . . . . . . . . . . . . . . . . . . . . $ 2.97 $ 0.83
3. CASH, CASH EQUIVALENTS AND MARKETABLE SECURITIES
Cash and cash equivalents primarily consist of deposits held at major banks, Tier-1 commercial paper debtsecurities and other securities with original maturities of 90 days or less. Marketable securities consist of Tier-1commercial paper debt securities, corporate debt securities and certain other securities.
The amortized principal amounts of our cash, cash equivalents and marketable securities approximated their fairvalues at May 31, 2019 and 2018. We use the specific identification method to determine any realized gains orlosses from the sale of our marketable securities classified as available-for-sale. Such realized gains and losses wereinsignificant for fiscal 2019, 2018 and 2017. The following table summarizes the components of our cashequivalents and marketable securities held, substantially all of which were classified as available-for-sale:
May 31,(in millions) 2019 2018
Corporate debt securities and other . . . . . . . . . . . . . . . . . . . . . . . . . . . . . . . . . . . . . . . . . . . . . $ 22,242 $ 44,302Commercial paper debt securities. . . . . . . . . . . . . . . . . . . . . . . . . . . . . . . . . . . . . . . . . . . . . . . . � 1,647Money market funds . . . . . . . . . . . . . . . . . . . . . . . . . . . . . . . . . . . . . . . . . . . . . . . . . . . . . . . . . . . . . . 5,700 6,500
Total investments . . . . . . . . . . . . . . . . . . . . . . . . . . . . . . . . . . . . . . . . . . . . . . . . . . . . . . . . . . . . . . $ 27,942 $ 52,449Investments classified as cash equivalents . . . . . . . . . . . . . . . . . . . . . . . . . . . . . . . . . . $ 10,629 $ 6,808Investments classified as marketable securities. . . . . . . . . . . . . . . . . . . . . . . . . . . . . $ 17,313 $ 45,641
As of May 31, 2019 and 2018, approximately 33% and 26%, respectively, of our marketable securities investmentsmature within one year and 67% and 74%, respectively, mature within one to four years. Our investment portfoliois subject to market risk due to changes in interest rates. As described above, we limit purchases of marketabledebt securities to investment-grade securities, which have high credit ratings and also limit the amount of creditexposure to any one issuer. As stated in our investment policy, we are averse to principal loss and seek to preserveour invested funds by limiting default risk and market risk.
Restricted cash that was included within cash and cash equivalents as presented within our consolidated balancesheets as of May 31, 2019 and 2018 and our consolidated statements of cash flows for the years ended May 31,2019, 2018 and 2017 was nominal.

ORACLE CORPORATIONNOTES TO CONSOLIDATED FINANCIAL STATEMENTS�(Continued)
May 31, 2019
88
4. FAIR VALUE MEASUREMENTS
We perform fair value measurements in accordance with ASC 820. ASC 820 defines fair value as the price thatwould be received from selling an asset or paid to transfer a liability in an orderly transaction between marketparticipants at the measurement date. When determining the fair value measurements for assets and liabilitiesrequired to be recorded at their fair values, we consider the principal or most advantageous market in which wewould transact and consider assumptions that market participants would use when pricing the assets or liabilities,such as inherent risk, transfer restrictions and risk of nonperformance.
ASC 820 establishes a fair value hierarchy that requires an entity to maximize the use of observable inputs andminimize the use of unobservable inputs when measuring fair value. An asset�s or a liability�s categorization withinthe fair value hierarchy is based upon the lowest level of input that is significant to the fair value measurement.ASC 820 establishes three levels of inputs that may be used to measure fair value:
� Level 1: quoted prices in active markets for identical assets or liabilities;
� Level 2: inputs other than Level 1 that are observable, either directly or indirectly, such as quoted pricesin active markets for similar assets or liabilities, quoted prices for identical or similar assets or liabilities inmarkets that are not active, or other inputs that are observable or can be corroborated by observablemarket data for substantially the full term of the assets or liabilities; or
� Level 3: unobservable inputs that are supported by little or no market activity and that are significant tothe fair values of the assets or liabilities.
Assets and Liabilities Measured at Fair Value on a Recurring Basis
Our assets and liabilities measured at fair value on a recurring basis, excluding accrued interest components,consisted of the following (Level 1 and Level 2 inputs are defined above):
May 31, 2019 May 31, 2018Fair Value Measurements
Using Input TypesFair Value Measurements
Using Input Types(in millions) Level 1 Level 2 Total Level 1 Level 2 Total
Assets:Corporate debt securities and other . . . $ 4,899 $ 17,343 $ 22,242 $ 223 $ 44,079 $ 44,302Commercial paper debt securities. . . . . . � � � � 1,647 1,647Money market funds . . . . . . . . . . . . . . . . . . . . 5,700 � 5,700 6,500 � 6,500Derivative financial instruments . . . . . . . . � 5 5 � 29 29
Total assets . . . . . . . . . . . . . . . . . . . . . . . . . . $ 10,599 $ 17,348 $ 27,947 $ 6,723 $ 45,755 $ 52,478Liabilities:
Derivative financial instruments . . . . . . . . $ � $ 230 $ 230 $ � $ 158 $ 158
Our marketable securities investments consist of Tier 1 commercial paper debt securities, corporate debtsecurities and certain other securities. Marketable securities as presented per our consolidated balance sheetsincluded securities with original maturities at the time of purchase greater than three months and the remainderof the securities were included in cash and cash equivalents. Our valuation techniques used to measure the fairvalues of our instruments that were classified as Level 1 in the table above were derived from quoted marketprices and active markets for these instruments that exist. Our valuation techniques used to measure the fairvalues of Level 2 instruments listed in the table above, the counterparties to which have high credit ratings, werederived from the following: non-binding market consensus prices that were corroborated by observable marketdata, quoted market prices for similar instruments, or pricing models, such as discounted cash flow techniques,
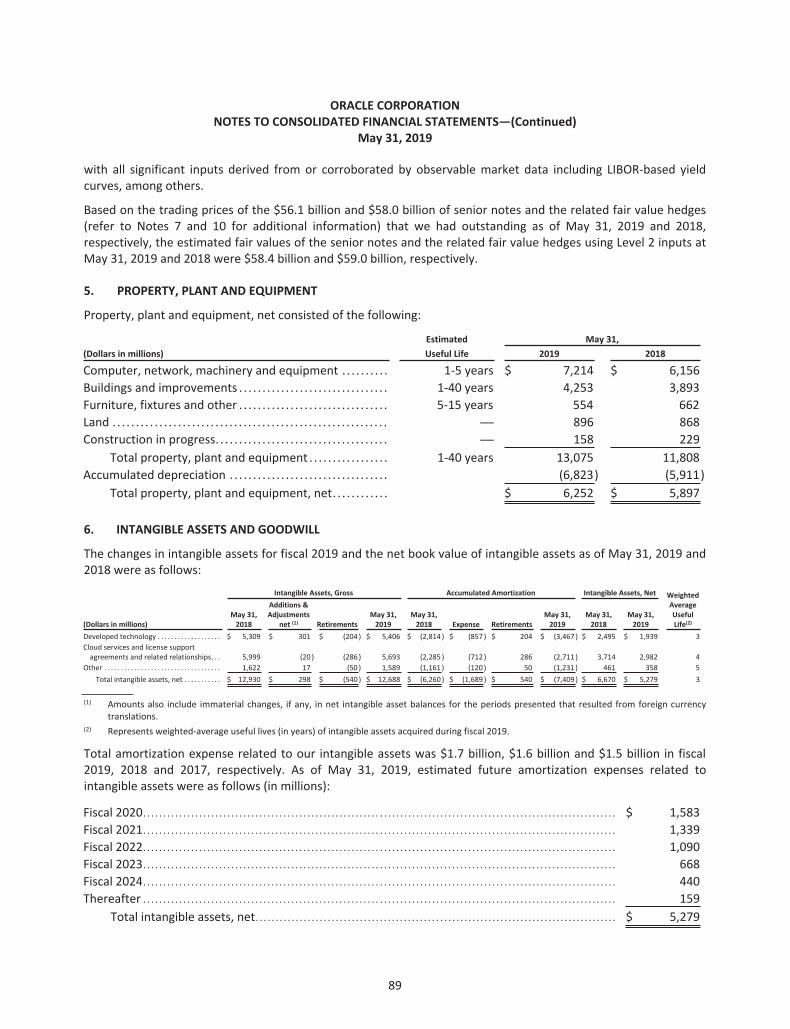
ORACLE CORPORATIONNOTES TO CONSOLIDATED FINANCIAL STATEMENTS�(Continued)
May 31, 2019
89
with all significant inputs derived from or corroborated by observable market data including LIBOR-based yieldcurves, among others.
Based on the trading prices of the $56.1 billion and $58.0 billion of senior notes and the related fair value hedges(refer to Notes 7 and 10 for additional information) that we had outstanding as of May 31, 2019 and 2018,respectively, the estimated fair values of the senior notes and the related fair value hedges using Level 2 inputs atMay 31, 2019 and 2018 were $58.4 billion and $59.0 billion, respectively.
5. PROPERTY, PLANT AND EQUIPMENT
Property, plant and equipment, net consisted of the following:
Estimated May 31,(Dollars in millions) Useful Life 2019 2018
Computer, network, machinery and equipment . . . . . . . . . . 1-5 years $ 7,214 $ 6,156Buildings and improvements . . . . . . . . . . . . . . . . . . . . . . . . . . . . . . . . 1-40 years 4,253 3,893Furniture, fixtures and other . . . . . . . . . . . . . . . . . . . . . . . . . . . . . . . . 5-15 years 554 662Land . . . . . . . . . . . . . . . . . . . . . . . . . . . . . . . . . . . . . . . . . . . . . . . . . . . . . . . . . . . � 896 868Construction in progress. . . . . . . . . . . . . . . . . . . . . . . . . . . . . . . . . . . . . � 158 229
Total property, plant and equipment . . . . . . . . . . . . . . . . . 1-40 years 13,075 11,808Accumulated depreciation . . . . . . . . . . . . . . . . . . . . . . . . . . . . . . . . . . (6,823) (5,911)
Total property, plant and equipment, net. . . . . . . . . . . . $ 6,252 $ 5,897
6. INTANGIBLE ASSETS AND GOODWILL
The changes in intangible assets for fiscal 2019 and the net book value of intangible assets as of May 31, 2019 and2018 were as follows:
Intangible Assets, Gross Accumulated Amortization Intangible Assets, Net
(Dollars in millions)May 31,2018
Additions &Adjustments
net (1) RetirementsMay 31,2019
May 31,2018 Expense Retirements
May 31,2019
May 31,2018
May 31,2019
WeightedAverageUsefulLife(2)
Developed technology . . . . . . . . . . . . . . . . . . . $ 5,309 $ 301 $ (204 ) $ 5,406 $ (2,814 ) $ (857 ) $ 204 $ (3,467 ) $ 2,495 $ 1,939 3Cloud services and license supportagreements and related relationships. . . 5,999 (20 ) (286 ) 5,693 (2,285 ) (712 ) 286 (2,711 ) 3,714 2,982 4
Other . . . . . . . . . . . . . . . . . . . . . . . . . . . . . . . . . . . 1,622 17 (50 ) 1,589 (1,161 ) (120 ) 50 (1,231 ) 461 358 5Total intangible assets, net . . . . . . . . . . . $ 12,930 $ 298 $ (540 ) $ 12,688 $ (6,260 ) $ (1,689 ) $ 540 $ (7,409 ) $ 6,670 $ 5,279 3
(1) Amounts also include immaterial changes, if any, in net intangible asset balances for the periods presented that resulted from foreign currencytranslations.
(2) Represents weighted-average useful lives (in years) of intangible assets acquired during fiscal 2019.
Total amortization expense related to our intangible assets was $1.7 billion, $1.6 billion and $1.5 billion in fiscal2019, 2018 and 2017, respectively. As of May 31, 2019, estimated future amortization expenses related tointangible assets were as follows (in millions):
Fiscal 2020. . . . . . . . . . . . . . . . . . . . . . . . . . . . . . . . . . . . . . . . . . . . . . . . . . . . . . . . . . . . . . . . . . . . . . . . . . . . . . . . . . . . . . . . . . . . . . . . . . . . . . . . . . . . . . . . . . . . . . $ 1,583Fiscal 2021. . . . . . . . . . . . . . . . . . . . . . . . . . . . . . . . . . . . . . . . . . . . . . . . . . . . . . . . . . . . . . . . . . . . . . . . . . . . . . . . . . . . . . . . . . . . . . . . . . . . . . . . . . . . . . . . . . . . . . 1,339Fiscal 2022. . . . . . . . . . . . . . . . . . . . . . . . . . . . . . . . . . . . . . . . . . . . . . . . . . . . . . . . . . . . . . . . . . . . . . . . . . . . . . . . . . . . . . . . . . . . . . . . . . . . . . . . . . . . . . . . . . . . . . 1,090Fiscal 2023. . . . . . . . . . . . . . . . . . . . . . . . . . . . . . . . . . . . . . . . . . . . . . . . . . . . . . . . . . . . . . . . . . . . . . . . . . . . . . . . . . . . . . . . . . . . . . . . . . . . . . . . . . . . . . . . . . . . . . 668Fiscal 2024. . . . . . . . . . . . . . . . . . . . . . . . . . . . . . . . . . . . . . . . . . . . . . . . . . . . . . . . . . . . . . . . . . . . . . . . . . . . . . . . . . . . . . . . . . . . . . . . . . . . . . . . . . . . . . . . . . . . . . 440Thereafter . . . . . . . . . . . . . . . . . . . . . . . . . . . . . . . . . . . . . . . . . . . . . . . . . . . . . . . . . . . . . . . . . . . . . . . . . . . . . . . . . . . . . . . . . . . . . . . . . . . . . . . . . . . . . . . . . . . . . . 159
Total intangible assets, net. . . . . . . . . . . . . . . . . . . . . . . . . . . . . . . . . . . . . . . . . . . . . . . . . . . . . . . . . . . . . . . . . . . . . . . . . . . . . . . . . . . . . . . . . . $ 5,279

ORACLE CORPORATIONNOTES TO CONSOLIDATED FINANCIAL STATEMENTS�(Continued)
May 31, 2019
90
The changes in the carrying amounts of goodwill, net, which is generally not deductible for tax purposes, for ouroperating segments for fiscal 2019 and 2018 were as follows:
(in millions) Cloud and License Hardware Services Total Goodwill, net
Balances as of May 31, 2017 . . . . . . . . . . . $ 38,791 $ 2,367 $ 1,887 $ 43,045Goodwill from acquisitions . . . . . . . 1,052 � � 1,052Goodwill adjustments, net(1) . . . . . (243) � (99) (342)
Balances as of May 31, 2018 . . . . . . . . . . . 39,600 2,367 1,788 43,755Goodwill from acquisitions . . . . . . . 96 � � 96Goodwill adjustments, net(1) . . . . . (63) � (9) (72)
Balances as of May 31, 2019 . . . . . . . . . . . $ 39,633 $ 2,367 $ 1,779 $ 43,779
(1) Pursuant to our business combinations accounting policy, we recorded goodwill adjustments for the effects on goodwill of changes to net assetsacquired during the period that such a change is identified, provided that any such change is within the measurement period (up to one year fromthe date of the acquisition). Amounts also include immaterial changes, if any, in goodwill balances for the periods presented that resulted from netforeign currency translations.

ORACLE CORPORATIONNOTES TO CONSOLIDATED FINANCIAL STATEMENTS�(Continued)
May 31, 2019
91
7. NOTES PAYABLE AND OTHER BORROWINGS
Notes payable and other borrowings consisted of the following:
May 31, 2019 May 31, 2018
(Dollars in millions)Date ofIssuance Amount
EffectiveInterestRate Amount
EffectiveInterestRate
Fixed-rate senior notes:$1,500, 2.375%, due January 2019(1) . . . . . . . . . . . . . . . . . . . . . . . . . . . . July 2013 � N.A. 1,500 2.44%$1,750, 5.00%, due July 2019 . . . . . . . . . . . . . . . . . . . . . . . . . . . . . . . . . . . July 2009 1,750 5.05% 1,750 5.05%$2,000, 2.25%, due October 2019(1). . . . . . . . . . . . . . . . . . . . . . . . . . . . . July 2014 2,000 2.27% 2,000 2.27%$1,000, 3.875%, due July 2020. . . . . . . . . . . . . . . . . . . . . . . . . . . . . . . . . . July 2010 1,000 3.93% 1,000 3.93%�1,250, 2.25%, due January 2021(2)(3) . . . . . . . . . . . . . . . . . . . . . . . . . . . July 2013 1,393 2.33% 1,446 2.33%$1,500, 2.80%, due July 2021(1) . . . . . . . . . . . . . . . . . . . . . . . . . . . . . . . . . July 2014 1,500 2.82% 1,500 2.82%$4,250, 1.90%, due September 2021 . . . . . . . . . . . . . . . . . . . . . . . . . . . July 2016 4,250 1.94% 4,250 1.94%$2,500, 2.50%, due May 2022 . . . . . . . . . . . . . . . . . . . . . . . . . . . . . . . . . . May 2015 2,500 2.56% 2,500 2.56%$2,500, 2.50%, due October 2022 . . . . . . . . . . . . . . . . . . . . . . . . . . . . . . October 2012 2,500 2.51% 2,500 2.51%$1,250, 2.625%, due February 2023 . . . . . . . . . . . . . . . . . . . . . . . . . . . . November 2017 1,250 2.64% 1,250 2.64%$1,000, 3.625%, due July 2023. . . . . . . . . . . . . . . . . . . . . . . . . . . . . . . . . . July 2013 1,000 3.73% 1,000 3.73%$2,500, 2.40%, due September 2023 . . . . . . . . . . . . . . . . . . . . . . . . . . . July 2016 2,500 2.40% 2,500 2.40%$2,000, 3.40%, due July 2024 . . . . . . . . . . . . . . . . . . . . . . . . . . . . . . . . . . . July 2014 2,000 3.43% 2,000 3.43%$2,000, 2.95%, due November 2024 . . . . . . . . . . . . . . . . . . . . . . . . . . . . November 2017 2,000 2.98% 2,000 2.98%$2,500, 2.95%, due May 2025 . . . . . . . . . . . . . . . . . . . . . . . . . . . . . . . . . . May 2015 2,500 3.00% 2,500 3.00%�750, 3.125%, due July 2025(2)(4) . . . . . . . . . . . . . . . . . . . . . . . . . . . . . . . . July 2013 836 3.17% 868 3.17%$3,000, 2.65%, due July 2026 . . . . . . . . . . . . . . . . . . . . . . . . . . . . . . . . . . . July 2016 3,000 2.69% 3,000 2.69%$2,750, 3.25%, due November 2027 . . . . . . . . . . . . . . . . . . . . . . . . . . . . November 2017 2,750 3.26% 2,750 3.26%$500, 3.25%, due May 2030 . . . . . . . . . . . . . . . . . . . . . . . . . . . . . . . . . . . . May 2015 500 3.30% 500 3.30%$1,750, 4.30%, due July 2034 . . . . . . . . . . . . . . . . . . . . . . . . . . . . . . . . . . . July 2014 1,750 4.30% 1,750 4.30%$1,250, 3.90%, due May 2035 . . . . . . . . . . . . . . . . . . . . . . . . . . . . . . . . . . May 2015 1,250 3.95% 1,250 3.95%$1,250, 3.85%, due July 2036 . . . . . . . . . . . . . . . . . . . . . . . . . . . . . . . . . . . July 2016 1,250 3.85% 1,250 3.85%$1,750, 3.80%, due November 2037 . . . . . . . . . . . . . . . . . . . . . . . . . . . . November 2017 1,750 3.83% 1,750 3.83%$1,250, 6.50%, due April 2038 . . . . . . . . . . . . . . . . . . . . . . . . . . . . . . . . . . April 2008 1,250 6.52% 1,250 6.52%$1,250, 6.125%, due July 2039. . . . . . . . . . . . . . . . . . . . . . . . . . . . . . . . . . July 2009 1,250 6.19% 1,250 6.19%$2,250, 5.375%, due July 2040. . . . . . . . . . . . . . . . . . . . . . . . . . . . . . . . . . July 2010 2,250 5.45% 2,250 5.45%$1,000, 4.50%, due July 2044 . . . . . . . . . . . . . . . . . . . . . . . . . . . . . . . . . . . July 2014 1,000 4.50% 1,000 4.50%$2,000, 4.125%, due May 2045 . . . . . . . . . . . . . . . . . . . . . . . . . . . . . . . . . May 2015 2,000 4.15% 2,000 4.15%$3,000, 4.00%, due July 2046 . . . . . . . . . . . . . . . . . . . . . . . . . . . . . . . . . . . July 2016 3,000 4.00% 3,000 4.00%$2,250, 4.00%, due November 2047 . . . . . . . . . . . . . . . . . . . . . . . . . . . . November 2017 2,250 4.03% 2,250 4.03%$1,250, 4.375%, due May 2055 . . . . . . . . . . . . . . . . . . . . . . . . . . . . . . . . . May 2015 1,250 4.40% 1,250 4.40%
Floating-rate senior notes:$500, three-month LIBOR plus 0.58%, due January 2019 . . . . . . July 2013 � N.A. 500 2.93%$750, three-month LIBOR plus 0.51%, due October 2019 . . . . . . July 2014 750 3.10% 750 2.84%
Revolving credit agreements and other borrowings:$2,500, LIBOR plus 0.50%, due June 2018 . . . . . . . . . . . . . . . . . . . . . . May 2018 � N.A. 2,500 2.48%Other borrowings due August 2025 . . . . . . . . . . . . . . . . . . . . . . . . . . . . November 2016 113 3.53% 113 3.53%
Total senior notes and other borrowings . . . . . . . . . . . . . . . . . . $ 56,342 $ 60,927Unamortized discount/issuance costs. . . . . . . . . . . . . . . . . . . . . . (202) (282)Hedge accounting fair value adjustments(1)(4) . . . . . . . . . . . . . . 27 (26)
Total notes payable and other borrowings . . . . . . . . . . . . $ 56,167 $ 60,619
Notes payable and other borrowings, current. . . . . . . . . $ 4,494 $ 4,491
Notes payable and other borrowings, non-current. . . . $ 51,673 $ 56,128
(1) We entered into certain interest rate swap agreements that have the economic effects of modifying the fixed-interest obligations associated withthe 2.375% senior notes that were due and settled in January 2019 (January 2019 Notes), the 2.25% senior notes due October 2019 (October 2019Notes) and the 2.80% senior notes due July 2021 (July 2021 Notes) so that the interest payable on these notes effectively became variable based on

ORACLE CORPORATIONNOTES TO CONSOLIDATED FINANCIAL STATEMENTS�(Continued)
May 31, 2019
92
LIBOR. The effective interest rates after consideration of these fixed to variable interest rate swap agreements were 3.00% as of May 31, 2018 forthe January 2019 Notes; and 3.07% and 2.81%, respectively, for the October 2019 Notes, and 3.22% and 2.96%, respectively, for the July 2021Notes as of May 31, 2019 and 2018, respectively. Refer to Notes 1 and 10 for a description of our accounting for fair value hedges associated withour October 2019 Notes and July 2021 Notes and to our Annual Report for the year ended May 31, 2018 for a description of our accounting for fairvalue hedges associated with our January 2019 Notes.
(2) In July 2013, we issued �2.0 billion of fixed-rate senior notes comprised of �1.25 billion of 2.25% senior notes due January 2021 (January 2021Notes) and �750 million of 3.125% senior notes due July 2025 (July 2025 Notes, and together with the January 2021 Notes, the Euro Notes).Principal and unamortized discount/issuance costs for the Euro Notes in the table above were calculated using foreign currency exchange rates asof May 31, 2019 and May 31, 2018, respectively. The Euro Notes are registered and trade on the New York Stock Exchange.
(3) In connection with the issuance of the January 2021 Notes, we entered into certain cross-currency swap agreements that have the economic effectof converting our fixed-rate, Euro-denominated debt, including annual interest payments and the payment of principal at maturity, to a fixed-rate,U.S. Dollar-denominated debt of $1.6 billion with a fixed annual interest rate of 3.53% (see Note 10 for additional information).
(4) In fiscal 2018 we entered into certain cross-currency interest rate swap agreements that have the economic effect of converting our fixed-rate,Euro-denominated debt, including annual interest payments and the payment of principal at maturity, to a variable-rate, U.S. Dollar-denominateddebt of $871 million based on LIBOR. The effective interest rate as of May 31, 2019 and 2018 after consideration of the cross-currency interest rateswap agreements were 5.74% and 5.17%, respectively, for the July 2025 Notes. Refer to Notes 1 and 10 for a description of our accounting for fairvalue hedges.
Future principal payments (adjusted for the effects of the cross-currency swap agreements associated with theJanuary 2021 Notes and July 2025 Notes) for all of our borrowings at May 31, 2019 were as follows (in millions):
Fiscal 2020. . . . . . . . . . . . . . . . . . . . . . . . . . . . . . . . . . . . . . . . . . . . . . . . . . . . . . . . . . . . . . . . . . . . . . . . . . . . . . . . . . . . . . . . . . . . . . . . . . . . $ 4,500Fiscal 2021. . . . . . . . . . . . . . . . . . . . . . . . . . . . . . . . . . . . . . . . . . . . . . . . . . . . . . . . . . . . . . . . . . . . . . . . . . . . . . . . . . . . . . . . . . . . . . . . . . . . 2,631Fiscal 2022. . . . . . . . . . . . . . . . . . . . . . . . . . . . . . . . . . . . . . . . . . . . . . . . . . . . . . . . . . . . . . . . . . . . . . . . . . . . . . . . . . . . . . . . . . . . . . . . . . . . 8,250Fiscal 2023. . . . . . . . . . . . . . . . . . . . . . . . . . . . . . . . . . . . . . . . . . . . . . . . . . . . . . . . . . . . . . . . . . . . . . . . . . . . . . . . . . . . . . . . . . . . . . . . . . . . 3,750Fiscal 2024. . . . . . . . . . . . . . . . . . . . . . . . . . . . . . . . . . . . . . . . . . . . . . . . . . . . . . . . . . . . . . . . . . . . . . . . . . . . . . . . . . . . . . . . . . . . . . . . . . . . 3,500Thereafter . . . . . . . . . . . . . . . . . . . . . . . . . . . . . . . . . . . . . . . . . . . . . . . . . . . . . . . . . . . . . . . . . . . . . . . . . . . . . . . . . . . . . . . . . . . . . . . . . . . . 33,984
Total . . . . . . . . . . . . . . . . . . . . . . . . . . . . . . . . . . . . . . . . . . . . . . . . . . . . . . . . . . . . . . . . . . . . . . . . . . . . . . . . . . . . . . . . . . . . . . . . . . . . . $ 56,615
Senior Notes
Interest is payable semi-annually for the senior notes listed in the above table except for the Euro Notes for whichinterest is payable annually and the floating-rate senior notes for which interest is payable quarterly. We mayredeem some or all of the senior notes of each series prior to their maturity, subject to certain restrictions, and thepayment of an applicable make-whole premium in certain instances except for the floating-rate senior notes,which may not be redeemed prior to their maturity.
The senior notes rank pari passu with any other notes we may issue in the future pursuant to our commercialpaper program (see additional discussion regarding our commercial paper program below) and all existing andfuture unsecured senior indebtedness of Oracle Corporation. All existing and future liabilities of the subsidiaries ofOracle Corporation are or will be effectively senior to the senior notes and any future issuances of commercialpaper notes. We were in compliance with all debt-related covenants at May 31, 2019.
Revolving Credit Agreements
In May 2018, we borrowed $2.5 billion pursuant to three revolving credit agreements with JPMorgan Chase Bank,N.A., as initial lender and administrative agent (the 2018 Credit Agreements). In June 2018, we repaid the $2.5billion and the 2018 Credit Agreements expired pursuant to their terms.

ORACLE CORPORATIONNOTES TO CONSOLIDATED FINANCIAL STATEMENTS�(Continued)
May 31, 2019
93
Commercial Paper Program and Commercial Paper Notes
Our existing $3.0 billion commercial paper program allows us to issue and sell unsecured short-term promissorynotes pursuant to a private placement exemption from the registration requirements under federal and statesecurities laws pursuant to dealer agreements with various banks and an Issuing and Paying Agency Agreementwith Deutsche Bank Trust Company Americas. As of May 31, 2019 and 2018, we did not have any outstandingcommercial paper notes.
8. RESTRUCTURING ACTIVITIES
Fiscal 2019 Oracle Restructuring Plan
During fiscal 2019, our management approved, committed to and initiated plans to restructure and furtherimprove efficiencies in our operations due to our acquisitions and certain other operational activities (2019Restructuring Plan). In the fourth quarter of fiscal 2019, our management supplemented the 2019 RestructuringPlan to reflect additional actions that we expect to take. The total estimated restructuring costs associated withthe 2019 Restructuring Plan are up to $584 million and will be recorded to the restructuring expense line itemwithin our consolidated statements of operations as they are incurred. We recorded $476 million of restructuringexpenses in connection with the 2019 Restructuring Plan in fiscal 2019 and we expect to incur the majority of theestimated $108 million through the end of fiscal 2020. Any changes to the estimates of executing the 2019Restructuring Plan will be reflected in our future results of operations.
Fiscal 2017 Oracle Restructuring Plan
During fiscal 2017, our management approved, committed to and initiated plans to restructure and furtherimprove efficiencies in our operations due to our acquisitions and certain other operational activities (2017Restructuring Plan). Restructuring costs associated with the 2017 Restructuring Plan were recorded to therestructuring expense line item within our consolidated statements of operations as they were incurred. Werecorded $601 million and $486 million of restructuring expenses in connection with the 2017 Restructuring Planin fiscal 2018 and 2017, respectively. Actions pursuant to the 2017 Restructuring Plan were substantially completeas of May 31, 2018.
Summary of All Plans
Fiscal 2019 Activity
Year Ended May 31, 2019
(in millions)
AccruedMay 31,2018(2)
InitialCosts(3)
Adj. toCost(4)
CashPayments Others(5)
AccruedMay 31,2019(2)
TotalCosts
Accruedto Date
TotalExpectedProgramCosts
Fiscal 2019 Oracle Restructuring Plan(1)
Cloud and license. . . . . . . . . . . . . . . . . . . . . . . . . . . . . . . . . . . . $ � $ 191 $ (4) $ (113) $ (2) $ 72 $ 187 $ 245Hardware. . . . . . . . . . . . . . . . . . . . . . . . . . . . . . . . . . . . . . . . . . . . � 53 � (35) � 18 53 65Services. . . . . . . . . . . . . . . . . . . . . . . . . . . . . . . . . . . . . . . . . . . . . . � 41 1 (27) � 15 42 72Other(6) . . . . . . . . . . . . . . . . . . . . . . . . . . . . . . . . . . . . . . . . . . . . . . � 190 4 (87) 1 108 194 202
Total Fiscal 2019 Oracle Restructuring Plan . . $ � $ 475 $ 1 $ (262) $ (1) $ 213 $ 476 $ 584
Total other restructuring plans(7) . . . . . . . . . . . . . $ 282 $ 5 $ (58) $ (181) $ 1 $ 49
Total restructuring plans. . . . . . . . . . . . . . . . . $ 282 $ 480 $ (57) $ (443) $ � $ 262

ORACLE CORPORATIONNOTES TO CONSOLIDATED FINANCIAL STATEMENTS�(Continued)
May 31, 2019
94
Fiscal 2018 Activity
Year Ended May 31, 2018
(in millions)
AccruedMay 31,2017
InitialCosts(3)
Adj. toCost(4)
CashPayments Others(5)
AccruedMay 31,2018(2)
Fiscal 2017 Oracle Restructuring Plan(1)
Cloud and license . . . . . . . . . . . . . . . . . . . . . . . . . . . . . . . . . . . . . $ 85 $ 156 $ (12) $ (150) $ 3 $ 82Hardware. . . . . . . . . . . . . . . . . . . . . . . . . . . . . . . . . . . . . . . . . . . . . . 31 167 (15) (122) � 61Services. . . . . . . . . . . . . . . . . . . . . . . . . . . . . . . . . . . . . . . . . . . . . . . . 25 48 (4) (54) 1 16Other(6) . . . . . . . . . . . . . . . . . . . . . . . . . . . . . . . . . . . . . . . . . . . . . . . . 44 267 (6) (208) (7) 90
Total Fiscal 2017 Oracle Restructuring Plan . . . $ 185 $ 638 $ (37) $ (534) $ (3) $ 249Total other restructuring plans(7) . . . . . . . . . . . . . . $ 79 $ 1 $ (14) $ (37) $ 4 $ 33
Total restructuring plans . . . . . . . . . . . . . . . . . . . $ 264 $ 639 $ (51) $ (571) $ 1 $ 282
Fiscal 2017 Activity
Year Ended May 31, 2017
(in millions)
AccruedMay 31,2016
InitialCosts(3)
Adj. toCost(4)
CashPayments Others(5)
AccruedMay 31,2017
Fiscal 2017 Oracle Restructuring Plan(1)
Cloud and license . . . . . . . . . . . . . . . . . . . . . . . . . . . . . . . . . . . . . . $ � $ 184 $ (6) $ (100) $ 7 $ 85Hardware. . . . . . . . . . . . . . . . . . . . . . . . . . . . . . . . . . . . . . . . . . . . . . . � 91 (3) (57) � 31Services . . . . . . . . . . . . . . . . . . . . . . . . . . . . . . . . . . . . . . . . . . . . . . . . � 59 (1) (34) 1 25Other(6) . . . . . . . . . . . . . . . . . . . . . . . . . . . . . . . . . . . . . . . . . . . . . . . . . � 166 (4) (118) � 44
Total Fiscal 2017 Oracle Restructuring Plan. . . . $ � $ 500 $ (14) $ (309) $ 8 $ 185Total other restructuring plans(7) . . . . . . . . . . . . . . . $ 283 $ 8 $ (31) $ (169) $ (12) $ 79
Total restructuring plans. . . . . . . . . . . . . . . . . . . . $ 283 $ 508 $ (45) $ (478) $ (4) $ 264
(1) Restructuring costs recorded for individual line items primarily related to employee severance costs.
(2) The balances at May 31, 2019 and 2018 included $239 million and $257 million, respectively, recorded in other current liabilities and $23 millionand $25 million, respectively, recorded in other non-current liabilities.
(3) Costs recorded for the respective restructuring plans during the periods presented.
(4) All plan adjustments were changes in estimates whereby increases and decreases in costs were generally recorded to operating expenses in theperiod of adjustments.
(5) Represents foreign currency translation and certain other adjustments.
(6) Represents employee related severance costs for functions that are not included within our operating segments and certain facilities relatedrestructuring costs.
(7) Other restructuring plans presented in the tables above included condensed information for certain Oracle-based plans and other plans associatedwith certain of our acquisitions whereby we continued to make cash outlays to settle obligations under these plans during the periods presentedbut for which the periodic impact to our consolidated statements of operations was not significant.

ORACLE CORPORATIONNOTES TO CONSOLIDATED FINANCIAL STATEMENTS�(Continued)
May 31, 2019
95
9. DEFERRED REVENUES
Deferred revenues consisted of the following:
May 31,(in millions) 2019 2018
Cloud services and license support. . . . . . . . . . . . . . . . . . . . . . . . . . . . . . . . . . . . . . . . . . . . . . . . . $ 7,340 $ 7,265Hardware . . . . . . . . . . . . . . . . . . . . . . . . . . . . . . . . . . . . . . . . . . . . . . . . . . . . . . . . . . . . . . . . . . . . . . . . . . . . . 635 645Services . . . . . . . . . . . . . . . . . . . . . . . . . . . . . . . . . . . . . . . . . . . . . . . . . . . . . . . . . . . . . . . . . . . . . . . . . . . . . . . 360 404Cloud license and on-premise license. . . . . . . . . . . . . . . . . . . . . . . . . . . . . . . . . . . . . . . . . . . . . . 39 27
Deferred revenues, current . . . . . . . . . . . . . . . . . . . . . . . . . . . . . . . . . . . . . . . . . . . . . . . . . . . 8,374 8,341Deferred revenues, non-current (in other non-current liabilities) . . . . . . . . . 669 625
Total deferred revenues . . . . . . . . . . . . . . . . . . . . . . . . . . . . . . . . . . . . . . . . . . . . . . . . . . . $ 9,043 $ 8,966
Deferred cloud services and license support revenues and deferred hardware revenues substantially representcustomer payments made in advance for cloud or support contracts that are typically billed in advance withcorresponding revenues generally being recognized ratably over the contractual periods. Deferred servicesrevenues include prepayments for our services business and revenues for these services are generally recognizedas the services are performed. Deferred cloud license and on-premise license revenues typically resulted fromcustomer payments that related to undelivered products and services or specified enhancements.
In connection with our acquisitions, we have estimated the fair values of the cloud services and license supportperformance obligations assumed from our acquired companies. We generally have estimated the fair values ofthese obligations assumed using a cost build-up approach. The cost build-up approach determines fair value byestimating the costs related to fulfilling the obligations plus a normal profit margin. The sum of the costs andoperating profit approximates, in theory, the amount that we would be required to pay a third party to assumethese acquired obligations. These aforementioned fair value adjustments recorded for obligations assumed fromour acquisitions reduced the cloud services and license support deferred revenues balances that we recorded asliabilities from these acquisitions and also reduced the resulting revenues that we recognized or will recognize overthe terms of the acquired obligations during the post-combination periods.
10. DERIVATIVE FINANCIAL INSTRUMENTS
Fair Value Hedges�Interest Rate Swap Agreements and Cross-Currency Interest Rate Swap Agreements
In May 2018, we entered into certain cross-currency interest rate swap agreements to manage the foreigncurrency exchange rate risk associated with our July 2025 Notes by effectively converting the fixed-rate, Eurodenominated 2025 Notes, including the annual interest payments and the payment of principal at maturity, tovariable-rate, U.S. Dollar denominated debt based on LIBOR. In July 2014, we entered into certain interest rateswap agreements that have the economic effect of modifying the fixed-interest obligations associated with ourOctober 2019 Notes and our July 2021 Notes so that the interest payable on these senior notes effectively becamevariable based on LIBOR. The critical terms of the swap agreements match the critical terms of the July 2025 Notes,October 2019 Notes, and July 2021 Notes that the swap agreements pertain to, including the notional amountsand maturity dates.
We have designated the aforementioned swap agreements as qualifying hedging instruments and are accountingfor them as fair value hedges pursuant to ASC 815. The changes in fair values of these swap agreements arerecognized as interest expense in our consolidated statements of operations with the corresponding amountsincluded in other current/non-current assets or other current/non-current liabilities in our consolidated balancesheets. The amount of net gain (loss) attributable to the risk being hedged is recognized as interest expense in ourconsolidated statements of operations with the corresponding amount included in notes payable, current or notes

ORACLE CORPORATIONNOTES TO CONSOLIDATED FINANCIAL STATEMENTS�(Continued)
May 31, 2019
96
payable, non-current. As a result of our adoption of ASU 2017-12, we have elected to exclude the portion of thechange in fair value of cross-currency interest rate swap agreements attributable to the related cross-currencybasis spread in our assessment of hedge effectiveness. The change in fair value of these cross-currency interestrate swap agreements attributable to the cross-currency basis spread is included in AOCL. The periodic interestsettlements for the swap agreements for the July 2025 Notes, October 2019 Notes, and July 2021 Notes arerecorded as interest expense and are included as a part of cash flows from operating activities.
Cash Flow Hedges�Cross-Currency Swap Agreements
In connection with the issuance of the January 2021 Notes, we entered into certain cross-currency swapagreements to manage the related foreign currency exchange risk by effectively converting the fixed-rate, Euro-denominated January 2021 Notes, including the annual interest payments and the payment of principal atmaturity, to fixed-rate, U.S. Dollar-denominated debt. The economic effect of the swap agreements was toeliminate the uncertainty of the cash flows in U.S. Dollars associated with the January 2021 Notes by fixing theprincipal amount of the January 2021 Notes at $1.6 billion with a fixed annual interest rate of 3.53%. We havedesignated these cross-currency swap agreements as qualifying hedging instruments and are accounting for theseas cash flow hedges pursuant to ASC 815. The critical terms of the cross-currency swap agreements correspond tothe January 2021 Notes including the annual interest payments being hedged, and the cross-currency swapagreements mature at the same time as the January 2021 Notes.
We used the hypothetical derivative method to assess the effectiveness of our cross-currency swap agreements.The fair values of these cross-currency swap agreements are recognized as other non-current assets or other non-current liabilities in our consolidated balance sheets. We reflect the gains or losses on the effective portion ofthese cross-currency swap agreements in AOCL in our consolidated balance sheets and an amount is reclassifiedout of AOCL into non-operating income, net in the same period that the carrying values of the Euro-denominatedJanuary 2021 Notes are remeasured and the interest expense is recognized. The cash flows related to the cross-currency swap agreements that pertain to the periodic interest settlements are classified as operating activitiesand the cash flows that pertain to the principal balance are classified as financing activities.
Foreign Currency Forward Contracts Not Designated as Hedges
We transact business in various foreign currencies and have established a program that primarily utilizes foreigncurrency forward contracts to offset the risks associated with the effects of certain foreign currency exposures.Under this program, our strategy is to enter into foreign currency forward contracts so that increases or decreasesin our foreign currency exposures are offset by gains or losses on the foreign currency forward contracts in orderto mitigate the risks and volatility associated with our foreign currency transactions. We may suspend this programfrom time to time. Our foreign currency exposures typically arise from intercompany sublicense fees,intercompany loans and other intercompany transactions that are generally expected to be cash settled in thenear term. Our foreign currency forward contracts are generally short-term in duration. Our ultimate realized gainor loss with respect to currency fluctuations will generally depend on the size and type of cross-currency exposuresthat we enter into, the currency exchange rates associated with these exposures and changes in those rates, thenet realized and unrealized gains or losses on foreign currency forward contracts to offset these exposures andother factors.
We do not designate these forward contracts as hedging instruments pursuant to ASC 815. Accordingly, werecorded the fair values of these contracts as of the end of each reporting period to our consolidated balancesheets with changes in fair values recorded to our consolidated statements of operations. The balance sheetclassification for the fair values of these forward contracts is other current assets for forward contracts in anunrealized gain position and other current liabilities for forward contracts in an unrealized loss position. Thestatement of operations classification for changes in fair values of these forward contracts is non-operatingincome, net for both realized and unrealized gains and losses.

ORACLE CORPORATIONNOTES TO CONSOLIDATED FINANCIAL STATEMENTS�(Continued)
May 31, 2019
97
As of May 31, 2019 and 2018, the notional amounts of the forward contracts we held to purchase U.S. Dollars inexchange for other major international currencies were $3.8 billion and $3.4 billion, respectively, and the notionalamounts of forward contracts we held to sell U.S. Dollars in exchange for other major international currencieswere $3.3 billion and $1.4 billion, respectively. The fair values of our outstanding foreign currency forwardcontracts were nominal at May 31, 2019 and 2018. The cash flows related to these foreign currency contracts areclassified as operating activities. Net gains or losses related to these forward contracts are included in non-operating income, net.
The effects of derivative instruments designated as hedges on certain of our consolidated financial statementswere as follows as of or for each of the respective periods presented below (amounts presented exclude anyincome tax effects):
Fair Values of Derivative Instruments Designated as Hedges in Consolidated Balance Sheets
Fair Value as of May 31,(in millions) Balance Sheet Location 2019 2018Derivative assets:
Interest rate swap agreements designated as fair value hedges. . . . . . . . Other non-current assets $ 5 $ 24Cross-currency interest rate swap agreements designated as fairvalue hedges . . . . . . . . . . . . . . . . . . . . . . . . . . . . . . . . . . . . . . . . . . . . . . . . . . . . . . . . . . . Other non-current assets � 5
Total derivative assets. . . . . . . . . . . . . . . . . . . . . . . . . . . . . . . . . . . . . . . . . . . . . . . $ 5 $ 29
Derivative liabilities:Interest rate swap agreements designated as fair value hedges. . . . . . . . Other current liabilities $ 5 $ 7Interest rate swap agreements designated as fair value hedges. . . . . . . . Other non-current liabilities � 48Cross-currency interest rate swap agreements designated as fairvalue hedges . . . . . . . . . . . . . . . . . . . . . . . . . . . . . . . . . . . . . . . . . . . . . . . . . . . . . . . . . . . Other non-current liabilities 17 �
Cross-currency swap agreements designated as cash flow hedges . . . . . Other non-current liabilities 208 103Total derivative liabilities. . . . . . . . . . . . . . . . . . . . . . . . . . . . . . . . . . . . . . . . . . . . $ 230 $ 158
Effects of Fair Value Hedging Relationships on Hedged Items in Consolidated Balance Sheets
May 31,(in millions) 2019 2018
Notes payable and other borrowings, current:Carrying amount of hedged item . . . . . . . . . . . . . . . . . . . . . . . . . . . . . . . . . . . . . . . . . . . . . . . . . . . . . . . . . $ 1,994 $ 1,492Cumulative hedging adjustments included in the carrying amount. . . . . . . . . . . . . . . . . . . . . (5) (7)
Notes payable and other borrowings, non-current:Carrying amounts of hedged items . . . . . . . . . . . . . . . . . . . . . . . . . . . . . . . . . . . . . . . . . . . . . . . . . . . . . . . 3,652 5,584Cumulative hedging adjustments included in the carrying amount. . . . . . . . . . . . . . . . . . . . . 44 (19)

ORACLE CORPORATIONNOTES TO CONSOLIDATED FINANCIAL STATEMENTS�(Continued)
May 31, 2019
98
Effects of Derivative Instruments Designated as Hedges on Income
Year Ended May 31,
2019 2018 2017
(in millions)Non-operatingincome, net
Interestexpense
Non-operatingincome, net
Interestexpense
Non-operatingincome, net
Interestexpense
Consolidated statements of income line amounts in which the hedgeeffects were recorded . . . . . . . . . . . . . . . . . . . . . . . . . . . . . . . . . . . . . . . . . . . . . . . $ 815 $ (2,082) $ 1,185 $ (2,025) $ 565 $ (1,798)
Gain (loss) on hedges recognized in income:Interest rate swaps designated as fair value hedges:Derivative instruments . . . . . . . . . . . . . . . . . . . . . . . . . . . . . . . . . . . . . . . . . . . . $ � $ 31 $ � $ (66) $ � $ (82)Hedged items. . . . . . . . . . . . . . . . . . . . . . . . . . . . . . . . . . . . . . . . . . . . . . . . . . . . . . � (31) � 66 � 82
Cross-currency interest rate swaps designated as fair value hedges:Derivative instruments . . . . . . . . . . . . . . . . . . . . . . . . . . . . . . . . . . . . . . . . . . . . (38) 27 � � � �Hedged items. . . . . . . . . . . . . . . . . . . . . . . . . . . . . . . . . . . . . . . . . . . . . . . . . . . . . . 38 (27) � � � �
Cross-currency swap agreements designated as cash flow hedges:Amount of gain (loss) reclassified from accumulated OCI or OCL. . . (53) � 51 � 2 �Total gain (loss) on hedges recognized in income. . . . . . . . . . . . . . . . $ (53) $ � $ 51 $ � $ 2 $ �
Gain (Loss) on Derivative Instruments Designated as Hedges included in Other Comprehensive Income (OCI) orLoss (OCL)
Year Ended May 31,(in millions) 2019 2018 2017Cross-currency swap agreements designated as cash flow hedges. . . . . . . . $ (105) $ 88 $ 27
11. COMMITMENTS AND CERTAIN CONTINGENCIES
Lease Commitments
We have operating leases primarily for facilities, land, data centers and vehicles. As of May 31, 2019, futureminimum annual operating lease payments and future minimum payments to be received from non-cancelablesubleases were as follows:
(in millions)
Fiscal 2020. . . . . . . . . . . . . . . . . . . . . . . . . . . . . . . . . . . . . . . . . . . . . . . . . . . . . . . . . . . . . . . . . . . . . . . . . . . . . . . . . . . . . . . . . . . . . . . . . . . . $ 658Fiscal 2021. . . . . . . . . . . . . . . . . . . . . . . . . . . . . . . . . . . . . . . . . . . . . . . . . . . . . . . . . . . . . . . . . . . . . . . . . . . . . . . . . . . . . . . . . . . . . . . . . . . . 538Fiscal 2022. . . . . . . . . . . . . . . . . . . . . . . . . . . . . . . . . . . . . . . . . . . . . . . . . . . . . . . . . . . . . . . . . . . . . . . . . . . . . . . . . . . . . . . . . . . . . . . . . . . . 425Fiscal 2023. . . . . . . . . . . . . . . . . . . . . . . . . . . . . . . . . . . . . . . . . . . . . . . . . . . . . . . . . . . . . . . . . . . . . . . . . . . . . . . . . . . . . . . . . . . . . . . . . . . . 262Fiscal 2024. . . . . . . . . . . . . . . . . . . . . . . . . . . . . . . . . . . . . . . . . . . . . . . . . . . . . . . . . . . . . . . . . . . . . . . . . . . . . . . . . . . . . . . . . . . . . . . . . . . . 165Thereafter . . . . . . . . . . . . . . . . . . . . . . . . . . . . . . . . . . . . . . . . . . . . . . . . . . . . . . . . . . . . . . . . . . . . . . . . . . . . . . . . . . . . . . . . . . . . . . . . . . . . 333
Future minimum operating lease payments. . . . . . . . . . . . . . . . . . . . . . . . . . . . . . . . . . . . . . . . . . . . . . . . . . . . . . . . . . . 2,381Less: minimum payments to be received from non-cancelable subleases . . . . . . . . . . . . . . . . . . . . . . . . . . (33)
Total future minimum operating lease payments, net. . . . . . . . . . . . . . . . . . . . . . . . . . . . . . . . . . . . . . . . . . . . $ 2,348

ORACLE CORPORATIONNOTES TO CONSOLIDATED FINANCIAL STATEMENTS�(Continued)
May 31, 2019
99
Lease commitments included future minimum rent payments for facilities that we have vacated pursuant to ourrestructuring and merger integration activities, as discussed in Note 8. We have approximately $58 million infacility obligations, net of estimated sublease income and other costs, in accrued restructuring for these locationsin our consolidated balance sheet at May 31, 2019.
Rent expense was $665 million, $618 million and $501 million for fiscal 2019, 2018 and 2017, respectively, net ofsublease income of approximately $16 million, $20 million and $24 million for fiscal 2019, 2018 and 2017,respectively. Certain lease agreements contain renewal options providing for extensions of the lease terms.
Unconditional Obligations
In the ordinary course of business, we enter into certain unconditional purchase obligations with our suppliers,which are agreements that are enforceable and legally binding and specify terms, including: fixed or minimumquantities to be purchased; fixed, minimum or variable price provisions; and the approximate timing of thepayment. We utilize several external manufacturers to manufacture sub-assemblies for our hardware products andto perform final assembly and testing of finished hardware products. We also obtain individual components for ourhardware products from a variety of individual suppliers based on projected demand information. Such purchasecommitments are based on our forecasted component and manufacturing requirements and typically provide forfulfillment within agreed upon lead-times and/or commercially standard lead-times for the particular part orproduct and have been included in the amounts below. Routine arrangements for other materials and goods thatare not related to our external manufacturers and certain other suppliers and that are entered into in the ordinarycourse of business are not included in the amounts below, as they are generally entered into in order to securepricing or other negotiated terms and are difficult to quantify in a meaningful way.
As of May 31, 2019, our unconditional purchase and certain other obligations were as follows (in millions):
Fiscal 2020. . . . . . . . . . . . . . . . . . . . . . . . . . . . . . . . . . . . . . . . . . . . . . . . . . . . . . . . . . . . . . . . . . . . . . . . . . . . . . . . . . . . . . . . . . . . . . . . . . . . $ 661Fiscal 2021. . . . . . . . . . . . . . . . . . . . . . . . . . . . . . . . . . . . . . . . . . . . . . . . . . . . . . . . . . . . . . . . . . . . . . . . . . . . . . . . . . . . . . . . . . . . . . . . . . . . 57Fiscal 2022. . . . . . . . . . . . . . . . . . . . . . . . . . . . . . . . . . . . . . . . . . . . . . . . . . . . . . . . . . . . . . . . . . . . . . . . . . . . . . . . . . . . . . . . . . . . . . . . . . . . 22Fiscal 2023. . . . . . . . . . . . . . . . . . . . . . . . . . . . . . . . . . . . . . . . . . . . . . . . . . . . . . . . . . . . . . . . . . . . . . . . . . . . . . . . . . . . . . . . . . . . . . . . . . . . 23Fiscal 2024. . . . . . . . . . . . . . . . . . . . . . . . . . . . . . . . . . . . . . . . . . . . . . . . . . . . . . . . . . . . . . . . . . . . . . . . . . . . . . . . . . . . . . . . . . . . . . . . . . . . 23Thereafter . . . . . . . . . . . . . . . . . . . . . . . . . . . . . . . . . . . . . . . . . . . . . . . . . . . . . . . . . . . . . . . . . . . . . . . . . . . . . . . . . . . . . . . . . . . . . . . . . . . . 259
Total . . . . . . . . . . . . . . . . . . . . . . . . . . . . . . . . . . . . . . . . . . . . . . . . . . . . . . . . . . . . . . . . . . . . . . . . . . . . . . . . . . . . . . . . . . . . . . . . . . . $ 1,045
As described in Notes 7 and 10 above, as of May 31, 2019 we have senior notes and other borrowings of $56.3billion that mature at various future dates and derivative financial instruments outstanding that we leverage tomanage certain risks and exposures.
Guarantees
Our cloud, license and hardware sales agreements generally include certain provisions for indemnifying customersagainst liabilities if our products infringe a third party�s intellectual property rights. To date, we have not incurredany material costs as a result of such indemnifications and have not accrued any material liabilities related to suchobligations in our consolidated financial statements. Certain of our sales agreements also include provisionsindemnifying customers against liabilities in the event we breach confidentiality or service level requirements. It isnot possible to determine the maximum potential amount under these indemnification agreements due to ourlimited and infrequent history of prior indemnification claims and the unique facts and circumstances involved ineach particular agreement.

ORACLE CORPORATIONNOTES TO CONSOLIDATED FINANCIAL STATEMENTS�(Continued)
May 31, 2019
100
Our Oracle Cloud Services agreements generally include a warranty that the cloud services will be performed in allmaterial respects as defined in the agreement during the service period. Our license and hardware agreementsalso generally include a warranty that our products will substantially operate as described in the applicableprogram documentation for a period of one year after delivery. We also warrant that services we perform will beprovided in a manner consistent with industry standards for a period of 90 days from performance of the services.
We occasionally are required, for various reasons, to enter into financial guarantees with third parties in theordinary course of our business including, among others, guarantees related to taxes, import licenses and letters ofcredit on behalf of parties with whom we conduct business. Such agreements have not had a material effect onour results of operations, financial position or cash flows.
In connection with certain litigation, we posted certain court-mandated surety bonds with a court and entered intorelated indemnification agreements with each of the surety bond issuing companies. Additional information isprovided in Note 17 below.
12. STOCKHOLDERS� EQUITY
Common Stock Repurchases
Our Board of Directors has approved a program for us to repurchase shares of our common stock. On September17, 2018 and February 15, 2019, we announced that our Board of Directors approved expansions of our stockrepurchase program collectively totaling $24.0 billion. As of May 31, 2019, approximately $5.8 billion remainedavailable for stock repurchases pursuant to our stock repurchase program. We repurchased 733.8 million sharesfor $36.0 billion (including 0.8 million shares for $40 million that were repurchased but not settled), 238.0 millionshares for $11.5 billion, and 85.6 million shares for $3.5 billion in fiscal 2019, 2018 and 2017, respectively, underthe stock repurchase program.
Our stock repurchase authorization does not have an expiration date and the pace of our repurchase activity willdepend on factors such as our working capital needs, our cash requirements for acquisitions and dividendpayments, our debt repayment obligations or repurchases of our debt, our stock price, and economic and marketconditions. Our stock repurchases may be effected from time to time through open market purchases andpursuant to a Rule 10b5-1 plan. Our stock repurchase program may be accelerated, suspended, delayed ordiscontinued at any time.
Dividends on Common Stock
During fiscal 2019, 2018 and 2017, our Board of Directors declared cash dividends of $0.81, $0.76 and $0.64 pershare of our outstanding common stock, respectively, which we paid during the same period.
In June 2019, our Board of Directors declared a quarterly cash dividend of $0.24 per share of our outstandingcommon stock. The dividend is payable on July 31, 2019 to stockholders of record as of the close of business onJuly 17, 2019. Future declarations of dividends and the establishment of future record and payment dates aresubject to the final determination of our Board of Directors.

ORACLE CORPORATIONNOTES TO CONSOLIDATED FINANCIAL STATEMENTS�(Continued)
May 31, 2019
101
Accumulated Other Comprehensive Loss
The following table summarizes, as of each balance sheet date, the components of our AOCL, net of income taxes:
May 31,(in millions) 2019 2018
Foreign currency translation losses and other, net . . . . . . . . . . . . . . . . . . . . . . . . . . . . . . . $ (1,176) $ (1,027)Unrealized losses on defined benefit plans, net . . . . . . . . . . . . . . . . . . . . . . . . . . . . . . . . . . (392) (322)Unrealized losses on marketable securities, net . . . . . . . . . . . . . . . . . . . . . . . . . . . . . . . . . . (90) (422)Unrealized gains on cash flow hedges, net . . . . . . . . . . . . . . . . . . . . . . . . . . . . . . . . . . . . . . . . 30 82
Total accumulated other comprehensive loss . . . . . . . . . . . . . . . . . . . . . . . . . . . $ (1,628) $ (1,689)
13. EMPLOYEE BENEFIT PLANS
Stock-Based Compensation Plans
Stock Plans
In fiscal 2001, we adopted the 2000 Long-Term Equity Incentive Plan, which provides for the issuance of long-termperformance awards, including restricted stock-based awards, non-qualified stock options and incentive stockoptions, as well as stock purchase rights and stock appreciation rights, to our eligible employees, officers anddirectors who are also employees or consultants, independent consultants and advisers.
� In fiscal 2011, our stockholders, upon the recommendation of our Board of Directors (the Board),approved the adoption of the Amended and Restated 2000 Long-Term Equity Incentive Plan (the 2000Plan), which extended the termination date of the 2000 Plan by 10 years and increased the number ofauthorized shares of stock that may be issued by 388,313,015 shares.
� In fiscal 2014, our stockholders, upon the recommendation of the Board, approved a further increase inthe number of authorized shares of stock that may be issued under the 2000 Plan by 305,000,000 shares.Under the terms of the 2000 Plan, long-term full value awards are granted in the form of restricted stockunits (RSUs) and performance-based restricted stock awards (PSUs). For each share granted as a full valueaward under the 2000 Plan, an equivalent of 2.5 shares is deducted from our pool of shares available forgrant.
� In fiscal 2018, our stockholders, upon the recommendation of the Board, approved a further increase inthe number of authorized shares of stock that may be issued under the 2000 Plan by 330,000,000 shares,and approved material terms of the performance goals under which PSUs and performance-based stockoptions (PSOs) could be granted.
As of May 31, 2019, the 2000 Plan had 93 million unvested RSUs outstanding, 1 million unvested PSUs outstanding,55 million PSOs outstanding and service-based stock options (SOs) to purchase 164 million shares of common stockoutstanding of which 143 million shares were vested. As of May 31, 2019, approximately 301 million shares ofcommon stock were available for future awards under the 2000 Plan. To date, we have not issued any stockpurchase rights or stock appreciation rights under the 2000 Plan.
The vesting schedule for all awards granted under the 2000 Plan is established by the Compensation Committee ofthe Board of Directors. RSUs generally require service-based vesting of 25% annually over four years. The vestingschedule for PSUs currently requires achieving performance targets and providing service over four fiscal years.SOs are granted at not less than fair market value, become exercisable generally 25% annually over four years ofservice, and generally expire 10 years from the date of grant. PSOs granted to three of our current executiveofficers in fiscal 2018 consist of seven numerically equivalent vesting tranches that potentially may vest. One

ORACLE CORPORATIONNOTES TO CONSOLIDATED FINANCIAL STATEMENTS�(Continued)
May 31, 2019
102
tranche vests solely on the attainment of a market-based metric. The remaining six tranches require theattainment of both a performance metric and a market capitalization metric. In each case, the market-basedmetric, performance metrics and market capitalization metrics may be achieved at any time during a five yearperformance period, assuming continued employment and service through the date the Compensation Committeeof the Board of Directors certifies that performance has been achieved. The PSOs have contractual lives of eightyears in comparison to the typical ten year contractual lives for SOs. For the six tranches of the PSOs with bothperformance and market conditions, stock-based compensation expense is to be recognized once each vestingtranche becomes probable of achievement over the longer of the estimated implicit service period or derivedservice. We have preliminarily estimated service periods for those tranches that have been deemed probable ofachievement to be up to five years. Stock-based compensation for the market-based tranche will be recognizedusing the derived service period for the market-based metric achievement, which we have initially estimated to beapproximately three years.
In fiscal 1993, the Board adopted the 1993 Directors� Stock Plan (the Directors� Plan), which provides for theissuance of RSUs and other stock-based awards, including non-qualified stock options, to non-employee directors.The Directors� Plan has from time to time been amended and restated. Under the terms of the Directors� Plan, 10million shares of common stock are reserved for issuance (including a fiscal 2013 amendment to increase thenumber of shares of our common stock reserved for issuance by 2 million shares). In prior years, we granted stockoptions at not less than fair market value, that vest over four years, and expire no more than 10 years from thedate of grant. We currently grant RSUs only that vest fully on the one-year anniversary of the date of grant. TheDirectors� Plan was most recently amended on April 29, 2016 and permits the Compensation Committee of theBoard to determine the amount and form of automatic grants of stock awards to each non-employee directorupon first becoming a director and thereafter on an annual basis, as well as automatic grants for chairing certainBoard committees, subject to certain stockholder approved limitations set forth in the Directors� Plan. As of May31, 2019, approximately 90,000 unvested RSUs and stock options to purchase approximately 1 million shares ofcommon stock (all of which were vested) were outstanding under the Directors� Plan. As of May 31, 2019,approximately 1 million shares were available for future stock awards under this plan.
In connection with certain of our acquisitions, we assumed certain outstanding restricted stock-based awards andstock options under each acquired company�s respective stock plans, or we substituted substantially similarawards under the 2000 Plan. These restricted stock-based awards and stock options assumed or substitutedgenerally retain all of the rights, terms and conditions of the respective plans under which they were originallygranted. As of May 31, 2019, approximately 1 million shares of restricted stock-based awards and stock options topurchase 2 million shares of common stock were outstanding under acquired company stock plans that Oracleassumed.

ORACLE CORPORATIONNOTES TO CONSOLIDATED FINANCIAL STATEMENTS�(Continued)
May 31, 2019
103
The following table summarizes restricted stock-based award activity, including service-based awards andperformance-based awards, granted pursuant to Oracle-based stock plans and stock plans assumed from ouracquisitions for our last three fiscal years ended May 31, 2019:
Restricted Stock-Based Awards Outstanding
(in millions, except fair value)Number ofShares
Weighted-AverageGrant Date Fair Value
Balance, May 31, 2016 . . . . . . . . . . . . . . . . . . . . . . . . . . . . . . . . . . . . . . . . . . . . . . . . . . . . . . . . . . . . 52 $ 39.29Granted. . . . . . . . . . . . . . . . . . . . . . . . . . . . . . . . . . . . . . . . . . . . . . . . . . . . . . . . . . . . . . . . . . . . . . . . 42 $ 39.40Assumed. . . . . . . . . . . . . . . . . . . . . . . . . . . . . . . . . . . . . . . . . . . . . . . . . . . . . . . . . . . . . . . . . . . . . . . 14 $ 37.83Vested and Issued. . . . . . . . . . . . . . . . . . . . . . . . . . . . . . . . . . . . . . . . . . . . . . . . . . . . . . . . . . . . . (18) $ 40.39Canceled. . . . . . . . . . . . . . . . . . . . . . . . . . . . . . . . . . . . . . . . . . . . . . . . . . . . . . . . . . . . . . . . . . . . . . . (7) $ 39.73
Balance, May 31, 2017 . . . . . . . . . . . . . . . . . . . . . . . . . . . . . . . . . . . . . . . . . . . . . . . . . . . . . . . . . . . . 83 $ 39.18Granted. . . . . . . . . . . . . . . . . . . . . . . . . . . . . . . . . . . . . . . . . . . . . . . . . . . . . . . . . . . . . . . . . . . . . . . . 44 $ 47.42Vested and Issued. . . . . . . . . . . . . . . . . . . . . . . . . . . . . . . . . . . . . . . . . . . . . . . . . . . . . . . . . . . . . (27) $ 39.10Canceled. . . . . . . . . . . . . . . . . . . . . . . . . . . . . . . . . . . . . . . . . . . . . . . . . . . . . . . . . . . . . . . . . . . . . . . (11) $ 41.97
Balance, May 31, 2018 . . . . . . . . . . . . . . . . . . . . . . . . . . . . . . . . . . . . . . . . . . . . . . . . . . . . . . . . . . . . 89 $ 42.93Granted. . . . . . . . . . . . . . . . . . . . . . . . . . . . . . . . . . . . . . . . . . . . . . . . . . . . . . . . . . . . . . . . . . . . . . . . 53 $ 42.47Vested and Issued. . . . . . . . . . . . . . . . . . . . . . . . . . . . . . . . . . . . . . . . . . . . . . . . . . . . . . . . . . . . . (31) $ 41.85Canceled. . . . . . . . . . . . . . . . . . . . . . . . . . . . . . . . . . . . . . . . . . . . . . . . . . . . . . . . . . . . . . . . . . . . . . . (12) $ 42.97
Balance, May 31, 2019 . . . . . . . . . . . . . . . . . . . . . . . . . . . . . . . . . . . . . . . . . . . . . . . . . . . . . . . . . . . . 99 $ 43.01
The total grant date fair value of restricted stock-based awards that were vested and issued in fiscal 2019, 2018and 2017 was $1.3 billion, $1.0 billion and $715 million, respectively. As of May 31, 2019, total unrecognized stock-based compensation expense related to non-vested restricted stock-based awards was $2.8 billion and is expectedto be recognized over the remaining weighted-average vesting period of 2.68 years.
No PSUs were granted in each of fiscal 2019 and 2018. In fiscal 2017, 1.7 million PSUs were granted which vestupon the attainment of certain performance metrics and service-based vesting. Based upon actual attainmentrelative to the �target� performance metric, certain participants have the ability to be issued up to 150% of thetarget number of PSUs originally granted, or to be issued no PSUs at all. In fiscal 2019, 2.4 million PSUs vested and1.3 million PSUs remained outstanding as of May 31, 2019.

ORACLE CORPORATIONNOTES TO CONSOLIDATED FINANCIAL STATEMENTS�(Continued)
May 31, 2019
104
The following table summarizes stock option activity, including SOs and PSOs, and includes awards grantedpursuant to the 2000 Plan and stock plans assumed from our acquisitions for our last three fiscal years ended May31, 2019:
Options Outstanding
(in millions, except exercise price)Shares UnderStock Option
Weighted-AverageExercise Price
Balance, May 31, 2016. . . . . . . . . . . . . . . . . . . . . . . . . . . . . . . . . . . . . . . . . . . . . . . . . . . . . . . . . . . . 375 $ 29.66Granted(1) . . . . . . . . . . . . . . . . . . . . . . . . . . . . . . . . . . . . . . . . . . . . . . . . . . . . . . . . . . . . . . . . . . . . . 18 $ 40.90Assumed . . . . . . . . . . . . . . . . . . . . . . . . . . . . . . . . . . . . . . . . . . . . . . . . . . . . . . . . . . . . . . . . . . . . . . 2 $ 13.06Exercised . . . . . . . . . . . . . . . . . . . . . . . . . . . . . . . . . . . . . . . . . . . . . . . . . . . . . . . . . . . . . . . . . . . . . . (77) $ 26.65Canceled . . . . . . . . . . . . . . . . . . . . . . . . . . . . . . . . . . . . . . . . . . . . . . . . . . . . . . . . . . . . . . . . . . . . . . (6) $ 36.28
Balance, May 31, 2017. . . . . . . . . . . . . . . . . . . . . . . . . . . . . . . . . . . . . . . . . . . . . . . . . . . . . . . . . . . . 312 $ 29.02Granted(2) . . . . . . . . . . . . . . . . . . . . . . . . . . . . . . . . . . . . . . . . . . . . . . . . . . . . . . . . . . . . . . . . . . . . . 77 $ 50.95Exercised . . . . . . . . . . . . . . . . . . . . . . . . . . . . . . . . . . . . . . . . . . . . . . . . . . . . . . . . . . . . . . . . . . . . . . (78) $ 28.78Canceled . . . . . . . . . . . . . . . . . . . . . . . . . . . . . . . . . . . . . . . . . . . . . . . . . . . . . . . . . . . . . . . . . . . . . . (7) $ 45.70
Balance, May 31, 2018. . . . . . . . . . . . . . . . . . . . . . . . . . . . . . . . . . . . . . . . . . . . . . . . . . . . . . . . . . . . 304 $ 36.11Granted . . . . . . . . . . . . . . . . . . . . . . . . . . . . . . . . . . . . . . . . . . . . . . . . . . . . . . . . . . . . . . . . . . . . . . . 7 $ 43.47Exercised . . . . . . . . . . . . . . . . . . . . . . . . . . . . . . . . . . . . . . . . . . . . . . . . . . . . . . . . . . . . . . . . . . . . . . (72) $ 28.32Canceled . . . . . . . . . . . . . . . . . . . . . . . . . . . . . . . . . . . . . . . . . . . . . . . . . . . . . . . . . . . . . . . . . . . . . . (17) $ 49.28
Balance, May 31, 2019. . . . . . . . . . . . . . . . . . . . . . . . . . . . . . . . . . . . . . . . . . . . . . . . . . . . . . . . . . . . 222 $ 37.78
(1) 6.75 million SOs were granted in total during fiscal 2017 to our Chief Executive Officers and Chief Technology Officer and have contractual lives offive years versus the ten-year contractual lives for most of the other SOs granted.
(2) Awards granted in fiscal 2018 included 66.5 million PSOs granted in total to our Chief Executive Officers, Chief Technology Officer, and formerPresident, Product Development, the contractual terms of which are described in greater detail above.
Stock options outstanding that have vested and that are expected to vest as of May 31, 2019 were as follows:
OutstandingStock Options(in millions)
Weighted-AverageExercise Price
Weighted-AverageRemaining Contract
Term(in years)
AggregateIntrinsic Value(1)(in millions)
Vested . . . . . . . . . . . . . . . . . . . . . . . . . . . . . 146 $ 32.13 3.32 $ 2,698Expected to vest(2) . . . . . . . . . . . . . . . . 42 $ 46.95 6.47 181
Total . . . . . . . . . . . . . . . . . . . . . . . . . . . 188 $ 35.45 4.02 $ 2,879
(1) The aggregate intrinsic value was calculated based on the gross difference between our closing stock price on the last trading day of fiscal 2019 of$50.60 and the exercise prices for all �in-the-money� options outstanding, excluding tax effects.
(2) The unrecognized compensation expense calculated under the fair value method for shares expected to vest (unvested shares net of expectedforfeitures) as of May 31, 2019 was approximately $254 million and is expected to be recognized over a weighted-average period of 2.74 years.Approximately 34 million shares outstanding as of May 31, 2019 were not expected to vest.
Stock-Based Compensation Expense and Valuations of Stock Awards
We estimated the fair values of our restricted stock-based awards that are solely subject to service-based vestingrequirements based upon their market values as of the grant dates, discounted for the present values of expecteddividends.
The fair values of our PSUs were also measured based upon their market values as of their respective grant dates,discounted for the present values of expected dividends. The vesting conditions and related terms of our PSUswere communicated to each participating employee as of their respective grant dates and included attainmentmetrics that were defined, fixed and based upon consistent U.S. GAAP metrics or internal metrics that are defined,fixed and consistently determined, and that require the employee to render service. Therefore, these awards metthe performance-based award classification criteria as defined within ASC 718.
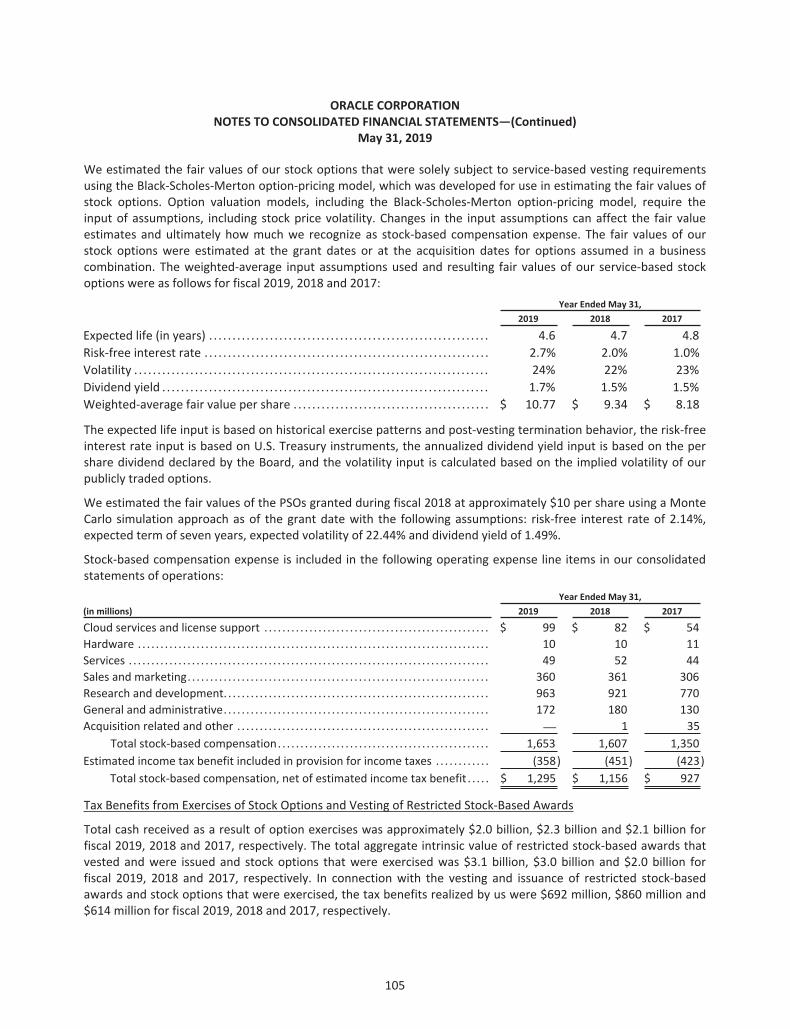
ORACLE CORPORATIONNOTES TO CONSOLIDATED FINANCIAL STATEMENTS�(Continued)
May 31, 2019
105
We estimated the fair values of our stock options that were solely subject to service-based vesting requirementsusing the Black-Scholes-Merton option-pricing model, which was developed for use in estimating the fair values ofstock options. Option valuation models, including the Black-Scholes-Merton option-pricing model, require theinput of assumptions, including stock price volatility. Changes in the input assumptions can affect the fair valueestimates and ultimately how much we recognize as stock-based compensation expense. The fair values of ourstock options were estimated at the grant dates or at the acquisition dates for options assumed in a businesscombination. The weighted-average input assumptions used and resulting fair values of our service-based stockoptions were as follows for fiscal 2019, 2018 and 2017:
Year Ended May 31,2019 2018 2017
Expected life (in years) . . . . . . . . . . . . . . . . . . . . . . . . . . . . . . . . . . . . . . . . . . . . . . . . . . . . . . . . . . . . 4.6 4.7 4.8Risk-free interest rate . . . . . . . . . . . . . . . . . . . . . . . . . . . . . . . . . . . . . . . . . . . . . . . . . . . . . . . . . . . . . 2.7% 2.0% 1.0%Volatility . . . . . . . . . . . . . . . . . . . . . . . . . . . . . . . . . . . . . . . . . . . . . . . . . . . . . . . . . . . . . . . . . . . . . . . . . . . . 24% 22% 23%Dividend yield . . . . . . . . . . . . . . . . . . . . . . . . . . . . . . . . . . . . . . . . . . . . . . . . . . . . . . . . . . . . . . . . . . . . . . 1.7% 1.5% 1.5%Weighted-average fair value per share . . . . . . . . . . . . . . . . . . . . . . . . . . . . . . . . . . . . . . . . . . $ 10.77 $ 9.34 $ 8.18
The expected life input is based on historical exercise patterns and post-vesting termination behavior, the risk-freeinterest rate input is based on U.S. Treasury instruments, the annualized dividend yield input is based on the pershare dividend declared by the Board, and the volatility input is calculated based on the implied volatility of ourpublicly traded options.
We estimated the fair values of the PSOs granted during fiscal 2018 at approximately $10 per share using a MonteCarlo simulation approach as of the grant date with the following assumptions: risk-free interest rate of 2.14%,expected term of seven years, expected volatility of 22.44% and dividend yield of 1.49%.
Stock-based compensation expense is included in the following operating expense line items in our consolidatedstatements of operations:
Year Ended May 31,(in millions) 2019 2018 2017
Cloud services and license support . . . . . . . . . . . . . . . . . . . . . . . . . . . . . . . . . . . . . . . . . . . . . . . . . . $ 99 $ 82 $ 54Hardware . . . . . . . . . . . . . . . . . . . . . . . . . . . . . . . . . . . . . . . . . . . . . . . . . . . . . . . . . . . . . . . . . . . . . . . . . . . . . . 10 10 11Services . . . . . . . . . . . . . . . . . . . . . . . . . . . . . . . . . . . . . . . . . . . . . . . . . . . . . . . . . . . . . . . . . . . . . . . . . . . . . . . . 49 52 44Sales and marketing. . . . . . . . . . . . . . . . . . . . . . . . . . . . . . . . . . . . . . . . . . . . . . . . . . . . . . . . . . . . . . . . . . . 360 361 306Research and development. . . . . . . . . . . . . . . . . . . . . . . . . . . . . . . . . . . . . . . . . . . . . . . . . . . . . . . . . . . 963 921 770General and administrative. . . . . . . . . . . . . . . . . . . . . . . . . . . . . . . . . . . . . . . . . . . . . . . . . . . . . . . . . . . 172 180 130Acquisition related and other . . . . . . . . . . . . . . . . . . . . . . . . . . . . . . . . . . . . . . . . . . . . . . . . . . . . . . . . � 1 35
Total stock-based compensation. . . . . . . . . . . . . . . . . . . . . . . . . . . . . . . . . . . . . . . . . . . . . . . 1,653 1,607 1,350Estimated income tax benefit included in provision for income taxes . . . . . . . . . . . . (358) (451) (423)
Total stock-based compensation, net of estimated income tax benefit . . . . . $ 1,295 $ 1,156 $ 927
Tax Benefits from Exercises of Stock Options and Vesting of Restricted Stock-Based Awards
Total cash received as a result of option exercises was approximately $2.0 billion, $2.3 billion and $2.1 billion forfiscal 2019, 2018 and 2017, respectively. The total aggregate intrinsic value of restricted stock-based awards thatvested and were issued and stock options that were exercised was $3.1 billion, $3.0 billion and $2.0 billion forfiscal 2019, 2018 and 2017, respectively. In connection with the vesting and issuance of restricted stock-basedawards and stock options that were exercised, the tax benefits realized by us were $692 million, $860 million and$614 million for fiscal 2019, 2018 and 2017, respectively.

ORACLE CORPORATIONNOTES TO CONSOLIDATED FINANCIAL STATEMENTS�(Continued)
May 31, 2019
106
Employee Stock Purchase Plan
We have an Employee Stock Purchase Plan (Purchase Plan) that allows employees to purchase shares of commonstock at a price per share that is 95% of the fair market value of Oracle stock as of the end of the semi-annualoption period. As of May 31, 2019, 46 million shares were reserved for future issuances under the Purchase Plan.We issued 2 million shares in fiscal 2019 and 3 million shares in each of fiscal 2018 and 2017, respectively, underthe Purchase Plan.
Defined Contribution and Other Postretirement Plans
We offer various defined contribution plans for our U.S. and non-U.S. employees. Total defined contribution planexpense was $380 million, $384 million and $366 million for fiscal 2019, 2018 and 2017, respectively.
In the U.S., regular employees can participate in the Oracle Corporation 401(k) Savings and Investment Plan(Oracle 401(k) Plan). Participants can generally contribute up to 40% of their eligible compensation on a per-pay-period basis as defined by the Oracle 401(k) Plan document or by the section 402(g) limit as defined by the U.S.Internal Revenue Service (IRS). We match a portion of employee contributions, currently 50% up to 6% ofcompensation each pay period, subject to maximum aggregate matching amounts. Our contributions to the Oracle401(k) Plan, net of forfeitures, were $154 million, $151 million and $157 million in fiscal 2019, 2018 and 2017,respectively.
We also offer non-qualified deferred compensation plans to certain employees whereby they may defer a portionof their annual base and/or variable compensation until retirement or a date specified by the employee inaccordance with the plans. Deferred compensation plan assets and liabilities were each approximately $566million and approximately $555 million as of May 31, 2019 and 2018, respectively, and were presented in othernon-current assets and other non-current liabilities in the accompanying consolidated balance sheets.
We sponsor certain defined benefit pension plans that are offered primarily by certain of our foreign subsidiaries.Many of these plans were assumed through our acquisitions or are required by local regulatory requirements. Wemay deposit funds for these plans with insurance companies, third-party trustees, or into government-managedaccounts consistent with local regulatory requirements, as applicable. Our total defined benefit plan pensionexpenses were $90 million, $102 million and $85 million for fiscal 2019, 2018 and 2017, respectively. Theaggregate projected benefit obligation and aggregate net liability (funded status) of our defined benefit plans as ofMay 31, 2019 were $1.2 billion and $821 million, respectively, and as of May 31, 2018 were $1.1 billion and $711million, respectively.
14. INCOME TAXES
Our effective tax rates for each of the periods presented are the result of the mix of income earned in various taxjurisdictions that apply a broad range of income tax rates. The more significant provisions of the Tax Act asapplicable to us are described in Note 1 above under �Impacts of the U.S. Tax Cuts and Jobs Act of 2017.� Duringfiscal 2019, we recorded a net benefit of $389 million in accordance with SAB 118 related to adjustments in ourestimates of the one-time transition tax on certain foreign subsidiary earnings, and the remeasurement of our netdeferred tax assets and liabilities affected by the Tax Act. Our provision for income taxes for fiscal 2019 varied fromthe 21% U.S. statutory rate imposed by the Tax Act primarily due to earnings in foreign operations, state taxes, theU.S. research and development tax credit, settlements with tax authorities, the tax effects of stock-basedcompensation, the Foreign Derived Intangible Income deduction, the tax effect of GILTI, and a reduction to ourtransition tax recorded consistent with the provision of SAB 118. Our provision for income taxes for fiscal 2018varied from the 21% U.S. statutory rate imposed by the Tax Act primarily due to the impacts of the Tax Act uponadoption, state taxes, the U.S. research and development tax credit, settlements with tax authorities, the taxeffects of stock-based compensation and the U.S. domestic production activity deduction. Prior to the January 1,2018 effective date of the Tax Act, our provision for income taxes historically differed from the tax computed at
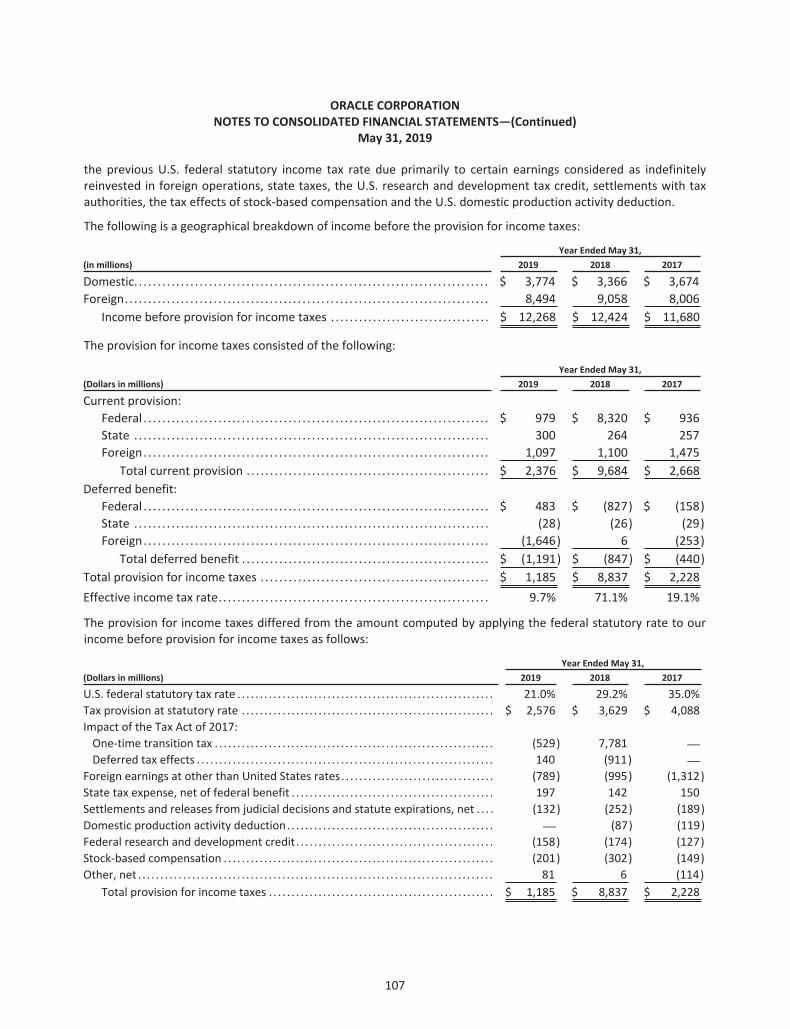
ORACLE CORPORATIONNOTES TO CONSOLIDATED FINANCIAL STATEMENTS�(Continued)
May 31, 2019
107
the previous U.S. federal statutory income tax rate due primarily to certain earnings considered as indefinitelyreinvested in foreign operations, state taxes, the U.S. research and development tax credit, settlements with taxauthorities, the tax effects of stock-based compensation and the U.S. domestic production activity deduction.
The following is a geographical breakdown of income before the provision for income taxes:
Year Ended May 31,(in millions) 2019 2018 2017
Domestic. . . . . . . . . . . . . . . . . . . . . . . . . . . . . . . . . . . . . . . . . . . . . . . . . . . . . . . . . . . . . . . . . . . . . . . . . . . . $ 3,774 $ 3,366 $ 3,674Foreign. . . . . . . . . . . . . . . . . . . . . . . . . . . . . . . . . . . . . . . . . . . . . . . . . . . . . . . . . . . . . . . . . . . . . . . . . . . . . . 8,494 9,058 8,006
Income before provision for income taxes . . . . . . . . . . . . . . . . . . . . . . . . . . . . . . . . . . $ 12,268 $ 12,424 $ 11,680
The provision for income taxes consisted of the following:
Year Ended May 31,(Dollars in millions) 2019 2018 2017
Current provision:Federal . . . . . . . . . . . . . . . . . . . . . . . . . . . . . . . . . . . . . . . . . . . . . . . . . . . . . . . . . . . . . . . . . . . . . . . . . . $ 979 $ 8,320 $ 936State . . . . . . . . . . . . . . . . . . . . . . . . . . . . . . . . . . . . . . . . . . . . . . . . . . . . . . . . . . . . . . . . . . . . . . . . . . . . 300 264 257Foreign. . . . . . . . . . . . . . . . . . . . . . . . . . . . . . . . . . . . . . . . . . . . . . . . . . . . . . . . . . . . . . . . . . . . . . . . . . 1,097 1,100 1,475
Total current provision . . . . . . . . . . . . . . . . . . . . . . . . . . . . . . . . . . . . . . . . . . . . . . . . . . . . $ 2,376 $ 9,684 $ 2,668Deferred benefit:
Federal . . . . . . . . . . . . . . . . . . . . . . . . . . . . . . . . . . . . . . . . . . . . . . . . . . . . . . . . . . . . . . . . . . . . . . . . . . $ 483 $ (827) $ (158)State . . . . . . . . . . . . . . . . . . . . . . . . . . . . . . . . . . . . . . . . . . . . . . . . . . . . . . . . . . . . . . . . . . . . . . . . . . . . (28) (26) (29)Foreign. . . . . . . . . . . . . . . . . . . . . . . . . . . . . . . . . . . . . . . . . . . . . . . . . . . . . . . . . . . . . . . . . . . . . . . . . . (1,646) 6 (253)
Total deferred benefit . . . . . . . . . . . . . . . . . . . . . . . . . . . . . . . . . . . . . . . . . . . . . . . . . . . . . $ (1,191) $ (847) $ (440)Total provision for income taxes . . . . . . . . . . . . . . . . . . . . . . . . . . . . . . . . . . . . . . . . . . . . . . . . . $ 1,185 $ 8,837 $ 2,228Effective income tax rate. . . . . . . . . . . . . . . . . . . . . . . . . . . . . . . . . . . . . . . . . . . . . . . . . . . . . . . . . . 9.7% 71.1% 19.1%
The provision for income taxes differed from the amount computed by applying the federal statutory rate to ourincome before provision for income taxes as follows:
Year Ended May 31,(Dollars in millions) 2019 2018 2017
U.S. federal statutory tax rate . . . . . . . . . . . . . . . . . . . . . . . . . . . . . . . . . . . . . . . . . . . . . . . . . . . . . . . . . 21.0% 29.2% 35.0%Tax provision at statutory rate . . . . . . . . . . . . . . . . . . . . . . . . . . . . . . . . . . . . . . . . . . . . . . . . . . . . . . . . $ 2,576 $ 3,629 $ 4,088Impact of the Tax Act of 2017:One-time transition tax . . . . . . . . . . . . . . . . . . . . . . . . . . . . . . . . . . . . . . . . . . . . . . . . . . . . . . . . . . . . . . (529) 7,781 �Deferred tax effects . . . . . . . . . . . . . . . . . . . . . . . . . . . . . . . . . . . . . . . . . . . . . . . . . . . . . . . . . . . . . . . . . . 140 (911) �
Foreign earnings at other than United States rates. . . . . . . . . . . . . . . . . . . . . . . . . . . . . . . . . . (789) (995) (1,312)State tax expense, net of federal benefit . . . . . . . . . . . . . . . . . . . . . . . . . . . . . . . . . . . . . . . . . . . . . 197 142 150Settlements and releases from judicial decisions and statute expirations, net . . . . (132) (252) (189)Domestic production activity deduction. . . . . . . . . . . . . . . . . . . . . . . . . . . . . . . . . . . . . . . . . . . . . . � (87) (119)Federal research and development credit. . . . . . . . . . . . . . . . . . . . . . . . . . . . . . . . . . . . . . . . . . . . (158) (174) (127)Stock-based compensation . . . . . . . . . . . . . . . . . . . . . . . . . . . . . . . . . . . . . . . . . . . . . . . . . . . . . . . . . . . . (201) (302) (149)Other, net . . . . . . . . . . . . . . . . . . . . . . . . . . . . . . . . . . . . . . . . . . . . . . . . . . . . . . . . . . . . . . . . . . . . . . . . . . . . . . . 81 6 (114)
Total provision for income taxes . . . . . . . . . . . . . . . . . . . . . . . . . . . . . . . . . . . . . . . . . . . . . . . . . . $ 1,185 $ 8,837 $ 2,228

ORACLE CORPORATIONNOTES TO CONSOLIDATED FINANCIAL STATEMENTS�(Continued)
May 31, 2019
108
The components of our deferred tax assets and liabilities were as follows:
May 31,(in millions) 2019 2018
Deferred tax assets:Accruals and allowances . . . . . . . . . . . . . . . . . . . . . . . . . . . . . . . . . . . . . . . . . . . . . . . . . . . . . . . . $ 541 $ 567Employee compensation and benefits . . . . . . . . . . . . . . . . . . . . . . . . . . . . . . . . . . . . . . . . . 646 664Differences in timing of revenue recognition. . . . . . . . . . . . . . . . . . . . . . . . . . . . . . . . . . 322 338Basis of property, plant and equipment and intangible assets. . . . . . . . . . . . . . . 1,238 �Tax credit and net operating loss carryforwards . . . . . . . . . . . . . . . . . . . . . . . . . . . . . . 3,717 2,614
Total deferred tax assets . . . . . . . . . . . . . . . . . . . . . . . . . . . . . . . . . . . . . . . . . . . . . . . . . . . . 6,464 4,183Valuation allowance . . . . . . . . . . . . . . . . . . . . . . . . . . . . . . . . . . . . . . . . . . . . . . . . . . . . . . . . . . . . . (1,266) (1,308)
Total deferred tax assets, net . . . . . . . . . . . . . . . . . . . . . . . . . . . . . . . . . . . . . . . . . . . . . . . 5,198 2,875Deferred tax liabilities:
Unrealized gain on stock . . . . . . . . . . . . . . . . . . . . . . . . . . . . . . . . . . . . . . . . . . . . . . . . . . . . . . . . (78) (78)Acquired intangible assets . . . . . . . . . . . . . . . . . . . . . . . . . . . . . . . . . . . . . . . . . . . . . . . . . . . . . . (973) (1,254)GILTI deferred . . . . . . . . . . . . . . . . . . . . . . . . . . . . . . . . . . . . . . . . . . . . . . . . . . . . . . . . . . . . . . . . . . . . (1,515) �Basis of property, plant and equipment and intangible assets. . . . . . . . . . . . . . . � (158)Other. . . . . . . . . . . . . . . . . . . . . . . . . . . . . . . . . . . . . . . . . . . . . . . . . . . . . . . . . . . . . . . . . . . . . . . . . . . . . . (200) (48)
Total deferred tax liabilities . . . . . . . . . . . . . . . . . . . . . . . . . . . . . . . . . . . . . . . . . . . . . . . . . (2,766) (1,538)Net deferred tax assets . . . . . . . . . . . . . . . . . . . . . . . . . . . . . . . . . . . . . . . . . . . . . . . . . . . . . . $ 2,432 $ 1,337
Recorded as:Non-current deferred tax assets. . . . . . . . . . . . . . . . . . . . . . . . . . . . . . . . . . . . . . . . . . . . . . . . $ 2,696 $ 1,395Non-current deferred tax liabilities (in other non-current liabilities). . . . . . . . (264) (58)
Net deferred tax assets . . . . . . . . . . . . . . . . . . . . . . . . . . . . . . . . . . . . . . . . . . . . . . . . . . . . . . $ 2,432 $ 1,337
We provide for taxes on the undistributed earnings of foreign subsidiaries. We do not provide for taxes on otheroutside basis temporary differences of foreign subsidiaries as they are considered indefinitely reinvested outsidethe U.S. At May 31, 2019, the amount of temporary differences related to other outside basis temporarydifferences of investments in foreign subsidiaries upon which U.S. income taxes have not been provided wasapproximately $7.9 billion. If the other outside basis differences were recognized in a taxable transaction, theywould generate foreign tax credits that would reduce the federal tax liability associated with the foreign dividendor the otherwise taxable transaction. At May 31, 2019, assuming a full utilization of the foreign tax credits, thepotential net deferred tax liability associated with these other outside basis temporary differences would beapproximately $1.5 billion.
Our net deferred tax assets were $2.4 billion and $1.3 billion as of May 31, 2019 and 2018, respectively. Webelieve that it is more likely than not that the net deferred tax assets will be realized in the foreseeable future.Realization of our net deferred tax assets is dependent upon our generation of sufficient taxable income in futureyears in appropriate tax jurisdictions to obtain benefit from the reversal of temporary differences, net operatingloss carryforwards and tax credit carryforwards. The amount of net deferred tax assets considered realizable issubject to adjustment in future periods if estimates of future taxable income change.
The valuation allowance was $1.3 billion at each of May 31, 2019 and 2018. Substantially all of the valuationallowances as of May 31, 2019 and 2018 related to tax assets established in purchase accounting and other taxcredits. Any subsequent reduction of that portion of the valuation allowance and the recognition of the associatedtax benefits associated with our acquisitions will be recorded to our provision for income taxes subsequent to our

ORACLE CORPORATIONNOTES TO CONSOLIDATED FINANCIAL STATEMENTS�(Continued)
May 31, 2019
109
final determination of the valuation allowance or the conclusion of the measurement period (as defined above),whichever comes first.
At May 31, 2019, we had federal net operating loss carryforwards of approximately $732 million, which are subjectto limitation on their utilization. Approximately $690 million of these federal net operating losses expire in variousyears between fiscal 2020 and fiscal 2038. Approximately $42 million of these federal net operating losses are notcurrently subject to expiration dates. We had state net operating loss carryforwards of approximately $2.2 billionat May 31, 2019, which expire between fiscal 2020 and fiscal 2038 and are subject to limitations on theirutilization. We had total foreign net operating loss carryforwards of approximately $2.0 billion at May 31, 2019,which are subject to limitations on their utilization. Approximately $1.9 billion of these foreign net operating lossesare not currently subject to expiration dates. The remainder of the foreign net operating losses, approximately$100 million, expire between fiscal 2020 and fiscal 2039. We had tax credit carryforwards of approximately $1.1billion at May 31, 2019, which are subject to limitations on their utilization. Approximately $734 million of thesetax credit carryforwards are not currently subject to expiration dates. The remainder of the tax creditcarryforwards, approximately $387 million, expire in various years between fiscal 2020 and fiscal 2039.
We classify our unrecognized tax benefits as either current or non-current income taxes payable in theaccompanying consolidated balance sheets. The aggregate changes in the balance of our gross unrecognized taxbenefits, including acquisitions, were as follows:
Year Ended May 31,(in millions) 2019 2018 2017
Gross unrecognized tax benefits as of June 1 . . . . . . . . . . . . . . . . . . . . . . . . . . . . . . . . . . . $ 5,592 $ 4,919 $ 4,561Increases related to tax positions from prior fiscal years . . . . . . . . . . . . . . . . . . . . . . 772 200 128Decreases related to tax positions from prior fiscal years. . . . . . . . . . . . . . . . . . . . . . (135) (65) (218)Increases related to tax positions taken during current fiscal year. . . . . . . . . . . . 540 840 595Settlements with tax authorities . . . . . . . . . . . . . . . . . . . . . . . . . . . . . . . . . . . . . . . . . . . . . . . . . (153) (42) (85)Lapses of statutes of limitation . . . . . . . . . . . . . . . . . . . . . . . . . . . . . . . . . . . . . . . . . . . . . . . . . . . (202) (273) (47)Cumulative translation adjustments and other, net . . . . . . . . . . . . . . . . . . . . . . . . . . . . (66) 13 (15)
Total gross unrecognized tax benefits as of May 31 . . . . . . . . . . . . . . . . . . . . . . . . $ 6,348 $ 5,592 $ 4,919
As of May 31, 2019, 2018 and 2017, $4.2 billion, $4.2 billion and $3.4 billion, respectively, of unrecognized taxbenefits would affect our effective tax rate if recognized. We recognized interest and penalties related to uncertaintax positions in our provision for income taxes line of our consolidated statements of operations of $312 million,$127 million and $125 million during fiscal 2019, 2018 and 2017, respectively. Interest and penalties accrued as ofMay 31, 2019 and 2018 were $1.3 billion and $992 million, respectively.
Domestically, U.S. federal and state taxing authorities are currently examining income tax returns of Oracle andvarious acquired entities for years through fiscal 2017. Many issues are at an advanced stage in the examinationprocess, the most significant of which include the deductibility of certain royalty payments, transfer pricing,extraterritorial income exemptions, domestic production activity, foreign tax credits, and research anddevelopment credits taken. With all of these domestic audit issues considered in the aggregate, we believe that itwas reasonably possible that, as of May 31, 2019, the gross unrecognized tax benefits related to these audits coulddecrease (whether by payment, release, or a combination of both) in the next 12 months by as much as $516million ($357 million net of offsetting tax benefits). Our U.S. federal income tax returns have been examined for allyears prior to fiscal 2010 and we are no longer subject to audit for those periods. Our U.S. state income taxreturns, with some exceptions, have been examined for all years prior to fiscal 2007 and we are no longer subjectto audit for those periods.

ORACLE CORPORATIONNOTES TO CONSOLIDATED FINANCIAL STATEMENTS�(Continued)
May 31, 2019
110
Internationally, tax authorities for numerous non-U.S. jurisdictions are also examining returns affecting ourunrecognized tax benefits. We believe that it was reasonably possible that, as of May 31, 2019, the grossunrecognized tax benefits could decrease (whether by payment, release, or a combination of both) by as much as$186 million ($87 million net of offsetting tax benefits) in the next 12 months related primarily to transfer pricing.With some exceptions, we are generally no longer subject to tax examinations in non-U.S. jurisdictions for yearsprior to fiscal 1997.
We believe that we have adequately provided under GAAP for outcomes related to our tax audits. However, therecan be no assurances as to the possible outcomes or any related financial statement effect thereof. On June 7,2019, the Ninth Circuit Court of Appeals, reversing a previous decision of the U.S. Tax Court, held that the U.S.Treasury Department�s regulations requiring the inclusion of stock-based compensation expense in a taxpayer�scost-sharing calculations were valid. Our financial statements have been prepared consistent with this outcome,but we will continue to monitor any ongoing developments, including the possibility of rehearing or appeal to theU.S. Supreme Court, to determine if future changes are required.
We are under audit by the IRS and various other domestic and foreign tax authorities with regards to income taxand indirect tax matters and are involved in various challenges and litigation in a number of countries, including, inparticular, Australia, Brazil, Canada, India, Indonesia, South Korea, Mexico, Pakistan and Spain, where the amountsunder controversy are significant. In some, although not all cases, we have reserved for potential adjustments toour provision for income taxes and accrual of indirect taxes that may result from examinations by, or anynegotiated agreements with, these tax authorities or final outcomes in judicial proceedings, and we believe thatthe final outcome of these examinations, agreements or judicial proceedings will not have a material effect on ourresults of operations. If events occur which indicate payment of these amounts is unnecessary, the reversal of theliabilities would result in the recognition of benefits in the period we determine the liabilities are no longernecessary. If our estimates of the federal, state, and foreign income tax liabilities and indirect tax liabilities are lessthan the ultimate assessment, it could result in a further charge to expense.

ORACLE CORPORATIONNOTES TO CONSOLIDATED FINANCIAL STATEMENTS�(Continued)
May 31, 2019
111
15. SEGMENT INFORMATION
ASC 280, Segment Reporting, establishes standards for reporting information about operating segments. Operatingsegments are defined as components of an enterprise about which separate financial information is available thatis evaluated regularly by the chief operating decision maker, or decision-making group, in deciding how to allocateresources and in assessing performance. Our chief operating decision makers (CODMs) are our Chief ExecutiveOfficers and Chief Technology Officer. We are organized by line of business and geographically. While our CODMsevaluate results in a number of different ways, the line of business management structure is the primary basis forwhich the allocation of resources and financial results are assessed. The footnote information below presents thefinancial information provided to our CODMs for their review and assists our CODMs with evaluating thecompany�s performance and allocating company resources.
We have three businesses�cloud and license, hardware and services�each of which is comprised of a singleoperating segment. All three of our businesses market and sell our offerings globally to businesses of many sizes,government agencies, educational institutions and resellers with a worldwide sales force positioned to offer thecombinations that best meet customer needs.
Our cloud and license business engages in the sale, marketing and delivery of our applications and infrastructuretechnologies through cloud and on-premise deployment models including our cloud services and license supportofferings; and our cloud license and on-premise license offerings. Cloud services and license support revenues aregenerated from offerings that are typically contracted with customers directly, billed to customers in advance,delivered to customers over time with our revenue recognition occurring over the contractual terms, and renewedby customers upon completion of the contractual terms. Cloud services and license support contracts providecustomers with access to the latest updates to the applications and infrastructure technologies as they becomeavailable and for which the customer contracted and also include related technical support services over thecontractual term. Cloud license and on-premise license revenues represent fees earned from granting customerslicenses, generally on a perpetual basis, to use our database and middleware and our applications softwareproducts within cloud and on-premise IT environments. We generally recognize revenues at the point in time thesoftware is made available to the customer to download and use, which typically is immediately upon signature ofthe license contract. In each fiscal year, our cloud and license business� contractual activities are typically highest inour fourth fiscal quarter and the related cash flows are typically highest in the following quarter (i.e., in the firstfiscal quarter of the next fiscal year) as we receive payments from these contracts.
Our hardware business provides Oracle Engineered Systems, servers, storage, industry-specific hardware,operating systems, virtualization, management and other hardware-related software to support diverse ITenvironments. Our hardware business also includes hardware support, which provides customers with softwareupdates for the software components that are essential to the functionality of the hardware products, such asOracle Solaris and certain other software, and can include product repairs, maintenance services and technicalsupport services.
Our services business provides services to customers and partners to help maximize the performance of theirinvestments in Oracle applications and infrastructure technologies.
We do not track our assets for each business. Consequently, it is not practical to show assets by operatingsegment.

ORACLE CORPORATIONNOTES TO CONSOLIDATED FINANCIAL STATEMENTS�(Continued)
May 31, 2019
112
The following table presents summary results for each of our three businesses for each of fiscal 2019, 2018 and2017:
Year Ended May 31,(in millions) 2019 2018 2017
Cloud and license:Revenues(1) . . . . . . . . . . . . . . . . . . . . . . . . . . . . . . . . . . . . . . . . . . . . . . . . . . . . . . . . . . . . . . . . . . . . . . . . . . $ 32,582 $ 32,041 $ 30,452Cloud services and license support expenses . . . . . . . . . . . . . . . . . . . . . . . . . . . . . . . . . . . . . 3,597 3,441 2,881Sales and marketing expenses . . . . . . . . . . . . . . . . . . . . . . . . . . . . . . . . . . . . . . . . . . . . . . . . . . . . . 7,398 7,213 6,770Margin(2) . . . . . . . . . . . . . . . . . . . . . . . . . . . . . . . . . . . . . . . . . . . . . . . . . . . . . . . . . . . . . . . . . . . . . . . . . . . . . $ 21,587 $ 21,387 $ 20,801
Hardware:Revenues . . . . . . . . . . . . . . . . . . . . . . . . . . . . . . . . . . . . . . . . . . . . . . . . . . . . . . . . . . . . . . . . . . . . . . . . . . . . $ 3,704 $ 3,994 $ 4,152Hardware products and support expenses . . . . . . . . . . . . . . . . . . . . . . . . . . . . . . . . . . . . . . . . 1,327 1,547 1,618Sales and marketing expenses . . . . . . . . . . . . . . . . . . . . . . . . . . . . . . . . . . . . . . . . . . . . . . . . . . . . . 520 643 825Margin(2) . . . . . . . . . . . . . . . . . . . . . . . . . . . . . . . . . . . . . . . . . . . . . . . . . . . . . . . . . . . . . . . . . . . . . . . . . . . . . $ 1,857 $ 1,804 $ 1,709
Services:Revenues . . . . . . . . . . . . . . . . . . . . . . . . . . . . . . . . . . . . . . . . . . . . . . . . . . . . . . . . . . . . . . . . . . . . . . . . . . . . $ 3,240 $ 3,395 $ 3,359Services expenses. . . . . . . . . . . . . . . . . . . . . . . . . . . . . . . . . . . . . . . . . . . . . . . . . . . . . . . . . . . . . . . . . . . 2,703 2,729 2,661Margin(2) . . . . . . . . . . . . . . . . . . . . . . . . . . . . . . . . . . . . . . . . . . . . . . . . . . . . . . . . . . . . . . . . . . . . . . . . . . . . . $ 537 $ 666 $ 698
Totals:Revenues(1) . . . . . . . . . . . . . . . . . . . . . . . . . . . . . . . . . . . . . . . . . . . . . . . . . . . . . . . . . . . . . $ 39,526 $ 39,430 $ 37,963Expenses . . . . . . . . . . . . . . . . . . . . . . . . . . . . . . . . . . . . . . . . . . . . . . . . . . . . . . . . . . . . . . . . 15,545 15,573 14,755Margin(2) . . . . . . . . . . . . . . . . . . . . . . . . . . . . . . . . . . . . . . . . . . . . . . . . . . . . . . . . . . . . . . . . $ 23,981 $ 23,857 $ 23,208
(1) Cloud and license revenues presented for management reporting included revenues related to cloud and license obligations that would haveotherwise been recorded by the acquired businesses as independent entities but were not recognized in our consolidated statements of operationsfor the periods presented due to business combination accounting requirements. See Note 9 for an explanation of these adjustments and the tablebelow for a reconciliation of our total operating segment revenues to our total consolidated revenues as reported in our consolidated statementsof operations.
(2) The margins reported reflect only the direct controllable costs of each line of business and do not include allocations of product development,general and administrative and certain other allocable expenses, net. Additionally, the margins reported above do not reflect amortization ofintangible assets, acquisition related and other expenses, restructuring expenses, stock-based compensation, interest expense or non-operatingincome, net. Refer to the table below for a reconciliation of our total margin for operating segments to our income before provision for incometaxes as reported per our consolidated statements of operations.

ORACLE CORPORATIONNOTES TO CONSOLIDATED FINANCIAL STATEMENTS�(Continued)
May 31, 2019
113
The following table reconciles total operating segment revenues to total revenues as well as total operatingsegment margin to income before provision for income taxes:
Year Ended May 31,(in millions) 2019 2018 2017
Total revenues for operating segments. . . . . . . . . . . . . . . . . . . . . . . . . . . . . . . . . . . . . . . . . . . . . . . . . . $ 39,526 $ 39,430 $ 37,963Cloud and license revenues(1). . . . . . . . . . . . . . . . . . . . . . . . . . . . . . . . . . . . . . . . . . . . . . . . . . . . . . . . . . . . . (20) (47) (171)
Total revenues . . . . . . . . . . . . . . . . . . . . . . . . . . . . . . . . . . . . . . . . . . . . . . . . . . . . . . . . . . . . . . . . . . . . . . $ 39,506 $ 39,383 $ 37,792
Total margin for operating segments . . . . . . . . . . . . . . . . . . . . . . . . . . . . . . . . . . . . . . . . . . . . . . . . . . . . $ 23,981 $ 23,857 $ 23,208Cloud and license revenues(1). . . . . . . . . . . . . . . . . . . . . . . . . . . . . . . . . . . . . . . . . . . . . . . . . . . . . . . . . . . . . (20) (47) (171)Research and development . . . . . . . . . . . . . . . . . . . . . . . . . . . . . . . . . . . . . . . . . . . . . . . . . . . . . . . . . . . . . . (6,026) (6,084) (6,153)General and administrative. . . . . . . . . . . . . . . . . . . . . . . . . . . . . . . . . . . . . . . . . . . . . . . . . . . . . . . . . . . . . . . (1,265) (1,282) (1,172)Amortization of intangible assets . . . . . . . . . . . . . . . . . . . . . . . . . . . . . . . . . . . . . . . . . . . . . . . . . . . . . . . . (1,689) (1,620) (1,451)Acquisition related and other . . . . . . . . . . . . . . . . . . . . . . . . . . . . . . . . . . . . . . . . . . . . . . . . . . . . . . . . . . . . (44) (52) (103)Restructuring . . . . . . . . . . . . . . . . . . . . . . . . . . . . . . . . . . . . . . . . . . . . . . . . . . . . . . . . . . . . . . . . . . . . . . . . . . . . . . (443) (588) (463)Stock-based compensation for operating segments . . . . . . . . . . . . . . . . . . . . . . . . . . . . . . . . . . . . (518) (505) (415)Expense allocations and other, net . . . . . . . . . . . . . . . . . . . . . . . . . . . . . . . . . . . . . . . . . . . . . . . . . . . . . . (441) (415) (367)Interest expense . . . . . . . . . . . . . . . . . . . . . . . . . . . . . . . . . . . . . . . . . . . . . . . . . . . . . . . . . . . . . . . . . . . . . . . . . . (2,082) (2,025) (1,798)Non-operating income, net. . . . . . . . . . . . . . . . . . . . . . . . . . . . . . . . . . . . . . . . . . . . . . . . . . . . . . . . . . . . . . . 815 1,185 565
Income before provision for income taxes . . . . . . . . . . . . . . . . . . . . . . . . . . . . . . . . . . . . . . . . $ 12,268 $ 12,424 $ 11,680
(1) Cloud and license revenues presented for management reporting included revenues related to cloud and license obligations that would haveotherwise been recorded by the acquired businesses as independent entities but were not recognized in our consolidated statements of operationsfor the periods presented due to business combination accounting requirements. See Note 9 for an explanation of these adjustments and this tablefor a reconciliation of our total operating segment revenues to our total revenues as reported in our consolidated statements of operations.
Disaggregation of Revenues
We have considered information that is regularly reviewed by our CODMs in evaluating financial performance, anddisclosures presented outside of our financial statements in our earnings releases and used in investorpresentations to disaggregate revenues to depict how the nature, amount, timing and uncertainty of revenues andcash flows are affected by economic factors. The principal category we use to disaggregate revenues is the natureof our products and services as presented in our consolidated statements of operations.
The following table is a summary of our total revenues by geographic region. The relative proportion of our totalrevenues between each geographic region as presented in the table below was materially consistent across eachof our operating segments� revenues for each of fiscal 2019, 2018 and 2017:
Year Ended May 31,(in millions) 2019 2018 2017
Americas. . . . . . . . . . . . . . . . . . . . . . . . . . . . . . . . . . . . . . . . . . . . . . . . . . . . . . . . . . . . . . . . . . . . . . . . . . . . $ 21,856 $ 21,648 $ 21,121EMEA(1) . . . . . . . . . . . . . . . . . . . . . . . . . . . . . . . . . . . . . . . . . . . . . . . . . . . . . . . . . . . . . . . . . . . . . . . . . . . . . 11,270 11,409 10,614Asia Pacific. . . . . . . . . . . . . . . . . . . . . . . . . . . . . . . . . . . . . . . . . . . . . . . . . . . . . . . . . . . . . . . . . . . . . . . . . . 6,380 6,326 6,057
Total revenues . . . . . . . . . . . . . . . . . . . . . . . . . . . . . . . . . . . . . . . . . . . . . . . . . . . . . . . . . . . . . . . $ 39,506 $ 39,383 $ 37,792
(1) Comprised of Europe, the Middle East and Africa

ORACLE CORPORATIONNOTES TO CONSOLIDATED FINANCIAL STATEMENTS�(Continued)
May 31, 2019
114
The following table presents a summary of our cloud and license business revenues by ecosystem. Applicationsecosystem revenues represent the sum of applications related cloud services and license support revenues; andapplications related license revenues. Infrastructure ecosystem revenues represent the sum of infrastructurerelated cloud services and license support revenues; and infrastructure related license revenues.
Year Ended May 31,(in millions) 2019 2018 2017
Applications revenues . . . . . . . . . . . . . . . . . . . . . . . . . . . . . . . . . . . . . . . . . . . . . . . . . . . . . . . . . . . . . . . . . . . . $ 11,491 $ 11,023 $ 9,933Infrastructure revenues. . . . . . . . . . . . . . . . . . . . . . . . . . . . . . . . . . . . . . . . . . . . . . . . . . . . . . . . . . . . . . . . . . . 21,071 20,971 20,348
Total cloud and license revenues . . . . . . . . . . . . . . . . . . . . . . . . . . . . . . . . . . . . . . . . . . . . . . . . . . $ 32,562 $ 31,994 $ 30,281
Geographic Information
Disclosed in the table below is geographic information for each country that comprised greater than three percentof our total revenues for any of fiscal 2019, 2018 or 2017.
As of and for the Year Ended May 31,2019 2018 2017
(in millions) RevenuesLong-LivedAssets(1) Revenues
Long-LivedAssets(1) Revenues
Long-LivedAssets(1)
United States . . . . . . . . . . . . . . . . . . . . . . . . . . . . . . . . $ 18,596 $ 5,318 $ 18,330 $ 4,976 $ 17,856 $ 4,680United Kingdom. . . . . . . . . . . . . . . . . . . . . . . . . . . . . 2,054 423 2,093 510 1,988 402Japan . . . . . . . . . . . . . . . . . . . . . . . . . . . . . . . . . . . . . . . . 1,848 422 1,716 388 1,619 380Germany. . . . . . . . . . . . . . . . . . . . . . . . . . . . . . . . . . . . . 1,583 263 1,526 179 1,415 116Canada. . . . . . . . . . . . . . . . . . . . . . . . . . . . . . . . . . . . . . . 1,166 87 1,200 78 1,102 60Other countries . . . . . . . . . . . . . . . . . . . . . . . . . . . . . 14,259 1,356 14,518 1,223 13,812 1,090
Total . . . . . . . . . . . . . . . . . . . . . . . . . . . . . . . . . . . . . $ 39,506 $ 7,869 $ 39,383 $ 7,354 $ 37,792 $ 6,728
(1) Long-lived assets exclude goodwill, intangible assets, equity investments and deferred taxes, which are not allocated to specific geographiclocations as it is impracticable to do so.

ORACLE CORPORATIONNOTES TO CONSOLIDATED FINANCIAL STATEMENTS�(Continued)
May 31, 2019
115
16. EARNINGS PER SHARE
Basic earnings per share is computed by dividing net income for the period by the weighted-average number ofcommon shares outstanding during the period. Diluted earnings per share is computed by dividing net income for theperiod by the weighted-average number of common shares outstanding during the period, plus the dilutive effect ofoutstanding restricted stock-based awards, stock options, and shares issuable under the employee stock purchaseplan using the treasury stock method. The following table sets forth the computation of basic and diluted earningsper share:
Year Ended May 31,(in millions, except per share data) 2019 2018 2017
Net income. . . . . . . . . . . . . . . . . . . . . . . . . . . . . . . . . . . . . . . . . . . . . . . . . . . . . . . . . . . . . . . . . . . . . . . . . . . . . . . . $ 11,083 $ 3,587 $ 9,452Weighted average common shares outstanding . . . . . . . . . . . . . . . . . . . . . . . . . . . . . . . . . . . . . . 3,634 4,121 4,115Dilutive effect of employee stock plans . . . . . . . . . . . . . . . . . . . . . . . . . . . . . . . . . . . . . . . . . . . . . . . . 98 117 102Dilutive weighted average common shares outstanding . . . . . . . . . . . . . . . . . . . . . . . . . . . . . 3,732 4,238 4,217Basic earnings per share . . . . . . . . . . . . . . . . . . . . . . . . . . . . . . . . . . . . . . . . . . . . . . . . . . . . . . . . . . . . . . . . . $ 3.05 $ 0.87 $ 2.30Diluted earnings per share . . . . . . . . . . . . . . . . . . . . . . . . . . . . . . . . . . . . . . . . . . . . . . . . . . . . . . . . . . . . . . $ 2.97 $ 0.85 $ 2.24Shares subject to anti-dilutive restricted stock-based awards and stock optionsexcluded from calculation(1). . . . . . . . . . . . . . . . . . . . . . . . . . . . . . . . . . . . . . . . . . . . . . . . . . . . . . . . . . . . 71 64 74
(1) These weighted shares relate to anti-dilutive restricted stock-based awards and stock options as calculated using the treasury stock method andcontingently issuable shares under PSO and PSU agreements. Such shares could be dilutive in the future. See Note 13 for information regarding theexercise prices of our outstanding, unexercised stock options.
17. LEGAL PROCEEDINGS
Hewlett-Packard Company Litigation
On June 15, 2011, Hewlett-Packard Company, now Hewlett Packard Enterprise Company (HP), filed a complaint inthe California Superior Court, County of Santa Clara against Oracle Corporation alleging numerous causes of actionincluding breach of contract, breach of the covenant of good faith and fair dealing, defamation, intentionalinterference with prospective economic advantage, and violation of the California Unfair Business Practices Act.The complaint alleged that when Oracle announced on March 22 and 23, 2011 that it would no longer developfuture versions of its software to run on HP�s Itanium-based servers, it breached a settlement agreement signed onSeptember 20, 2010 between HP and Mark Hurd (the Hurd Settlement Agreement), who is our Chief ExecutiveOfficer and was both HP�s former chief executive officer and chairman of HP�s board of directors. HP sought ajudicial declaration of the parties� rights and obligations under the Hurd Settlement Agreement and otherequitable and monetary relief. Oracle answered the complaint and filed cross-claims.
After a bench trial on the meaning of the Hurd Settlement Agreement, the court found that the Hurd SettlementAgreement required Oracle to continue to develop certain of its software products for use on HP�s Itanium-basedservers at no cost to HP. The case proceeded to a jury trial in May 2016. On June 30, 2016, the jury returned averdict in favor of HP on its claims for breach of contract and breach of the implied covenant of good faith and fairdealing and against Oracle on its cross-claims. The jury awarded HP $3.0 billion in damages. Under the court�srulings, HP is entitled to post-judgment interest, but not pre-judgment interest, on this award.
After the trial court denied Oracle�s motion for a new trial, Oracle filed a notice of appeal on January 17, 2017. OnFebruary 2, 2017, HP filed a notice of appeal of the trial court�s denial of pre-judgment interest.
Oracle has posted a bond for the amounts owing. No amounts have been paid or recorded to our results ofoperations. We continue to believe that we have meritorious defenses against HP�s claims, and we intend topresent these defenses to the appellate court. Oracle filed its opening brief on March 7, 2019. Briefing on theappeal is scheduled to be completed by October 2019, and the appellate court has not scheduled a date for oral

ORACLE CORPORATIONNOTES TO CONSOLIDATED FINANCIAL STATEMENTS�(Continued)
May 31, 2019
116
argument. We cannot currently estimate a reasonably possible range of loss for this action due to the complexitiesand uncertainty surrounding the appeal process and the nature of the claims. Litigation is inherentlyunpredictable, and the outcome of the appeal process related to this action is uncertain. It is possible that theresolution of this action could have a material impact on our future cash flows and results of operations.
Derivative Litigation Concerning Oracle�s NetSuite Acquisition
On May 3, 2017, a stockholder derivative lawsuit was filed in the Court of Chancery of the State of Delaware, andon July 18, 2017, a second stockholder derivative lawsuit was filed in the same court. The second case was broughtby an alleged stockholder of Oracle, purportedly on Oracle�s behalf. The suit was brought against all the then-current members and one former member of our Board of Directors, and Oracle as a nominal defendant. Plaintiffalleges that the defendants breached their fiduciary duties by causing Oracle to agree to purchase NetSuite Inc. atan excessive price. Plaintiff seeks declaratory relief, unspecified monetary damages (including interest), andattorneys� fees and costs.
On August 9, 2017, the court consolidated the two derivative cases. In a September 7, 2017 order, the courtappointed plaintiff�s counsel in the second case as lead plaintiffs� counsel and designated the July 18, 2017complaint as the operative complaint. The defendants filed a motion to dismiss on October 27, 2017, and afterbriefing and argument, the court denied this motion on March 19, 2018. The parties stipulated that all of theindividual defendants, except for our Chief Technology Officer and one of our Chief Executive Officers, should bedismissed from this case without prejudice, and on March 28, 2018, the court approved this stipulation. On May 4,2018, the remaining defendants answered plaintiff�s complaint.
On May 4, 2018, the Board of Directors established a Special Litigation Committee (the SLC) to investigate theallegations in this derivative action. Three outside directors serve on the SLC. On July 24, 2018, the court enteredan order granting the SLC�s motion to stay this case for six months. The stay has been extended twice and is due toexpire on August 15, 2019. The SLC and the two individual defendants are scheduled to participate in a mediationon July 2, 2019.
While Oracle continues to evaluate these claims, we do not believe this litigation will have a material impact onour financial position or results of operations.
Securities Class Action and Derivative Litigation Concerning Oracle�s Cloud Business
On August 10, 2018, a putative class action, brought by an alleged stockholder of Oracle, was filed in the U.S.District Court for the Northern District of California against us, our Chief Technology Officer, our two ChiefExecutive Officers, two other Oracle executives, and one former Oracle executive. On December 21, 2018, thecourt granted plaintiff�s motion that it be appointed lead plaintiff and approving its selection of lead plaintiff�scounsel. On March 8, 2019, plaintiff filed an amended complaint. Plaintiff alleges that the defendants made or areresponsible for false and misleading statements regarding Oracle�s cloud business. Plaintiff further alleges that theformer Oracle executive engaged in insider trading. Plaintiff seeks a ruling that this case may proceed as a classaction, and seeks damages, attorneys� fees and costs, and unspecified declaratory/injunctive relief. On April 19,2019, defendants moved to dismiss plaintiff�s amended complaint, and on May 31, 2019, plaintiff filed anopposition. We believe that we have meritorious defenses against this action, and we will continue to vigorouslydefend it.
On February 12, 2019, a stockholder derivative lawsuit was filed in the U.S. District Court for the Northern Districtof California. The derivative suit is brought by two alleged stockholders of Oracle, purportedly on Oracle�s behalf,against all members of our Board of Directors, and Oracle as a nominal defendant. Plaintiffs claim that the allegedactions described in the August 10, 2018 class action discussed above caused harm to Oracle, and that Oracle�sBoard members violated their fiduciary duties of care, loyalty, reasonable inquiry, and good faith by failing to

ORACLE CORPORATIONNOTES TO CONSOLIDATED FINANCIAL STATEMENTS�(Continued)
May 31, 2019
117
prevent this alleged harm. Plaintiffs also allege that defendants� actions constitute gross mismanagement, waste,and securities fraud. Plaintiffs seek a ruling that this case may proceed as a derivative action, a finding thatdefendants are liable for breaching their fiduciary duties, an order directing defendants to enact corporatereforms, attorneys� fees and costs, and unspecified equitable relief. On April 26, 2019, the court approved a stay ofthis action, which will be lifted if the class action discussed above is dismissed, if the motion to dismiss the classaction is denied, or if either party voluntarily chooses to lift the stay.
On May 8, 2019, a second derivative action was filed in the U.S. District Court for the Northern District ofCalifornia. The derivative suit is brought by an alleged stockholder of Oracle, purportedly on Oracle�s behalf,against our Chief Technology Officer, our two Chief Executive Officers, one former Oracle executive, and Oracle asa nominal defendant. Plaintiff claims that the alleged actions described in the August 10, 2018 class actiondiscussed above caused harm to Oracle, and plaintiff raises further allegations of impropriety relating to Oracle�sstock buybacks and acquisition of NetSuite Inc. Plaintiff asserts claims for violation of securities laws, violation offiduciary duties, contribution and indemnification. Plaintiff seeks a ruling that the case may proceed as a derivativeaction, and seeks damages, declaratory and other equitable relief, attorneys� and expert fees and costs. On June 4,2019, the court issued an order finding that this case was related to the derivative case above and staying the caseunder the court�s prior stay order.
While Oracle continues to evaluate these claims, we do not believe this litigation will have a material impact onour financial position or results of operations.
Other Litigation
We are party to various other legal proceedings and claims, either asserted or unasserted, which arise in theordinary course of business, including proceedings and claims that relate to acquisitions we have completed or tocompanies we have acquired or are attempting to acquire. While the outcome of these matters cannot bepredicted with certainty, we do not believe that the outcome of any of these matters, individually or in theaggregate, will result in losses that are materially in excess of amounts already recognized, if any.

118
SCHEDULE II
ORACLE CORPORATIONVALUATION AND QUALIFYING ACCOUNTS
(in millions)BeginningBalance
AdditionsCharged to
Operations orOther Accounts Write-offs
TranslationAdjustmentsand Other
EndingBalance
Allowances for Doubtful Trade ReceivablesYear Ended:
May 31, 2017 . . . . . . . . . . . . . . . . . . . . . . . . . . . . . . . . . . . $ 327 $ 129 $ (138) $ 1 $ 319May 31, 2018 . . . . . . . . . . . . . . . . . . . . . . . . . . . . . . . . . . . $ 319 $ 146 $ (98) $ 3 $ 370May 31, 2019 . . . . . . . . . . . . . . . . . . . . . . . . . . . . . . . . . . . $ 370 $ 190 $ (188) $ (1) $ 371
Item 16. Form 10-K Summary
None.

119
ORACLE CORPORATIONINDEX OF EXHIBITS
The following exhibits are filed or furnished herewith or are incorporated by reference to exhibits previously filedwith the U.S. Securities and Exchange Commission.
Incorporated by ReferenceExhibitNo. Exhibit Description Form File No. Exhibit
FilingDate Filed By
3.01 Amended and Restated Certificate ofIncorporation of Oracle Corporation andCertificate of Amendment of Amendedand Restated Certificate ofIncorporation of Oracle Corporation
8-K 12G3 000-51788 3.01 2/6/06 Oracle Corporation
3.02 Amended and Restated Bylaws of OracleCorporation
8-K 001-35992 3.02 6/16/16 Oracle Corporation
4.01 Specimen Certificate of OracleCorporation�s Common Stock
S-3 ASR 333-166643 4.04 5/7/10 Oracle Corporation
4.02 Indenture dated January 13, 2006,among Ozark Holding Inc., OracleCorporation and Citibank, N.A.
8-K 000-14376 10.34 1/20/06 Oracle SystemsCorporation
4.03 First Supplemental Indenture dated May9, 2007 among Oracle Corporation,Citibank, N.A. and The Bank of New YorkTrust Company, N.A.
S-3 ASR 333-142796 4.3 5/10/07 Oracle Corporation
4.04 Form of 6.50% Note due 2038, togetherwith Officers� Certificate issued April 9,2008 setting forth the terms of the Note
8-K 000-51788 4.09 4/8/08 Oracle Corporation
4.05 Forms of 5.00% Note due 2019 and6.125% Note due 2039, together withOfficers� Certificate issued July 8, 2009setting forth the terms of the Notes
8-K 000-51788 4.08 7/8/09 Oracle Corporation
4.06 Forms of Original 2020 Note andOriginal 2040 Note, together withOfficers� Certificate issued July 19, 2010setting forth the terms of the Notes
10-Q 000-51788 4.08 9/20/10 Oracle Corporation
4.07 Forms of New 2020 Note and New 2040Note
S-4 333-176405 4.5 8/19/11 Oracle Corporation

120
Incorporated by ReferenceExhibitNo. Exhibit Description Form File No. Exhibit
FilingDate Filed By
4.08 Forms of 2.50% Note due 2022, togetherwith Officers� Certificate issued October25, 2012 setting forth the terms of theNote
8-K 000-51788 4.10 10/25/12 Oracle Corporation
4.09 Forms of 2.25% Note due 2021 and3.125% Note due 2025, together withOfficers� Certificate issued July 10, 2013setting forth the terms of the Notes
8-K 001-35992 4.11 7/10/13 Oracle Corporation
4.10 Forms of Floating-Rate Note due 2019,2.375% Note due 2019 and 3.625% Notedue 2023, together with Officers�Certificate issued July 16, 2013 settingforth the terms of the Notes
8-K 001-35992 4.12 7/16/13 Oracle Corporation
4.11 Forms of Floating-Rate Note due 2019,2.25% Note due 2019, 2.80% Note due2021, 3.40% Note due 2024, 4.30% Notedue 2034 and 4.50% Note due 2044,together with Officers� Certificate issuedJuly 8, 2014 setting forth the terms ofthe Notes
8-K 001-35992 4.13 7/8/14 Oracle Corporation
4.12 Forms of 2.50% Notes due 2022, 2.95%Notes due 2025, 3.25% Notes due 2030,3.90% Notes due 2035, 4.125% Notesdue 2045 and 4.375% Notes due 2055,together with Officers� Certificate issuedMay 5, 2015 setting forth the terms ofthe Notes
8-K 001-35992 4.13 5/5/15 Oracle Corporation
4.13 Forms of 1.90% Notes due 2021, 2.40%Notes due 2023, 2.65% Notes due 2026,3.85% Notes due 2036 and 4.00% Notesdue 2046, together with Officers�Certificate issued July 7, 2016 settingforth the terms of the Notes
8-K 001-35992 4.1 7/7/16 Oracle Corporation
4.14 Form of 2.625% Notes due 2023, 2.950%Notes due 2024, 3.250% Notes due2027, 3.800% Notes due 2037 and4.000% Notes due 2047, together withOfficers� Certificate issued November 9,2017 setting forth the terms of theNotes
8-K 001-35992 4.1 11/9/17 Oracle Corporation

121
Incorporated by ReferenceExhibitNo. Exhibit Description Form File No. Exhibit
FilingDate Filed By
4.15� Description of Oracle Corporation�sSecurities Registered Under Section 12of the Exchange Act
10.01* Oracle Corporation DeferredCompensation Plan, as amended andrestated as of July 1, 2015
10-Q 001-35992 10.01 9/18/15 Oracle Corporation
10.02* Oracle Corporation Employee StockPurchase Plan (1992), as amended andrestated as of October 1, 2009
10-K 000-51788 10.02 7/1/10 Oracle Corporation
10.03* Oracle Corporation Amended andRestated 1993 Directors� Stock Plan, asamended and restated on April 29, 2016
10-K 001-35992 10.03 6/22/16 Oracle Corporation
10.04* Amended and Restated 2000 Long-TermEquity Incentive Plan, as approved onNovember 15, 2017
8-K 001-35992 10.04 11/17/17 Oracle Corporation
10.05* Form of Stock Option Agreement underthe Amended and Restated 2000 Long-Term Equity Incentive Plan for U.S.Executive Vice Presidents and Section 16Officers
10-Q 001-35992 10.05 9/18/17 Oracle Corporation
10.06* Form of Stock Option Agreement underthe Oracle Corporation Amended andRestated 1993 Directors� Stock Plan
10-K 001-35992 10.06 6/25/15 Oracle Corporation
10.07* Form of Indemnity Agreement forDirectors and Executive Officers
10-Q 000-51788 10.07 12/23/11 Oracle Corporation
10.08* Offer letter dated September 2, 2010 toMark V. Hurd and employmentagreement dated September 3, 2010
8-K 000-51788 10.28 9/8/10 Oracle Corporation
10.09* Oracle Corporation Amended andRestated Executive Bonus Plan, asamended and restated as of February12, 2019
10-Q 001-35992 10.09 3/18/19 Oracle Corporation
10.10* Oracle Corporation Stock Unit AwardDeferred Compensation Plan, asamended and restated as of July 1, 2015
10-Q 001-35992 10.15 9/18/15 Oracle Corporation

122
Incorporated by ReferenceExhibitNo. Exhibit Description Form File No. Exhibit
FilingDate Filed By
10.11* Form of Performance-Based Stock UnitAward Agreement under the Amendedand Restated 2000 Long-Term EquityIncentive Plan for Section 16 Officers
10-Q 001-35992 10.16 9/23/14 Oracle Corporation
10.12* Form of Restricted Stock Unit AwardAgreement under the OracleCorporation Amended and Restated1993 Directors� Stock Plan
10-K 001-35992 10.17 6/25/15 Oracle Corporation
10.13* Form of Performance-Based StockOption Agreement under the Amendedand Restated 2000 Long-Term EquityIncentive Plan for Named ExecutiveOfficers
10-Q 001-35992 10.16 9/18/17 Oracle Corporation
10.14* Form of Stock Unit Award Agreementunder the Amended and Restated 2000Long-Term Equity Incentive Plan for U.S.Employees (Including Section 16Officers)
10-Q 001-35992 10.17 9/18/17 Oracle Corporation
21.01� Subsidiaries of the Registrant
23.01� Consent of Independent RegisteredPublic Accounting Firm
31.01� Rule 13a-14(a)/15d-14(a) Certification ofPrincipal Executive Officer
31.02� Rule 13a-14(a)/15d-14(a) Certification ofPrincipal Executive and Financial Officer
32.01� Section 1350 Certification of PrincipalExecutive Officers and Principal FinancialOfficer

123
Incorporated by ReferenceExhibitNo. Exhibit Description Form File No. Exhibit
FilingDate Filed By
101� Interactive Data Files Pursuant to Rule405 of Regulation S-T: (1) ConsolidatedBalance Sheets as of May 31, 2019 and2018, (2) Consolidated Statements ofOperations for the years ended May 31,2019, 2018 and 2017, (3) ConsolidatedStatements of Comprehensive Incomefor the years ended May 31, 2019, 2018and 2017, (4) Consolidated Statementsof Equity for the years ended May 31,2019, 2018 and 2017, (5) ConsolidatedStatements of Cash Flows for the yearsended May 31, 2019, 2018 and 2017, (6)Notes to Consolidated FinancialStatements and (7) Financial StatementSchedule II
* Indicates management contract or compensatory plan or arrangement.
� Filed herewith.
� Furnished herewith.

124
SIGNATURES
Pursuant to the requirements of Section 13 or 15(d) of the Securities Exchange Act of 1934, the registrant has dulycaused this report to be signed on its behalf by the undersigned, thereunto duly authorized.
ORACLE CORPORATION
Date: June 21, 2019 By: /s/ SAFRA A. CATZSafra A. CatzChief Executive Officer and Director(Principal Executive and Financial Officer)
Date: June 21, 2019 By: /s/ MARK V. HURDMark V. HurdChief Executive Officer and Director(Principal Executive Officer)
Pursuant to the requirements of the Securities Exchange Act of 1934, this report has been signed by the followingpersons on behalf of the Registrant and in the capacities and on the date indicated.
Name Title Date
/s/ SAFRA A. CATZ June 21, 2019Safra A. Catz
Chief Executive Officer and Director(Principal Executive and Financial Officer)
/s/ MARK V. HURD June 21, 2019Mark V. Hurd
Chief Executive Officer and Director(Principal Executive Officer)
/s/ WILLIAM COREYWEST June 21, 2019William Corey West
Executive Vice President, CorporateController and Chief Accounting Officer(Principal Accounting Officer)
/s/ LAWRENCE J. ELLISON June 21, 2019Lawrence J. Ellison
Chairman of the Board of Directors andChief Technology Officer
/s/ JEFFREY O. HENLEY Vice Chairman of the Board of Directors June 21, 2019Jeffrey O. Henley
/s/ JEFFREY S. BERG Director June 21, 2019Jeffrey S. Berg
/s/ MICHAEL J. BOSKIN Director June 21, 2019Michael J. Boskin
/s/ BRUCE R. CHIZEN Director June 21, 2019Bruce R. Chizen
/s/ GEORGE H. CONRADES Director June 21, 2019George H. Conrades
/s/ HECTOR GARCIA-MOLINA Director June 21, 2019Hector Garcia-Molina
/s/ RENÉE J. JAMES Director June 21, 2019Renée J. James/s/ CHARLESW.MOORMAN IV Director June 21, 2019Charles W. Moorman IV
/s/ LEON E. PANETTA Director June 21, 2019Leon E. Panetta
/s/ WILLIAM G. PARRETT Director June 21, 2019William G. Parrett
/s/ NAOMI O. SELIGMAN Director June 21, 2019Naomi O. Seligman