united states securities and exchange … and exchange commission washington, ... all adjustments...
TRANSCRIPT
UNITED STATES
SECURITIES AND EXCHANGE COMMISSION
Washington, D.C. 20549
FORM 10-Q
QUARTERLY REPORT PURSUANT TO SECTION 13 OR 15(D) OF THE
SECURITIES EXCHANGE ACT OF 1934
For the quarterly period ended June 30, 2008
Commission File Number: 001 – 31524
BROOKFIELD HOMES CORPORATION
(Exact Name of Registrant as Specified in Its Charter)
Delaware
(State or Other Jurisdiction of
Incorporation or Organization)
37-1446709
(I.R.S. Employer
Identification No.)
8500 Executive Park Avenue
Suite 300
Fairfax, Virginia
(Address of Principal Executive Offices)
22031
(Zip Code)
(703) 270-1700
(Registrant's Telephone Number, Including Area Code)
Indicate by check mark whether the registrant (1) has filed all reports required to be filed by Section 13 or 15(d) of the
Securities Exchange Act of 1934 during the preceding 12 months (or for such shorter period that the registrant was
required to file such reports) and (2) has been subject to such filing requirements for the past 90 days.
Yes No
Indicate by check mark whether the registrant is a large accelerated filer, an accelerated filer, a non-accelerated filer or a
smaller reporting company. See the definitions of “large accelerated filer,” “accelerated filer” and “smaller reporting
company” in Rule 12b-2 of the Exchange Act.
Large accelerated filer Accelerated filer
Non-accelerated filer (Do not check if a smaller reporting company) Smaller reporting company
Indicate by check mark whether the registrant is a shell company (as defined in Rule 12b-2 of the Exchange Act).
Yes No
As of August 1, 2008 the registrant had outstanding 26,663,413 shares of its common stock, $0.01 par value per share.
INDEX
BROOKFIELD HOMES CORPORATION
PART I. FINANCIAL INFORMATION PAGE
Item 1. Financial Statements
Consolidated Balance Sheets – June 30, 2008 and
December 31, 2007 .............................................................................
1
Consolidated Statements of Income – Three Months and
Six Months Ended June 30, 2008 and 2007 ........................................
2
Consolidated Statements of Stockholders’ Equity – Six Months
Ended June 30, 2008 and 2007 ...........................................................
3
Consolidated Statements of Cash Flows – Three Months and
Six Months Ended June 30, 2008 and 2007 ........................................
4
Notes to the Consolidated Financial Statements .................................... 5
Item 2. Management’s Discussion and Analysis of Financial
Condition and Results of Operations ..............................................
16
Item 3. Quantitative and Qualitative Disclosures about Market Risk .......... 23
Item 4. Controls and Procedures ..................................................................... 23
PART II. OTHER INFORMATION
Item 1. Legal Proceedings ................................................................................. 24
Item 1A. Risk Factors .......................................................................................... 24
Item 2. Unregistered Sales of Equity Securities and Use of Proceeds ........... 24
Item 3. Defaults Upon Senior Securities .......................................................... 24
Item 4. Submission of Matters to a Vote of Security Holders ....................... 24
Item 5. Other Information ................................................................................ 24
Item 6. Exhibits.................................................................................................. 24
SIGNATURES .................................................................................................. 25
EXHIBITS

1
PART I. FINANCIAL INFORMATION
Item 1. Financial Statements
BROOKFIELD HOMES CORPORATION
CONSOLIDATED BALANCE SHEETS
(all dollar amounts are in thousands of U.S. dollars)
(Unaudited)
June 30, December 31,
Note 2008 2007
Assets
Housing and land inventory .......................................................................... 2 $ 1,142,331 $ 1,078,229
Investments in housing and land joint ventures ............................................ 3 99,950 130,546
Consolidated land inventory not owned........................................................ 2 9,448 26,748
Receivables and other assets ......................................................................... 51,626 50,066
Cash and cash equivalents ............................................................................ – 9,132
Deferred income taxes .................................................................................. 7 50,885 55,943
$ 1,354,240 $ 1,350,664
Liabilities and Equity
Project specific and other financings ............................................................ 4 $ 791,863 $ 734,572
Accounts payable and other liabilities .......................................................... 5 140,017 159,956
Minority interest ........................................................................................... 2 69,354 76,486
Preferred stock – 10,000,000 shares authorized, no shares issued ................ – –
Common – 65,000,000 shares authorized, 32,073,781 shares issued
(December 31, 2007 – 32,073,781 shares issued) .........................................
321
321
Additional paid-in-capital ............................................................................. 145,101 145,101
Treasury stock, at cost – 5,410,368 shares (December 31, 2007 –
5,410,368 shares) ......................................................................................
(243,701)
(243,701)
Retained earnings .......................................................................................... 451,285 477,929
$ 1,354,240 $ 1,350,664
See accompanying notes to financial statements

2
BROOKFIELD HOMES CORPORATION
CONSOLIDATED STATEMENTS OF INCOME
(all dollar amounts are in thousands of U.S. dollars, except per share amounts)
(Unaudited) (Unaudited)
Three Months Ended Six Months Ended
June 30, June 30,
Revenue Note 2008 2007 2008 2007
Housing ......................................................................... $ 115,235 $ 154,632 $ 181,641 $ 258,672
Land .............................................................................. 4,525 2,720 7,811 6,239
119,760 157,352 189,452 264,911
Direct cost of sales ............................................................. 2 (105,288) (129,062) (164,644) (215,643)
Impairments and write-offs of option deposits ................... 2 (16,651) – (22,801) –
(2,179) 28,290 2,007 49,268
Equity in earnings from housing and land joint
ventures ...................................................................
3
2,385
56
2,424
380
Impairment of investments in housing and land joint
ventures ...................................................................
3
(10,000)
–
(10,000)
–
Other (expense) / income .............................................. 9(c) 8,613 5,306 (417) 5,693
Selling, general and administrative expense ................. (15,087) (17,518) (31,692) (34,030)
Operating (Loss) / Income ................................................ (16,268) 16,134 (37,678) 21,311
Minority interest ........................................................... 2,020 (763) 3,306 (928)
(Loss) / Income Before Taxes (14,248) 15,371 (34,372) 20,383
Income tax recovery / (expense) 5,413 (5,841) 13,061 17,807
Net (Loss) / Income ........................................................... $ (8,835) $ 9,530 $ (21,311) $ 38,190
(Loss) / Earnings Per Share
Basic ............................................................................. 6 $ (0.33) $ 0.36 $ (0.80) $ 1.43
Diluted .......................................................................... 6 $ (0.33) $ 0.35 $ (0.80) $ 1.42
Weighted Average Common Shares Outstanding
(in thousands)
Basic ............................................................................. 6 26,663 26,628 26,663 26,621
Diluted .......................................................................... 6 26,663 26,886 26,663 26,890
See accompanying notes to financial statements
3
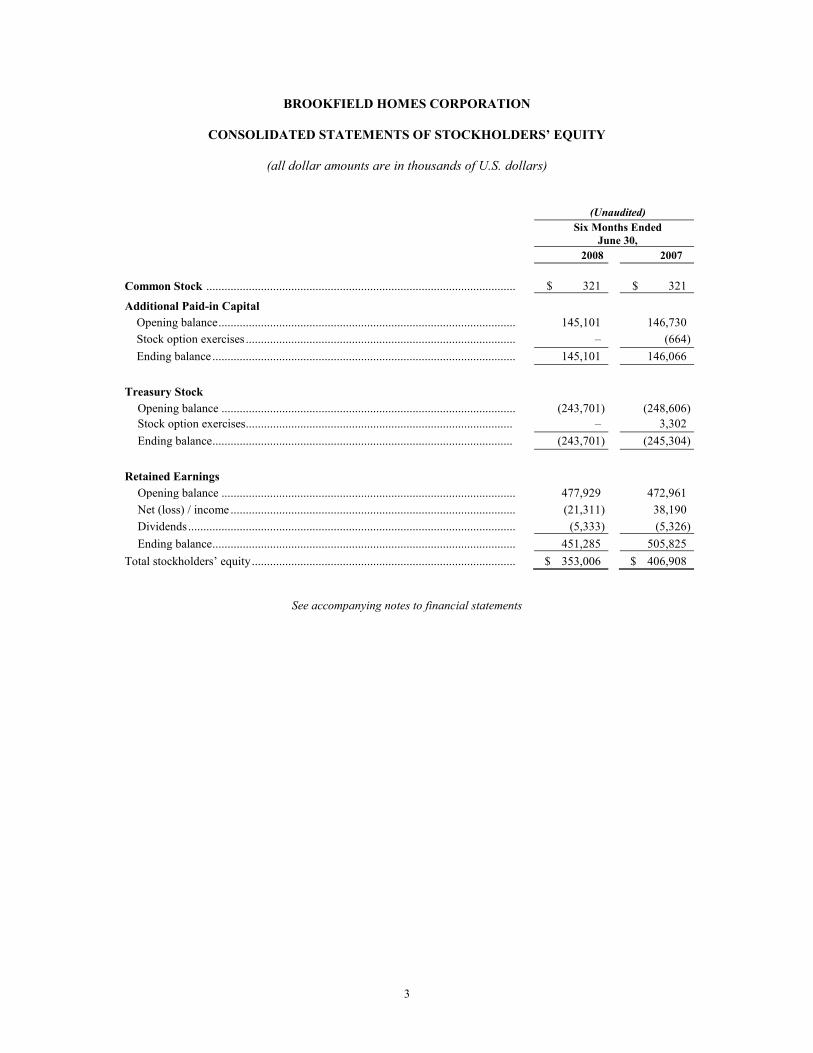
BROOKFIELD HOMES CORPORATION
CONSOLIDATED STATEMENTS OF STOCKHOLDERS’ EQUITY
(all dollar amounts are in thousands of U.S. dollars)
(Unaudited)
Six Months Ended
June 30,
2008 2007
Common Stock ...................................................................................................... $ 321 $ 321
Additional Paid-in Capital
Opening balance .................................................................................................. 145,101 146,730
Stock option exercises ......................................................................................... – (664)
Ending balance .................................................................................................... 145,101 146,066
Treasury Stock
Opening balance ................................................................................................. (243,701) (248,606)
Stock option exercises ........................................................................................ – 3,302
Ending balance ................................................................................................... (243,701) (245,304)
Retained Earnings
Opening balance ................................................................................................. 477,929 472,961
Net (loss) / income .............................................................................................. (21,311) 38,190
Dividends ............................................................................................................ (5,333) (5,326)
Ending balance .................................................................................................... 451,285 505,825
Total stockholders’ equity ....................................................................................... $ 353,006 $ 406,908
See accompanying notes to financial statements
4
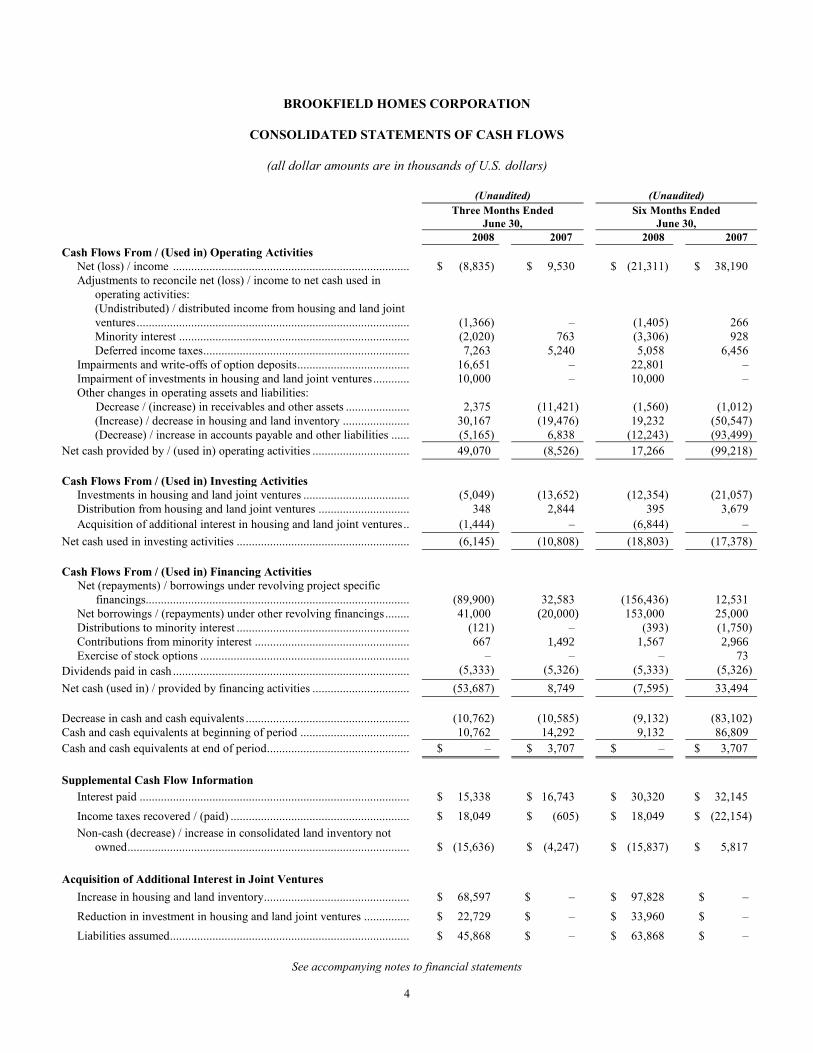
BROOKFIELD HOMES CORPORATION
CONSOLIDATED STATEMENTS OF CASH FLOWS
(all dollar amounts are in thousands of U.S. dollars)
(Unaudited) (Unaudited)
Three Months Ended
June 30,
Six Months Ended
June 30,
2008 2007 2008 2007
Cash Flows From / (Used in) Operating Activities
Net (loss) / income .............................................................................. $ (8,835) $ 9,530 $ (21,311) $ 38,190
Adjustments to reconcile net (loss) / income to net cash used in
operating activities:
(Undistributed) / distributed income from housing and land joint
ventures ..........................................................................................
(1,366)
–
(1,405)
266
Minority interest ............................................................................ (2,020) 763 (3,306) 928
Deferred income taxes .................................................................... 7,263 5,240 5,058 6,456
Impairments and write-offs of option deposits ..................................... 16,651 – 22,801 –
Impairment of investments in housing and land joint ventures ............ 10,000 – 10,000 –
Other changes in operating assets and liabilities:
Decrease / (increase) in receivables and other assets ..................... 2,375 (11,421) (1,560) (1,012)
(Increase) / decrease in housing and land inventory ...................... 30,167 (19,476) 19,232 (50,547)
(Decrease) / increase in accounts payable and other liabilities ...... (5,165) 6,838 (12,243) (93,499)
Net cash provided by / (used in) operating activities ................................ 49,070 (8,526) 17,266 (99,218)
Cash Flows From / (Used in) Investing Activities
Investments in housing and land joint ventures ................................... (5,049) (13,652) (12,354) (21,057)
Distribution from housing and land joint ventures .............................. 348 2,844 395 3,679
Acquisition of additional interest in housing and land joint ventures .. (1,444) – (6,844) –
Net cash used in investing activities ......................................................... (6,145) (10,808) (18,803) (17,378)
Cash Flows From / (Used in) Financing Activities
Net (repayments) / borrowings under revolving project specific
financings.......................................................................................
(89,900)
32,583
(156,436)
12,531
Net borrowings / (repayments) under other revolving financings ........ 41,000 (20,000) 153,000 25,000
Distributions to minority interest ......................................................... (121) – (393) (1,750)
Contributions from minority interest ................................................... 667 1,492 1,567 2,966
Exercise of stock options ..................................................................... – – – 73
Dividends paid in cash .............................................................................. (5,333) (5,326) (5,333) (5,326)
Net cash (used in) / provided by financing activities ................................ (53,687) 8,749 (7,595) 33,494
Decrease in cash and cash equivalents ...................................................... (10,762) (10,585) (9,132) (83,102)
Cash and cash equivalents at beginning of period .................................... 10,762 14,292 9,132 86,809
Cash and cash equivalents at end of period............................................... $ – $ 3,707 $ – $ 3,707
Supplemental Cash Flow Information
Interest paid ......................................................................................... $ 15,338 $ 16,743 $ 30,320 $ 32,145
Income taxes recovered / (paid) ........................................................... $ 18,049 $ (605) $ 18,049 $ (22,154)
Non-cash (decrease) / increase in consolidated land inventory not
owned .............................................................................................
$ (15,636)
$ (4,247)
$ (15,837)
$ 5,817
Acquisition of Additional Interest in Joint Ventures
Increase in housing and land inventory ................................................ $ 68,597 $ – $ 97,828 $ –
Reduction in investment in housing and land joint ventures ............... $ 22,729 $ – $ 33,960 $ –
Liabilities assumed ............................................................................... $ 45,868 $ – $ 63,868 $ –
See accompanying notes to financial statements
BROOKFIELD HOMES CORPORATION
NOTES TO THE CONSOLIDATED FINANCIAL STATEMENTS
(Tabular amounts in thousands of U.S. dollars except per share amounts)
5
Note 1. Significant Accounting Policies
(a) Basis of Presentation
Brookfield Homes Corporation (the “Company” or “Brookfield Homes”) was incorporated on August 28, 2002 as a
wholly-owned subsidiary of Brookfield Properties Corporation (“Brookfield Properties”) to acquire as of October 1,
2002 all of the California and Washington D.C. Area homebuilding and land development operations (the “Land and
Housing Operations”) of Brookfield Properties pursuant to a reorganization of its business (the “Spin-off”). On January
6, 2003, Brookfield Properties completed the Spin-off by distributing all of the issued and outstanding common stock it
owned in the Company to its common stockholders. Brookfield Homes began trading as a separate company on the New
York Stock Exchange on January 7, 2003.
These consolidated financial statements include the accounts of Brookfield Homes and its subsidiaries and investments in
joint ventures and variable interests in which the Company is the primary beneficiary.
The accompanying unaudited consolidated financial statements have been prepared in accordance with accounting
principles generally accepted in the United States for interim financial information. Since they do not include all of the
information and footnotes required by accounting principles generally accepted in the United States of America for
complete financial statements, they should be read in conjunction with the Company’s consolidated financial statements
and footnotes thereto included in the Company’s annual report on Form 10-K/A for the year ended December 31, 2007.
In the opinion of management, all adjustments necessary for fair presentation of the accompanying consolidated
financial statements have been made.
The Company historically has experienced, and expects to continue to experience, variability in quarterly results. The
consolidated statements of income for the three months and six months ended June 30, 2008 are not necessarily
indicative of the results to be expected for the full year.
The preparation of financial statements in conformity with accounting principles generally accepted in the United States
of America requires management to make estimates and assumptions that affect the amounts reported in the financial
statements and accompanying notes. Actual results could differ from those estimates.
(b) Recent Accounting Pronouncements
In December 2007, the United States Financial Accounting Standards Board (“FASB”) issued Statement of Financial
Accounting Standards (“SFAS”) 160 “Non-controlling Interests in Consolidated Financial Statements.” SFAS 160
clarifies the accounting for non-controlling interests and establishes accounting and reporting standards for the non-
controlling interest in a subsidiary, including classification as a component of stockholders equity. This statement is
effective for fiscal years beginning on or after December 15, 2008 (the Company’s fiscal year beginning January 1,
2009). The Company is currently reviewing the impact, if any, that SFAS 160 may have on its consolidated financial
statements.
In December 2007, FASB issued SFAS 141R, “Business Combinations” which replaces the previous version of SFAS
141. SFAS 141R provides revised guidance for recognizing and measuring identifiable assets and goodwill acquired,
liabilities assumed, and any non-controlling interests in the acquiree as a result of business combinations. The revised
standard also provides disclosure requirements to enable users of the financial statements to evaluate the nature and
financial effects of the business combination. SFAS 141R is effective for fiscal years beginning on or after December 15,
2008 (the Company’s fiscal year beginning January 1, 2009). The Company is currently reviewing the impact, if any,
that SFAS 141R may have on its consolidated financial statements.
In February 2007, FASB issued SFAS 159, “The Fair Value Option for Financial Assets and Financial Liabilities.” SFAS
159 allows companies to choose to measure certain financial instruments and other items at fair value. Companies
electing the fair value option are required to report subsequent changes in fair value in earnings. This Statement was
effective for the Company’s fiscal year beginning January 1, 2008. The Company did not elect the fair value option for
any of its financial assets or financial liabilities in FAS 159 and the standard has had no impact on the Company’s
consolidated financial statements.
BROOKFIELD HOMES CORPORATION
NOTES TO THE CONSOLIDATED FINANCIAL STATEMENTS
(Tabular amounts in thousands of U.S. dollars except per share amounts)
6
In September 2006, the FASB issued SFAS 157, “Fair Value Measurements.” SFAS 157 defines fair value, establishes a
framework for measuring fair value in generally accepted accounting principles, and expands disclosures about fair value
measurements. Effective January 1, 2008, the Company adopted SFAS 157. SFAS 157 specifies a hierarchy of valuation
techniques that are based on observable and unobservable inputs. Observable inputs reflect readily obtainable data from
independent sources, while unobservable inputs reflect our market assumptions. The three levels of the hierarchy are as
follows: level 1 inputs are derived from quoted prices for identical instruments in active markets, level 2 inputs are
derived from quoted prices for similar instruments in active markets, quoted prices for identical or similar instruments in
markets that are not active, and model-derived valuations whose inputs are observable or whose significant value drivers
are observable; level 3 inputs are derived from instruments with primarily unobservable value drivers. See Notes 2 and 8
for fair value disclosure.
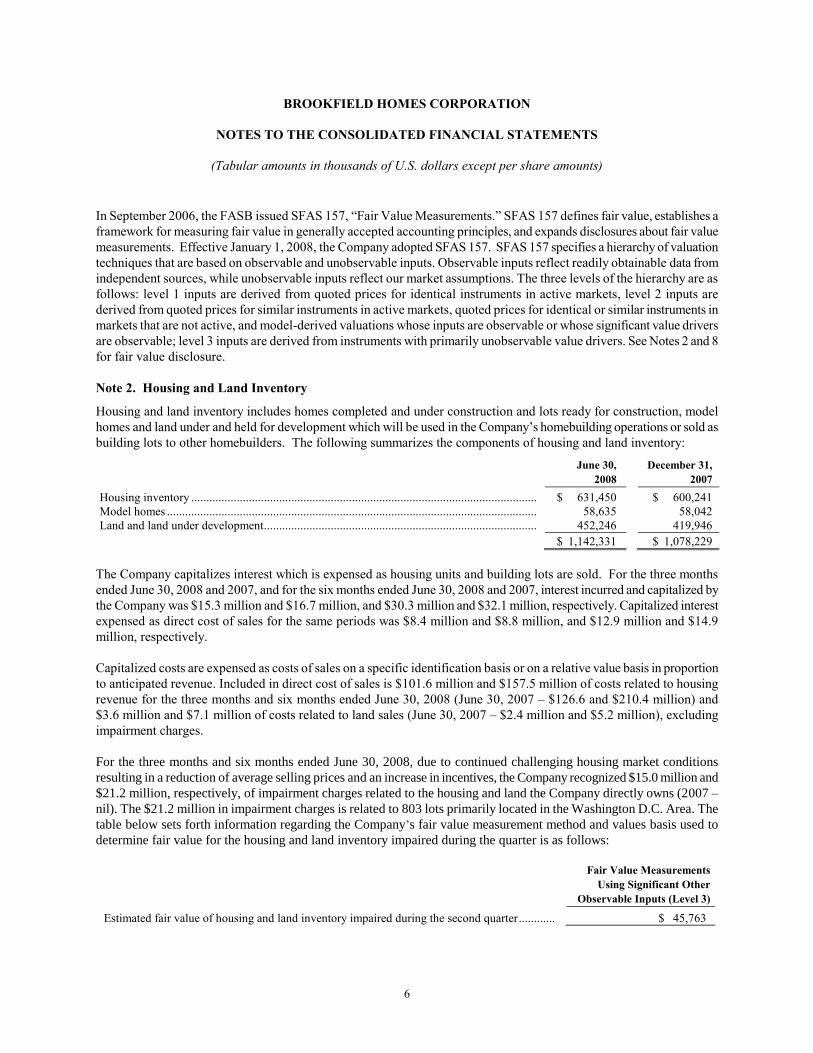
Note 2. Housing and Land Inventory
Housing and land inventory includes homes completed and under construction and lots ready for construction, model
homes and land under and held for development which will be used in the Company’s homebuilding operations or sold as
building lots to other homebuilders. The following summarizes the components of housing and land inventory:
June 30, December 31,
2008 2007
Housing inventory .................................................................................................................. $ 631,450 $ 600,241
Model homes .......................................................................................................................... 58,635 58,042
Land and land under development .......................................................................................... 452,246 419,946
$ 1,142,331 $ 1,078,229
The Company capitalizes interest which is expensed as housing units and building lots are sold. For the three months
ended June 30, 2008 and 2007, and for the six months ended June 30, 2008 and 2007, interest incurred and capitalized by
the Company was $15.3 million and $16.7 million, and $30.3 million and $32.1 million, respectively. Capitalized interest
expensed as direct cost of sales for the same periods was $8.4 million and $8.8 million, and $12.9 million and $14.9
million, respectively.
Capitalized costs are expensed as costs of sales on a specific identification basis or on a relative value basis in proportion
to anticipated revenue. Included in direct cost of sales is $101.6 million and $157.5 million of costs related to housing
revenue for the three months and six months ended June 30, 2008 (June 30, 2007 – $126.6 and $210.4 million) and
$3.6 million and $7.1 million of costs related to land sales (June 30, 2007 – $2.4 million and $5.2 million), excluding
impairment charges.
For the three months and six months ended June 30, 2008, due to continued challenging housing market conditions
resulting in a reduction of average selling prices and an increase in incentives, the Company recognized $15.0 million and
$21.2 million, respectively, of impairment charges related to the housing and land the Company directly owns (2007 –
nil). The $21.2 million in impairment charges is related to 803 lots primarily located in the Washington D.C. Area. The
table below sets forth information regarding the Company’s fair value measurement method and values basis used to
determine fair value for the housing and land inventory impaired during the quarter is as follows:
Fair Value Measurements
Using Significant Other
Observable Inputs (Level 3)
Estimated fair value of housing and land inventory impaired during the second quarter ............ $ 45,763

BROOKFIELD HOMES CORPORATION
NOTES TO THE CONSOLIDATED FINANCIAL STATEMENTS
(Tabular amounts in thousands of U.S. dollars except per share amounts)
7
In accordance with the provisions of SFAS 144, housing and land inventory with a carrying amount of $60.8 million was
written down to its fair value of $45.8 million, resulting in an impairment charge of $15.0 million, which was included in
earnings for the period.
The fair value measurements for housing and land inventory was determined by comparing the carrying amount of an
asset to cash flows expected to be generated by the asset. To arrive at the estimated fair value of housing and land
inventory impaired during the second quarter, the Company estimated the cash flow for the life of each project. These
projections take into account the specific business plans for each project and management's best estimate of the most
probable set of economic conditions anticipated to prevail in the market area. Such projections generally assume current
home selling prices, with cost estimates and sales rates for short-term projects consistent with recent sales activity. For
longer-term projects, planned sales rates for 2008 and 2009 assume recent sales activity and normalized sales rates
beyond 2009. If the future undiscounted cash flows are less than the carrying amount, the asset is considered to be
impaired. If the assets are considered to be impaired, they are then written down to fair value less estimated selling
costs. In addition, when assessing fair value, the Company also calculates a static residual value analysis, which is
assessed in conjunction with a discounted cash flow analysis.
In the ordinary course of business, the Company has entered into a number of option contracts to acquire lots in
future in accordance with specific terms and conditions. Under these option agreements, the Company will advance
deposits to secure the right to purchase land or lots at a future point in time. The Company has evaluated its option
contracts and determined that for those entities considered to be variable interest entities ("VIEs"), it is the primary
beneficiary of options for 25 lots with an aggregate exercise price of $9.4 million (December 31, 2007 – 204 lots with an
aggregate exercise price of $26.7 million), which are required to be consolidated. In these cases, the only asset recorded
is the Company’s exercise price for the option to purchase, with an increase in minority interest of $6.0 million
(December 31, 2007 – $21.8 million) for the assumed third party investment in the VIE. Where the land sellers are not
required to provide the Company financial information related to the VIE, certain assumptions by the Company were
required in its assessment as to whether or not it is the primary beneficiary.
Housing and land inventory includes non-refundable deposits and other entitlement costs totaling $59.8 million
(December 31, 2007 – $55.6 million) in connection with options that are not required to be consolidated under the
provisions of FASB Interpretation No. 46 (Revised 2003) (“FIN 46R”). The total exercise price of these options is
$343.8 million (December 31, 2007 – $409.4 million) including the non-refundable deposits identified above. The
number of lots for which the Company has obtained an option to purchase, excluding those already consolidated, and the
respective dates of expiry and exercise price for these options is as follows:
Year of Expiry
Number
of
Lots
Total
Exercise
Price
2008 ....................................................................................................................................... 87 $ 17,955
2009 ....................................................................................................................................... 53 21,173
2010 ....................................................................................................................................... 2,322 66,488
Thereafter ............................................................................................................................... 7,315 238,226
9,777 $ 343,842
During the second quarter of 2008, the Company wrote-off $1.6 million (June 30, 2007 – nil) primarily related to
unentitled lot option agreements on 108 lots which the Company is no longer pursuing.
Investments in housing and land joint ventures includes $21.0 million of the Company’s share of non-refundable deposits
and other entitlement costs in connection with 1,329 lots under option. The Company’s share of the total exercise price of
these options is $92.0 million.

BROOKFIELD HOMES CORPORATION
NOTES TO THE CONSOLIDATED FINANCIAL STATEMENTS
(Tabular amounts in thousands of U.S. dollars except per share amounts)
8
The Company holds agreements for a further 5,829 acres of longer term land, with non-refundable deposits and other
entitlement costs of $10.4 million which is included in housing and land inventory that may provide additional lots upon
obtaining entitlements with an aggregate exercise price of $185.0 million. However, given that the Company is in the
initial stage of land entitlement, the Company has concluded at this time that the level of uncertainty in entitling these
properties does not warrant including them in the above totals.
In the ordinary course of business, the Company selectively acquires land that it anticipates will provide a minimum
return on invested capital. In the first quarter of 2008, the Company acquired its former partner’s 50% interest in one of
its joint ventures for cash consideration of $5.4 million and assumed project specific and other financings of $9.0 million.
As a result, the Company now owns 100% of this venture and as of January 15, 2008, it is included in the Company’s
consolidated financial statements. This acquisition resulted in an increase to the Company’s housing and land inventory
of $29.2 million, an increase to project specific and other financings of $18.0 million and a decrease in investments in
housing and land joint ventures of $11.2 million. In the second quarter of 2008, the Company acquired its former
partner’s 50% interest in another one of its joint ventures for cash consideration of $1.4 million and assumed project
specific and other financings of $21.3 million. As a result, the Company now owns 100% of this venture and as of April
11, 2008, it is included in the Company’s consolidated financial statements. This acquisition resulted in an increase to
the Company’s housing and land inventory of $68.6 million, an increase to project specific and other financings of $42.7
million, an increase to accounts payable and other liabilities of $3.1 million, and a decrease in investments in housing
and land joint ventures of $22.7 million.
Note 3. Investments in Housing and Land Joint Ventures
The Company participates in a number of joint ventures in which it has less than a controlling interest. Summarized
condensed financial information on a combined 100% basis of the joint ventures follows:
June 30, December 31,
2008 2007
Assets
Housing and land inventory ............................................................................................... $ 379,521 $ 476,250
Other assets ........................................................................................................................ 8,521 11,526
$ 388,042 $ 487,776
Liabilities and Equity
Project specific financings ................................................................................................. $ 134,599 $ 193,259
Accounts payable and other liabilities ............................................................................... 23,132 26,497
Investment and advances
Brookfield Homes ......................................................................................................... 99,950 130,546
Others ............................................................................................................................ 130,361 137,474
$ 388,042 $ 487,776
Three Months Ended
June 30,
Six Months Ended
June 30,
2008 2007 2008 2007
Revenue and Expenses
Revenue ................................................................... $ 12,320 $ 32,620 $ 17,814 $ 39,808
Expenses .................................................................. (9,993) (74,266) (13,199) (80,722)
Net income ............................................................... 2,327 (41,646) $ 4,615 $ (40,914)
Company’s share of net income ............................... $ 2,385 $ 56 $ 2,424 $ 380
Impairment of investments in housing and land
joint ventures ......................................................
$ (10,000)
$ –
$ (10,000)
$ –

BROOKFIELD HOMES CORPORATION
NOTES TO THE CONSOLIDATED FINANCIAL STATEMENTS
(Tabular amounts in thousands of U.S. dollars except per share amounts)
9
In reporting the Company’s share of net income, all inter-company profits or losses from housing and land joint ventures
are eliminated on lots purchased by the Company from the joint ventures.
Joint ventures in which the Company has a non-controlling interest are accounted for using the equity method. In
addition, the Company has performed an evaluation of its existing joint venture relationships by applying the provisions
of FIN 46R.
During the second quarter, in accordance with Accounting Principles Board Opinion No. 18 (“APB 18”) the “Equity
Method of Accounting for Investments in Common Stock,” the Company recognized impairment charges of $10.0
million related to a joint venture in the Inland Empire of California in the San Diego / Riverside reportable segment as a
result of continued deterioration in this project which resulted in the carrying value of the Company’s investment in this
joint venture exceeding the estimated fair value. Additionally, this joint venture has received notice from its lender that it
is in default on its $71.6 million loan. The Company has provided the lender a several guarantee for fifty percent of the
amount outstanding. The joint venture is currently in discussions with its lender. The Company’s remaining investment in
this venture is $7.9 million.
The Company and/or its joint venture partners have provided varying levels of guarantees of debt in its joint ventures. At
June 30, 2008, the Company had recourse guarantees of $35.8 million (December 31, 2007 – $8.5 million) and limited
maintenance guarantees of $22.1 million (December 31, 2007 – $76.1 million) with respect to debt in its joint ventures.
Note 4. Project Specific and Other Financings
Project specific and other financings are as follows:
June 30, December 31,
2008 2007
Project specific ................................................................................................................... $ 548,863 $ 644,572
Other financings ................................................................................................................. 243,000 90,000
$ 791,863 $ 734,572
Project specific financings are revolving in nature, bear interest at floating rates with a weighted average rate of 5.4% as
at June 30, 2008 (December 31, 2007 – 7.0%) and are secured by housing and land inventory. The weighted average rate
was calculated as of the end of each period, based upon the amount of debt outstanding and the related interest rates
applicable on the date. During the six months ended June 30, 2008, two joint ventures were acquired on which
$60.7 million of debt was assumed and remains outstanding at June 30, 2008.
The Company’s project specific financings require Brookfield Homes Holdings Inc., a wholly-owned subsidiary of the
Company, to maintain a tangible net worth of at least $250.0 million, a net debt to capitalization ratio of no greater than
65% and a net debt to tangible net worth of no greater than 2.50 to 1. As of June 30, 2008, the Company was in
compliance with all its covenants.
Project specific financings mature as follows: 2008 – $136.4 million; 2009 – $295.6 million; 2010 – $78.8 million; and
2011 – $38.1 million.
Other financings consist of amounts drawn on an unsecured revolving credit facility due to a subsidiary of the Company’s
largest stockholder, Brookfield Asset Management Inc. This facility bears interest at LIBOR plus 3.0% per annum and
matures in September 2009. This facility was increased in July 2008 to an aggregate principal amount not to exceed
$275.0 million. During the three months and six months ended June 30, 2008, interest of $2.1 million and $4.7 million,
respectively, was paid related to this facility (2007 – $1.1 million and $1.9 million, respectively). This facility requires
the Company to maintain minimum stockholders’ equity of $300.0 million and a consolidated net debt to book
capitalization of no greater than 70%.
BROOKFIELD HOMES CORPORATION
NOTES TO THE CONSOLIDATED FINANCIAL STATEMENTS
(Tabular amounts in thousands of U.S. dollars except per share amounts)
10
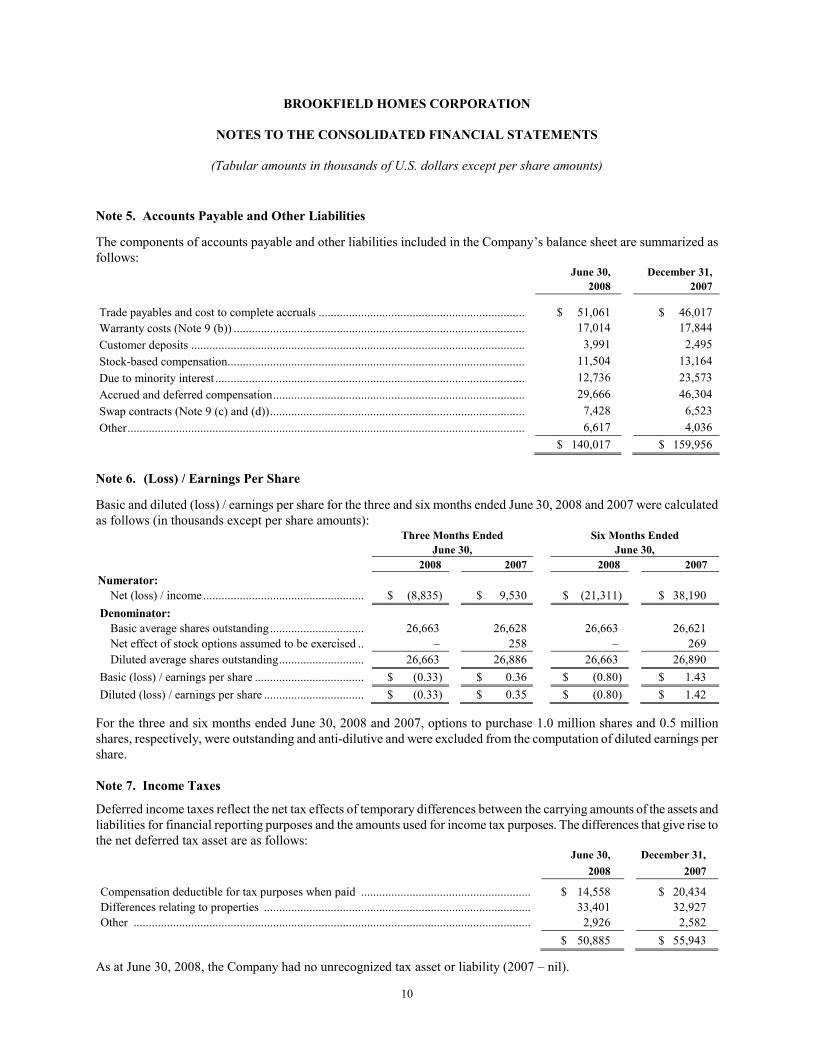
Note 5. Accounts Payable and Other Liabilities
The components of accounts payable and other liabilities included in the Company’s balance sheet are summarized as
follows: June 30, December 31,
2008 2007
Trade payables and cost to complete accruals .................................................................... $ 51,061 $ 46,017
Warranty costs (Note 9 (b)) ................................................................................................ 17,014 17,844
Customer deposits .............................................................................................................. 3,991 2,495
Stock-based compensation.................................................................................................. 11,504 13,164
Due to minority interest ...................................................................................................... 12,736 23,573
Accrued and deferred compensation ................................................................................... 29,666 46,304
Swap contracts (Note 9 (c) and (d)) .................................................................................... 7,428 6,523
Other ................................................................................................................................... 6,617 4,036
$ 140,017 $ 159,956
Note 6. (Loss) / Earnings Per Share
Basic and diluted (loss) / earnings per share for the three and six months ended June 30, 2008 and 2007 were calculated
as follows (in thousands except per share amounts):
Three Months Ended
June 30,
Six Months Ended
June 30,
2008 2007 2008 2007
Numerator:
Net (loss) / income ..................................................... $ (8,835) $ 9,530 $ (21,311) $ 38,190
Denominator:
Basic average shares outstanding ............................... 26,663 26,628 26,663 26,621
Net effect of stock options assumed to be exercised .. – 258 – 269
Diluted average shares outstanding ............................ 26,663 26,886 26,663 26,890
Basic (loss) / earnings per share .................................... $ (0.33) $ 0.36 $ (0.80) $ 1.43
Diluted (loss) / earnings per share ................................. $ (0.33) $ 0.35 $ (0.80) $ 1.42
For the three and six months ended June 30, 2008 and 2007, options to purchase 1.0 million shares and 0.5 million
shares, respectively, were outstanding and anti-dilutive and were excluded from the computation of diluted earnings per
share.
Note 7. Income Taxes
Deferred income taxes reflect the net tax effects of temporary differences between the carrying amounts of the assets and
liabilities for financial reporting purposes and the amounts used for income tax purposes. The differences that give rise to
the net deferred tax asset are as follows: June 30, December 31,
2008 2007
Compensation deductible for tax purposes when paid ........................................................ $ 14,558 $ 20,434
Differences relating to properties ........................................................................................ 33,401 32,927
Other ................................................................................................................................... 2,926 2,582
$ 50,885 $ 55,943
As at June 30, 2008, the Company had no unrecognized tax asset or liability (2007 – nil).

BROOKFIELD HOMES CORPORATION
NOTES TO THE CONSOLIDATED FINANCIAL STATEMENTS
(Tabular amounts in thousands of U.S. dollars except per share amounts)
11
Note 8. Stock Based Compensation
Option Plan
Pursuant to the Company’s stock option plan, Brookfield Homes grants options to purchase shares of the Company’s
common stock at the market price of the shares on the day the options are granted. A maximum of two million shares are
authorized for issuance under the plan.
The total compensation costs recognized in income related to the Company’s stock options during the three and six
months ended June 30, 2008 was income of $1.1 million and $0.5 million, respectively (2007 – income of $0.7 million
and $2.4 million, respectively).
The fair value of each of the Company’s stock option awards is estimated at each reporting date using a Black-Scholes
option-pricing model that uses the assumptions noted in the table below. The fair value of the Company’s stock option
awards, which are subject to graded vesting, is expensed over the vesting period of the stock options. Expected volatility
is based on historical volatility of the Company’s stock. The risk-free rate for periods within the contractual life of the
stock option award is based on the yield curve of a zero-coupon U.S. Treasury bond with a maturity equal to the expected
term of the stock option award granted. The Company uses historical data to estimate stock option exercises and
forfeitures within its valuation model. The expected term of stock option awards granted for some participants is derived
from historical exercise experience under the Company’s share-based payment plan and represents the period of time that
stock option awards granted are expected to be outstanding. The expected term of stock options granted for the remaining
participants is derived by using the simplified method.
The significant weighted average assumptions relating to the valuation of the Company’s stock options for the three
months and six months ended June 30, 2008 were as follows: 2008
Dividend yield ...................................................................................................................................................... 0.0% – 3.26%
Volatility rate ........................................................................................................................................................ 64%
Risk-free interest rate ............................................................................................................................................ 2.6% – 4.5%
Expected option life (years) .................................................................................................................................. 0.0 – 7.0
The following table sets out the number of common shares that employees of the Company may acquire under options
granted under the Company’s stock option plan: June 30, 2008
Shares
Weighted
Average per
Share Exercise
Price
Outstanding, January 1, 2008 ................................................................................................ 782,319 $ 30.11
Granted.................................................................................................................................. 210,000 $ 15.90
Exercised ............................................................................................................................... – –
Cancelled .............................................................................................................................. – –
Outstanding, June 30, 2008 ................................................................................................... 992,319 $ 27.10
Options exercisable at June 30, 2008 .................................................................................... 421,719 $ 22.29
The weighted average grant date fair value of options granted during the six months ended June 30, 2008 was $6.65 per
option compared to $12.17 per option during the six months ended June 30, 2007. The intrinsic value of options
exercised during the six months ended June 30, 2008 and 2007 was nil and $2.6 million, respectively. At June 30, 2008,
the aggregate intrinsic value of options currently exercisable is $1.8 million and the aggregate intrinsic value of options
outstanding is $1.8 million.
At June 30, 2008, there was $0.9 million of unrecognized expense related to unvested options, which is expected to be
recognized over the weighted average period of 2.6 years.

BROOKFIELD HOMES CORPORATION
NOTES TO THE CONSOLIDATED FINANCIAL STATEMENTS
(Tabular amounts in thousands of U.S. dollars except per share amounts)
12
Deferred Share Unit Plan
The Company has adopted a Deferred Share Unit Plan ("DSUP") under which certain of its executive officers and
directors may, at their option, receive all or a portion of their annual bonus awards or retainers, respectively, in the form
of deferred share units. The Company may also make additional grants of units to its executives and directors pursuant to
the DSUP. As of June 30, 2008, the Company had granted 925,999 units under the DSUP, all of which were outstanding
at June 30, 2008, and of which 565,391 units are currently vested and 360,608 vest over the next five years.
In addition, the Company has adopted a Senior Operating Management Deferred Share Unit Plan, ("MDSUP") under
which certain senior operating management employees receive a portion of their annual compensation in the form of
deferred share units. As of June 30, 2008, the Company had granted 73,375 units under the MDSUP, all of which were
outstanding at June 30, 2008.
The financial statement impact relating to the DSUP and MDSUP for the three and six months ended June 30, 2008 were
income of $2.7 million and $1.4 million, respectively (2007 – income of $1.7 million and $4.4 million, respectively).
The following table sets out the number of deferred share units that executive officers, directors and senior operating
management employees of the Company may redeem under the Company’s DSUP and MDSUP:
June 30,
2008
Outstanding, January 1, 2008 ............................................................................................................................ 677,902
Granted.............................................................................................................................................................. 325,701
Exercised ........................................................................................................................................................... –
Cancelled .......................................................................................................................................................... (4,229)
Outstanding, June 30, 2008 ............................................................................................................................... 999,374
Deferred share units vested at June 30, 2008 .................................................................................................... 638,766
Note 9. Commitments, Contingent Liabilities and Other
(a) The Company is party to various legal actions arising in the ordinary course of business. Management believes that
none of these actions, either individually or in the aggregate, will have a material adverse effect on the financial
condition or results of operations of the Company.
(b) When selling a home, the Company’s subsidiaries provide customers with a limited warranty. The Company
estimates the costs that may be incurred under each limited warranty and records a liability in the amount of such costs
at the time the revenue associated with the sale of each home is recognized. In addition, the Company has insurance in
place where its subsidiaries are subject to the respective warranty statutes in the State where the Company conducts
business which range up to ten years for latent construction defects. Factors that affect the Company’s warranty liability
include the number of homes sold, historical and anticipated rates of warranty claims, and cost per claim. The Company
periodically assesses the adequacy of its recorded warranty liabilities and adjusts the amounts as necessary. The
following table reflects the changes in the Company’s warranty liability for the six months ended June 30, 2008 and
2007: 2008 2007
Balance, at beginning of period ............................................................................................ $ 17,844 $ 19,569
Payments and other adjustments made during the period ..................................................... (2,290) (2,817)
Warranties issued during the period ...................................................................................... 1,460 2,278
Balance, end of period .......................................................................................................... $ 17,014 $ 19,030
BROOKFIELD HOMES CORPORATION
NOTES TO THE CONSOLIDATED FINANCIAL STATEMENTS
(Tabular amounts in thousands of U.S. dollars except per share amounts)
13
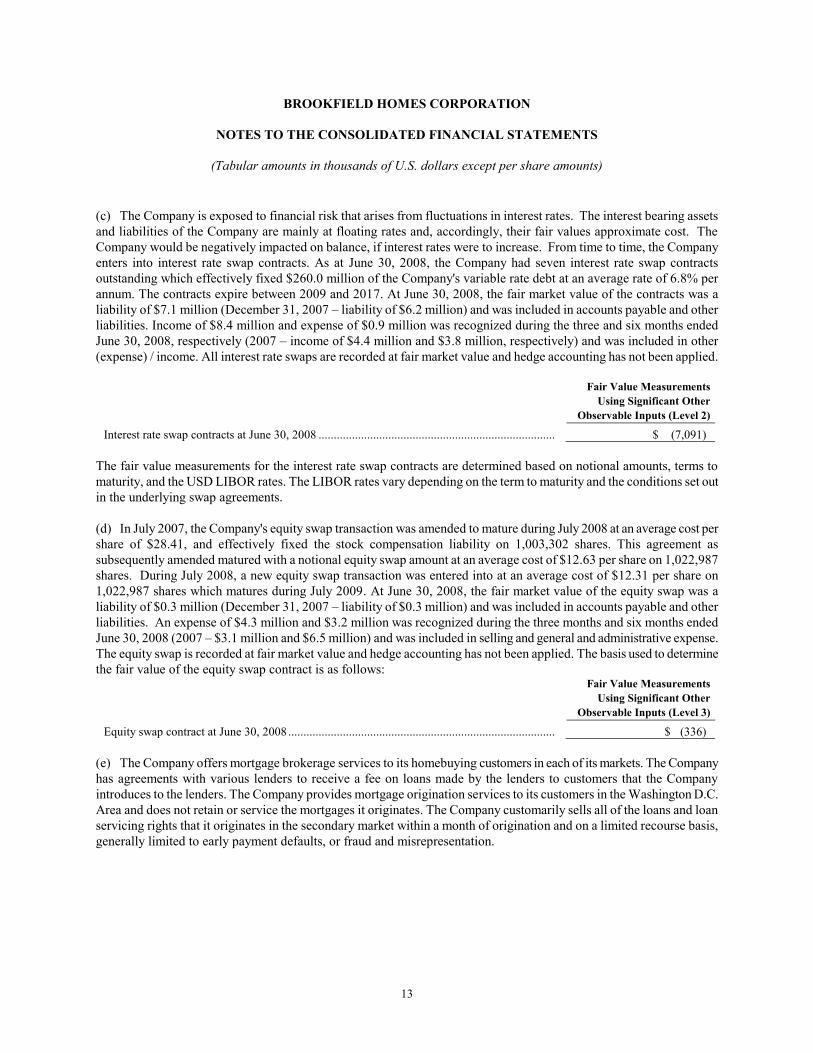
(c) The Company is exposed to financial risk that arises from fluctuations in interest rates. The interest bearing assets
and liabilities of the Company are mainly at floating rates and, accordingly, their fair values approximate cost. The
Company would be negatively impacted on balance, if interest rates were to increase. From time to time, the Company
enters into interest rate swap contracts. As at June 30, 2008, the Company had seven interest rate swap contracts
outstanding which effectively fixed $260.0 million of the Company's variable rate debt at an average rate of 6.8% per
annum. The contracts expire between 2009 and 2017. At June 30, 2008, the fair market value of the contracts was a
liability of $7.1 million (December 31, 2007 – liability of $6.2 million) and was included in accounts payable and other
liabilities. Income of $8.4 million and expense of $0.9 million was recognized during the three and six months ended
June 30, 2008, respectively (2007 – income of $4.4 million and $3.8 million, respectively) and was included in other
(expense) / income. All interest rate swaps are recorded at fair market value and hedge accounting has not been applied.
Fair Value Measurements
Using Significant Other
Observable Inputs (Level 2)
Interest rate swap contracts at June 30, 2008 .............................................................................. $ (7,091)
The fair value measurements for the interest rate swap contracts are determined based on notional amounts, terms to
maturity, and the USD LIBOR rates. The LIBOR rates vary depending on the term to maturity and the conditions set out
in the underlying swap agreements.
(d) In July 2007, the Company's equity swap transaction was amended to mature during July 2008 at an average cost per
share of $28.41, and effectively fixed the stock compensation liability on 1,003,302 shares. This agreement as
subsequently amended matured with a notional equity swap amount at an average cost of $12.63 per share on 1,022,987
shares. During July 2008, a new equity swap transaction was entered into at an average cost of $12.31 per share on
1,022,987 shares which matures during July 2009. At June 30, 2008, the fair market value of the equity swap was a
liability of $0.3 million (December 31, 2007 – liability of $0.3 million) and was included in accounts payable and other
liabilities. An expense of $4.3 million and $3.2 million was recognized during the three months and six months ended
June 30, 2008 (2007 – $3.1 million and $6.5 million) and was included in selling and general and administrative expense.
The equity swap is recorded at fair market value and hedge accounting has not been applied. The basis used to determine
the fair value of the equity swap contract is as follows:
Fair Value Measurements
Using Significant Other
Observable Inputs (Level 3)
Equity swap contract at June 30, 2008 ........................................................................................ $ (336)
(e) The Company offers mortgage brokerage services to its homebuying customers in each of its markets. The Company
has agreements with various lenders to receive a fee on loans made by the lenders to customers that the Company
introduces to the lenders. The Company provides mortgage origination services to its customers in the Washington D.C.
Area and does not retain or service the mortgages it originates. The Company customarily sells all of the loans and loan
servicing rights that it originates in the secondary market within a month of origination and on a limited recourse basis,
generally limited to early payment defaults, or fraud and misrepresentation.

BROOKFIELD HOMES CORPORATION
NOTES TO THE CONSOLIDATED FINANCIAL STATEMENTS
(Tabular amounts in thousands of U.S. dollars except per share amounts)
14
Note 10. Segment Information
As defined in SFAS 131, "Disclosures About Segments of an Enterprise and Related Information," the Company have
five operating segments. The Company has four reportable segments: Northern California, Southland / Los Angeles, San
Diego / Riverside, and the Washington D.C. Area.
The Company is a land developer and residential homebuilder. The Company is organized and manages its business
based on the geographical areas in which it operates. Each of the Company’s segments specialize in lot entitlement and
development and the construction of single-family and multi-family homes. The Company evaluates performance and
allocates capital based primarily on return on assets together with a number of other risk factors. Earnings performance is
measured using segment operating income. The accounting policies of the segments are the same as those described in
Note 1, “Significant Accounting Policies.”
Three Months Ended Six Months Ended
June 30, June 30,
2008 2007 2008 2007
Revenues
Northern California ........................................... $ 37,565 $ 30,235 $ 46,768 $ 40,020
Southland / Los Angeles ................................... 31,561 53,290 56,287 104,871
San Diego / Riverside ....................................... 19,375 34,516 32,235 49,840
Washington, D.C. Area ..................................... 28,545 37,876 51,448 59,295
Corporate and Other .......................................... 2,714 1,435 2,714 10,885
Total Revenues.................................................. $ 119,760 $ 157,352 $ 189,452 $ 264,911
Segment Operating Income (Loss)
Northern California ........................................... $ (1,109) $ 3,398 $ (2,148) $ 2,098
Southland / Los Angeles ................................... 1,215 5,729 800 12,021
San Diego / Riverside ....................................... (7,159) 4,445 (5,706) 6,618
Washington D.C. Area ...................................... (16,281) 1,472 (23,983) 1,186
Corporate and Other .......................................... 7,066 1,090 (6,641) (612)
Total Operating (Loss) / Income ....................... (16,268) 16,134 (37,678) 21,311
Minority Interest ............................................... 2,020 (763) 3,306 (928)
Net (Loss) / Income before Taxes ..................... $ (14,248) $ 15,371 $ (34,372) $ 20,383
June 30, December 31,
2008 2007
Housing and Land Assets 1)
Northern California ........................................................................................................ $ 311,828 $ 310,946
Southland / Los Angeles ................................................................................................ 168,119 198,483
San Diego / Riverside ..................................................................................................... 447,789 387,575
Washington, D.C. Area .................................................................................................. 269,407 287,994
Corporate and Other ....................................................................................................... 54,586 50,525
$ 1,251,729 $ 1,235,523
1) Consists of housing and land inventory, investments in housing and land joint ventures and consolidated land inventory not
owned.

BROOKFIELD HOMES CORPORATION
NOTES TO THE CONSOLIDATED FINANCIAL STATEMENTS
(Tabular amounts in thousands of U.S. dollars except per share amounts)
15
The following tables set forth additional financial information relating to the Company’s reportable operating segments:
Three Months Ended
June 30,
Six Months Ended
June 30,
2008 2007 2008 2007
Equity in earnings/(loss) from Housing and Land Joint
Ventures:
Northern California .................................................................. $ – $ – $ – $ –
Southland / Los Angeles .......................................................... – – – –
San Diego / Riverside .............................................................. 1,730 – 1,730 –
Washington, D.C. Area ............................................................ (240) 56 (417) (9)
Corporate and Other ................................................................. 895 – 1,111 389
Total ......................................................................................... $ 2,385 $ 56 $ 2,424 $ 380
Three Months Ended
June 30,
Six Months Ended
June 30,
2008 2007 2008 2007
Impairments and write-offs of option deposits:
Northern California .................................................................. $ 447 $ – $ 447 $ –
Southland / Los Angeles .......................................................... – – 550 –
San Diego / Riverside .............................................................. – – – –
Washington, D.C. Area ............................................................ 16,204 – 21,804 –
Corporate and Other ................................................................. – – – –
Total ......................................................................................... $ 16,651 $ – $ 22,801 $ –
June 30, December 31,
2008 2007
Investments in Housing and Land Joint Ventures
Northern California ..................................................................................................................... $ – $ –
Southland / Los Angeles ............................................................................................................. 35,174 32,541
San Diego / Riverside ................................................................................................................. 10,799 50,165
Washington, D.C. Area ............................................................................................................... 45,939 41,777
Corporate and Other .................................................................................................................... 8,038 6,063
Total ............................................................................................................................................ $ 99,950 $ 130,546

16
Item 2. Management’s Discussion and Analysis of Financial Condition and Results of Operations
This discussion includes forward-looking statements that reflect our current views with respect to future events and
financial performance and that involve risks and uncertainties. Our actual results, performance or achievements could
differ materially from those anticipated in the forward-looking statements as a result of certain factors including risks
discussed in “Management’s Discussion and Analysis of Financial Condition and Results of Operations –
Forward-Looking Statements” and Item 1A – “Risk Factors” elsewhere in this report and in our Annual Report on Form
10-K/A for the year ended December 31, 2007.
Outlook
During the second quarter of 2008, we continued to experience challenging housing market conditions as a result of a
continuing excess supply of housing inventory and the ongoing disruption in credit markets that began in 2007. Despite
these challenging market conditions which are negatively affecting our current housing operations, we continue to focus
on the monetization of our approximately 3,600 lots ready for house construction to generate significant cash flow to
repay debt in the interim, and to redeploy to assets with higher expected returns. In addition, we continue to focus on our
core strategies, including controlling land through option contracts and adding value by entitling raw land and creating
communities.
Overview
We entitle and develop land for our communities and sell lots to third parties. We also design, construct and market
single and multi-family homes primarily to move-up and luxury homebuyers.
We operate in the following geographic regions which are presented as our reportable segments: Northern California
(San Francisco Bay Area and Sacramento), Southland / Los Angeles, San Diego / Riverside and Washington, D.C. Area.
Our other operations that do not meet the quantitative thresholds for separate disclosure in our financial statements
under US GAAP are included in "Corporate and Other."
Our goal is to maximize the total return on our common stockholders’ equity over the long term. We plan to achieve this
by actively managing our assets and creating value on the lots we own or control.
For the period 2003 through the second quarter of 2008, cash provided from operations was $432 million, which was
used primarily to return cash to stockholders through the repurchase of shares and the payment of dividends. Despite the
continuing challenges of the United States housing market, we believe our business is positioned to create further
shareholder value over the long term through the selective control of a number of strategic projects and the overall level
of lots controlled.
The 25,957 lots that we control, 14,826 of which we own directly or through joint ventures, provide a strong foundation
for our business and visibility on our future cash flow. We believe we add value to the lots we control through
entitlements, development and the construction of homes. In allocating capital to our operations we generally limit our
risk on unentitled land by optioning such land positions in all our markets, thereby mitigating our capital at risk. Option
contracts for the purchase of land permit us to control lots for an extended period of time.
Homebuilding is our primary source of revenue and has represented approximately 90% of our total revenue since 2002.
Our operations are positioned to allow us to close up to 1,500 homes annually. Our average sales price for the six months
ended June 30, 2008 of $558,000 was well in excess of the national average sales price as we operate in markets with
higher price points and cater to move-up and luxury buyers. We also sell serviced and unserviced lots to other
homebuilders generally on an opportunistic basis where we can redeploy capital to an asset providing higher returns or
reduce risk in a market.
Our housing and land inventory, investments in housing and land joint ventures, and consolidated land inventory not
owned together comprised 92% of our total assets as of June 30, 2008. In addition, we had $102 million in other assets,
which consist of homebuyer receivables of $3 million, deferred income taxes and income taxes receivable of $69 million
and mortgages and other receivables of $30 million. Homebuyer receivables consist primarily of proceeds due from
homebuyers on the closing of homes.
Critical Accounting Policies and Estimates
There have been no significant changes to our critical accounting policies and estimates during the three
months and six months ended June 30, 2008 compared to those disclosed in Item 7, Management’s Discussion and
Analysis of Financial Condition and Results of Operations included in our annual report on Form 10-K/A for the year
ended December 31, 2007.

17
Results of Operations
Selected Financial Information (Unaudited) Three Months Ended
June 30,
Six Months Ended
June 30,
($US millions) 2008 2007 2008 2007
Revenue:
Housing ................................................................................... $ 115 $ 155 $ 181 $ 259
Land......................................................................................... 5 2 8 6
Total revenues ............................................................................. 120 157 189 265
Direct cost of sales ...................................................................... (105) (129) (164) (216)
Impairments and write-offs of option deposits ............................ (17) – (23) –
Gross margin / (loss) ................................................................... (2) 28 2 49
Equity in earnings from housing and land joint ventures ............ 2 – 2 –
Impairments of investments in housing and land joint ventures .. (10) – (10) –
Other (expense) / income ............................................................ 9 6 – 6
Selling, general and administrative expense ................................ (15) (18) (31) (34)
Operating (loss) / income ............................................................ (16) 16 (37) 21
Minority interest .......................................................................... 2 (1) 3 (1)
(Loss) / income before taxes ........................................................ (14) 15 (34) 20
Income tax recovery / (expense) .................................................. 5 (6) 13 18
Net (loss) / income ...................................................................... $ (9) $ 9 $ (21) $ 38
Segment Information
Housing revenue ($US millions):
Northern California ................................................................. $ 38 $ 30 $ 47 $ 40
Southland / Los Angeles ......................................................... 31 53 56 105
San Diego / Riverside .............................................................. 19 35 32 50
Washington D.C. Area ............................................................ 24 35 43 53
Corporate and Other ................................................................ 3 2 3 11
Total ........................................................................................ $ 115 $ 155 $ 181 $ 259
Land revenues ($US millions):
Northern California ................................................................. $ – $ – $ – $ –
Southland / Los Angeles .......................................................... – – – –
San Diego / Riverside .............................................................. – – – –
Washington D.C. Area ............................................................ 5 2 8 6
Corporate and Other ................................................................ – – – –
Total ........................................................................................ $ 5 $ 2 $ 8 $ 6
Impairments and write-offs of option deposits ($US millions):
Northern California ................................................................. $ – $ – $ – $ –
Southland / Los Angeles ......................................................... – – – –
San Diego / Riverside .............................................................. – – – –
Washington D.C. Area ............................................................ 17 – 23 –
Corporate and Other ................................................................ – – – –
Total ........................................................................................ $ 17 $ – $ 23 $ –
Gross margin ($US millions)(1):
Northern California ................................................................. $ 2 $ 6 $ 3 $ 7
Southland / Los Angeles ......................................................... 5 9 8 20
San Diego / Riverside .............................................................. 4 8 8 12
Washington D.C. Area ............................................................ (12) 4 (16) 8
Corporate and Other ................................................................ (1) 1 (1) 2
Total ........................................................................................ $ (2) $ 28 $ 2 $ 49

18
Home closings (units):
Northern California ................................................................. 40 31 50 43
Southland / Los Angeles .......................................................... 77 70 131 142
San Diego / Riverside .............................................................. 39 61 61 84
Washington D.C. Area ............................................................ 54 72 85 102
Corporate and Other ................................................................ 4 2 4 13
Consolidated total .................................................................... 214 236 331 384
Joint ventures........................................................................... 2 1 5 4
Total ........................................................................................ 216 237 336 388
Average selling price ($US):
Northern California ................................................................. $ 939,000 $ 975,000 $ 935,000 $ 931,000
Southland / Los Angeles .......................................................... 410,000 761,000 430,000 739,000
San Diego / Riverside .............................................................. 497,000 566,000 528,000 593,000
Washington D.C. Area ............................................................ 445,000 488,000 513,000 520,000
Corporate and Other ................................................................ 679,000 718,000 679,000 837,000
Consolidated average............................................................... 538,000 655,000 549,000 674,000
Joint ventures........................................................................... 1,378,000 1,025,000 1,236,000 948,000
Average ................................................................................... $ 548,000 $ 657,000 $ 558,000 $ 676,000
Net new orders (units): (2)
Northern California ................................................................. 38 34 70 63
Southland / Los Angeles .......................................................... 80 53 159 134
San Diego / Riverside .............................................................. 41 25 89 89
Washington D.C. Area ............................................................ 74 79 145 187
Corporate and Other ................................................................ 3 6 4 10
Consolidated total .................................................................... 236 197 467 483
Joint ventures........................................................................... 1 15 1 18
Total ........................................................................................ 237 212 468 501
Backlog (units at end of period): (3)
Northern California ................................................................. 47 37
Southland / Los Angeles .......................................................... 73 92
San Diego / Riverside .............................................................. 36 40
Washington D.C. Area ............................................................ 112 160
Corporate and other ................................................................. 19 17
Consolidated total .................................................................... 287 346
Joint ventures........................................................................... – 26
Total ........................................................................................ 287 372
Lots controlled (units at end of period):
Lots owned:
Northern California ................................................................. 1,275 1,352
Southland / Los Angeles .......................................................... 1,465 1,393
San Diego / Riverside .............................................................. 8,030 6,130
Washington D.C. Area ............................................................ 3,781 3,916
Corporate and Other ................................................................ 275 143
14,826 12,934
Lots under option (4) ................................................................ 11,131 14,639
Total ........................................................................................ 25,957 27,573
(1) Gross margin includes impairments and write-offs of option deposits.
(2) Net new orders for any period represent the aggregate of all homes ordered by customers, net of cancellations.
(3) Backlog represents the number of new homes subject to pending sales contracts.
(4) Includes proportionate share of lots under option related to joint ventures.
19
Three Months and Six Months Ended June 30, 2008 Compared with Three Months and Six Months Ended
June 30, 2007
Net (Loss) / Income
Net loss was $9 million and $21 million for the three months and six months ended June 30, 2008, a decrease in income
of $18 million and $59 million, respectively, when compared to the same periods in 2007. The decrease for the three
months ended June 30, 2008 primarily relates to impairments and option write-offs of $17 million and impairments of
investments in housing and land joint ventures of $10 million as a result of lower than anticipated revenues. The decrease
for the six months ended June 30, 2008 primarily relates to impairment charges previously outlined and a reversal of an
uncertain tax position that contributed $26 million to net income during the six months ended June 30, 2007.
Results of Operations
Company-wide: Housing revenue was $115 million and $181 million for the three months and six months ended June 30,
2008, a decrease of $40 million and $78 million, respectively, when compared to the same periods in 2007. The decrease
in housing revenue was primarily a result of a decrease of 18% and 19% in the average selling price during the three
months and six months ended June 30, 2008 when compared to the same period in 2007. In addition, 22 and 53 fewer
homes were closed in the three months and six months ended June 30, 2008 when compared to the same periods in 2007.
The gross margin on housing revenue for the three months ended June 30, 2008 was $14 million or 12% compared with
$28 million or 18% for the same period in 2007. The decrease in the gross margin was due to fewer home closings,
continued homebuyer incentives, and/or reduce average selling prices.
Land revenue totaled $5 million and $8 million for the three months and six months ended June 30, 2008, an increase of
$3 million and $2 million, respectively, when compared to the same periods in 2007. Our land revenues may vary
significantly from period to period due to the timing and nature of land sales as they generally occur on an opportunistic
basis and additionally such revenues are also affected by local market conditions which continue to be weak.
During the three months and six months ended June 30, 2008, we recognized $17 million and $23 million of impairment
charges and write-offs of option deposits compared to nil for the same periods in 2007. The impairment charges and
write-offs for the three months ended June 30, 2008 relates to 581 lots and 108 optioned lots primarily in the Washington
D.C. Area. The impairment charges and write-offs for the six months ended June 30, 2008 relate to 803 lots and 108
optioned lots primarily in the Washington D.C. Area.
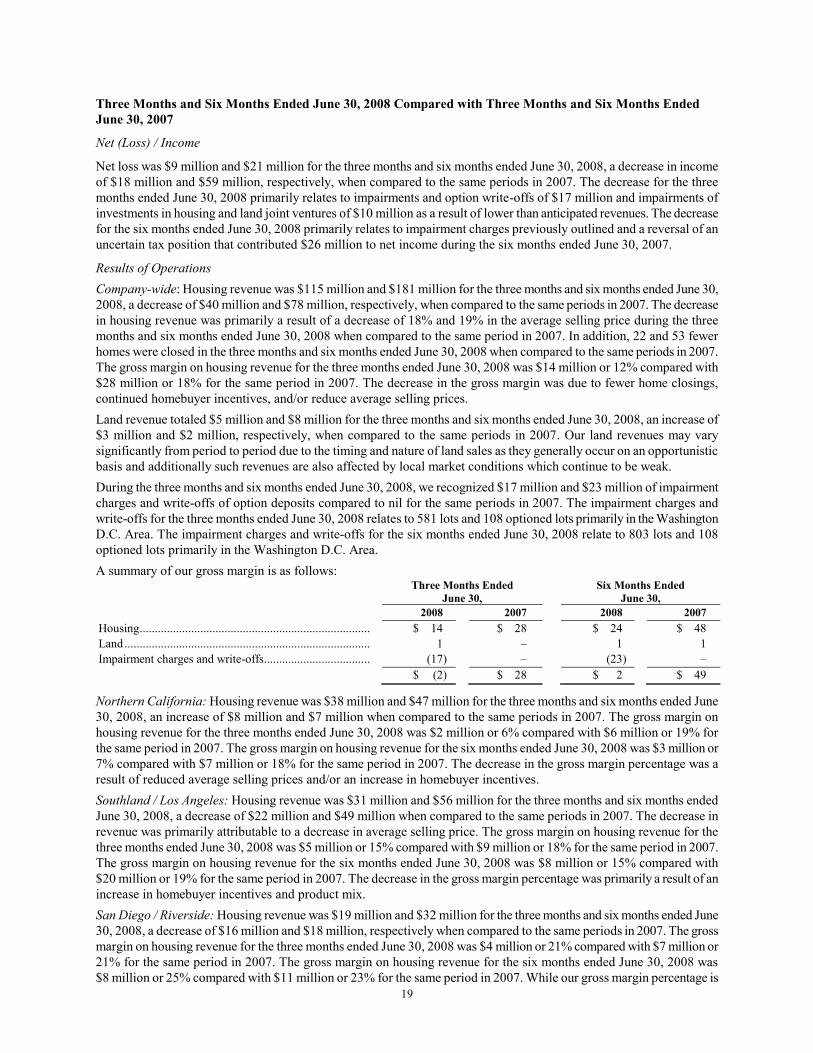
A summary of our gross margin is as follows:
Three Months Ended
June 30,
Six Months Ended
June 30,
2008 2007 2008 2007
Housing ............................................................................ $ 14 $ 28 $ 24 $ 48
Land ................................................................................. 1 – 1 1
Impairment charges and write-offs ................................... (17) – (23) –
$ (2) $ 28 $ 2 $ 49
Northern California: Housing revenue was $38 million and $47 million for the three months and six months ended June
30, 2008, an increase of $8 million and $7 million when compared to the same periods in 2007. The gross margin on
housing revenue for the three months ended June 30, 2008 was $2 million or 6% compared with $6 million or 19% for
the same period in 2007. The gross margin on housing revenue for the six months ended June 30, 2008 was $3 million or
7% compared with $7 million or 18% for the same period in 2007. The decrease in the gross margin percentage was a
result of reduced average selling prices and/or an increase in homebuyer incentives.
Southland / Los Angeles: Housing revenue was $31 million and $56 million for the three months and six months ended
June 30, 2008, a decrease of $22 million and $49 million when compared to the same periods in 2007. The decrease in
revenue was primarily attributable to a decrease in average selling price. The gross margin on housing revenue for the
three months ended June 30, 2008 was $5 million or 15% compared with $9 million or 18% for the same period in 2007.
The gross margin on housing revenue for the six months ended June 30, 2008 was $8 million or 15% compared with
$20 million or 19% for the same period in 2007. The decrease in the gross margin percentage was primarily a result of an
increase in homebuyer incentives and product mix.
San Diego / Riverside: Housing revenue was $19 million and $32 million for the three months and six months ended June
30, 2008, a decrease of $16 million and $18 million, respectively when compared to the same periods in 2007. The gross
margin on housing revenue for the three months ended June 30, 2008 was $4 million or 21% compared with $7 million or
21% for the same period in 2007. The gross margin on housing revenue for the six months ended June 30, 2008 was
$8 million or 25% compared with $11 million or 23% for the same period in 2007. While our gross margin percentage is

20
high relative to our other geographic areas, our current backlog of homes indicates our margins will decrease in future
periods.
Washington D.C. Area: Housing revenue was $24 million and $43 million for the three months and six months ended
June 30, 2008, a decrease of $11 million and $10 million, respectively, when compared to the same periods in 2007. The
gross margin on housing revenue before impairment charges for the three months ended June 30, 2008 was $4 million or
13% compared with $4 million or 12% for the same period in 2007. The gross margin on housing revenue before
impairment charges for the six months ended June 30, 2008 was $6 million or 13% compared with $7 million or 14% for
the same period in 2007.
Other Income and Expenses
Equity in earnings from housing and land joint venture for the three months and six months ended June 30, 2008 was
$2 million, an increase of $2 million when compared to the same periods in 2007. The impairments of investments in
housing and land joint ventures of $10 million for the three months and six months ended June 30, 2008 primarily relates
to 907 lots in the Inland Empire of California.
Other (expense) / income for the three months and six months ended June 30, 2008 totaled income of $9 million and nil,
an increase of $3 million and a decrease of $6 million, respectively, when compared to the same periods in 2007.
Selling, general and administrative expenses was $15 million and $31 million for the three months and six months ended
June 30, 2008, a decrease of $3 million when compared to the same periods in 2007. Included in selling, general and
administrative expense was net stock compensation expense of $1 million and nil for the six months ended June 30, 2008
and 2007, respectively.
Sales Activity
Net new home orders for the three months and six months ended June 30, 2008 totaled 237 and 468 units, an increase of
25 units or 12% and a decrease of 33 units or 7%, respectively, compared to the same periods in 2007.
Liquidity and Capital Resources
Financial Position
Our assets as of June 30, 2008 totaled $1,354 million, consistent with December 31, 2007. Our housing and land
inventory and investments in housing and land joint ventures are our most significant assets with a combined book value
of $1,242 million or approximately 92% of our total assets. Our housing and land assets have increased by
$33 million in 2008 when compared to December 31, 2007. The increase was primarily due to the acquisitions of our
partners’ 50% interests in two joint ventures for $39 million, of which $7 million was paid in cash and $32 million was
financed by project specific debt and other liabilities. In addition, as at June 30, 2008, we have consolidated these two
former joint venture entities which resulted in a further increase in our housing and land inventory of $32 million related
to our share of debt in these entities. The increase of $71 million in housing and land assets as a result of these two
acquisitions was offset by impairments and write-offs of option deposits of $33 million during 2008. Our housing and
land assets include homes completed and under construction and lots ready for construction, model homes and land under
and held for development. A summary of our lots owned and their stage of development at June 30, 2008 compared with
December 31, 2007 follows:
June 30, December 31,
2008 2007
Completed homes, including models .................................................................................... 288 477
Homes under construction .................................................................................................... 195 91
Homes with foundations / slabs ............................................................................................ 147 165
Total housing units ................................................................................................................ 630 733
Lots ready for house construction ......................................................................................... 2,944 2,683
3,574 3,416
Graded lots and lots commenced grading ............................................................................ 1,354 1,552
Undeveloped land ................................................................................................................. 9,898 8,110
14,826 13,078
Our total debt as of June 30, 2008 was $792 million, an increase of $57 million from December 31, 2007. Total debt as
of June 30, 2008 consists of $549 million related to project specific financings and $243 million related to amounts
drawn on our unsecured revolving credit facility with a subsidiary of our largest stockholder, Brookfield Asset
Management Inc.
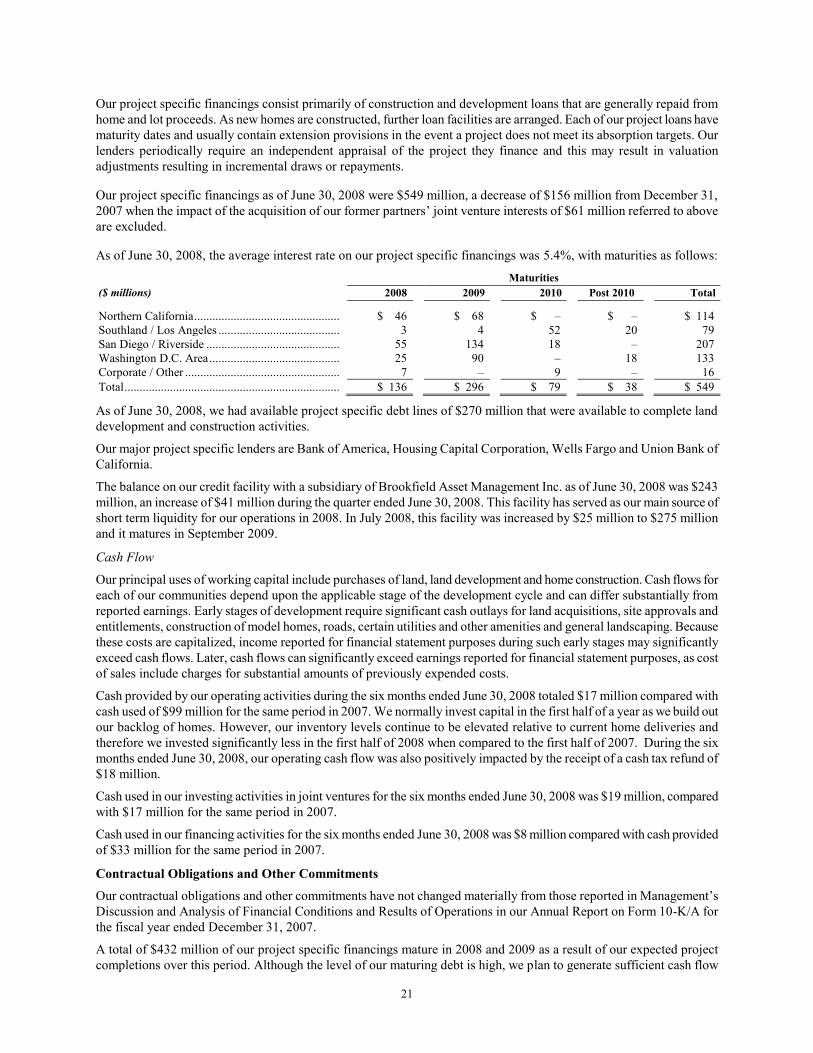
21
Our project specific financings consist primarily of construction and development loans that are generally repaid from
home and lot proceeds. As new homes are constructed, further loan facilities are arranged. Each of our project loans have
maturity dates and usually contain extension provisions in the event a project does not meet its absorption targets. Our
lenders periodically require an independent appraisal of the project they finance and this may result in valuation
adjustments resulting in incremental draws or repayments.
Our project specific financings as of June 30, 2008 were $549 million, a decrease of $156 million from December 31,
2007 when the impact of the acquisition of our former partners’ joint venture interests of $61 million referred to above
are excluded.
As of June 30, 2008, the average interest rate on our project specific financings was 5.4%, with maturities as follows:
Maturities
($ millions) 2008 2009 2010 Post 2010 Total
Northern California ................................................ $ 46 $ 68 $ – $ – $ 114
Southland / Los Angeles ........................................ 3 4 52 20 79
San Diego / Riverside ............................................ 55 134 18 – 207
Washington D.C. Area ........................................... 25 90 – 18 133
Corporate / Other ................................................... 7 – 9 – 16
Total ....................................................................... $ 136 $ 296 $ 79 $ 38 $ 549
As of June 30, 2008, we had available project specific debt lines of $270 million that were available to complete land
development and construction activities.
Our major project specific lenders are Bank of America, Housing Capital Corporation, Wells Fargo and Union Bank of
California.
The balance on our credit facility with a subsidiary of Brookfield Asset Management Inc. as of June 30, 2008 was $243
million, an increase of $41 million during the quarter ended June 30, 2008. This facility has served as our main source of
short term liquidity for our operations in 2008. In July 2008, this facility was increased by $25 million to $275 million
and it matures in September 2009.
Cash Flow
Our principal uses of working capital include purchases of land, land development and home construction. Cash flows for
each of our communities depend upon the applicable stage of the development cycle and can differ substantially from
reported earnings. Early stages of development require significant cash outlays for land acquisitions, site approvals and
entitlements, construction of model homes, roads, certain utilities and other amenities and general landscaping. Because
these costs are capitalized, income reported for financial statement purposes during such early stages may significantly
exceed cash flows. Later, cash flows can significantly exceed earnings reported for financial statement purposes, as cost
of sales include charges for substantial amounts of previously expended costs.
Cash provided by our operating activities during the six months ended June 30, 2008 totaled $17 million compared with
cash used of $99 million for the same period in 2007. We normally invest capital in the first half of a year as we build out
our backlog of homes. However, our inventory levels continue to be elevated relative to current home deliveries and
therefore we invested significantly less in the first half of 2008 when compared to the first half of 2007. During the six
months ended June 30, 2008, our operating cash flow was also positively impacted by the receipt of a cash tax refund of
$18 million.
Cash used in our investing activities in joint ventures for the six months ended June 30, 2008 was $19 million, compared
with $17 million for the same period in 2007.
Cash used in our financing activities for the six months ended June 30, 2008 was $8 million compared with cash provided
of $33 million for the same period in 2007.
Contractual Obligations and Other Commitments
Our contractual obligations and other commitments have not changed materially from those reported in Management’s
Discussion and Analysis of Financial Conditions and Results of Operations in our Annual Report on Form 10-K/A for
the fiscal year ended December 31, 2007.
A total of $432 million of our project specific financings mature in 2008 and 2009 as a result of our expected project
completions over this period. Although the level of our maturing debt is high, we plan to generate sufficient cash flow
22
from our assets in 2008 and 2009 to repay these obligations. Our net debt to total capitalization ratio as of June 30, 2008,
which we define as total interest-bearing debt less cash divided by total interest-bearing debt less cash plus stockholders’
equity and minority interest, was 65% compared to 61% at December 31, 2007. For a description of the specific risks
facing us if, for any reason, we are unable to meet these obligations, refer to the section of our Annual Report on Form
10-K/A for the year ended December 31, 2007 entitled "Risk Factors – Our Debt and Leverage Could Adversely Affect
our Financial Condition."
Our project specific financings require Brookfield Homes Holdings Inc., a wholly-owned subsidiary of our Company, to
maintain a tangible net worth of at least $250 million, a net debt to capitalization ratio of no greater than 65% and a net
debt to tangible net worth ratio of no greater than 2.50 to 1. Our revolving credit facility with a subsidiary of Brookfield
Asset Management Inc. requires us to maintain minimum stockholders’ equity of $300 million and a consolidated net
debt to book capitalization ratio of no greater than 70%. At June 30, 2008, we were in compliance with all our covenants.
Off-Balance Sheet Arrangements
In the ordinary course of business, we use lot option contracts to acquire control of land to mitigate the risk of declining
land values. Option contracts for the purchase of land permit us to control the land for an extended period of time, until
options expire and/or we are ready to develop the land to construct homes or sell the land. This reduces our financial
risk associated with land holdings. As of June 30, 2008, we had $63 million of primarily applicable, non-refundable
option deposits and other advanced costs. The total exercise price of these options was $353 million. Pursuant to FIN
46R, as described in Note 2 to our consolidated financial statements included elsewhere in this Form 10-Q, we have
consolidated $9 million of these option contracts. Please see Note 2 to our consolidated financial statements included
elsewhere in this Form 10-Q for additional information about our lot options.
We also own 2,460 lots through our proportionate share of joint ventures. As of June 30, 2008, our investment in housing
and land joint ventures totaled $100 million. We have provided varying levels of guarantees of debt in our joint ventures.
As of June 30, 2008, we had recourse guarantees of $36 million and limited capital maintenance guarantees of
$22 million with respect to debt in our joint ventures. During the six months ending June 30, 2008, we did not make
any loan re-margin repayments on the debt in our joint ventures.
We obtain letters of credit, performance bonds and other bonds to support our obligations with respect to the
development of our projects. The amount of these obligations outstanding at any time varies in accordance with our
development activities. If these letters of credit or bonds are drawn upon, we will be obligated to reimburse the issuer of
the letter of credit or bonds. As of June 30, 2008, we had $17 million in letters of credit outstanding and $183 million in
performance bonds for these purposes. The costs to complete related to our letters of credit and performance bonds are
$10 million and $90 million, respectively. We do not believe that any of these letters of credit or bonds are likely to be
drawn upon.
Forward-Looking Statements
This quarterly report on Form 10-Q contains “forward-looking statements” within the meaning of the United States
federal securities laws. The words "may," "believe," "will," "anticipate," "expect," "estimate," "project," "future," and
other expressions that are predictions of or indicate future events and trends and that do not relate to historical matters
identify forward-looking statements. The forward-looking statements in this quarterly report on Form 10-Q include,
among others, statements with respect to:
• ability to create shareholder value;
• strategies for shareholder value creation;
• cash flow generation and our ability to repay our debt obligations;
• the visibility on our future cash flow;
• future gross margins;
• the effect of interest rate changes on our cash flows;
• the effect on our business of existing lawsuits; and
• whether or not our letters of credit or performance bonds will be drawn upon.
Reliance should not be placed on forward-looking statements because they involve known and unknown risks,
uncertainties and other factors, which may cause the actual results to differ materially from the anticipated future results
expressed or implied by such forward-looking statements. Factors that could cause actual results to differ materially from
those set forward in the forward-looking statements include, but are not limited to:
23
• changes in general economic, real estate and other conditions;
• mortgage rate and availability changes;
• availability of suitable undeveloped land at acceptable prices;
• adverse legislation or regulation;
• ability to obtain necessary permits and approvals for the development of our land;
• availability of labor or materials or increases in their costs;
• ability to develop and market our master-planned communities successfully;
• confidence levels of consumers;
• ability to raise capital on favorable terms;
• adverse weather conditions and natural disasters;
• relations with the residents of our communities;
• risks associated with increased insurance costs or unavailability of adequate coverage;
• ability to obtain surety bonds;
• competitive conditions in the homebuilding industry, including product and pricing pressures; and
• additional risks and uncertainties, many of which are beyond our control, referred to in our Form 10-K/A for the
year ended December 31, 2007 and our other SEC filings.
Except as required by law, we undertake no obligation to publicly update any forward-looking statements unless required
by law, whether as a result of new information, future events or otherwise. However, any further disclosures made on
related subjects in subsequent reports on Forms 10-K, 10-Q and 8-K should be consulted.
Item 3. Quantitative and Qualitative Disclosures About Market Risk
Exchange Rates
We conduct business in U.S. dollars only, so we are not exposed to currency risks.
Interest Rates
We are exposed to financial risks that arise from the fluctuations in interest rates. Our interest bearing assets and
liabilities are mainly at floating rates, so we would be negatively affected, on balance, if interest rates increase. In
addition, we have interest rate swap contracts which effectively fix $260 million of our variable rate debt at an average
rate of 6.8% per annum. Based on our net debt levels as of June 30, 2008, a 1% change up or down in interest rates
would have either a negative or positive effect of approximately $5 million on our cash flows.
Our interest rate swaps are not designed as hedges under SFAS 133 “Accounting for Derivative Instruments and
Hedging Activities.” We are exposed to market risk associated with changes in the fair values of the swaps, and such
changes must be reflected in our income statements. As of June 30, 2008, the fair value of the interest rate swaps totaled a
liability of $7 million.
Item 4. Controls and Procedures
Evaluation of Disclosure Controls and Procedures. As of the end of our fiscal quarter ended June 30, 2008, an
evaluation of the effectiveness of our "disclosure controls and procedures" (as defined in Rules 13a – 15(e) and 15d –
15(e) of the United States Securities Exchange Act of 1934, as amended (the "Exchange Act")) was carried out under the
supervision and with the participation of our Chief Executive Officer ("CEO") and Chief Financial Officer ("CFO").
Based upon that evaluation, the CEO and CFO have concluded that as of the end of such fiscal quarter, our disclosure
controls and procedures are effective: (i) to ensure that information required to be disclosed by us in reports that we file
or submit under the Exchange Act is recorded, processed, summarized and reported within the time periods specified in
the Securities and Exchange Commission rules and forms; and (ii) to ensure that information required to be disclosed in
the reports that we file or submit under the Exchange Act is accumulated and communicated to our management,
including our CEO and CFO, to allow timely decisions regarding required disclosure.
It should be noted that while our management, including the CEO and CFO, believe our disclosure controls and
procedures provide a reasonable level of assurance that such controls and procedures are effective, they do not expect
that our disclosure controls and procedures or internal controls will prevent all error and all fraud. A control system, no
matter how well conceived or operated, can provide only reasonable, not absolute, assurance that the objectives of the
control system are met.
24
There was no change in our internal control over financial reporting during the quarter ended June 30, 2008, that has
materially affected, or is reasonably likely to materially affect, our internal control over financial reporting.
PART II. OTHER INFORMATION
Item 1. Legal Proceedings
We are party to various legal actions arising in the ordinary course of our business. We believe that none of these
actions, either individually or in the aggregate, will have a material adverse effect on our financial condition or results of
operations.
Item 1A. Risk Factors
There have been no material changes in our risk factors from those disclosed in our Annual Report on Form 10-K/A for
the fiscal year ended December 31, 2007.
Item 2. Unregistered Sales of Equity Securities and Use of Proceeds
Our Board of Directors approved a share repurchase program that allows us to repurchase in aggregate up to $144
million of our outstanding common shares of which the remaining amount approved for repurchase at June 30, 2008 was
approximately $49 million.
During the six months ended June 30, 2008, we did not repurchase any shares of our common stock.
Item 3. Defaults Upon Senior Securities
None.
Item 4. Submission of Matters to a Vote of Security Holders
Our 2008 Annual Meeting of Stockholders was held on May 1, 2008. The following proposals were submitted to and
approved by security holders at the Annual Meeting. All numbers reported are shares of our common stock.
1. The election of nine directors to hold office in accordance with our By-laws until the 2009 Annual Meeting of
Stockholders and until their respective successors have been duly elected and qualified.
2. The ratification of the appointment of Deloitte & Touche LLP as our independent auditors for the 2008 fiscal year.
For Against Abstain
22,156,863 681 673
Item 5. Other Information
None.
Item 6. Exhibits
(a) Exhibits.
31.1 Rule 13a - 14(a) certification by Ian G. Cockwell, President and Chief Executive Officer.
31.2 Rule 13a - 14(a) certification by Paul G. Kerrigan, Executive Vice President and Chief Financial Officer.
32.1 Certification of the Chief Executive Officer and Chief Financial Officer pursuant to 18 U.S.C. Section 1350.
25
SIGNATURES
Pursuant to the requirements of the Securities Exchange Act of 1934, the registrant has duly caused this report to be
signed on its behalf by the undersigned, thereunto duly authorized, on this 11th
day of
August, 2008.
BROOKFIELD HOMES CORPORATION
B
By:
/s/ PAUL G. KERRIGAN
Paul G. Kerrigan
Executive Vice President and Chief Financial Officer

EXHIBIT INDEX
Exhibit Description
31.1 Rule 13a - 14(a) certification by Ian G. Cockwell, President and Chief Executive Officer
31.2 Rule 13a - 14(a) certification by Paul G. Kerrigan, Executive Vice President and Chief Financial Officer
32.1 Certification of the Chief Executive Officer and Chief Financial Officer pursuant to 18 U.S.C.
Section 1350
EXHIBIT 31.1
CERTIFICATIONS I, Ian G. Cockwell, certify that:
1. I have reviewed this quarterly report on Form 10-Q of Brookfield Homes Corporation;
2. Based on my knowledge, this report does not contain any untrue statement of a material fact or omit to state a
material fact necessary to make the statements made, in light of the circumstances under which such statements
were made, not misleading with respect to the period covered by this report;
3. Based on my knowledge, the financial statements, and other financial information included in this report, fairly
present in all material respects the financial condition, results of operations and cash flows of the registrant as of,
and for, the periods presented in this report;
4. The registrant’s other certifying officer and I are responsible for establishing and maintaining disclosure controls
and procedures (as defined in Exchange Act Rules 13a-15(e) and 15d-15(e)) and internal control over financial
reporting (as defined in Exchange Act Rules 13a-15(f) and 15d-15(f)) for the registrant and have:
(a) Designed such disclosure controls and procedures, or caused such disclosure controls and procedures to be
designed under our supervision, to ensure that material information relating to the registrant, including its
consolidated subsidiaries, is made known to us by others within those entities, particularly during the period in
which this report is being prepared;
(b) Designed such internal control over financial reporting, or caused such internal control over financial reporting
to be designed under our supervision, to provide reasonable assurance regarding the reliability of financial reporting
and the preparation of financial statements for external purposes in accordance with generally accepted accounting
principles;
(c) Evaluated the effectiveness of the registrant’s disclosure controls and procedures and presented in this report
our conclusions about the effectiveness of the disclosure controls and procedures, as of the end of the period
covered by this report based on such evaluation; and
(d) Disclosed in this report any change in the registrant’s internal control over financial reporting that occurred
during the registrant's most recent fiscal quarter (the registrant’s fourth fiscal quarter in the case of an annual
report) that has materially affected, or is reasonably likely to materially affect, the registrant’s internal control over
financial reporting; and
5. The registrant’s other certifying officer and I have disclosed, based on our most recent evaluation of internal control
over financial reporting, to the registrant’s auditors and the audit committee of registrant’s board of directors (or
persons performing the equivalent functions):
(a) All significant deficiencies and material weaknesses in the design or operation of internal control over financial
reporting which are reasonably likely to adversely affect the registrant’s ability to record, process, summarize and
report financial information; and
(b) Any fraud, whether or not material, that involves management or other employees who have a significant role
in the registrant’s internal control over financial reporting.
Date: August 11, 2008
By: /s/ IAN G. COCKWELL
Ian G. Cockwell
President and Chief Executive Officer
EXHIBIT 31.2
CERTIFICATIONS
I, Paul G. Kerrigan, certify that:
1. I have reviewed this quarterly report on Form 10-Q of Brookfield Homes Corporation;
2. Based on my knowledge, this report does not contain any untrue statement of a material fact or omit to state a
material fact necessary to make the statements made, in light of the circumstances under which such statements were
made, not misleading with respect to the period covered by this report;
3. Based on my knowledge, the financial statements, and other financial information included in this report, fairly
present in all material respects the financial condition, results of operations and cash flows of the registrant as of, and
for, the periods presented in this report;
4. The registrant’s other certifying officer and I are responsible for establishing and maintaining disclosure controls and
procedures (as defined in Exchange Act Rules 13a-15(e) and 15d-15(e)) and internal control over financial reporting
(as defined in Exchange Act Rules 13a-15(f) and 15d-15(f)) for the registrant and have:
(a) Designed such disclosure controls and procedures, or caused such disclosure controls and procedures to be
designed under our supervision, to ensure that material information relating to the registrant, including its
consolidated subsidiaries, is made known to us by others within those entities, particularly during the period in which
this report is being prepared;
(b) Designed such internal control over financial reporting, or caused such internal control over financial reporting
to be designed under our supervision, to provide reasonable assurance regarding the reliability of financial reporting
and the preparation of financial statements for external purposes in accordance with generally accepted accounting
principles;
(c) Evaluated the effectiveness of the registrant’s disclosure controls and procedures and presented in this report our
conclusions about the effectiveness of the disclosure controls and procedures, as of the end of the period covered by
this report based on such evaluation; and
(d) Disclosed in this report any change in the registrant’s internal control over financial reporting that occurred
during the registrant’s most recent fiscal quarter (the registrant’s fourth fiscal quarter in the case of an annual report)
that has materially affected, or is reasonably likely to materially affect, the registrant's internal control over financial
reporting; and
5. The registrant’s other certifying officer and I have disclosed, based on our most recent evaluation of internal control
over financial reporting, to the registrant's auditors and the audit committee of registrant's board of directors (or
persons performing the equivalent functions):
(a) All significant deficiencies and material weaknesses in the design or operation of internal control over financial
reporting which are reasonably likely to adversely affect the registrant's ability to record, process, summarize and
report financial information; and
(b) Any fraud, whether or not material, that involves management or other employees who have a significant role in
the registrant’s internal control over financial reporting.
Date: August 11, 2008
By: /s/ PAUL G. KERRIGAN
Paul G. Kerrigan
Executive Vice President and Chief Financial Officer
EXHIBIT 32.1
CERTIFICATION PURSUANT TO
18 U.S.C. SECTION 1350,
AS ADOPTED PURSUANT TO
SECTION 906 OF THE SARBANES-OXLEY ACT OF 2002
In connection with the Quarterly Report of Brookfield Homes Corporation (the "Company") on Form 10-Q for the period
ended June 30, 2008, as filed with the Securities and Exchange Commission on the date hereof (the "Report"), each of
Ian G. Cockwell, Chief Executive Officer of the Company and Paul G. Kerrigan, Chief Financial Officer of the Company,
certify pursuant to 18.U.S.C. section 1350, as adopted pursuant to Section 906 of the Sarbanes-Oxley Act of 2002, that to
the best of their knowledge:
1. The Report fully complies with the requirements of section 13(a) or 15(d) of the Securities Exchange Act of 1934;
and
2. The information contained in the Report fairly presents, in all material respects, the financial condition and results
of operations of the Company.
Date: August 11, 2008
By: /s/ IAN G. COCKWELL
Ian G. Cockwell
President and Chief Executive Officer
By: /s/ PAUL G. KERRIGAN
Paul G. Kerrigan
Executive Vice President and Chief Financial Officer