united states harvesting productionin - srs.fs.fed.us · search was established in the 193o’s,...
TRANSCRIPT

United StatesDepartment ofAgriculture
Forest Service
Southern ForestExperiment Station
New Orleans,Louisiana
Research PaperSO-269September 1992
Harvesting Production inUneven-AgedLoblolly-Shortleaf PineStands: The Crossett FarmForestry FortiesR. Kluender, B. Stokes, and S. Woodfin
SUMMARY
Two Arkansas pine stands have been managed using uneven-aged manage-ment techniques since 1937. For many years the stands were harvested an-nually, but they have been harvested every 5 years since the 1970’s. A study todetermine productivity of the harvesting system was completed in the fa11 of1990. The system consisted of chain saw felling and grapple skidding. Fellingand skidding productivity varied significantly with the diameter of stems oraverage stem volume removed from each stand. The diameter distribution ofthe removed material caused significant differences in productivity betweenthe stands.
Harvesting Production in UnevenAged Loblolly-ShortleafPine Stands: The Crossett Farm Forestry Forties
R. Kluender, B. Stokes, and S. Woodfin
INTRODUCTION
Interest in the Good Forty and the Poor Forty (theForties) at the U.S. Department of Agriculture ForestService’s Southern Forest Experiment Station fieldlocation at Crossett, AB, has remained high over along period of time. These two 40-acre tracts were es-tablished to determine if previously unmanaged, un-derstocked, second-growth loblolly pine (Pinus tuedu)stands could be successfully rehabilitated andmanaged using uneven-aged management techniques(Reynolds and others 1984). “Good” and “Poor” refer tothe initial stocking conditions on the tracts when re-search was established in the 193O’s, not the siteclass, yields, or other stand characteristics. Similarstudies comparing yields and silvicultura1 perfor-mance of good and poor tracts have been establishedelsewhere in the South Central United States (Farrarand others 1989). The Arkansas Good and Poor Fortystudies have been of particular interest to managersbecause the uneven-aged management regimes havebeen imposed over a 50-year period. Interest in thestudies continues because of the present debate overeven-age VS. uneven-age management on both publicand private forest lands.
The two 40-acre pine tracts were established in1937. For many years, they were harvested annually,but since the late 1970’s partial harvests have beendone every 5 years. These harvests have resulted inuneven-aged stands of loblolly and shortleaf (P.echinata) pine. Most published studies of the Fortieshave reported silvicultura1 results from harvestingregimes imposed on the stands. However, no studyhas yet reported harvesting production for the twoForties. In November and December, 1990, the For-ties were harvested as a part of the continuingmanagement plan. At that time, sawtimber volumeswere reduced to residual stocking levels as prescribedby uneven-aged volume regulation. A field team ob-served and recorded production information as felling
and skidding progressed on the Forties. Time studieswere made of individual felling and skidding cycles oneach of the two tracts to determine whether meren-ces existed between tracts and to establish baselineproduction data for harvesting stands under uneven-aged management. Those studies are summarized inthis report.
Because the two 40-acre tracts are only harvestedevery 5 years, replication of the study was not pos-sible. Historie records of harvesting at Crossett fromthe 1950’s and 1960’s do exist, but harvestingmethods at that time cannot be compared to present-day operations. Earlier operations utilized earlymodel chain saws and extracted timber with smallcrawler tractors in contrast to the current operation,which used lightweight, high-production chains sawsand large, rubber-tired, grapple skidders.
Comparison of harvesting information acrossstudies has additional complicating factors. Produc-tion is strongly affected by the preharvest diameterdistribution of a stand and the diameter distributionof trees removed. The current cutting regime con-sisted of removing a few trees across a range of dia-meter classes. Additionally, harvesting contractor,equipment used, terrain, soil, and brush conditions al1contributed to variability in harvesting rates. Becauseof the varying conditions under which the studieshave been conducted, this report cannot be compareddirectly with other published studies; however, thegeneral trends may be contrasted with other studieswhere appropriate.
METHODS
Stands
The Good Forty and the Poor Forty were bothmarked for harvest by the technical staff stationed atthe Crossett Experimental Forest in accordance withstated management objectives for the two stands
R. Rluender is an associate professor of Forest Operations, Department of Forest Resources, University of Arkansas at Monticello,Monticello, AR 71655; B. Stokes is project leader, Engineering Systems for Intensive Forest Management, U.S. Department of Agricul-ture, Forest Service, Southern Forest Experiment Station, Auburn, AL 36849; S. Woodfin is natural resource specialist, Tennessee ValleyAuthority, Norris, TN 37828.
1

(Reynolds and tho ers 1984). Both tracts were level,with no significant slope that would atfect the har-vesting effort. Brush conditions on both tracts weremoderate to heavy, typified by honeysuckle, blackber-ry, and greenbrier. Soils on the tracts are moderatelydrained silt loams; site indexes ran fi-om 85 to 100(base age 50). The preharvest and postharvest quad-ratic mean diameters (QMD) for the stands were cal-culated. The QMD of the removed stand portions werealso calculated. The stand distributions were com-pared on a preharvest and postharvest basis using theKolmogorov-Smirnov (K-S) nonparametric test of dis-tribution similarity. The distribution of removedstand portions were also compared with a K-S test todetermine whether the harvest treatments weresimilar.
Felling
The felling crew, consisting of two sawyers sub-contracted by the skidding crew, was observed in bothtracts. Sawyers were instructed to fe11 al1 markedtrees within the stand boundaries. Trees were notdirectionally felled to optimize skidding. “Hung” treesoccurred severa1 times in both stands. When treeswere hung, the sawyer would stop work and have askidder pu11 or push the tree to the ground. Treeswere processed into tree-length stems. Limbing andtopping were generally done at the stump immedi-ately after felling.
A felling cycle was defined as the time it took thesawyer to walk to a tree (walk), clear the brush anddetermine felling direction of the tree (plan), fe11 thetree (cut), limb and top (limb and top) the tree, anddelays. The field research team members timed eachevent in the cycle and recorded the time. Delay time(delay) and the reason for the delay were recorded.Walk time started when the sawyer completed limb-ing and topping the previous tree and ended when thesawyer reached the tree to be cut. Plan time began atthe end of walk time and ended when the sawyerbegan cutting the tree. Cut time began when the sawflrst touched the tree and ended when the tree was onthe ground or stopped falling because it becamelodged (hung) on an adjacent tree. Limb and toptime started when the tree hit the ground and endedwhen the sawyer allowed the chain saw to idle andbegan walking to the next tree to be felled. Totalcycle time per tree was calculated as the sum of theevents for each tree.
After a tree was limbed and topped, a researchermeasured the d.b.h. (diameter at breast height) of thetree. Individual tree volumes were later determinedusing a formula developed from a local volume table.Production rates in cunitshr (100 cubic feet perproductive hour, excluding delays) were calculated foreach observation. Averages for walk time, plan time,
cut time, limb and top time, and delay time were com-puted by sawyer and by tract and for the overa11study. An analysis of variance was used to test for dif-ferences in production rate by sawyer and tract withtree diameter as a covariate. A structural regressionequation was developed to test the significance of eachof the relationships of the felling factors to cunits/hr.
Skidding
Two 120-horsepower, turbocharged, John Deere648-D skidders equipped with two-cord grapples and34-inch tires skidded the tree-length stems on bothtracts. Skidder operators prebunched enough stemsfor a ful1 load before traveling loaded to the landing.When skidders arrived at the landing, they droppedtheir load and pushed the stems into a pile for laterloading. Skidders incurred delays at the deck and inthe woods. At the deck, both skidders sometimes ar-rived simultaneously; when this occurred, one skidderwaited for the other to fmish dropping the load andpiling the skidded stems. In-the-woods delays oc-casionally occurred when hung trees needed to bepulled or pushed down or when sawyers fe11 behind intheir work and there were no stems to skid. Nomechanical delays were observed for the skiddersduring the study.
At the deck, skidded trees were measured to obtaind.b.h., top diameter, and length using tree calipersand a logger’s tape. For each skidder cycle, travelempty, travel loaded, bunching, positioning and un-grapple times were recorded. Skidding distancesalong skid trails were measured, and colored flaggingwas hung in nonharvested trees at measured distan-ces from the deck to aid in measurement of exact skid-ding distance. Travel empty time began when theskidder left the deck going back into the woods.Bunching, positioning, intermediate travel, and grap-ple/deck times were recorded when the skidder was inthe vicinity of the first stem to be bunched and con-tinued until the skidder had a ful1 grapple and startedback toward the landing with a load. Travel loadedtime began when the skidder left the bunch positionand started moving toward the landing with a load.Travel loaded time ceased when the grapple wasopened on the deck and the load dropped. Ungrappletime included time taken to push stems into a pile andmaneuver to return to the woods for another drag.
Production rates were calculated for each observa-tion. Averages for travel empty, bunching, position-ing, intermediate travel, travel loaded, and ungrappletimes were computed by skidder and by tract, and forthe overa11 study. An analysis of variance was used totest for differences in production rate by skidder andby tract, with skidded volume and total distance ascovariates. A structural regression equation was
2

developed to test the significance of each of the factorscontributing to total skidding time.
FWXJLTS
Stands
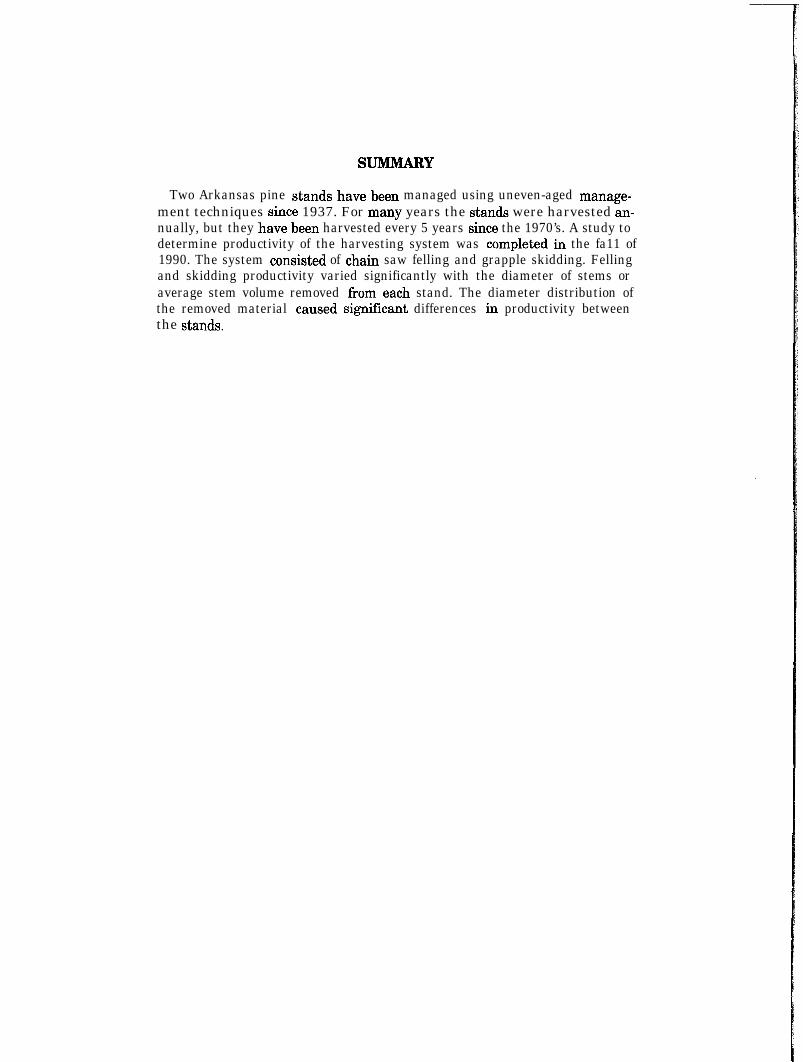
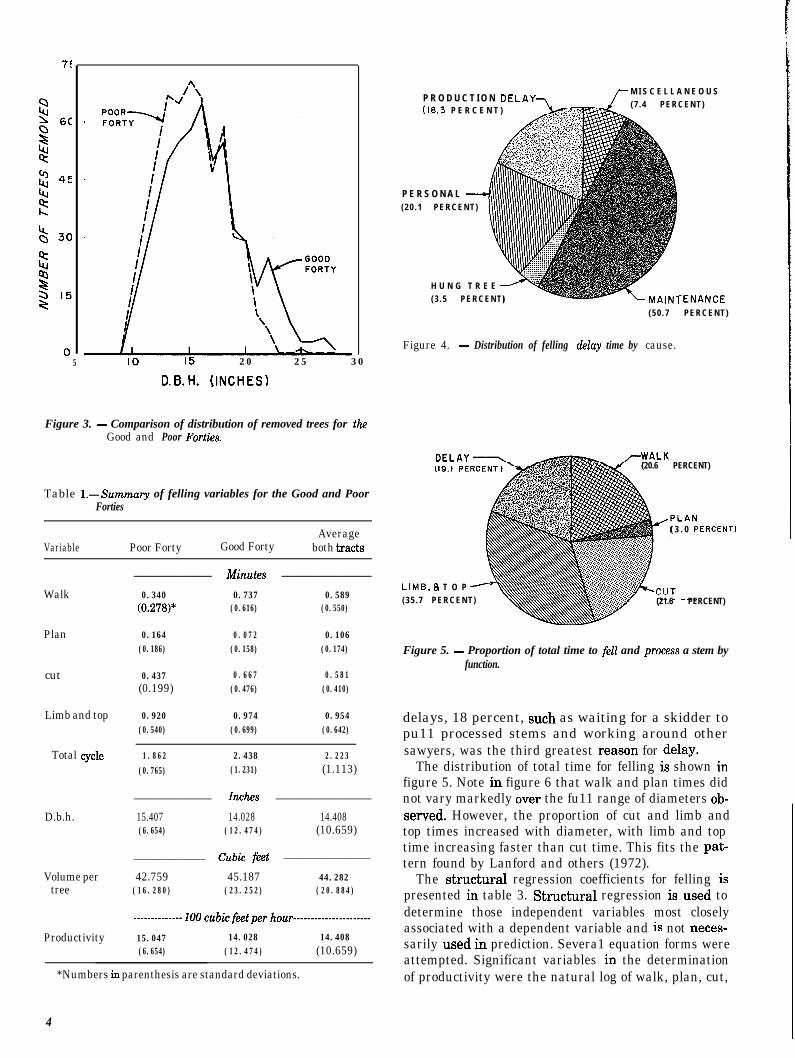
The preharvest and postharvest distributions(number of trees by d.b.h. class) are shown in figures1 and 2 for both stands. Number of trees by d.b.h.class removed from each stand is displayed in figure 3.The Poor Forty (fig. 1) showed a strongly bimodal dis-tribution with a 13.2-inch QMD preharvest and 12.3inch QMD postharvest. Postharvest, the Poor Fortywas not as pronounced in its bimodal pattern, but itstill did not have the strong reverse-J tendencyfavored in uneven-age management. The Good Fortydisplayed a slight reverse-J distribution preharvest,with a 13.7-inch QMD preharvest and a 12.6-inchQMD postharvest. Postharvest, the Good Forty ap-proached the traditional reverse-J shape.
The K-S test of preharvest and postharvest standdistributions between the two Forties showed that thedistributions were similar in the number of trees, orbasal area by d.b.h. class, preharvest and postharvest(~~0.746). Additionally, both stands had a similarnumber of trees removed, and the distributions ofremoved trees by d.b.h. class were similar (p=O.483).Thus, the stands were statistically similar bothpreharvest and postharvest and in the harvesting
250
,-
l -
) -
)-
)-
P O O R F O R T Y
POST HARVEST
‘REH ARVEST
0 10 20
D . B . H . (INCHES)
Figure 1. - Number of trees by d.b.h. for the Poor Forty prehar-e. vest and postharvest.
treatment. This would suggest that there should be nosignifícant differences in harvesting productivityrates between the two stands. However, the GoodForty had 60 more trees above a 20-inch d.b.h.removed than the Poor Forty, whereas the Poor Fortyhad 40 more trees removed below a 20-inch d.b.h.than the Good Forty. The QMD of the 451 treesremoved from the Poor Forty was 16.4 inches,whereas it was 17.6 inches for the 471 trees from theGood Forty.
Felling
The analysis of variance of production rate revealedno production rate differences between sawyers orsawyers across tracts. However, the covariate, d.b.h.2of processed trees, was significant in production rate.Accordingly, al1 118 felling observations of bothsawyers and tracts were lumped together. Mean walktime was 0.59 minute; mean plan time, 0.11 minute;mean cut time, 0.68 minute; and, mean limb and toptime, 0.95 minute. Mean production rate for the twosawyers was 14.41 cunits/hr (table 1).
Delays occurred infrequently; mean delay time was3.16 minutes. Figure 4 shows that the major delaywas maintenance, wbich included saw filing andrefueling. Hung trees accounted for a small percent-age of delay time (3.5 percent), whereas personal time(operator rest breaks, water breaks, etc.) accountedfor 20 percent of the total delay time. Production
250G O O D F O R T Y
0 10 2 0 30
0. B.H. (INCHES)
Figure 2. - Number of trees by d.b.h. for the Good Forty prehar-vest and postharvest.
3
5 10 15 20 25 30
13.e.H. (INCHES)
Figure 3. - Comparison of distribution of removed trees for theGood and Poor Fort&.
Table l.-Summary of felling variables for the Good and PoorForties
Variable Poor Forty Good FortyAverage
both tracts
Walk
Plan
cut
Limb and top
Total cycle
D.b.h.
Volume pertree
Productivity
__________________________ Minutes ______________________________
0.340 0.737 0.589(0.278)* (0.616) (0.550)
0.164 0.072 0.106(0.186) (0.158) (0.174)
0.437 0.667 0.581(0.199) (0.476) (0.410)
0.920 0.974 0.954(0.540) (0.699) (0.642)
1.862 2.438 2.223(0.765) (1.231) (1.113)
__________________________ Znches ________________________________
15.407 14.028 14.408(6.654) (12.474) (10.659)
________________________ Cu& feet _____________________________
42.759 45.187 44.282(16.280) (23.252) (20.884)
---------loo cubicf&per hour----------------------
15.047 14.028 14.408(6.654) (12.474) (10.659)
*Numbers in parenthesis are standard deviations.
4
P R O D U C T I O N DELAY(18.3 P E R C E N T )
M I S C E L L A N E O U S(7 .4 PERCENT)
P E R S O N A L(20 .1 PERCENT)
H U N G T R E E(3 .5 PERCENT) -ENANCE
(50 .7 PERCENT)
Figure 4. - Distribution of felling delay time by cause.
(20.6 PERCENT)
( 3 . 0 PERCENTI
(21.6 PERCENT)
LIME, 8 T O P(35 .7 PERCENT)
Figure 5. - Proportion of total time to fe11 and process a stem byfunction.
delays, 18 percent, such as waiting for a skidder topu11 processed stems and working around othersawyers, was the third greatest reason for delay.
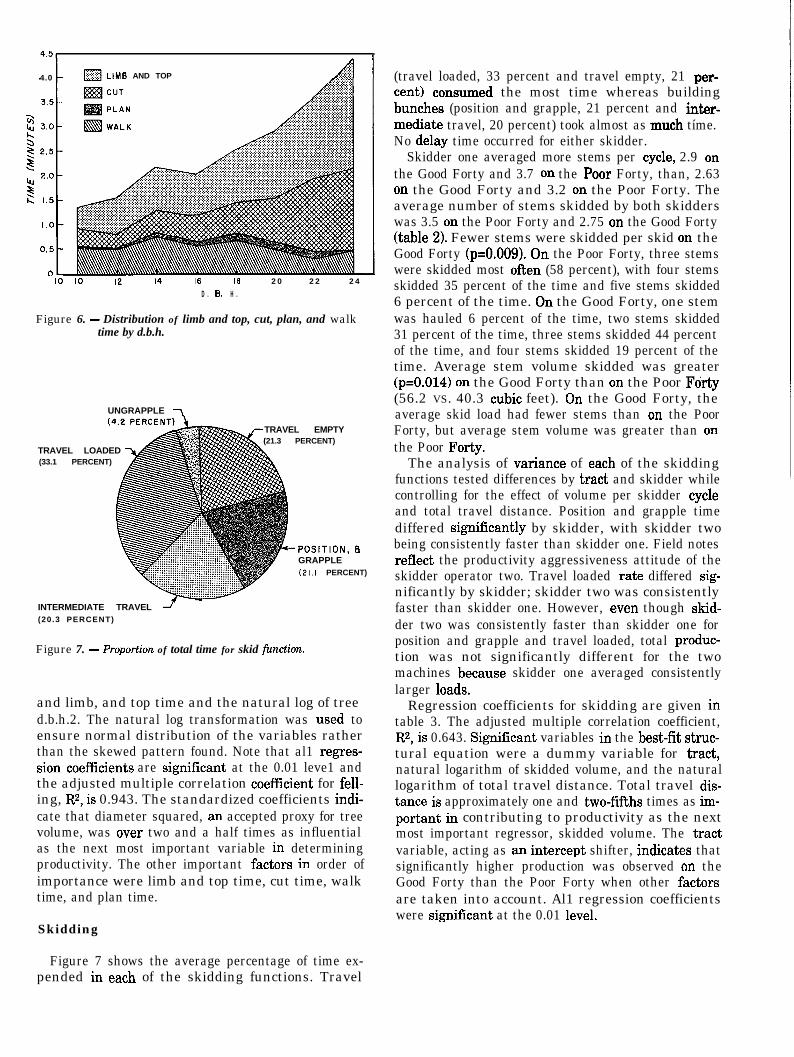
The distribution of total time for felling is shown infigure 5. Note in figure 6 that walk and plan times didnot vary markedly over the fu11 range of diameters ob-served. However, the proportion of cut and limb andtop times increased with diameter, with limb and toptime increasing faster than cut time. This fits the pat-tern found by Lanford and others (1972).
The structural regression coefficients for felling ispresented in table 3. Structural regression is used todetermine those independent variables most closelyassociated with a dependent variable and is not neces-sarily used in prediction. Severa1 equation forms wereattempted. Signifícant variables in the determinationof productivity were the natural log of walk, plan, cut,
4.0 caLIMB AND TOP
-10 10 12 14 16 16 2 0 2 2 2 4
D . 6. H .
Figure 6. - Distribution of limb and top, cut, plan, and walktime by d.b.h.
UNGRAPPLE 7
TRAVEL LOADED(33.1 PERCENT)
TRAVEL EMPTY(21.3 PERCENT)
PDSITION, 8:GRAPPLE(21.1 PERCENT)
INTERMEDIATE TRAVEL = -(20.3 PERCENT)
Figure 7. - Proportion of total time for skid finction.
and limb, and top time and the natural log of treed.b.h.2. The natural log transformation was used toensure normal distribution of the variables ratherthan the skewed pattern found. Note that al1 regres-sion coeffrcients are signifícant at the 0.01 leve1 andthe adjusted multiple correlation coeffrcient for fell-ing, Rs, is 0.943. The standardized coefficients indi-cate that diameter squared, an accepted proxy for treevolume, was over two and a half times as influentialas the next most important variable in determiningproductivity. The other important factors in order ofimportance were limb and top time, cut time, walktime, and plan time.
Skidding
(travel loaded, 33 percent and travel empty, 21 per-cent) consumed the most time whereas buildingbunches (position and grapple, 21 percent and inter-mediate travel, 20 percent) took almost as much tíme.No delay time occurred for either skidder.
Skidder one averaged more stems per cycle, 2.9 onthe Good Forty and 3.7 on the Peor Forty, than, 2.63on the Good Forty and 3.2 on the Poor Forty. Theaverage number of stems skidded by both skidderswas 3.5 on the Poor Forty and 2.75 on the Good Forty(table 2). Fewer stems were skidded per skid on theGood Forty (p=O.O09). On the Poor Forty, three stemswere skidded most often (58 percent), with four stemsskidded 35 percent of the time and five stems skidded6 percent of the time. On the Good Forty, one stemwas hauled 6 percent of the time, two stems skidded31 percent of the time, three stems skidded 44 percentof the time, and four stems skidded 19 percent of thetime. Average stem volume skidded was greater(p=O.O14) on the Good Forty than on the Poor Forty(56.2 VS. 40.3 cubic feet). On the Good Forty, theaverage skid load had fewer stems than on the PoorForty, but average stem volume was greater than onthe Poor Forty.
The analysis of variance of each of the skiddingfunctions tested differences by tract and skidder whilecontrolling for the effect of volume per skidder cycleand total travel distance. Position and grapple timediffered significantly by skidder, with skidder twobeing consistently faster than skidder one. Field notesreflect the productivity aggressiveness attitude of theskidder operator two. Travel loaded rate differed sig-nificantly by skidder; skidder two was consistentlyfaster than skidder one. However, even though skid-der two was consistently faster than skidder one forposition and grapple and travel loaded, total produc-tion was not significantly different for the twomachines because skidder one averaged consistentlylarger loads.
Regression coefficients for skidding are given intable 3. The adjusted multiple correlation coefficient,Rs, is 0.643. Signifícant variables in the best-fit struc-tural equation were a dummy variable for tract,natural logarithm of skidded volume, and the naturallogarithm of total travel distance. Total travel dis-tance is approximately one and two-fifths times as im-,portant in contributing to productivity as the nextmost important regressor, skidded volume. The tractvariable, acting as an intercept shifter, indicates thatsignificantly higher production was observed on theGood Forty than the Poor Forty when other factorsare taken into account. Al1 regression coefficientswere significant at the 0.01 level.
Figure 7 shows the average percentage of time ex-pended in each of the skidding functions. Travel
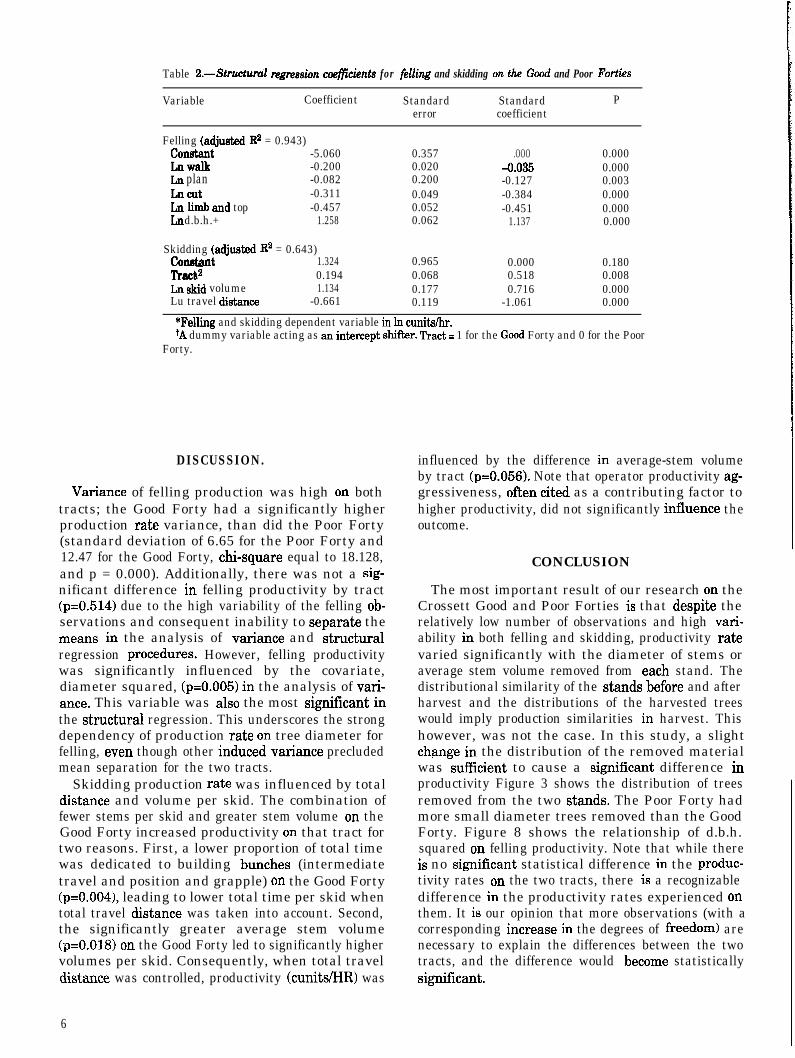
Table 2.-Structuml regression coeficients for felling and skidding on tke G’ood and Poor Forties
Variable Coefficient Standard Standard Perror coefficient
Felling (a&mt.ed R2 = 0.943)constant -5.060 0.357 .OOO 0.000Lnwalk -0.200 0.020 4.035 0.000Lu plan -0.082 0.200 -0.127 0.003Lncut -0.311 0.049 -0.384 0.000Ia limb and top -0.457 0.052 -0.451 0.000Ln d.b.h.+ 1.258 0.062 1.137 0.000
Skidding (adjusted R2 = 0.643)comnt 1.324 0.965 0.000 0.180Tra& 0.194 0.068 0.518 0.008Ln skid volume 1.134 0.177 0.716 0.000Lu travel distance -0.661 0.119 -1.061 0.000
*Felling and skidding dependent variable in In cunitsk.TA dummy variable acting as an intercept shifker. Tract = 1 for the Cood Forty and 0 for the Poor
Forty.
DISCUSSION.
Variance of felling production was high on bothtracts; the Good Forty had a significantly higherproduction rate variance, than did the Poor Forty(standard deviation of 6.65 for the Poor Forty and12.47 for the Good Forty, chi-square equal to 18.128,and p = 0.000). Additionally, there was not a sig-nificant difference in felling productivity by tract(p=O.514) due to the high variability of the felling ob-servations and consequent inability to separate themeans in the analysis of variance and structuralregression procedures. However, felling productivitywas significantly influenced by the covariate,diameter squared, (p=O.O05) in the analysis of vari-ante. This variable was also the most significant inthe structural regression. This underscores the strongdependency of production rate on tree diameter forfelling, even though other induced variance precludedmean separation for the two tracts.
Skidding production rate was influenced by totaldistance and volume per skid. The combination offewer stems per skid and greater stem volume on theGood Forty increased productivity on that tract fortwo reasons. First, a lower proportion of total timewas dedicated to building bunches (intermediatetravel and position and grapple) on the Good Forty(p=O.O04), leading to lower total time per skid whentotal travel distance was taken into account. Second,the significantly greater average stem volume(p=O.OM) on the Good Forty led to significantly highervolumes per skid. Consequently, when total traveldistance was controlled, productivity (cunits/HR) was
influenced by the difference in average-stem volumeby tract (p=O.O56). Note that operator productivity ag-gressiveness, often cited as a contributing factor tohigher productivity, did not significantly influente theoutcome.
CONCLUSION
The most important result of our research on theCrossett Good and Poor Forties is that despite therelatively low number of observations and high vari-ability in both felling and skidding, productivity ratevaried significantly with the diameter of stems oraverage stem volume removed from each stand. Thedistributional similarity of the stands before and afterharvest and the distributions of the harvested treeswould imply production similarities in harvest. Thishowever, was not the case. In this study, a slightchange in the distribution of the removed materialwas sufficient to cause a significant difference inproductivity Figure 3 shows the distribution of treesremoved from the two stands. The Poor Forty hadmore small diameter trees removed than the GoodForty. Figure 8 shows the relationship of d.b.h.squared on felling productivity. Note that while thereis no significant statistical difference in the produc-tivity rates on the two tracts, there is a recognizabledifference in the productivity rates experienced onthem. It is our opinion that more observations (with acorresponding increase in the degrees of freedom) arenecessary to explain the differences between the twotracts, and the difference would become statisticallysignificant.
6
Table 3.-Summary of skidding variable for Good and Poor Forties
Variable Poor Forty Good FortyAverage
both tracts
Travel empty
Position andgrwple
Intermediatetravel
Travel loaded
Ungrapple
Total cycle
Average totaldistance
Volume perskid
Stems per skid
Average stemvolume
Productivity
----------________________ Minutes ____________________________
1.262 2.148 1.694(0x4)* (0.832) (0.811)
1.227 2.138 1.669(0.643) (1.881) (1.442)
1.716 1.506 1.614(0.961) (1.501) (1.237)
2.265 3.007 2.625(1.185) (0.931) (1.118)
0.618 0.038 0.337(0.773) (0.069) (0.622)
7.092 8.837 7.938(2.317) (2.485) (2.522)
_____________________________ Feet _______________________________
8 3 0 2 1 0 0 1446(291) (703) (831)
_____________________ 100 cubic feet __________________________
1.35 1.41 1.38(0.27) (0.39) (0.33)
__________________________ Number ____________________________
2 .75 3 .47 3 .12(0.87) (0.62) (0.82)
_______________________ Cubic feet ____________________________
40.26 56.20 47.99(11.56) (22.27) (19.10)
_______________ 100 cubic feet per hour ___________________
12.45 10.35 ll.43(4.28) (4.27) (4.32)
*Numbers in parenthesis are standard deviations.
For skidding, production rates (after correction forskidding distance and skidded volume) were higherfor the Good Forty than for the Poor Forty (fig. 9). Attotal travel distances of less than 750 feet, distancewas more significar-k in the determination of skiddingproductivity than was average tree size. However, attotal travel distances beyond 750 feet, the largeraverage tree size observed on the- Good Fortyproduced higher production rates.
Recall that although there was no significant dif-ference in the removed portions of the two stands,there was a 1.2 inch difference in the QMXkThus, forfelling, we conclude that for the conditions of this
00 GOOD FORTY
l POOR FORTY
Qo . I0e. . . . Im- .
0
1 0 0 200 300 400 500 600TREE S IZE (D.B.H.2)
Figure 8. - Relationship of felling production to tree size for theGood Forty and the Poor Forty, with the best-fit curvefor each tract.
I I I I I I1 , 0 0 0 2,000 3,000
TOTAL TRAVEL DISTANCE (FEET)
Figure 9. -&lationship of skidding production to total traveldistance for the Good Forty and the Poor Forty, withthe best-fit curve for each tract.
study the d.b.h. distribution of trees removed in aselection harvest is the single most important factorinfluencing productivity rate. Similarly, for skidding,the distribution of trees removed in a selection har-vest is the third most important factor in influencingharvesting productivity rate, ranking only behindskidding distance and skidded volume. A removal dis-tribution weighted to larger d.b.h. trees will producehigher productivity rates than a distribution weightedto lower d.b.h. classes. Size distribution of theremoved stems and skidded volume are both included,instead of average stem volume alone, because a skid-der may not always travel with a ful1 grapple load.This research suggests that the difference in the re-moval diameter distributions between two standscaused a signifícant difference in productivity rates.This further implies that harvesting cost differenceswill occur for relatively minor changes in removal dis-tributions.
LITERM’URE CITED
Farrar, R.M.; Straka, T.J.; Burkhardt, C.E. 1989. Aquarter-century of selection management on theMississippi State Farm Forestry Forties. MAFESBull. No. 164. Mississippi State, MS: MississippiAgricultura1 and Forestry Experiment Station. 24P*
Lanford, B.L.; Cunia, T.; Haver, G.F. 1972. Handbookof production tables. APA Harvesting ResearchProject. Washington, DC: Ameritan Pulpwood As-sociation. 523 p.
Reynolds, R.R.; Baker, J.B.; Ku, T.T. 1984. Fourdecades of selection management on the CrossettFarm Forestry Forties. Bulletin No. 872. Fayette-ville, AR: Agricultura1 Experiment Station, Divi-sion of Agriculture, University of Arkansas. 43 p.
Kluender, R.; Stokes, B.; Woodf’m, S. 1992. Harvesting production inuneven-aged loblolly-shortleaf pine stands: the Crossett FarmForestry Forties. Res. Pap. SO-269, New Orleans, LA: U.S. Depart-ment of Agriculture, Forest Service, Southern Forest ExperimentStation. 8 p.
Two stands managed using uneven-aged techniques were har-vested as par-t of a 5-year entry schedule. Felling and skiddingproductivity varied significantly with average stem diameter andvolume and was affected by diameter distribution of the removedmaterial.
Keywords: Felling, skidding.
The use of trade, firm, or corporation names in this paper is for the informa-tion and conveniente of the reader. Such use does not constitute official en-dorsement or approval by the U.S. Department of Agriculture of any product orservice to the exclusion of others that may be available.
Persons of any race, color, national origin, sex, age, religion, or with anyhandicapping condition are welcome to use and enjoy al1 facilities, programs,and services of the USDA. Discrimination in any form is strictly againstagency policy, and should be reported to the Secretary of Agriculture,Washington, DC 20250.
