united states evaluation of new canal point … of new canal point sugarcane clones ... cp 02 and...
TRANSCRIPT

i
United States Department of Agriculture
AgriculturalResearchService
ARS–171
July 2010
Evaluation of New Canal Point Sugarcane Clones
2008–2009 Harvest Season
ii
Abstract
Glaz, B., J.C. Comstock, R.W. Davidson, S. Sood, S.J. Edmé, I.A. del Blanco, N.C. Glynn, R.A. Gilbert, and D. Zhao. 2010. Evaluation of New Canal Point Sugarcane Clones: 2008-2009 Harvest Season, ARS-171. U.S. Department of Agriculture, Agricultural Research Service, Washington, D.C., 36 pp.
Twenty-eight replicated experiments were conducted on 10 farms (representing 4 muck and 3 sand soils) to evaluate 36 new Canal Point (CP) and 26 new Canal Point and Clewiston (CPCL) clones of sugarcane from the CP 04, CP 03, CP 02, CP 01, CPCL 02, CPCL 01, CPCL 00, CPCL 99, and CPCL 95 series. Experiments compared the cane and sugar yields of the new clones, complex hybrids of Saccharum spp., primarily with yields of CP 89-2143, and to a lesser extent with CP 72-2086 and CP 78-1628. All three were major sugarcane cultivars in Florida. Each clone was tested for its fiber content and its tolerance to diseases and cold temperatures. Based on results of these and previous years’ tests, one new clone—CPCL 99-4455—was released for commercial production in Florida.
The audience for this publication includes growers, geneticists and other researchers, extension agents, and individuals who are interested in sugarcane cultivar development.
Keywords: Brown rust, histosol, muck soil, orange rust, organic soil, Puccinia kuehnii, Puccinia melanocephala, Saccharum spp., Sporisorium scitaminea, sugarcane cultivars, sugarcane smut, sugarcane yields, sugar yields.
Mention of trade names or commercial products in this publication is solely for the purpose of providing specific information and does not imply recommendation or endorsement by the U.S. Department of Agriculture over others not mentioned.
While supplies last, single copies of this publication can be obtained at no cost from Barry
Glaz, USDA-ARS-SAA, U.S. Sugarcane Field Station, 12990 U.S. Highway 441 N, Canal Point, FL 33438; or by e-mail at [email protected].
Copies of this publication may be purchased in various formats (microfiche, photocopy, CD, print on demand) from the National Technical Information Service, 5285 Port Royal Road, Springfield, VA 22161, (800) 553-6847, www.ntis.gov.
The U.S. Department of Agriculture (USDA) prohibits discrimination in all its programs and activities on the basis of race, color, national origin, age, disability, and where applicable, sex, marital status, familial status, parental status, religion, sexual orientation, genetic information, political beliefs, reprisal, or because all or part of an individual’s income is derived from any public assistance program. (Not all prohibited bases apply to all programs.) Persons with disabilities who require alternative means for communication of program information (Braille, large print, audiotape, etc.) should contact USDA’s TARGET Center at (202) 720-2600 (voice and TDD). To file a complaint of discrimination, write to USDA, Director, Office of Civil Rights, 1400 Independence Avenue, SW, Washington, DC
20250-9410, or call (800) 795-3272 (voice) or (202) 720-6382 (TDD). USDA is an equal opportunity provider and employer.
Acknowledgments
The authors acknowledge the assistance of Velton Banks and Matthew Paige of the Florida Sugar Cane League, Inc., and Ricardo Ramirez, Johnnie Tejeda, and Juan Tejeda of USDA-ARS in conducting the fieldwork described herein; and of Stephen Jennewein of USDA-ARS for conducting laboratory work, data input, database management, and table development for this report. The authors also express their appreciation to the growers who provided land, labor, cultivation, and other support for these experiments.
iii
Contents
Abbreviations .............................................................................................................. iv
Test procedures ............................................................................................................ 4
Results and discussion ................................................................................................. 7
Plant-cane crop, CP 04, CPCL 02, and CPCL 99 series on muck soils ................... 7
Plant-cane crop, CP 04 and CPCL 02 series on sand soils ...................................... 8
Plant-cane crop, CP 03, CPCL 00, and CPCL 01 series on muck soils ................... 8
First-ratoon crop, CP 03, CPCL 00, and CPCL 01 series on muck soils ................. 8
First-ratoon crop, CP 03, CPCL 00, and CPCL 01 series on sand soils................... 9
First-ratoon crop. CP 02 and CPCL 99 series .......................................................... 9
Second-ratoon crop, CP 02 and CPCL 99 series .................................................... 10
Second-ratoon crop, CP 01 series .......................................................................... 10
Summary .................................................................................................................... 11
References .................................................................................................................. 12
Tables ........................................................................................................................ 14

iv
Abbreviations
ARS Agricultural Research Service
CP Canal Point
CPCL Canal Point and Clewiston
CV Coefficient of variation
KS/T Theoretical recoverable yield of 96o sugar in kilograms per metric ton of cane
LSD Least significant difference
NIRS Near infrared reflectance spectroscopy
TC/H Cane yields in metric tons per hectare
TS/H Theoretical yields of 96o sugar in metric tons per hectare
USSC United States Sugar Corporation
1
Evaluation of New Canal Point Sugarcane Clones2008-2009 Harvest Season
B. Glaz, J.C. Comstock, R.W. Davidson, S. Sood, S.J. Edmé, I.A. del Blanco, N.C. Glynn, R.A. Gilbert, and D. Zhao
Breeding and selection for clones that can be used for commercial production of sugarcane, complex hybrids of Saccharum spp., support the continued success of this crop in Florida. Though production of sugar per unit area is a principal selection characteristic, it is not the only factor on which sugarcane is evaluated. In addition, analyses are made on the concentration of sugar and on the fiber content of the cane. The economic value of each clone integrates its harvesting, transportation, and milling costs with its expected returns from sugar production. Deren et al. (1995) developed an economic index for clonal evaluation in Florida. Evaluation of clonal suitability also includes its reactions to endemic pathogens.
This report summarizes the cane production and sugar yields of the clones in the plant-cane, first-ratoon, and second-ratoon stage IV experiments sampled in Florida’s 2008-2009 sugarcane harvest season. This information is used to identify commercial cultivars in Florida and identify clones with useful characteristics for the Canal Point sugarcane breeding and selection program. The information is also used by representatives of other sugarcane industries to request Canal Point clones. Throughout this report, the term clone or genotype refers to a genetically unique sugarcane entry in
Stage IV, or any other stage of the Canal Point sugarcane breeding and selection program. The term sugarcane cultivar refers to any genotype that was released for commercial production.
The time of year and the duration that a clone yields its highest quantity of sugar per unit area are important because the Florida sugarcane harvest season extends from October to April. Because sugarcane is commercially grown in plant and ratoon crops, clones are evaluated accordingly. Adaptability to mechanical harvesters is an important trait in Florida. All sugarcane sent to Florida mills and much of the sugarcane used for planting is mechanically harvested. Before a new clone is released, Florida growers judge its acceptability for mechanical operations.
Genotypes with desired agronomic characteristics also must be productive in the presence of harmful diseases, insects, and weeds. Some pathogens rapidly develop new, virulent races or strains. Because of these changes in pathogen populations, clonal resistance is not considered permanent. The selection team at Canal Point uses some genotypes as parents that are too susceptible to pests to be grown commercially, but does not advance these genotypes in its selection program.
Two rust fungi in Florida have infected a large number of genotypes in the Canal Point program. From 2000 to 2005, this program discarded 15 clones that were within 1 year of commercial release due to new infections of brown rust, caused by Puccinia melanocephala Syd & P. Syd. During the summer of 2007, orange rust, caused by Puccinia kuehnii E.J. Butler, was detected in infected commercial sugarcane fields in Florida (Comstock et al. 2008). The pathogen against which this program has had its most success in selecting resistant cultivars is sugarcane smut, caused by Sporisorium scitaminea (Syd.) M. Piepenbring, M. Stoll, & F. Oberwinkler. Other diseases the Canal Point program must contend with are leaf scald, caused by Xanthomonas albilineans (Ashby) Dow; sugarcane yellow leaf virus, a disease caused by a luteovirus (Lockhart
Glaz and Zhao are research agronomists; Comstock is a research plant pathologist; Sood is a plant pathologist; Edmé and del Blanco are research geneticists; and Glynn is a research molecular biologist, U.S. Department of Agriculture, Agricultural Research Service, U.S. Sugarcane Field Station, Canal Point, FL. Davidson is an agronomist, Florida Sugar Cane League, Inc., Clewiston, FL. Gilbert is an associate professor in agronomy, Everglades Research and Education Center, Institute of Food and Agricultural Sciences, University of Florida, Belle Glade, FL.
2
et al. 1996); sugarcane mosaic strain E; and ratoon stunting, caused by Leifsonia xyli subsp. xyli Evtsuhenko et al. Ratoon stunting has probably been the most damaging, though the least visible, sugarcane disease in Florida. A program to improve resistance of CP clones to ratoon stunting is underway (Comstock et al. 2001). In addition to improved resistance, growers can also minimize yield losses by planting stalks that do not contain the bacteria that cause ratoon stunting. This can be accomplished either by planting stalks that have been treated with hot-water therapy that kills the ratoon stunting bacteria or by using disease-free stalks derived from meristem tissue culture.
Scientists at Canal Point screen clones in their selection program for resistance to brown rust, orange rust, smut, leaf scald, sugarcane yellow leaf virus, mosaic, ratoon stunting, and eye spot caused by Bipolaris sacchari (E.J. Butler) Shoemaker. Eye spot is not currently a commercial problem in Florida.
Recently, researchers in Florida have begun assessing fungicide control of sugarcane orange rust. Otherwise, sugarcane growers in Florida prefer to rely on genotype resistance to sugarcane diseases. However, it is increasingly difficult to develop high-yielding cultivars that are resistant to all diseases, so growers are also accepting some new cultivars with tolerance, rather than resistance, to some diseases. In the 2008 growing season, 6 cultivars comprised 88.4 percent of Florida’s sugarcane (Rice et al. 2009). All six of these cultivars—CP 72-2086 (Miller et al. 1984), CP 78-1628 (Tai et al. 1991), CP 80-1743 (Deren et al. 1991), CP 84-1198 (Glaz et al. 1994), CP 88-1762 (Tai et al. 1997), and CP 89-2143 (Glaz et al. 2000)—were at least moderately susceptible to one or more of the following sugarcane diseases: brown rust, orange rust, mosaic, leaf scald, smut, and ratoon stunting. Glaz et al. (1986) presented a formula and procedure to help growers distribute their available sugarcane cultivars while considering possible attacks of new pests.
Damaging insects in Florida are the sugarcane borer, Diatraea saccharalis (F.); the sugarcane lace bug, Leptodictya tabida; the sugarcane wireworm, Melanotus communis; the sugarcane grub, Ligyrus subtropicus; and the West Indian cane weevil, Metamasius hemipterus (L.).
Winter freezes are common in the region of Florida where much of the sugarcane is produced. The severity and duration of a freeze and the tolerance of specific sugarcane cultivars are the major factors that determine how much damage occurs. The damage caused by such freezes ranges from no damage to death of the mature sugarcane plant. The rate of deterioration of juice quality after a freeze depends on the ambient air temperature: Warmer post-freeze temperatures result in more rapid deterioration of juice quality. Freezes also damage young sugarcane plants. Stalk populations may decline after severe freezes kill aboveground parts of recently emerged plants. The most severe damage occurs when the growing point is frozen, which is more likely if the plant has emerged from the soil. Tai and Miller (1996) reported that resistance to a light freeze (-1.7 oC to -2.8 oC) was not significantly correlated to fiber content, but resistance to a moderate freeze (-5.0 oC) was.
The United States Sugar Corporation (USSC), based in Clewiston, Florida, discontinued its breeding program in 2004. Approximately the top 25 percent of clones in all selection stages from the USSC program were donated to the Canal Point program. Clones from the USSC program were designated with a CL (Clewiston) prefix. Each donated clone described in this report has a CPCL (Canal Point and Clewiston) designation.
Each year at Canal Point, 50,000 to 100,000 seedlings are evaluated from crosses derived from a diverse germplasm collection. However, Deren (1995) suggested that the genetic base of U.S. sugarcane breeding programs was too narrow. About 80 percent of the cytoplasm in commercial sugarcane

3
is Saccharum officinarum. This year, 53.2 percent of our parental clones adapted to Florida originated from Canal Point, while the remainder were developed by USSC (34.1 percent were CPCL clones and 12.7 percent were CL clones). Additional parents not adapted to Florida originated from Louisiana or Texas breeding programs as well as from programs outside the United States.
The seedling stage planted in 2009 contained approximately 60,000 new clones that originated from true seeds planted in the greenhouse and were then transplanted to the field. Once selected as seedlings, clones are vegetatively propagated. Because of this vegetative propagation, from this stage (seedling stage) on in the selection program, each plant (clone) is genetically identical to its precursor, assuming no mutations. The stage I trial planted in January 2009 contained 13,696 new genotypes. The stage II trial, planted in November 2008, had 1,476 new clones. The 2008 plant-cane stage III trial had 136 new clones (135 CP clones and 1 CPCL clone) that were tested in replicated experiments on 4 grower farms. Each of the first three stages (seedling, stage I, and stage II) was evaluated for 1 year in the plant-cane crop at Canal Point. Selection is visual in the seedling phase. In stage I, the first selection process is visual. The clones that are selected visually are then analyzed with a hand-punch Brix, and heavy emphasis is placed on Brix results. The primary selection criteria for stage II and all subsequent stages are sugar yield (in metric tons of sugar per hectare), theoretical recoverable sucrose, cane tonnage, and disease resistance.
The 135 stage III genotypes are evaluated for 2 years, in the plant-cane and first-ratoon crops, in commercial sugarcane fields at four locations—three with organic (muck) soils and one with a sand soil. Independently for muck and sand soils, the 13 most promising clones identified in stage III receive continued testing
for 4 more years in the stage IV experiments where they are planted in successive years and evaluated in the plant-cane, first-ratoon, and second-ratoon crops. Genotypes that successfully complete these experimental phases undergo 2 to 4 years of evaluation and expansion by the Florida Sugar Cane League, Inc., before commercial release. Some of the League’s evaluation occurs concurrently with the stage IV evaluations. The Canal Point selection program is summarized in appendix 1.
Edmé et al. (2005a) found that the CP program has been responsible for substantial sugarcane yield improvements in Florida. However, these yield improvements occurred on the muck soils on which sugarcane is grown in Florida (about 80 percent of Florida’s sugarcane) and not on the 20 percent of Florida’s sugarcane that is grown on sand soils. Based on this finding, scientists are conducting a comprehensive review of the CP program to identify changes that can improve results for sand soils without compromising successes on muck soils. Based on the recommendation of Glaz and Kang (2008), one location with a muck soil was dropped from stage IV and one with a sand soil was added. Thus, this program now plants at three, rather than at two, locations in stage IV on sand soils, but it has not increased the total number of locations in stage IV. Glynn et al. (2009) reported that it would be unlikely to expect improvement in selecting genotypes for sand soils by adding a stage II on sand soils.
Clones with characteristics that may be valuable for sugarcane breeding programs are identified throughout the selection process. Even though the Canal Point program breeds and selects sugarcane in Florida, some CP clones have been productive commercial cultivars in Texas and outside of the United States. An example of the potential adaptability of Canal Point genotypes is CP 88-1165 (Juárez et al. 2008). CP 88-1165 was not selected for commercial use in Florida, but scientists in Guatemala requested it from Canal Point and later selected it for commercial use in Guatemala. Sugarcane geneticists in other

4
programs often request clones from Canal Point. From May 2008 to April 2009, clones or seeds from the Canal Point program were requested from and sent to Costa Rica, Guatemala, Nicaragua, Mauritius, and Tanzania.
Test Procedures
In 28 experiments, 62 new CP and CPCL clones (36 CP clones and 26 CPCL clones) were evaluated. Five clones of the CP 04 series, seven clones of the CPCL 02 series, and one clone of the CPCL 95 series were evaluated at five farms with muck soils in the plant-cane crop. Eight clones of the CP 04 series and five clones of the CPCL 02 series were evaluated at three farms with sand soils in the plant-cane crop. Eight clones (CP 04-1252, CP 04-1321, CP 04-1619, CPCL 02-0843, CPCL 02-0908, CPCL 02-0926, CPCL 02-1295, and CPCL 02-2913) were evaluated at all eight locations (muck and sand soils), five were evaluated on muck soils only, and five were evaluated on sand soils only. Three clones of the CP 03 series, eight clones of the CPCL 00 series, and two clones of the CPCL 01 series were evaluated at two farms with muck soils in the plant-cane crop and at six farms with muck soil in the first-ratoon crop. Seven clones of the CP 03 series, three clones of the CPCL 00 series, and three clones of the CPCL 01 series were evaluated at two farms with sand soils in the first-ratoon crop. Eight clones (CP 03-1160, CP 03-1491, CP 03-2188, CPCL 00-1373, CPCL 00-4027, CPCL 00-6131, CPCL 01-0271, and CPCL 01-0571) were evaluated at all 10 locations (muck and sand soils), five were evaluated on muck soils only, and five were evaluated on sand soils only. Six clones of the CP 02 series and seven clones of the CPCL 99 series were evaluated at two farms in the first-ratoon crop and at six farms in the second-ratoon crop. Thirteen clones of the CP 01 series were evaluated at two farms in the second-ratoon crop.
CP 89-2143 was the primary reference clone on muck soils, and CP 78-1628 was the primary reference clone on sand soils. In 2008, CP 89-2143 was the most widely grown cultivar in Florida and CP 78-1628 the most widely grown cultivar on sand soils in Florida (Rice et al. 2009). CP 72-2086 was sometimes used as a reference clone for KS/T. CP 72-2086 was the fifth most widely grown cultivar in Florida in 2008 (Rice et al. 2009).
Agronomic practices, such as fertilization, pest and water control, and cultivation, were conducted by the farmer or farm manager responsible for the field in which each experiment was planted.
The plant-cane and first-ratoon experiments at A. Duda and Sons, Inc., (Duda) southeast of Belle Glade and all three experiments planted in the successive rotation at Okeelanta Corporation (Okeelanta) south of South Bay were conducted on Dania muck soil. As described by Rice et al. (2002), Dania muck is the shallowest of the histosols (organic soils) comprised primarily of decomposed sawgrass (Cladium jamaicense Crantz) in the Everglades Agricultural Area. The maximum depth to the bedrock of Dania muck is 51 cm. The other organic soils similar to Dania muck are Lauderhill muck (51 to 91 cm depth to bedrock), Pahokee muck (91 to 130 cm to bedrock), and Terra Ceia muck (more than 130 cm to bedrock).
All experiments at Knight Management, Inc., (Knight) southwest of 20-Mile Bend, Sugar Farms Cooperative North-SFI Region S05 (SFI) near 20-Mile Bend in Palm Beach County and Wedgworth Farms, Inc. (Wedgworth) east of Belle Glade, as well as the three experiments not planted in the successive rotation at Okeelanta, were conducted on Lauderhill muck.
Both experiments at Sugar Farms Cooperative North-Osceola Region S03 (Osceola) were

5
conducted on Pahokee muck. The three experiments at Eastgate Farms, Inc., (Eastgate) north of Belle Glade were conducted on Torry muck. Both experiments at Hilliard Brothers of Florida, Ltd., (Hilliard) west of Clewiston were on Malabar sand. The three experiments at Lykes Brothers, Inc., (Lykes) near Moore Haven in Glades County were on Pompano fine sand, and the plant-cane experiment at the United States Sugar Corporation-Townsite (Townsite) was on Margate sand.
At Okeelanta, clones of the CP 03, CPCL 00, and CPCL 01 series experiment in the plant-cane crop, the CP 02 and CPCL 99 series in the first-ratoon crop, and the CP 01 series in the second-ratoon experiment were planted on fields in successive sugarcane rotations. In this rotation in Florida, a new crop of sugarcane is planted within about 2 months of the previous sugarcane harvest, a practice that increases the number of harvests per year but decreases yields per hectare (Glaz and Ulloa 1995). All other experiments were planted in fields that had not been cropped to sugarcane for approximately 1 year. In all experiments, plots were arranged in randomized-complete-block designs with six replications.
In all experiments of CP and CPCL clones, all plots had three rows, a border row, and two inside rows used for yield determination. These two rows were 10.7 m long and 3.0 m wide (0.0032 ha). The distance between rows was l.5 m, and 1.5-m alleys separated the front and back ends of the plots. The outside row of each plot was a border row and it was usually planted with the same genotype as the two adjacent rows. All inside rows of each plot in all replications and the border row of each plot in three replications were planted with two lines of stalks. The border row of each plot in the remaining three replications was planted with one line of stalks. Experiments were two clones (6 rows) wide, and each replication was 16 plots long. An extra 1.5 m of sugarcane
protected each row at the front and back of each test.
Samples of 10 stalks were cut from unburned cane from a middle row of each plot in each experiment between October 14, 2008, and February 9, 2009. In addition, preharvest samples of 10 stalks were cut from 2 replications of all plant-cane experiments between October 8 and October 15, 2008. Once a stool of sugarcane was chosen for cutting, the next 10 stalks in the row were cut as the 10-stalk sample. The range of sample dates for each crop was as follows:
Plant-cane crop December 22, 2008, to February 9, 2009 First-ratoon crop October 29, 2008, to January 23, 2009 Second-ratoon crop October 14, 2008, to January 16, 2009
After each stalk sample was transported to the USDA-Agricultural Research Service (ARS) Sugarcane Field Station at Canal Point, FL, for weighing and milling, crusher juice from the milled stalks was analyzed for Brix and pol, and commercial recoverable yield of 96o sucrose, in kg per metric ton of cane, (kg sucrose per ton of cane: KS/T) was determined as a measure of sugar content. The fiber percentage of each clone was used to calculate commercial recoverable yield (Legendre 1992). The values of theoretical recoverable yield determined by the Legendre method were multiplied by 0.86 to estimate the commercial recoverable yield in a Florida sugarcane mill. Brix and pol were usually estimated by near infrared reflectance spectroscopy (NIRS); Brix and pol were measured for samples with unacceptable NIRS calibrations by refractometer and polarimeter, respectively.
Using 3-stalk samples collected from border rows, an average of 11, 11, 12, 14, 6, 13, 11, and 14 fiber samples were calculated for the clones of the CP 01, CP 02, CP 03,

6
CP 04, CPCL 95, CPCL 00, CPCL 01, and CPCL 02 series, respectively. Leaves were stripped from these stalks, which were then processed through a Jeffco1 cutter-grinder (Jeffries Brothers, Ltd., Brisbane Queensland, Australia). About 400 g of material (bagasse) processed through the cutter-grinder were collected and weighed. Juice was extracted from the bagasse by pressing it at 69 MPa for 30 seconds. Brix of the juice was measured by refractometer. The pressed bagasse was then weighed, crumbled, placed in paper bags, and dried at 60o C until it reached a constant weight. Fiber percentage was then measured as described by Tanimoto (1964). All fiber percentages calculated on a given day were corrected to the historical fiber percentage of the reference clone.
Total millable stalks per plot were counted between April 16 and September 16, 2008. Cane yields, in metric tons per hectare, (tons of cane per hectare: TC/H) were calculated by multiplying stalk weights by number of stalks. Theoretical yields of sugar (in metric tons per hectare: TS/H) were calculated by multiplying TC/H by KS/T and dividing by 1,000.
To assess cold tolerance, stage IV clones were subjected to freezing temperatures in two field experiments established at the Hague Farm of the Florida Institute of Food and Agricultural Sciences, University of Florida, in Hague, near Gainesville, FL. Air temperatures usually go down to -2 to -4 oC at the testing site during winter months, which guarantees exposure of the clones to harsher freeze temperatures than normally found in south Florida. Clones of the CP 01, CP 02, and CPCL 99 series were planted on March 16, 2006, as randomized-complete-block experiments with four replications in single-row plots 1.5 m long and 2.4 m apart. Plots had 2.4 m breaks between replications, and clones were compared with three reference cultivars—CP 72-2086, CP 78-1628, and CP 89-2143. Five stalks were sampled from each plot on January 13, February 6, and March 5, 2007. Clones of the CP 03, CPCL 00, and CPCL
01 series were planted similarly to the previous series on March 5, 2007. Five-stalk samples were collected from the plant-cane crop on December 6, 2007, and February 6, 2008, and from the first-ratoon crop on December 4, 2008, and January 12, 2009. Cold-tolerance rankings for all three experiments were based on temporal deterioration of juice quality in mature stalks after exposure to freezing temperatures.
Prior to their advancement to stage IV, CP clones were evaluated in separate tests by artificial inoculation for susceptibility to sugarcane smut, sugarcane mosaic virus, leaf scald, and ratoon stunting. CP clones were inoculated in stage II plots to determine eye spot susceptibility. Since being advanced to stage IV, separate artificial-inoculation tests were repeated on clones for smut, ratoon stunting, mosaic, and leaf scald. Each clone was also field rated for its emergence, early plant height, tillering, and shading, as well as for its reactions to natural infection by sugarcane smut, sugarcane brown rust, sugarcane orange rust, sugarcane mosaic virus, and leaf scald in stage IV.
Statistical analyses of the stage IV experiments were based on a mixed model using SAS software (SAS version 9.1, 2003; SAS Institute, Inc., Cary, NC) with clones as fixed effects and locations and replications as random effects. Least squares means were calculated for clones. Means of locations were estimated by empirical best linear unbiased predictors. Significant differences were sought at the 10-percent probability level. Differences among clones were tested by the least significant difference (LSD), which was used regardless of significance of F-ratios to protect against high type-II error rates (Glaz and Dean 1988). The SAS estimation of the mean square error used for separating clone means was the error term used to calculate this LSD. Clones that had significantly higher yields than the reference clone were also identified by individual t tests calculated by SAS. Values
7
of LSD were also calculated to approximate significant differences among locations using the mean square error of replications within locations as the error term.
Results and Discussion
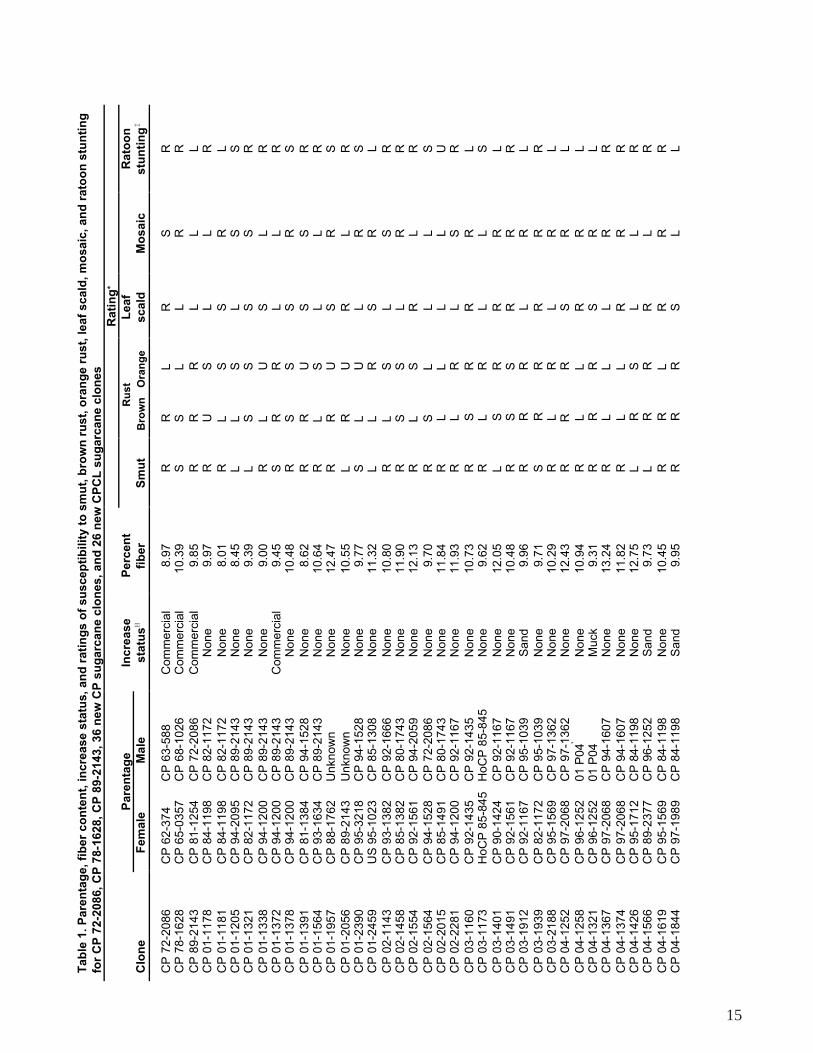
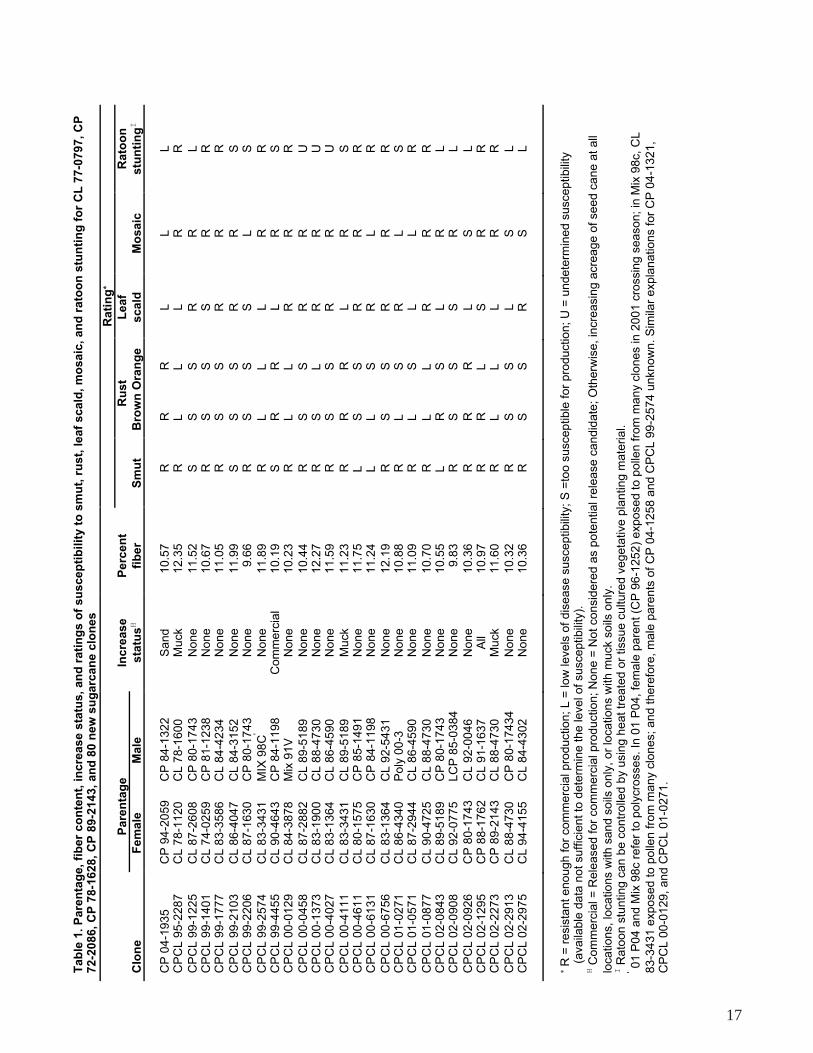
Table 1 lists the parentage, percentage of fiber, and reactions to smut, brown rust, orange rust, leaf scald, mosaic, and ratoon stunting for each clone included in these experiments. Tables 2-5 contain the results of clones from the CP 04, CPCL 02, and CPCL 95 series in plant-cane experiments at locations with muck soils, and tables 6-7 contain the results for plant-cane experiments of clones from the CP 04 and CPCL 02 series planted at locations with sand soils. Tables 8-9 contain the results of plant-cane experiments of clones from the CP 03, CPCL 00, and CPCL 01 series, and tables 10-12 and table 13 contain results of clones from these three series in first-ratoon experiments on muck and sand soils, respectively. Table 14 contains the results of the CP 02 and CPCL 99 first-ratoon experiments, and tables 15-17 contain the results of clones from these two series in second-ratoon experiments. Table 18 contains the results of the CP 01 second-ratoon experiments. Table 19 gives the dates that stalks were counted in each experiment. Table 20 gives cold-tolerance ratings for clones of the CP 01, CP 02, CP 03, CPCL 99, CPCL 00, and CPCL 01 series.
Plant-Cane Crop, CP 04, CPCL 02, and CPCL 95 Series on Muck Soils
When averaged across all five locations, CPCL 02-1295 was the only clone that yielded significantly more TC/H (metric tons of cane per hectare) and TS/H (metric tons of sugar per hectare) than CP 89-2143 (tables 2 and 5). CPCL 02-1295 also had high TC/H yields at four of the five locations with muck soils (Knight, Okeelanta, SFI, and Wedgworth) (table 2). At the fifth location with muck soil (Duda), the TC/H yield of CPCL 02-1295 was similar to the mean of all clones tested. The preharvest and harvest KS/T (theoretical
recoverable yield of 96o sugar in kg per metric ton of cane) values of CPCL 02-1295 were significantly lower than those of CP 89-2143 (tables 3 and 4). The female parent of CPCL 02-1295 was CP 88-1762 (table 1) which was the second most widely planted sugarcane cultivar in Florida in 2008 (Rice et al. 2009).
In addition to CPCL 02-1295, CPCL 02-2273 and CPCL 95-2287 had significantly greater TC/H than CP 89-2143 (table 2). The TS/H yields of CPCL 02-2273 and CPCL 95-2287 did not differ significantly from CP 89-2143, CPCL 02-1295, or from each other (table 5). The preharvest KS/T value of CPCL 95-2287 was significantly less than that of CP 89-2143, and the preharvest KS/T of CPCL 02-2273 was significantly less than that of CPCL 95-2287 (table 3). The harvest KS/T values of CPCL 95-2287 and CPCL 02-2273 did not differ significantly, but the KS/T of each of these new clones was significantly less than that of CP 89-2143 (table 4). The female parent of CPCL 02-2273 was CP 89-2143 and the male parent was CL 88-4730, a proprietary cultivar of USSC (table 1).
CP 04-1321 was the only clone that had significantly higher preharvest and harvest KS/T values than CP 89-2143 when averaged across the five muck-soil locations (tables 3 and 4). The mean TC/H yield of CP 04-1321 was similar to that of CP 89-2143 but significantly lower than that of CPCL 02-1295 (table 2). At SFI and Wedgworth, the TC/H yields of CP 04-1321 were significantly higher than those of CP 89-2143. However, at Knight, the TC/H yield of CP 04-1321 was significantly less than the TC/H yields CP 89-2143 and 11 of the other 13 clones tested. The mean TS/H of CP 04-1321 did not differ significantly from the TS/H yields of CP 89-2143 or CPCL 02-1295, but the TS/H yield of CP 04-1321 at Knight was significantly lower than that of CP 89-2143 and significantly lower than the TS/H yields of 10 of the 13 other genotypes tested at Knight (table 5). The

8
female parent of CP 04-1321 was CP 96-1252 (table 1 and Edmé 2005b), a minor cultivar in Florida.
Sugarcane in Florida is propagated by planting stem sections (referred to as seed cane) from which axillary buds emerge. The Florida Sugar Cane League, Inc., has begun increasing seed cane of CP 04-1321 and CPCL 95-2287 at all stage IV locations with muck soils and has begun increasing seed cane of CPCL 02-1295 at all stage IV locations (table 1). As seed cane of these clones is increased, more disease testing will be conducted. There is particular concern regarding the susceptible ratings of CP 04-1321 and CPCL 02-1295 to leaf scald. The fiber contents of CP 04-1321, CPCL 95-2287, and CPCL 02-1295 were 9.31, 12.35, and 10.97 percent, respectively.
Plant-Cane Crop, CP 04 and CPCL 02 Series on Sand Soils
When averaged across all three locations with sand soils, no new clone yielded significantly more TS/H than CP 78-1628 (table 7). CP 04-1844 had significantly higher TC/H than CP 78-1628 when averaged across all locations and at Hilliard and Townsite. However, the preharvest and harvest KS/T values of CP 04-1844 were significantly lower than those of CP 78-1628 (table 6). The male parent of CP 04-1844 was CP 84-1198 and the female parent was CP 97-1989 (table 1 and Glaz et al. 2005). CP 84-1198 was the sixth most widely planted sugarcane cultivar in Florida in 2008 (Rice et al. 2009), and CP 97-1989 is a minor cultivar that was released for sand soils in Florida.
Three new clones—CPCL 02-0908, CP 04-1321, and CP 04-1935—had significantly higher preharvest KS/T than CP 78-1628 (table 6). The harvest KS/T of CPCL 02-0908 was also significantly higher than that of CP 78-1628. However, the TC/H and TS/H yields of CPCL 02-0908 and CP 04-1321 were significantly lower than those of CP 78-1628
(table 7). The TC/H and TS/H yields of CP 04-1935 were significantly higher than those of CPCL 02-0908 and CP 04-1321 but did not differ significantly from those of CP 78-1628.
CP 04-1566 was the only clone with TC/H and TS/H yields that did not differ significantly from those of CP 04-1844 (table 7), and its harvest and preharvest KS/T yields were higher than those of CP 04-1844. The female parent of CP 04-1566 was CP 89-2377 (table 1 and Miller et al. 2000), which is a minor cultivar in Florida, and the female parent was CP 96-1252.
The Florida Sugar Cane League, Inc., has begun increasing seed cane of CP 04-1566 and CP 04-1844 at stage IV locations with sand soils (table 1). Currently there are no disease concerns for CP 04-1566, but CP 04-1844 is susceptible to leaf scald. The fiber contents of CP 04-1566 and CP 04-1844 were 9.73 and 9.95 percent, respectively (table 1). There are currently no plans to increase seed cane of CP 04-1935; it has no disease concerns and a fiber content of 10.57 percent.
Plant-Cane Crop, CP 03, CPCL 00, and CPCL 01 Series on Muck Soils
Last year’s report contained the results from five locations with muck soils of the CP 03, CPCL 00, and CPCL 01 series plant-cane crop (Glaz et al. 2009). This year, plant-cane results are available from Eastgate and the successively planted test at Okeelanta (tables 8-9). Averaged across these two locations, no new genotype had significantly higher mean yields of TC/H, preharvest or harvest KS/T, or TS/H, than CP 89-2143.
First-Ratoon Crop, CP 03, CPCL 00, and CPCL 01 Series on Muck Soils
When averaged across all six farms with muck soils in the first-ratoon crop, eight new clones—CPCL 00-6131, CPCL 00-4111, CP

9
03-1160, CPCL 01-0271, CP 03-2188, CPCL 00-4027, CPCL 00-6756, and CPCL 00-0129—yielded significantly more TS/H than CP 89-2143 (table 12). However, CP 78-1628, the primary reference cultivar for sand soils, also had a TS/H yield significantly higher than that of CP 89-2143; and no new clone yielded significantly more TS/H than CP 78-1628. In addition, five of the eight new clones that had TS/H yields higher than the TS/H yield of CP 89-2143—CPCL 00-6131, CP 03-1160, CPCL 00-0271, CPCL 00-4027, and CPCL 00-6756—were too susceptible to either brown or orange rust for commercial production in Florida (table 1).
The TC/H yields of CPCL 00-4111 and CP 03-2188 were significantly higher those of CP 89-2143 (table 10), and there were no significant differences among the KS/T values of these three clones (table 11). Conversely, there were no significant differences between the TC/H yields of CP 00-0129 and CP 89-2143, but CP 00-0129 was the only new clone with a KS/T higher than that of CP 89-2143 (tables 10 and 11). Last year in the plant-cane crop on muck soils, yields of these three new clones were generally similar to their yields this year in the first-ratoon crop (Glaz et al. 2009). CPCL 00-4111 had a high TC/H yield and its KS/T was similar to that of CP 89-2143. CP 03-2188 also had a high TC/H yield last year, but one difference between the two years is that the KS/T value of CP 03-2188 was significantly lower than that of CP 89-2143 last year. The relative TC/H yields of CPCL 00-0129 and CP 89-2143 were similar this year and last year, but the KS/T value of CPCL 00-0129 was not significantly higher than that of CP 89-2143 last year.
Seed cane of CPCL 00-4111 is being increased at stage IV locations with muck soils (table 1). CPCL 00-4111 has no major disease concerns except for its susceptibility to ratoon stunting, and it had a fiber content of 11.23 percent
(table 1). The freeze tolerance of CPCL 00-4111 ranked 7th out of 21 clones tested (table 20).
First-Ratoon Crop, CP 03, CPCL 00, and CPCL 01 Series on Sand Soils
CP 03-1912 was the only new clone with a significantly higher yield of TS/H than CP 78-1628 when averaged across Hilliard and Lykes (table 13). In addition, the TC/H yield of CP 03-1912 was higher than that of CP 78-1628 and higher than the TC/H yields of all clones in the test except CPCL 00-4027, CP 03-1160, and CPCL 00-6131. Last year in the plant-cane crop on sand soils, CP 03-1912 had similarly high TC/H and TS/H yields (Glaz et al. 2009). The KS/T values of only two new clones—CP 03-1491 and CPCL 00-1373—differed significantly from the KS/T of CP 78-1628. Compared with CP 78-1628, the KS/T of CP 03-1491 was higher and that of CPCL 00-1373 was lower.
The Florida Sugar Cane League, Inc., has begun increasing seed cane of CP 03-1912 at all stage IV locations with sand soils (table 1). There are no disease concerns for CP 03-1912. However, growers are concerned that its stalks are more easily broken by wind than is normal for Florida sugarcane. Also, the cold tolerance of CP 03-1912 was the worst in this group (table 20). The fiber content of CP 03-1912 was 9.96 percent.
First-Ratoon Crop, CP 02 and CPCL 99 Series
Last year’s report contained information for the CP 02 and CPCL 99 series in the first-ratoon crop at eight locations and in the plant-cane crop at Eastgate and Okeelanta (Glaz et al. 2009). In addition, Glaz et al. (2008) reported on results of these clones from eight locations in the plant-cane crop. This year, in the first-ratoon crop combined yields at

10
Okeelanta and Eastgate, four new clones— CP 02-1143, CP 02-1564, CPCL 99-2574, and CPCL 99-1401—yielded significantly more TC/H and TS/H than CP 89-2143 (table 14). There were no significant differences in KS/T values among the four new clones, CP 89-2143, and CP 72-2086. CP 02-1143 (orange rust), CP 02-1564 (brown rust and ratoon stunting), and CPCP 99-1401 (brown rust, orange rust, and leaf scald) are not candidates for release because of disease susceptibilities (table 1). CPCL 99-2574 had moderately high yields of KS/T and TS/H in the plant-cane and first-ratoon crops and was a candidate for release. However, CPCL 99-2574 had low second-ratoon yields this year, which will be discussed in the next section, and is no longer being considered for release. CPCL 99-4455 was recently released for commercial production in Florida, based largely on its high KS/T values, which were higher than 13 of the 15 other clones tested at Eastgate and Okeelanta (table 14). However, its TC/H and TS/H yields were lower than 10 and 5 clones, respectively, at Eastgate and Okeelanta.
Second-Ratoon Crop, CP 02 and CPCL 99 Series
When averaged across all six locations, CP 02-1564 yielded significantly more TC/H and TS/H than any other clone in the test (tables 15 and 17). The KS/T values of CP 02-1564, CP 89-2143, and CP 72-2086 did not differ significantly (table 16). As noted in the previous section, CP 02-1564 is not being considered for commercial release because of susceptibilities to brown rust and ratoon stunting.
CPCL 99-4455 was released for commercial production in Florida in October 2009. This year as second ratoon, CPCL 99-4455 had a significantly higher KS/T value than any other clone in the test. However, although the TC/H yields of CPCL 99-4455 and CP 89-2143 did not differ significantly, the TC/H yield of
CPCL 99-4455 was significantly less than the TC/H yields of 9 of the 14 other genotypes in the experiment (table 15). The TS/H yields of CPCL 99-4455 and CP 89-2143 did not differ significantly (table 17). The relative plant-cane and first-ratoon crop KS/T and TC/H yields of CPCL 99-4455 were similar to those of this year in the second-ratoon crop (Glaz et al. 2008 and Glaz et al. 2009). CPCL 99-4455 was susceptible to smut and ratoon stunting and had a fiber content of 10.19 percent.
In the plant-cane crop, CPCL 99-2574 had moderate TC/H yields but high KS/T and TS/H yields (Glaz et al. 2008). In the first-ratoon crop, the KS/T values of CPCL 99-2574 remained high, but its TC/H and TS/H yields were moderately low (Glaz et al. 2009). Based on these results, along with its lack of disease concerns, CPCL 99-2574 was being considered for potential release in Florida. However, second-ratoon TC/H yield of CPCL 99-2574 was significantly lower than that of CP 89-2143 (table 15); and although it had a high KS/T value, the KS/T of CPCL 99-2574 was significantly lower than that of CPCL 99-4455 (table 16). Therefore, CPCL 99-2574 is no longer under consideration for release in Florida (table 1).
Second-Ratoon Crop, CP 01 Series
When combined across Okeelanta and Eastgate in the second-ratoon crop, four new clones—CP 01-1564, CP 01-2390, CP 01-1378, and CP 01-1372—had significantly higher TC/H and TS/H yields than CP 89-2143 (table 18). However, because of disease susceptibilities, CP 01-1564 (brown rust) and CP 01-1378 (brown rust, orange rust, and leaf scald) are not being considered for commercial production (table 1). CP 01-2390 also had high TS/H yields on sand soils in the plant-cane through second-ratoon crops (Glaz et al 2007, 2008, 2009) but has not been considered for commercial release due to its susceptibility to ratoon stunting and its severe susceptibility to smut (table 1).

11
Last year, CP 01-1372 (Edmé et al. 2009) was released for commercial production in Florida (table 1). Based on yields the previous 3 years, CP 01-1372 was recommended for (Glaz et al. 2007, 2008, 2009). This year as second ratoon, CP 01-1372 had significantly higher yields of TC/H and TS/H than CP 89-2143 (table 18). The KS/T values of CP 01-1372, CP 89-2143, and CP 72-2086 were not significantly different. The only disease concern regarding CP 01-1372 was its susceptibility to smut (table 1). The fiber content of CP 01-1372 was 9.45 percent. Rankings for freeze tolerance of CP 78-1628, CP 89-2143, CP 01-1372, and CP 72-2086 were 1st, 3rd, 4th, and 12th, respectively (table 20).
Summary
This is the second report in this long series in which clones in some plant-cane tests were advanced from stage III to stage IV muck and sand locations independently. For genotypes from the CP 04, CPCL 02, and CPCL 95 series reported on for the first time in stage IV this year, as well as for the CP 03 and CPCL 00 series in the first-ratoon crop, there were eight genotypes common to all tests, five genotypes only at locations with muck soils, and five genotypes only at locations with sand soils.
Clones from the CP 04, CPCL 02, and CPCL 95 series were tested in the plant-cane crop at five locations with muck soil and at three locations with sand soil this year. On both the muck and sand soils, CPCL 02-1295 had high TC/H and TS/H yields but low KS/T yields, and its seed cane is being expanded on both soil types by the Florida Sugar Cane League, Inc., for potential commercial release in Florida. CPCL 02-1295 is resistant to all major sugarcane diseases in Florida except leaf scald.
The Florida Sugar Cane League, Inc., began increasing seed cane of CP 04-1321 and CPCL 95-2287 on muck soils and of CP 04-1566, CP
04-1844, and CP 04-1935 on sand soils. CP 04-1321 had high KS/T values and moderate TC/H yields on muck soils, and CPCL 95-2287 had high TC/H yields and low KS/T values on muck soils. On sand soils, CP 04-1566 had moderately high TC/H yields and moderate KS/T values, CP 04-1844 had high TC/H yields with low KS/T values, and CP 04-1935 had moderate TC/H yields with high KS/T values. The only disease concerns among these five new clones were the susceptibilities of CP 04-1321 and CP 04-1844 to leaf scald.
One group of clones from the CP 03, CPCL 00, and CPCL 01 series was tested on muck soils in the plant-cane crop at two locations this year and at five locations last year. This group of new clones was also tested at six location in the first-ratoon crop this year. CPCL 00-4111 has had consistently high TC/H and TS/H yields with acceptable yields of KS/T across these tests. Seed cane of CPCL 00-4111 is being expanded on muck soils by the Florida Sugar Cane League, Inc., for potential commercial release in Florida. The only disease concern of CPCL 00-4111 is that it is susceptible to ratoon stunting. CP 03-2188 had high yields of TC/H and TS/H, but it is not being expanded for potential release due to its low KS/T yields.
A second group of CP 03, CPCL 00, and CPCL 01 clones was tested in the plant-cane crop last year and in the first-ratoon crop this year at two locations with sand soils. CP 03-1912 had no disease concerns, high yields of TC/H and TS/H, and acceptable yields of KS/T in both years of testing. However, growers are concerned that its stalks are more easily broken by wind than is normal for Florida sugarcane. The Florida Sugar Cane League, Inc., is expanding seed cane of CP 03-1912 on sand soils for potential commercial release in Florida.
Genotypes from the CP 02 and CPCL 99 series were tested in the plant-cane crop at

12
two locations last year and at eight locations two years ago. These clones were also tested in the first-ratoon crop at two locations this year and at eight locations last year and in the second-ratoon crop at six locations this year. In October 2009, the USDA-ARS, the University of Florida, and the Florida Sugar Cane League, Inc., jointly released CPCL 99-4455 for commercial production in Florida. CPCL 99-4455 had consistently high KS/T yields across years and locations; however, its yields of TC/H and TS/H were generally mediocre. The only disease concerns of CPCL 99-4455 are its susceptibility to smut and ratoon stunting.
Stage IV testing of the CP 01 series was completed this year with two second-ratoon experiments. Previous testing of these clones included 2 years and 10 locations as plant cane, 2 years and 10 locations as first ratoon, and 7 locations as second ratoon last year. Combined across all locations in the plant-cane through the second-ratoon crop cycles, CP 01-1372 had significantly higher (at p < 0.001) yields of TC/H (164.31 vs. 122.31 tons ha-1) and TS/H (19.345 vs. 14.382 tons ha-1) than CP 89-2143. The harvest KS/T yields throughout the three-crop cycle of CP 01-1372 (118.7 kg ton-1) and CP 89-2143 (116.91 kg ton-1) did not differ significantly. CP 01-1372 was jointly released by USDA-ARS, the University of Florida, and the Florida Sugar Cane League, Inc., for commercial production on muck and sand soils in Florida in September 2008. The only disease concern regarding CP 01-1372 was its susceptibility to smut. CP 01-1372 had excellent tolerance to freezing temperatures.
References
Comstock, J.C., J.M. Shine, Jr., P.Y.P. Tai, and J.D. Miller. 2001. Breeding for ratoon stunting disease resistance: Is it both possible and effective? In International Society of Sugar Cane Technologists: Proceedings of the XXIV Congress, vol. 2, September 17-21, 2001, pp. 471-476. Brisbane, Australia.
Comstock, J.C., S.G. Sood, et al. 2008. First report of Puccinia kuehnii, causal agent of orange rust of sugarcane, in the United States and in the Western Hemisphere. Plant Disease 92:175.
Deren, C.W. 1995. Genetic base of U.S. mainland sugarcane. Crop Science 35:1195-1199.
Deren, C.W., J. Alvarez, and B. Glaz. 1995. Use of economic criteria for selecting clones in a sugarcane breeding program. Proceedings of the International Society of Sugar Cane Technologists 21:2, March 5-14, 1992, pp. 437-447. Bangkok, Thailand.
Deren, C.W., B. Glaz, P.Y.P. Tai, J.D. Miller, and J.M. Shine, Jr. 1991. Registration of ‘CP 80-1743’ sugarcane. Crop Science 31:235-236.
Edmé, S.J., R.W. Davidson, et al. 2009. Registration of ‘CP 01-1372’ Sugarcane. Journal of Plant Registrations 3:150-157.
Edmé, S.J., J.D. Miller, et al. 2005a. Genetic contributions to yield gains in the Florida sugarcane industry across 33 years. Crop Science 45:92-97.
Edmé, S.J., P.Y.P. Tai, et al. 2005b. Registration of ‘CP 96-1252’ sugarcane. Crop Science 45:423.
Glaz, B., J. Alvarez, and J.D. Miller. 1986. Analysis of cultivar-use options with sugarcane as influenced by threats of new pests. Agronomy Journal 78:503-506. Glaz, B., J.C. Comstock, et al. 2008. Evaluation of new Canal Point sugarcane clones: 2006-2007 harvest season. U.S. Department of Agriculture, Agricultural Research Service, ARS-169.
13
Glaz, B., R.W. Davidson, et al. 2007. Evaluation of new Canal Point sugarcane clones: 2005-2006 harvest season. U.S. Department of Agriculture, Agricultural Research Service, ARS-167.
Glaz, B., and J.L. Dean. 1988. Statistical error rates and their implications in sugarcane clone trials. Agronomy Journal 80:560-562.
Glaz, B., S.J. Edmé, et al. 2009. Evaluation of new Canal Point sugarcane clones: 2007-2008 harvest season. U.S. Department of Agriculture, Agricultural Research Service, ARS-170.
Glaz, B., S.J. Edmé, et al. 2005. Registration of ‘CP 97-1989’ sugarcane. Crop Science 45:2660-2661.
Glaz, B., and M.S. Kang. 2008. Location contributions determined via GGE biplot analysis of multienvironment sugarcane genotype-performance trials. Crop Science 48:941-950.
Glaz, B., J.D. Miller, et al. 2000. Registration of ‘CP 89-2143’ sugarcane. Crop Science 40:577.
Glaz, B., J.M Shine, Jr., et al. 1994. Registration of ‘CP 84-1198’ sugarcane. Crop Science 34:1404-1405.
Glaz, B., and M.F. Ulloa. 1995. Fallow and successive planting effects on sugarcane yields in Florida. Journal American Society of Sugar Cane Technologists 15:41-53.
Glynn, N.C., R.A. Gilbert, et al. 2009. Repeatability between two intermediate sugarcane genotype selection stages in Florida. Journal of Crop Improvement 23:252-265.
Juárez, J.L., J.D. Miller, et al. 2008. Registration of ‘CP 88-1165’ sugarcane. Journal of Plant Registrations 2:102-109.
Legendre, B.L. 1992. The core/press method for predicting the sugar yield from cane for use in cane payment. Sugar Journal 54(9):2-7.
Lockhart, B.E.L., M.J. Irey, and J.C. Comstock. 1996. Sugarcane bacilliform virus, sugarcane mild mosaic virus and sugarcane yellow leaf syndrome. In B.J. Croft, C.M. Piggin, E.S. Wallis, and D.M. Hogarth, eds., Sugarcane Germplasm Conservation and Exchange, pp. 108-112. Australian Centre for International Agricultural Research, Canberra, Australia, Proceedings No. 67.
Miller, J.D., P.Y.P. Tai, et al. l984. Registration of ‘CP 72-2086’ sugarcane. Crop Science 24:210.
Miller J.D., C.W. Deren, et al. 2000. Registration of ‘CP 89-2377’ sugarcane. Crop Science 40:577-578.
Rice, R.W., L. Baucum, and B. Glaz. 2009. Sugarcane Variety Census: Florida 2008. Sugar Journal 72(7):6-12.
Rice, R.W., R.A. Gilbert, and S.H. Daroub. 2002. Application of the soil taxonomy key to the organic soils of the Everglades Agricultural Area. Agronomy Department, Florida Cooperative Extension Service, Institute of Food and Agricultural Sciences, University of Florida, SS-AGR-246. Available online at http://edis.ifas.ufl.edu/AG151 (May 2002, verified Sept. 9, 2002).
Tai, P.Y.P., J.D. Miller, et al. 1991. Registration of ‘CP 78-1628’ sugarcane. Crop Science 31:236.
Tai, P.Y.P., J.M. Shine, Jr., et al. 1997. Registration of ‘CP 88-1762’ sugarcane. Crop Science 37:1388.
Tai, P.Y.P., and J.D. Miller. 1996. Selection for frost resistance in sugarcane. Sugar Cane 1996(3):13-18.
Tanimoto, T. 1964. The press method of cane analysis. Hawaii. Plant. Rec. 57:133-150.

14
Tables
Notes (tables 2-18):
1. Clonal yields approximated by least squares (p = 0.10) within and across locations.
2. Location yields approximated by empirical linear unbiased predictors.
3. LSD = least significant difference.
4. CV = coefficient of variation.
15
Tab
le 1
. P
are
nta
ge, fi
ber
co
nte
nt,
in
cre
ase s
tatu
s,
an
d r
ati
ng
s o
f su
scep
tib
ilit
y t
o s
mu
t, b
row
n r
ust,
ora
ng
e r
us
t, l
ea
f s
ca
ld,
mo
sa
ic,
an
d r
ato
on
stu
nti
ng
for
CP
72-2
086, C
P 7
8-1
628, C
P 8
9-2
143, 36 n
ew
CP
su
garc
an
e c
lon
es,
an
d 2
6 n
ew
CP
CL
su
garc
an
e c
lon
es
Ra
tin
g*
P
are
nta
ge
Incre
ase
Perc
en
t
R
ust
Le
af
R
ato
on
Clo
ne
F
em
ale
M
ale
sta
tusH
fi
ber
Sm
ut
Bro
wn
O
ran
ge
sc
ald
M
os
aic
s
tun
tin
gI
CP
72-2
086
C
P 6
2-3
74
CP
63-5
88
Com
merc
ial
8.9
7
R
R
L
R
S
R
CP
78-1
628
C
P 6
5-0
357
C
P 6
8-1
026
C
om
merc
ial
10.3
9
S
S
L
L
R
R
CP
89-2
143
C
P 8
1-1
254
C
P 7
2-2
086
C
om
merc
ial
9.8
5
R
R
R
L
L
L
CP
01-1
178
C
P 8
4-1
198
C
P 8
2-1
172
N
one
9.9
7
R
U
S
L
L
R
CP
01-1
181
C
P 8
4-1
198
C
P 8
2-1
172
N
one
8.0
1
R
L
S
S
R
L
CP
01-1
205
C
P 9
4-2
095
C
P 8
9-2
143
N
one
8.4
5
L
L
S
L
S
S
CP
01-1
321
C
P 8
2-1
172
C
P 8
9-2
143
N
one
9.3
9
L
S
S
S
S
R
CP
01-1
338
C
P 9
4-1
200
C
P 8
9-2
143
N
one
9.0
0
R
L
U
S
L
R
CP
01-1
372
C
P 9
4-1
200
C
P 8
9-2
143
C
om
merc
ial
9.4
5
S
R
R
L
L
R
CP
01-1
378
C
P 9
4-1
200
C
P 8
9-2
143
N
one
10.4
8
R
S
S
S
R
S
CP
01-1
391
C
P 8
1-1
384
C
P 9
4-1
528
N
one
8.6
2
R
R
U
S
S
R
CP
01-1
564
C
P 9
3-1
634
C
P 8
9-2
143
N
one
10.6
4
R
L
S
L
L
R
CP
01-1
957
C
P 8
8-1
762
U
nknow
n
None
12.4
7
R
R
U
S
R
S
CP
01-2
056
C
P 8
9-2
143
U
nknow
n
None
10.5
5
L
R
U
R
L
R
CP
01-2
390
C
P 9
5-3
218
C
P 9
4-1
528
N
one
9.7
7
S
L
U
L
R
S
CP
01-2
459
U
S 9
5-1
023
C
P 8
5-1
308
N
one
11.3
2
L
L
R
S
R
L
CP
02-1
143
CP
93-1
382
C
P 9
2-1
666
N
one
10.8
0
R
L
S
L
S
R
CP
02-1
458
C
P 8
5-1
382
C
P 8
0-1
743
N
one
11.9
0
R
S
S
L
R
R
CP
02-1
554
C
P 9
2-1
561
C
P 9
4-2
059
N
one
12.1
3
R
L
S
R
L
R
CP
02-1
564
C
P 9
4-1
528
C
P 7
2-2
086
N
one
9.7
0
R
S
L
L
L
S
CP
02-2
015
C
P 8
5-1
491
C
P 8
0-1
743
N
one
11.8
4
R
L
L
L
L
U
CP
02-2
281
C
P 9
4-1
200
C
P 9
2-1
167
N
one
11.9
3
R
L
R
L
S
R
CP
03-1
160
C
P 9
2-1
435
C
P 9
2-1
435
N
one
10.7
3
R
S
R
R
R
L
CP
03-1
173
H
oC
P 8
5-8
45
HoC
P 8
5-8
45
N
one
9.6
2
R
L
R
L
L
S
CP
03-1
401
C
P 9
0-1
424
C
P 9
2-1
167
N
one
12.0
5
L
S
R
R
R
L
CP
03-1
491
C
P 9
2-1
561
C
P 9
2-1
167
N
one
10.4
8
R
S
S
R
R
R
CP
03-1
912
C
P 9
2-1
167
C
P 9
5-1
039
S
and
9.9
6
R
R
R
L
R
L
CP
03-1
939
C
P 8
2-1
172
C
P 9
5-1
039
N
one
9.7
1
S
R
R
R
R
R
CP
03-2
188
C
P 9
5-1
569
C
P 9
7-1
362
N
one
10.2
9
R
L
R
L
R
L
CP
04-1
252
CP
97-2
068
C
P 9
7-1
362
N
one
12.4
3
R
R
R
S
R
L
CP
04-1
258
C
P 9
6-1
252
01 P
04
' N
one
10.9
4
R
L
L
R
R
L
CP
04-1
321
C
P 9
6-1
252
01 P
04
Muck
9.3
1
R
R
R
S
R
L
CP
04-1
367
C
P 9
7-2
068
C
P 9
4-1
607
N
one
13.2
4
R
L
L
L
R
R
CP
04-1
374
C
P 9
7-2
068
C
P 9
4-1
607
N
one
11.8
2
R
L
L
R
R
R
CP
04-1
426
C
P 9
5-1
712
C
P 8
4-1
198
N
one
12.7
5
L
R
S
L
L
R
CP
04-1
566
C
P 8
9-2
377
C
P 9
6-1
252
S
and
9.7
3
L
R
R
R
L
R
CP
04-1
619
C
P 9
5-1
569
C
P 8
4-1
198
N
one
10.4
5
R
R
L
R
R
R
CP
04-1
844
C
P 9
7-1
989
C
P 8
4-1
198
S
and
9.9
5
R
R
R
S
L
L

16
Tab
le 1
. P
are
nta
ge, fi
ber
co
nte
nt,
in
cre
ase s
tatu
s,
an
d r
ati
ng
s o
f su
scep
tib
ilit
y t
o s
mu
t, b
row
n r
ust,
ora
ng
e r
us
t, l
ea
f s
ca
ld,
mo
sa
ic,
an
d r
ato
on
stu
nti
ng
for
CP
72-2
086, C
P 7
8-1
628, C
P 8
9-2
143, 36 n
ew
CP
su
garc
an
e c
lon
es,
an
d 2
6 n
ew
CP
CL
su
garc
an
e c
lon
es
Ra
tin
g*
P
are
nta
ge
Incre
ase
Perc
en
t
R
ust
Le
af
R
ato
on
Clo
ne
F
em
ale
M
ale
sta
tusH
fi
ber
Sm
ut
Bro
wn
O
ran
ge
sc
ald
M
os
aic
s
tun
tin
gI
CP
72-2
086
C
P 6
2-3
74
CP
63-5
88
Com
merc
ial
8.9
7
R
R
L
R
S
R
CP
78-1
628
C
P 6
5-0
357
C
P 6
8-1
026
C
om
merc
ial
10.3
9
S
S
L
L
R
R
CP
89-2
143
C
P 8
1-1
254
C
P 7
2-2
086
C
om
merc
ial
9.8
5
R
R
R
L
L
L
CP
01-1
178
C
P 8
4-1
198
C
P 8
2-1
172
N
one
9.9
7
R
U
S
L
L
R
CP
01-1
181
C
P 8
4-1
198
C
P 8
2-1
172
N
one
8.0
1
R
L
S
S
R
L
CP
01-1
205
C
P 9
4-2
095
C
P 8
9-2
143
N
one
8.4
5
L
L
S
L
S
S
CP
01-1
321
C
P 8
2-1
172
C
P 8
9-2
143
N
one
9.3
9
L
S
S
S
S
R
CP
01-1
338
C
P 9
4-1
200
C
P 8
9-2
143
N
one
9.0
0
R
L
U
S
L
R
CP
01-1
372
C
P 9
4-1
200
C
P 8
9-2
143
C
om
merc
ial
9.4
5
S
R
R
L
L
R
CP
01-1
378
C
P 9
4-1
200
C
P 8
9-2
143
N
one
10.4
8
R
S
S
S
R
S
CP
01-1
391
C
P 8
1-1
384
C
P 9
4-1
528
N
one
8.6
2
R
R
U
S
S
R
CP
01-1
564
C
P 9
3-1
634
C
P 8
9-2
143
N
one
10.6
4
R
L
S
L
L
R
CP
01-1
957
C
P 8
8-1
762
U
nknow
n
None
12.4
7
R
R
U
S
R
S
CP
01-2
056
C
P 8
9-2
143
U
nknow
n
None
10.5
5
L
R
U
R
L
R
CP
01-2
390
C
P 9
5-3
218
C
P 9
4-1
528
N
one
9.7
7
S
L
U
L
R
S
CP
01-2
459
U
S 9
5-1
023
C
P 8
5-1
308
N
one
11.3
2
L
L
R
S
R
L
CP
02-1
143
CP
93-1
382
C
P 9
2-1
666
N
one
10.8
0
R
L
S
L
S
R
CP
02-1
458
C
P 8
5-1
382
C
P 8
0-1
743
N
one
11.9
0
R
S
S
L
R
R
CP
02-1
554
C
P 9
2-1
561
C
P 9
4-2
059
N
one
12.1
3
R
L
S
R
L
R
CP
02-1
564
C
P 9
4-1
528
C
P 7
2-2
086
N
one
9.7
0
R
S
L
L
L
S
CP
02-2
015
C
P 8
5-1
491
C
P 8
0-1
743
N
one
11.8
4
R
L
L
L
L
U
CP
02-2
281
C
P 9
4-1
200
C
P 9
2-1
167
N
one
11.9
3
R
L
R
L
S
R
CP
03-1
160
C
P 9
2-1
435
C
P 9
2-1
435
N
one
10.7
3
R
S
R
R
R
L
CP
03-1
173
H
oC
P 8
5-8
45
HoC
P 8
5-8
45
N
one
9.6
2
R
L
R
L
L
S
CP
03-1
401
C
P 9
0-1
424
C
P 9
2-1
167
N
one
12.0
5
L
S
R
R
R
L
CP
03-1
491
C
P 9
2-1
561
C
P 9
2-1
167
N
one
10.4
8
R
S
S
R
R
R
CP
03-1
912
C
P 9
2-1
167
C
P 9
5-1
039
S
and
9.9
6
R
R
R
L
R
L
CP
03-1
939
C
P 8
2-1
172
C
P 9
5-1
039
N
one
9.7
1
S
R
R
R
R
R
CP
03-2
188
C
P 9
5-1
569
C
P 9
7-1
362
N
one
10.2
9
R
L
R
L
R
L
CP
04-1
252
CP
97-2
068
C
P 9
7-1
362
N
one
12.4
3
R
R
R
S
R
L
CP
04-1
258
C
P 9
6-1
252
01 P
04
' N
one
10.9
4
R
L
L
R
R
L
CP
04-1
321
C
P 9
6-1
252
01 P
04
Muck
9.3
1
R
R
R
S
R
L
CP
04-1
367
C
P 9
7-2
068
C
P 9
4-1
607
N
one
13.2
4
R
L
L
L
R
R
CP
04-1
374
C
P 9
7-2
068
C
P 9
4-1
607
N
one
11.8
2
R
L
L
R
R
R
CP
04-1
426
C
P 9
5-1
712
C
P 8
4-1
198
N
one
12.7
5
L
R
S
L
L
R
CP
04-1
566
C
P 8
9-2
377
C
P 9
6-1
252
S
and
9.7
3
L
R
R
R
L
R
CP
04-1
619
C
P 9
5-1
569
C
P 8
4-1
198
N
one
10.4
5
R
R
L
R
R
R
CP
04-1
844
C
P 9
7-1
989
C
P 8
4-1
198
S
and
9.9
5
R
R
R
S
L
L
17
Tab
le 1
. P
are
nta
ge, fi
ber
co
nte
nt,
in
cre
ase s
tatu
s,
an
d r
ati
ng
s o
f su
scep
tib
ilit
y t
o s
mu
t, r
ust,
leaf
scald
, m
os
aic
, a
nd
ra
too
n s
tun
tin
g f
or
CL
77-0
79
7,
CP
72-2
086, C
P 7
8-1
628, C
P 8
9-2
143, an
d 8
0 n
ew
su
garc
an
e c
lon
es
Ra
tin
g*
Pare
nta
ge
Incre
ase
Perc
en
t
R
ust
Le
af
R
ato
on
Clo
ne
F
em
ale
M
ale
sta
tusH
fi
ber
Sm
ut
Bro
wn
Ora
ng
e
sc
ald
M
os
aic
s
tun
tin
gI
C
P 0
4-1
935
C
P 9
4-2
059
C
P 8
4-1
322
S
and
10.5
7
R
R
R
L
L
L
CP
CL 9
5-2
287
C
L 7
8-1
120
C
L 7
8-1
600
M
uck
12.3
5
R
L
L
L
R
R
CP
CL 9
9-1
225
C
L 8
7-2
608
C
P 8
0-1
743
N
one
11.5
2
S
S
S
R
R
L
CP
CL 9
9-1
401
C
L 7
4-0
259
C
P 8
1-1
238
N
one
10.6
7
R
S
S
S
R
R
CP
CL 9
9-1
777
C
L 8
3-3
586
C
L 8
4-4
234
N
one
11.0
5
R
S
S
R
R
R
CP
CL 9
9-2
103
C
L 8
6-4
047
C
L 8
4-3
152
N
one
11.9
9
S
S
S
R
R
S
CP
CL 9
9-2
206
C
L 8
7-1
630
C
P 8
0-1
743
N
one
9.6
6
R
S
S
S
L
S
CP
CL 9
9-2
574
C
L 8
3-3
431
M
IX 9
8C
' N
one
11.8
9
R
L
L
L
R
R
CP
CL 9
9-4
455
C
L 9
0-4
643
C
P 8
4-1
198
C
om
merc
ial
10.1
9
S
R
R
L
R
S
CP
CL 0
0-0
129
C
L 8
4-3
878
Mix
91V
N
one
10.2
3
R
L
L
R
R
R
CP
CL 0
0-0
458
C
L 8
7-2
882
CL 8
9-5
189
N
one
10.4
4
R
S
S
R
R
U
CP
CL 0
0-1
373
C
L 8
3-1
900
C
L 8
8-4
730
N
one
12.2
7
R
S
L
R
R
U
CP
CL 0
0-4
027
C
L 8
3-1
364
C
L 8
6-4
590
N
one
11.5
9
R
S
S
R
R
U
CP
CL 0
0-4
111
C
L 8
3-3
431
C
L 8
9- 5
189
M
uck
11.2
3
R
R
R
L
R
S
CP
CL 0
0-4
611
C
L 8
0-1
575
C
P 8
5-1
491
N
one
11.7
5
L
S
S
R
R
R
C
PC
L 0
0-6
131
C
L 8
7-1
630
C
P 8
4-1
198
N
one
11.2
4
L
L
S
R
L
R
CP
CL 0
0-6
756
C
L 8
3-1
364
C
L 9
2-5
431
N
one
12.1
9
R
S
S
R
R
R
CP
CL 0
1-0
271
C
L 8
6-4
340
P
oly
00
-3
None
10.8
8
R
L
S
R
L
S
CP
CL 0
1-0
571
C
L 8
7-2
944
C
L 8
6-4
590
N
one
11.0
9
R
L
S
L
L
R
CP
CL 0
1-0
877
C
L 9
0-4
725
C
L 8
8-4
730
N
one
10.7
0
R
L
L
R
R
R
CP
CL 0
2-0
843
CL 8
9-5
189
C
P 8
0-1
743
N
one
10.5
5
L
R
S
L
R
L
C
PC
L 0
2-0
908
C
L 9
2-0
775
LC
P 8
5-0
384
N
one
9.8
3
R
S
S
S
R
L
CP
CL 0
2-0
926
C
P 8
0-1
743
C
L 9
2-0
046
N
one
10.3
6
R
R
R
L
S
L
CP
CL 0
2-1
295
C
P 8
8-1
762
C
L 9
1-1
637
A
ll 10.9
7
R
R
L
S
R
R
CP
CL 0
2-2
273
C
P 8
9-2
143
CL 8
8-4
730
M
uck
11.6
0
R
L
L
L
R
R
CP
CL 0
2-2
913
C
L 8
8-4
730
C
P 8
0-1
7434
N
one
10.3
2
R
S
S
L
S
L
CP
CL 0
2-2
975
C
L 9
4-4
155
C
L 8
4-4
302
N
one
10.3
6
R
S
S
R
S
L
* R
= r
esis
tant en
ough for
com
merc
ial pro
duction;
L =
low
levels
of
dis
ease s
usceptibili
ty;
S =
too s
usceptible
for
pro
du
ctio
n;
U =
un
de
term
ine
d s
usce
ptib
ility
(a
vaila
ble
data
not suffic
ient to
dete
rmin
e the level of
susceptibili
ty).
H C
om
merc
ial =
Rele
ased for
com
merc
ial pro
duction;
None =
Not
consid
ere
d a
s p
ote
ntial re
lease c
andid
ate
; O
therw
ise
, in
cre
asin
g a
cre
ag
e o
f se
ed
ca
ne
at
all
locations, lo
cation
s w
ith s
and s
oils
only
, or
locatio
ns w
ith m
uck s
oils
only
. I R
ato
on s
tunting c
an b
e c
ontr
olle
d b
y u
sin
g h
eat
treate
d o
r tissue c
ulture
d v
egeta
tive p
lanting m
ate
rial.
' 01 P
04 a
nd M
ix 9
8c r
efe
r to
poly
cro
sses. In
01 P
04,
fem
ale
pare
nt
(CP
96
-1252)
exposed t
o p
olle
n f
rom
many c
lon
es in
20
01
cro
ssin
g s
ea
so
n;
in M
ix 9
8c,
CL
83-3
431 e
xposed
to p
olle
n fro
m m
any c
lones; and t
here
fore
, m
ale
pare
nts
of
CP
04
-1258 a
nd C
PC
L 9
9-2
574 u
nkn
ow
n.
Sim
ilar
exp
lan
atio
ns f
or
CP
04
-13
21
, C
PC
L 0
0-0
129, a
nd C
PC
L 0
1-0
271.

18
Tabl
e 2.
Yie
lds
of c
ane
in m
etric
tons
per
hec
tare
(TC
/H) f
rom
pla
nt c
ane
on D
ania
muc
k an
d La
uder
hill
muc
k
M
ean
yiel
d by
soi
l typ
e, fa
rm, a
nd s
ampl
ing
date
D
ania
muc
k
Laud
erhi
ll m
uck
Dud
a
SFI
Kni
ght
Wed
gwor
th
Oke
elan
ta
M
ean
yiel
d,
Clo
ne
12/3
0/20
08
12
/22/
2008
12
/29/
2008
1/
22/2
009
2/4/
2009
all f
arm
s
CP
CL
02-1
295
143.
44
22
3.90
*
10
5.30
251.
49
*
151.
47 *
175.
12 *
C
PC
L 02
-227
3 16
6.52
193.
63
96
.13
20
1.14
*
15
3.36
*
16
2.15
*
CP
CL
95-2
287
17
4.26
*
19
2.05
84.7
1
213.
15
*
137.
74
16
0.07
*
CP
04-
1367
15
0.91
178.
98
11
6.10
*
19
1.71
141.
04
15
5.75
C
P 7
8-16
28
155.
17
18
9.01
----
-
187.
18
14
5.92
154.
28
CP
CL
02-0
926
131.
69
21
2.30
*
76
.90
19
3.23
147.
65 *
152.
19
CP
04-
1321
14
4.73
210.
05 *
47.1
6
228.
93
*
128.
05
15
1.79
C
PC
L 02
-084
3 15
0.63
163.
91
11
1.20
177.
45
15
0.92
*
15
0.82
C
P 0
4-16
19
136.
63
18
3.66
92.5
9
190.
31
13
2.27
147.
09
CP
04-
1252
13
5.50
202.
79 *
81.0
0
183.
26
12
5.82
145.
67
CP
04-
1426
14
4.75
160.
92
10
2.50
163.
01
14
3.24
143.
28
CP
89-
2143
14
9.10
177.
65
88
.71
16
9.46
125.
63
14
2.11
C
PC
L 02
-297
5 12
4.04
176.
20
88
.22
17
9.07
122.
72
13
7.90
C
PC
L 02
-291
3 12
7.49
173.
84
89
.91
16
2.77
126.
50
13
6.10
C
PC
L 02
-090
8 12
2.87
149.
57
66
.88
20
1.69
*
91
.72
12
6.54
C
P 7
2-20
86
113.
15
15
0.58
46.8
5
167.
57
11
7.06
119.
04
Mea
n 14
1.93
183.
69
86
.28
19
1.34
133.
82
14
7.49
LS
D (p
= 0
.1)†
24.4
4
20.2
1
24.1
4
27.8
4
19.0
8
17.3
8 C
V (%
) 11
.43
11
.82
23
.74
12
.66
12
.01
9.
30
*S
igni
fican
tly g
reat
er th
an C
P 8
9-21
43 a
t p =
0.1
0 ba
sed
on t
test
.
†LS
D fo
r loc
atio
n m
eans
of c
ane
yiel
d =
10.9
9 TC
/H a
t p =
0.1
0.
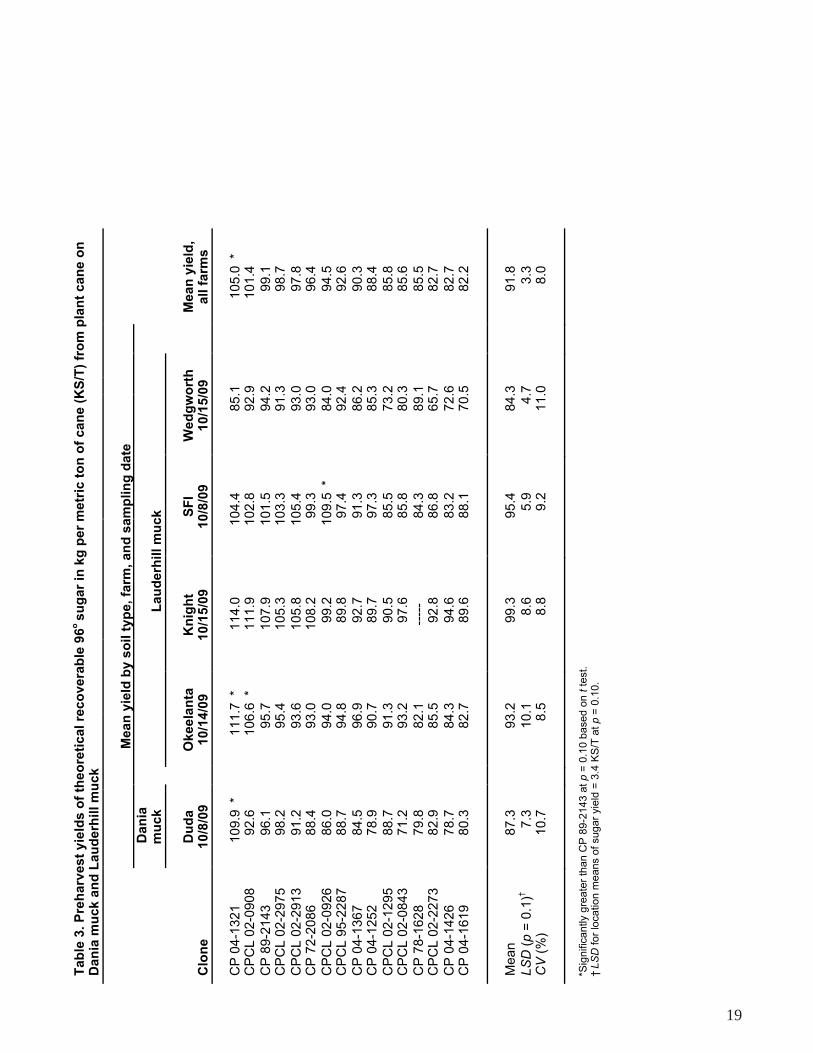
19
Tab
le 3
. P
reh
arv
est
yie
lds o
f th
eo
reti
cal re
co
vera
ble
96
o s
ug
ar
in k
g p
er
metr
ic t
on
of
can
e (
KS
/T)
fro
m p
lan
t can
e o
n
Dan
ia m
uck a
nd
Lau
derh
ill m
uck
Mean
yie
ld b
y s
oil t
yp
e, fa
rm, an
d s
am
plin
g d
ate
D
an
ia
mu
ck
L
au
derh
ill m
uck
Du
da
O
keela
nta
K
nig
ht
SF
I W
ed
gw
ort
h
M
ean
yie
ld,
Clo
ne
10/8
/09
10/1
4/0
9
10/1
5/0
9
10/8
/09
10/1
5/0
9
all
farm
s
C
P 0
4-1
321
109.9
*
111.7
*
114.0
104.4
85.1
105.0
*
CP
CL 0
2-0
908
92.6
106.6
*
111.9
102.8
92.9
101.4
CP
89-2
143
96.1
95.7
107.9
101.5
94.2
99.1
C
PC
L 0
2-2
975
98.2
95.4
105.3
103.3
91.3
98.7
CP
CL 0
2-2
913
91.2
93.6
105.8
105.4
93.0
97.8
C
P 7
2-2
086
88.4
93.0
108.2
99.3
93.0
96.4
CP
CL 0
2-0
926
86.0
94.0
99.2
109.5
*
84.0
94.5
C
PC
L 9
5-2
287
88.7
94.8
89.8
97.4
92.4
92.6
CP
04-1
367
84.5
96.9
92.7
91.3
86.2
90.3
C
P 0
4-1
252
78.9
90.7
89.7
97.3
85.3
88.4
CP
CL 0
2-1
295
88.7
91.3
90.5
85.5
73.2
85.8
C
PC
L 0
2-0
843
71.2
93.2
97.6
85.8
80.3
85.6
CP
78-1
628
79.8
82.1
--
---
84.3
89.1
85.5
C
PC
L 0
2-2
273
82.9
85.5
92.8
86.8
65.7
82.7
CP
04-1
426
78.7
84.3
94.6
83.2
72.6
82.7
C
P 0
4-1
619
80.3
82.7
89.6
88.1
70.5
82.2
M
ean
87.3
93.2
99.3
95.4
84.3
91.8
LS
D (
p =
0.1
)†
7.3
10.1
8.6
5.9
4.7
3.3
C
V (
%)
10.7
8.5
8.8
9.2
11.0
8.0
*Sig
nific
antly g
reate
r th
an C
P 8
9-2
143 a
t p =
0.1
0 b
ased
on t
test.
† L
SD
for
location m
eans o
f sugar
yie
ld =
3.4
KS
/T a
t p =
0.1
0.

20
Tab
le 4
. Y
ield
s o
f th
eo
reti
cal re
co
vera
ble
96
o s
ug
ar
in k
g p
er
metr
ic t
on
of
can
e (
KS
/T)
fro
m p
lan
t can
e o
n D
an
ia m
uck
an
d L
au
derh
ill m
uck
Mea
n y
ield
by s
oil t
yp
e, fa
rm, an
d s
am
plin
g d
ate
Dan
ia m
uck
L
au
derh
ill m
uck
Du
da
S
FI
Kn
igh
t W
ed
gw
ort
h
Okeela
nta
Mean
yie
ld,
Clo
ne
12/3
0/2
008
12/2
2/2
008
12/2
9/2
008
1/2
2/2
009
2/4
/200
9
all
farm
s
C
P 0
4-1
321
125.1
*
123.6
125.8
*
123.7
*
126.9
*
125.0
*
CP
CL 0
2-0
908
121.7
125.5
120.5
125.2
*
126.7
*
123.9
*
CP
CL 0
2-2
913
121.8
128.6
122.5
121.5
*
123.1
123.5
C
PC
L 0
2-2
975
119.3
124.2
122.4
117.9
122.4
121.3
CP
CL 0
2-0
926
120.7
123.5
120.4
117.1
123.3
121.0
C
P 8
9-2
143
121.1
126.8
121.4
116.4
119.1
121.0
CP
72-2
086
118.7
125.8
118.9
116.6
121.7
120.3
C
P 7
8-1
628
114.3
124.7
-
----
112.0
118.9
117.2
CP
CL 0
2-2
273
112.5
122.5
113.5
114.1
121.3
116.8
C
PC
L 0
2-0
843
116.0
119.9
111.3
109.7
118.6
115.1
CP
CL 0
2-1
295
114.1
119.2
111.3
115.0
115.3
115.0
C
PC
L 9
5-2
287
114.6
116.6
112.1
115.3
115.0
114.7
CP
04-1
619
114.7
116.5
116.9
110.2
112.9
114.2
C
P 0
4-1
367
107.6
114.9
106.6
106.2
108.7
108.8
CP
04-1
252
105.3
107.6
104.2
106.7
108.8
106.5
C
P 0
4-1
426
101.8
109.2
106.8
108.0
94.0
104.1
M
ean
115.6
120.6
115.6
114.7
117.3
116.8
LS
D (
p =
0.1
)†
3.4
4.2
4.1
4.7
5.4
2.8
C
V (
%)
5.6
5.1
5.8
5.0
7.1
5.3
*S
ignific
antly g
reate
r th
an C
P 8
9-2
143 a
t p =
0.1
0 b
ase
d o
n t
test.
† LS
D for
location m
eans o
f sugar
yie
ld =
2.2
KS
/T a
t p
= 0
.10.
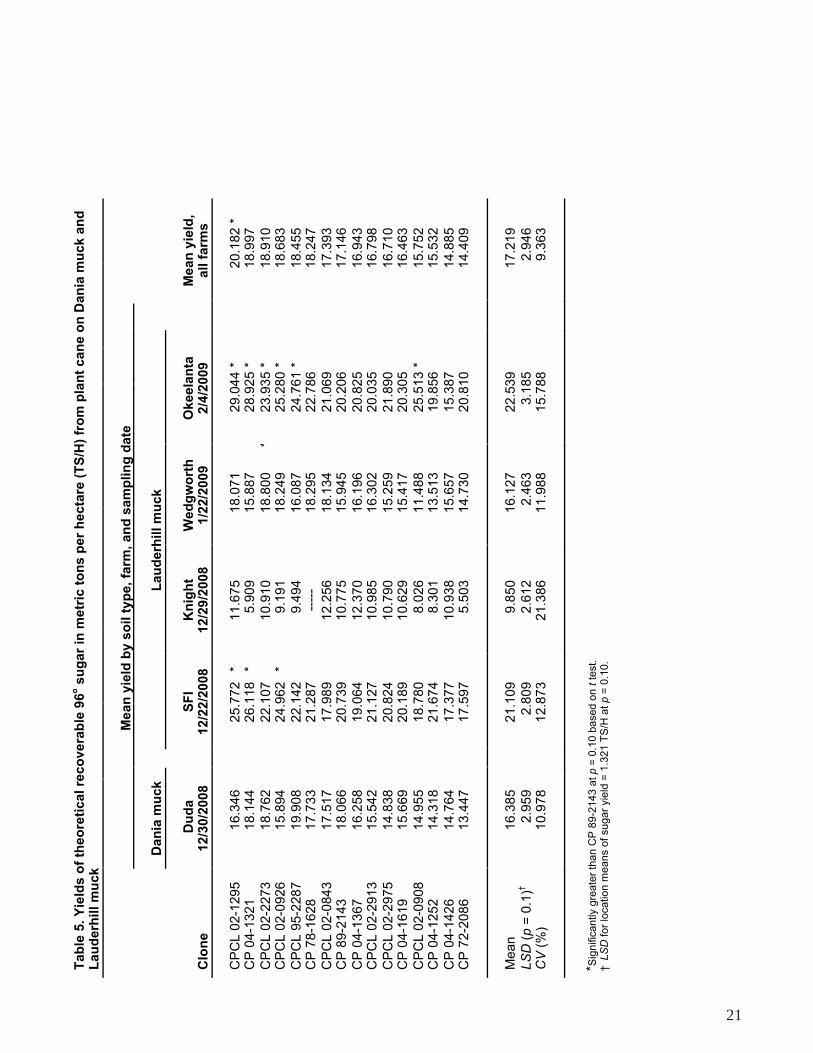
21
Tab
le 5
. Y
ield
s o
f th
eo
reti
cal re
co
vera
ble
96
o s
ug
ar
in m
etr
ic t
on
s p
er
hecta
re (
TS
/H)
fro
m p
lan
t can
e o
n D
an
ia m
uck a
nd
L
au
derh
ill m
uck
Me
an
yie
ld b
y s
oil t
yp
e, fa
rm, an
d s
am
plin
g d
ate
Dan
ia m
uck
L
au
derh
ill m
uck
Du
da
S
FI
Kn
igh
t W
ed
gw
ort
h
Okeela
nta
Mean
yie
ld,
Clo
ne
12/3
0/2
008
12/2
2/2
008
12/2
9/2
008
1/2
2/2
009
2/4
/200
9
all
farm
s
C
PC
L 0
2-1
295
16.3
46
25
.772
*
11.6
75
18.0
71
29.0
44
*
20.1
82
*
CP
04-1
321
18.1
44
26
.118
*
5.9
09
15.8
87
28.9
25
*
18.9
97
CP
CL 0
2-2
273
18.7
62
22
.107
10.9
10
18.8
00
*
23.9
35
*
18.9
10
C
PC
L 0
2-0
926
15.8
94
24
.962
*
9.1
91
18.2
49
25.2
80
*
18.6
83
CP
CL 9
5-2
287
19.9
08
22
.142
9.4
94
16.0
87
24.7
61
*
18.4
55
C
P 7
8-1
628
17.7
33
21
.287
--
---
18.2
95
22.7
86
18.2
47
CP
CL 0
2-0
843
17.5
17
17
.989
12.2
56
18.1
34
21.0
69
17.3
93
C
P 8
9-2
143
18.0
66
20
.739
10.7
75
15.9
45
20.2
06
17.1
46
CP
04-1
367
16.2
58
19
.064
12.3
70
16.1
96
20.8
25
16.9
43
C
PC
L 0
2-2
913
15.5
42
21
.127
10.9
85
16.3
02
20.0
35
16.7
98
CP
CL 0
2-2
975
14.8
38
20
.824
10.7
90
15.2
59
21.8
90
16.7
10
CP
04-1
619
15.6
69
20
.189
10.6
29
15.4
17
20.3
05
16.4
63
CP
CL 0
2-0
908
14.9
55
18
.780
8.0
26
11.4
88
25.5
13
*
15.7
52
C
P 0
4-1
252
14.3
18
21
.674
8.3
01
13.5
13
19.8
56
15.5
32
CP
04-1
426
14.7
64
17
.377
10.9
38
15.6
57
15.3
87
14.8
85
C
P 7
2-2
086
13.4
47
17
.597
5.5
03
14.7
30
20.8
10
14.4
09
M
ean
16.3
85
21
.109
9.8
50
16.1
27
22.5
39
17.2
19
LS
D (
p =
0.1
)†
2.9
59
2.8
09
2.6
12
2.4
63
3.1
85
2.9
46
CV
(%
) 10.9
78
12
.873
21.3
86
11.9
88
15.7
88
9.3
63
*S
ignific
antly g
reate
r th
an C
P 8
9-2
143 a
t p =
0.1
0 b
ase
d o
n t test.
† L
SD
for
location m
eans o
f sugar
yie
ld =
1.3
21 T
S/H
at
p =
0.1
0.
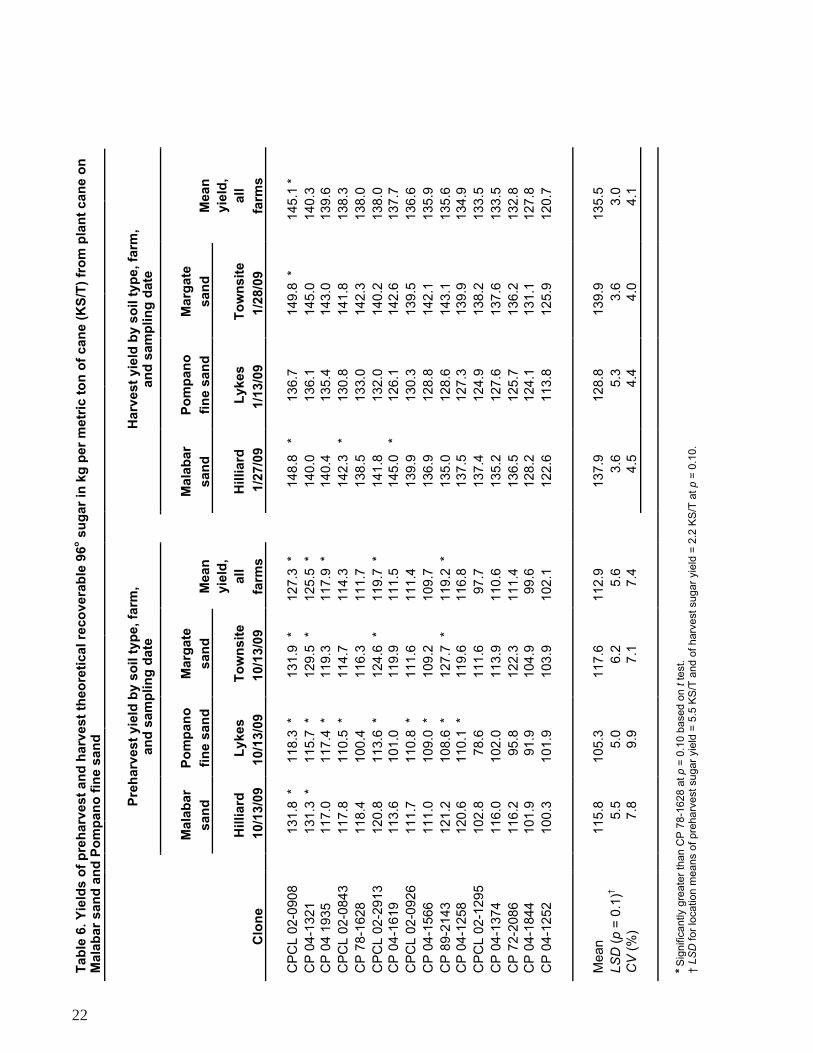
22
Tab
le 6
. Y
ield
s o
f p
reh
arv
est
an
d h
arv
est
theo
reti
cal re
co
vera
ble
96
o s
ug
ar
in k
g p
er
metr
ic t
on
of
can
e (
KS
/T)
fro
m p
lan
t can
e o
n
Mala
bar
sa
nd
an
d P
om
pan
o f
ine s
an
d
Pre
harv
est
yie
ld b
y s
oil t
yp
e, fa
rm,
an
d s
am
plin
g d
ate
Harv
est
yie
ld b
y s
oil
typ
e,
farm
, a
nd
sam
pli
ng
date
Mala
bar
P
om
pan
o
Marg
ate
M
ala
bar
P
om
pan
o
Marg
ate
san
d
fin
e s
an
d
san
d
Mean
san
d
fin
e s
an
d
san
d
Mean
y
ield
,
y
ield
,
Hilliard
L
ykes
To
wn
sit
e
all
H
illiard
L
ykes
T
ow
nsit
e
all
Clo
ne
1
0/1
3/0
9
10/1
3/0
9
10/1
3/0
9
farm
s
1
/27/0
9
1/1
3/0
9
1/2
8/0
9
farm
s
CP
CL 0
2-0
908
131.8
*
118.3
*
131.9
*
127.3
*
148.8
*
136.7
149.8
*
145.1
*
CP
04-1
321
131.3
*
115.7
*
129.5
*
125.5
*
140.0
136.1
145.0
140.3
CP
04 1
935
117.0
117.4
*
119.3
1
17.9
*
140.4
135.4
143.0
139.6
CP
CL 0
2-0
843
117.8
110.5
*
114.7
1
14.3
142.3
*
130.8
141.8
138.3
CP
78-1
628
118.4
100.4
116.3
1
11.7
138.5
133.0
142.3
138.0
CP
CL 0
2-2
913
120.8
113.6
*
124.6
*
119.7
*
141.8
132.0
140.2
138.0
CP
04-1
619
113.6
101.0
119.9
1
11.5
145.0
*
126.1
142.6
137.7
CP
CL 0
2-0
926
111.7
110.8
*
111.6
1
11.4
139.9
130.3
139.5
136.6
CP
04-1
566
111.0
109.0
*
109.2
1
09.7
136.9
128.8
142.1
135.9
CP
89-2
143
121.2
108.6
*
127.7
*
119.2
*
135.0
128.6
143.1
135.6
CP
04-1
258
120.6
110.1
*
119.6
1
16.8
137.5
127.3
139.9
134.9
CP
CL 0
2-1
295
102.8
78.6
111.6
97.7
137.4
124.9
138.2
133.5
CP
04-1
374
116.0
102.0
113.9
1
10.6
135.2
127.6
137.6
133.5
CP
72-2
086
116.2
95.8
122.3
1
11.4
136.5
125.7
136.2
132.8
CP
04-1
844
101.9
91.9
104.9
99.6
128.2
124.1
131.1
127.8
CP
04-1
252
100.3
101.9
103.9
1
02.1
122.6
113.8
125.9
120.7
Mean
115.8
105.3
117.6
1
12.9
137.9
128.8
139.9
135.5
LS
D (
p =
0.1
)†
5.5
5.0
6.2
5.6
3.6
5.3
3.6
3.0
CV
(%
)
7.8
9.9
7.1
7.4
4.5
4.4
4.0
4.1
* S
ignific
antly g
reate
r th
an C
P 7
8-1
628 a
t p =
0.1
0 b
ase
d o
n t
test.
† L
SD
for
location m
eans o
f pre
harv
est
sugar
yie
ld =
5.5
KS
/T a
nd o
f harv
est sugar
yie
ld =
2.2
KS
/T a
t p =
0.1
0.

23
Tab
le 7
. Y
ield
s o
f can
e a
nd
th
eo
reti
cal re
co
vera
ble
96
o s
ug
ar
in m
etr
ic t
on
s p
er
hecta
re (
TC
/H a
nd
TS
/H)
fro
m p
lan
t can
e o
n M
ala
bar
san
d, M
arg
ate
san
d, an
d P
om
pan
o f
ine s
an
d
Can
e y
ield
by s
oil t
yp
e, fa
rm,
an
d s
am
plin
g d
ate
Su
gar
yie
ld b
y s
oil
typ
e,
farm
, a
nd
sam
pli
ng
date
Mala
bar
P
om
pan
o
Marg
ate
M
ala
bar
P
om
pan
o
Marg
ate
San
d
Fin
e S
an
d
San
d
Mean
San
d
Fin
e S
an
d
San
d
Mean
y
ield
,
y
ield
,
Hilliard
L
ykes
To
wn
sit
e
all
H
illiard
L
ykes
To
wn
sit
e
all
Clo
ne
1/2
7/0
9
1/1
3/0
9
1/2
8/0
9
farm
s
1/2
7/0
9
1/1
3/0
9
1/2
8/0
9
farm
s
CP
04-1
844
184.1
7
*
152
.58
173.7
2 *
170.1
6 *
23.6
85
19.0
38
22.7
32
*
21.8
18
CP
04-1
566
156.3
6
144
.06
164.3
1 *
154.9
1
21.4
17
18.5
70
23.3
85
*
21.1
24
CP
04-1
935
172.6
1
108
.15
162.4
1 *
147.7
2
24.2
43
14.6
02
23.1
89
*
20.6
78
CP
CL 0
2-1
295
153.4
8
141.8
9
162.0
0 *
152.4
6
21.0
89
17.7
54
22.3
70
*
20.4
04
CP
CL 0
2-0
843
161.6
1
138
.11
138.7
8
146.1
7
23.0
04
18.0
76
19.6
92
20.2
57
CP
78-1
628
158.8
5
138.6
5
128.5
7
141.8
0
22.0
14
18.3
94
18.2
82
19.5
35
CP
CL 0
2-0
926
151.8
2
144.6
4
124.2
4
140.2
3
21.1
83
18.7
98
17.3
45
19.1
09
CP
89-2
143
161.9
5
123.5
2
133.9
7
139.8
1
21.8
60
15.9
53
19.1
84
18.9
99
CP
04-1
374
150.9
2
148
.84
127.4
2
142.3
9
20.3
83
19.0
02
17.5
23
18.9
69
CP
04-1
258
156.5
2
130
.69
132.1
1
139.7
7
21.5
22
16.5
83
18.4
76
18.8
60
CP
04-1
619
153.7
6
123.9
5
124.5
9
133.7
7
22.3
20
15.6
40
17.7
23
18.4
87
CP
CL 0
2-2
913
135.5
5
112.2
9
131.8
2
126.5
5
19.2
08
14.8
30
18.4
68
17.5
02
CP
04-1
321
121.2
1
113
.03
121.8
2
118.6
9
16.9
36
15.4
02
17.6
47
16.6
61
CP
CL 0
2-0
908
122.1
3
115
.07
102.2
0
113.1
3
18.1
78
15.6
15
15.2
99
16.3
64
CP
04-1
252
130.2
4
130
.72
145.5
9
135.0
4
15.9
18
14.8
29
17.7
76
16.0
66
CP
72-2
086
136.5
6
94
.10
120.0
0
116.8
9
18.6
14
11.8
28
16.3
09
15.5
83
Mean
150.4
8
128
.77
137.1
0
138.7
2
20.7
23
16.5
57
19.0
87
18.7
76
LS
D (
p =
0.1
)†
22.6
2
23.8
2
17.9
4
16.9
0
3.1
02
3.1
69
2.4
80
2.3
00
CV
(%
)
11.5
5
13
.00
14.2
3
10.7
3
11.4
26
12.4
66
13.1
39
10.0
62
* Sig
nific
antly g
reate
r th
an C
P 7
8-1
628 a
t p =
0.1
0 b
ase
d o
n t
test.
† L
SD
for
location m
eans o
f cane y
ield
= 9
.35 T
C/H
and
of sugar
yie
ld =
1.2
92 T
S/H
at p =
0.1
0.
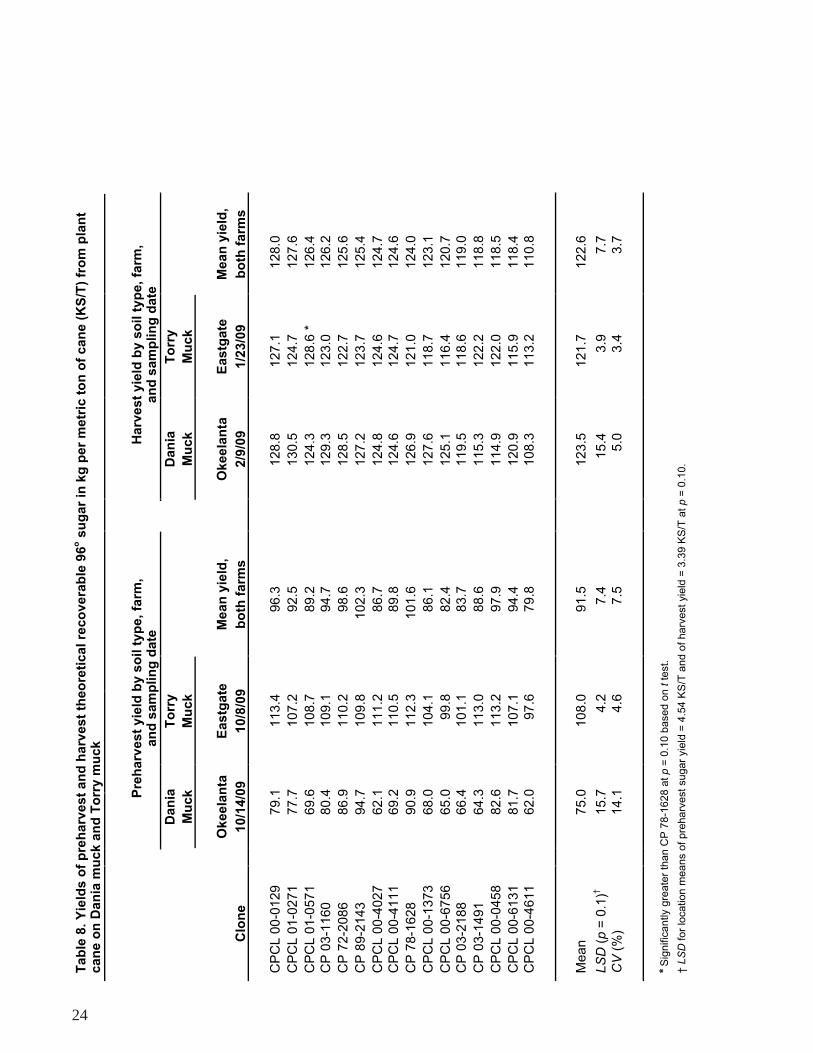
24
Tab
le 8
. Y
ield
s o
f p
reh
arv
est
an
d h
arv
est
theo
reti
cal re
co
vera
ble
96
o s
ug
ar
in k
g p
er
metr
ic t
on
of
can
e (
KS
/T)
fro
m p
lan
t can
e o
n D
an
ia m
uck a
nd
To
rry
mu
ck
Pre
harv
est
yie
ld b
y s
oil t
yp
e, fa
rm,
an
d s
am
plin
g d
ate
Harv
est
yie
ld b
y s
oil
typ
e,
farm
, a
nd
sam
pli
ng
date
Dan
ia
To
rry
D
an
ia
To
rry
Mu
ck
M
uck
M
uck
M
uck
Okeela
nta
E
astg
ate
M
ean
yie
ld,
O
keela
nta
E
astg
ate
M
ean
yie
ld,
Clo
ne
10/1
4/0
9
10/8
/09
bo
th f
arm
s
2/9
/09
1/2
3/0
9
bo
th f
arm
s
CP
CL 0
0-0
129
79.1
11
3.4
96.3
128.8
127.1
128.0
CP
CL 0
1-0
271
77.7
10
7.2
92.5
130.5
124.7
127.6
CP
CL 0
1-0
571
69.6
10
8.7
89.2
124.3
128.6
*
126.4
CP
03-1
160
80.4
10
9.1
94.7
129.3
123.0
126.2
CP
72-2
086
86.9
11
0.2
98.6
128.5
122.7
125.6
CP
89-2
143
94.7
10
9.8
102.3
127.2
123.7
125.4
CP
CL 0
0-4
027
62.1
11
1.2
86.7
124.8
124.6
124.7
CP
CL 0
0-4
111
69.2
11
0.5
89.8
124.6
124.7
124.6
CP
78-1
628
90.9
11
2.3
101.6
126.9
121.0
124.0
CP
CL 0
0-1
373
68.0
10
4.1
86.1
127.6
118.7
123.1
CP
CL 0
0-6
756
65.0
99.8
82.4
125.1
116.4
120.7
CP
03-2
188
66.4
10
1.1
83.7
119.5
118.6
119.0
CP
03-1
491
64.3
11
3.0
88.6
115.3
122.2
118.8
CP
CL 0
0-0
458
82.6
11
3.2
97.9
114.9
122.0
118.5
CP
CL 0
0-6
131
81.7
10
7.1
94.4
120.9
115.9
118.4
CP
CL 0
0-4
611
62.0
97.6
79.8
108.3
113.2
110.8
Mean
75.0
10
8.0
91.5
123.5
121.7
122.6
LS
D (
p =
0.1
)†
15.7
4.2
7.4
15.4
3.9
7.7
CV
(%
)
14.1
4.6
7.5
5.0
3.4
3.7
* Sig
nific
antly g
reate
r th
an C
P 7
8-1
628 a
t p =
0.1
0 b
ase
d o
n t
test.
† L
SD
for
location m
ea
ns o
f pre
harv
est sugar
yie
ld =
4.5
4 K
S/T
and o
f harv
est yie
ld =
3.3
9 K
S/T
at p =
0.1
0.
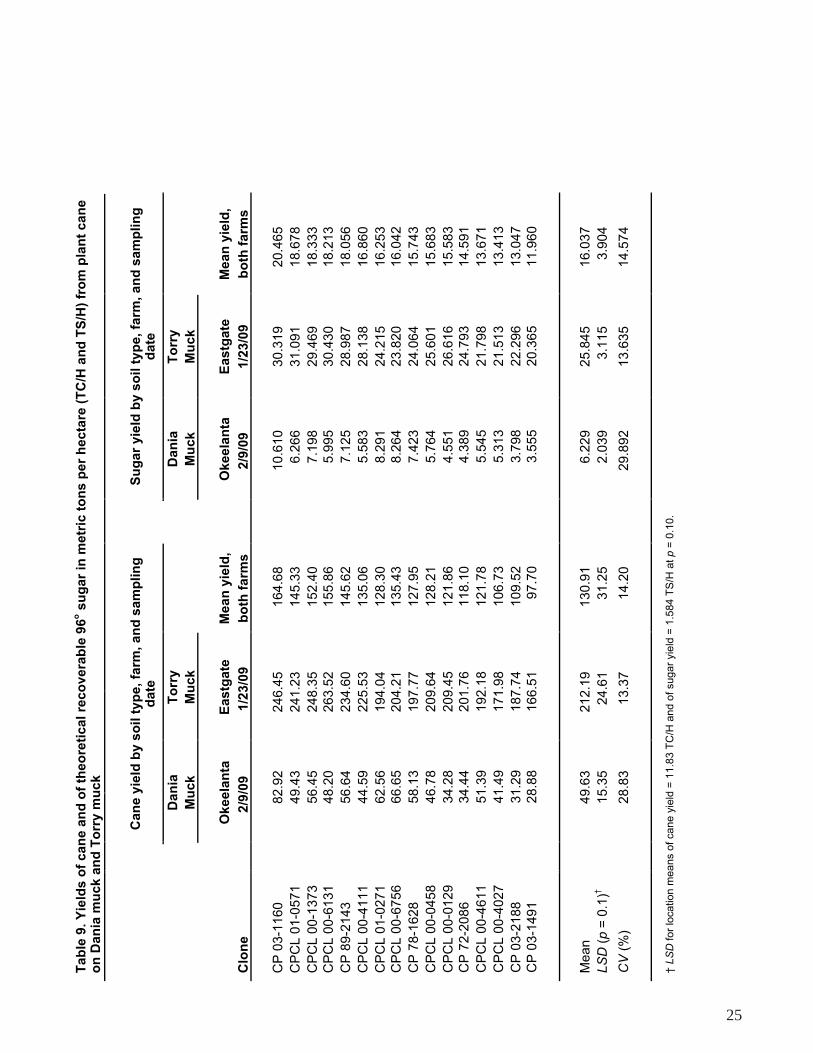
25
Tab
le 9
. Y
ield
s o
f can
e a
nd
of
theo
reti
cal re
co
vera
ble
96
o s
ug
ar
in m
etr
ic t
on
s p
er
hecta
re (
TC
/H a
nd
TS
/H)
fro
m p
lan
t can
e
on
Dan
ia m
uck a
nd
To
rry m
uck
Can
e y
ield
by s
oil t
yp
e, fa
rm, an
d s
am
plin
g
date
Su
gar
yie
ld b
y s
oil
typ
e,
farm
, an
d s
am
pli
ng
d
ate
Dan
ia
To
rry
D
an
ia
To
rry
Mu
ck
M
uck
M
uck
M
uck
Okeela
nta
E
astg
ate
M
ean
yie
ld,
O
keela
nta
E
astg
ate
M
ean
yie
ld,
Clo
ne
2/9
/09
1/2
3/0
9
bo
th f
arm
s
2/9
/09
1/2
3/0
9
bo
th f
arm
s
CP
03-1
160
82.9
2
246.4
5
164.6
8
10.6
10
30.3
19
20.4
65
CP
CL 0
1-0
571
49.4
3
241.2
3
145.3
3
6.2
66
31.0
91
18.6
78
CP
CL 0
0-1
373
56.4
5
248.3
5
152.4
0
7.1
98
29.4
69
18.3
33
CP
CL 0
0-6
131
48.2
0
263.5
2
155.8
6
5.9
95
30.4
30
18.2
13
CP
89-2
143
56.6
4
234.6
0
145.6
2
7.1
25
28.9
87
18.0
56
CP
CL 0
0-4
111
44.5
9
225.5
3
135.0
6
5.5
83
28.1
38
16.8
60
CP
CL 0
1-0
271
62.5
6
194.0
4
128.3
0
8.2
91
24.2
15
16.2
53
CP
CL 0
0-6
756
66.6
5
204.2
1
135.4
3
8.2
64
23.8
20
16.0
42
CP
78-1
628
58.1
3
197.7
7
127.9
5
7.4
23
24.0
64
15.7
43
CP
CL 0
0-0
458
46.7
8
209.6
4
128.2
1
5.7
64
25.6
01
15.6
83
CP
CL 0
0-0
129
34.2
8
209.4
5
121.8
6
4.5
51
26.6
16
15.5
83
CP
72-2
086
34.4
4
201.7
6
118.1
0
4.3
89
24.7
93
14.5
91
CP
CL 0
0-4
611
51.3
9
192.1
8
121.7
8
5.5
45
21.7
98
13.6
71
CP
CL 0
0-4
027
41.4
9
171.9
8
106.7
3
5.3
13
21.5
13
13.4
13
CP
03-2
188
31.2
9
187.7
4
109.5
2
3.7
98
22.2
96
13.0
47
CP
03-1
491
28.8
8
166.5
1
97.7
0
3.5
55
20.3
65
11.9
60
Mean
49.6
3
212.1
9
130.9
1
6.2
29
25.8
45
16.0
37
LS
D (
p =
0.1
)†
15.3
5
24.6
1
31.2
5
2.0
39
3.1
15
3.9
04
CV
(%
)
28.8
3
13.3
7
14.2
0
29.8
92
13.6
35
14.5
74
† L
SD
for
location m
eans o
f cane y
ield
= 1
1.8
3 T
C/H
and o
f sugar
yie
ld =
1.5
84
TS
/H a
t p =
0.1
0.
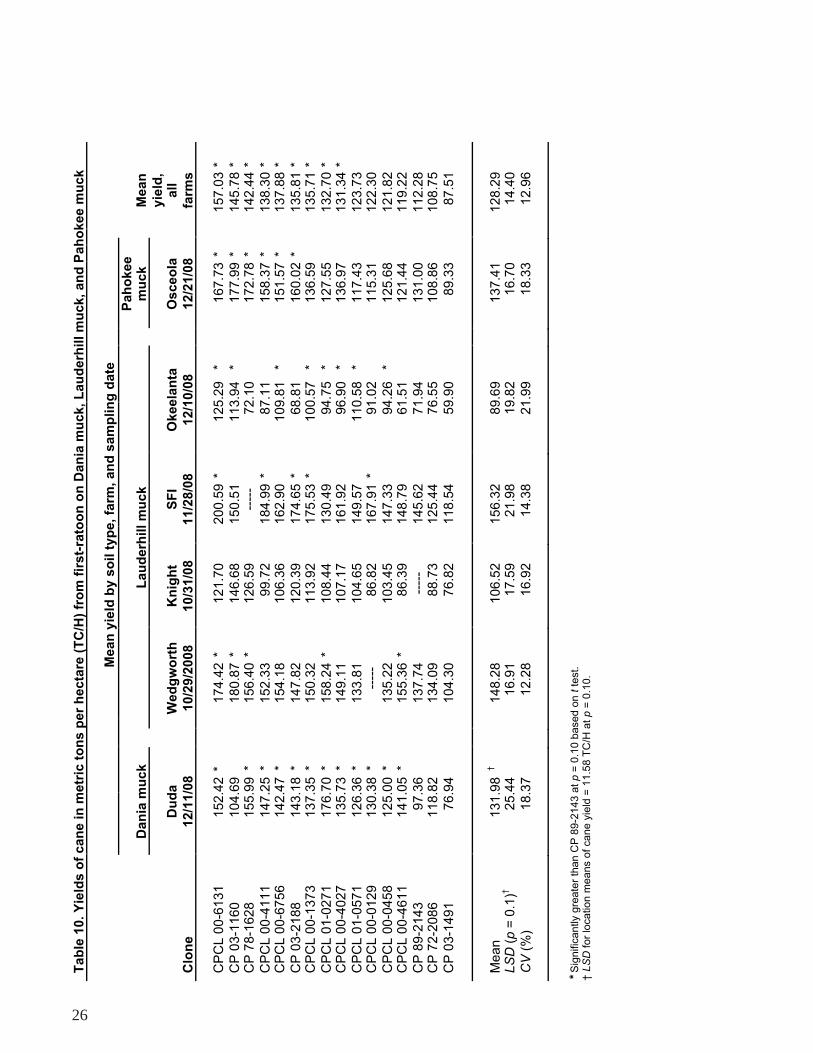
26
Tab
le 1
0. Y
ield
s o
f can
e in
metr
ic t
on
s p
er
hecta
re (
TC
/H)
fro
m f
irst-
rato
on
on
Dan
ia m
uck, L
au
derh
ill
mu
ck, an
d P
ah
okee m
uck
Mean
yie
ld b
y s
oil t
yp
e, fa
rm, an
d s
am
plin
g d
ate
Pah
okee
Dan
ia m
uck
L
au
derh
ill m
uck
m
uck
Mean
y
ield
,
Du
da
W
ed
gw
ort
h
Kn
igh
t S
FI
Okeela
nta
Osceo
la
all
Clo
ne
12/1
1/0
8
10/2
9/2
008
10/3
1/0
8
11/2
8/0
8
12/1
0/0
8
12/2
1/0
8
farm
s
CP
CL 0
0-6
131
152.4
2 *
174.4
2 *
121.7
0
200.5
9 *
125.2
9
*
167.7
3 *
157.0
3 *
CP
03-1
160
104.6
9
180.8
7 *
146.6
8
150.5
1
113.9
4
*
177.9
9 *
145.7
8 *
C
P 7
8-1
628
155.9
9 *
156.4
0 *
126.5
9
----
-
72.1
0
172.7
8 *
142.4
4 *
CP
CL 0
0-4
111
147.2
5 *
152.3
3
99.7
2
184.9
9 *
87.1
1
158.3
7 *
138.3
0 *
C
PC
L 0
0-6
756
142.4
7 *
154.1
8
106.3
6
162.9
0
109.8
1
*
151.5
7 *
137.8
8 *
CP
03-2
188
143.1
8 *
147.8
2
120.3
9
174.6
5 *
68.8
1
160.0
2 *
135.8
1 *
C
PC
L 0
0-1
373
137.3
5 *
150.3
2
113.9
2
175.5
3 *
100.5
7
*
136.5
9
135.7
1 *
CP
CL 0
1-0
271
176.7
0 *
158.2
4 *
108.4
4
130.4
9
94.7
5
*
127.5
5
132.7
0 *
C
PC
L 0
0-4
027
135.7
3 *
149.1
1
107.1
7
161.9
2
96.9
0
*
136.9
7
131.3
4 *
CP
CL 0
1-0
571
126.3
6 *
133.8
1
104.6
5
149.5
7
110.5
8
*
117.4
3
123.7
3
CP
CL 0
0-0
129
130.3
8 *
--
---
86.8
2
167.9
1 *
91.0
2
115.3
1
122.3
0
CP
CL 0
0-0
458
125.0
0 *
135.2
2
103.4
5
147.3
3
94.2
6
*
125.6
8
121.8
2
CP
CL 0
0-4
611
141.0
5 *
155.3
6 *
86.3
9
148.7
9
61.5
1
121.4
4
119.2
2
CP
89-2
143
97.3
6
137.7
4
----
-
145.6
2
71.9
4
131.0
0
112.2
8
CP
72-2
086
118.8
2
134.0
9
88.7
3
125.4
4
76.5
5
108.8
6
108.7
5
CP
03-1
491
76.9
4
104.3
0
76.8
2
118.5
4
59.9
0
89.3
3
87.5
1
M
ean
131.9
8
†
148.2
8
106.5
2
156.3
2
89.6
9
137.4
1
128.2
9
LS
D (
p =
0.1
)†
25.4
4
16.9
1
17.5
9
21.9
8
19.8
2
16.7
0
14.4
0
CV
(%
)
18.3
7
12.2
8
16.9
2
14.3
8
21.9
9
18.3
3
12.9
6
* S
ignific
antly g
reate
r th
an C
P 8
9-2
143 a
t p =
0.1
0 b
ased
on t
test.
† L
SD
for
location m
eans o
f cane y
ield
= 1
1.5
8 T
C/H
at p
= 0
.10.

27
Tab
le 1
1. Y
ield
s o
f th
eo
reti
cal re
co
vera
ble
96
o s
ug
ar
in k
g p
er
metr
ic t
on
of
can
e (
KS
/T)
fro
m f
irst-
rato
on
on
Dan
ia m
uck,
Lau
derh
ill m
uck, an
d P
ah
okee m
uck
Mean
yie
ld b
y s
oil t
yp
e, fa
rm, an
d s
am
plin
g d
ate
Pah
okee
Dan
ia m
uck
L
au
derh
ill m
uck
m
uck
Mean
y
ield
,
Du
da
W
ed
gw
ort
h
Kn
igh
t S
FI
Okeela
nta
Osceo
la
all
C
lon
e
12/1
1/0
8
10/2
9/2
008
10/3
1/0
8
11/2
8/0
8
12/1
0/0
8
12/2
1/0
8
farm
s
CP
CL 0
0-0
129
123.8
*
-
----
100.1
119.3
121.2
123.9
*
115.8
*
CP
CL 0
1-0
271
120.2
*
106.9
97.5
116.1
124.5
*
119.8
114.2
CP
CL 0
0-4
027
122.3
*
100.9
90.3
118.5
117.9
116.7
111.2
C
P 0
3-1
491
119.3
99.0
92.0
114.1
125.3
*
115.8
111.0
CP
72-2
086
118.4
104.2
96.0
114.6
116.8
115.5
110.9
C
P 8
9-2
143
115.1
103.8
--
---
115.1
118.7
116.3
110.9
CP
CL 0
0-4
111
113.1
96.8
103.6
117.5
118.3
109.3
109.8
C
PC
L 0
1-0
571
118.1
97.7
96.9
114.2
109.1
113.4
108.2
CP
03-2
188
116.6
99.3
95.6
114.8
98.5
116.9
106.9
C
P 7
8-1
628
113.0
100.4
89.6
--
---
111.3
115.7
106.9
CP
CL 0
0-6
756
114.7
89.9
97.7
106.4
115.5
114.0
106.4
C
PC
L 0
0-0
458
113.3
94.3
89.4
107.1
115.6
111.5
105.2
CP
03-1
160
106.8
95.1
88.8
110.3
111.5
113.7
104.4
C
PC
L 0
0-1
373
110.9
99.2
89.6
103.9
114.9
106.3
104.1
CP
CL 0
0-6
131
108.1
87.2
82.3
107.8
109.6
112.1
101.2
C
PC
L 0
0-4
611
107.2
92.9
86.1
106.0
106.7
104.1
100.5
Mean
115.0
97.8
93.0
112.4
114.7
114.1
108.0
LS
D (
p =
0.1
)†
4.4
4.7
4.7
5.8
3.7
4.6
3.7
C
V (
%)
4.5
5.5
6.2
4.5
6.0
4.2
4.0
* S
ignific
antly g
reate
r th
an C
P 8
9-2
143 a
t p =
0.1
0 b
ase
d o
n t test.
† L
SD
for
location m
eans o
f sugar
yie
ld =
1.9
KS
/T a
t p =
0.1
0.
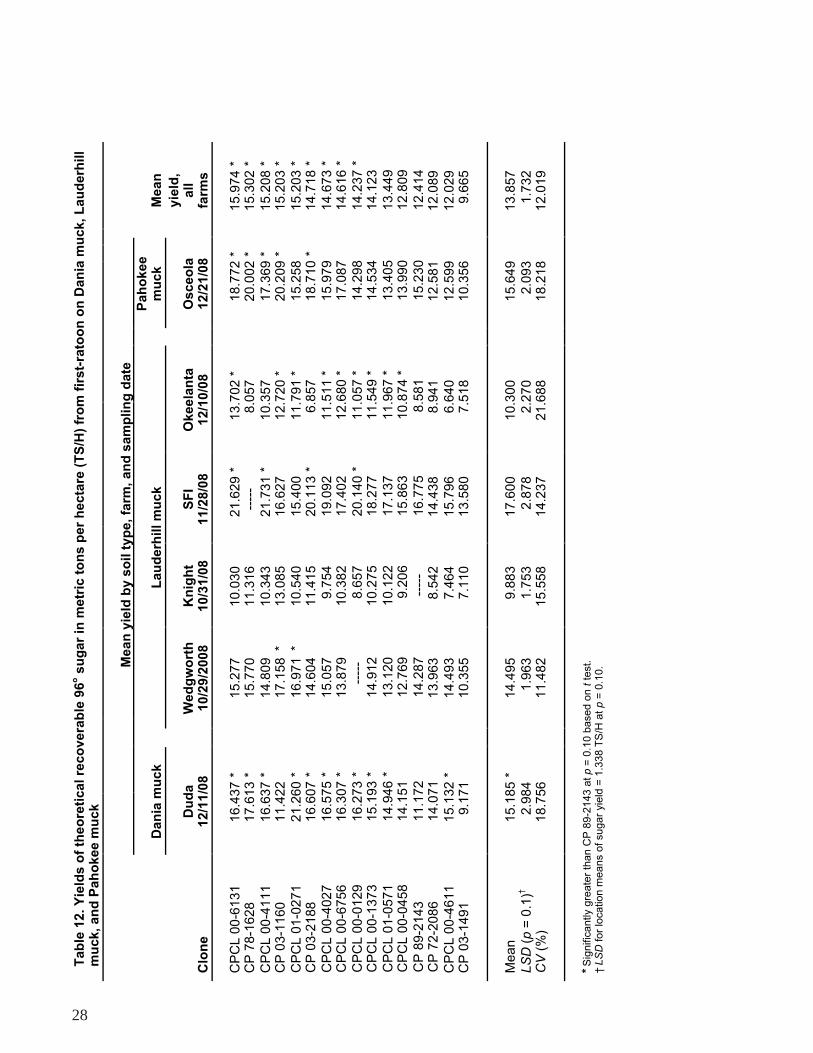
28
Tab
le 1
2. Y
ield
s o
f th
eo
reti
cal re
co
vera
ble
96
o s
ug
ar
in m
etr
ic t
on
s p
er
hecta
re (
TS
/H)
fro
m f
irs
t-ra
too
n o
n D
an
ia m
uck,
Lau
derh
ill
mu
ck, an
d P
ah
okee m
uck
M
ean
yie
ld b
y s
oil t
yp
e, fa
rm, an
d s
am
plin
g d
ate
Pah
okee
Dan
ia m
uck
L
au
derh
ill m
uck
m
uck
Mean
y
ield
,
Du
da
W
ed
gw
ort
h
Kn
igh
t S
FI
Okeela
nta
Osceo
la
all
C
lon
e
12/1
1/0
8
10/2
9/2
008
10/3
1/0
8
11/2
8/0
8
12/1
0/0
8
12/2
1/0
8
farm
s
CP
CL 0
0-6
131
16.4
37
*
15.2
77
10.0
30
21.6
29
*
13.7
02
*
18.7
72
*
15.9
74
*
CP
78-1
628
17.6
13
*
15.7
70
11.3
16
--
---
8.0
57
20.0
02
*
15.3
02
*
CP
CL 0
0-4
111
16.6
37
*
14.8
09
10.3
43
21.7
31
*
10.3
57
17.3
69
*
15.2
08
*
CP
03-1
160
11.4
22
17.1
58 *
13.0
85
16.6
27
12.7
20
*
20.2
09
*
15.2
03
*
CP
CL 0
1-0
271
21.2
60
*
16.9
71
*
10.5
40
15.4
00
11.7
91
*
15.2
58
15.2
03
*
CP
03-2
188
16.6
07
*
14.6
04
11.4
15
20.1
13
*
6.8
57
18.7
10
*
14.7
18
*
CP
CL 0
0-4
027
16.5
75
*
15.0
57
9.7
54
19.0
92
11.5
11
*
15.9
79
14.6
73
*
CP
CL 0
0-6
756
16.3
07
*
13.8
79
10.3
82
17.4
02
12.6
80
*
17.0
87
14.6
16
*
CP
CL 0
0-0
129
16.2
73
*
--
---
8.6
57
20.1
40
*
11.0
57
*
14.2
98
14.2
37
*
CP
CL 0
0-1
373
15.1
93
*
14.9
12
10.2
75
18.2
77
11.5
49
*
14.5
34
14.1
23
CP
CL 0
1-0
571
14.9
46
*
13.1
20
10.1
22
17.1
37
11.9
67
*
13.4
05
13.4
49
C
PC
L 0
0-0
458
14.1
51
12.7
69
9.2
06
15.8
63
10.8
74
*
13.9
90
12.8
09
CP
89-2
143
11.1
72
14.2
87
--
---
16.7
75
8.5
81
15.2
30
12.4
14
C
P 7
2-2
086
14.0
71
13
.963
8.5
42
14.4
38
8.9
41
12.5
81
12.0
89
CP
CL 0
0-4
611
15.1
32
*
14.4
93
7.4
64
15.7
96
6.6
40
12.5
99
12.0
29
C
P 0
3-1
491
9.1
71
10.3
55
7.1
10
13.5
80
7.5
18
10.3
56
9.6
65
Mean
15.1
85
*
14.4
95
9.8
83
17.6
00
10.3
00
15.6
49
13.8
57
LS
D (
p =
0.1
)†
2.9
84
1.9
63
1.7
53
2.8
78
2.2
70
2.0
93
1.7
32
CV
(%
)
18.7
56
11.4
82
15.5
58
14.2
37
21.6
88
18.2
18
12.0
19
* Sig
nific
antly g
reate
r th
an C
P 8
9-2
143 a
t p =
0.1
0 b
ase
d o
n t
test.
† L
SD
for
location m
eans o
f sugar
yie
ld =
1.3
38 T
S/H
at
p =
0.1
0.
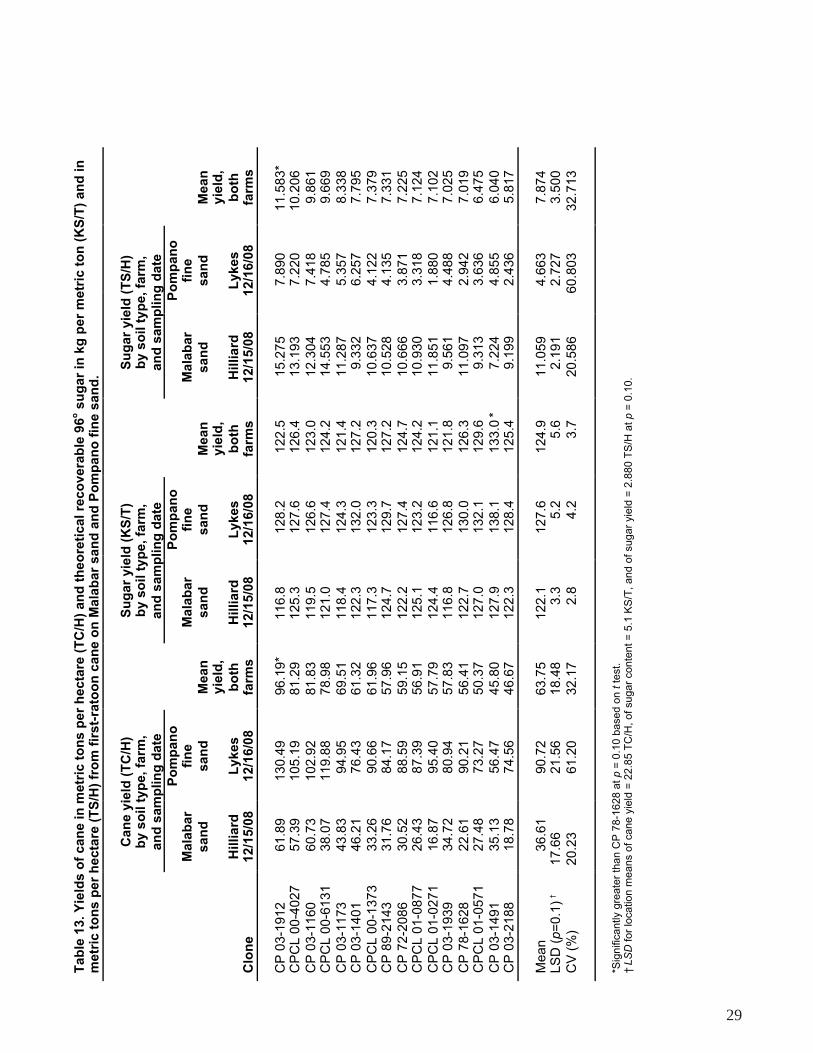
29
Tab
le 1
3. Y
ield
s o
f can
e in
metr
ic t
on
s p
er
hecta
re (
TC
/H)
an
d t
heo
reti
cal re
co
vera
ble
96
o s
ug
ar
in k
g p
er
metr
ic t
on
(K
S/T
) an
d i
n
metr
ic t
on
s p
er
hecta
re (
TS
/H)
fro
m f
irst-
rato
on
can
e o
n M
ala
bar
san
d a
nd
Po
mp
an
o f
ine s
an
d.
C
an
e y
ield
(T
C/H
)
Su
gar
yie
ld (
KS
/T)
S
ug
ar
yie
ld (
TS
/H)
by s
oil t
yp
e, fa
rm,
b
y s
oil t
yp
e, fa
rm,
b
y s
oil
typ
e,
farm
,
an
d s
am
plin
g d
ate
an
d s
am
plin
g d
ate
an
d s
am
pli
ng
date
Po
mp
an
o
Po
mp
an
o
Po
mp
an
o
Mala
bar
fin
e
M
ala
bar
fin
e
M
ala
bar
fin
e
san
d
san
d
Mean
san
d
san
d
Mean
s
an
d
san
d
Mean
yie
ld,
yie
ld,
yie
ld,
H
illiard
L
ykes
bo
th
Hilliard
L
ykes
bo
th
Hil
liard
L
ykes
bo
th
Clo
ne
12/1
5/0
8
12/1
6/0
8
farm
s
12/1
5/0
8
12/1
6/0
8
farm
s
12/1
5/0
8
12/1
6/0
8
farm
s
CP
03-1
912
61.8
9
130.4
9
96.1
9*
116.8
128.2
122.5
15.2
75
7.8
90
11.5
83*
CP
CL 0
0-4
027
57.3
9
105.1
9
81.2
9
125.3
127.6
126.4
1
3.1
93
7.2
20
10.2
06
CP
03-1
160
60.7
3
102.9
2
81.8
3
119.5
126.6
123.0
1
2.3
04
7.4
18
9.8
61
CP
CL 0
0-6
131
38.0
7
119.8
8
78.9
8
121.0
127.4
124.2
1
4.5
53
4.7
85
9.6
69
CP
03-1
173
43.8
3
94.9
5
69.5
1
118.4
124.3
121.4
1
1.2
87
5.3
57
8.3
38
CP
03-1
401
46.2
1
76.4
3
61.3
2
122.3
132.0
127.2
9.3
32
6.2
57
7.7
95
CP
CL 0
0-1
373
33.2
6
90.6
6
61.9
6
117.3
123.3
120.3
1
0.6
37
4.1
22
7.3
79
CP
89-2
143
31.7
6
84.1
7
57.9
6
124.7
129.7
127.2
10.5
28
4.1
35
7.3
31
CP
72-2
086
30.5
2
88.5
9
59.1
5
122.2
127.4
124.7
10.6
66
3.8
71
7.2
25
CP
CL 0
1-0
877
26.4
3
87.3
9
56.9
1
125.1
123.2
124.2
10.9
30
3.3
18
7.1
24
CP
CL 0
1-0
271
16.8
7
95.4
0
57.7
9
124.4
116.6
121.1
1
1.8
51
1.8
80
7.1
02
CP
03-1
939
34.7
2
80.9
4
57.8
3
116.8
126.8
121.8
9.5
61
4.4
88
7.0
25
CP
78-1
628
22.6
1
90.2
1
56.4
1
122.7
130.0
126.3
1
1.0
97
2.9
42
7.0
19
CP
CL 0
1-0
571
27.4
8
73.2
7
50.3
7
127.0
132.1
129.6
9.3
13
3.6
36
6.4
75
CP
03-1
491
35.1
3
56.4
7
45.8
0
127.9
138.1
133.0
*
7.2
24
4.8
55
6.0
40
CP
03-2
188
18.7
8
74.5
6
46.6
7
122.3
128.4
125.4
9.1
99
2.4
36
5.8
17
Mean
36.6
1
90.7
2
63.7
5
122.1
127.6
124.9
1
1.0
59
4.6
63
7.8
74
LS
D (
p=
0.1
) †
17.6
6
21.5
6
18.4
8
3.3
5.2
5.6
2.1
91
2.7
27
3.5
00
CV
(%
) 20.2
3
61.2
0
32.1
7
2.8
4.2
3.7
2
0.5
86
60.8
03
32.7
13
*Sig
nific
antly g
reate
r th
an C
P 7
8-1
628 a
t p =
0.1
0 b
ased
on t test.
† L
SD
for
location m
eans o
f cane y
ield
= 2
2.8
5 T
C/H
, of sugar
conte
nt =
5.1
KS
/T, and o
f sugar
yie
ld =
2.8
80 T
S/H
at p =
0.1
0.

30
Tab
le 1
4. Y
ield
s o
f can
e in
metr
ic t
on
s p
er
hecta
re (
TC
/H)
an
d t
heo
reti
cal re
co
vera
ble
96
o s
ug
ar
in k
g p
er
metr
ic t
on
(K
S/T
) an
d i
n
metr
ic t
on
s p
er
hecta
re (
TS
/H)
fro
m f
irst-
rato
on
on
Dan
ia M
uck a
nd
To
rry M
uck.
C
an
e y
ield
(T
C/H
)
Su
gar
yie
ld (
KS
/T)
S
ug
ar
yie
ld (
TS
/H)
by s
oil t
yp
e, fa
rm,
b
y s
oil t
yp
e, fa
rm,
b
y s
oil
typ
e,
farm
,
an
d s
am
plin
g d
ate
an
d s
am
plin
g d
ate
an
d s
am
pli
ng
date
T
orr
y
Dan
ia
T
orr
y
Dan
ia
T
orr
y
Dan
ia
M
uck
M
uck
M
ean
M
uck
M
uck
M
ean
M
uck
M
uck
M
ean
yie
ld,
yie
ld,
yie
ld,
E
astg
ate
O
keela
nta
b
oth
E
astg
ate
O
keela
nta
b
oth
E
astg
ate
O
keela
nta
b
oth
C
lon
e
1/2
3/2
009
12/1
8/2
008
fa
rms
1/2
3/2
009
12/1
8/2
008
fa
rms
1/2
3/2
009
12/1
8/2
008
fa
rms
CP
02-1
143
196.7
5 *
113.5
0 *
155.1
3
* 127.2
117.9
122.6
25.0
37
*
13.3
77
*
19.2
07
*
CP
02-1
564
180.0
3
122.2
9 *
151.1
6
* 125.4
117.6
121.5
22.5
68
14.5
82
*
18.5
75
*
CP
CL 9
9-2
574
187.2
2 *
98.4
6 *
142.8
4
* 128.5
118.8
123.7
24.0
40
*
11.7
98
*
17.9
19
*
CP
CL 9
9-1
401
157.2
4
118.4
9 *
137.8
6
* 134.3
118.3
126.3
21.0
08
14.1
78
*
17.5
93
*
CP
02-2
015
179.5
8
96.3
6 *
137.9
7
* 124.3
117.0
120.6
22.2
91
11.3
16
*
16.8
04
C
P 0
2-2
281
174.5
5
98.5
1 *
136.5
3
* 121.9
118.9
120.4
21.2
85
11.7
75
*
16.5
30
CP
CL 9
9-1
225
163.8
1
96.9
4 *
130.3
8
130.9
118.2
124.6
21.4
33
11.4
97
*
16.4
65
C
P 7
8-1
628
154.6
6
105.0
6 *
129.8
6
124.4
122.9
123.7
19.2
49
12.9
53
*
16.1
01
CP
02-1
554
170.6
6
92.1
1 *
131.3
8
* 121.6
116.0
118.8
20.7
47
10.7
35
*
15.7
41
C
P 7
2-2
086
143.6
3
89.6
6 *
116.6
5
132.7
118.3
125.5
19.0
89
10.6
42
*
14.8
65
CP
CL 9
9-2
206
154.9
8
93.3
5 *
124.1
6
121.3
116.6
118.9
18.7
97
10.8
87
*
14.8
42
C
PC
L 9
9-2
103
145.9
3
80.5
2
113.2
2
129.7
125.3
127.5
18.9
08
10.1
08
14.5
08
CP
89-2
143
161.5
5
57.5
8
109.5
6
131.7
121.9
126.8
21.3
26
7.1
41
14.2
33
C
PC
L 9
9-4
455
132.3
2
72.3
1
102.3
1
139.4
*
124.4
131.9
18.4
43
9.0
52
13.7
48
CP
CL 9
9-1
777
147.4
3
65.8
6
106.6
4
127.5
118.5
123.0
18.7
65
7.8
27
13.2
96
C
P 0
2-1
458
116.9
9
69.9
6
93.4
8
121.5
113.2
117.3
14.2
33
7.9
74
11.1
04
Mean
160.4
6
91.9
3 †
126.2
0
127.6
119.0
123.3
20.4
51
10.9
90
†
15.7
21
LS
D (
p =
0.1
)†
19.2
7
27.0
8
21.6
9
3.7
3.8
5.3
2.4
71
3.3
29
2.9
32
*Sig
nific
antly g
reate
r th
an C
P 8
9 2
143
at p =
0.1
0 b
ased
on t test.
† L
SD
for
location m
eans o
f cane y
ield
= 1
9.8
3 T
C/H
of sugar
yie
ld =
2.5
KS
/T, and o
f sugar
yie
ld =
2.5
69 T
S/H
at p =
0.1
0.

31
Tab
le 1
5. Y
ield
s o
f can
e in
metr
ic t
on
s p
er
hecta
re (
TC
/H)
fro
m s
eco
nd
-rato
on
can
e o
n D
an
ia m
uck,
Lau
derh
ill
mu
ck,
Pah
okee
mu
ck, M
ala
bar
san
d, an
d P
om
pan
o f
ine s
an
d
M
ean
yie
ld b
y s
oil t
yp
e, fa
rm, an
d s
am
plin
g d
ate
P
ah
okee
P
om
pan
o
Lau
derh
ill m
uck
m
uck
fi
ne s
an
d
M
ean
O
keela
nta
K
nig
ht
Wed
gw
ort
h
SF
I
Osceo
la
L
ykes
y
ield
, C
lon
e
10/1
7/2
008
10/2
1/2
008
10/2
7/2
008
10/1
6/2
008
10/2
0/2
008
12/1
0/2
008
all
farm
s
CP
02-1
564
107.6
2 *
91.6
4
147.9
9
173.6
6 *
125.0
6 *
66.5
8
119.3
7 *
C
P 0
2-2
281
104.5
7 *
110.5
5
116.7
3
131.0
3
96.1
0 *
65.3
2
103.7
4 *
CP
02-1
554
90.1
5
104.9
3
111.5
6
125.2
7
108.4
2 *
81.3
1 *
103.4
3
CP
78-1
628
87.2
7
-
----
-
----
-
----
106.0
3 *
74.5
7
102.3
2
CP
CL 9
9-2
206
96.3
4
62.6
4
137.7
3
136.8
7
101.1
2 *
61.1
8
100.1
9
CP
02-2
015
100.8
2 *
105.2
2
102.0
7
145.2
9
90.8
4 *
48.1
7
98.4
2
CP
02-1
143
88.9
4
80.5
7
97.1
0
145.6
1
94.3
7 *
67.7
5
96.0
0
CP
CL 9
9-1
225
83.2
7
99.8
3
110.3
0
126.6
4
90.0
1
49.9
6
93.0
0
CP
89-2
143
85.4
9
-
----
-
----
140.2
8
73.0
5
62.9
7
91.6
4
CP
CL 9
9-1
401
93.2
8
61.8
8
105.1
1
104.6
1
95.9
6 *
76.5
8
90.5
3
CP
CL 9
9-2
103
76.6
7
91.3
0
88.3
0
117.0
8
98.1
2 *
53.1
2
87.1
9
CP
CL 9
9-1
777
91.0
5
80.4
5
90.2
6
112.0
7
67.7
9
63.0
5
84.0
8
CP
CL 9
9-2
574
77.8
2
87.4
9
66.9
5
125.2
5
83.0
2
41.0
4
79.6
1
CP
CL 9
9-4
455
75.9
0
99.8
8
92.4
6
108.1
9
74.7
8
25.9
0
78.8
6
CP
72-2
086
67.1
8
58.9
2
60.8
9
99.4
3
73.6
5
29.8
5
65.0
1
CP
02-1
458
62.3
7
52.2
3
77.8
6
87.9
9
57.7
5
39.2
5
62.9
4
Mean
86.8
0
84.8
2
100.3
8
125.2
8
89.7
5
56.6
6
91.0
2
LS
D (
p =
0.1
)†
14.2
9
32.6
4
16.0
4
19.8
3
17.4
0
15.9
6
11.8
4
CV
(%
)
14.6
1
22.7
0
24.2
2
17.2
9
19.2
4
29.0
5
16.1
0
*
Sig
nific
antly g
reate
r th
an C
P 8
9-2
143 a
t p =
0.1
0 b
ase
d o
n t
test.
† L
SD
for
location m
eans o
f cane y
ield
= 8
.94 T
C/H
at p =
0.1
0.

32
Tab
le 1
6. Y
ield
s o
f th
eo
reti
cal re
co
vera
ble
96
o s
ug
ar
in k
g p
er
metr
ic t
on
of
can
e (
KS
/T)
fro
m s
eco
nd
-rato
on
can
e o
n D
an
ia
mu
ck, L
au
derh
ill m
uck, P
ah
okee m
uck, M
ala
bar
san
d, an
d P
om
pan
o f
ine s
an
d
M
ean
yie
ld b
y s
oil t
yp
e, fa
rm, an
d s
am
plin
g d
ate
P
ah
okee
P
om
pan
o
Lau
derh
ill m
uck
m
uck
fi
ne s
an
d
M
ean
O
keela
nta
K
nig
ht
Wed
gw
ort
h
SF
I
Osceo
la
L
ykes
y
ield
, C
lon
e
10/1
7/2
008
10/2
1/2
008
10/2
7/2
008
10/1
6/2
008
10/2
0/2
008
12/1
0/2
008
all
farm
s
CP
CL 9
9-4
455
129.7
*
105.9
105.1
120.4
*
134.4
0 *
128.0
120.6
*
CP
CL 9
9-2
574
124.0
*
97.4
98.6
109.8
128.1
6 *
133.0
*
115.3
CP
89-2
143
114.9
--
---
--
---
113.4
119.9
0
126.2
111.6
C
P 0
2-1
564
119.7
91.9
99.2
105.4
119.4
9
130.2
111.1
CP
CL 9
9-2
103
112.7
97.8
95.1
107.1
120.4
4
129.0
110.3
C
P 0
2-2
281
113.1
98.4
93.1
110.6
120.3
3
124.9
110.0
CP
78-1
628
112.9
--
---
--
---
-
----
125.1
2
124.2
110.0
C
P 0
2-1
143
108.9
90.2
101.3
102.5
121.7
8
126.2
108.6
CP
72-2
086
116.9
93.5
98.4
103.6
116.8
4
121.2
108.4
C
P 0
2-1
458
113.8
97.7
89.9
104.4
120.3
6
124.8
108.4
CP
02-2
015
107.1
96.6
90.5
109.2
122.6
5
120.6
107.7
C
P 0
2-1
554
109.1
90.8
90.5
103.6
123.1
5
128.4
107.7
CP
CL 9
9-1
777
111.0
91.8
90.9
98.0
109.5
5
123.9
104.1
C
PC
L 9
9-1
225
112.2
94.1
87.7
91.6
111.6
0
121.8
103.0
CP
CL 9
9-1
401
101.8
86.5
86.2
93.7
109.9
3
133.3
102.1
C
PC
L 9
9-2
206
104.5
91.3
92.3
91.2
106.1
2
122.9
101.3
Mean
113.3
94.6
94.2
104.3
119.3
6
126.2
108.8
LS
D (
p =
0.1
)†
6.5
8.2
6.5
7.0
6.1
4
3.8
4.1
C
V (
%)
6.2
5.1
5.9
7.8
6.1
1
3.1
4.5
*
Sig
nific
antly g
reate
r th
an C
P 8
9-2
143 a
t p =
0.1
0 b
ase
d o
n t
test.
† L
SD
for
location m
eans o
f cane y
ield
=1.8
TC
/H a
t p =
0.1
0.
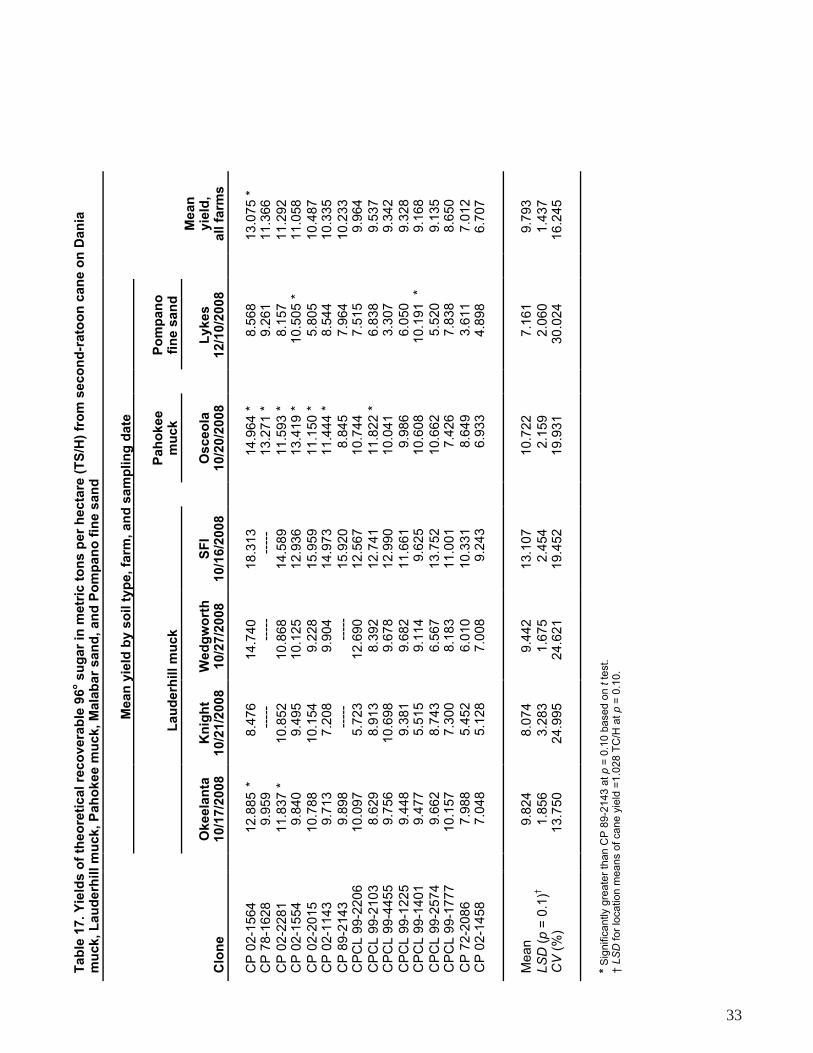
33
Tab
le 1
7. Y
ield
s o
f th
eo
reti
cal re
co
vera
ble
96
o s
ug
ar
in m
etr
ic t
on
s p
er
hecta
re (
TS
/H)
fro
m s
eco
nd
-rato
on
can
e o
n D
an
ia
mu
ck, L
au
derh
ill m
uck, P
ah
okee m
uck, M
ala
bar
san
d, an
d P
om
pan
o f
ine s
an
d
M
ean
yie
ld b
y s
oil t
yp
e, fa
rm, an
d s
am
plin
g d
ate
P
ah
okee
P
om
pan
o
Lau
derh
ill m
uck
m
uck
fi
ne s
an
d
M
ean
O
keela
nta
K
nig
ht
Wed
gw
ort
h
SF
I
Osceo
la
L
ykes
y
ield
, C
lon
e
10/1
7/2
008
10/2
1/2
008
10/2
7/2
008
10/1
6/2
008
10/2
0/2
008
12/1
0/2
008
all
farm
s
CP
02-1
564
12.8
85
*
8.4
76
14.7
40
18.3
13
14.9
64
*
8.5
68
13.0
75
*
CP
78-1
628
9.9
59
--
---
-
----
--
---
13.2
71
*
9.2
61
11.3
66
CP
02-2
281
11.8
37
*
10.8
52
10.8
68
14.5
89
11.5
93
*
8.1
57
11.2
92
C
P 0
2-1
554
9.8
40
9.4
95
10.1
25
12.9
36
13.4
19
*
10.5
05
*
11.0
58
CP
02-2
015
10.7
88
10.1
54
9.2
28
15.9
59
11.1
50
*
5.8
05
10.4
87
C
P 0
2-1
143
9.7
13
7.2
08
9.9
04
14.9
73
11.4
44
*
8.5
44
10.3
35
CP
89-2
143
9.8
98
--
---
-
----
15.9
20
8.8
45
7.9
64
10.2
33
C
PC
L 9
9-2
206
10.0
97
5.7
23
12.6
90
12.5
67
10.7
44
7.5
15
9.9
64
CP
CL 9
9-2
103
8.6
29
8.9
13
8.3
92
12.7
41
11.8
22
*
6.8
38
9.5
37
CP
CL 9
9-4
455
9.7
56
10.6
98
9.6
78
12.9
90
10.0
41
3.3
07
9.3
42
CP
CL 9
9-1
225
9.4
48
9.3
81
9.6
82
11.6
61
9.9
86
6.0
50
9.3
28
CP
CL 9
9-1
401
9.4
77
5.5
15
9.1
14
9.6
25
10.6
08
10.1
91
*
9.1
68
CP
CL 9
9-2
574
9.6
62
8.7
43
6.5
67
13.7
52
10.6
62
5.5
20
9.1
35
CP
CL 9
9-1
777
10.1
57
7.3
00
8.1
83
11.0
01
7.4
26
7.8
38
8.6
50
CP
72-2
086
7.9
88
5.4
52
6.0
10
10.3
31
8.6
49
3.6
11
7.0
12
CP
02-1
458
7.0
48
5.1
28
7.0
08
9.2
43
6.9
33
4.8
98
6.7
07
Mean
9.8
24
8.0
74
9.4
42
13.1
07
10.7
22
7.1
61
9.7
93
LS
D (
p =
0.1
)†
1.8
56
3.2
83
1.6
75
2.4
54
2.1
59
2.0
60
1.4
37
CV
(%
)
13.7
50
24.9
95
24.6
21
19.4
52
19.9
31
30.0
24
16.2
45
*
Sig
nific
antly g
reate
r th
an C
P 8
9-2
143 a
t p =
0.1
0 b
ase
d o
n t
test.
† L
SD
for
location m
eans o
f cane y
ield
=1.0
28 T
C/H
at p =
0.1
0.
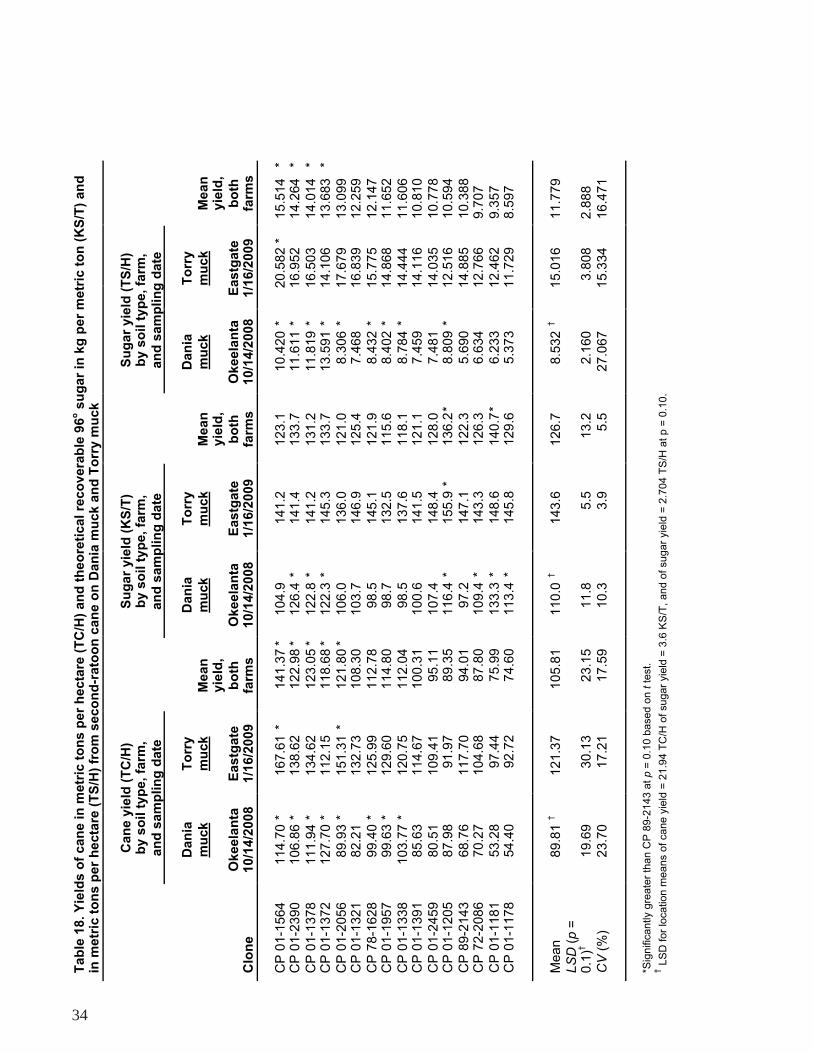
34
Tab
le 1
8. Y
ield
s o
f can
e in
metr
ic t
on
s p
er
hecta
re (
TC
/H)
an
d t
heo
reti
cal re
co
vera
ble
96
o s
ug
ar
in k
g p
er
metr
ic t
on
(K
S/T
) an
d
in m
etr
ic t
on
s p
er
hecta
re (
TS
/H)
fro
m s
eco
nd
-rato
on
can
e o
n D
an
ia m
uck a
nd
To
rry m
uck
C
an
e y
ield
(T
C/H
)
Su
gar
yie
ld (
KS
/T)
S
ug
ar
yie
ld (
TS
/H)
by s
oil t
yp
e, fa
rm,
b
y s
oil t
yp
e, fa
rm,
b
y s
oil
typ
e,
farm
,
an
d s
am
plin
g d
ate
an
d s
am
plin
g d
ate
an
d s
am
pli
ng
date
Dan
ia
To
rry
Dan
ia
To
rry
Dan
ia
To
rry
m
uck
m
uck
Mean
m
uck
m
uck
M
ean
m
uck
mu
ck
Mean
yie
ld,
yie
ld,
yie
ld,
O
keela
nta
E
astg
ate
b
oth
O
keela
nta
E
astg
ate
b
oth
O
keela
nta
E
astg
ate
b
oth
C
lon
e
10/1
4/2
008
1/1
6/2
009
fa
rms
10/1
4/2
008
1/1
6/2
009
fa
rms
10
/14/2
008
1/1
6/2
009
fa
rms
CP
01-1
564
114.7
0 *
167.6
1 *
141.3
7 *
104.9
141.2
123.1
10.4
20
*
20.5
82
*
15.5
14
*
CP
01-2
390
106.8
6 *
138.6
2
122.9
8 *
126.4
*
141.4
133.7
11.6
11
*
16.9
52
14.2
64
*
CP
01-1
378
111.9
4 *
134.6
2
123.0
5 *
122.8
*
141.2
131.2
11.8
19
*
16.5
03
14.0
14
*
CP
01-1
372
127.7
0 *
112.1
5
118.6
8 *
122.3
*
145.3
133.7
13.5
91
*
14.1
06
13.6
83
*
CP
01-2
056
89.9
3 *
151.3
1 *
121.8
0 *
106.0
136.0
121.0
8.3
06 *
17.6
79
13.0
99
C
P 0
1-1
321
82.2
1
132.7
3
108.3
0
103.7
146.9
125.4
7.4
68
16.8
39
12.2
59
CP
78-1
628
99.4
0 *
125.9
9
112.7
8
98.5
145.1
121.9
8.4
32 *
15.7
75
12.1
47
C
P 0
1-1
957
99.6
3 *
129.6
0
114.8
0
98.7
132.5
115.6
8.4
02 *
14.8
68
11.6
52
CP
01-1
338
103.7
7 *
120.7
5
112.0
4
98.5
137.6
118.1
8.7
84 *
14.4
44
11.6
06
C
P 0
1-1
391
85.6
3
114.6
7
100.3
1
100.6
141.5
121.1
7.4
59
14.1
16
10.8
10
CP
01-2
459
80.5
1
109.4
1
95.1
1
107.4
148.4
128.0
7.4
81
14.0
35
10.7
78
C
P 0
1-1
205
87.9
8
91.9
7
89.3
5
116.4
*
155.9
*
136.2
*
8.8
09 *
12.5
16
10.5
94
CP
89-2
143
68.7
6
117.7
0
94.0
1
97.2
147.1
122.3
5.6
90
14.8
85
10.3
88
C
P 7
2-2
086
70.2
7
104.6
8
87.8
0
109.4
*
143.3
126.3
6.6
34
12.7
66
9.7
07
CP
01-1
181
53.2
8
97.4
4
75.9
9
133.3
*
148.6
140.7
*
6.2
33
12.4
62
9.3
57
CP
01-1
178
54.4
0
92.7
2
74.6
0
113.4
*
145.8
129.6
5.3
73
11.7
29
8.5
97
Mean
89.8
1 †
121.3
7
105.8
1
110.0
†
143.6
126.7
8.5
32 †
15.0
16
11.7
79
LS
D (
p =
0.1
)†
19.6
9
30.1
3
23.1
5
11.8
5.5
13.2
2.1
60
3.8
08
2.8
88
CV
(%
)
23.7
0
17.2
1
17.5
9
10.3
3.9
5.5
27.0
67
15.3
34
16.4
71
*Sig
nific
antly g
reate
r th
an C
P 8
9-2
143 a
t p =
0.1
0 b
ased
on t
test.
† L
SD
for
location m
eans o
f cane y
ield
= 2
1.9
4 T
C/H
of sugar
yie
ld =
3.6
KS
/T, and o
f sugar
yie
ld =
2.7
04 T
S/H
at p =
0.1
0.

35
Tab
le 1
9. D
ate
s o
f sta
lk c
ou
nts
of
10 p
lan
t can
e, 9 f
irst
rato
on
, an
d 1
0 s
eco
nd
rato
on
exp
eri
men
ts.
C
rop
Lo
cati
on
P
lan
t can
e
Fir
st
rato
on
S
eco
nd
ra
too
n
Duda
07/1
1/0
8
07/2
4/0
8
08/2
8/0
8
Eastg
ate
04/1
6/0
8
08/1
3/0
8
09/1
6/0
8
Hill
iard
07/2
5/0
8
08/1
4/0
8
09/1
2/0
8
Knig
ht
0
7/1
0/0
8
08/0
4/0
8
09/1
1/0
8
Lykes
0
7/2
3/0
8
08/0
5/0
8
08/2
7/0
8
Okeela
nta
07/2
1/0
8
08/0
1/0
8
08/2
2/0
8
Okeela
nta
(successiv
e)
07/2
8/0
8
08/1
1/0
8
08/2
9/0
8
Osceola
---
---
09/0
8/0
8
SF
I
07/0
9/0
8
07/3
1/0
8
09/0
2/0
8
Tow
nsite
0
7/1
4/0
8
---
---
Wedgw
ort
h
0
7/0
8/0
8
07/2
9/0
8
08/2
6/0
8
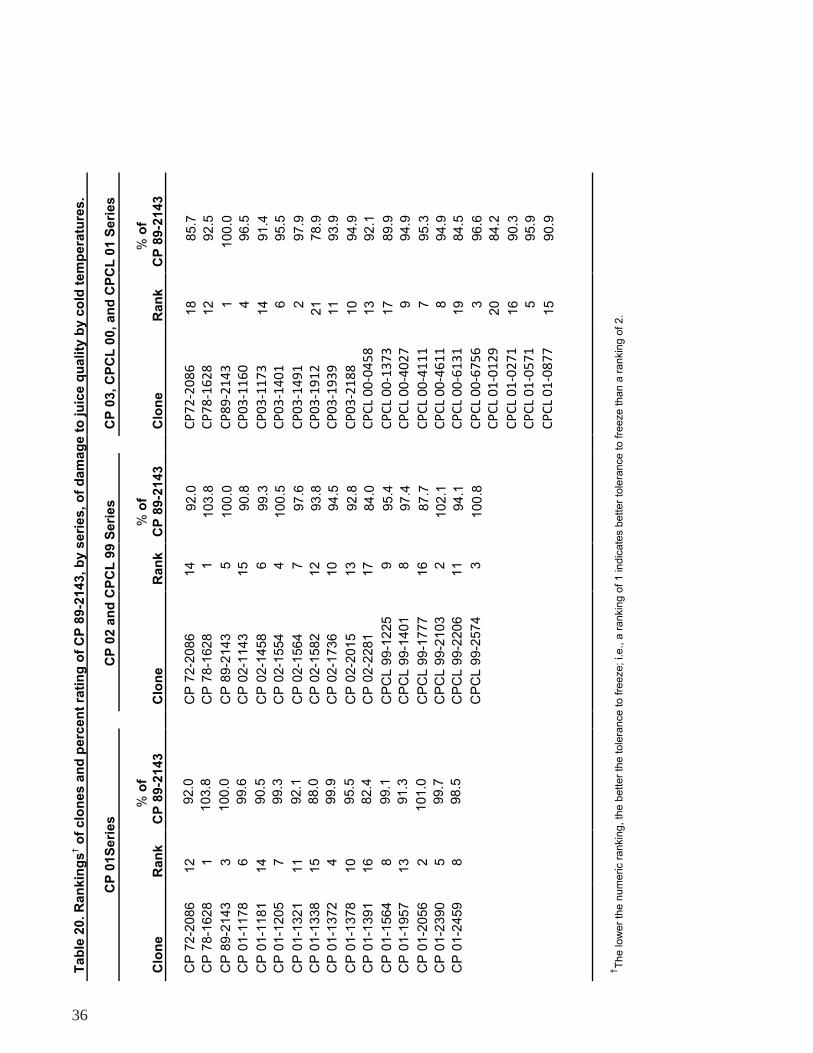
36
Tab
le 2
0. R
an
kin
gs
† o
f clo
nes a
nd
perc
en
t ra
tin
g o
f C
P 8
9-2
143, b
y s
eri
es, o
f d
am
ag
e t
o ju
ice q
uali
ty b
y c
old
tem
pera
ture
s.
C
P 0
1S
eri
es
CP
02 a
nd
CP
CL
99 S
eri
es
C
P 0
3, C
PC
L 0
0,
an
d C
PC
L 0
1 S
eri
es
Clo
ne
Ran
k
% o
f
CP
89-2
143
C
lon
e
Ran
k
% o
f
CP
89-2
143
C
lon
e
Ran
k
% o
f
CP
89-2
143
CP
72-2
086
1
2
92.0
CP
72-2
086
14
92.0
CP72‐2086
18
85.7
CP
78-1
628
1
103.8
CP
78-1
628
1
103.8
CP78‐1628
12
92.5
CP
89-2
143
3
100.0
CP
89-2
143
5
100.0
CP89‐2143
1
100.0
CP
01-1
178
6
99.6
CP
02-1
143
15
90.8
CP03‐1160
4
96.5
CP
01-1
181
1
4
90.5
CP
02-1
458
6
99.3
CP03‐1173
14
91.4
CP
01-1
205
7
99.3
CP
02-1
554
4
100.5
CP03‐1401
6
95.5
CP
01-1
321
1
1
92.1
CP
02-1
564
7
97.6
CP03‐1491
2
97.9
CP
01-1
338
1
5
88.0
CP
02-1
582
12
93.8
CP03‐1912
21
78.9
CP
01-1
372
4
99.9
CP
02-1
736
10
94.5
CP03‐1939
11
93.9
CP
01-1
378
1
0
95.5
CP
02-2
015
13
92.8
CP03‐2188
10
94.9
CP
01-1
391
1
6
82.4
CP
02-2
281
17
84.0
CPCL00‐0458
13
92.1
CP
01-1
564
8
99.1
CP
CL 9
9-1
225
9
95.4
CPCL00‐1373
17
89.9
CP
01-1
957
1
3
91.3
CP
CL 9
9-1
401
8
97.4
CPCL00‐4027
9
94.9
CP
01-2
056
2
101.0
CP
CL 9
9-1
777
16
87.7
CPCL00‐4111
7
95.3
CP
01-2
390
5
99.7
CP
CL 9
9-2
103
2
102.1
CPCL00‐4611
8
94.9
CP
01-2
459
8
98.5
CP
CL 9
9-2
206
11
94.1
CPCL00‐6131
19
84.5
CP
CL 9
9-2
574
3
100.8
CPCL00‐6756
3
96.6
CPCL01‐0129
20
84.2
CPCL01‐0271
16
90.3
CPCL01‐0571
5
95.9
CPCL01‐0877
15
90.9
†T
he low
er
the n
um
eric r
ankin
g, th
e b
etter
the tole
rance
to fre
eze; i.e., a
rankin
g o
f 1 indic
ate
s b
etter
tole
rance to fre
eze than a
rankin
g o
f 2.
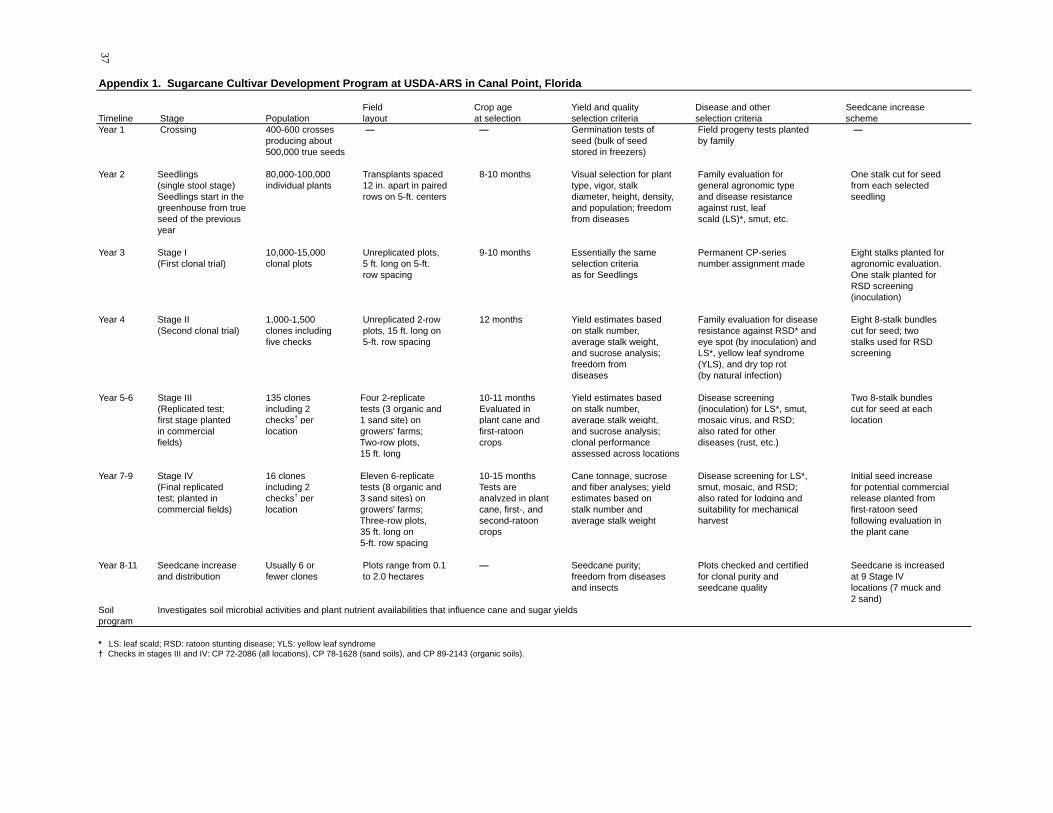
37
Appendix 1. Sugarcane Cultivar Development Program at USDA-ARS in Canal Point, Florida
Field Crop age Yield and quality Disease and other Seedcane increase Timeline Stage Population layout at selection selection criteria selection criteria schemeYear 1 Crossing 400-600 crosses — — Germination tests of Field progeny tests planted —
producing about seed (bulk of seed by family 500,000 true seeds stored in freezers)
Year 2 Seedlings 80,000-100,000 Transplants spaced 8-10 months Visual selection for plant Family evaluation for One stalk cut for seed (single stool stage) individual plants 12 in. apart in paired type, vigor, stalk general agronomic type from each selected Seedlings start in the rows on 5-ft. centers diameter, height, density, and disease resistance seedling greenhouse from true and population; freedom against rust, leaf seed of the previous from diseases scald (LS)*, smut, etc. year
Year 3 Stage I 10,000-15,000 Unreplicated plots, 9-10 months Essentially the same Permanent CP-series Eight stalks planted for (First clonal trial) clonal plots 5 ft. long on 5-ft. selection criteria number assignment made agronomic evaluation.
row spacing as for Seedlings One stalk planted for RSD screening (inoculation)
Year 4 Stage II 1,000-1,500 Unreplicated 2-row 12 months Yield estimates based Family evaluation for disease Eight 8-stalk bundles (Second clonal trial) clones including plots, 15 ft. long on on stalk number, resistance against RSD* and cut for seed; two
five checks 5-ft. row spacing average stalk weight, eye spot (by inoculation) and stalks used for RSD and sucrose analysis; LS*, yellow leaf syndrome screening freedom from (YLS), and dry top rot diseases (by natural infection)
Year 5-6 Stage III 135 clones Four 2-replicate 10-11 months Yield estimates based Disease screening Two 8-stalk bundles (Replicated test; including 2 tests (3 organic and Evaluated in on stalk number, (inoculation) for LS*, smut, cut for seed at each first stage planted checks† per 1 sand site) on plant cane and average stalk weight, mosaic virus, and RSD; location in commercial location growers' farms; first-ratoon and sucrose analysis; also rated for other fields) Two-row plots, crops clonal performance diseases (rust, etc.)
15 ft. long assessed across locations
Year 7-9 Stage IV 16 clones Eleven 6-replicate 10-15 months Cane tonnage, sucrose Disease screening for LS*, Initial seed increase (Final replicated including 2 tests (8 organic and Tests are and fiber analyses; yield smut, mosaic, and RSD; for potential commercial test; planted in checks† per 3 sand sites) on analyzed in plant estimates based on also rated for lodging and release planted from commercial fields) location growers' farms; cane, first-, and stalk number and suitability for mechanical first-ratoon seed
Three-row plots, second-ratoon average stalk weight harvest following evaluation in 35 ft. long on crops the plant cane 5-ft. row spacing
Year 8-11 Seedcane increase Usually 6 or Plots range from 0.1 — Seedcane purity; Plots checked and certified Seedcane is increased and distribution fewer clones to 2.0 hectares freedom from diseases for clonal purity and at 9 Stage lV
and insects seedcane quality locations (7 muck and 2 sand)
Soil Investigates soil microbial activities and plant nutrient availabilities that influence cane and sugar yieldsprogram
* LS: leaf scald; RSD: ratoon stunting disease; YLS: yellow leaf syndrome† Checks in stages III and IV: CP 72-2086 (all locations), CP 78-1628 (sand soils), and CP 89-2143 (organic soils).