united states department of agricultureusda.mannlib.cornell.edu/usda/fas/wine//2000s/2006/... ·...
TRANSCRIPT
UNITED STATES DEPARTMENT OF
AGRICULTURE
World Wine Situation and Outlook
COMMODITY AND MARKETING PROGRAMS – PROCESSED PRODUCTS DIVISION MARKET ACCESS AND ANALYSIS GROUP
AUGUST 2006
2
Table of Contents Executive Summary .......................................................................................................... 3 World Wine Production ................................................................................................... 4 U.S. Wine Production ....................................................................................................... 5 U.S. Wine Consumption ................................................................................................... 8 Recent Issues Affecting the U.S. Wine Industry ............................................................ 8 Trade Policy and the U.S. Wine Industry ....................................................................... 9 U.S. Wine Exports ........................................................................................................... 10 Competitive Environment .............................................................................................. 11 Largest U.S. Wine Export Markets............................................................................... 12
United Kingdom........................................................................................................ 12 Canada....................................................................................................................... 13 Japan.......................................................................................................................... 14 Netherlands ............................................................................................................... 16 Germany.................................................................................................................... 17
Competitor Countries for U.S. Wine ............................................................................. 18 France........................................................................................................................ 18 Italy ........................................................................................................................... 20 Australia .................................................................................................................... 21 Spain.......................................................................................................................... 22 Chile .......................................................................................................................... 24 South Africa .............................................................................................................. 25 Argentina................................................................................................................... 26
Appendix .......................................................................................................................... 28 Additional Information ................................................................................................. 28 Country Export and Import Valuation Explanation...................................................... 28 Trade Data Comparison................................................................................................ 30 Data Updates................................................................................................................. 30 Sources.......................................................................................................................... 31
3
Executive Summary U.S. wine exports fell 17 percent in 2005 to $659 million from a record high of $795.5 million in 2004. In spite of the decline, 2005 wine exports were still greater than the yearly wine exports from 2000 through 2003. Major markets for U.S. wine exports include the United Kingdom, Canada, Japan, Italy, and the Netherlands. Major U.S. wine competitors include France, Italy, Australia, Spain, Chile, Germany, Portugal, South Africa, New Zealand, and Argentina. In 2005, wine imports to the United States reached a record high of $3.79 billion. According to Wine Institute estimates, wine sales in the United States were up 12 percent in value and 5 percent in quantity in 2005. The estimated retail value of wine shipments from all sources to the United States in 2005 is $26 billion. Wine consumption in the United States has been rising slowly and consistently over the last 11 years. A Supreme Court ruling in the spring of 2005 said that states cannot discriminate in favor of their in-state wineries by allowing only those local wineries to make shipments via common carriers to their in-state consumers while prohibiting out-of-state wineries from making shipments to those same consumers. Another important development for the U.S. wine industry was the completion of the first phase of the U.S.-EU agreement on wine. The agreement provides for mutual acceptance of existing wine-making practices and addresses labeling issues. The greatest competition to the market share for U.S. wines comes from the European Union-25 nations and some of the New World (non-European) producers, particularly Australia. The European Union’s 2005 wine production decreased 12 percent from 2004. Production is not expected to increase significantly in the near term due to policy controls. Australian wine production has experienced strong growth in the last decade. A weaker U.S. dollar against the currencies of key trading partners, a general improvement in the global economy, and strong marketing strategies should aid sales of U.S. wines in 2006. The Foreign Agricultural Service of the USDA predicts that for all of FY 2006 (October 2005 through September 2006), the value growth of U.S. wine exports will be unchanged from FY 2005.
4
World Wine Production1
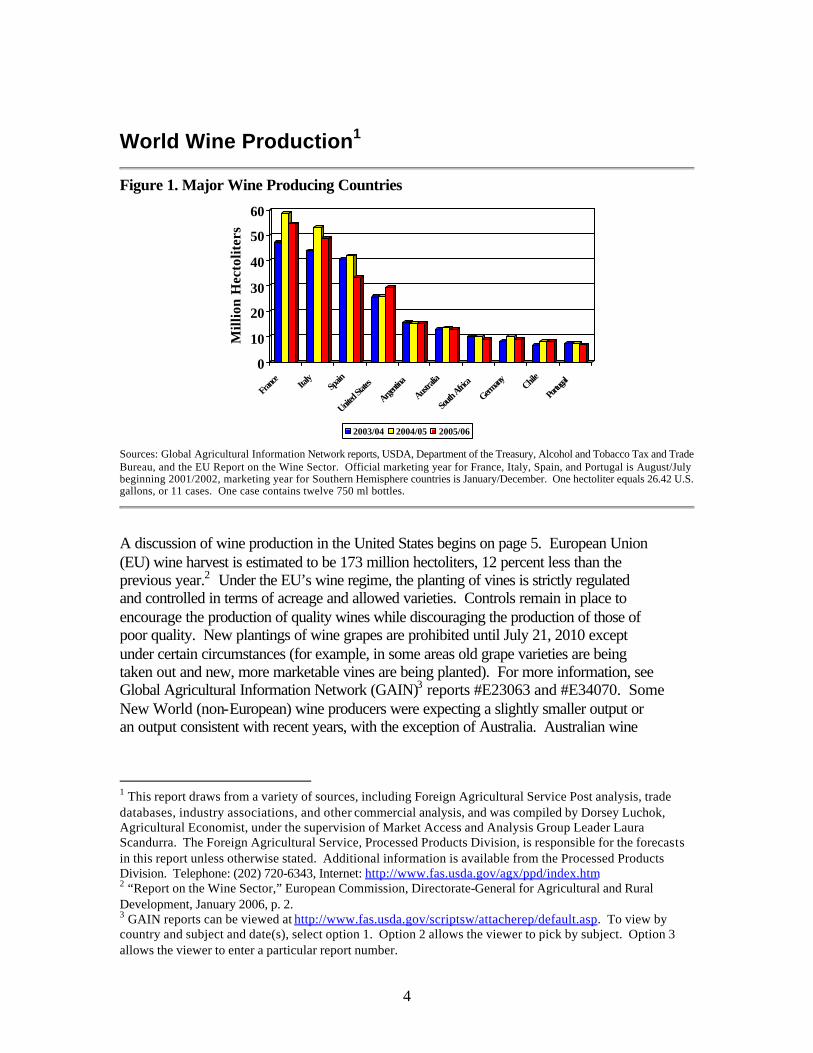
Figure 1. Major Wine Producing Countries
0
10
20
30
40
50
60
Mill
ion
Hec
tolit
ers
France Ita
lySp
ain
United S
tates
Argentin
a
Austral
ia
South
Africa
Germany Chil
e
Portug
al
2003/04 2004/05 2005/06
Sources: Global Agricultural Information Network reports, USDA, Department of the Treasury, Alcohol and Tobacco Tax and Trade Bureau, and the EU Report on the Wine Sector. Official marketing year for France, Italy, Spain, and Portugal is August/July beginning 2001/2002, marketing year for Southern Hemisphere countries is January/December. One hectoliter equals 26.42 U.S. gallons, or 11 cases. One case contains twelve 750 ml bottles.
A discussion of wine production in the United States begins on page 5. European Union (EU) wine harvest is estimated to be 173 million hectoliters, 12 percent less than the previous year.2 Under the EU’s wine regime, the planting of vines is strictly regulated and controlled in terms of acreage and allowed varieties. Controls remain in place to encourage the production of quality wines while discouraging the production of those of poor quality. New plantings of wine grapes are prohibited until July 21, 2010 except under certain circumstances (for example, in some areas old grape varieties are being taken out and new, more marketable vines are being planted). For more information, see Global Agricultural Information Network (GAIN)3 reports #E23063 and #E34070. Some New World (non-European) wine producers were expecting a slightly smaller output or an output consistent with recent years, with the exception of Australia. Australian wine
1 This report draws from a variety of sources, including Foreign Agricultural Service Post analysis, trade databases, industry associations, and other commercial analysis, and was compiled by Dorsey Luchok, Agricultural Economist, under the supervision of Market Access and Analysis Group Leader Laura Scandurra. The Foreign Agricultural Service, Processed Products Division, is responsible for the forecasts in this report unless otherwise stated. Additional information is available from the Processed Products Division. Telephone: (202) 720-6343, Internet: http://www.fas.usda.gov/agx/ppd/index.htm 2 “Report on the Wine Sector,” European Commission, Directorate-General for Agricultural and Rural Development, January 2006, p. 2. 3 GAIN reports can be viewed at http://www.fas.usda.gov/scriptsw/attacherep/default.asp. To view by country and subject and date(s), select option 1. Option 2 allows the viewer to pick by subject. Option 3 allows the viewer to enter a particular report number.
5
production for 2005 is forecasted to reach a record level, driven by increasing wine grape bearing area.
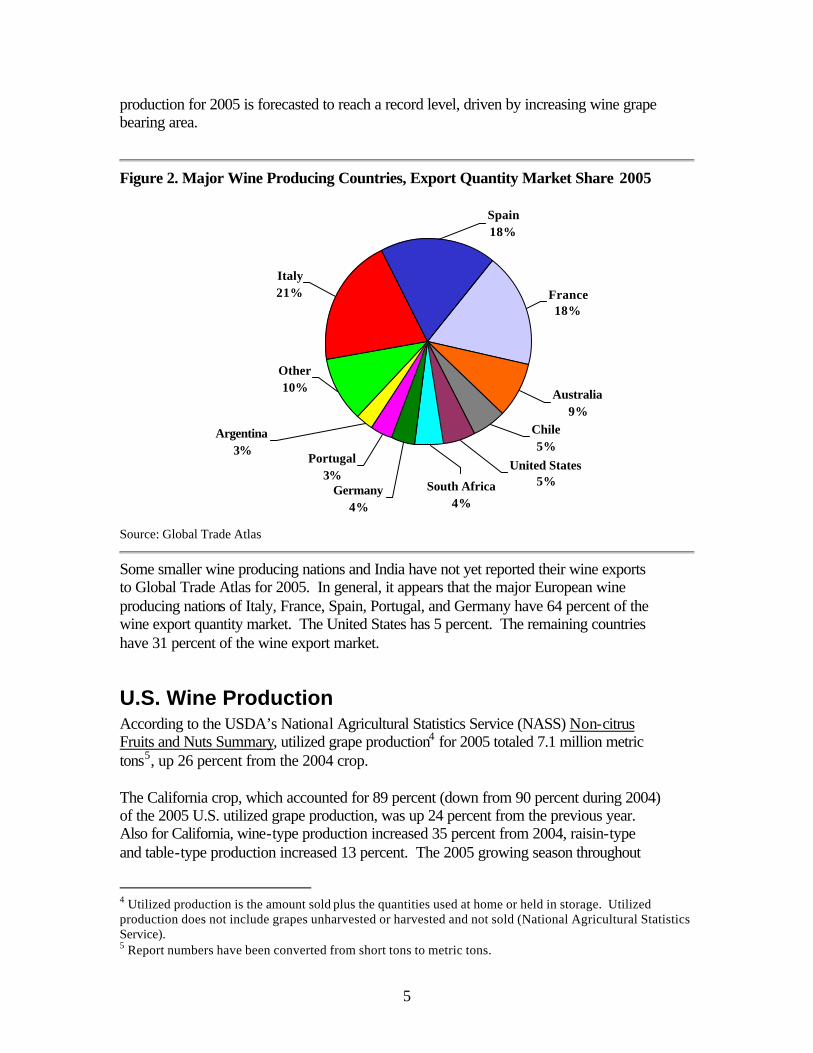
Figure 2. Major Wine Producing Countries, Export Quantity Market Share 2005
Italy21%
Argentina3%
Germany4%
Portugal3%
Other10%
South Africa4%
Spain18%
United States5%
Chile5%
Australia9%
France18%
Source: Global Trade Atlas
Some smaller wine producing nations and India have not yet reported their wine exports to Global Trade Atlas for 2005. In general, it appears that the major European wine producing nations of Italy, France, Spain, Portugal, and Germany have 64 percent of the wine export quantity market. The United States has 5 percent. The remaining countries have 31 percent of the wine export market.
U.S. Wine Production According to the USDA’s National Agricultural Statistics Service (NASS) Non-citrus Fruits and Nuts Summary, utilized grape production4 for 2005 totaled 7.1 million metric tons5, up 26 percent from the 2004 crop. The California crop, which accounted for 89 percent (down from 90 percent during 2004) of the 2005 U.S. utilized grape production, was up 24 percent from the previous year. Also for California, wine-type production increased 35 percent from 2004, raisin-type and table-type production increased 13 percent. The 2005 growing season throughout
4 Utilized production is the amount sold plus the quantities used at home or held in storage. Utilized production does not include grapes unharvested or harvested and not sold (National Agricultural Statistics Service). 5 Report numbers have been converted from short tons to metric tons.
6
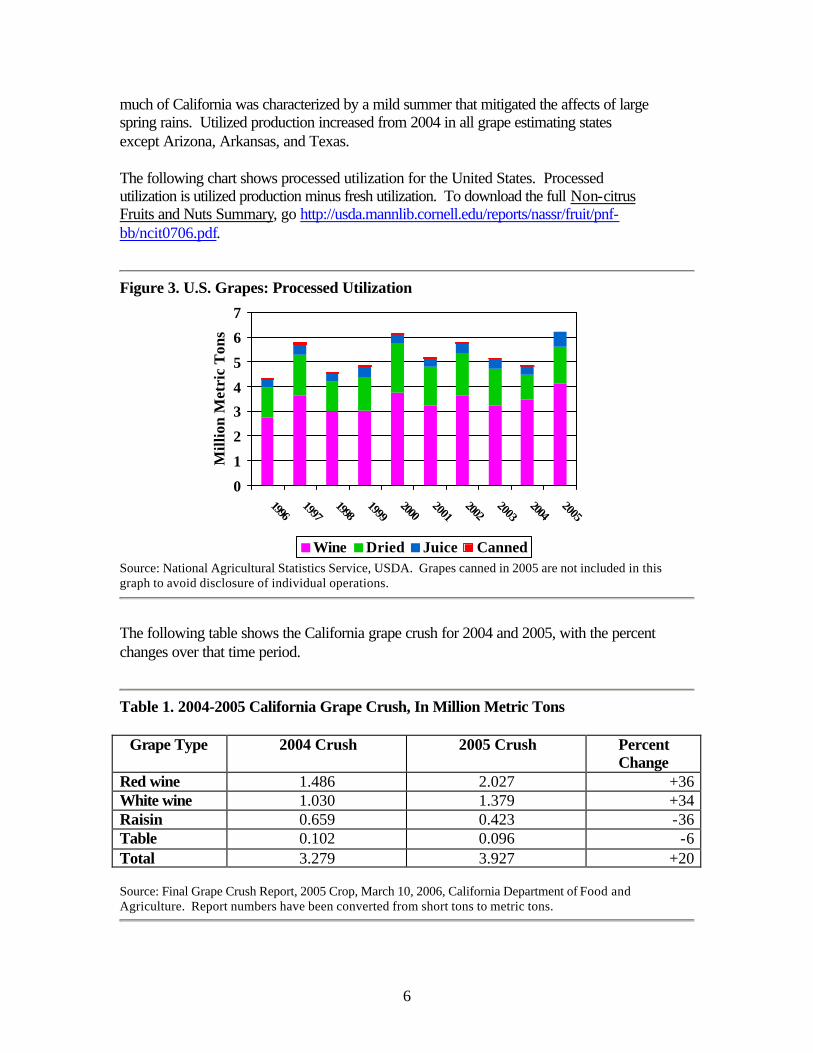
much of California was characterized by a mild summer that mitigated the affects of large spring rains. Utilized production increased from 2004 in all grape estimating states except Arizona, Arkansas, and Texas. The following chart shows processed utilization for the United States. Processed utilization is utilized production minus fresh utilization. To download the full Non-citrus Fruits and Nuts Summary, go http://usda.mannlib.cornell.edu/reports/nassr/fruit/pnf-bb/ncit0706.pdf.
Figure 3. U.S. Grapes: Processed Utilization
0
1
2
3
4
5
6
7
19961997
19981999
20002001
20022003
20042005
Mill
ion
Met
ric
Ton
s
Wine Dried Juice Canned Source: National Agricultural Statistics Service, USDA. Grapes canned in 2005 are not included in this graph to avoid disclosure of individual operations.
The following table shows the California grape crush for 2004 and 2005, with the percent changes over that time period.
Table 1. 2004-2005 California Grape Crush, In Million Metric Tons
Grape Type 2004 Crush 2005 Crush Percent Change
Red wine 1.486 2.027 +36 White wine 1.030 1.379 +34 Raisin 0.659 0.423 -36 Table 0.102 0.096 -6 Total 3.279 3.927 +20 Source: Final Grape Crush Report, 2005 Crop, March 10, 2006, California Department of Food and Agriculture. Report numbers have been converted from short tons to metric tons.
7
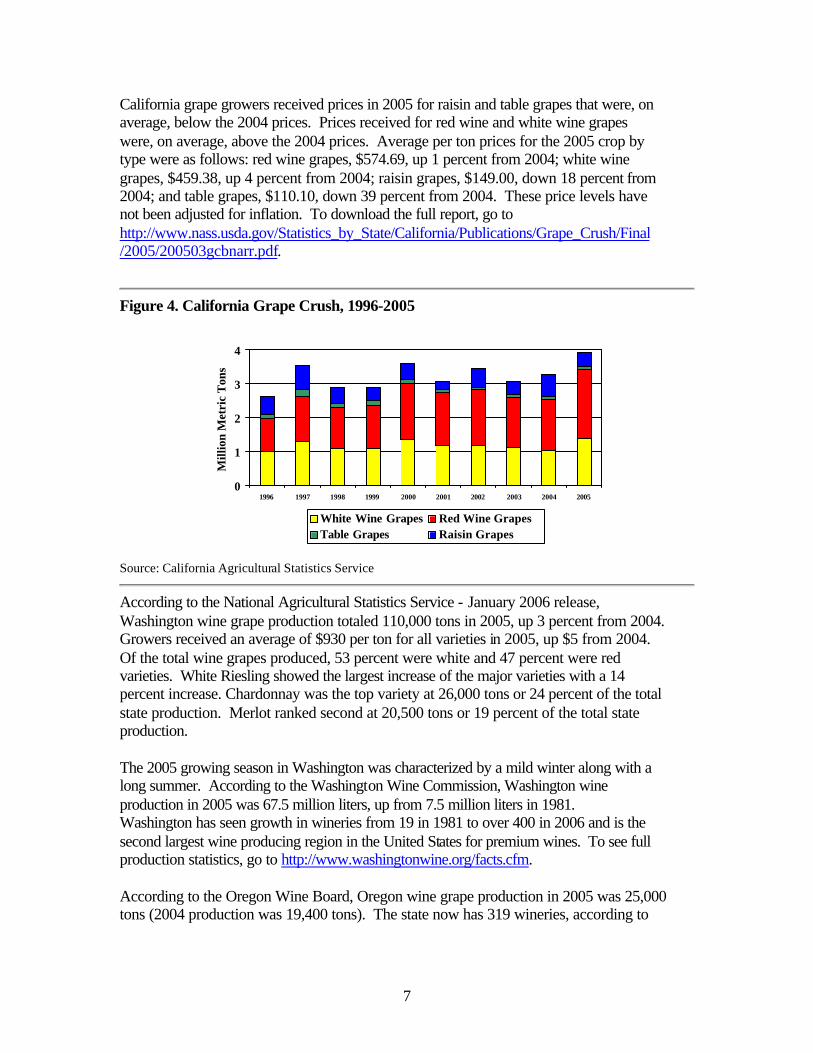
California grape growers received prices in 2005 for raisin and table grapes that were, on average, below the 2004 prices. Prices received for red wine and white wine grapes were, on average, above the 2004 prices. Average per ton prices for the 2005 crop by type were as follows: red wine grapes, $574.69, up 1 percent from 2004; white wine grapes, $459.38, up 4 percent from 2004; raisin grapes, $149.00, down 18 percent from 2004; and table grapes, $110.10, down 39 percent from 2004. These price levels have not been adjusted for inflation. To download the full report, go to http://www.nass.usda.gov/Statistics_by_State/California/Publications/Grape_Crush/Final/2005/200503gcbnarr.pdf.
Figure 4. California Grape Crush, 1996-2005
0
1
2
3
4
1996 1997 1998 1999 2000 2001 2002 2003 2004 2005
Mill
ion
Met
ric
Ton
s
White Wine Grapes Red Wine GrapesTable Grapes Raisin Grapes
Source: California Agricultural Statistics Service
According to the National Agricultural Statistics Service - January 2006 release, Washington wine grape production totaled 110,000 tons in 2005, up 3 percent from 2004. Growers received an average of $930 per ton for all varieties in 2005, up $5 from 2004. Of the total wine grapes produced, 53 percent were white and 47 percent were red varieties. White Riesling showed the largest increase of the major varieties with a 14 percent increase. Chardonnay was the top variety at 26,000 tons or 24 percent of the total state production. Merlot ranked second at 20,500 tons or 19 percent of the total state production. The 2005 growing season in Washington was characterized by a mild winter along with a long summer. According to the Washington Wine Commission, Washington wine production in 2005 was 67.5 million liters, up from 7.5 million liters in 1981. Washington has seen growth in wineries from 19 in 1981 to over 400 in 2006 and is the second largest wine producing region in the United States for premium wines. To see full production statistics, go to http://www.washingtonwine.org/facts.cfm. According to the Oregon Wine Board, Oregon wine grape production in 2005 was 25,000 tons (2004 production was 19,400 tons). The state now has 319 wineries, according to
8
the Oregon Liquor Control Commission. For further information, go to http://www.oregonwine.org/. The growing season for the New York wine grape crop in 2005 was characterized by a January deep freeze in the Finger Lakes area and late season rains in Long Island and in the Hudson Valley. Of the 162 thousand tons crushed by wineries and processing plants, over 46 thousand tons were used for wine crushing, representing a one percent drop from 2004. New York has 239 wineries, an increase from 17 wineries in 1976. New York has five grape growing regions and nine American Viticultural Areas. New York specializes in producing table wines and dessert wines. Further information on winery and grape processing plant production in New York for 2005 can be found at http://www.nass.usda.gov/Statistics_by_State/New_York/Publications/Statistical_Reports/03mar/fruitwineries0206.htm. For further information on New York wines, go to http://www.newyorkwines.org/. Wine production facilities can be found in all 50 states. Specific production data for 2005 in many states can be found on the Department of the Treasury, Alcohol and Tobacco Tax and Trade Bureau website at http://www.ttb.gov.
U.S. Wine Consumption Wine consumption in the United States has been rising slowly and consistently over the last 11 years. Various sources put consumption of wine by American adults at 25 to 33 percent. The core wine drinkers (people who drink wine at least once per week) make up about half of this group. The rest are marginal wine drinkers. According to Euromonitor International, U.S. yearly per capita consumption of wine is 12 liters, up from 10.6 liters in 2000. While French wine remains popular, market share has been lost to lower-priced wines from other countries. Americans are drinking more imported wines from countries such as Italy, Australia, Spain, Chile, Germany, New Zealand, Portugal, and South Africa. According to Wine Institute estimates, wine sales in the United States from all sources grew five percent to 703 million gallons (26.6 million hectoliters) in 2005. The estimated retail value of wine shipments from all sources to the United States is $26 billion.6 Good growth was seen in wines priced $7 per bottle and above.
Recent Issues Affecting the U.S. Wine Industry A Supreme Court ruling in the spring of 2005 said that states cannot discriminate in favor of their in-state wineries by allowing only those local wineries to make shipments via common carriers to their in-state consumers while prohibiting out-of-state wineries from making shipments to those same consumers. This ruling directly affected approximately
6 “2005 California Wine Sales Continue Growth Trend as Wine Enters Mainstream U.S. Lifestyle,” The Wine Institute, 3 April 2006, http://www.wineinstitute.org/communications/statistics/sales2005.htm
9
a dozen states that had such a discriminatory law on the books at the time of the ruling, although many of the affected states have now taken legislative action to provide for a level playing field for all domestic wineries. This ruling could potentially benefit small and mid-sized wineries. In March 2006, the United States and the European Community concluded the first phase of an agreement on wine. The agreement provides for mutual acceptance of existing wine-making practices and addresses labeling issues. Discussions on phase two of this agreement will begin soon. Further information on this agreement can be found on the Office of the United States Trade Representative website at http://www.ustr.gov/Document_Library/Press_Releases/2006/March/United_States_European_Community_Reach_Agreement_on_Trade_in_Wine.html.
Trade Policy and the U.S. Wine Industry The marketing efforts of the U.S. wine industry are important tools in the expansion of exports. However, growth in demand for U.S. wine is also partially dependent on maintaining and expanding market access, ensuring fair competition, and leveling the international playing field for U.S. producers and exporters. Subsidies, protectionist policies, tariffs, and non-tariff barriers inhibit the competitiveness of U.S. wines in some countries. The World Trade Organization (WTO), multilateral and bilateral trade negotiations, and organizations such as the World Wine Trade Group (WWTG) are forums to attempt to reduce these trade barriers. The major trade barrier faced by U.S. wine exports is high tariffs, which can vary in many ways including by whether the wine is bottled or bulk, by the type of wine, or by the alcohol content of the wine. For example, the United Kingdom, the largest market for U.S. wine exports and a member of the EU, has tariffs on wine products ranging from €10.9 ($13.97)7 per hectoliter to €32 ($41.01) per hectoliter. For a complete list of EU wine tariffs, please visit http://europa.eu.int/comm/taxation_customs/dds/en/tarhome.htm. Other countries with high import tariffs for wines include Russia, Japan, Hong Kong, Korea, and Thailand. Specific tariff information for many countries can be found at http://www.trade.gov/td/tic/tariff/country_tariff_info.htm. In addition, high value added taxes (VATs) and excise taxes can be applied. To again use the United Kingdom as an example, excise duties range from £166.70 ($315.10) per hectoliter to £223.62 ($422.69) per hectoliter, with some types of sparkling wines accessed an excise tax based on the amount of alcohol in the product. Other countries with high VATs and/or excise taxes on wine include Chile, China, France, Japan, Russia, Thailand, and South Africa. Countries such as Canada and Sweden have nationwide monopolies on alcohol. The importation of alcoholic beverages into Canada is strictly controlled by a Liquor Control Board (LCB) for each province. Wine exporters are required to have their products listed
7 All conversions are based on the exchange rates on May 18, 2006
10
by the LCBs and have a registered agent to provide marketing support. Sweden has Systembolaget, a government agency that handles all of the over-the-counter sales of wine, spirits, and full-strength beer through 400 liquor stores in Sweden. Systembolaget does not have a monopoly on the importation, wholesaling, production and exporting of wine and spirits. Other restrictions, such as licensing, import registration, and required testing, cause additional expenses for wine producers. These restrictions vary widely by country.
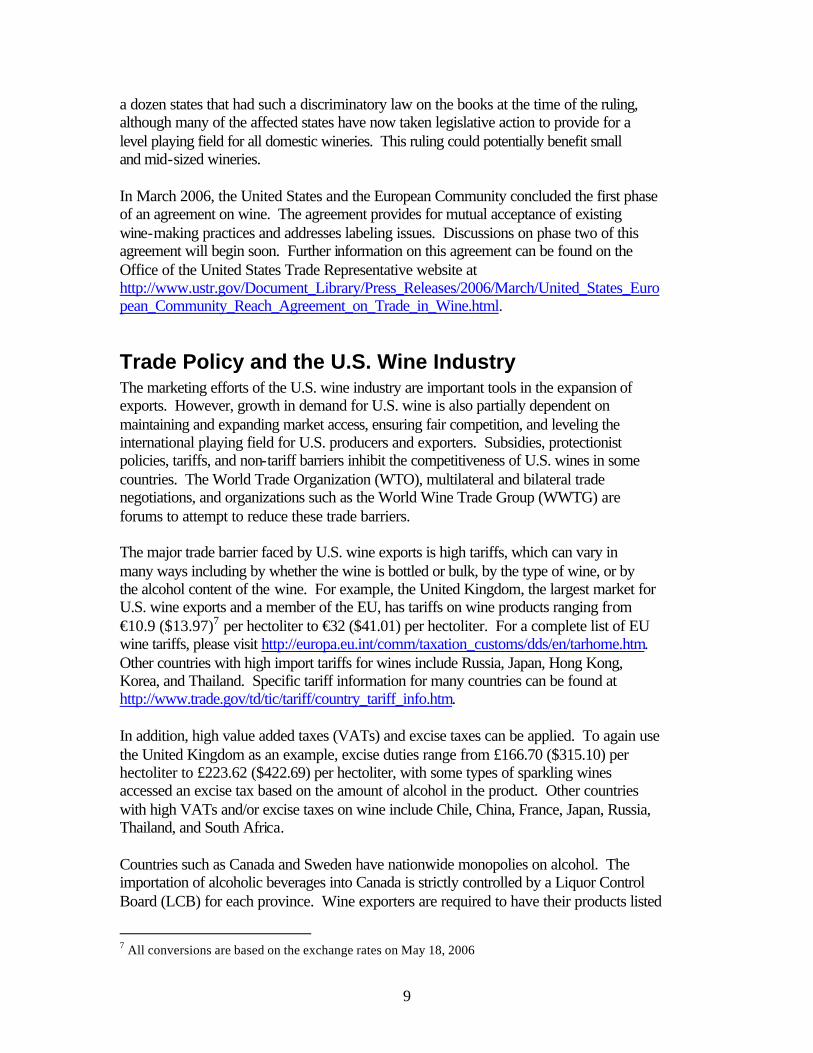
U.S. Wine Exports The United States exported 3.8 million hectoliters of wine and wine products (including cider, fermented beverages, and wine must) during 2005, a 15 percent drop from 2004. The United States exported $659 million of wine and wine products during 2005, which represented a decrease of 17 percent from 2004. By quantity, the top market for the United States, the United Kingdom, decreased 42 percent above the year before. Canada, the second highest export market for the United States, increased by 9 percent in quantity. Italy ranks as the United States’ third top market after purchases increased 262 percent during 2005. A U.S. wine producer sends bulk wine to Italy for bottling and ships the product to other parts of Europe from there. Japan ranks fourth and decreased 44 percent from the previous year. Germany continues to rank fifth and decreased 11 percent from 2004.
Figure 5. U.S. Wine Exports by Quantity
020
406080
100120140160
Mill
ion
Lit
ers
United Kingdom
CanadaItaly
JapanGermany
Netherlands
Denmark
MexicoBelgium
Sweden
2003 2004 2005
Source: U.S. Department of Commerce
Nations in the EU-25 represent 49 percent of the U.S. wine exports in value and 57 percent of the U.S. wine exports in quantity. Canada represents 22 percent of U.S. wine
11
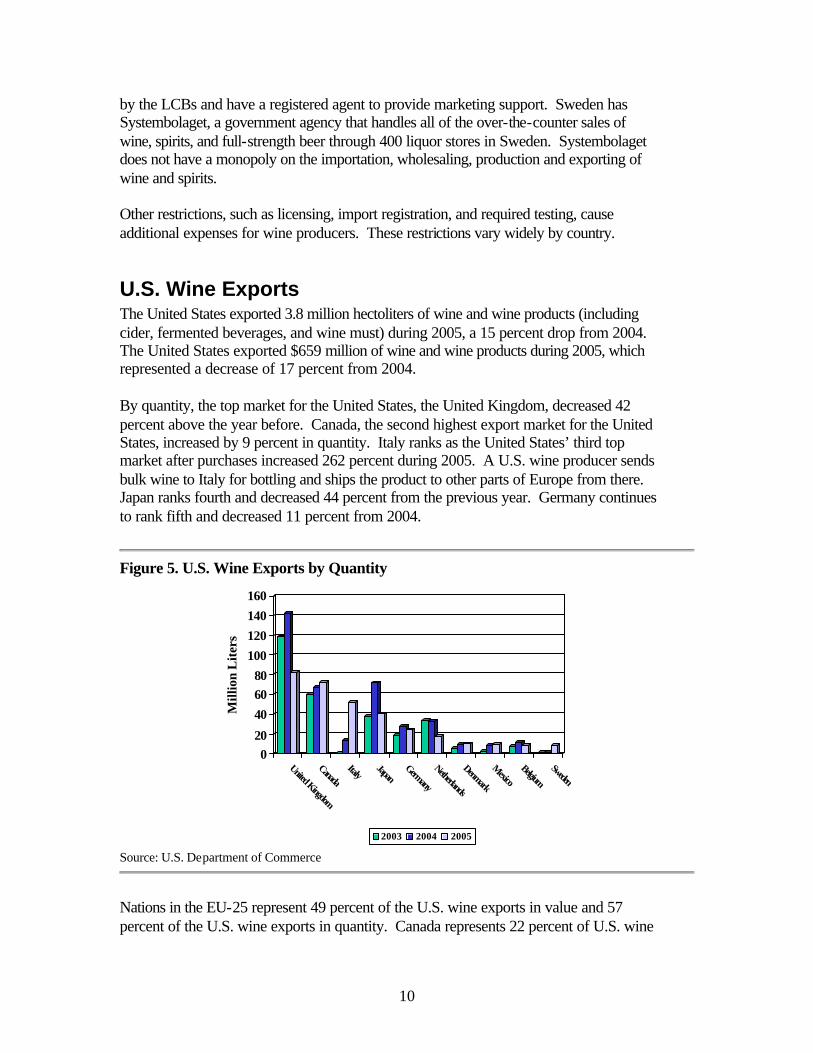
exports in value and 19 percent in quantity, and Japan represents 12 percent of U.S. wine exports in value and 11 percent in quantity.
Figure 6. U.S. Wine Exports by Value
0
50
100
150
200
250
300
Mill
ion
Dol
lars
United Kingdom
CanadaJapan
ItalyNetherlands
Germany
Sweden
Denmark
Mexico
Belgium
2003 2004 2005
Source: U.S. Department of Commerce
U.S. wine exports rose 4 percent in value during the first three quarters of fiscal year (FY) 2006 (October 2005 through June 2006), compared to the same time period in FY 2005. U.S. wine exports fell 5 percent in quantity during the first three quarters of FY 2006 compared to the same time period in FY 2005. FY 2005 (October 2004 through September 2005) U.S. wine exports were $727.6 million, almost unchanged from FY 2004. For all of FY 2006 (October 2005 through September 2006), FAS projects that value growth of U.S. wine exports will be unchanged from FY 2005.
Competitive Environment The greatest competition to the market share for U.S. wines comes from the EU-25 nations and some of the New World producers, particularly Australia and Chile. Discussion of some of the largest competitor nations begins on page 18. Government assistance to the wine industry in Australia can mostly be found in the form of export promotion. Wine producing EU nations receive financial assistance through their individual governments and through the EU agricultural budget. The EU wine regime, begun during Marketing Year (MY) 2000/01, seeks the enhancement of quality, a greater market orientation, and the renewal of old vineyards. Appropriations for the wine sector are as follows: 2005, €1.228 billion ($2.321 billion), 2006 €1.494 billion ($2.823 billion). Products of the wine-growing sector will receive 2.6 percent of the total EU agricultural budget in 2006. Appropriations for wine increased by 22 percent compared to 2005. The EU budget includes appropriations for export refunds on products of the wine-growing sector, storage of wine and grape must, distillation of wine, storage measures for alcohol, aid for the use of must, permanent abandonment premiums for
12
areas under vines, and restructuring and conversion of vineyards. For more information, see GAIN reports #E35005, #E34076, #E35053, and #E36074.
Largest U.S. Wine Export Markets
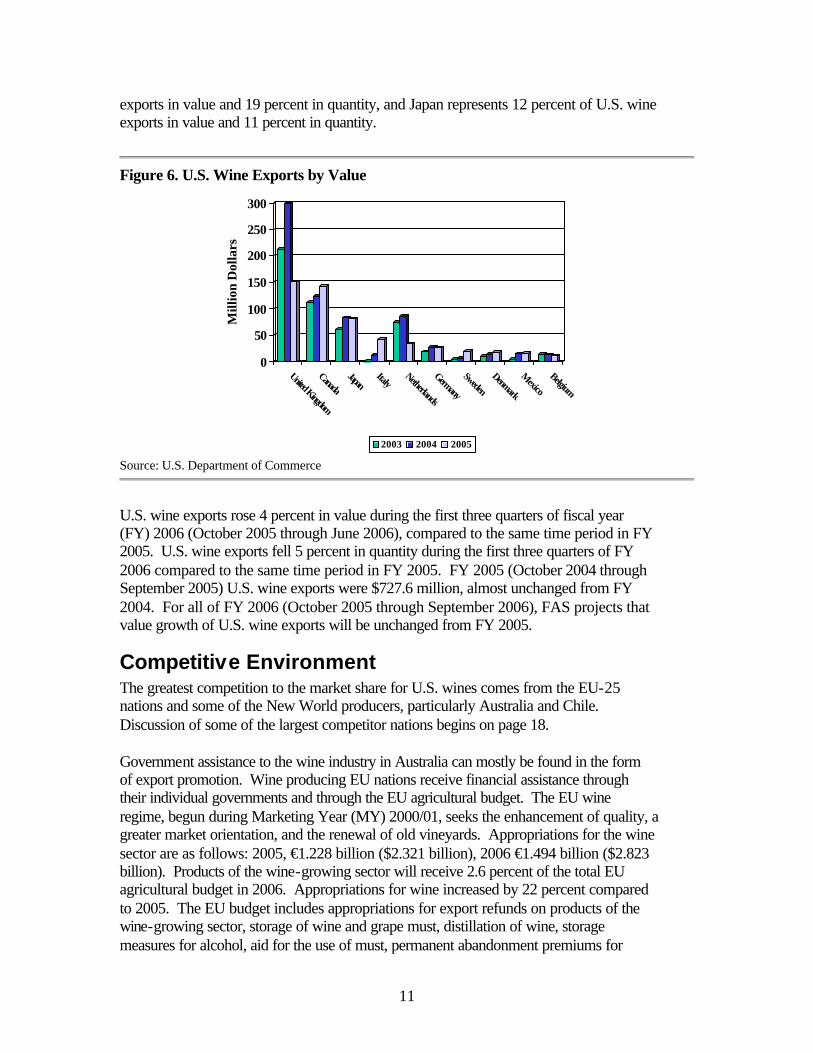
United Kingdom Production: 19 thousand hectoliters (hl) (2004) Total imports: $4.2 billion, 12.3 million hl (2005) Total exports: $250 million, 326 thousand hl (2005) Sources: GAIN report, Global Trade Atlas (GTA) Wine production in the United Kingdom is minimal due to the variable climate. Historically, it has been a cottage industry but is slowly becoming a profitable enterprise. Output is predominately white wine (92 percent) though sparkling, dessert, and red wines are starting to be produced in growing quantities. The production total for the 2004 harvest was 19 thousand hectoliters. Consumption of wine in the United Kingdom is increasing at the expense of beer sales, as the British become more influenced by the lifestyles of continental Europe. Wine consumption is also positively impacted by rising personal disposable incomes in the United Kingdom. However, there are concerns by importers that the UK market may be reaching a saturation point. According to Euromonitor International, per capita grape wine consumption in the United Kingdom was 28.3 liters in 2005, growing from 20.2 liters in 1997.
Figure 7. U.K. Wine Imports by Value
0
200
400
600
800
1,000
1,200
1,400
1,600
Mill
ion
Dol
lars
FranceAustralia
ItalySpain
South Africa
ChileUnited States
Germany
New Zealand
2003 2004 2005
Sources: Global Trade Atlas, U.S. Department of Commerce (for U.S. statistics)
The United Kingdom is the world’s largest importer of wine by value and the largest market for U.S. wines. By value, the United States is the seventh largest supplier of wine to the UK market. The top three suppliers by value are France, Australia, and Italy. U.S.
13
wine exports to the United Kingdom decreased 50 percent in value from 2004 to $150.4 million. By quantity, U.S. wine exports to the United Kingdom decreased 42 percent to 826 thousand hectoliters. Composition of U.S. wine exports by value in the UK market in 2005 were 85 percent bottled wine, 14 percent bulk wine, and a small amount of sparkling wines, grape must, cider, other fermented beverages, vermouth, and others. One possible reason for the decrease in U.S. exports to the United Kingdom is the re-export of U.S. wines shipped to Italy for bottling to other parts of Europe. For more information on marketing wine in the United Kingdom, see GAIN report #UK6002.
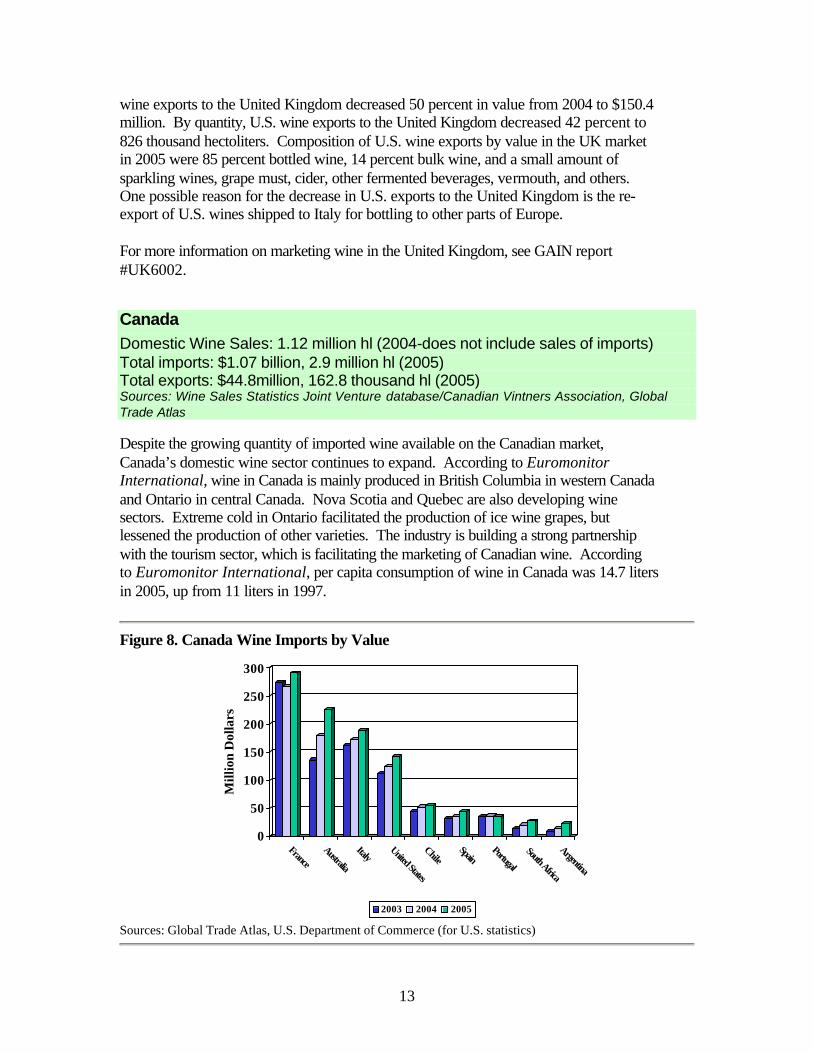
Canada Domestic Wine Sales: 1.12 million hl (2004-does not include sales of imports) Total imports: $1.07 billion, 2.9 million hl (2005) Total exports: $44.8million, 162.8 thousand hl (2005) Sources: Wine Sales Statistics Joint Venture database/Canadian Vintners Association, Global Trade Atlas Despite the growing quantity of imported wine available on the Canadian market, Canada’s domestic wine sector continues to expand. According to Euromonitor International, wine in Canada is mainly produced in British Columbia in western Canada and Ontario in central Canada. Nova Scotia and Quebec are also developing wine sectors. Extreme cold in Ontario facilitated the production of ice wine grapes, but lessened the production of other varieties. The industry is building a strong partnership with the tourism sector, which is facilitating the marketing of Canadian wine. According to Euromonitor International, per capita consumption of wine in Canada was 14.7 liters in 2005, up from 11 liters in 1997.
Figure 8. Canada Wine Imports by Value
0
50
100
150
200
250
300
Mill
ion
Dol
lars
FranceAustralia
ItalyUnited States
ChileSpain
Portugal
South Africa
Argentina
2003 2004 2005
Sources: Global Trade Atlas, U.S. Department of Commerce (for U.S. statistics)
14
The United States is the fourth largest supplier of wine to the Canadian market by value. Canada continued to be the number two export market for U.S. wine by value. During 2005, the United States exported $142 million in wine to Canada, an increase of 14 percent over 2004. By value, 79 percent of the wine shipped from the United States went in the form of bottled product, 9 percent as bulk, 9 percent as other fermented beverage products, and 2 percent as sparkling wine. For Canadian wine, there are four main export markets: the United States, Taiwan, Japan, and France. The United States is Canada’s largest export market with $33.5 million in sales in 2005, a 38 percent increase over 2004, though sales have not recovered back to 2001/2002 levels yet. Euromonitor International reports that wine can be sold in supermarkets in Quebec only, the other provinces sell wine through government stores or licensed retail agents. The Canadian wine industry receives generic government support. Canadian associations promoting international wine sales are the Canadian Vintners Association, and the two regional wine associations: the Wine Council of Ontario and the British Columbia Wine Institute. For more information on wine relating to Canada, see GAIN reports #CA2100, #CA2026, and #CA2021.
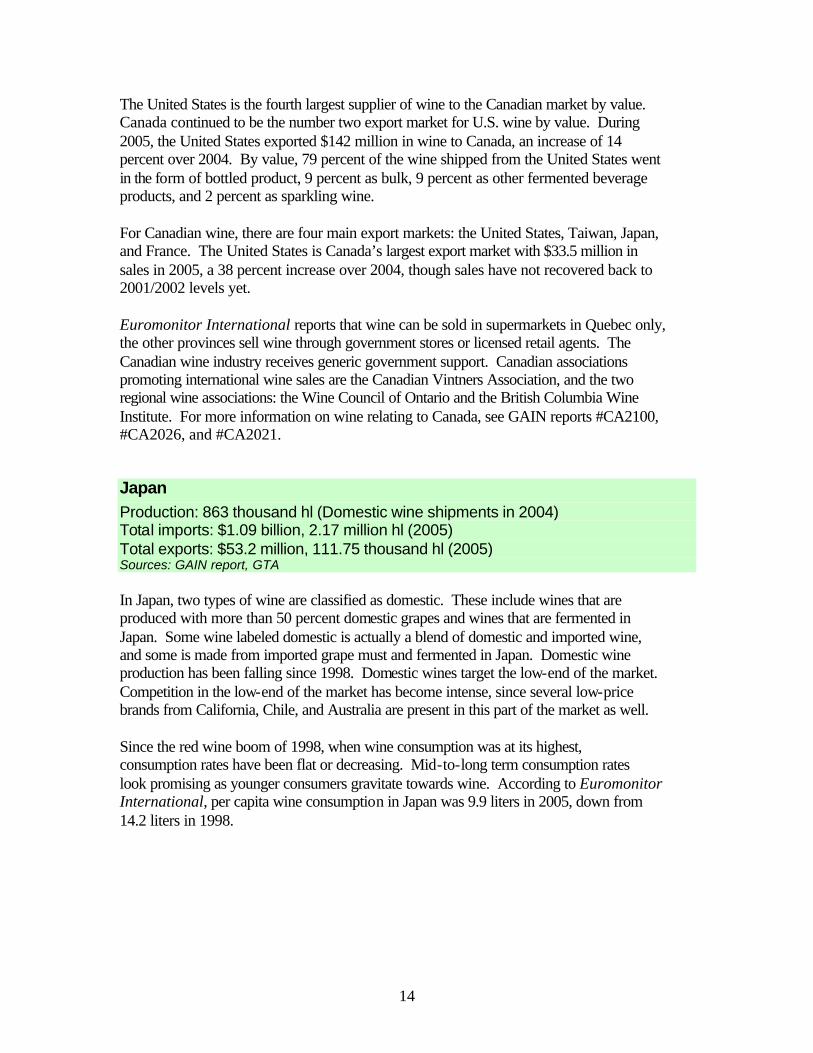
Japan Production: 863 thousand hl (Domestic wine shipments in 2004) Total imports: $1.09 billion, 2.17 million hl (2005) Total exports: $53.2 million, 111.75 thousand hl (2005) Sources: GAIN report, GTA In Japan, two types of wine are classified as domestic. These include wines that are produced with more than 50 percent domestic grapes and wines that are fermented in Japan. Some wine labeled domestic is actually a blend of domestic and imported wine, and some is made from imported grape must and fermented in Japan. Domestic wine production has been falling since 1998. Domestic wines target the low-end of the market. Competition in the low-end of the market has become intense, since several low-price brands from California, Chile, and Australia are present in this part of the market as well. Since the red wine boom of 1998, when wine consumption was at its highest, consumption rates have been flat or decreasing. Mid-to-long term consumption rates look promising as younger consumers gravitate towards wine. According to Euromonitor International, per capita wine consumption in Japan was 9.9 liters in 2005, down from 14.2 liters in 1998.
15
Figure 9. Japan Wine Imports by Value
0
100
200
300
400
500
600700
800
Mill
ion
Dol
lars
FranceItaly
United States
SpainAustralia
ChileGermany
China
2003 2004 2005
Sources: Global Trade Atlas, U.S. Department of Commerce (for U.S. statistics)
The United States is the third largest supplier of wine to the Japanese market by value. Japan is the number three export market for U.S. wine by value. U.S. wine sales are recovering from the stagnation that followed the wine boom of 1998. While U.S. exports dropped 2 percent by value in 2005, the large sales gains of 2004 are holding on. By value, 63 percent of the wine shipped from the United States went in the form of bottled product, 21 percent as other fermented beverage products, 6 percent as bulk, and 6 percent as vermouth, with small amounts of sparkling wine, grape must, effervescent wine and cider. For Japanese wine in 2005, there are three main export markets: the United States, Taiwan, and Hong Kong. The United States is Japan’s largest export market. U.S. imports of Japanese wine (mainly sake or rice wine) have risen from $21.7 million in 2004 to $26.4 million in 2005, an increase of 21 percent. Deregulation of Japanese liquor licensing has expanded the range of retail outlets handling wine and other alcoholic beverages. The deregulation took place in September 2003, and presents new opportunities as supermarkets and convenience stores find it easier to sell wine. The Wine Institute’s “California Wine by the Glass” campaign, in which over 300 restaurants are serving California wines, along with other U.S. promotional efforts, continue to build awareness of U.S. wine products. Washington wine in particular made significant progress for placement in Tokyo area hotel and restaurant wine lists. Other wine producing states are also attracting market interest. For more information, see GAIN report #JA6501.
16
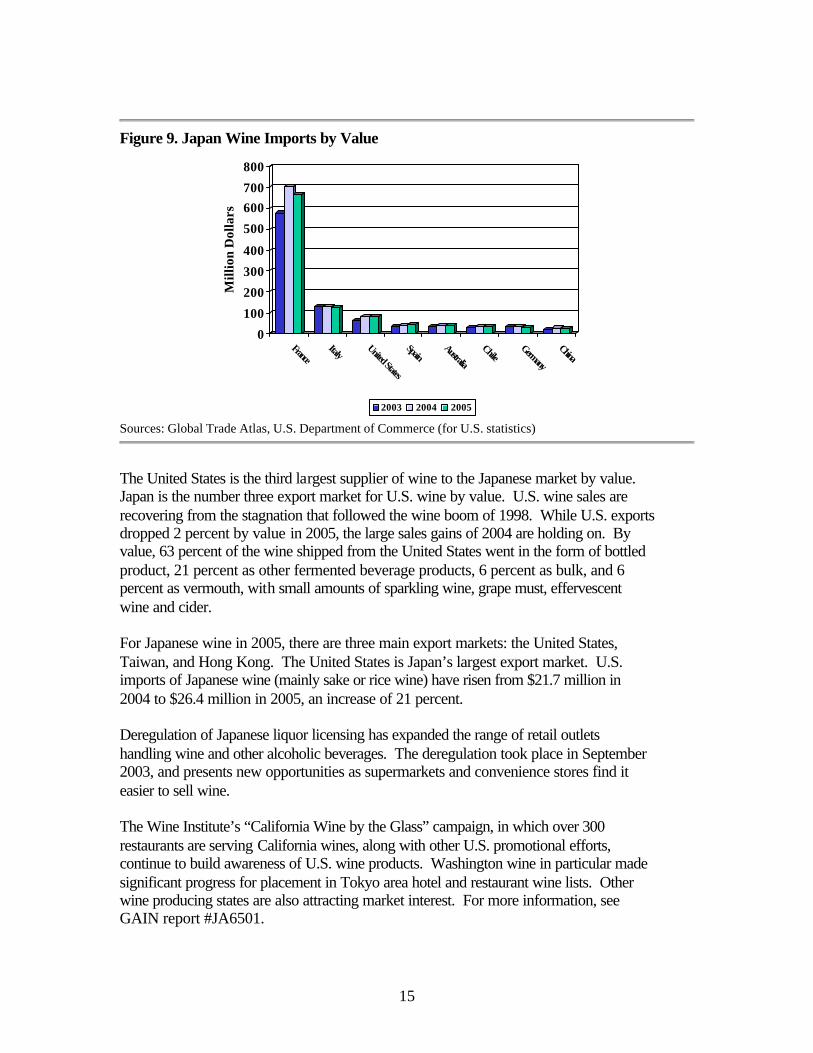
Netherlands Production: None Total imports: $896.4 million, 3.81 million hl (2005) Total exports: $162.4 million, 510 thousand hl (2005) Sources: GAIN report, Global Trade Atlas Wine is not produced in the Netherlands. According to Euromonitor International, Dutch drinkers consumed 30.5 liters of wine per capita in 2005, up from 24.2 liters in 2000. Reportedly, older consumers are leading the growth in consumption. Red wine is the most popular variety, but consumption of white wine and rosé wine is increasing. New World wines are very popular in the Netherlands.
Figure 10. Netherlands Wine Imports by Value
0
50
100
150
200
250
300
350
Mill
ion
Dol
lars
FranceSouth Africa
SpainGermany
ItalyChile
Australia
Portugal
United States
2003 2004 2005
Sources: Global Trade Atlas, U.S. Department of Commerce (for U.S. statistics)
The United States is the eleventh largest supplier of wine to the Dutch market by value. The Netherlands is the number five export market for U.S. wine by value. By value, 90 percent of the wine shipped from the United States went in the form of bottled product, 8 percent as bulk, with small amounts of sparkling wine, effervescent wine, vermouth, cider, and fermented beverages. Wine re-exports are significant, with Germany being the primary destination. U.S. industry sources believe as much as 50 to 75 percent of U.S. wine products shipped to the Netherlands are trans-shipped to other destinations, particularly other countries within the EU. Industry sources believe that much of the drop in U.S. wine shipments to the Netherlands from 2004 to 2005 can be attributed to bulk shipments of U.S. wine going to Italy for bottling and then being shipped from Italy to other parts of Europe. For the Netherlands, there are five main export markets: Germany, Belgium, Japan, France and the United Kingdom. The United States is the sixth largest market for wine
17
from the Netherlands. Wine is not produced in the Netherlands, so these products are re-exports are from another country of origin. There are no GAIN reports from the Netherlands specifically covering wine, but the wine sector is mentioned in GAIN reports #NL5029, #NL5005, and #NL4026.
Germany Production: 9.1 million hl (2005) Total imports: $2.2 billion, 13.4 million hl (2005) Total exports: $713.9 million, 3 million hl (2005) Sources: GAIN report, Global Trade Atlas Wine production in Germany is forecasted to reach 9.1 million hectoliters in 2005, about 1 million hectoliters less than in 2004 due to adverse weather conditions. Grapes for wine are found in more than 14 different growing regions. The most prominent wine growing regions are in the states of Rheinland-Pfatz, Baden-Wuerttemberg, and Hessen. Due to climate and geography, German wine production can vary significantly in quality and quantity from year to year. Germany is predominately a white wine region with 64 percent white wine grape areas in 2004. Red wine grapes account for the rest of the production area, but red wine grape plantings are increasing. Per capita consumption of wine in Germany was estimated at 20.1 liters for 2004, compared to 19 liters in 2000. However, per capita consumption of sparkling wine has fallen off, 4.1 liters in 2000 versus 3.8 liters in 2004.
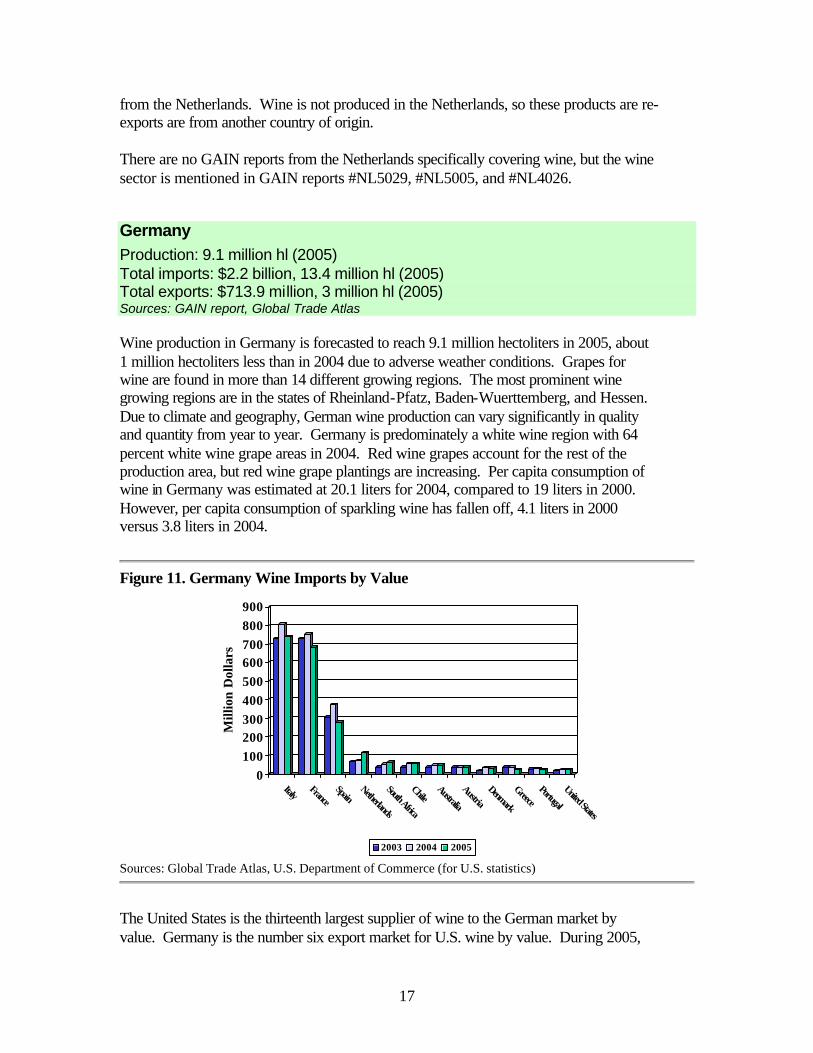
Figure 11. Germany Wine Imports by Value
0100200300400500600700800900
Mill
ion
Dol
lars
ItalyFrance
SpainNetherlands
South Africa
ChileAustralia
Austria
Denmark
GreecePortugal
United States
2003 2004 2005
Sources: Global Trade Atlas, U.S. Department of Commerce (for U.S. statistics)
The United States is the thirteenth largest supplier of wine to the German market by value. Germany is the number six export market for U.S. wine by value. During 2005,
18
the United States exported $26 million in wine to Germany, a 3 percent drop from 2004. Seventy-eight percent of the wine shipped from the United States went in the form of bottled product, 21 percent as bulk, with small amounts of effervescent wine, sparkling wine, other fermented beverage products, and grape must. For German wine, there are seven main export markets: the United Kingdom, the United States, the Netherlands, Japan, Sweden, France and Belgium. The United States is Germany’s second largest export market. U.S. imports of German wine have risen from $80.1 million in 2004 to $98.6 million in 2005, an increase of 23 percent. Generic marketing for the German wine industry is conducted by the Deutsches Weininstut (German Wine Institute), charged with marketing and promoting German wine within Germany and around the world. The Institute receives most of its funds as royalties from German winegrowers and processors. The Institute is a major sponsor of the FIFA (Federation Internationale de Football) World Cup Championship in Germany during June of 2006 and it will be interesting to see how this event affects sales of domestic and imported wine in Germany. For more information, see GAIN report #GM5044.
Competitor Countries for U.S. Wine
France Production: 54.7 million hectoliters (2005) Total imports: $659.2 million, 5.9 million hl (2005) Total exports: $7.02 billion, 14.07 million hl (2005) Sources: GAIN report, Global Trade Atlas France is the world’s number one wine producer with 58.8 million hectoliters in 2004 and a 2005 vintage currently estimated at 54.7 million hectoliters. The 2005 crop is a 6.8 percent decrease from the 2004 crop, but is up 6.3 percent compared to the average for 2000-2004. The long-term trend toward declining wine consumption continued last year. French per capita wine consumption has decreased from 103 liters in 1980 to 54 liters in 2004, which is only slightly higher than the per capita consumption of 53.5 liters in 2003.
19
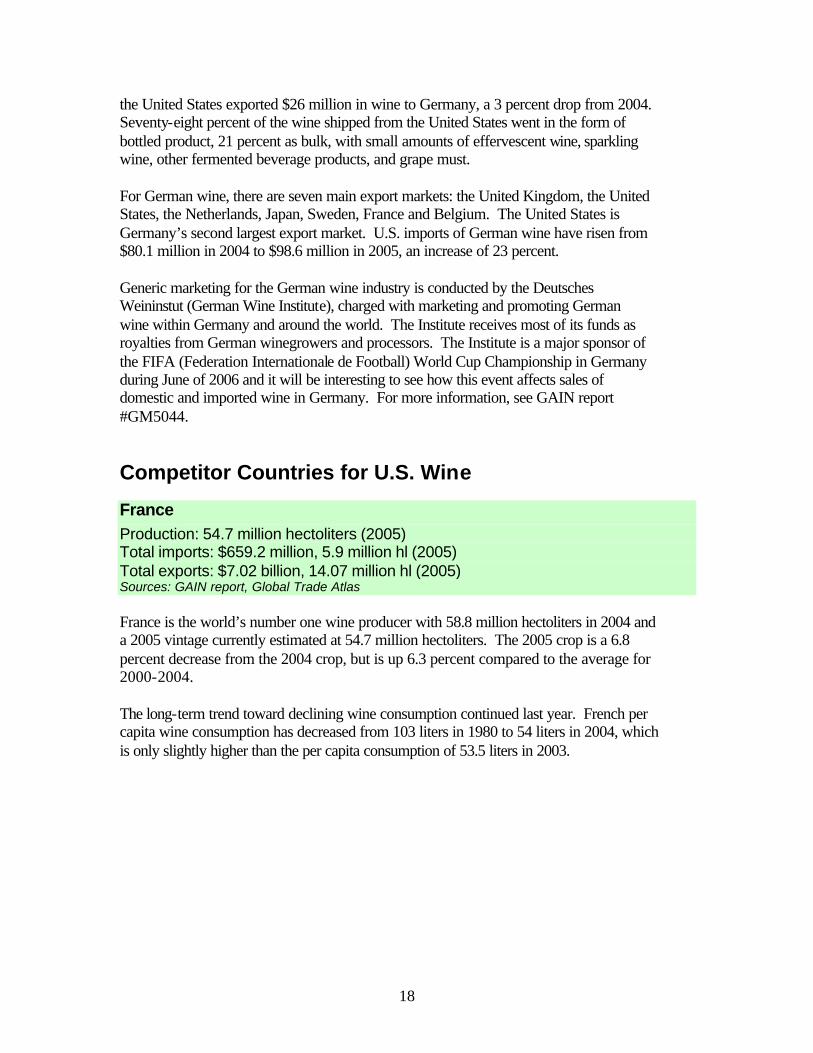
Figure 12. France Wine Exports by Quantity
0
50
100
150
200
250
300
350
Mill
ion
Lit
ers
United Kingdom
Germany
BelgiumNetherlands
United States
JapanCanada
Switzerland
RussiaDenmark
Italy
2003 2004 2005
Sources: Global Trade Atlas, U.S. Department of Commerce (for U.S. statistics)
According to Global Trade Atlas, French wine export quantities decreased 4 percent in CY 2005. In terms of value, French wine exports experienced no change from 2004 to 2005. By quantity, major destinations for French wine continue to be the United Kingdom, Germany, Belgium, the Netherlands, and the United States. According to Global Trade Atlas, the United States represents 6.9 percent in quantity and 15.4 percent in value of France’s export market. The U.S. Department of Commerce reports that the United States imported 6 percent more wine from France in value to $1.08 billion and 4 percent more in quantity to 980 thousand hectoliters in 2005. U.S. exports of wine to France in 2005 decreased 35 percent in value to $6.7 million and decreased 31 percent in quantity to 61.5 thousand hectoliters. By value, most of the U.S. wine exported to France was bottled wine, with small amounts of other fermented beverages and bulk wine. U.S. wines in France face strong competition from domestic producers, other large EU producers, and New World producers. However, U.S. wines are present in large retailers and restaurants, especially those restaurants with an American theme. Frustrated by overproduction, shrinking exports, advertising restrictions, an aggressive anti-alcohol abuse campaign, and changing domestic drinking habits, French wine makers are pleading for government assistance. The French office of Wines and Vines (ONIVINS) and SOPEXA had a budget in CY2004 of €15.3 million ($19.6 million) for export promotion of French wines. For more information, see GAIN report #FR6011.
20
Italy Production: 49 million hl (2005) Total imports: $340.7 million, 1.8 million hl (2005) Total exports: $3.9 billion, 16.1 million hl (2005) Sources: GAIN report, Global Trade Atlas Italy’s 2005 wine production dropped 8 percent from 2004 to 49 million hectoliters, due to unfavorable weather, with too much rain in the summer and early fall. Italian vine area continues to fall, but at a slower rate than in the 1980s and 1990s. The 2005 area is officially reported at 764 thousand hectares, which is about half of the area of the early 1980s. Per capita wine consumption in 2004 fell below 50 liters for the first time to 49.8 liters. Thirty years ago this figure was over 100 liters. For a time, the drop in wine consumption represented a switch to beer, but now per capita consumption of beverage trends favor low-alcohol or no alcohol drinks.
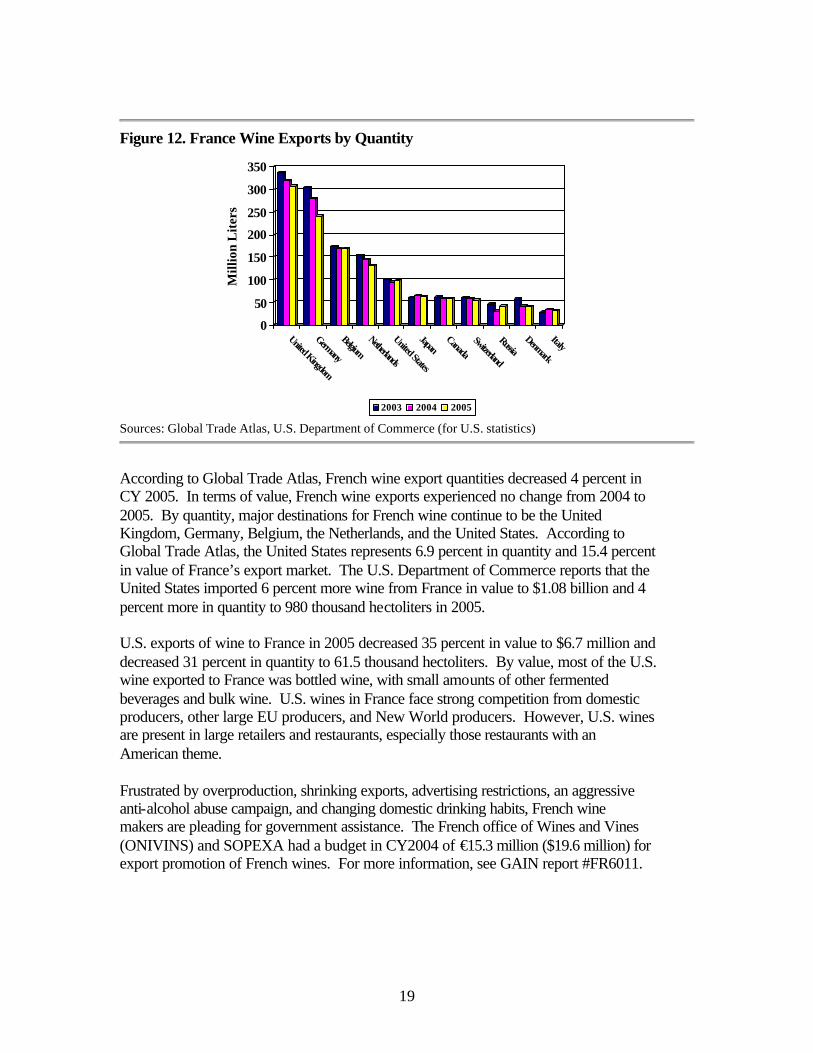
Figure 13. Italy Wine Exports by Quantity
0
100
200
300
400
500
600
Mill
ion
Lit
ers
Germany
United Kingdom
United States
FranceSwitzerland
CanadaCzech Republic
AustriaNetherlands
Denmark
2003 2004 2005
Sources: Global Trade Atlas, U.S. Department of Commerce (for U.S. statistics)
According to Global Trade Atlas, Italy’s wine export quantities increased 4 percent in CY 2005. In terms of value, Italy’s wine exports increased 3 percent. Major destinations for Italian wine are Germany, the United Kingdom, the United States, France, and Switzerland. According to Global Trade Atlas, the United States represents 13 percent in quantity and 25 percent in value of Italy’s export market. According to the U.S. Department of Commerce, the United States imported 11 percent more wine from Italy in value to $1.07 billion and 9 percent more in quantity to 2.2 million hectoliters during 2005. Italy has been the top wine supplier to the United States in terms of quantity for many years.
21
U.S. exports of wine to Italy increased remarkably in 2005, with increases of 239 percent in value to $42 million and of over 262 percent in quantity to 521 thousand hectoliters. Most of the increase was in bulk wine. A U.S. wine producer sends bulk wine to Italy for bottling and ships the product to other parts of Europe from there. EU allocations for Italy are mostly spent in southern Italy, where quality wines are still rare. The Italian Trade Commission (ICE), an agency of the Ministry of Production Activities, remains the main public institution to provide export and promotion assistance in foreign markets. There is currently no specific export promotion program for wine, which is included in the general promotion programs of Italian foods and beverages. For more information, see GAIN report #IT6005.
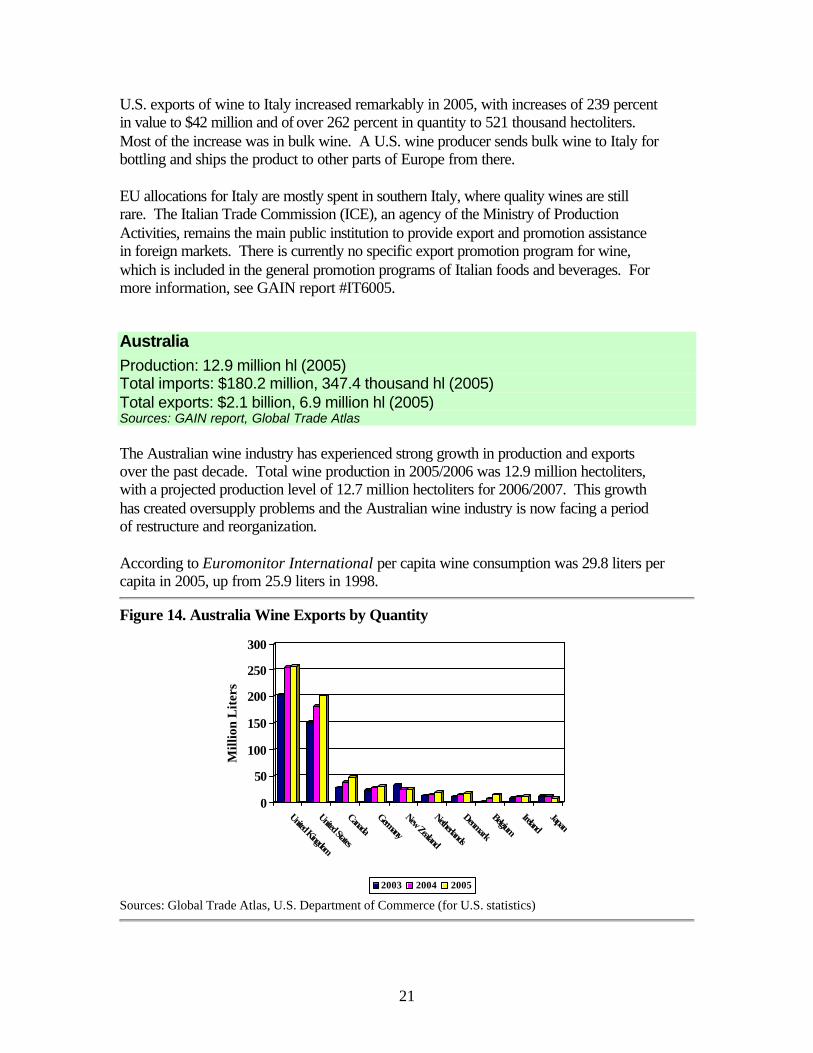
Australia Production: 12.9 million hl (2005) Total imports: $180.2 million, 347.4 thousand hl (2005) Total exports: $2.1 billion, 6.9 million hl (2005) Sources: GAIN report, Global Trade Atlas The Australian wine industry has experienced strong growth in production and exports over the past decade. Total wine production in 2005/2006 was 12.9 million hectoliters, with a projected production level of 12.7 million hectoliters for 2006/2007. This growth has created oversupply problems and the Australian wine industry is now facing a period of restructure and reorganization. According to Euromonitor International per capita wine consumption was 29.8 liters per capita in 2005, up from 25.9 liters in 1998.
Figure 14. Australia Wine Exports by Quantity
0
50
100
150
200
250
300
Mill
ion
Lit
ers
United Kingdom
United States
CanadaGermany
New Zealand
Netherlands
Denmark
BelgiumIreland
Japan
2003 2004 2005
Sources: Global Trade Atlas, U.S. Department of Commerce (for U.S. statistics)
22
According to Global Trade Atlas, Australian wine export quantities increased 7 percent in CY 2005. In terms of value, Australian wine exports increased 5.5 percent. Major destinations for Australian wine are the United Kingdom, the United States, Canada, Germany, and New Zealand. According to Global Trade Atlas, the United States represents 29 percent in quantity and 33 percent in value of Australia’s export market. The United States imported 4.5 percent more wine from Australia in value to $761 million and nearly 11 percent more in quantity to 2 million hectoliters in 2005. U.S. exports of wine to Australia increased 12 percent in value to $4.2 million and decreased 45 percent in quantity to 20.8 thousand hectoliters. Most of the value gains were in bottled wine with small increases in sparkling wine, effervescent wine, bulk wine, and cider. However, wines from the United States represent only about 2.5 percent of total Australian imports of wine by value. In 2004, the United States and Australia completed a free trade agreement. The agreement went into effect on January 1, 2005. For U.S. wine exports to Australia, all tariffs were immediately eliminated. For Australian wine imports to the United States, tariffs will be eliminated over an 11-year period. The Australian Wine Export Council (AWEC), a subsidiary of the Australian Wine and Brandy Corporation (AWBC) is the export promotion arm of the AWBC. AWEC conducts wine promotion programs in many countries and works closely with the government’s export promotion arm, Austrade. The Winemakers Federation of Australia is the main industry body representing the interests of Australia’s winemakers, representing about 90 percent of Australia’s wine production and about 98 percent of exports. There are also state and territory wine associations. For more information, see GAIN reports #AS5018 and #AS6036.
Spain Production: 33.3 million hl (2005) Total imports: $154.2 million, 472.4 thousand hl (2005) Total exports: $1.95 billion, 14.6 million hl (2005) Sources: GAIN report, Global Trade Atlas Spain’s 2005 wine vintage is currently estimated at about 33.3 million hectoliters. This decrease is due to a drought reduced grape harvest. Spain continues to have the most area under vines in the world. However, Spain’s production ranks third following France and Italy, and is more variable, since it must contend with poor rainfall and soil. The downward trend in wine consumption continues, as Spaniards are switching to beer and soft drinks. According to Euromonitor International, per capita wine consumption in Spain declined to 38.5 liters in 2005, down from 44.1 liters in 1998.
23
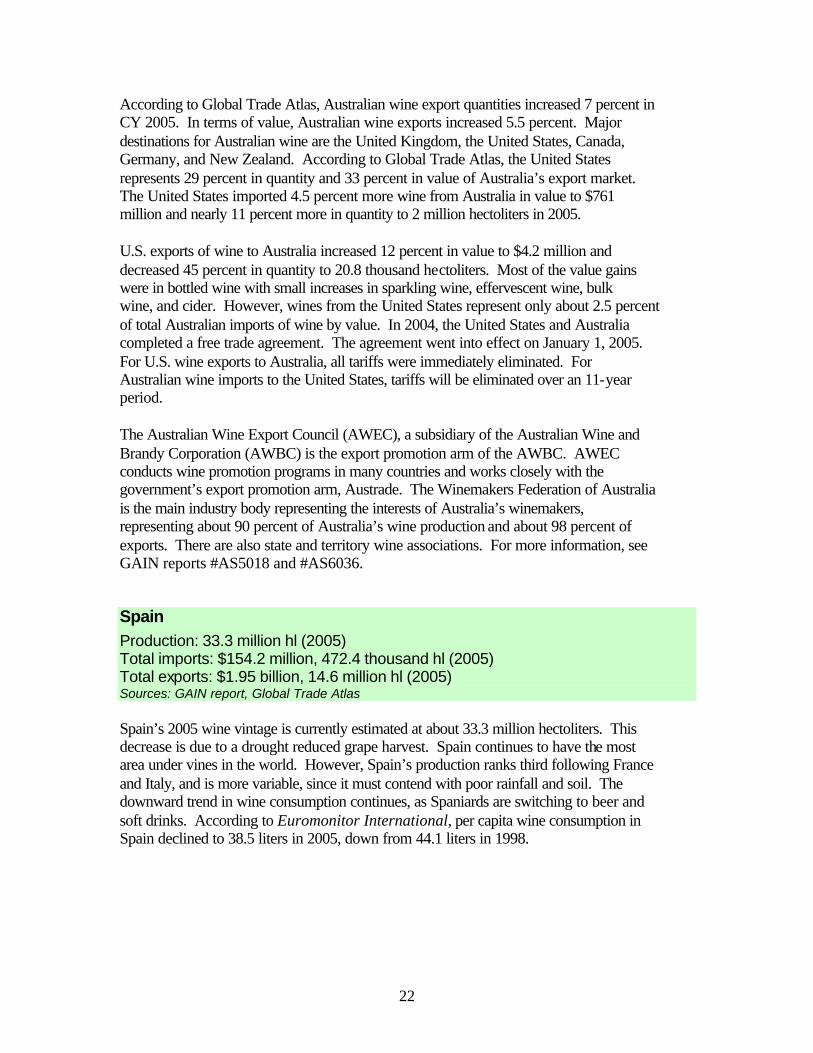
Figure 15. Spain Wine Exports by Quantity
0
50
100
150
200
250
300
350
Mill
ion
Lit
ers
FranceGermany
Portugal
United Kingdom
ItalyRussia
Netherlands
United States
Switzerland
Belgium
2003 2004 2005
Sources: Global Trade Atlas, U.S. Department of Commerce (for U.S. statistics)
According to Global Trade Atlas, Spanish wine export quantities decreased 3 percent in CY 2005. In terms of value, Spanish wine exports decreased 3 percent. Major destinations for Spanish wine are France, Germany, Portugal, Italy, and the United Kingdom. According to Global Trade Atlas, the United States represents 3 percent in quantity and 10 percent in value of Spain’s export market. According to the U.S. Department of Commerce, the 2005 import quantity of 417 thousand hectoliters was up 17 percent and import value of $211.4 million was up 14 percent over 2004. U.S. exports of wine to Spain in 2005 increased 15 percent in value to $1 million and decreased 23 percent in quantity to 2.6 thousand hectoliters. Most of the value gains were in bottled wine. However, wine from the United States represents well under 1 percent of total Spanish imports of wine. Spain should be considered only as a specialty market for U.S. wine imports. The Spanish Foreign Trade Institute (ICEX) an agency of the Ministry of Industry, Commerce, and Tourism, is responsible for diversified, government-funded foreign market promotion programs. For more information, see GAIN report #SP6006.
24
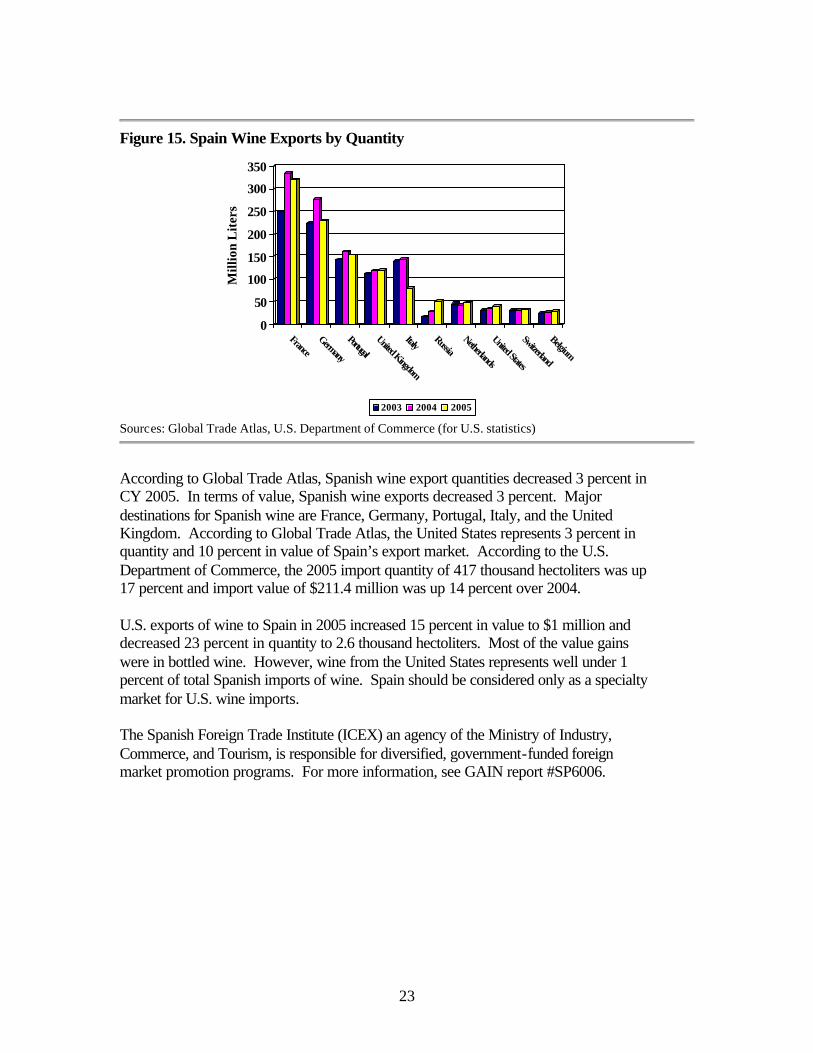
Chile Production: 8.05 million hl (2005) Total imports: $4 million, 61.7 thousand hl (2005) Total exports: $884.5 million, 4.2 million hl (2005) Sources: GAIN report, Global Trade Atlas Total wine production in Chile was 8.05 million hectoliters in 2005, with a projected production level of 8 million hectoliters for 2006. Favorable weather and new acreage coming into production has aided the increase in Chilean output for the last two years. However, the industry still produces a significant volume of wine from table grapes, as there is a shortage of white wine for the domestic market. The Chilean wine industry has expressed some concerns about the explosive increase in the planted area of wine grapes, which has increased 70 percent in the last eight years. Industry sources indicate that once new areas come into production, wineries will have to invest in new processing and storage facilities to absorb additional output. Per capita consumption of wine in Chile was 16 liters in 2003 and has been more or less stagnant for the past several years, down from the high point in 1982 of 52 liters.
Figure 16. Chile Wine Exports by Quantity
0102030405060708090
Mill
ion
Lit
ers
United Kingdom
United States
Germany
Denmark
Canada
FranceNetherlands
JapanIreland
Brazil
2003 2004 2005
Sources: Global Trade Atlas, U.S. Department of Commerce (for U.S. statistics)
Over 60 percent of Chile’s total yearly wine production is exported. In terms of value, Chile’s wine exports increased 5 percent. Major destinations for Chilean wine are the United Kingdom, the United States, Germany, Denmark, and Canada. The United States represents 13 percent in quantity and 17 percent in value of Chile’s export market. According to the U.S. Department of Commerce, the United States imported 9 percent
25
more wine from Chile for $162.7 million in value and 5 percent more in quantity for 559.7 thousand hectoliters in 2005. The United States sells a very small amount of wine to Chile. U.S. exports of wine to Chile in 2005 fell 18 percent in value to $295 thousand but rose 64 percent in quantity to 2.2 thousand hectoliters. By value, most of the U.S. product sold in Chile is bulk wine, vermouth, bottled wine, sparkling wine, and other fermented beverages. The Chilean government provides no direct subsidies to support wine production or to subsidize exports. However, Chile does have a successful market promotion campaign called “Tastes of Chile” that includes wine. Promotions are managed by an organization called “Wines of Chile” that is co-funded by both of the wine producers associations in Chile, Vinos de Chile and Chilevid. The Free Trade Agreement with the United States is expected to have only limited effect on wine export volumes to the United States as the duty of 6.3 cents per liter is scheduled to be phased-out over 12 years. For more information, see GAIN reports #CI5011 and #CI6014.
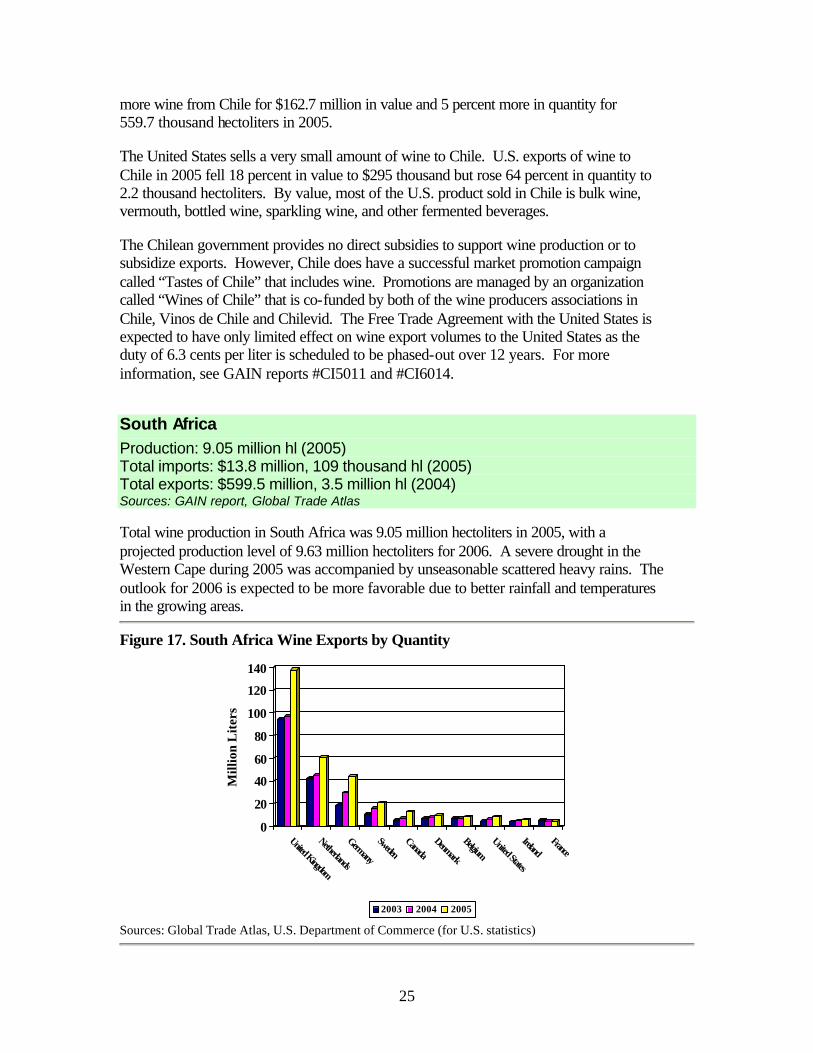
South Africa Production: 9.05 million hl (2005) Total imports: $13.8 million, 109 thousand hl (2005) Total exports: $599.5 million, 3.5 million hl (2004) Sources: GAIN report, Global Trade Atlas Total wine production in South Africa was 9.05 million hectoliters in 2005, with a projected production level of 9.63 million hectoliters for 2006. A severe drought in the Western Cape during 2005 was accompanied by unseasonable scattered heavy rains. The outlook for 2006 is expected to be more favorable due to better rainfall and temperatures in the growing areas.
Figure 17. South Africa Wine Exports by Quantity
0
20
40
60
80
100
120
140
Mill
ion
Lit
ers
United Kingdom
Netherlands
Germany
SwedenCanada
Denmark
BelgiumUnited States
IrelandFrance
2003 2004 2005
Sources: Global Trade Atlas, U.S. Department of Commerce (for U.S. statistics)
26
According to Global Trade Atlas, South African wine export quantities increased 33 percent in CY 2005. In terms of value, South African wine exports increased 11 percent. Major destinations for South African wine are the United Kingdom, the Netherlands, Germany, Sweden, and Canada. According to Global Trade Atlas, the United States represents 2.7 percent in quantity and 6 percent in value of South Africa’s export market. The United States imported 32 percent more wine from South Africa in value to $43.7 million and 31 percent more in quantity to 91.1 thousand hectoliters in 2005.
The United States sells a very small amount of wine to South Africa. U.S. exports of wine to South Africa rose in 2004, with increases of 180 percent in value to $406 thousand and of nearly 28 percent in quantity to 1.2 thousand hectoliters. By value, most of the U.S. product sold in South Africa is bottled wine, vermouth, and wine must.
South Africa benefits from a duty-free treatment for its wine exports to the United States under the African Growth and Opportunity Act (AGOA). The South African government is encouraging all private industries to include a Black Economic Empowerment (BEE) strategic plan within their sectors. The South African wine industry has adopted such a plan, the South African Wine Industry Strategy Plan (WIP). The plan was accepted by the Minister of Agriculture as the strategic framework for cooperation and action in the South African wine industry in October 2003. For more information, see GAIN reports #SF4024, #SF5023 and #SF6022.
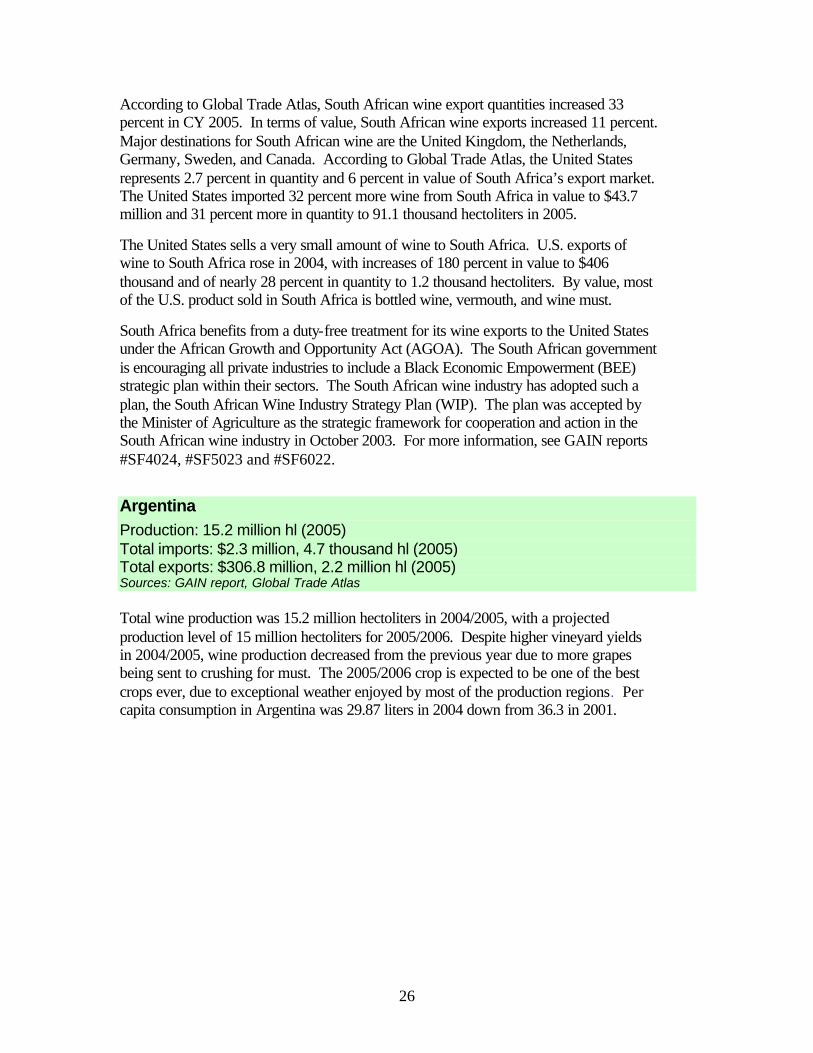
Argentina Production: 15.2 million hl (2005) Total imports: $2.3 million, 4.7 thousand hl (2005) Total exports: $306.8 million, 2.2 million hl (2005) Sources: GAIN report, Global Trade Atlas Total wine production was 15.2 million hectoliters in 2004/2005, with a projected production level of 15 million hectoliters for 2005/2006. Despite higher vineyard yields in 2004/2005, wine production decreased from the previous year due to more grapes being sent to crushing for must. The 2005/2006 crop is expected to be one of the best crops ever, due to exceptional weather enjoyed by most of the production regions. Per capita consumption in Argentina was 29.87 liters in 2004 down from 36.3 in 2001.
27
Figure 18. Argentina Wine Exports by Quantity
0
5
10
15
20
25
30
35
Mill
ion
Lit
ers
United States
Paraguay
United Kingdom
RussiaCanada
BrazilJapan
Netherlands
2003 2004 2005
Sources: Global Trade Atlas, U.S. Department of Commerce (for U.S. statistics)
According to Global Trade Atlas, Argentina’s wine export quantities increased 33 percent in CY 2005. In terms of value, Argentina’s wine exports increased 33 percent. Major destinations for Argentine wine are the United States, Paraguay, United Kingdom, Russia, and Canada. According to Global Trade Atlas, the United States represents 14 percent in quantity and 20 percent in value of Argentina’s export market. The United States imported 41 percent more wine from Argentina in value to $66.8 million and 26 percent more in quantity for 279 thousand hectoliters in 2004. The United States sells a very small amount of wine to Argentina. Imports are discouraged by the devalued currency. U.S. exports of wine to Argentina rose in 2005, with increases of 100 percent in value to $551 thousand and of over 1,600 percent in quantity to 1.6 thousand hectoliters. Most of the U.S. product sold in Argentina is bottled wine and sparkling wine. The Argentine Government passed Law No. 25849, which created the Strategic Plan for Argentine Wine 2020 (Plan Estratégico Vitivinícola 2002 – PEVI). The goal of this program is to reach sales of $2 billion and an international market share of 10 percent by CY 2020. Article 3 of this law establishes the creation of an agency that will be in charge of promoting consumption of Argentine wine locally and internationally. This new agency is called the Argentine Wine Corporation (Corporación Vitivinícola Argentina – COVIAR). This year, COVIAR began operations. For more information, see GAIN reports #AR5019 and #AR6021.
28
Appendix
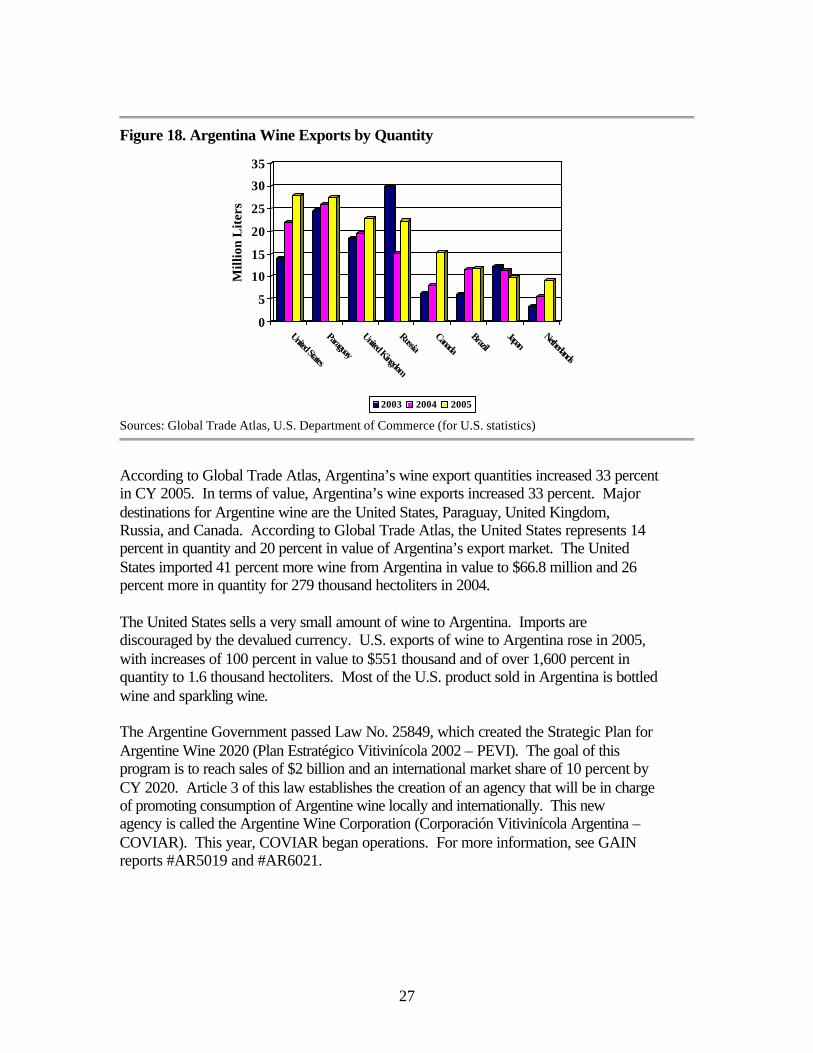
Additional Information Harmonized System (HS) codes are used for tracking imports and exports. The industry consensus is that wine products include three categories when described by the 4-digit and seven categories when described by the 6-digit HS Code. HS 4 HS 4 description HS 6 HS 6 description
220410 Grape wines, sparkling
220421 Grape wines, nes8, fortified wine or must, pack<2L
220429 Grape wines, alcoholic grape must nes 2204 Grape wines 220430 Grape must, unfermented, except as fruit juice
220510 Vermouth and other flavored grape wines - pack<2L
2205 Vermouth/grape wines 220590
Vermouth and other flavored grape wines – pack>2L
2206 Fermented beverages 220600 Fermented beverages nes (e.g. cider, perry, mead)
http://www.census.gov/foreign-trade/schedules/b/ For a complete selection of FAS worldwide reporting, visit http://www.fas.usda.gov. Regular wine reports are published on Argentina, Australia, Chile, South Africa, France, Germany, Italy, Japan, Mexico, Spain, Sweden, and the United Kingdom. Periodic worldwide voluntary reports are also available, in the last two years from Costa Rica, Brazil, Colombia, South China and Shanghai, Russian Federation, Thailand, Korea, the Czech Republic, Turkey, Hungary, Croatia, Bosnia & Herzegovina and Poland. For information on U.S. imports and exports, please visit our trade database online at http://www.fas.gov/ustrade. For country and regional tariff and tax information, please refer to http://www.ita.doc.gov/td/tic/tariff/country_tariff.htm. For information on production and trade, contact Dorsey Luchok at 202-720-3083. For information on marketing, contact Don Washington at 202-720-1533. Check out the wine webpage at http://www.fas.usda.gov/agx/processed/Wine/wine.html.
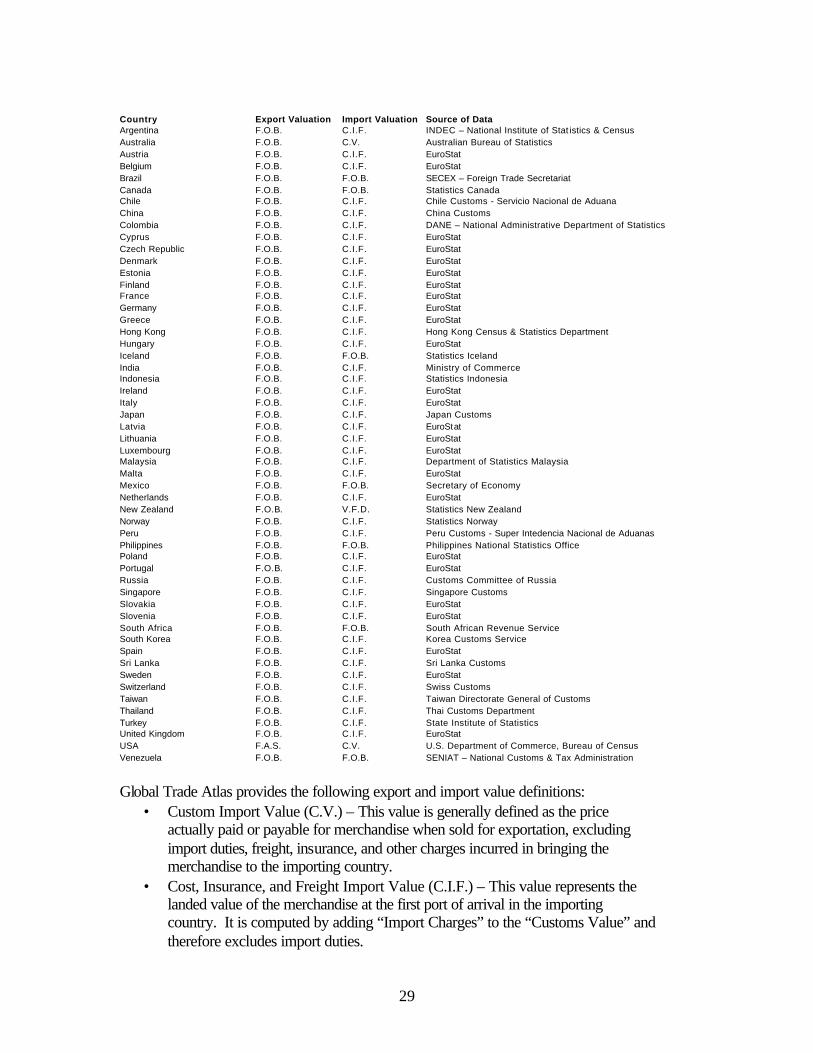
Country Export and Import Valuation Explanation Countries use different export and import valuations, depending on the source of data. These differences partially explain why the valuation of trade depends on the analysis perspective. 8 “nes” stands for “not elsewhere specified.”
29
Country Export Valuation Import Valuation Source of Data Argentina F.O.B. C.I.F. INDEC – National Institute of Stat istics & Census Australia F.O.B. C.V. Australian Bureau of Statistics Austria F.O.B. C.I.F. EuroStat Belgium F.O.B. C.I.F. EuroStat Brazil F.O.B. F.O.B. SECEX – Foreign Trade Secretariat Canada F.O.B. F.O.B. Statistics Canada Chile F.O.B. C.I.F. Chile Customs - Servicio Nacional de Aduana China F.O.B. C.I.F. China Customs Colombia F.O.B. C.I.F. DANE – National Administrative Department of Statistics Cyprus F.O.B. C.I.F. EuroStat Czech Republic F.O.B. C.I.F. EuroStat Denmark F.O.B. C.I.F. EuroStat Estonia F.O.B. C.I.F. EuroStat Finland F.O.B. C.I.F. EuroStat France F.O.B. C.I.F. EuroStat Germany F.O.B. C.I.F. EuroStat Greece F.O.B. C.I.F. EuroStat Hong Kong F.O.B. C.I.F. Hong Kong Census & Statistics Department Hungary F.O.B. C.I.F. EuroStat Iceland F.O.B. F.O.B. Statistics Iceland India F.O.B. C.I.F. Ministry of Commerce Indonesia F.O.B. C.I.F. Statistics Indonesia Ireland F.O.B. C.I.F. EuroStat Italy F.O.B. C.I.F. EuroStat Japan F.O.B. C.I.F. Japan Customs Latvia F.O.B. C.I.F. EuroStat Lithuania F.O.B. C.I.F. EuroStat Luxembourg F.O.B. C.I.F. EuroStat Malaysia F.O.B. C.I.F. Department of Statistics Malaysia Malta F.O.B. C.I.F. EuroStat Mexico F.O.B. F.O.B. Secretary of Economy Netherlands F.O.B. C.I.F. EuroStat New Zealand F.O.B. V.F.D. Statistics New Zealand Norway F.O.B. C.I.F. Statistics Norway Peru F.O.B. C.I.F. Peru Customs - Super Intedencia Nacional de Aduanas Philippines F.O.B. F.O.B. Philippines National Statistics Office Poland F.O.B. C.I.F. EuroStat Portugal F.O.B. C.I.F. EuroStat Russia F.O.B. C.I.F. Customs Committee of Russia Singapore F.O.B. C.I.F. Singapore Customs Slovakia F.O.B. C.I.F. EuroStat Slovenia F.O.B. C.I.F. EuroStat South Africa F.O.B. F.O.B. South African Revenue Service South Korea F.O.B. C.I.F. Korea Customs Service Spain F.O.B. C.I.F. EuroStat Sri Lanka F.O.B. C.I.F. Sri Lanka Customs Sweden F.O.B. C.I.F. EuroStat Switzerland F.O.B. C.I.F. Swiss Customs Taiwan F.O.B. C.I.F. Taiwan Directorate General of Customs Thailand F.O.B. C.I.F. Thai Customs Department Turkey F.O.B. C.I.F. State Institute of Statistics United Kingdom F.O.B. C.I.F. EuroStat USA F.A.S. C.V. U.S. Department of Commerce, Bureau of Census Venezuela F.O.B. F.O.B. SENIAT – National Customs & Tax Administration
Global Trade Atlas provides the following export and import value definitions:
• Custom Import Value (C.V.) – This value is generally defined as the price actually paid or payable for merchandise when sold for exportation, excluding import duties, freight, insurance, and other charges incurred in bringing the merchandise to the importing country.
• Cost, Insurance, and Freight Import Value (C.I.F.) – This value represents the landed value of the merchandise at the first port of arrival in the importing country. It is computed by adding “Import Charges” to the “Customs Value” and therefore excludes import duties.
30
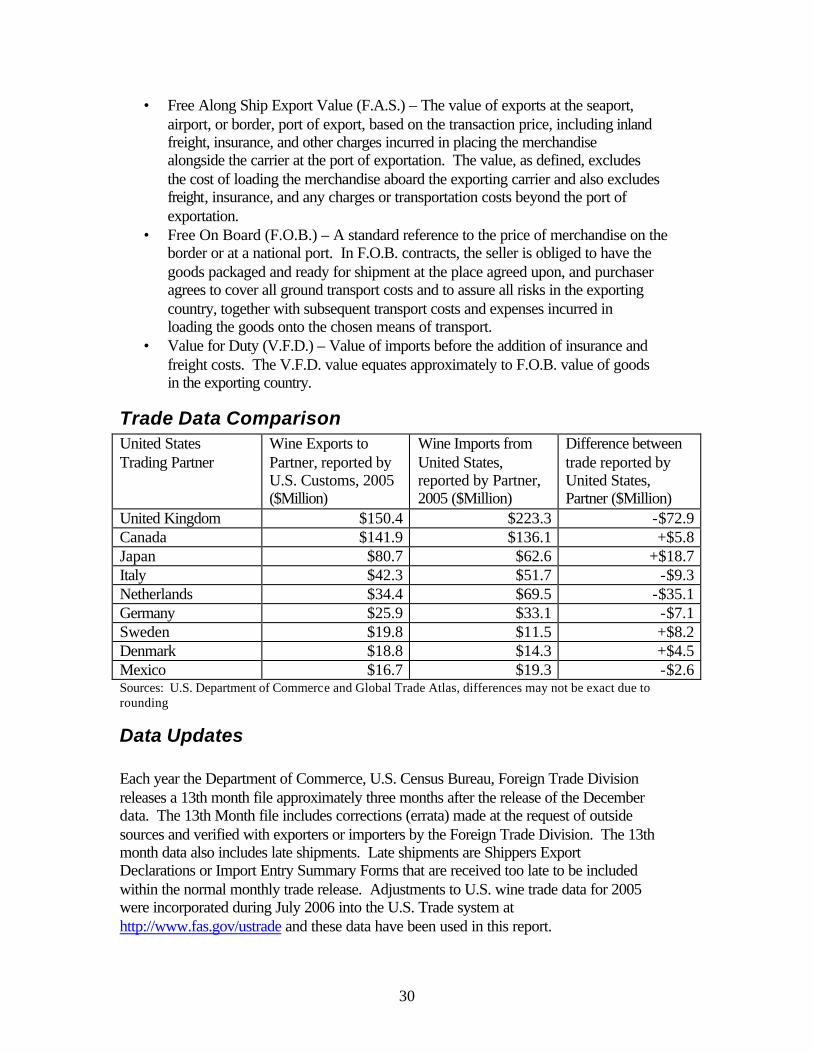
• Free Along Ship Export Value (F.A.S.) – The value of exports at the seaport, airport, or border, port of export, based on the transaction price, including inland freight, insurance, and other charges incurred in placing the merchandise alongside the carrier at the port of exportation. The value, as defined, excludes the cost of loading the merchandise aboard the exporting carrier and also excludes freight, insurance, and any charges or transportation costs beyond the port of exportation.
• Free On Board (F.O.B.) – A standard reference to the price of merchandise on the border or at a national port. In F.O.B. contracts, the seller is obliged to have the goods packaged and ready for shipment at the place agreed upon, and purchaser agrees to cover all ground transport costs and to assure all risks in the exporting country, together with subsequent transport costs and expenses incurred in loading the goods onto the chosen means of transport.
• Value for Duty (V.F.D.) – Value of imports before the addition of insurance and freight costs. The V.F.D. value equates approximately to F.O.B. value of goods in the exporting country.
Trade Data Comparison United States Trading Partner
Wine Exports to Partner, reported by U.S. Customs, 2005 ($Million)
Wine Imports from United States, reported by Partner, 2005 ($Million)
Difference between trade reported by United States, Partner ($Million)
United Kingdom $150.4 $223.3 -$72.9 Canada $141.9 $136.1 +$5.8 Japan $80.7 $62.6 +$18.7 Italy $42.3 $51.7 -$9.3 Netherlands $34.4 $69.5 -$35.1 Germany $25.9 $33.1 -$7.1 Sweden $19.8 $11.5 +$8.2 Denmark $18.8 $14.3 +$4.5 Mexico $16.7 $19.3 -$2.6 Sources: U.S. Department of Commerce and Global Trade Atlas, differences may not be exact due to rounding
Data Updates Each year the Department of Commerce, U.S. Census Bureau, Foreign Trade Division releases a 13th month file approximately three months after the release of the December data. The 13th Month file includes corrections (errata) made at the request of outside sources and verified with exporters or importers by the Foreign Trade Division. The 13th month data also includes late shipments. Late shipments are Shippers Export Declarations or Import Entry Summary Forms that are received too late to be included within the normal monthly trade release. Adjustments to U.S. wine trade data for 2005 were incorporated during July 2006 into the U.S. Trade system at http://www.fas.gov/ustrade and these data have been used in this report.
31
Sources • USDA FAS GAIN Reports (and other communications with the FAS Posts)
http://www.fas.usda.gov/scriptsw/attacherep/default.asp • USDA National Agricultural Statistics Service
http://www.usda.gov/nass/ • Office of the United States Trade Representative
http://www.ustr.gov • California Agricultural Statistics Service
http://www.nass.usda.gov/ca/ • U.S. Trade Database
http://www.fas.usda.gov/ustrade/ • Global Trade Atlas
http://www.gtis.com/gta/ • Euromonitor International
http://www.euromonitor.com • The Wine Institute
http://www.wineinstitute.org • The New York Wine and Grape Foundation
http://www.newyorkwines.org • The Northwest Wine Coalition
http://www.northwestwine.org • Oregon Wine Board
http://www.oregonwine.org • Canadian Vintners Association
http://www.canadianvintners.com • European Commission Report on the Wine Sector
http://ec.europa.eu/comm/agriculture/markets/wine/facts/situation.pdf