united states catfish 2010 agriculture animal and plant health · from catfish 2003 to catfish...
TRANSCRIPT

United StatesDepartment ofAgriculture
Animal andPlant HealthInspection Service
VeterinaryServices
NationalAnimal HealthMonitoringSystem
December 2011
Catfish 2010Part III: Changes in Catfish Health andProduction Practices in the United States,2002–09

The U.S. Department of Agriculture (USDA) prohibits
discrimination in all its programs and activities on the
basis of race, color, national origin, age, disability, and
where applicable, sex, marital status, familial status,
parental status, religion, sexual orientation, genetic
information, political beliefs, reprisal, or because all or
part of an individual’s income is derived from any public
assistance program. (Not all prohibited bases apply to
all programs.) Persons with disabilities who require
alternative means for communication of program
information (Braille, large print, audiotape, etc.) should
contact USDA’s TARGET Center at (202) 720-2600
(voice and TDD).
To file a complaint of discrimination, write to USDA
Director, Office of Civil Rights, 1400 Independence
Avenue, S.W., Washington, D.C. 20250-9410, or call
(800) 795-3272 (voice) or (202) 720-6382 (TDD).
USDA is an equal opportunity provider and employer.
Mention of companies or commercial products does not imply recommendation or endorsement by the USDA over others not mentioned. USDA neither guarantees nor warrants the standard of any product mentioned. Product names are mentioned solely to report factually on available data and to provide specific information.
USDA–APHIS–VS, CEAH
NRRC Building B, M.S. 2E7
2150 Centre Avenue
Fort Collins, CO 80526-8117
(970) 494-7000
Email: [email protected]
http://www.aphis.usda.gov/nahms
#597.1212
Cover photograph courtesy of Stephen Ausmus,Agricultural Research Service

USDA APHIS VS / i
Items of Note
In general, it appeared that two factors might have had an overarching influence on many
of the differences between Catfish 2003 and Catfish 2010, and these two factors are likely
related to each other. The first factor is changes in the demographics of catfish
operations; the total number of catfish operations decreased from 1,161 on January 1,
2003, to 994 on January 1, 2010 (source: NASS Catfish Production reports). Additionally,
the water surface acres used for production decreased from 187,200 for the period
January 1 through June 30, 2003, to 115,100 for the same 6-month time frame in 2010.
Based on these numbers, the calculated average surface acres per operation decreased
from 161.2 acres in 2003 to 115.8 acres in 2010, which might indicate that a number of
smaller operations joined the industry, a number of larger operations left the industry,
and/or some operations decreased in size. The second factor that appears to have had a
global effect on production practices is the business climate for the catfish industry,
including the weak economy, which has made it more difficult for producers to obtain
credit, and increased competition from foreign producers. Data suggest that some
producers made changes in production practices to save costs for their operations, while
other producers chose or were forced to to leave the industry.
Catfish Production Phases
From Catfish 2003 to Catfish 2010, the percentage of operations in production declined
for three of the four production phases (p 7). The percentages of operations that bred
catfish, operated a hatchery, or raised fry to fingerlings declined, while the percentage of
operations that grew out foodsize fish did not change. For Catfish 2010, less than
13 percent of operations bred catfish, operated a hatchery, or raised fry to fingerlings,
while more than 94 percent of operations grew out foodsize fish.
Breeding
As noted, the percentage of operations that bred catfish declined, from 14.2 percent of
operations for Catfish 2003 to 8.8 percent of operations for Catfish 2010 (p 10). Part of
this decline might result from a change in the definition of a breeding operation; for Catfish
2003, a breeding operation was one that bred catfish for egg production, whereas for
Catfish 2010, a breeding operation was one that bred catfish for egg collection. Some
operations that bred catfish but did not collect the eggs might not have been counted as
breeding operations for Catfish 2010. The percentages of operations with broodfish lines
of blue catfish and pond-run catfish increased between studies, while the percentages of
operations with most other broodfish lines decreased. The increase in blue catfish is likely
related to increased production of channel x blue hybrid catfish (p 11). Other trends for
breeding operations include the following.

ii / Catfish 2010
• The percentage of operations that stocked broodfish at a density of 1,200 lb/acre or
higher increased from 26.9 percent to 35.1 percent, and the percentage of broodfish
stocked at this rate increased from 41.6 percent to 67.0 percent. Maximum
recommended broodfish stocking densities are about 1,200 lb/acre; the large
percentage of fish stocked at this density or higher might be related to the increase in
fighting.
Hatchery
As noted, the percentage of operations that operated a hatchery declined between
studies. From Catfish 2003 to Catfish 2010, the percentage of operations that had more
than 75 percent of eggs survive until hatching declined from 76.0 percent of operations for
Catfish 2003 to 55.2 percent for Catfish 2010. Accordingly, the percentage of operations
that had less than 75 percent of eggs survive until hatching increased from 24.0 percent
to 44.8 percent, and, while no Catfish 2003 operations lost more than 50 percent of eggs,
10.3 percent of Catfish 2010 operations lost more than 50 percent of eggs. The decrease
in the percentage of eggs surviving until hatching might reflect increased production of
channel x blue hybrids or changes in management factors, such as reduced treatment of
eggs for fungal or bacterial diseases (p 28) and reduced turning of egg masses (page 34).
Fry/Fingerling
As noted, the percentage of operations that raised fry to fingerlings declined by more than
half, from 29.9 percent of operations for Catfish 2003 to 12.8 percent for Catfish 2010.
Trend data suggest that smaller operations stopped raising fry/fingerlings or expanded
their operations to achieve economies of scale. Between studies, the average number of
fry/fingerling ponds on operations increased (from 10.3 to 15.6), the average pond size
increased (from 7.6 to 8.7 surface acres), and the average total surface acres increased
(from 77.0 to 136.5). Additionally, the percentage of operations with 1 to 2 ponds
decreased from 28.2 percent of operations to 21.1 percent of operations, while the
percentage of operations with 11 or more fry/fingerling ponds increased from 23.3 percent
34.7 percent of operations. Other trends for fry/fingerling operations include the following.
• The percentage of ponds with a stocking rate of 200,000 or more fry per acre increased
from 12.7 percent of ponds for Catfish 2003 to 27.5 percent of ponds for Catfish 2010
(p 60).

USDA APHIS VS / iii
• Overall, the protein level of floating feed primarily fed to fry decreased between
studies. The percentage of operations primarily providing feed with 35 percent
protein declined, while the percentage of operations primarily feeding 28 or 32
percent protein increased (p 65).
• The percentage of operations vaccinating any fry against ESC declined between
the two studies, from 11.4 percent of operations to 3.9 percent (p 71).
• The percentage of operations feeding medicated feed to fry/fingerlings was similar
for the two studies, but there was a shift in the medicated feed used. Aquaflor®,
which was not yet on the market during the Catfish 2003 study, was used by a
higher percentage of Catfish 2010 operations than Terramycin® or Romet®
(p 80).
• The percentage of operations that had a snail problem in any fry/fingerling ponds in
the year prior to the study increased from about 11.6 percent of operations to 23.1
percent. The percentage of operations using any measures to control snails
decreased from 26.8 percent to 19.2 percent (p 82).
Foodsize Fish
The percentage of operations that had some channel x blue hybrid catfish present on
January 1 of the study year increased from 2.1 percent of operations for Catfish 2003 to
21.2 percent for Catfish 2010. Unspecified channel catfish remained the line with the
highest percentage of foodsize fish present, however, increasing from 64.4 percent of
foodsize fish for Catfish 2003 to 85.8 percent for Catfish 2010.
• The percentage of operations that purchased fry for stocking from another source
decreased from 17.5 to 9.6 percent, while the operation average percentage of
fish stocked that were fry purchased from another source also decreased, from
15.2 percent of fish stocked to 7.4 percent. These data agree with a trend toward
stocking larger fish; for Catfish 2010, the highest operation average percentage of
fish stocked in growout ponds was fish more than 8 inches long (56.6 percent),
compared with fish 6 to 8 inches long for Catfish 2003 (63.7 percent) (p 88).
• For growout ponds for foodsize fish, the number of ponds, total surface acres, or
average size of ponds did not change substantially between studies (page 68).

iv / Catfish 2010
• Catfish 2010 operations waited longer between pond drainings or renovations,
which might be a cost-savings measure. The operation average number of years
between pond draining increased from 9.1 to 11.7 years between studies, and the
operation average number of years between complete renovations increased from
11.0 to 14.0 years (p 102).
• The percentage of foodsize-fish operations using automated sensors to monitor
dissolved oxygen increased from 17.2 percent for Catfish 2003 to 40.9 percent for
Catfish 2010, while the percentage of operations using handheld monitors
decreased, from 75.1 to 48.9 percent (p 103).
• Changes occurred in several aspects of feeding practices. The average tons of
feed fed to foodsize fish per operation per acre increased from 4.3 to 5.5 between
studies, and the predominant feed changed from 32 to 28 percent protein.
Additionally, the percentage of operations feeding an average of zero days per
week during winter increased from 30.1 percent of operations for Catfish 2003 to
56.8 percent of operations for Catfish 2010. This change might be related to cost
savings; recent research has indicated that feeding fish during the winter can help
fish maintain condition and body weight (p 123).
• The percentage of operations that lost any foodsize fish to bacterial diseases
declined from Catfish 2003 to Catfish 2010 (p 129).
• The percentage of operations that fed medicated feed to foodsize fish decreased
between studies (from 11.0 to 8.2 percent), but the operation average tons of
medicated feed fed increased, with those Catfish 2010 operations that fed
medicated feed feeding an average of 22.3 tons of Aquaflor® (p 137).
• The percentage of operations that experienced harvest delays because of off-
flavor problems increased from 69.6 percent for Catfish 2003 to 80.7 percent for
Catfish 2010. Although the overall percentage of ponds that experienced delays
was similar for the two studies, the percentage of ponds with 20 to 49 surface
acres that experienced delays increased between studies (p 144).

USDA APHIS VS / v
Acknowledgments
This report was a cooperative effort between two U.S. Department of Agriculture (USDA)
agencies: the National Agricultural Statistics Service (NASS) and the Animal and Plant
Health Inspection Service (APHIS).
Thanks to the NASS enumerators who contacted catfish producers and collected the
data. Their hard work and dedication were invaluable. Thanks also to the personnel at the
USDA–APHIS–Veterinary Services’ Centers for Epidemiology and Animal Health for their
efforts in generating and distributing this report.
All participants are to be commended, particularly the producers whose voluntary efforts
made the Catfish 2010 study possible.
Larry M. Granger
Director
Centers for Epidemiology and Animal Health

vi / Catfish 2010
Suggested bibliographic citation for this report:
USDA. 2010. Catfish 2010 Part III: “Changes in Catfish Health and Production Practices in the United States, 2002–09”. USDA–APHIS–VS–CEAH–NAHMS. Fort Collins, CO.
#597.1111
Contacts for further information:
Questions or comments on data analysis: Dr. Bruce Wagner (970) 494-7000
Information on reprints or other reports: Ms. Abby Zehr (970) 494-7000
Email: [email protected]

USDA APHIS VS / vii
Table of Contents
Introduction 1
Study Objectives and Related Outputs 3
Terms Used in This Report 4
Section I: Population Estimates, Fry and Fingerling Catfish 9
A. General Operation Trends 91. Changes in operation demographics 9
2. Distribution of catfish production phases 9
B. Broodfish Management 111. Broodfish lines 11
2. Broodfish by age 12
3. Annual cycle rate (cull rate) of broodfish 13
4. Reasons for culling 14
5. Broodfish loss 16
6. Seasonal feeding practices 18
7. Protein level of feed 19
8. Additional species stocked 20
C. Spawning Management: Ponds and Broodfish 211. Number of spawning ponds 21
2. Draining and renovation of spawning ponds 22
3. Broodfish stocking densities 24
4. Female-to-male ratio in spawning ponds 25
D. Hatchery Management 261. Operations that operated a hatchery 26
2. Average number of egg masses and pounds of eggs 27
3. Egg mass treatment and placement in hatchery 28
4. Hatchery water management 28
5. Density of egg masses in hatching troughs 32
6. Turning of egg masses 34
E. Egg Health Issues 361. Survival of eggs until hatching 36
2. Causes of egg loss 38
3. Fungal/bacterial prevention and treatment 40

viii / Catfish 2010
F. Fry Management 441. Number of fry hatched 44
2. Length of time fry left in fry troughs 44
3. Primary feed in fry troughs 46
4. Number of feedings per day for fry 47
5. Water circulation in fry troughs 48
6. Fry trough disinfection 49
7. Raising of fry to fingerlings 49
G. Management of Fry/Fingerling Ponds Prior to Stocking 501. Placement of fry in raceways or tanks prior to stocking 50
2. Number and size of fry/fingerling ponds 51
3. Treatment of fry/fingerling ponds before stocking 53
4. Number of days between filling of ponds and stocking 55
5. Number of years between complete renovations of fry/fingerling ponds 56
6. Fertilization of fry/fingerling ponds 57
7. Chloride level 58
8. Salt use 59
H. Management of Fry/Fingerling Ponds after Stocking 601. Fry stocked in years preceding the study 60
2. Fry stocking rates 60
3. Fry feed type 62
4. Fry feeding frequency 63
5. Protein level of feed 65
6. Primary method for monitoring dissolved oxygen 67
7. Horsepower of fixed aeration 68
8. Water quality testing 68
I. Fingerling Health Issues 711. Vaccination for enteric septicemia of catfish (ESC) 71
2. Average age of fry at ESC vaccination 72
3. ESC vaccination of fry intended for on-farm growout 72
4. ESC vaccination of fry intended for sale as fingerlings 73
5. Survival of stocked fry until harvest 74
6. Causes of fingerling loss 74
7. Primary treatment for ESC outbreaks 78
8. Diagnostic laboratory testing 79
9. Use of medicated feed 80
10. Snail control 81

USDA APHIS VS / ix
Section II: Population Estimates, Foodsize Catfish 83
A. Inventory Characteristics 831. Genetic lines 83
2. Selection criteria for fingerlings or stockers 85
B. Stocking Practices 861. Stocking density 86
2. Sources of fish 87
3. Sizes of fish stocked 88
4. Types of ponds stocked 90
5. Additional species stocked 92
C. Characteristics of Growout Ponds 931. Pond size 93
2. Water source 97
3. Pond water depth 98
D. Management of Production Ponds 1001. Levee management 100
2. Draining and renovation 100
3. Water-level management 102
4. Monitoring of dissolved oxygen 103
5. Horsepower of fixed aeration 104
6. Emergency aerators 105
E. Water Quality and Treatments 1061. Chloride level 106
2. Salt use 106
3. Alkalinity 107
4. Water quality testing 109
5. Algae management 112
6. Snail control 117
F. FeedingPractices 1181. Tons of feed fed 118
2. Feed conversion ratio 118
3. Protein in feed 119
4. Seasonal feeding practices 121
5. Maximum feed fed to foodsize-fish 124

G. Vaccination for enteric septicemia of catfish (ESC) 1261. ESC-vaccinated fish stocked 126
2. Vaccination of fish to be stocked during the year of the study 126
H. Foodsize-fish Health Issues 1281. Causes of foodsize-fish loss 128
2. Fish health problems related to algal toxins 136
3. Use of medicated feed 136
4. Diagnostic laboratory testing 138
I. Harvesting Practices 1411. Pounds of fish harvested 141
2. Ponds harvested 141
3. Production method 142
4. Primary harvesters 143
J. Management of Off-flavor Issues 1441. Delayed harvest 144
2. Duration of off-flavor episodes 144
3. Treatment of harvest-delayed ponds 146
1. Record-keeping practices 147
K. General 1471. Record-keeping practices 147
Appendix I: Sample Profile 148
A. Responding Operations 1481. Responding operations by pond size 148
2. Responding operations by region 148
3. Responding operations by State 148
4. Responding operations by operation type 149
Appendix II: U.S. Catfish Acreage Inventory and Operations 150
A. Regional Summary for 2003 150
B. Regional Summary for 2010 151
C. Number of Operations and Water Surface Acres used for Production,2003–11 152
D. Number of Water Surface Acres used for Production by Operations in theFour Study States, 2003 and 2010 152

USDA APHIS VS / 1
Introduction
Introduction
Through its periodic national studies of animal health and management practices in the
food-animal industries, the U.S. Department of Agriculture’s (USDA) National Animal
Health Monitoring System (NAHMS) is able to describe changes in animal health and
management over time. With both current and trend information, stakeholders can identify
opportunities for improving health and management practices, reevaluate priorities for
research and special studies, and detect emerging problems.
Catfish 2010 is NAHMS’ third study of health and production management practices on
U.S. catfish operations. The previous studies were Catfish ’97 and Catfish 2003. NAHMS,
a nonregulatory program of the USDA Animal and Plant Health Inspection Service
(APHIS), is designed to help meet the Nation’s animal-health information needs.
This report is the third in a series from Catfish 2010 and focuses primarily on the changes
in practices over time, specifically comparing results from Catfish 2003 with those from
Catfish 2010 (results from Catfish ’97 have not been used in comparisons because of
differences in coverage, question wording, and structure). Sections I and II of this report
provide national estimates of animal health and management practices from the two
studies and describe changes in the U.S. catfish industry from 2003 to 2010.
Section III shows demographic changes of the U.S. catfish industry from data provided by
the National Agricultural Statistics Service (NASS) and the Census of Agriculture.
For both Catfish 2003 and Catfish 2010, representatives from NASS and APHIS
Veterinary Services queried catfish producers in four participating States: Alabama,
Arkansas, Louisiana, and Mississippi. In January 2003 and 2010, NASS enumerators
administered a questionnaire—either by phone or through a personal visit—to all known
catfish producers in the four participating States. Data presented in Catfish 2003 and
Catfish 2010 publications are based on data collected from these producers during this
one collection period.
The major publications from Catfish 2010 are described below:
• Part I: Reference of Catfish Health and Production Practices in the United States,
2009—focuses on aspects of disease and production of catfish fingerlings;
• Part II: Health and Production Practices for Foodsize Catfish in the United States,
2009—focuses on aspects of disease and production of foodsize fish;
• Part III: Changes in Catfish Health and Production Practices in the United States,
2002–09—trends.
The methodology used in Catfish 2010 is documented in the last section of each report.

2 / Catfish 2010
Introduction
Many factors could influence changes in estimates from Catfish 2003 to Catfish 2010. Differences could reflect true changes in the health and management practices of operations, as well as changes in the composition of the target population, revisions of wording on questionnaires (usually done only to resolve a problem with a question or to update material), and/or random variation. Differences in the composition of the target population and in questionnaire wording are documented in each summary table to aid in interpretation.
Further information on NAHMS studies and copies of reports are available at
http://www.aphis.usda.gov/nahms
For questions about this report or additional copies, please contact
USDA–APHIS–VS–CEAH
NRRC Building B., M.S. 2E7
2150 Centre Avenue
Fort Collins, CO 80526-8117
970.494.7000

USDA APHIS VS / 3
Introduction
1. Investigate foodsize-fish production practices
• Part II: Health and Production Practices for Foodsize Catfish in the United States, 2009,
July 2011
• Part III: Changes in Catfish Health and Production Practices in the United States, 2002–
09, December 2011
2. Describe fingerling production practices
• Part I: Reference of Catfish Health and Production Practices in the United States, 2009,
December 2010
• Part III: Changes in Catfish Health and Production Practices in the United States, 2002–
09, December 2011
3. Address a broad range of fish health issues
• Part I: Reference of Catfish Health and Production Practices in the United States, 2009,
December 2010
• Part III: Changes in Catfish Health and Production Practices in the United States, 2002–
09, December 2011
4. Quantify the magnitude of the problem of off-flavor
• Info sheet, August 2011
Study Objectives and Related Outputs

4 / Catfish 2010
Introduction
Terms Used inThis Report
Agitator: A vertical paddle that spins to aerate water in a small area (1/10 horsepower
electric motor with a blade attached).
Air stones: Porous stones attached to an air source to create air bubbles.
Algal toxins: Algae-produced chemicals that can kill fish.
Alkalinity: The quality in water that neutralizes acids, especially calcium sulfate or
bicarbonate, measured in mg/L CaCO3, and usually expressed as ppm.
Bacterial infection: Sometimes called bacterial egg rot. It often occurs when egg masses
contain large numbers of infertile eggs or when egg hatching baskets are crowded,
reducing water circulation. The condition is often recognized when egg masses begin to
fall apart prematurely, before embryos develop eye spots. Infected egg masses also will
feel slimy, which occurs when bacteria destroy the egg shell. If the problem progresses,
prematurely hatched embryos without eye spots often will be found on the trough bottom.
Breeding operation: For 2003 study, an operation that bred catfish for egg production.
For 2010 study, an operation that bred catfish for egg collection in 2009. The definition
was made more specific for Catfish 2010 to exclude those operations that might have
allowed natural breeding in ponds but did not pursue active management of breeding for
production goals (such as some fee-fishing operations).
Broodfish: Adult catfish (male and female) intended for use in spawning.
Channel x blue hybrid catfish: First-generation offspring from an artificial mating of a
female channel catfish and a male blue catfish.
Degassing: The process of removing excess gas (particularly nitrogen) from water.
Egg mass: Eggs from a single female catfish, naturally held together by a gelatinous
substance. Egg masses are sometimes referred to as spawns.
ESC: Enteric septicemia of catfish, an economically important bacterial disease of catfish;
also known as hole-in-head disease.
Fingerling: This study defined fingerling fish according to the National Agricultural
Statistics Service’s weight-based size category of 2 to 60 pounds per 1,000 fish.
Typically, fish considered to be fingerlings and falling into this weight-based category
would be about 1 to 8 inches long.

USDA APHIS VS / 5
Introduction
Foodsize fish: Fish of marketable size, generally more than 10 inches long and up to
3 pounds in weight.
Fry: Newly hatched fish less than 1 inch long.
Fungal infection: Fungus growth on infertile or dead eggs that occurs when water
temperature is below 78°F. Appears as a white or brown cottonlike growth.
Growout: The process of raising fingerlings to harvest size (generally 1.3 to 3.0 pounds).
Growout pond: Typically, pond in which fingerlings are stocked and allowed to grow until
they attain harvest size.
Hardness: The quality in water that is imparted by the presence of dissolved chemical
compounds, especially of calcium or magnesium, often expressed as ppm.
Hatchery: Portion of operation devoted to hatching of eggs and the initial rearing of fry.
Ich (pronounced “ick”): Also known as white spot disease, ich is caused by a protozoan
parasite, Ichthyophthirius multifiliis. Ich typically occurs in freshwater fish and is
characterized by white nodules on the skin that can rupture, releasing thousands of new
infective parasitic forms. Many affected fish die. Ich can also infest the gills.
Krill: Species of small marine shrimp commonly dried and sold as fish food.
Multibatch (or multiple batch) production: A production method in which ponds are
incompletely harvested and then restocked with fingerlings. This method is considered to
be continuous production (compare with single-batch production).
Operation average: The average value for all operations. The value reported for each
operation is summed for all operations reporting; the sum is then divided by the number of
operations reporting. For example, operation average number of fry hatched (shown on
p 44) is calculated by summing the reported average number of fry hatched over all
operations divided by the number of operations.
Paddles: Attached to a horizontal rotating bar over hatching troughs; promote water
movement over eggs to simulate the natural fanning action of a male catfish’s tail.

6 / Catfish 2010
Introduction
Population estimates: Estimates in this report are provided with a measure of precision
called the standard error (abbreviated within as Std. Error). A 95-percent confidence
interval can be created with bounds equal to the estimate plus or minus two standard
errors. If the only error is sampling error, the confidence intervals created in this manner
will contain the true population mean 95 out of 100 times. In the example to the left, an
estimate of 7.5 with a standard error of 1.0 results in limits of 5.5 to 9.5 (two times the
standard error above and below the estimate). The second estimate of 3.4 shows a
standard error of 0.3 and results in limits of 2.8 and 4.0. Alternatively, the 90-percent
confidence interval would be created by multiplying the standard error by 1.65 instead of
2. Most estimates in this report are rounded to the nearest tenth. If rounded to 0, the
standard error was reported (0.0). If there were no reports of the event, no standard error
was reported (—).
Raceway: A fish culture unit with a continuous flow of water.
Regions:
• East: Alabama and eastern Mississippi.
• West: Arkansas, Louisiana, and the delta of Mississippi.
Renovation: The draining and drying of ponds, followed by collection and use of
accumulated sediments from the pond bottom for rebuilding of levees.
Sac fry: Newly hatched fry that still have an external yolk sac evident.
Sample profile: Information that describes characteristics of the sites from which data
were collected for Catfish 2003 and for Catfish 2010.
Single-batch production: A production method in which all fish are stocked in a pond at
a single time and the pond is not restocked until all fish have been harvested (compare
with multibatch production).
Pond-run channel catfish: Fish originating from foodsize-fish production ponds that lack
the documented history of genetic improvement that is usually associated with identifiable
broodfish lines. (Some hatcheries might perform some type of mass selection, such as
retaining the largest fingerlings, or fingerlings from the earliest spawn, to use as broodfish.
Such fish might be called “unselected commercial lines.”)
USDA APHIS VS / 7
Introduction
Spawns: See egg masses.
Stocker: A small to medium-sized fish. One thousand stockers typically weigh 61 to
750 pounds. This definition follows weight-based size categories the National Agricultural
Statistics Service uses in its inventory surveys.
Swim-up fry: Newly hatched fry that seek food by swimming to the water surface,
typically 3 to 4 days after hatching.
Trough: Generally a flat-bottom wooden, fiberglass, or metal structure about 8 feet long,
2 feet wide, and 20 inches deep, with a water inlet at one end and drain at the other.
Understock: The practice of stocking smaller fish (fingerlings or stockers) in ponds that
have existing inventories of foodsize fish from previous stockings (carryover).
Vaccination: Two vaccines are in use in the catfish industry: one for ESC and one for
columnaris. Fry are vaccinated by being immersed briefly in a bath containing the vaccine.
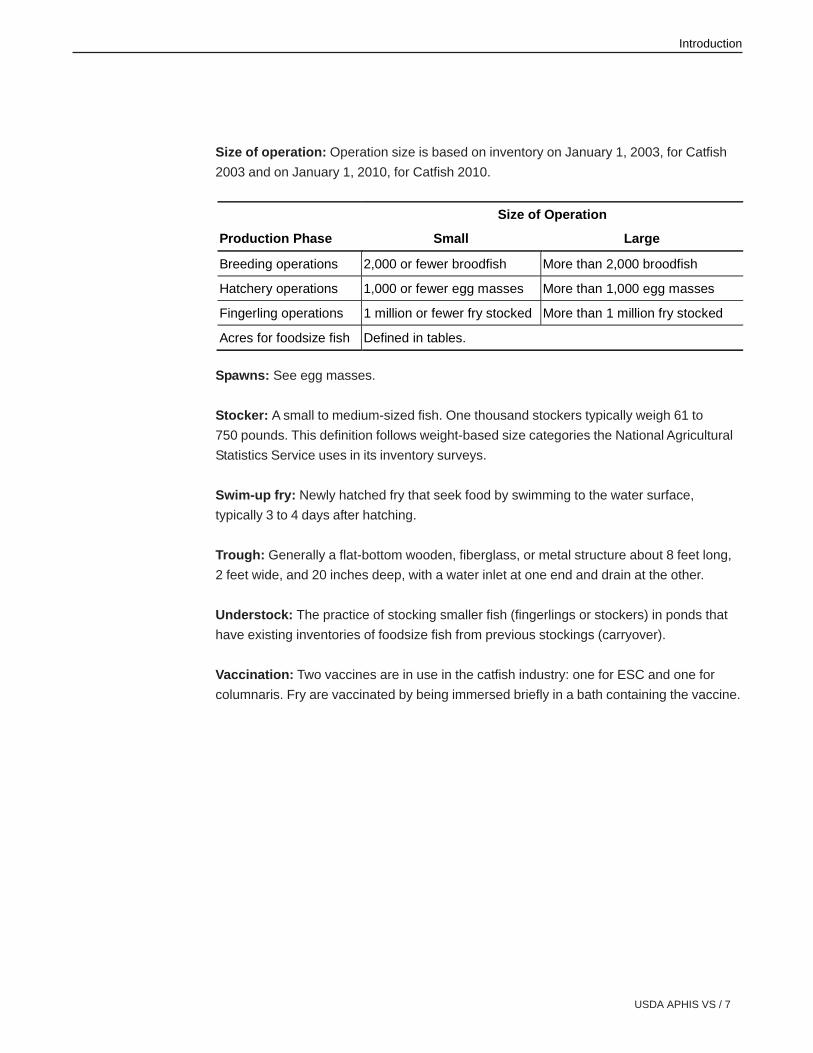
Size of operation: Operation size is based on inventory on January 1, 2003, for Catfish
2003 and on January 1, 2010, for Catfish 2010.
Size of Operation
Production Phase Small Large
Breeding operations 2,000 or fewer broodfish More than 2,000 broodfish
Hatchery operations 1,000 or fewer egg masses More than 1,000 egg masses
Fingerling operations 1 million or fewer fry stocked More than 1 million fry stocked
Acres for foodsize fish Defined in tables.


USDA APHIS VS / 9
Section I: Population Estimates–A. General Operation Trends
Note: This report compares results from Catfish 2003 study with those from Catfish 2010
study. In some cases, questions asked about practices or occurrences during the
calendar year preceding the study (i.e., 2002 for Catfish 2003 and 2009 for Catfish 2010),
while other questions asked about usual or ongoing practices or occurrences without a
specific time frame (i.e., what the producer typically does). This report has maintained
these distinctions in narratives and tables in the interest of accuracy and proper
representation of the producers’ responses.
Section I: Population Estimates, Fry and Fingerling Catfish
A. GeneralOperation Trends
1. Changes in operation demographics
From Catfish 2003 to Catfish 2010, some major changes occurred in the demographics of
catfish operations. For all States, the number of catfish operations decreased from 1,161
on January 1, 2003, to 994 on January 1, 2010 (see Appendix II). Additionally, the water
surface acres used for production decreased from 187,200 for the period January 1
through June 30, 2003, to 115,100 for the same 6-month time frame in 2010. The number
of operations in each State is no longer published by NASS on an annual basis, but all
four study States experienced substantial declines in the number of water surface acres
used for production (see Appendix II, table D).
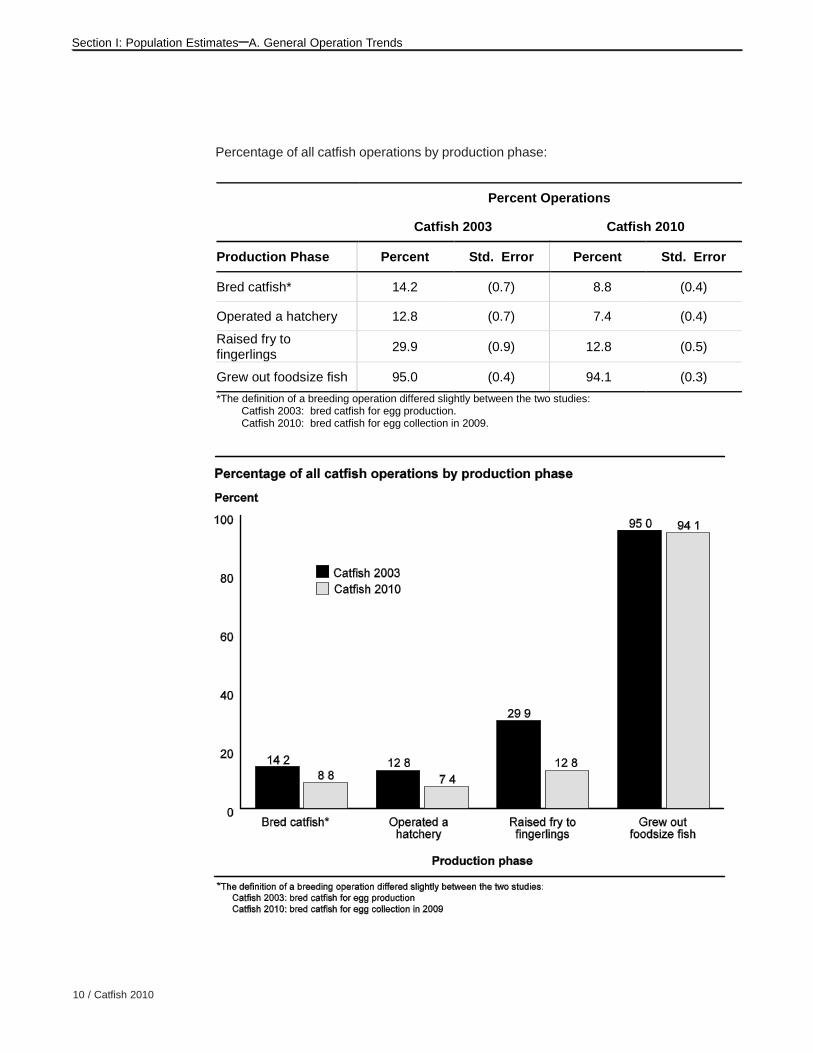
2. Distribution of catfish production phases
Almost all catfish operations grew out foodsize fish, and the percentage of operations that
raised foodsize fish was similar for the Catfish 2003 and 2010 studies. The percentages of
operations participating in the other three production phases declined, however, with the
percentage of operations that raised fry to fingerlings declining by more than half. For both
studies, a higher percentage of operations raised fry to fingerlings than either bred catfish
or operated a hatchery. Some operations that bred catfish did not operate a hatchery;
these operations might have allowed eggs to hatch in breeding ponds.
The decline in the percentage of operations that bred catfish might in part be due to a
change between studies in the definition of a breeding operation. For Catfish 2003, a
breeding operation was one that bred catfish for egg production, whereas for Catfish
2010, a breeding operation was one that bred catfish for egg collection. Some operations
that bred catfish but did not collect the eggs might not have been counted as breeding
operations for Catfish 2010.
10 / Catfish 2010
Section I: Population Estimates–A. General Operation Trends
Percentage of all catfish operations by production phase:
Percent Operations
Catfish 2003 Catfish 2010
Production Phase Percent Std. Error Percent Std. Error
Bred catfish* 14.2 (0.7) 8.8 (0.4)
Operated a hatchery 12.8 (0.7) 7.4 (0.4)
Raised fry to fingerlings
29.9 (0.9) 12.8 (0.5)
Grew out foodsize fish 95.0 (0.4) 94.1 (0.3)
*The definition of a breeding operation differed slightly between the two studies: Catfish 2003: bred catfish for egg production. Catfish 2010: bred catfish for egg collection in 2009.

USDA APHIS VS / 11
Section I: Population Estimates–B. Broodfish Management
B. BroodfishManagement
1. Broodfish lines
The percentage of operations raising blue catfish increased from 9.2 percent in 2003 to
19.4 percent in 2010, which suggests a shift toward production of channel x blue hybrid
catfish. The percentage of operations maintaining broodfish lines of pond-run catfish
almost doubled from 2003 to 2010 (from 34.8 to 69.4 percent). The percentages of
operations with NWAC103, Goldkist, and other channel catfish lines declined from 2003 to
2010.
a. Percentage of breeding operations that had the following broodfish lines on January 1
of the study year:
Percent Breeding Operations
Catfish 2003 Catfish 2010
Line Percent Std. Error Percent Std. Error
NWAC103 23.7 (2.6) 2.8 (0.0)
Kansas 5.8 (1.2) 2.8 (0.4)
Goldkist* 27.5 (2.7) 11.1 (0.5)
Norris 0.0 (—)
Auburn 5.6 (0.1)
Blue catfish 9.2 (1.5) 19.4 (0.5)
Other channel catfish line
32.8 (2.6) 13.9 (0.5)
Pond-run channel catfish**
34.8 (2.8) 69.4 (0.6)
*Catfish 2010 included Harvest Select catfish with Goldkist catfish. **Defined in study questionnaires as “fish selected from foodsize-fish production ponds.”

12 / Catfish 2010
Section I: Population Estimates–B. Broodfish Management
b. Percentage of broodfish by broodfish line present on January 1 of the study year:
Percent Broodfish
Catfish 2003 Catfish 2010
Line Percent Std. Error Percent Std. Error
NWAC103 14.0 (2.3) 0.4 (0.0)
Kansas 5.8 (1.7) 1.5 (0.2)
Goldkist* 18.6 (2.7) 4.7 (0.4)
Norris 0.0 (—)
Auburn 0.2 (0.0)
Blue catfish 4.0 (1.7) 3.6 (0.2)
Other channel catfish line
24.2 (4.1) 7.3 (0.5)
Pond-run channel catfish**
33.4 (4.1) 82.3 (1.0)
Total 100.0 100.0
*Catfish 2010 included Harvest Select catfish with Goldkist catfish. **Defined in study questionnaires as “fish selected from foodsize-fish production ponds.”
2. Broodfish by age
For breeding operations, channel catfish 3 to 6 years old are likely better broodfish
because they are more productive and easier to handle. Although channel catfish can
breed at 2 years of age, they breed more reliably at 3 years or older. Once they have
reached age 7, however, they might produce fewer eggs per pound of fish, be more
difficult to handle, and have difficulty using spawning containers.

USDA APHIS VS / 13
Section I: Population Estimates–B. Broodfish Management
Data from Catfish 2010 indicate that producers might be keeping broodfish longer than
they did in 2003. Although the percentage of 3- to 4-year-old broodfish declined from
57.8 percent in 2003 to 39.4 percent in 2010, the percentage of 5- to 6-year-old broodfish
increased from 21.1 percent in 2003 to 46.9 percent in 2010, with the majority of those
being in the 5-year-old category.
Percentage of broodfish by age on January 1 of the study year:
Percent Broodfish
Catfish 2003 Catfish 2010
Age (years) Percent Std. Error Percent Std. Error
Less than 3 17.8 (3.6) 11.1 (0.5)
3 to 4 57.8 (4.9) 39.4 (1.1)
5 to 6 21.1 (2.9)
5 41.7 (1.2)
6 5.2 (0.3)
More than 6 3.3 (0.8) 2.6 (0.1)
Total 100.0 100.0
3. Annual cycle rate (cull rate) of broodfish
For both studies, in the year preceding the study (2002 or 2009), catfish producers
annually culled about 15 percent of their broodfish.
a. Percentage of broodfish inventory culled during the year preceding the study:
Percent Broodfish
Catfish 2003 Catfish 2010
Percent Std. Error Percent Std. Error
16.3 (3.4) 14.4 (0.9)

14 / Catfish 2010
Section I: Population Estimates–B. Broodfish Management
In each study, more than half of breeding operations did not cull any broodfish in the year
before the study. About one-fifth of operations culled 1.0 to 10.9 percent of broodfish. The
increase in the percentage of operations culling 11.0 to 20.9 percent of broodfish (from 3.5
to 13.5 percent) and the decrease in operations culling 21.0 percent of broodfish or more
(from 19.1 to 10.8 percent) is consistent with culling about one-sixth of broodfish each
year and maintaining a population of broodfish with a higher percentage of older fish.
b. Percentage of breeding operations by percentage of broodfish culled during the year
preceding the study year:
Percent Breeding Operations
Catfish 2003 Catfish 2010
Percent Broodfish Culled Percent Std. Error Percent Std. Error
0.0 54.5 (3.0) 54.1 (0.7)
1.0 to 10.9 22.9 (2.3) 21.6 (0.7)
11.0 to 20.9 3.5 (0.8) 13.5 (0.5)
21.0 or more 19.1 (2.6) 10.8 (0.4)
Total 100.0 100.0
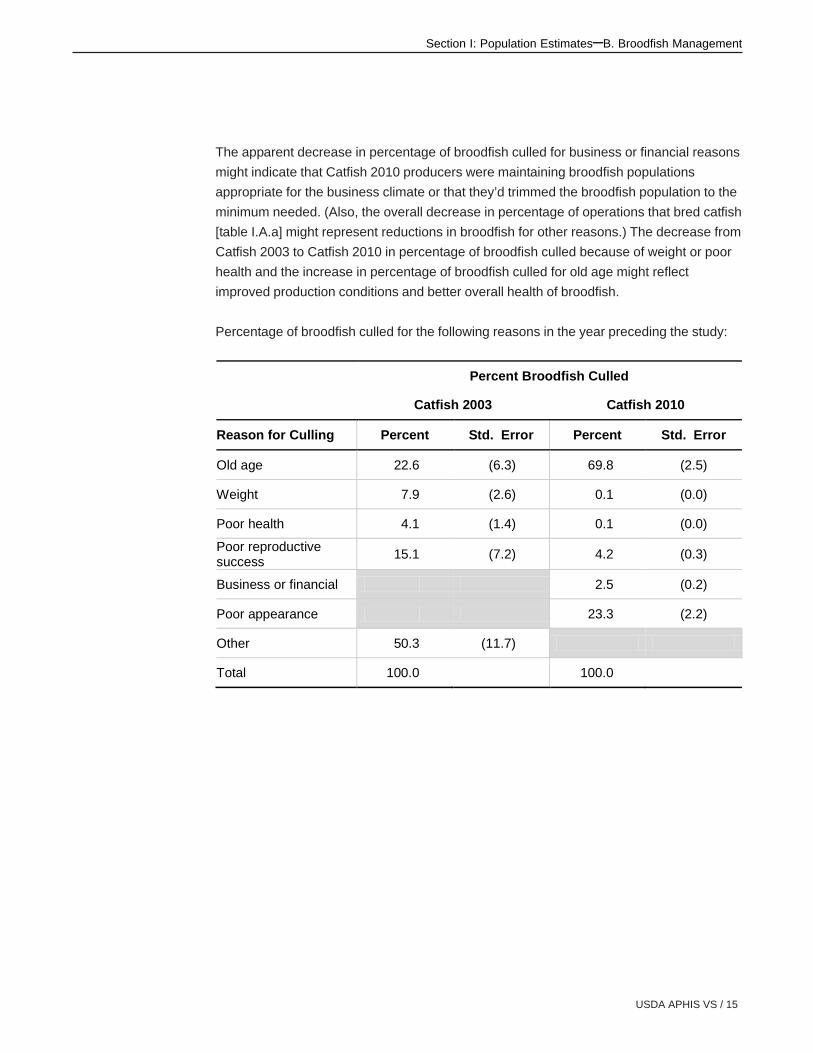
4. Reasons for culling
For Catfish 2003, more than half of broodfish culled were culled for “other” reasons, which
might have reflected a downsizing of inventory by some producers. For Catfish 2010,
“other” was not provided as an answer option and “business or financial” and “poor
appearance” were added as options; only about one-fourth of broodfish (25.8 percent)
were culled for these two reasons.
USDA APHIS VS / 15
Section I: Population Estimates–B. Broodfish Management
The apparent decrease in percentage of broodfish culled for business or financial reasons
might indicate that Catfish 2010 producers were maintaining broodfish populations
appropriate for the business climate or that they’d trimmed the broodfish population to the
minimum needed. (Also, the overall decrease in percentage of operations that bred catfish
[table I.A.a] might represent reductions in broodfish for other reasons.) The decrease from
Catfish 2003 to Catfish 2010 in percentage of broodfish culled because of weight or poor
health and the increase in percentage of broodfish culled for old age might reflect
improved production conditions and better overall health of broodfish.
Percentage of broodfish culled for the following reasons in the year preceding the study:
Percent Broodfish Culled
Catfish 2003 Catfish 2010
Reason for Culling Percent Std. Error Percent Std. Error
Old age 22.6 (6.3) 69.8 (2.5)
Weight 7.9 (2.6) 0.1 (0.0)
Poor health 4.1 (1.4) 0.1 (0.0)
Poor reproductive success
15.1 (7.2) 4.2 (0.3)
Business or financial 2.5 (0.2)
Poor appearance 23.3 (2.2)
Other 50.3 (11.7)
Total 100.0 100.0

16 / Catfish 2010
Section I: Population Estimates–B. Broodfish Management
5. Broodfish loss
For both studies, producers reported that about 15 percent of broodfish (14.5 percent for
Catfish 2003 and 17.0 percent for Catfish 2010) were lost in the year prior to the study to
disease, predation, or other problems. Combined with the culling rate for broodfish (table
B.4.a), it appears that about one-third of broodfish inventory is culled or lost each year.
a. Percentage of broodfish lost to disease, predation, or other problems in the year prior to
the study:
Percent Broodfish
Catfish 2003 Catfish 2010
Percent Std. Error Percent Std. Error
14.5 (2.8) 17.0 (0.5)
For both studies, producers were asked to estimate the percentage of total broodfish loss
attributed to each of the following listed reasons of loss. Fighting increased as a cause of
broodfish loss from Catfish 2003 to Catfish 2010, with the percentage of operations
affected increasing from 26.4 to 34.6 percent and the percentage of total loss increasing
from 11.1 to 48.8 percent. The cause of the highest percentage of broodfish loss for
Catfish 2003—visceral toxicosis of catfish (VTC), a disease of catfish first identified in
1998—affected a similar percentage of operations for Catfish 2010 but caused lower
percentages of broodfish loss (from 37.8 percent of total broodfish loss to 2.5 percent).
For Catfish 2003, when VTC had only recently been identified, there were reports of
severe losses of broodfish to VTC when it occurred on operations. Predation affected a
similar percentage of operations for both studies but affected a higher percentage of
broodfish for Catfish 2010 than for Catfish 2003. Winter kill declined as a cause of
broodfish loss, affecting a lower percentage of operations and lower percentages of
broodfish.

USDA APHIS VS / 17
Section I: Population Estimates–B. Broodfish Management
b. For the listed reasons for loss of broodfish in the year prior to the study, percentage of
breeding operations that lost broodfish, percentage of broodfish lost, and percentage of
total loss:
Percent
Catfish 2003 Catfish 2010
Operations Broodfish Total Loss Operations Broodfish Total Loss
Reason for Loss Pct.
Std. Error Pct.
Std. Error Pct.
Std. Error Pct.
Std. Error Pct.
Std. Error Pct.
Std. Error
Enteric septicemia of catfish
9.1 (1.4) 0.2 (0.0) 1.4 (0.3) 11.5 (0.7) 0.2 (0.0) 0.9 (0.1)
Columnaris 9.0 (1.8) 0.6 (0.2) 4.2 (1.4) 11.5 (0.7) 0.2 (0.0) 1.4 (0.2)
Proliferative gill disease
0.0 (—) 0.0 (—) 0.0 (—) 0.0 (—) 0.0 (0.0) 0.0 (—)
Anemia* 0.0 (—) 0.0 (—) 0.0 (—)
Winter kill 8.6 (1.7) 0.4 (0.1) 2.6 (0.7) 3.8 (0.1) 0.1 (0.0) 0.5 (0.0)
Visceral toxicosis of catfish
4.9 (1.3) 5.5 (2.1) 37.8 (10.1) 3.8 (0.1) 0.4 (0.0) 2.5 (0.1)
Fighting 26.4 (2.5) 1.6 (0.5) 11.1 (3.6) 34.6 (0.9) 8.3 (0.6) 48.8 (3.0)
Predation 14.8 (1.7) 0.1 (0.0) 0.5 (0.1) 15.4 (0.7) 1.8 (0.2) 10.9 (1.1)
Other 10.5 (2.0) 3.6 (1.2) 25.1 (0.7) 15.4 (0.5) 3.2 (0.2) 18.9 (1.5)
Unknown causes
19.6 (2.5) 2.5 (1.1) 17.3 (0.7) 23.1 (0.7) 2.8 (0.2) 16.1 (1.5)
Total NA 14.5 (2.8) 100.0 NA 17.0 (0.5) 100.0
*Anemia was not listed as an answer option for causes of loss of broodfish in Cafish 2010 because there were no reports of anemia in Catfish 2003.
18 / Catfish 2010
Section I: Population Estimates–B. Broodfish Management
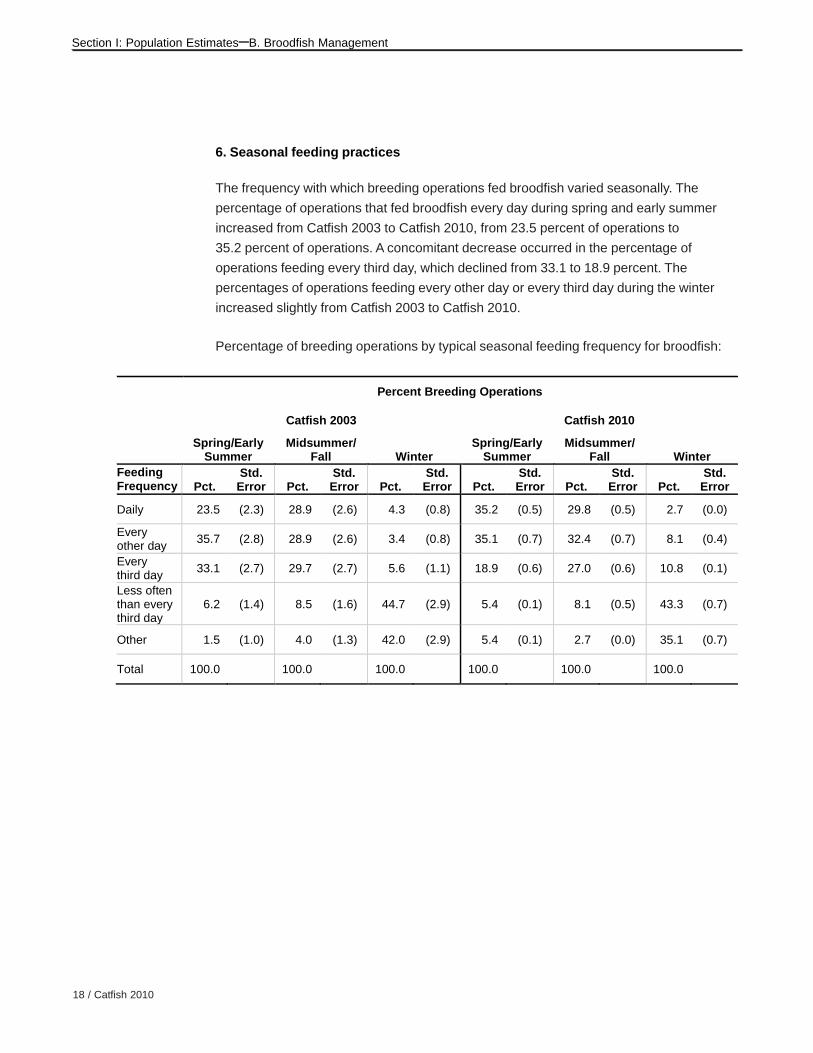
6. Seasonal feeding practices
The frequency with which breeding operations fed broodfish varied seasonally. The
percentage of operations that fed broodfish every day during spring and early summer
increased from Catfish 2003 to Catfish 2010, from 23.5 percent of operations to
35.2 percent of operations. A concomitant decrease occurred in the percentage of
operations feeding every third day, which declined from 33.1 to 18.9 percent. The
percentages of operations feeding every other day or every third day during the winter
increased slightly from Catfish 2003 to Catfish 2010.
Percentage of breeding operations by typical seasonal feeding frequency for broodfish:
Percent Breeding Operations
Catfish 2003 Catfish 2010
Spring/Early Summer
Midsummer/ Fall Winter
Spring/Early Summer
Midsummer/ Fall Winter
Feeding Frequency Pct.
Std. Error Pct.
Std. Error Pct.
Std. Error Pct.
Std. Error Pct.
Std. Error Pct.
Std. Error
Daily 23.5 (2.3) 28.9 (2.6) 4.3 (0.8) 35.2 (0.5) 29.8 (0.5) 2.7 (0.0)
Every other day
35.7 (2.8) 28.9 (2.6) 3.4 (0.8) 35.1 (0.7) 32.4 (0.7) 8.1 (0.4)
Every third day
33.1 (2.7) 29.7 (2.7) 5.6 (1.1) 18.9 (0.6) 27.0 (0.6) 10.8 (0.1)
Less often than every third day
6.2 (1.4) 8.5 (1.6) 44.7 (2.9) 5.4 (0.1) 8.1 (0.5) 43.3 (0.7)
Other 1.5 (1.0) 4.0 (1.3) 42.0 (2.9) 5.4 (0.1) 2.7 (0.0) 35.1 (0.7)
Total 100.0 100.0 100.0 100.0 100.0 100.0
USDA APHIS VS / 19
Section I: Population Estimates–B. Broodfish Management
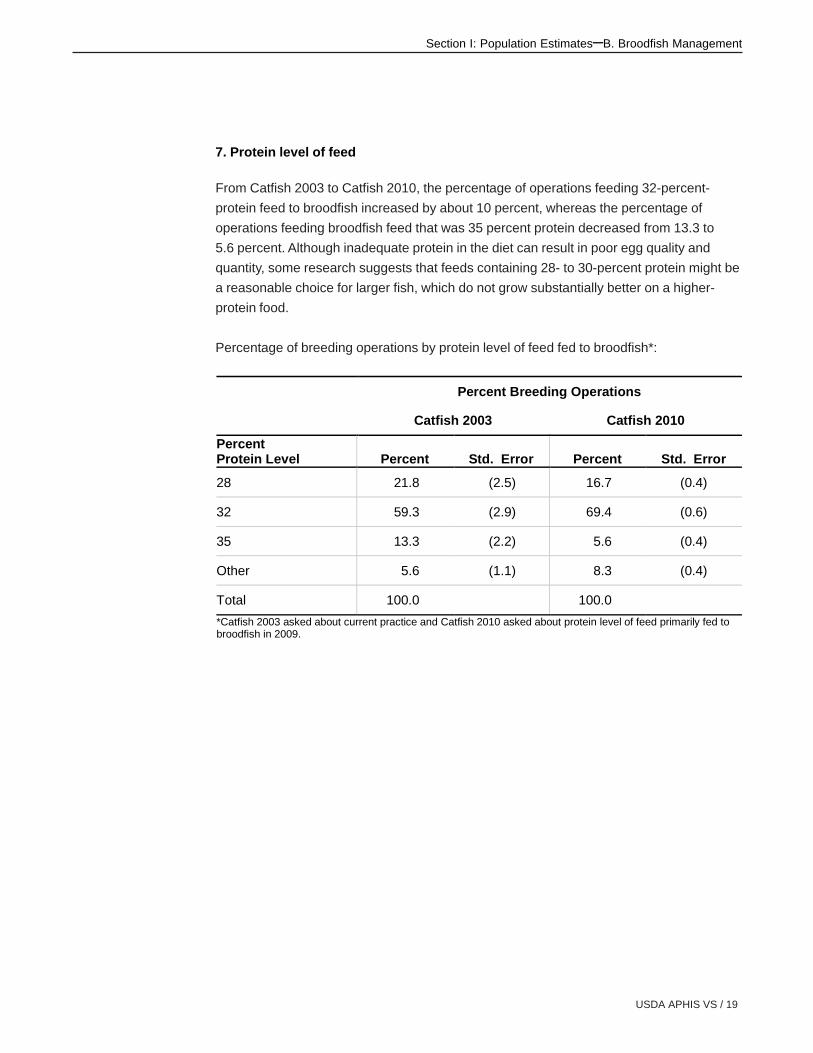
7. Protein level of feed
From Catfish 2003 to Catfish 2010, the percentage of operations feeding 32-percent-
protein feed to broodfish increased by about 10 percent, whereas the percentage of
operations feeding broodfish feed that was 35 percent protein decreased from 13.3 to
5.6 percent. Although inadequate protein in the diet can result in poor egg quality and
quantity, some research suggests that feeds containing 28- to 30-percent protein might be
a reasonable choice for larger fish, which do not grow substantially better on a higher-
protein food.
Percentage of breeding operations by protein level of feed fed to broodfish*:
Percent Breeding Operations
Catfish 2003 Catfish 2010
Percent Protein Level Percent Std. Error Percent Std. Error
28 21.8 (2.5) 16.7 (0.4)
32 59.3 (2.9) 69.4 (0.6)
35 13.3 (2.2) 5.6 (0.4)
Other 5.6 (1.1) 8.3 (0.4)
Total 100.0 100.0
*Catfish 2003 asked about current practice and Catfish 2010 asked about protein level of feed primarily fed to broodfish in 2009.

20 / Catfish 2010
Section I: Population Estimates–B. Broodfish Management
8. Additional species stocked
Stocked forage fish serve as a supplemental food source for broodfish. The percentage of
breeding operations stocking forage fish in broodfish ponds as a supplemental food
source increased from about one-third of operations (32.5 percent) for Catfish 2003 to
almost half of operations for Catfish 2010 (48.7 percent).
Percentage of breeding operations that stocked forage fish in broodfish ponds as a
supplemental food source for broodfish:
Percent Breeding Operations
Catfish 2003 Catfish 2010
Percent Std. Error Percent Std. Error
32.5 (2.5) 48.7 (0.7)
USDA APHIS VS / 21
Section I: Population Estimates–C. Spawning Management: Ponds and Broodfish
C. SpawningManagement:Ponds andBroodfish
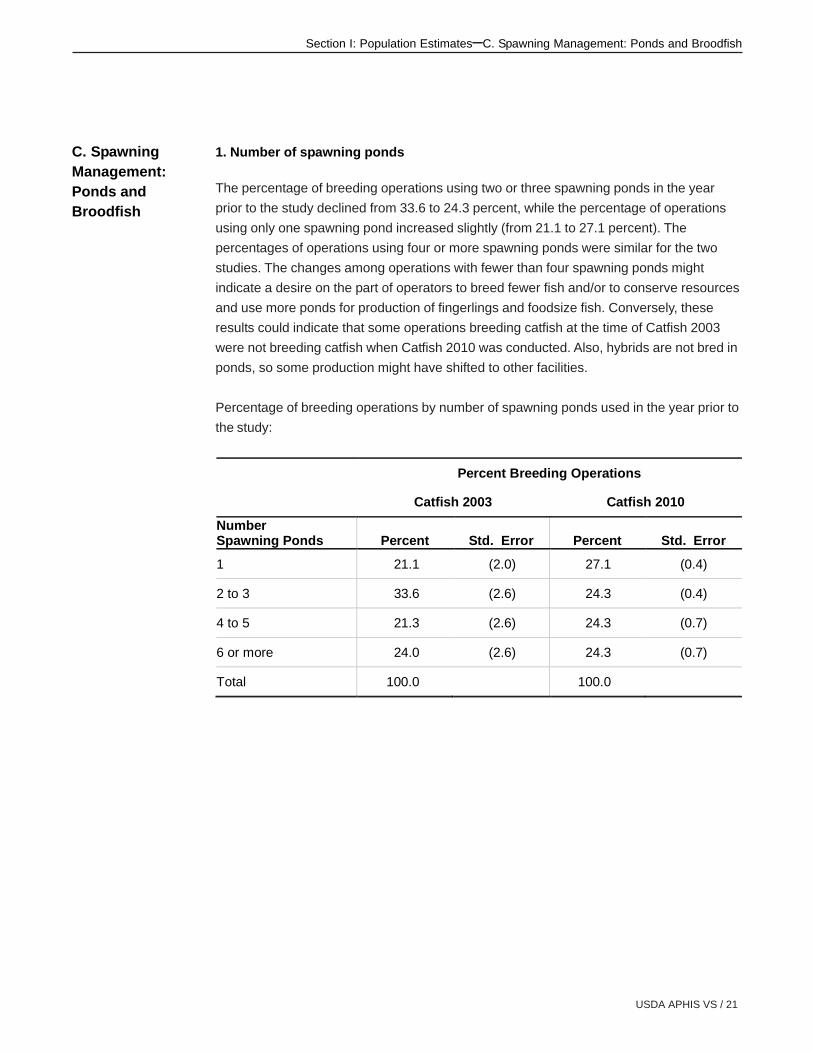
1. Number of spawning ponds
The percentage of breeding operations using two or three spawning ponds in the year
prior to the study declined from 33.6 to 24.3 percent, while the percentage of operations
using only one spawning pond increased slightly (from 21.1 to 27.1 percent). The
percentages of operations using four or more spawning ponds were similar for the two
studies. The changes among operations with fewer than four spawning ponds might
indicate a desire on the part of operators to breed fewer fish and/or to conserve resources
and use more ponds for production of fingerlings and foodsize fish. Conversely, these
results could indicate that some operations breeding catfish at the time of Catfish 2003
were not breeding catfish when Catfish 2010 was conducted. Also, hybrids are not bred in
ponds, so some production might have shifted to other facilities.
Percentage of breeding operations by number of spawning ponds used in the year prior to
the study:
Percent Breeding Operations
Catfish 2003 Catfish 2010
Number Spawning Ponds Percent Std. Error Percent Std. Error
1 21.1 (2.0) 27.1 (0.4)
2 to 3 33.6 (2.6) 24.3 (0.4)
4 to 5 21.3 (2.6) 24.3 (0.7)
6 or more 24.0 (2.6) 24.3 (0.7)
Total 100.0 100.0

22 / Catfish 2010
Section I: Population Estimates–C. Spawning Management: Ponds and Broodfish
2. Draining and renovation of spawning ponds
Although some experts recommend draining and drying ponds every year to maintain
spawning success, the percentage of operations that usually drain and dry ponds every 1
to 3 years declined from 79.0 percent for Catfish 2003 to 61.1 percent for Catfish 2010.
Concomitantly, the percentage of operations that usually wait 6 or more years to drain and
dry ponds increased from 13.6 percent for Catfish 2003 to 30.6 percent in for Catfish
2010. These changes might reflect economic pressures and reduced availability of
resources.
For each study, about three-fourths of operations usually wait 6 or more years between
complete renovations of ponds.
a. Percentage of breeding operations by usual number of years between draining and
drying of spawning ponds and between complete renovations of ponds:
Percent Breeding Operations
Catfish 2003 Catfish 2010
Number Years Between… Percent Std. Error Percent Std. Error Draining and drying of ponds
1 to 3 79.0 (2.2) 61.1 (0.7)
4 to 5 7.4 (1.2) 8.3 (0.1)
6 or more 13.6 (1.8) 30.6 (0.6)
Total 100.0 100.0
Complete renovations
1 to 3 15.5 (2.7) 19.4 (0.3)
4 to 5 11.1 (2.2) 6.4 (0.1)
6 or more 73.4 (3.3) 74.2 (0.4)
Total 100.0 100.0

USDA APHIS VS / 23
Section I: Population Estimates–C. Spawning Management: Ponds and Broodfish
The average interval between draining and drying of ponds increased slightly from
3.1 years for Catfish 2003 to 3.9 years for Catfish 2010. The average time between
complete renovations for all operations remained the same, at almost 10 years.
b. Average number of years between draining and drying of spawning ponds and average
number of years between complete renovations of spawning ponds:
Average Number of Years
Catfish 2003 Catfish 2010
Procedure Average Std. Error Average Std. Error
Draining and drying of ponds
3.1 (0.2) 3.9 (0.1)
Complete renovations 9.4 (0.3) 9.9 (0.1)
24 / Catfish 2010
Section I: Population Estimates–C. Spawning Management: Ponds and Broodfish
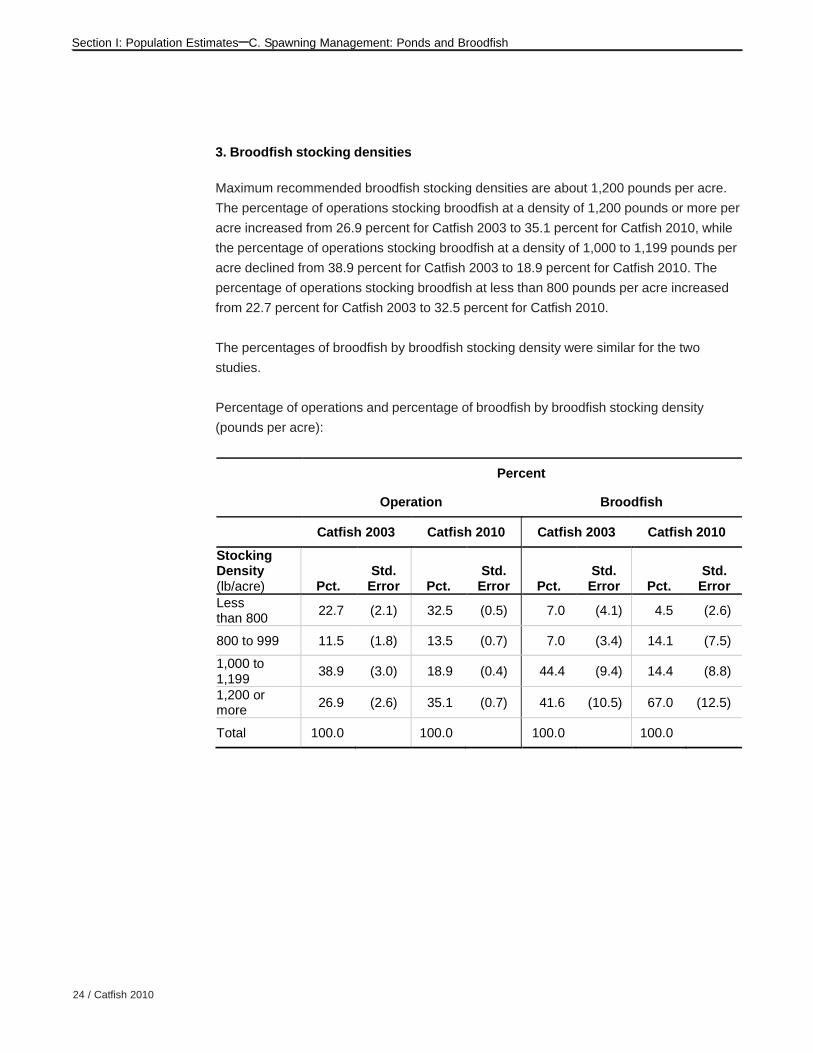
3. Broodfish stocking densities
Maximum recommended broodfish stocking densities are about 1,200 pounds per acre.
The percentage of operations stocking broodfish at a density of 1,200 pounds or more per
acre increased from 26.9 percent for Catfish 2003 to 35.1 percent for Catfish 2010, while
the percentage of operations stocking broodfish at a density of 1,000 to 1,199 pounds per
acre declined from 38.9 percent for Catfish 2003 to 18.9 percent for Catfish 2010. The
percentage of operations stocking broodfish at less than 800 pounds per acre increased
from 22.7 percent for Catfish 2003 to 32.5 percent for Catfish 2010.
The percentages of broodfish by broodfish stocking density were similar for the two
studies.
Percentage of operations and percentage of broodfish by broodfish stocking density
(pounds per acre):
Percent
Operation Broodfish
Catfish 2003 Catfish 2010 Catfish 2003 Catfish 2010
Stocking Density (lb/acre) Pct.
Std. Error Pct.
Std. Error Pct.
Std. Error Pct.
Std. Error
Less than 800
22.7 (2.1) 32.5 (0.5) 7.0 (4.1) 4.5 (2.6)
800 to 999 11.5 (1.8) 13.5 (0.7) 7.0 (3.4) 14.1 (7.5)
1,000 to 1,199
38.9 (3.0) 18.9 (0.4) 44.4 (9.4) 14.4 (8.8)
1,200 or more
26.9 (2.6) 35.1 (0.7) 41.6 (10.5) 67.0 (12.5)
Total 100.0 100.0 100.0 100.0
USDA APHIS VS / 25
Section I: Population Estimates–C. Spawning Management: Ponds and Broodfish
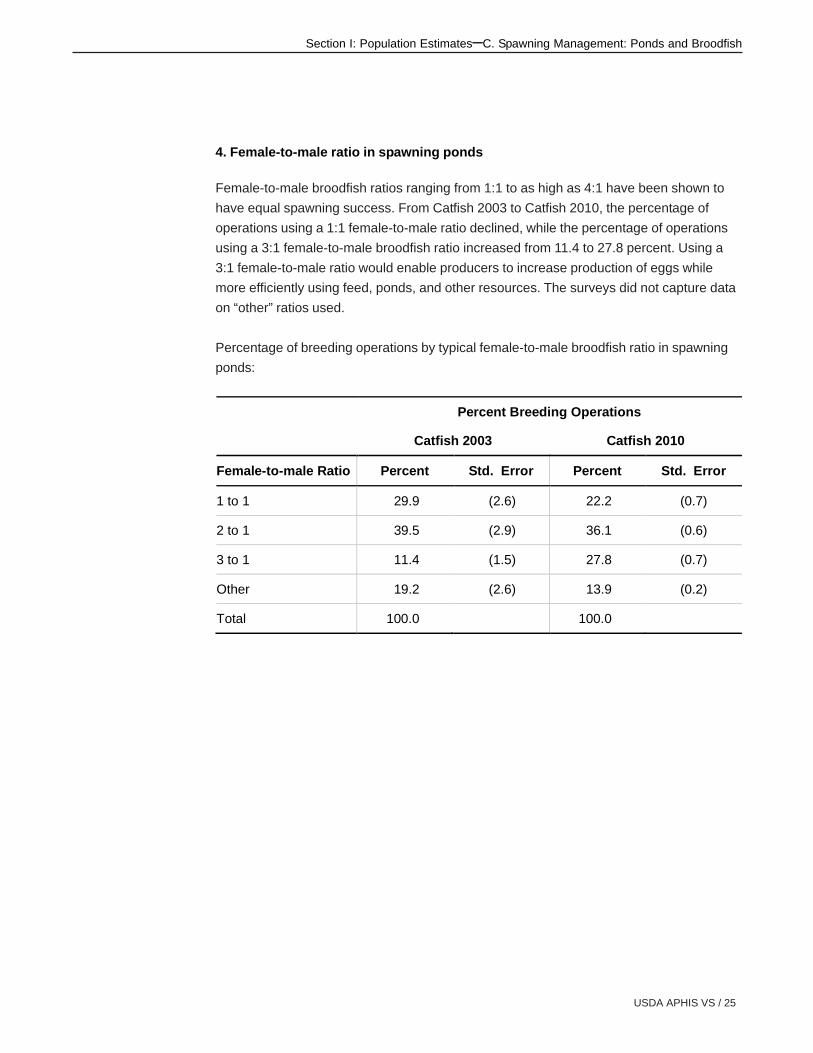
4. Female-to-male ratio in spawning ponds
Female-to-male broodfish ratios ranging from 1:1 to as high as 4:1 have been shown to
have equal spawning success. From Catfish 2003 to Catfish 2010, the percentage of
operations using a 1:1 female-to-male ratio declined, while the percentage of operations
using a 3:1 female-to-male broodfish ratio increased from 11.4 to 27.8 percent. Using a
3:1 female-to-male ratio would enable producers to increase production of eggs while
more efficiently using feed, ponds, and other resources. The surveys did not capture data
on “other” ratios used.
Percentage of breeding operations by typical female-to-male broodfish ratio in spawning
ponds:
Percent Breeding Operations
Catfish 2003 Catfish 2010
Female-to-male Ratio Percent Std. Error Percent Std. Error
1 to 1 29.9 (2.6) 22.2 (0.7)
2 to 1 39.5 (2.9) 36.1 (0.6)
3 to 1 11.4 (1.5) 27.8 (0.7)
Other 19.2 (2.6) 13.9 (0.2)
Total 100.0 100.0
26 / Catfish 2010
Section I: Population Estimates–D. Hatchery Management
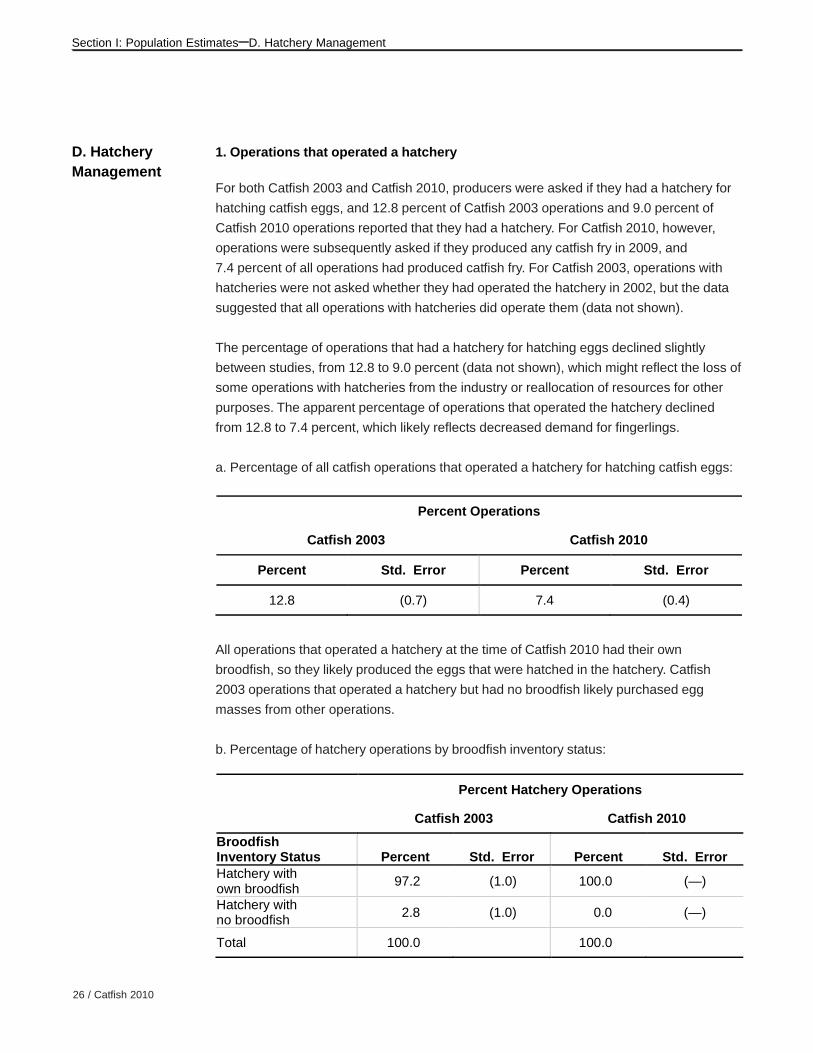
1. Operations that operated a hatchery
For both Catfish 2003 and Catfish 2010, producers were asked if they had a hatchery for
hatching catfish eggs, and 12.8 percent of Catfish 2003 operations and 9.0 percent of
Catfish 2010 operations reported that they had a hatchery. For Catfish 2010, however,
operations were subsequently asked if they produced any catfish fry in 2009, and
7.4 percent of all operations had produced catfish fry. For Catfish 2003, operations with
hatcheries were not asked whether they had operated the hatchery in 2002, but the data
suggested that all operations with hatcheries did operate them (data not shown).
The percentage of operations that had a hatchery for hatching eggs declined slightly
between studies, from 12.8 to 9.0 percent (data not shown), which might reflect the loss of
some operations with hatcheries from the industry or reallocation of resources for other
purposes. The apparent percentage of operations that operated the hatchery declined
from 12.8 to 7.4 percent, which likely reflects decreased demand for fingerlings.
a. Percentage of all catfish operations that operated a hatchery for hatching catfish eggs:
D. HatcheryManagement
Percent Operations
Catfish 2003 Catfish 2010
Percent Std. Error Percent Std. Error
12.8 (0.7) 7.4 (0.4)
All operations that operated a hatchery at the time of Catfish 2010 had their own
broodfish, so they likely produced the eggs that were hatched in the hatchery. Catfish
2003 operations that operated a hatchery but had no broodfish likely purchased egg
masses from other operations.
b. Percentage of hatchery operations by broodfish inventory status:
Percent Hatchery Operations
Catfish 2003 Catfish 2010
Broodfish Inventory Status Percent Std. Error Percent Std. Error Hatchery with own broodfish
97.2 (1.0) 100.0 (—)
Hatchery with no broodfish
2.8 (1.0) 0.0 (—)
Total 100.0 100.0
USDA APHIS VS / 27
Section I: Population Estimates–D. Hatchery Management
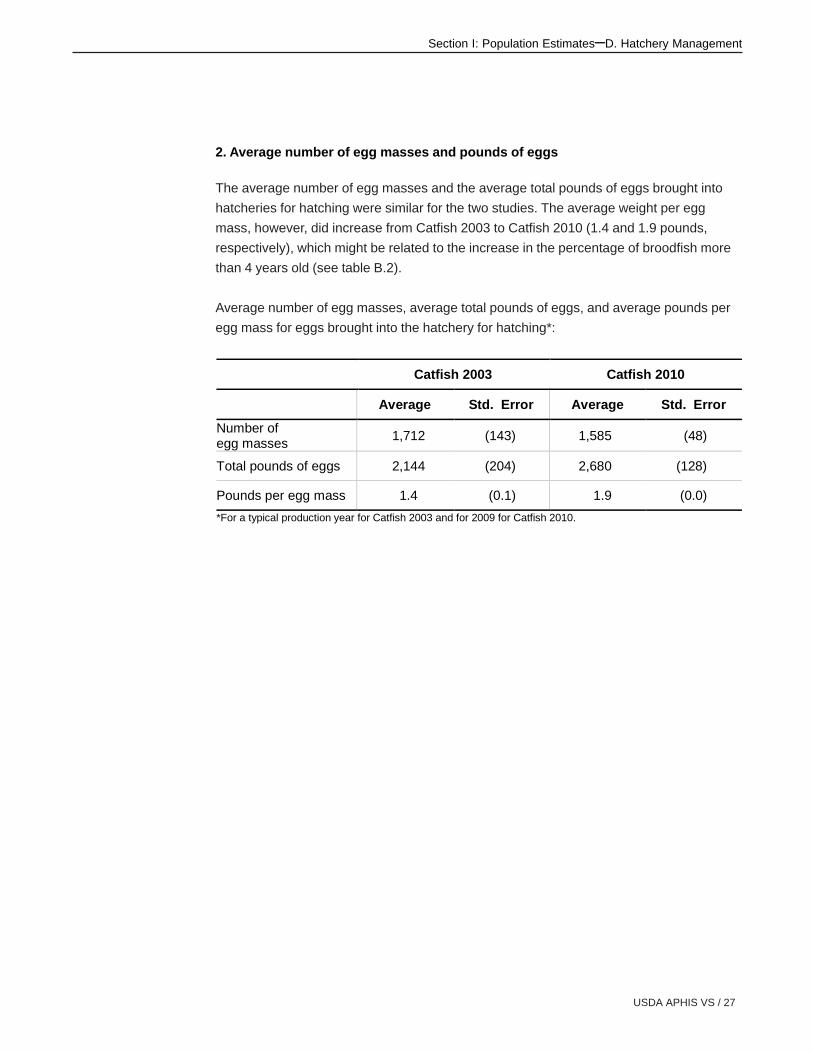
2. Average number of egg masses and pounds of eggs
The average number of egg masses and the average total pounds of eggs brought into
hatcheries for hatching were similar for the two studies. The average weight per egg
mass, however, did increase from Catfish 2003 to Catfish 2010 (1.4 and 1.9 pounds,
respectively), which might be related to the increase in the percentage of broodfish more
than 4 years old (see table B.2).
Average number of egg masses, average total pounds of eggs, and average pounds per
egg mass for eggs brought into the hatchery for hatching*:
Catfish 2003 Catfish 2010
Average Std. Error Average Std. Error
Number of egg masses
1,712 (143) 1,585 (48)
Total pounds of eggs 2,144 (204) 2,680 (128)
Pounds per egg mass 1.4 (0.1) 1.9 (0.0)
*For a typical production year for Catfish 2003 and for 2009 for Catfish 2010.

28 / Catfish 2010
Section I: Population Estimates–D. Hatchery Management
3. Egg mass treatment and placement in hatchery
Operations can treat egg masses with an appropriate compound to control bacterial and
fungal diseases, but to avoid extra handling, the treatment is best done immediately after
eggs are placed into hatching troughs. From Catfish 2003 to Catfish 2010, the percentage
of operations that usually did not treat egg masses before placing them in the hatchery
increased from 37.5 to 51.8 percent. The percentage of operations that usually treated
egg masses with Betadine® or another iodine compound declined from 48.0 to
38.5 percent.
Percentage of breeding operations by usual treatment of egg masses before they are
placed into hatching troughs:
4. Hatchery water management
Compared with surface water, well water has the advantage of generally being free of
disease agents and vectors, wild fish, suspended matter, and pollutants. Water obtained
directly from a well, however, can have issues associated with supersaturation of gases.
Storing well water in a holding pond before use prevents problems with supersaturated
gases and also facilitates availability of water.
Percent Breeding Operations
Catfish 2003 Catfish 2010
Treatment of Egg Masses Percent Std. Error Percent Std. Error Betadine® (iodine compounds)
48.0 (3.1) 38.5 (0.8)
Other compound 14.5 (2.1) 9.7 (0.4)
No treatment 37.5 (2.9) 51.8 (0.8)
Total 100.0 100.0

USDA APHIS VS / 29
Section I: Population Estimates–D. Hatchery Management
The percentage of operations using well water stored in a holding pond as the primary
water source for the hatchery declined from 28.8 to 16.2 percent from Catfish 2003 to
Catfish 2010. The percentage of operations using, as their primary water source, water
from a creek or watershed that was then stored in a holding pond increased slightly, from
5.9 to 9.8 percent. Rather than reflecting changes individual operations made in their
water sources, these differences more likely reflect changes caused by some operations
leaving the business.
a. Percentage of hatchery operations by primary water source for the hatchery:
Percent Hatchery Operations
Catfish 2003 Catfish 2010
Primary Water Source Percent Std. Error Percent Std. Error Well water stored in a holding pond
28.8 (2.3) 16.2 (0.4)
Water from a creek or watershed, then stored in a holding pond
5.9 (1.0) 9.8 (0.1)
Water directly from a well
52.2 (2.8) 57.7 (0.7)
Mixture of water directly from a well and from a holding pond
9.2 (1.7) 13.0 (0.2)
Other 3.9 (1.1) 3.3 (0.4)
Total 100.0 100.0

30 / Catfish 2010
Section I: Population Estimates–D. Hatchery Management
For both studies, about half of the hatcheries that used water directly from a well
degassed the water before using it in the hatchery. Water used directly from a well also
can be cold; Catfish 2003 did not ask about heating well water, but Catfish 2010 found that
44.6 percent of operations heated water obtained directly from a well before using it in the
hatchery (data not shown).
b. For hatchery operations that used water directly from a well, percentage of operations
that degassed water used in the hatchery:
Percent Hatchery Operations
Catfish 2003 Catfish 2010
Percent Std. Error Percent Std. Error
51.3 (4.8) 55.1 (1.1)
For a typical 100-gallon hatching trough, between 2 and 5 gallons of water should flow
through the trough per minute; this flow rate provides adequate water exchange to
maintain water quality.
The percentage of operations with average flow rates of 1 to 3 gallons per minute
decreased from 36.5 percent for Catfish 2003 to 22.7 percent for Catfish 2010. This
decline might represent an improvement in hatchery conditions because, if these troughs
are the typical 100-gallon size, flow rates of 1 to 3 gallons per minute might be
inadequate. The percentage of operations with flow rates of more than 5 gallons per
minute increased from 16.6 to 27.5 percent; the surveys did not ask about trough size, so
troughs with these flow rates might be larger than 100 gallons.
c. Percentage of hatchery operations by average water flow rate (gallons/minute) in each
hatching trough:
Percent Hatchery Operations
Catfish 2003 Catfish 2010
Flow Rate (gal/min) Percent Std. Error Percent Std. Error
1 to 3 36.5 (4.0) 22.7 (0.6)
4 to 5 46.9 (4.1) 49.8 (0.8)
More than 5 16.6 (2.6) 27.5 (0.6)
Total 100.0 100.0
USDA APHIS VS / 31
Section I: Population Estimates–D. Hatchery Management
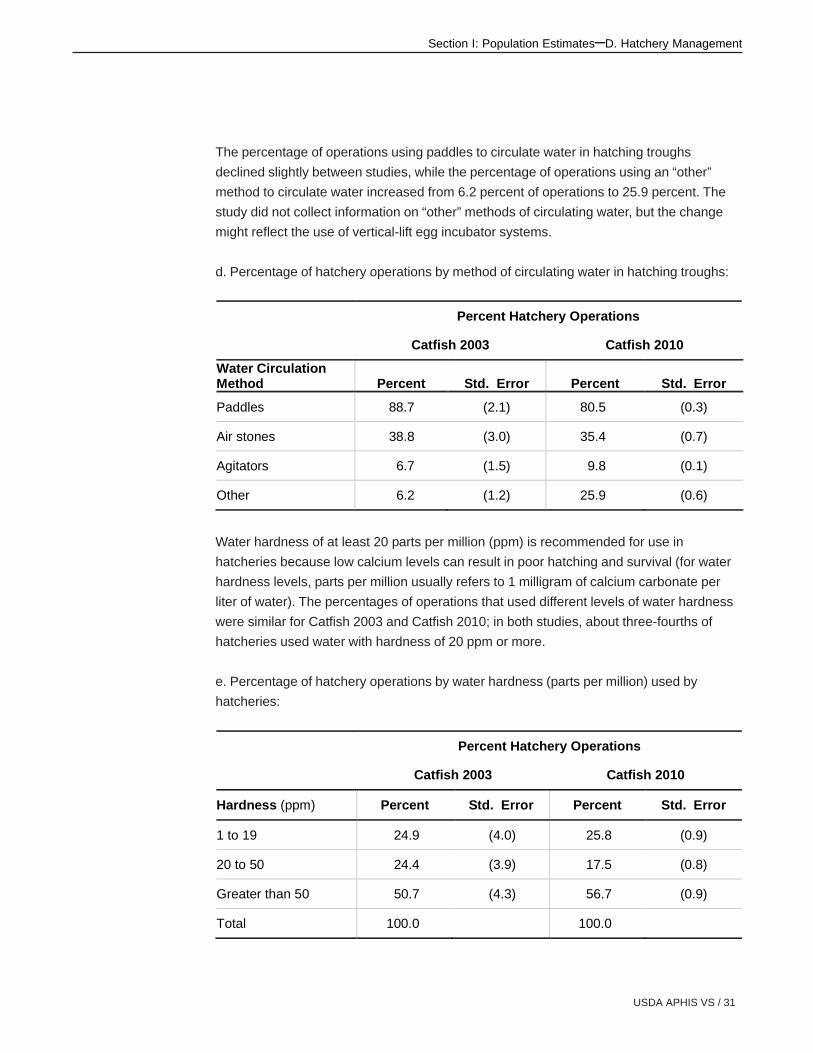
The percentage of operations using paddles to circulate water in hatching troughs
declined slightly between studies, while the percentage of operations using an “other”
method to circulate water increased from 6.2 percent of operations to 25.9 percent. The
study did not collect information on “other” methods of circulating water, but the change
might reflect the use of vertical-lift egg incubator systems.
d. Percentage of hatchery operations by method of circulating water in hatching troughs:
Percent Hatchery Operations
Catfish 2003 Catfish 2010
Water Circulation Method Percent Std. Error Percent Std. Error
Paddles 88.7 (2.1) 80.5 (0.3)
Air stones 38.8 (3.0) 35.4 (0.7)
Agitators 6.7 (1.5) 9.8 (0.1)
Other 6.2 (1.2) 25.9 (0.6)
Water hardness of at least 20 parts per million (ppm) is recommended for use in
hatcheries because low calcium levels can result in poor hatching and survival (for water
hardness levels, parts per million usually refers to 1 milligram of calcium carbonate per
liter of water). The percentages of operations that used different levels of water hardness
were similar for Catfish 2003 and Catfish 2010; in both studies, about three-fourths of
hatcheries used water with hardness of 20 ppm or more.
e. Percentage of hatchery operations by water hardness (parts per million) used by
hatcheries:
Percent Hatchery Operations
Catfish 2003 Catfish 2010
Hardness (ppm) Percent Std. Error Percent Std. Error
1 to 19 24.9 (4.0) 25.8 (0.9)
20 to 50 24.4 (3.9) 17.5 (0.8)
Greater than 50 50.7 (4.3) 56.7 (0.9)
Total 100.0 100.0
32 / Catfish 2010
Section I: Population Estimates–D. Hatchery Management
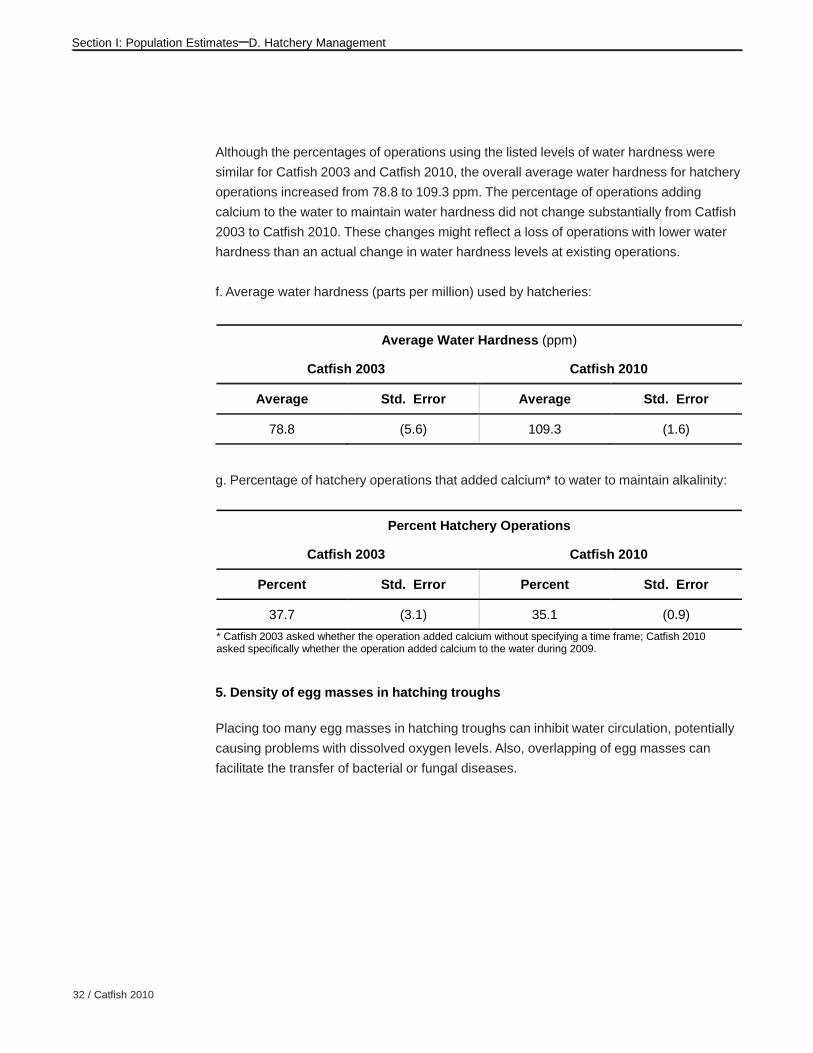
Although the percentages of operations using the listed levels of water hardness were
similar for Catfish 2003 and Catfish 2010, the overall average water hardness for hatchery
operations increased from 78.8 to 109.3 ppm. The percentage of operations adding
calcium to the water to maintain water hardness did not change substantially from Catfish
2003 to Catfish 2010. These changes might reflect a loss of operations with lower water
hardness than an actual change in water hardness levels at existing operations.
f. Average water hardness (parts per million) used by hatcheries:
Average Water Hardness (ppm)
Catfish 2003 Catfish 2010
Average Std. Error Average Std. Error
78.8 (5.6) 109.3 (1.6)
g. Percentage of hatchery operations that added calcium* to water to maintain alkalinity:
Percent Hatchery Operations
Catfish 2003 Catfish 2010
Percent Std. Error Percent Std. Error
37.7 (3.1) 35.1 (0.9)
* Catfish 2003 asked whether the operation added calcium without specifying a time frame; Catfish 2010 asked specifically whether the operation added calcium to the water during 2009.
5. Density of egg masses in hatching troughs
Placing too many egg masses in hatching troughs can inhibit water circulation, potentially
causing problems with dissolved oxygen levels. Also, overlapping of egg masses can
facilitate the transfer of bacterial or fungal diseases.
USDA APHIS VS / 33
Section I: Population Estimates–D. Hatchery Management
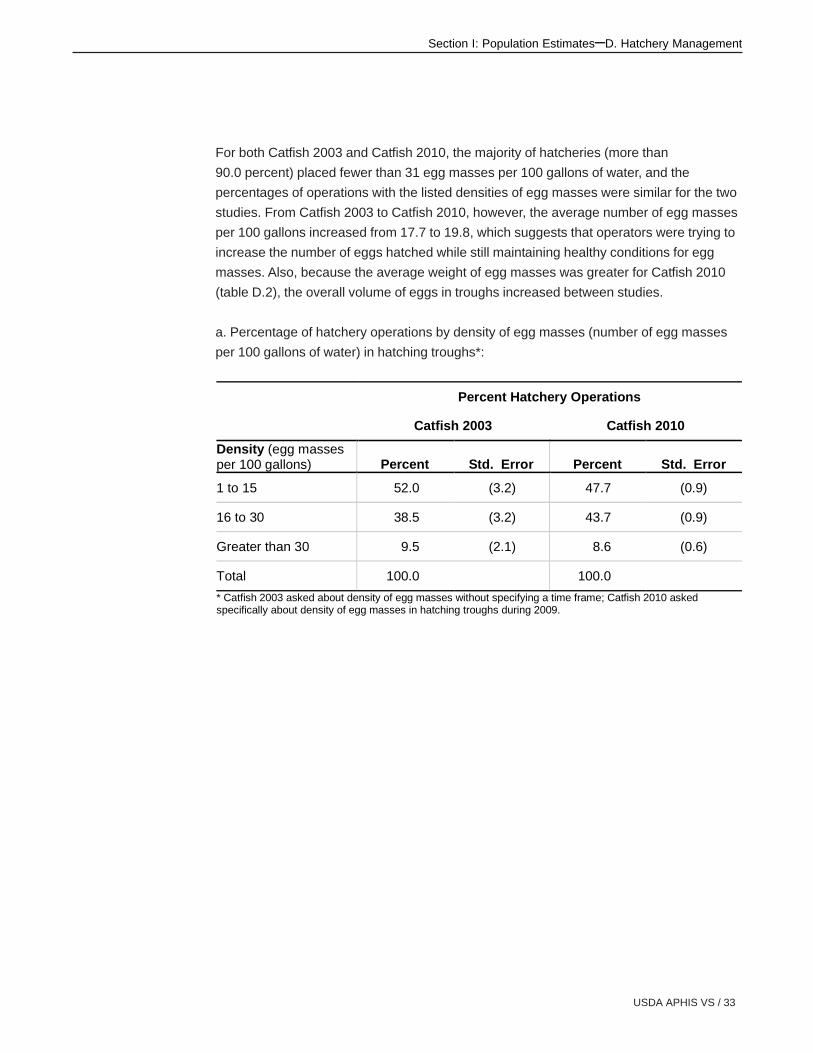
For both Catfish 2003 and Catfish 2010, the majority of hatcheries (more than
90.0 percent) placed fewer than 31 egg masses per 100 gallons of water, and the
percentages of operations with the listed densities of egg masses were similar for the two
studies. From Catfish 2003 to Catfish 2010, however, the average number of egg masses
per 100 gallons increased from 17.7 to 19.8, which suggests that operators were trying to
increase the number of eggs hatched while still maintaining healthy conditions for egg
masses. Also, because the average weight of egg masses was greater for Catfish 2010
(table D.2), the overall volume of eggs in troughs increased between studies.
a. Percentage of hatchery operations by density of egg masses (number of egg masses
per 100 gallons of water) in hatching troughs*:
Percent Hatchery Operations
Catfish 2003 Catfish 2010
Density (egg masses per 100 gallons) Percent Std. Error Percent Std. Error
1 to 15 52.0 (3.2) 47.7 (0.9)
16 to 30 38.5 (3.2) 43.7 (0.9)
Greater than 30 9.5 (2.1) 8.6 (0.6)
Total 100.0 100.0
* Catfish 2003 asked about density of egg masses without specifying a time frame; Catfish 2010 asked specifically about density of egg masses in hatching troughs during 2009.

34 / Catfish 2010
Section I: Population Estimates–D. Hatchery Management
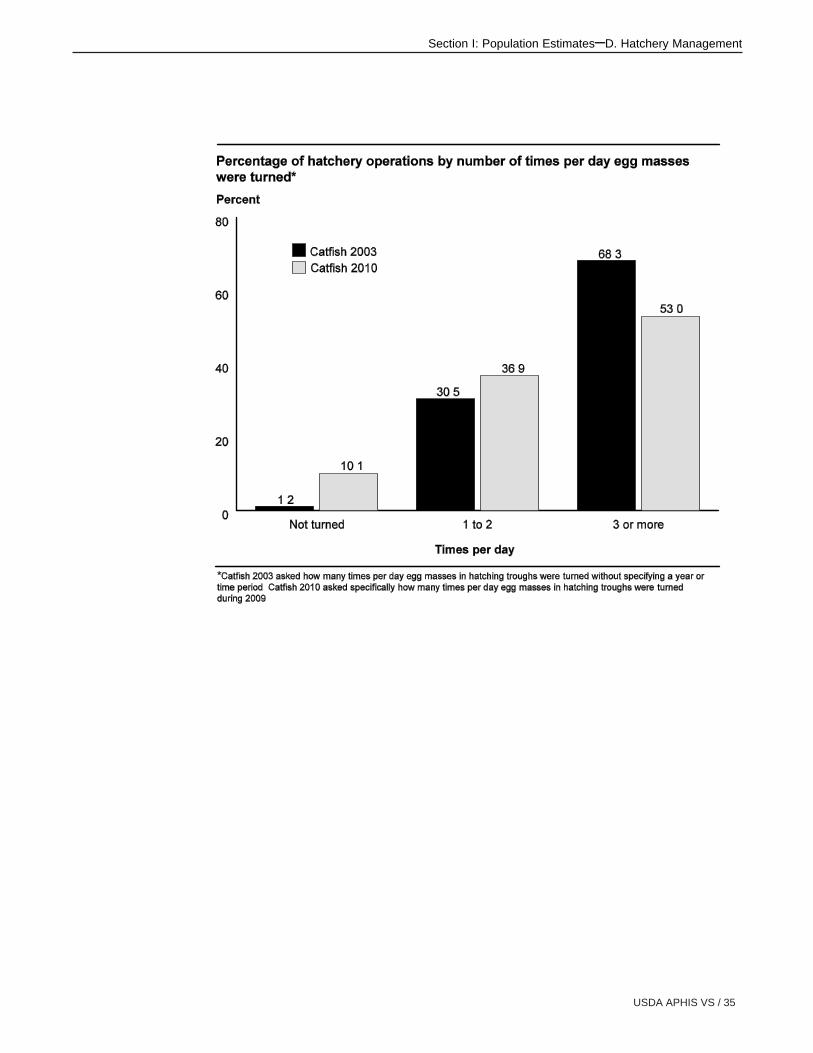
6. Turning of egg masses
Egg masses should be turned over on a regular basis to check for infected or dead eggs.
Although the majority of Catfish 2010 hatcheries (53.0 percent) turned eggs at least three
times per day, this percentage was a decline from 68.3 percent of operations in Catfish
2003. The percentage of operations that did not turn eggs on a daily basis increased from
1.2 to 10.1 percent from Catfish 2003 to Catfish 2010. The apparent decrease in the
number of times per day egg masses were turned might reflect reduced availability of
labor during difficult economic times or improvements in other management practices that
could reduce rates of egg infection or death, such as improved water circulation.
Percentage of hatchery operations by number of times per day egg masses were turned*:
Percent Hatchery Operations
Catfish 2003 Catfish 2010
Number Times per Day Percent Std. Error Percent Std. Error
Not turned 1.2 (0.4) 10.1 (0.2)
1 to 2 30.5 (2.7) 36.9 (0.8)
3 or more 68.3 (2.7) 53.0 (0.8)
Total 100.0 100.0
* Catfish 2003 asked how many times per day egg masses in hatching troughs were turned without specifying a year or time period; Catfish 2010 asked specifically how many times per day egg masses in hatching troughs were turned during 2009.
USDA APHIS VS / 35
Section I: Population Estimates–D. Hatchery Management
36 / Catfish 2010
Section I: Population Estimates–E. Egg Health Issues
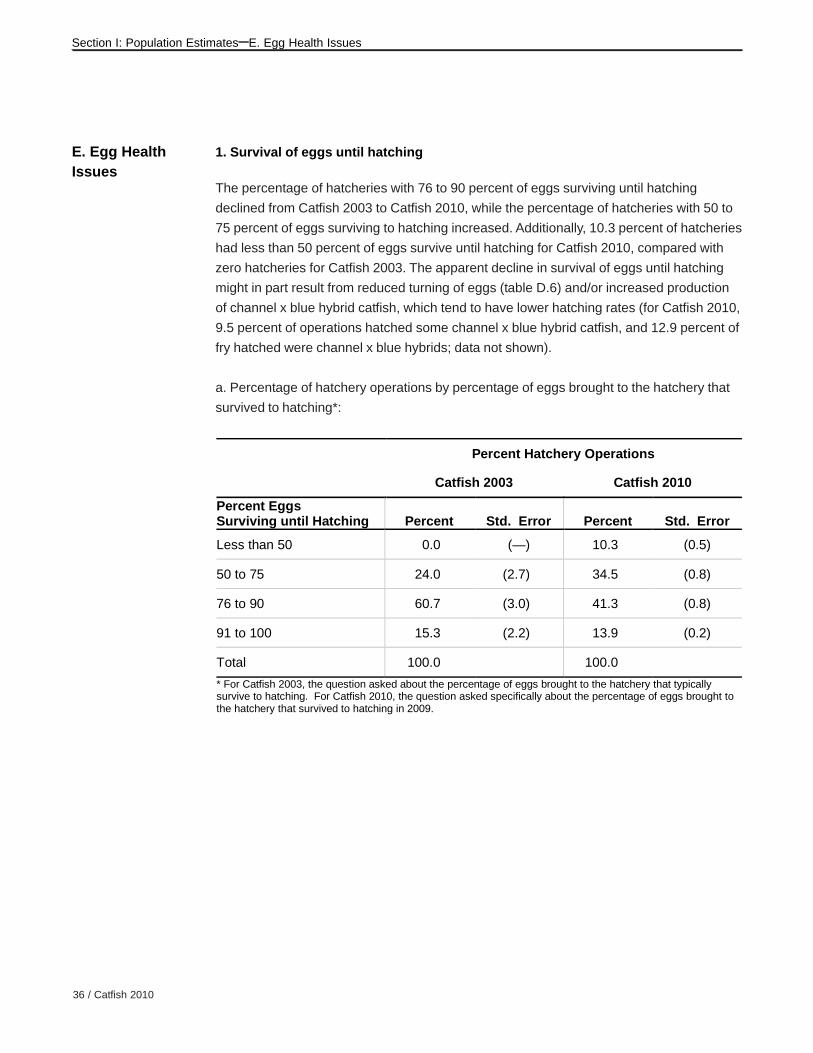
1. Survival of eggs until hatching
The percentage of hatcheries with 76 to 90 percent of eggs surviving until hatching
declined from Catfish 2003 to Catfish 2010, while the percentage of hatcheries with 50 to
75 percent of eggs surviving to hatching increased. Additionally, 10.3 percent of hatcheries
had less than 50 percent of eggs survive until hatching for Catfish 2010, compared with
zero hatcheries for Catfish 2003. The apparent decline in survival of eggs until hatching
might in part result from reduced turning of eggs (table D.6) and/or increased production
of channel x blue hybrid catfish, which tend to have lower hatching rates (for Catfish 2010,
9.5 percent of operations hatched some channel x blue hybrid catfish, and 12.9 percent of
fry hatched were channel x blue hybrids; data not shown).
a. Percentage of hatchery operations by percentage of eggs brought to the hatchery that
survived to hatching*:
E. Egg HealthIssues
Percent Hatchery Operations
Catfish 2003 Catfish 2010
Percent Eggs Surviving until Hatching Percent Std. Error Percent Std. Error
Less than 50 0.0 (—) 10.3 (0.5)
50 to 75 24.0 (2.7) 34.5 (0.8)
76 to 90 60.7 (3.0) 41.3 (0.8)
91 to 100 15.3 (2.2) 13.9 (0.2)
Total 100.0 100.0
* For Catfish 2003, the question asked about the percentage of eggs brought to the hatchery that typically survive to hatching. For Catfish 2010, the question asked specifically about the percentage of eggs brought to the hatchery that survived to hatching in 2009.

USDA APHIS VS / 37
Section I: Population Estimates–E. Egg Health Issues
Overall, about three-fourths of eggs brought into hatcheries survived to hatching in both
Catfish 2003 and Catfish 2010.
b. Percentage of eggs brought into the hatchery operation (weighted by number of egg
masses) that survived to hatching*:
Percent Eggs
Catfish 2003 Catfish 2010
Percent Std. Error Percent Std. Error
79.3 (2.1) 74.2 (3.6)
* For Catfish 2003, the question asked about the percentage of eggs brought to the hatchery that typically survive to hatching. For Catfish 2010, the question asked specifically about the percentage of eggs brought to the hatchery that survived to hatching in 2009.

38 / Catfish 2010
Section I: Population Estimates–E. Egg Health Issues
2. Causes of egg loss
The percentages of eggs brought into the hatchery that failed to hatch because of the
listed causes were similar for Catfish 2003 and Catfish 2010.
a. Percentage of eggs brought into the hatchery operation (weighted by number of egg
masses) that did not hatch,* by cause:
Percent Eggs
Catfish 2003 Catfish 2010
Cause Percent Std. Error Percent Std. Error
Fungal infections 8.3 (1.7) 3.5 (2.1)
Bacterial egg rot (or other bacterial infections)
3.7 (0.7) 1.6 (0.7)
Infertility 4.8 (1.6) 10.0 (3.3)
Other known 0.8 (0.7) 1.7 (1.4)
Unknown 3.1 (0.9) 9.0 (4.5)
Total 20.7 (2.1) 25.8 (3.6)
* For Catfish 2003, the question asked about the percentage of eggs brought to the hatchery that typically did not hatch. For Catfish 2010, the question asked specifically about the percentage of eggs brought to the hatchery that did not hatch in 2009.

USDA APHIS VS / 39
Section I: Population Estimates–E. Egg Health Issues
The percentages of operations that lost eggs to fungal or bacterial infections declined
from Catfish 2003 to Catfish 2010. The percentage of operations that lost eggs to
unknown causes increased slightly, however.
b. Percentage of hatchery operations with any eggs that did not hatch,* by cause:
Percent Hatchery Operations
Catfish 2003 Catfish 2010
Cause Percent Std. Error Percent Std. Error
Fungal infections 65.1 (2.9) 38.9 (0.7)
Bacterial egg rot (or other bacterial infections)
44.8 (3.0) 25.7 (0.7)
Infertility 52.5 (3.0) 48.3 (0.8)
Other 9.6 (1.4) 9.6 (0.6)
Unknown 44.4 (3.0) 55.0 (0.8)
* For Catfish 2003, the question asked about the percentage of eggs brought to the hatchery that typically did not hatch. For Catfish 2010, the question asked specifically about the percentage of eggs brought to the hatchery that did not hatch in 2009.

40 / Catfish 2010
Section I: Population Estimates–E. Egg Health Issues
Chemical treatment can help prevent fungal or bacterial infections in hatching troughs. For
Catfish 2010, about three-fourths of hatchery operations (74.0 percent) used some sort of
chemical treatment to prevent fungal or bacterial infections of eggs, a slight decline from
79.3 percent of operations for Catfish 2003. From Catfish 2003 to Catfish 2010, the
percentage of operations using Betadine or other iodine compounds decreased (from 43.0
to 28.8 percent of operations, respectively), while the percentage of operations using salt
increased (from 16.9 to 26.0 percent of operations, respectively); these changes might
reflect the relative cost of the two treatments.
a. Percentage of hatchery operations that used chemicals to prevent fungal or bacterial
infections in hatching troughs:*
3. Fungal/bacterial prevention and treatment
Operators can take a variety of measures to prevent disease in hatcheries, such as
maintaining adequate water flow and quality (including dissolved oxygen levels), keeping
eggs from being too crowded in hatching baskets, and treating eggs with chemicals.
Percent Hatchery Operations
Catfish 2003 Catfish 2010
Preventive Chemical Percent Std. Error Percent Std. Error
Betadine (iodine compounds)
43.0 (3.0) 28.8 (0.8)
Copper sulfate 42.7 (3.1) 38.4 (0.8)
Formalin 26.1 (2.8) 32.2 (0.7)
Potassium permanganate
7.9 (1.5)
Hydrogen peroxide 9.7 (0.4)
Salt 16.9 (2.1) 26.0 (0.6)
Any of the above 79.3 (2.1) 74.0 (0.5)
*For Catfish 2003, the question asked about general use of chemicals to prevent fungal or bacterial infections in hatching troughs; for Catfish 2010, the question asked specifically about chemicals used during 2009.

USDA APHIS VS / 41
Section I: Population Estimates–E. Egg Health Issues
For each of the listed chemicals, the average number of times per day that hatchery
operations treated eggs to prevent fungal or bacterial infections was similar for Catfish
2003 and Catfish 2010.
b. Average number of times per day hatchery operations used chemicals to prevent
fungal or bacterial infections in hatchery troughs:*
Average Times per Day
Catfish 2003 Catfish 2010
Preventive Chemical Average Std. Error Average Std. Error
Betadine (iodine compounds)
1.4 (0.1) 1.3 (0.2)
Copper sulfate 1.7 (0.1) 1.3 (0.2)
Formalin 2.0 (0.2) 1.5 (0.2)
Potassium permanganate
1.0 (0.0)
Hydrogen peroxide 1.0 (0.0)
Salt 1.5 (0.2) 1.3 (0.3)
*For Catfish 2003, the question asked about general use of chemicals to prevent fungal or bacterial infections in hatching troughs; for Catfish 2010, the question asked specifically about chemicals used during 2009.

42 / Catfish 2010
Section I: Population Estimates–E. Egg Health Issues
The primary disease concerns for catfish eggs are bacterial and fungal infections, which
can spread quickly once the disease-causing organisms are present. The changes from
Catfish 2003 to Catfish 2010 in use of chemicals to treat fungal infections are similar to
those seen for use of chemicals to prevent fungal or bacterial infections (see tables E.3.a
and E.3.c). The percentage of operations using Betadine or other iodine compounds to
treat fungal infections declined between studies, the percentage of operations using salt
increased, and the percentage of operations using any of the listed chemicals to treat
fungal infections decreased.
c. Percentage of hatchery operations that used chemicals to treat fungal infections in
hatching troughs:
Percent Hatchery Operations
Catfish 2003 Catfish 2010
Treatment Chemical Percent Std. Error Percent Std. Error
Betadine (iodine compounds)
41.9 (3.1) 19.3 (0.7)
Copper sulfate 35.0 (2.9) 28.8 (0.9)
Formalin 22.9 (2.6) 29.1 (0.7)
Potassium permanganate
9.2 (1.6)
Hydrogen peroxide 6.5 (0.4)
Salt 13.9 (1.8) 22.8 (0.6)
Any of the above 75.7 (2.3) 61.4 (0.7)
*For Catfish 2003, the question asked about general use of chemicals to treat fungal infections in hatching troughs; for Catfish 2010, the question asked specifically about chemicals used during 2009.
USDA APHIS VS / 43
Section I: Population Estimates–E. Egg Health Issues
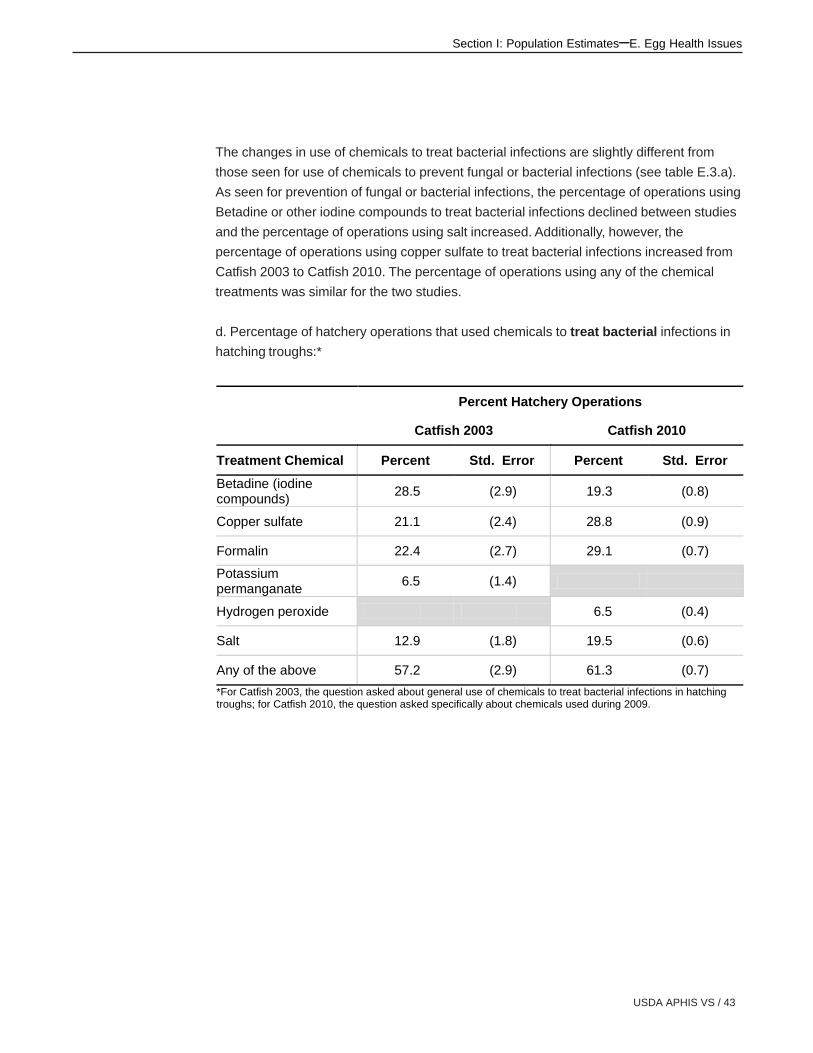
The changes in use of chemicals to treat bacterial infections are slightly different from
those seen for use of chemicals to prevent fungal or bacterial infections (see table E.3.a).
As seen for prevention of fungal or bacterial infections, the percentage of operations using
Betadine or other iodine compounds to treat bacterial infections declined between studies
and the percentage of operations using salt increased. Additionally, however, the
percentage of operations using copper sulfate to treat bacterial infections increased from
Catfish 2003 to Catfish 2010. The percentage of operations using any of the chemical
treatments was similar for the two studies.
d. Percentage of hatchery operations that used chemicals to treat bacterial infections in
hatching troughs:*
Percent Hatchery Operations
Catfish 2003 Catfish 2010
Treatment Chemical Percent Std. Error Percent Std. Error
Betadine (iodine compounds)
28.5 (2.9) 19.3 (0.8)
Copper sulfate 21.1 (2.4) 28.8 (0.9)
Formalin 22.4 (2.7) 29.1 (0.7)
Potassium permanganate
6.5 (1.4)
Hydrogen peroxide 6.5 (0.4)
Salt 12.9 (1.8) 19.5 (0.6)
Any of the above 57.2 (2.9) 61.3 (0.7)
*For Catfish 2003, the question asked about general use of chemicals to treat bacterial infections in hatching troughs; for Catfish 2010, the question asked specifically about chemicals used during 2009.

44 / Catfish 2010
Section I: Population Estimates–F. Fry Management
F. Fry Management 1. Number of fry hatched
The operation average number of fry hatched declined from 2003 to 2010.
Operation average number of fry hatched annually*:
Operation Average Number Hatched
Catfish 2003 Catfish 2010
Average Std. Error Average Std. Error
17,216,000 (1,346) 16,256,000 (578)
*For Catfish 2003, the question asked about the number of fry hatched annually; for Catfish 2010, the question asked specifically about fry hatched during 2009.
2. Length of time fry left in fry troughs
Although fry that have not fully absorbed the yolk sac can be stocked into fry/fingerling
ponds, survival is likely better if they are not stocked until they have absorbed the entire
yolk sac and been fed for a brief period. The percentage of operations leaving fry in fry
troughs for a longer period beyond swim-up increased between studies, with 71.0 percent
of operations leaving fry in fry troughs for 4 days or more past swim-up for Catfish 2010,
compared with 50.1 percent of operations for Catfish 2003. Concomitantly, the percentage
of operations leaving fry in fry troughs only 1 to 3 days past swim-up declined from
44.3 percent for Catfish 2003 to 25.8 percent for Catfish 2010.
Percentage of hatchery operations by how many days fry were normally left in fry troughs
past swim-up*:
Percent Hatchery Operations
Catfish 2003 Catfish 2010
Days Left in Fry Trough Past Swim-up Percent Std. Error Percent Std. Error
Release sac fry 5.6 (1.5) 3.2 (0.4)
1 to 3 44.3 (3.1) 25.8 (0.7)
4 to 7 37.4 (2.9) 51.7 (0.8)
More than 7 12.7 (1.7) 19.3 (0.7)
Total 100.0 100.0
*For Catfish 2003, the question did not specify a time frame; for Catfish 2010, the question asked specifically about 2009.

USDA APHIS VS / 45
Section I: Population Estimates–F. Fry Management

46 / Catfish 2010
Section I: Population Estimates–F. Fry Management
3. Primary feed in fry troughs
Perhaps in association with the increase in the percentage of operations keeping fry in fry
troughs for 4 or more days after swim-up (see table F.2), the percentage of operations that
did not feed fry in fry troughs declined between the two studies, from 9.5 percent of
operations for Catfish 2003 to 3.2 percent of operations for Catfish 2010. Other changes
in the primary feed fed in fry troughs were a decrease in the percentage of operations
feeding catfish starter (from 68.3 to 51.7 percent of operations) and an increase in the
percentage of operations feeding salmon/trout starter (from 11.1 to 35.4 percent of
operations). The apparent shift toward salmon/trout starter might be related to research
indicating that fry gained 50 to 75 percent more body weight on salmon or trout starter
than on catfish starter.
Percentage of hatchery operations by primary feed fed in fry troughs*:
Percent Hatchery Operations
Catfish 2003 Catfish 2010
Primary Feed Percent Std. Error Percent Std. Error
Catfish starter 68.3 (2.9) 51.7 (0.8)
Salmon/trout starter 11.1 (2.0) 35.4 (0.7)
Krill 6.2 (1.8) 3.2 (0.4)
Other 4.9 (1.0) 6.5 (0.1)
Nothing fed to fry in fry troughs
9.5 (1.8) 3.2 (0.4)
Total 100.0 100.0
*For Catfish 2003, the question did not specify a time frame; for Catfish 2010, the question asked specifically about 2009.

USDA APHIS VS / 47
Section I: Population Estimates–F. Fry Management
4. Number of feedings per day for fry
There were no substantial changes from 2003 to 2010 in percentages of operations based
on the number of times per day that fry in fry troughs were fed.
For hatchery operations that fed fry in fry troughs, percentage of operations by number of
times fry were fed in a 24-hour period*:
Percent Hatchery Operations
Catfish 2003 Catfish 2010
Number Times Fed Per 24-hour Period Percent Std. Error Percent Std. Error
1 to 2 12.5 (1.8) 13.5 (0.2)
3 to 4 19.2 (2.1) 20.2 (0.5)
5 to 6 20.7 (2.6) 20.1 (0.5)
7 or more 47.6 (3.1) 46.2 (0.8)
Total 100.0 100.0
*For Catfish 2003, the question did not specify a time frame; for Catfish 2010, the question asked specifically about 2009.
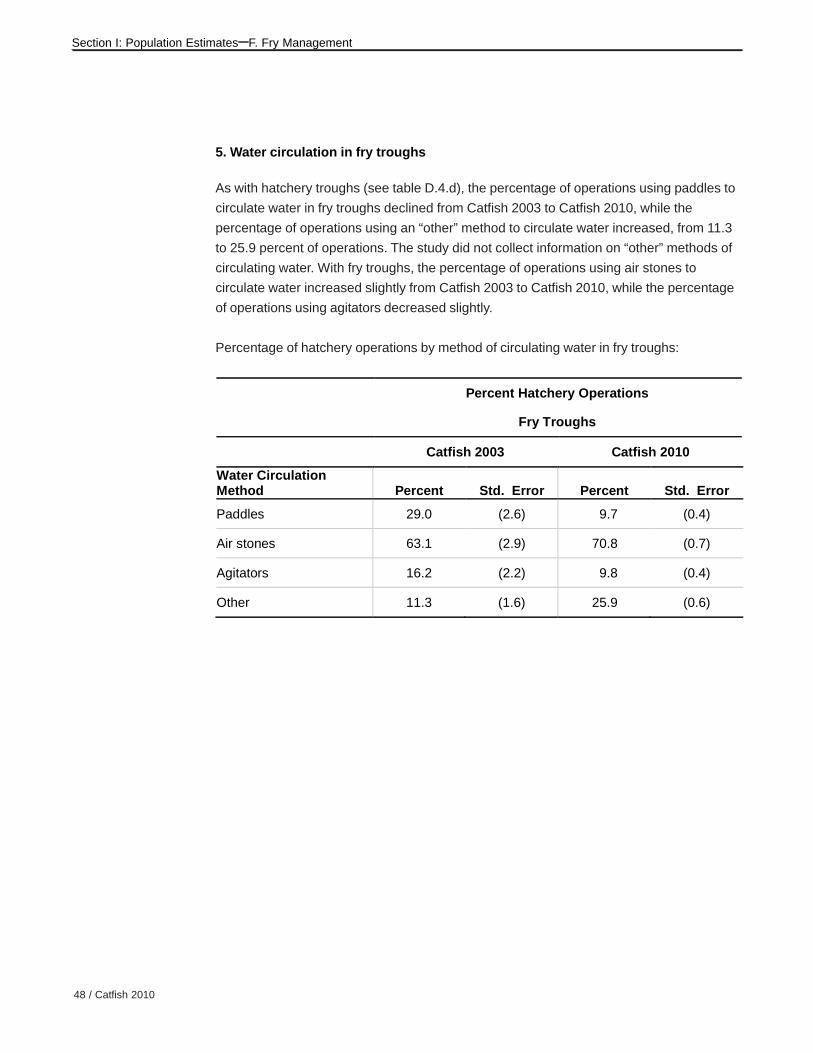
48 / Catfish 2010
Section I: Population Estimates–F. Fry Management
5. Water circulation in fry troughs
As with hatchery troughs (see table D.4.d), the percentage of operations using paddles to
circulate water in fry troughs declined from Catfish 2003 to Catfish 2010, while the
percentage of operations using an “other” method to circulate water increased, from 11.3
to 25.9 percent of operations. The study did not collect information on “other” methods of
circulating water. With fry troughs, the percentage of operations using air stones to
circulate water increased slightly from Catfish 2003 to Catfish 2010, while the percentage
of operations using agitators decreased slightly.
Percentage of hatchery operations by method of circulating water in fry troughs:
Percent Hatchery Operations
Fry Troughs
Catfish 2003 Catfish 2010
Water Circulation Method Percent Std. Error Percent Std. Error
Paddles 29.0 (2.6) 9.7 (0.4)
Air stones 63.1 (2.9) 70.8 (0.7)
Agitators 16.2 (2.2) 9.8 (0.4)
Other 11.3 (1.6) 25.9 (0.6)
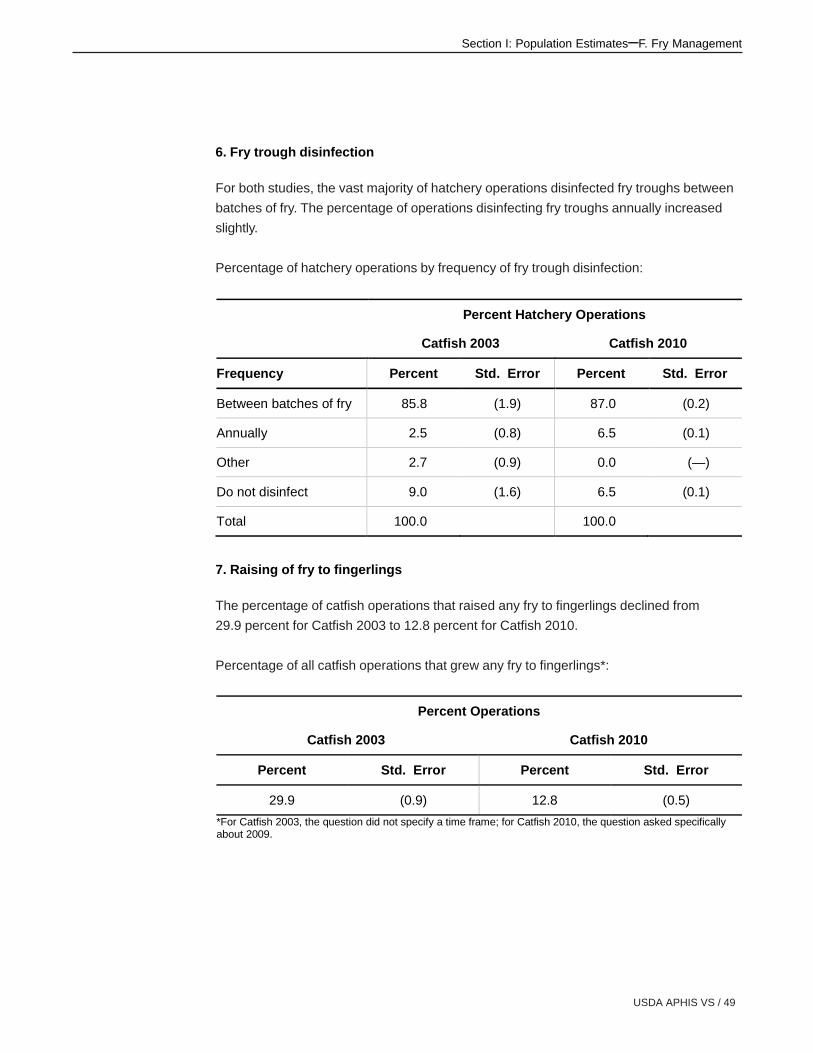
USDA APHIS VS / 49
Section I: Population Estimates–F. Fry Management
6. Fry trough disinfection
For both studies, the vast majority of hatchery operations disinfected fry troughs between
batches of fry. The percentage of operations disinfecting fry troughs annually increased
slightly.
Percentage of hatchery operations by frequency of fry trough disinfection:
Percent Hatchery Operations
Catfish 2003 Catfish 2010
Frequency Percent Std. Error Percent Std. Error
Between batches of fry 85.8 (1.9) 87.0 (0.2)
Annually 2.5 (0.8) 6.5 (0.1)
Other 2.7 (0.9) 0.0 (—)
Do not disinfect 9.0 (1.6) 6.5 (0.1)
Total 100.0 100.0
7. Raising of fry to fingerlings
The percentage of catfish operations that raised any fry to fingerlings declined from
29.9 percent for Catfish 2003 to 12.8 percent for Catfish 2010.
Percentage of all catfish operations that grew any fry to fingerlings*:
Percent Operations
Catfish 2003 Catfish 2010
Percent Std. Error Percent Std. Error
29.9 (0.9) 12.8 (0.5)
*For Catfish 2003, the question did not specify a time frame; for Catfish 2010, the question asked specifically about 2009.

50 / Catfish 2010
Section I: Population Estimates–G. Management of Fry/Fingerling Ponds Prior to Stocking
G. Management ofFry/FingerlingPonds Prior toStocking
1. Placement of fry in raceways or tanks prior to stocking
Moving fry from the fry trough directly to another tank or raceway might increase survival
rate by giving fry more time to develop and grow before they are placed in a fry/fingerling
pond. The percentage of operations that moved fry from the fry trough to raceways or
tanks before stocking them into fry/fingerling ponds increased slightly, from 6.7 percent of
operations for Catfish 2003 to 11.5 percent of operations for Catfish 2010.
a. Percentage of fingerling operations that moved swim-up fry from fry troughs to
raceways or tanks before stocking them into fry/fingerling ponds*:
Percent Fingerling Operations
Catfish 2003 Catfish 2010
Percent Std. Error Percent Std. Error
6.7 (0.9) 11.5 (0.5)
*For Catfish 2003, the question did not specify a time frame; for Catfish 2010, the question asked specifically about 2009.
For fingerling operations that placed fry in raceways or tanks before moving them into
fry/fingerling ponds, 100.0 percent of Catfish 2010 operations waited until fry were at least
8 days old to move them, an increase from 59.3 percent of Catfish 2003 operations.
Although 40.7 percent of Catfish 2003 operations moved fry from raceways or tanks when
they were 4 to 7 days old, no Catfish 2010 operations moved fry from raceways or tanks
at this age.
b. For fingerling operations that placed fry in raceways or tanks, percentage of operations
by average age of fry (days) when moved from the raceway or tank to fry/fingerling
ponds*:
Percent Fingerling Operations
Catfish 2003 Catfish 2010
Average Age (days after hatching) Percent Std. Error Percent Std. Error
4 to 7 40.7 (6.7) 0.0 (—)
8 to 14 33.9 (6.5) 66.7 (2.1)
15 or more 25.4 (6.2) 33.3 (2.1)
Total 100.0 100.0
*For Catfish 2003, the question did not specify a time frame; for Catfish 2010, the question asked specifically about 2009.

USDA APHIS VS / 51
Section I: Population Estimates–G. Management of Fry/Fingerling Ponds Prior to Stocking
2. Number and size of fry/fingerling ponds
From Catfish 2003 to Catfish 2010, the percentage of operations with 1 to 2 fry/fingerling
ponds decreased from 28.2 to 21.1 percent, while the percentage of operations with 11 or
more fry/fingerling ponds increased from 23.3 to 34.7 percent. These changes might
reflect the economic climate for catfish operations, with smaller operators leaving the
business and/or operations increasing in size to gain from economies of scale and
improve profitability.
a. Percentage of fingerling operations by number of fry/fingerling ponds*:
Percent Fingerling Operations
Catfish 2003 Catfish 2010
Number of Fry/Fingerling Ponds Percent Std. Error Percent Std. Error
1 to 2 28.2 (1.5) 21.1 (0.7)
3 to 4 19.2 (1.5) 17.3 (0.6)
5 to 6 11.3 (1.2) 11.5 (0.6)
7 to 10 18.0 (1.6) 15.4 (0.7)
11 or more 23.3 (1.7) 34.7 (0.9)
Total 100.0 100.0
*Catfish 2003 asked about the number of fry/fingerling ponds on the operation, whereas Catfish 2010 asked specifically about the number of fry/fingerling ponds used for production during 2009.

52 / Catfish 2010
Section I: Population Estimates–G. Management of Fry/Fingerling Ponds Prior to Stocking

USDA APHIS VS / 53
Section I: Population Estimates–G. Management of Fry/Fingerling Ponds Prior to Stocking
From Catfish 2003 to Catfish 2010, the average number of fry/fingerling ponds on
fingerling operations increased from 10.3 to 15.6 ponds. Additionally, the average pond
size increased between the two studies from 7.6 to 8.7 surface acres, with the total
surface acres per operation also increasing, from 77.0 to 136.5 surface acres. Again,
these changes might reflect the exit of smaller operations from the business and/or
enlargement of operations to become more cost-effective and competitive.
b. For fingerling operations, average number of fry/fingerling ponds, average pond size
(surface acres), and average total surface acres of ponds*:
Average
Catfish 2003 Catfish 2010
Average Std. Error Average Std. Error
Number of ponds 10.3 (0.8) 15.6 (0.6)
Pond size (surface acres)
7.6 (0.2) 8.7 (0.2)
Total surface acres 77.0 (5.5) 136.5 (6.6)
*Catfish 2003 asked about the number of fry/fingerling ponds on the operation, whereas Catfish 2010 asked specifically about the number of fry/fingerling ponds used for production during 2009.
3. Treatment of fry/fingerling ponds before stocking
Preparing fingerling ponds before stocking helps minimize loss of catfish to aquatic
predators and establish zooplankton as a food source for catfish. Pond treatments
typically include some combination of draining, drying, and/or poisoning with an approved
toxicant registered with the U.S. Environmental Protection Agency (such as chlorine,
rotenone, or antimycin A).

54 / Catfish 2010
Section I: Population Estimates–G. Management of Fry/Fingerling Ponds Prior to Stocking
With the exception of “other” treatments, the percentages of operations using the various
treatment options were similar for Catfish 2003 and Catfish 2010. For both studies, almost
three-fourths of operations drained and dried ponds or drained and poisoned ponds
before stocking them with catfish. A small percentage of operations (2.1 percent) used
“other” treatments for Catfish 2003, but no operations did for Catfish 2010.
Percentage of fingerling operations by procedure that best describes the treatment of fry/
fingerling ponds before stocking*:
Percent Fingerling Operations
Catfish 2003 Catfish 2010
Treatment Percent Std. Error Percent Std. Error
Drained and dried 48.9 (1.9) 45.0 (0.9)
Drained and poisoned 24.3 (1.8) 29.5 (0.9)
Poisoned but not drained
13.4 (1.4) 11.8 (0.6)
Neither drained nor poisoned
11.3 (1.0) 13.7 (0.5)
Other 2.1 (0.5) 0.0 (—)
Total 100.0 100.0
*Catfish 2010 asked specifically about the treatment of ponds before stocking in 2009.

USDA APHIS VS / 55
Section I: Population Estimates–G. Management of Fry/Fingerling Ponds Prior to Stocking
4. Number of days between filling of ponds and stocking
The amount of time operators wait between refilling a drained pond and stocking it with
catfish is a balance requiring enough time for proper zooplankton populations to become
established but not enough time for predatory aquatic insects to become established.
The percentages of operations waiting the listed numbers of days between filling a
drained pond with water and stocking it with fish were similar for Catfish 2003 and Catfish
2010. For each study, more than half of operations waited 7 to 14 days between filling and
restocking the pond.
a. For fingerling operations that drained fingerling ponds before stocking,* percentage of
operations by usual number of days between filling fingerling ponds with water and
stocking with fry:
Percent Fingerling Operations
Catfish 2003 Catfish 2010
Days Between Filling and Stocking Percent Std. Error Percent Std. Error
Fewer than 7 20.6 (1.9) 19.4 (0.9)
7 to 14 53.1 (2.3) 55.6 (1.1)
15 or more 26.3 (2.1) 25.0 (1.0)
Total 100.0 100.0
*Catfish 2010 asked specifically about the treatment of ponds before stocking in 2009.
For both studies, fingerling operations waited on average about 2 weeks between refilling
ponds and stocking them.
b. For fingerling operations that drained fingerling ponds before stocking,* average usual
number of days between filling fry/fingerling ponds with water and stocking fry*:
Average Number of Days
Catfish 2003 Catfish 2010
Average Std. Error Average Std. Error
14.0 (0.5) 15.4 (0.3)
*Catfish 2010 asked specifically about the treatment of ponds before stocking in 2009.

56 / Catfish 2010
Section I: Population Estimates–G. Management of Fry/Fingerling Ponds Prior to Stocking
5. Number of years between complete renovations of fry/fingerling ponds
Complete renovations of ponds are an expensive and time-consuming process. From
Catfish 2003 to Catfish 2010, the percentage of operations waiting 6 to 10 years between
complete renovations increased from 48.3 to 57.8 percent. Concomitantly, the percentage
of operations waiting only 1 to 5 years between complete renovations decreased, from
32.0 to 21.0 percent.
a. Percentage of fingerling operations by usual number of years between complete
renovations of fry/fingerling ponds:
Percent Fingerling Operations
Catfish 2003 Catfish 2010
Years Between Complete Renovations Percent Std. Error Percent Std. Error
1 to 5 32.0 (2.0) 21.0 (0.8)
6 to 10 48.3 (2.3) 57.8 (1.1)
11 or more 19.7 (2.0) 21.2 (1.0)
Total 100.0 100.0
The average time operations waited between complete renovations of fingerling ponds
increased from Catfish 2003 to Catfish 2010.
b. Average usual time (in years) between complete renovations of fingerling ponds:
Average Time (years)
Catfish 2003 Catfish 2010
Average Std. Error Average Std. Error
8.5 (0.2) 9.3 (0.1)

USDA APHIS VS / 57
Section I: Population Estimates–G. Management of Fry/Fingerling Ponds Prior to Stocking
6. Fertilization of fry/fingerling ponds
Fertilizing fingerling ponds promotes a bloom of beneficial zooplankton, providing food for
catfish fry. This process can be especially important for ponds that have been drained,
dried, and/or poisoned. From Catfish 2003 to Catfish 2010, the percentage of operations
that fertilized fry/fingerling ponds decreased from 57.5 to 46.2 percent.
a. Percentage of fingerling operations that fertilized fry/fingerling ponds*:
Percent Fingerling Operations
Catfish 2003 Catfish 2010
Percent Std. Error Percent Std. Error
57.5 (1.9) 46.2 (0.9)
*Catfish 2003 asked about the operations’ usual practice, whereas Catfish 2010 asked specifically about pond fertilization practices during 2009.
Some time is needed between fertilizing ponds and stocking catfish to let zooplankton
populations develop in the ponds. For both studies, at least three-fourths of operations
that fertilized fingerling ponds began fertilizing ponds at least 7 days before stocking fry.
b. For operations that fertilized fry/fingerling ponds, percentage of operations by number
of days between beginning fertilization and stocking ponds:
Percent Operations
Catfish 2003 Catfish 2010
Days Between Beginning Fertilization and Stocking Percent Std. Error Percent Std. Error
Fewer than 7 22.4 (1.9) 23.7 (1.2)
7 to 14 64.1 (2.3) 57.3 (1.4)
15 or more 13.5 (1.8) 19.0 (1.0)
Total 100.0 100.0

58 / Catfish 2010
Section I: Population Estimates–G. Management of Fry/Fingerling Ponds Prior to Stocking
7. Chloride level
High chloride levels in ponds can help prevent methemoglobinemia, or brown blood
disease, in catfish. Methemoglobinemia develops when nitrite in pond water crosses the
gill epithelium and enters the bloodstream, complexing with hemoglobin to form
methemoglobin. Red blood cells containing methemoglobin cannot transport oxygen,
causing fish to become hypoxic even in water with high oxygen content. High chloride
levels in water can prevent nitrite from crossing the gill epithelium, thereby preventing
development of brown blood disease.
Pond chloride levels in excess of 100 ppm are considered adequate to preclude the need
to regularly monitor nitrite levels. The operation average chloride level during summer
months in fry/fingerling ponds exceeded 100 ppm for both Catfish 2003 and Catfish 2010,
and the level was similar for the two studies.
Operation average chloride level in fry/fingerling ponds (parts per million) during summer:
Operation Average Chloride Level (ppm)
Catfish 2003 Catfish 2010
Average Std. Error Average Std. Error
135.0 (23.0) 153.5 (5.7)

USDA APHIS VS / 59
Section I: Population Estimates–G. Management of Fry/Fingerling Ponds Prior to Stocking
8. Salt use
Fingerling producers can add salt to ponds if chloride levels are not high enough to
prevent problems with nitrites. From Catfish 2003 to Catfish 2010, however, the
percentage of operations that did not add salt to fry/fingerling ponds increased from about
one-third of operations (32.3 percent) to almost two-thirds of operations (61.4 percent).
The percentages of operations that added salt—either routinely to maintain a desired
chloride level or only in response to health problems—declined between studies. The
operation average chloride level was similar for the studies, however (table G.7), which
suggests these findings might be related to changes in the population of operations.
Percentage of fingerling operations by use of salt in fry/fingerling ponds*:
Percent Fingerling Operations
Catfish 2003 Catfish 2010
Salt Use Percent Std. Error Percent Std. Error
Routinely added salt to maintain a desired chloride level
45.5 (1.8) 30.9 (0.9)
Added salt only in response to health problems
22.2 (1.6) 7.7 (0.5)
Did not add salt 32.3 (1.5) 61.4 (0.9)
Total 100.0 100.0
*Catfish 2010 asked specifically about the use of salt in ponds during 2009, whereas Catfish 2003 did not specify a time frame.

60 / Catfish 2010
Section I: Population Estimates–H. Management of Fingerling Ponds after Stocking
H. Management ofFry/FingerlingPonds afterStocking
1. Fry stocked in years preceding the study
The stocking rates obtained for Catfish 2010 (11.5 million fry in 2008 and 9.7 million fry in
2009) were increases over the stocking rates obtained for Catfish 2003 (7.0 million fry in
2001 and 6.0 million fry in 2002). This finding is likely related to the increase in operation
size and/or the loss of smaller operations (see table G.2.b).
Operation average number of fry stocked into fry/fingerling ponds for the previous 2 years,
by year:
Operation Average Number of Fry (x1,000)
Catfish 2003 Catfish 2010
2001 2002 2008 2009
Avg. Std.
Error Avg. Std.
Error Avg. Std. Error Avg.
Std. Error
6,963.5 (487.6) 6,039.7 (478.8) 11,493 (534) 9,711 (502)
2. Fry stocking rates
Stocking density affects health, growth rate, and survival of fish. From 2003 to 2010, the
percentage of ponds stocked at a rate of 100,000 to 149,000 fry per acre decreased, while
the percentage of ponds stocked at a rate of 200,000 or more fry per acre increased.
The percentage of operations that did not stock fry/fingerling ponds in the year preceding
the study decreased from 11.9 percent in Catfish 2003 to 1.9 percent in 2010.
Percentage of fry/fingerling ponds by stocking rate in the year preceding the study:
Percent Fry/Fingerling Ponds
Catfish 2003 Catfish 2010
Stocking Rate (fry/acre) Percent Std. Error Percent Std. Error
Less than 100,000 33.6 (3.5) 36.8 (1.3)
100,000 to 149,000 47.6 (3.4) 30.7 (1.6)
150,000 to 199,000 6.1 (1.0) 5.0 (0.3)
200,000 or more 12.7 (1.7) 27.5 (1.8)
Total 100.0 100.0

USDA APHIS VS / 61
Section I: Population Estimates–H. Management of Fingerling Ponds after Stocking
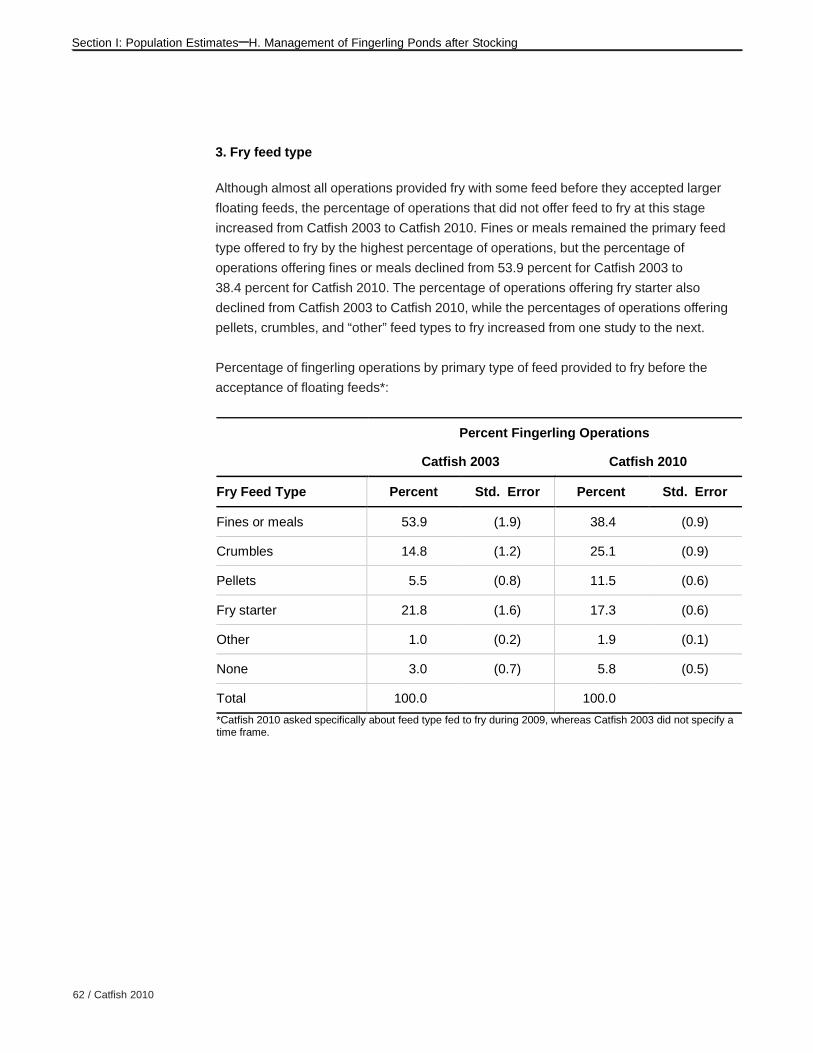
62 / Catfish 2010
Section I: Population Estimates–H. Management of Fingerling Ponds after Stocking
3. Fry feed type
Although almost all operations provided fry with some feed before they accepted larger
floating feeds, the percentage of operations that did not offer feed to fry at this stage
increased from Catfish 2003 to Catfish 2010. Fines or meals remained the primary feed
type offered to fry by the highest percentage of operations, but the percentage of
operations offering fines or meals declined from 53.9 percent for Catfish 2003 to
38.4 percent for Catfish 2010. The percentage of operations offering fry starter also
declined from Catfish 2003 to Catfish 2010, while the percentages of operations offering
pellets, crumbles, and “other” feed types to fry increased from one study to the next.
Percentage of fingerling operations by primary type of feed provided to fry before the
acceptance of floating feeds*:
Percent Fingerling Operations
Catfish 2003 Catfish 2010
Fry Feed Type Percent Std. Error Percent Std. Error
Fines or meals 53.9 (1.9) 38.4 (0.9)
Crumbles 14.8 (1.2) 25.1 (0.9)
Pellets 5.5 (0.8) 11.5 (0.6)
Fry starter 21.8 (1.6) 17.3 (0.6)
Other 1.0 (0.2) 1.9 (0.1)
None 3.0 (0.7) 5.8 (0.5)
Total 100.0 100.0
*Catfish 2010 asked specifically about feed type fed to fry during 2009, whereas Catfish 2003 did not specify a time frame.

USDA APHIS VS / 63
Section I: Population Estimates–H. Management of Fingerling Ponds after Stocking
4. Fry feeding frequency
Fingerling feeding frequency tends to vary by season. From Catfish 2003 to Catfish 2010,
the percentage of operations that fed fish at least twice a day increased in the spring,
when fry are present. The percentage of operations that fed fish at least twice a day in the
summer declined between studies, while the percentage of operations that fed fish every
other day in the summer increased. The percentage of operations that fed fish at an
“other” rate in the summer also increased from Catfish 2003 to Catfish 2010. For both
studies, the highest percentage of operations fed once a day during summer.
a. Percentage of fingerling operations by how often fry/fingerlings were usually fed during
spring and summer*:
Percent Fingerling Operations
Catfish 2003 Catfish 2010
Spring Summer Spring Summer
Feeding Frequency Pct.
Std. Error Pct.
Std. Error Pct.
Std. Error Pct.
Std. Error
At least twice a day
37.3 (1.9) 33.6 (1.9) 46.2 (0.9) 26.9 (0.8)
Once a day 40.8 (1.9) 60.7 (1.9) 38.4 (0.9) 57.7 (0.9)
Every other day
12.5 (1.3) 3.3 (0.6) 9.6 (0.5) 9.6 (0.6)
Every third day
4.0 (0.8) 1.3 (0.5)
Other 5.4 (0.8) 1.1 (0.4) 5.8 (0.4) 5.8 (0.5)
Total 100.0 100.0 100.0 100.0
*Catfish 2010 asked specifically about feeding practices during 2009, whereas Catfish 2003 did not specify a time frame.
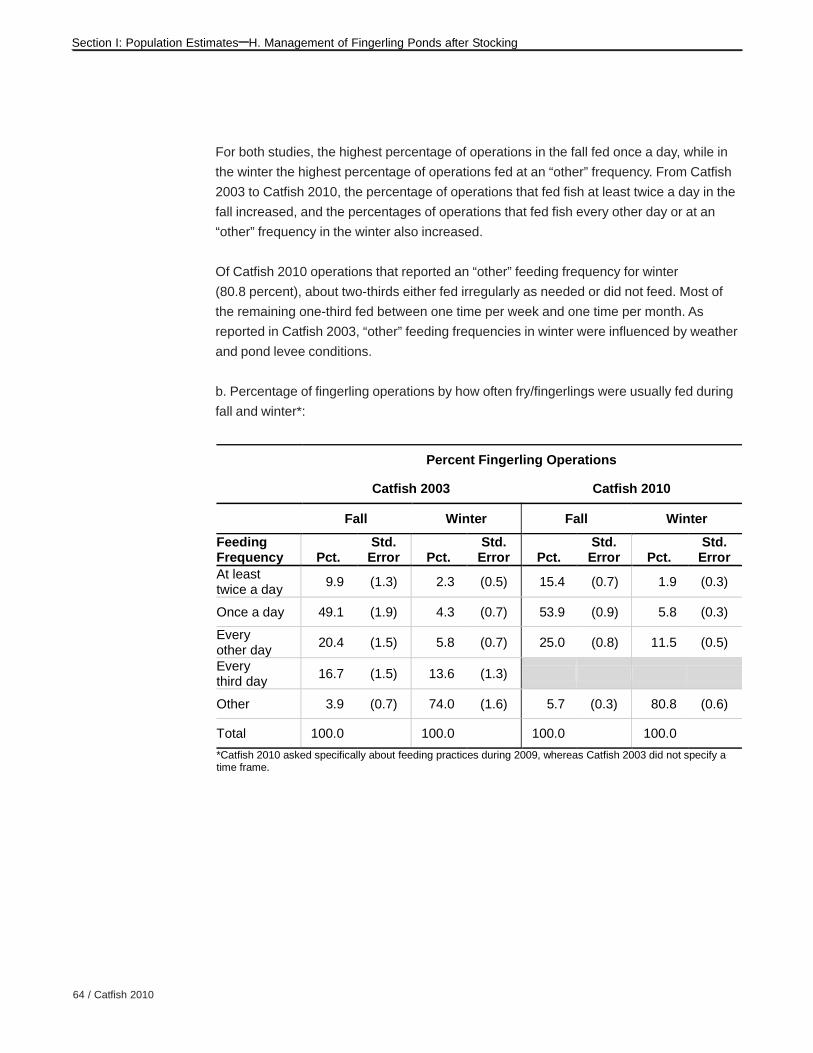
64 / Catfish 2010
Section I: Population Estimates–H. Management of Fingerling Ponds after Stocking
For both studies, the highest percentage of operations in the fall fed once a day, while in
the winter the highest percentage of operations fed at an “other” frequency. From Catfish
2003 to Catfish 2010, the percentage of operations that fed fish at least twice a day in the
fall increased, and the percentages of operations that fed fish every other day or at an
“other” frequency in the winter also increased.
Of Catfish 2010 operations that reported an “other” feeding frequency for winter
(80.8 percent), about two-thirds either fed irregularly as needed or did not feed. Most of
the remaining one-third fed between one time per week and one time per month. As
reported in Catfish 2003, “other” feeding frequencies in winter were influenced by weather
and pond levee conditions.
b. Percentage of fingerling operations by how often fry/fingerlings were usually fed during
fall and winter*:
Percent Fingerling Operations
Catfish 2003 Catfish 2010
Fall Winter Fall Winter
Feeding Frequency Pct.
Std. Error Pct.
Std. Error Pct.
Std. Error Pct.
Std. Error
At least twice a day
9.9 (1.3) 2.3 (0.5) 15.4 (0.7) 1.9 (0.3)
Once a day 49.1 (1.9) 4.3 (0.7) 53.9 (0.9) 5.8 (0.3)
Every other day
20.4 (1.5) 5.8 (0.7) 25.0 (0.8) 11.5 (0.5)
Every third day
16.7 (1.5) 13.6 (1.3)
Other 3.9 (0.7) 74.0 (1.6) 5.7 (0.3) 80.8 (0.6)
Total 100.0 100.0 100.0 100.0
*Catfish 2010 asked specifically about feeding practices during 2009, whereas Catfish 2003 did not specify a time frame.

USDA APHIS VS / 65
Section I: Population Estimates–H. Management of Fingerling Ponds after Stocking
5. Protein level of feed
Intermediate-sized fingerlings (2 inches or more but less than 5 inches in length) can be
fed higher protein levels (such as 35 percent protein). Protein levels of 28 to 32 percent
are suitable for small fingerlings (less than 2 inches in length) or large fingerlings
(5 inches or more in length).
The percentages of operations primarily feeding 28 or 32 percent protein increased from
Catfish 2003 to Catfish 2010, while the percentage of operations providing feed with
35 percent protein declined. From Catfish 2003 to Catfish 2010, the protein level primarily
fed by the highest percentage of operations changed from 35 to 32 percent protein. For
Catfish 2010, the “other” protein levels specified by respondents were primarily a
combination of 36 and 38 percent protein.
Percentage of fingerling operations by percentage of protein in the floating feed primarily
fed to fry/fingerlings*:
Percent Fingerling Operations
Catfish 2003 Catfish 2010
Percent Protein Level Percent Std. Error Percent Std. Error
28 8.0 (1.0) 15.7 (0.7)
32 33.3 (1.8) 49.1 (0.9)
35 41.3 (1.9) 17.6 (0.7)
Other protein 17.4 (1.3) 17.6 (0.6)
Total 100.0 100.0
*Catfish 2010 asked specifically about feeding practices during 2009, whereas Catfish 2003 did not specify a time frame.
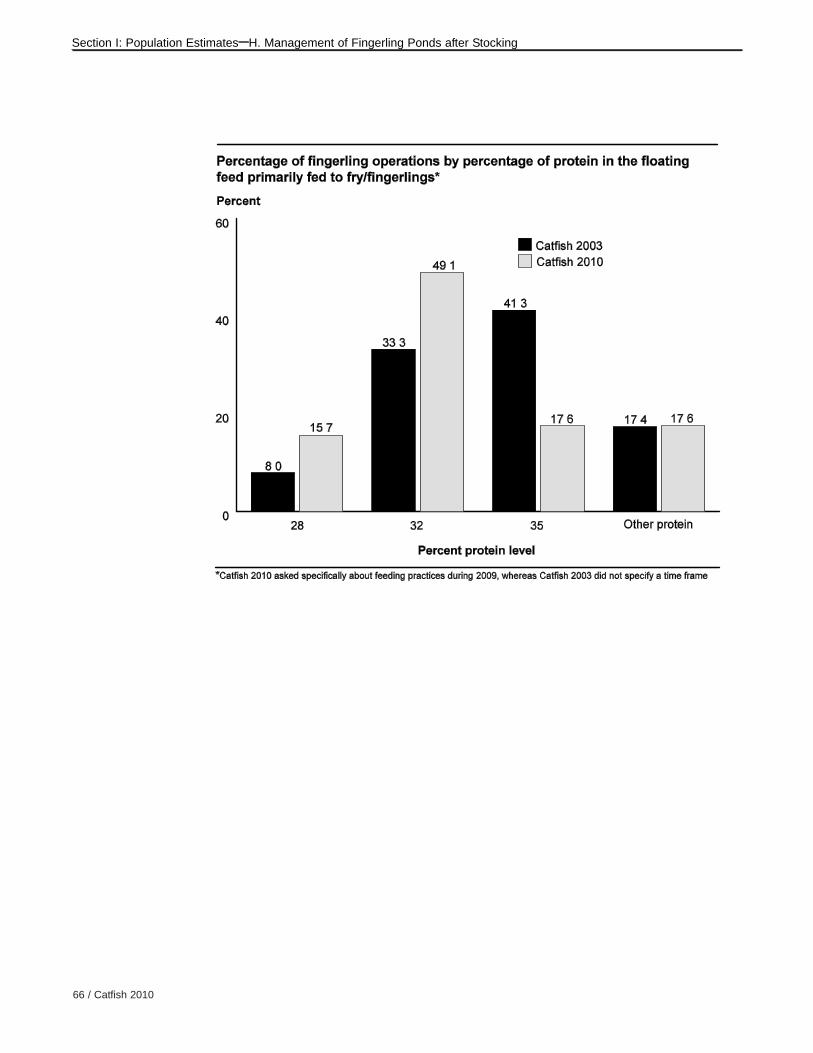
66 / Catfish 2010
Section I: Population Estimates–H. Management of Fingerling Ponds after Stocking

USDA APHIS VS / 67
Section I: Population Estimates–H. Management of Fingerling Ponds after Stocking
6. Primary method for monitoring dissolved oxygen
Notably, the percentage of operations that did not regularly monitor dissolved oxygen in
fry/fingerling ponds increased from Catfish 2003 to Catfish 2010, with more than one-
fourth of Catfish 2010 operations not regularly monitoring dissolved oxygen. Although the
percentage of operations using hand monitors as the primary method to monitor dissolved
oxygen declined from 85.9 to 73.1 percent between studies, hand monitors were the only
method used for Catfish 2010, as the percentage of operations using automated sensors
or “other” methods dropped to zero.
Percentage of fingerling operations by primary method used to regularly monitor dissolved
oxygen in fry/fingerling ponds*:
Percent Fingerling Operations
Catfish 2003 Catfish 2010
Monitoring Method Percent Std. Error Percent Std. Error
Automated sensors 7.7 (0.9) 0.0 (—)
Hand monitor (oxygen meter)
85.9 (1.1) 73.1 (0.7)
Other 1.6 (0.3) 0.0 (—)
Did not regularly monitor dissolved oxygen levels
4.8 (0.7) 26.9 (0.7)
Total 100.0 100.0
*Catfish 2010 asked specifically about monitoring practices during 2009, whereas Catfish 2003 did not specify a time frame.

68 / Catfish 2010
Section I: Population Estimates–H. Management of Fingerling Ponds after Stocking
7. Horsepower of fixed aeration
Recommended fixed aeration rates range from 2.0 to 2.5 horsepower (hp) per acre, but
the value varies with many factors, including feeding rate and stocking density. The
average horsepower of fixed aeration per surface acre of fry/fingerling ponds declined
from 1.8 to 1.6 hp from Catfish 2003 to Catfish 2010.
Average horsepower of fixed aeration per surface acre of fry/fingerling ponds:
Average Horsepower
Catfish 2003 Catfish 2010
Average Std. Error Average Std. Error
1.8 (0.0) 1.6 (0.0)
8. Water quality testing
From Catfish 2003 to Catfish 2010, the percentage of operations that did not test water
quality in fry/fingerling ponds more than doubled, with 34.5 percent of Catfish 2010
operations not testing. The percentage of operations testing water quality at least once a
month declined from close to half of operations (46.4 percent) for Catfish 2003 to slightly
more than one-fourth of operations (27.0 percent) for Catfish 2010. Concomitantly, the
percentage of operations testing water quality in fry/fingerling ponds less than once a
month increased between studies, from 11.9 to 21.2 percent of operations. The
percentage of operations testing water quality only in response to health problems
decreased from 26.2 percent of operations for Catfish 2003 to 17.3 percent of operations
for Catfish 2010.
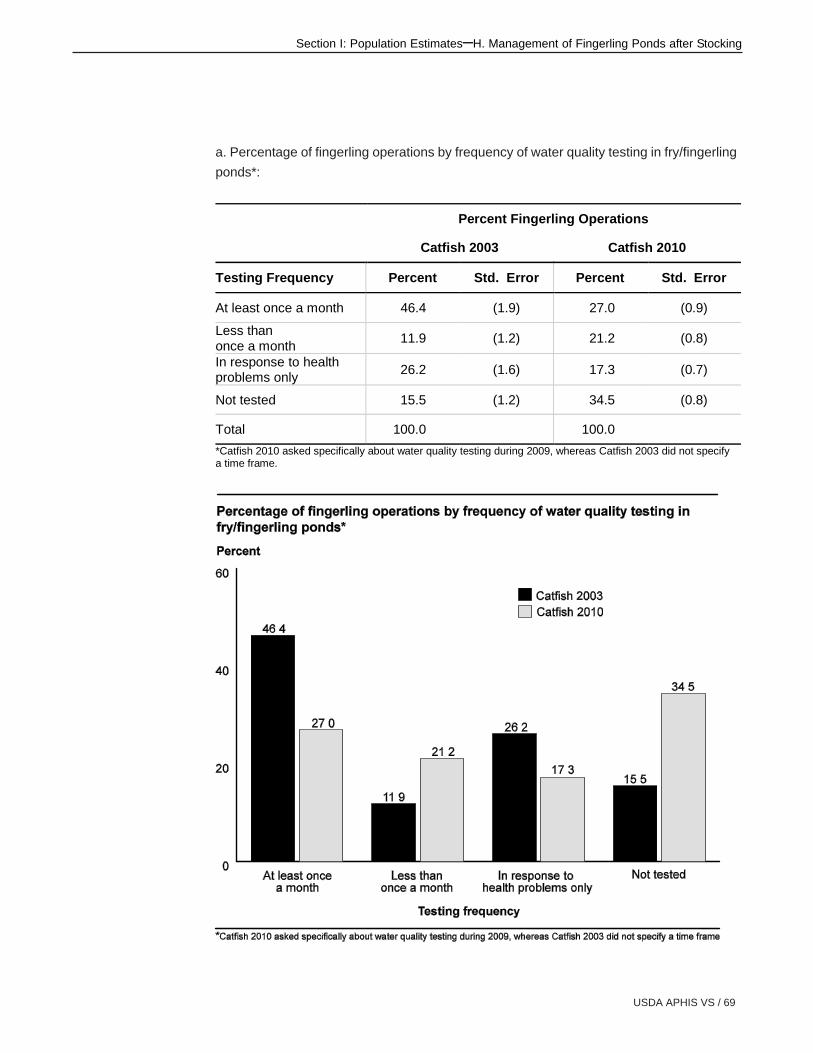
USDA APHIS VS / 69
Section I: Population Estimates–H. Management of Fingerling Ponds after Stocking
Percent Fingerling Operations
Catfish 2003 Catfish 2010
Testing Frequency Percent Std. Error Percent Std. Error
At least once a month 46.4 (1.9) 27.0 (0.9)
Less than once a month
11.9 (1.2) 21.2 (0.8)
In response to health problems only
26.2 (1.6) 17.3 (0.7)
Not tested 15.5 (1.2) 34.5 (0.8)
Total 100.0 100.0
*Catfish 2010 asked specifically about water quality testing during 2009, whereas Catfish 2003 did not specify a time frame.
a. Percentage of fingerling operations by frequency of water quality testing in fry/fingerling
ponds*:
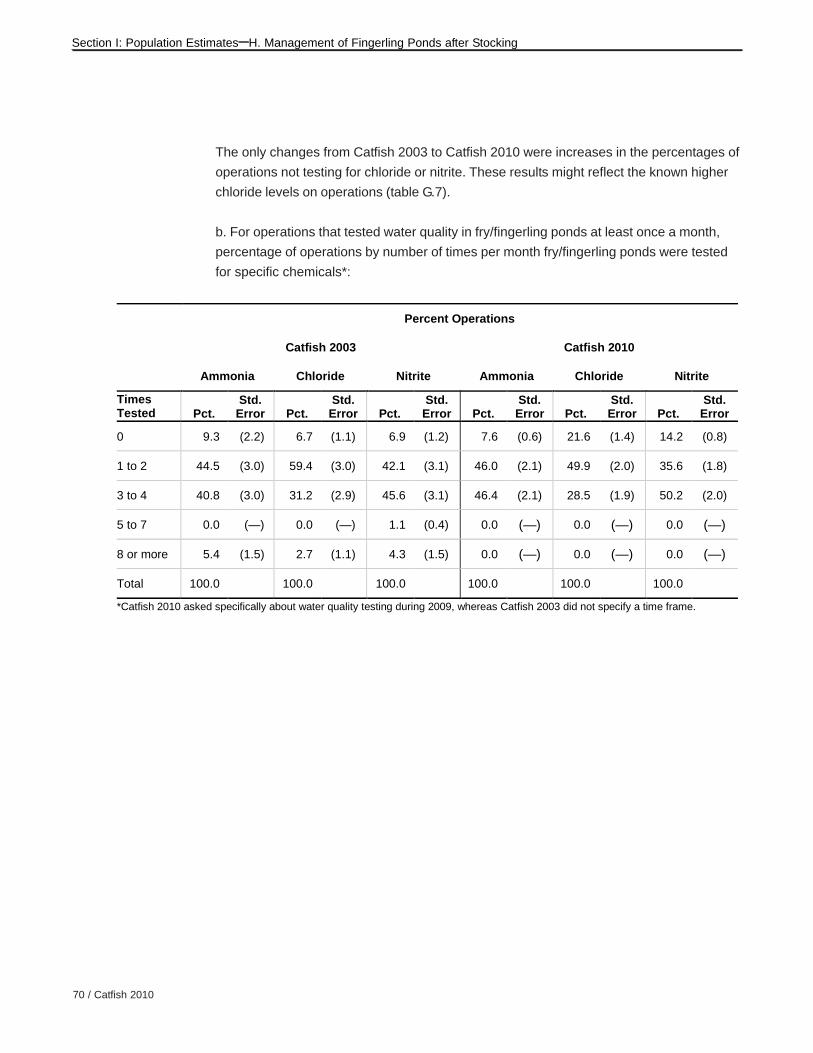
70 / Catfish 2010
Section I: Population Estimates–H. Management of Fingerling Ponds after Stocking
The only changes from Catfish 2003 to Catfish 2010 were increases in the percentages of
operations not testing for chloride or nitrite. These results might reflect the known higher
chloride levels on operations (table G.7).
b. For operations that tested water quality in fry/fingerling ponds at least once a month,
percentage of operations by number of times per month fry/fingerling ponds were tested
for specific chemicals*:
Percent Operations
Catfish 2003 Catfish 2010
Ammonia Chloride Nitrite Ammonia Chloride Nitrite
Times Tested Pct.
Std. Error Pct.
Std. Error Pct.
Std. Error Pct.
Std. Error Pct.
Std. Error Pct.
Std. Error
0 9.3 (2.2) 6.7 (1.1) 6.9 (1.2) 7.6 (0.6) 21.6 (1.4) 14.2 (0.8)
1 to 2 44.5 (3.0) 59.4 (3.0) 42.1 (3.1) 46.0 (2.1) 49.9 (2.0) 35.6 (1.8)
3 to 4 40.8 (3.0) 31.2 (2.9) 45.6 (3.1) 46.4 (2.1) 28.5 (1.9) 50.2 (2.0)
5 to 7 0.0 (—) 0.0 (—) 1.1 (0.4) 0.0 (—) 0.0 (—) 0.0 (—)
8 or more 5.4 (1.5) 2.7 (1.1) 4.3 (1.5) 0.0 (—) 0.0 (—) 0.0 (—)
Total 100.0 100.0 100.0 100.0 100.0 100.0
*Catfish 2010 asked specifically about water quality testing during 2009, whereas Catfish 2003 did not specify a time frame.

USDA APHIS VS / 71
Section I: Population Estimates–I. Fingerling Health Issues
I. FingerlingHealth Issues
1. Vaccination for enteric septicemia of catfish (ESC)
Although the time frame covered by the survey question is 2 years for Catfish 2003 and
1 year for Catfish 2010, the percentage of operations vaccinating fry against ESC appears
to have declined between the two studies. Because fry hatched each year would need to
be vaccinated, the data do seem to represent a true decrease in the percentage of
operations vaccinating any fry against ESC.
a. Percentage of fingerling operations that vaccinated fry against ESC*:
Percent Fingerling Operations
Catfish 2003 Catfish 2010
Percent Std. Error Percent Std. Error
11.4 (1.3) 3.9 (0.4)
*Catfish 2003 asked about vaccination of fry against ESC in the past 2 years; Catfish 2010 asked about vaccination of fry against ESC during 2009.
On operations that vaccinated any fry against ESC, the percentage of fry vaccinated
increased from 18.1 to 49.1 percent.
b. For fingerling operations that vaccinated any fry against ESC in the year prior to the
study,* percentage of fry (weighted by number of fry stocked) that were vaccinated:
Percent Fry
Catfish 2003 Catfish 2010
Percent Std. Error Percent Std. Error
18.1 (4.9) 49.1 (1.2)
*Although Catfish 2003 asked about vaccination of fry against ESC in the past 2 years; data on the percentage of fry vaccinated are presented only for the year prior to the study to be consistent with data from Catfish 2010.

72 / Catfish 2010
Section I: Population Estimates–I. Fingerling Health Issues
2. Average age of fry at ESC vaccination
Fry should be at least 7 days old before they are vaccinated for ESC. The operation
average number of days after hatching that fry were vaccinated increased from 8.8 days
for Catfish 2003 to 15.1 days for Catfish 2010.
For fingerling operations that vaccinated any fry against ESC, operation average number
of days after hatching that fry typically were vaccinated against ESC:
Operation Average
Catfish 2003 Catfish 2010
Average Std. Error Average Std. Error
8.8 (0.4) 15.1 (0.6)
3. ESC vaccination of fry intended for on-farm growout
Although it appears that vaccination practices for fry intended for growout on the operation
changed considerably from Catfish 2003 to Catfish 2010, it is not possible to draw
conclusions about vaccination practices because few producers (3.9 percent) vaccinated
for ESC for Catfish 2010.
For fingerling operations that vaccinated any fry against ESC, percentage of operations by
routine vaccination practice* for fry intended for growout on the operation:
Percent Fingerling Operations
Catfish 2003 Catfish 2010
Vaccination Practice Percent Std. Error Percent Std. Error
All fry intended for growout on operation
29.4 (5.1) 0.0 (—)
A portion of the fry 39.0 (6.3) 100.0 (0.0)
None of the fry 16.9 (5.1) 0.0 (—)
No fry growout on this operation
14.7 (3.8) 0.0 (—)
Total 100.0 100.0
*Catfish 2010 asked specifically about vaccination practices during 2009, whereas Catfish 2003 asked about routine practices without specifying a time frame.
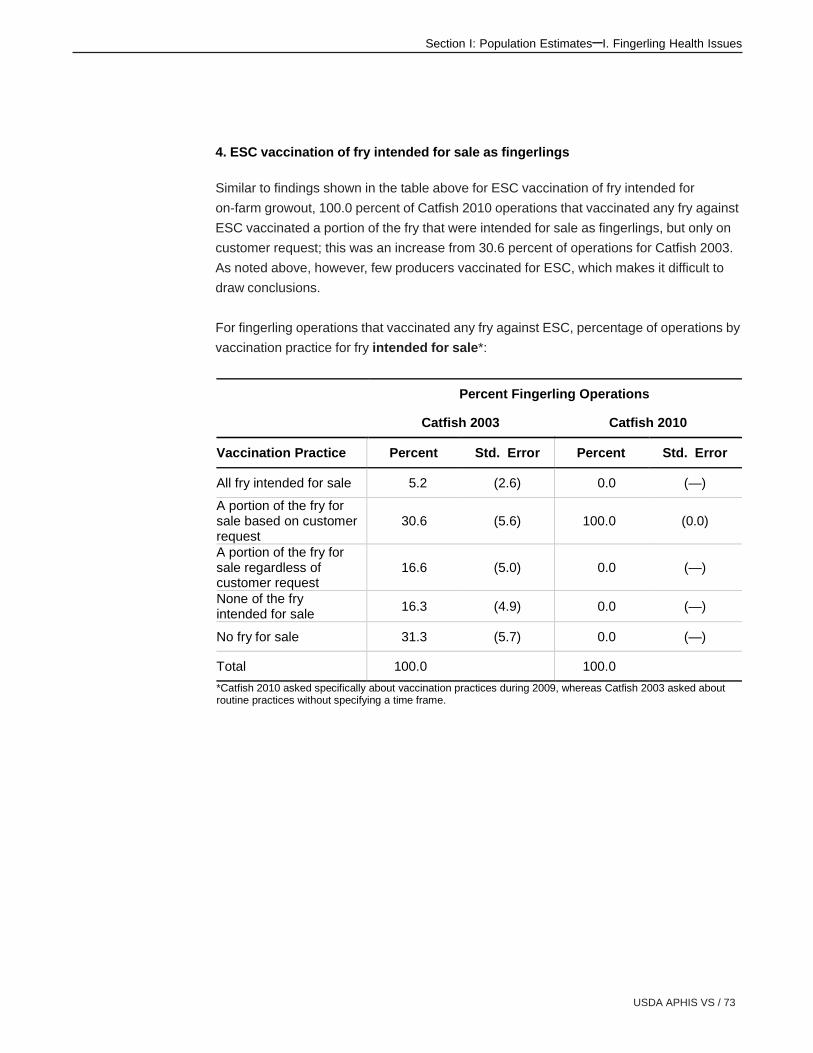
USDA APHIS VS / 73
Section I: Population Estimates–I. Fingerling Health Issues
4. ESC vaccination of fry intended for sale as fingerlings
Similar to findings shown in the table above for ESC vaccination of fry intended for
on-farm growout, 100.0 percent of Catfish 2010 operations that vaccinated any fry against
ESC vaccinated a portion of the fry that were intended for sale as fingerlings, but only on
customer request; this was an increase from 30.6 percent of operations for Catfish 2003.
As noted above, however, few producers vaccinated for ESC, which makes it difficult to
draw conclusions.
For fingerling operations that vaccinated any fry against ESC, percentage of operations by
vaccination practice for fry intended for sale*:
Percent Fingerling Operations
Catfish 2003 Catfish 2010
Vaccination Practice Percent Std. Error Percent Std. Error
All fry intended for sale 5.2 (2.6) 0.0 (—)
A portion of the fry for sale based on customer request
30.6 (5.6) 100.0 (0.0)
A portion of the fry for sale regardless of customer request
16.6 (5.0) 0.0 (—)
None of the fry intended for sale
16.3 (4.9) 0.0 (—)
No fry for sale 31.3 (5.7) 0.0 (—)
Total 100.0 100.0
*Catfish 2010 asked specifically about vaccination practices during 2009, whereas Catfish 2003 asked about routine practices without specifying a time frame.

74 / Catfish 2010
Section I: Population Estimates–I. Fingerling Health Issues
5. Survival of stocked fry until harvest
The operation average percent survival of fry stocked until harvest as fingerlings declined
slightly between the two studies, from 69.0 for Catfish 2003 to 66.7 for Catfish 2010. The
percent survival of fry (weighted by the number of fry stocked) was similar for the two
studies.
For stocked fry,* operation average and fry average (weighted by the number of fry
stocked) percent survival until harvest as fingerlings:
Average
Catfish 2003 Catfish 2010
Percent Survival Average Std. Error Average Std. Error
Operation average 69.0 (0.7) 66.7 (0.3)
Fry average 66.2 (1.6) 65.1 (4.4)
*For Catfish 2003, the question asked about survival of stocked fry during the past 2 years; for Catfish 2010, the question asked about survival of stocked fry during 2009.
6. Causes of fingerling loss
With large numbers of fry being stocked into ponds and not readily visible, it can be very
difficult for producers to observe losses and identify causes of loss. The percentage of
operations that lost any fry/fingerlings to unknown causes increased from slightly less than
half for Catfish 2003 to almost three-fourths of operations for Catfish 2010, and
38.5 percent of all fingerling operations participating in the 2010 study attributed all fry/
fingerling loss to unknown causes (data not shown).

USDA APHIS VS / 75
Section I: Population Estimates–I. Fingerling Health Issues
The percentages of operations that lost any fry/fingerlings to ESC, columnaris,
proliferative gill disease, or channel catfish virus (CCV) declined between studies. The
percentages of operations that lost any fry/fingerlings to gill parasites or “other” known
causes also decreased between the two studies. The percentages of operations that lost
any fry/fingerlings to predation increased from Catfish 2003 to Catfish 2010.
a. Percentage of fingerling operations that lost any fry/fingerlings* to the following causes:
Percent Fingerling Operations
Catfish 2003 Catfish 2010
Cause of Loss Percent Std. Error Percent Std. Error
Enteric septicemia (ESC)
52.9 (1.9) 19.3 (0.8)
Columnaris 45.2 (1.9) 17.4 (0.7)
Proliferative gill disease 8.9 (1.3) 0.0 (—)
Channel catfish virus 6.9 (1.2) 0.0 (—)
Trematodes 1.9 (0.6) 1.9 (0.1)
Gill parasites 4.0 (0.7) 1.9 (0.1)
Ich 5.1 (0.7) 3.8 (0.2)
Predation 26.2 (1.7) 48.0 (0.9)
Other known causes 15.3 (1.5) 5.8 (0.5)
Unknown causes 46.2 (1.9) 71.1 (0.8)
*For Catfish 2003, the question asked about fry stocked during the last 2 years that did not survive until harvest as fingerlings; for Catfish 2010, the question asked about fry stocked in 2009 that did not survive until harvest as fingerlings.
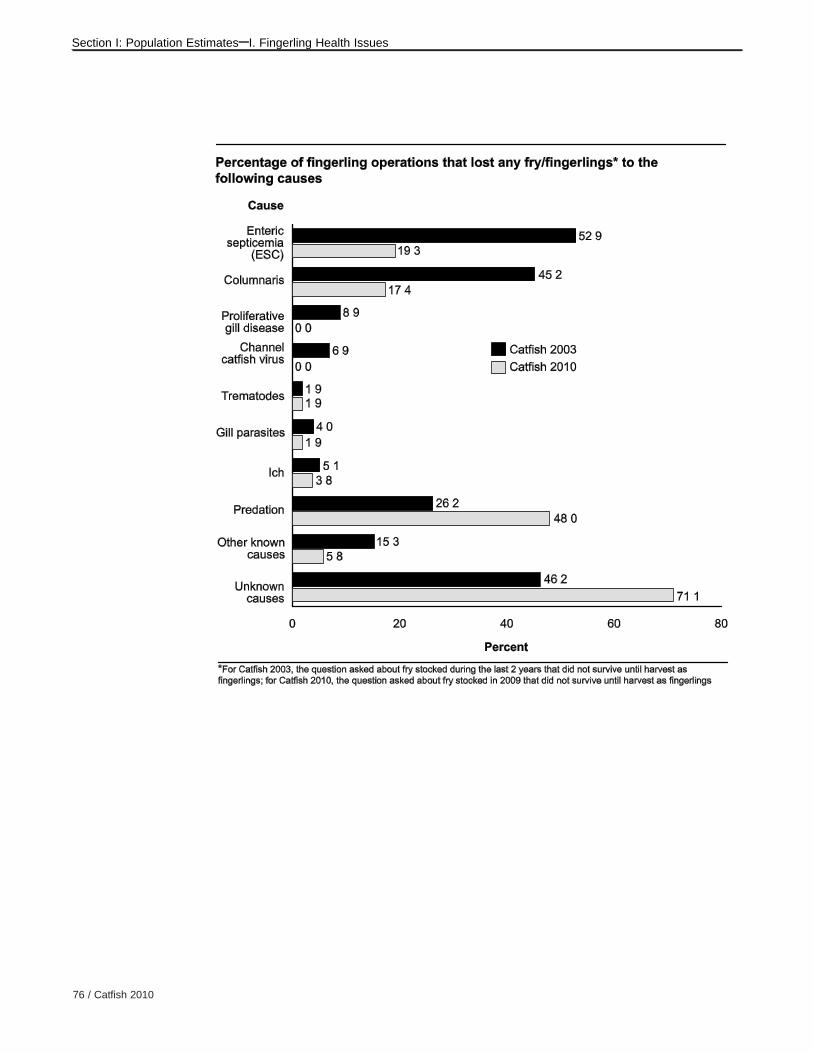
76 / Catfish 2010
Section I: Population Estimates–I. Fingerling Health Issues

USDA APHIS VS / 77
Section I: Population Estimates–I. Fingerling Health Issues
From Catfish 2003 to Catfish 2010, trends in the percentages of fry/fingerlings lost were
difficult to assess because of high variability associated with the estimates. Although the
percentages of operations that had losses from ESC or columnaris declined between the
two studies (table I.6.a), the percentages of fry/fingerlings lost to those causes on affected
operations did not change substantially. The percentages of fry/fingerlings lost to
proliferative gill disease, CCV, gill parasites, or ich declined to zero or near zero.
b. Percentage of fry/fingerlings (weighted by the number of fry stocked1) lost to the
following causes:
Percent Fry Lost
Catfish 2003 Catfish 2010
Cause of Loss Percent Std. Error Percent Std. Error
Enteric septicemia (ESC)
27.3 (2.6) 20.2 (11.2)
Columnaris 24.8 (2.9) 19.1 (11.4)
Proliferative gill disease 3.0 (0.8) 0.0 (—)
Channel catfish virus 8.2 (3.1) 0.0 (—)
Trematodes 0.9 (0.6) 0.02 (0.0)
Gill parasites 0.7 (0.3) 0.02 (0.0)
Ich 0.9 (0.3) 0.1 (0.0)
Predation 6.0 (1.1) 10.5 (7.3)
Other known causes 9.8 (4.0) 4.3 (3.5)
Unknown causes 18.4 (3.5) 45.8 (18.2)
Total 100.0 100.0 1For Catfish 2003, the question asked about fry stocked during the last 2 years that did not survive until
harvest as fingerlings; for Catfish 2010, the question asked about fry stocked in 2009 that did not survive until harvest as fingerlings. 2Although 1.9 percent of operations reported losses to trematodes and gill parasites in 2009, these losses
rounded to zero.

78 / Catfish 2010
Section I: Population Estimates–I. Fingerling Health Issues
7. Primary treatment for ESC outbreaks
From Catfish 2003 to Catfish 2010, the percentage of fingerling operations that
experienced ESC outbreaks decreased from 78.2 percent of operations to 40.4 percent.
a. Percentage of fingerling operations that experienced ESC outbreaks:
Percent Fingerling Operations
Catfish 2003 Catfish 2010
Percent Std. Error Percent Std. Error
78.2 (1.4) 40.4 (0.9)
From Catfish 2003 to Catfish 2010, the primary treatment the majority of operations used
to treat fry/fingerlings with ESC changed from cessation of feeding to medicated feed.
This result is likely due to the recent availability of a new antibiotic to treat ESC. Of Catfish
2003 operations that experienced ESC outbreaks, the majority (70.0 percent) treated
fry/fingerlings with ESC by taking them off feed. For Catfish 2010, the majority of
operations (66.7 percent) fed medicated feed to fry/fingerlings with ESC. The percentages
of operations that treated fish by reducing their feed or taking them off feed declined
between the two studies, whereas the percentage of operations treating fingerlings with
medicated feed increased.
b. Percentage of fingerling operations by primary treatment for fry/fingerlings with ESC:
Percent Fingerling Operations
Catfish 2003 Catfish 2010
Primary Treatment Percent Std. Error Percent Std. Error
Medicated feed 23.1 (1.8) 66.7 (1.5)
Regular feed on alternate days (reduce feed)
3.8 (0.9) 0.0 (—)
Take off feed 70.0 (2.0) 28.6 (1.5)
Other 3.1 (0.8) 4.7 (0.7)
Total 100.0 100.0

USDA APHIS VS / 79
Section I: Population Estimates–I. Fingerling Health Issues
8. Diagnostic laboratory testing
Submitting samples to a diagnostic laboratory and obtaining a firm diagnosis can help
producers choose the best treatment to fight the disease. Producers who have seen
diseases affect their fish before, however, might be able to identify some diseases and
treatments on their own and might choose not to submit samples to a laboratory.
Additionally, some producers might opt to use certain treatments for ill fish regardless of
the cause of disease, or there might not be effective treatments available.
Overall, the percentage of fingerling operations that submitted any fingerling samples to a
diagnostic laboratory for any reason declined between studies. As for Catfish 2003
producers, however, about one-fifth of Catfish 2010 producers submitted samples to a
diagnostic laboratory to detect a problem early. The percentages of operations submitting
samples to confirm a cause of disease, identify an unknown disease, or for an “other”
reason declined from Catfish 2003 to Catfish 2010.
Percentage of fingerling operations that submitted any fingerling samples to a diagnostic
laboratory in the year preceding the study, by reason for submission:
Percent Fingerling Operations
Catfish 2003 Catfish 2010
Reason Percent Std. Error Percent Std. Error
Detect problem early 18.0 (1.6) 21.1 (0.8)
Confirm cause of disease
27.5 (1.8) 13.5 (0.7)
Identify unknown disease
26.4 (1.8) 5.8 (0.4)
Other reason 3.1 (0.8) 0.0 (—)
Any reason 40.3 (1.9) 25.0 (0.9)

80 / Catfish 2010
Section I: Population Estimates–I. Fingerling Health Issues
9. Use of medicated feed
Medicated feed is used to treat disease in catfish. The percentage of operations that fed
medicated feed to catfish fry did not change from Catfish 2003 to Catfish 2010.
a. Percentage of fingerling operations that fed medicated feed to fry in the year preceding
the study:
Percent Fingerling Operations
Catfish 2003 Catfish 2010
Percent Std. Error Percent Std. Error
27.0 (1.8) 28.9 (0.8)
Since Catfish 2003, Aquaflor® has joined Terramycin® and Romet® in having Food and
Drug Administration approval for use in catfish feed. For Catfish 2010, three-fifths of
operations that fed medicated feed (60.2 percent) used Aquaflor, which is the only
antimicrobial approved for treatment of both ESC and columnaris, the two most important
bacterial diseases of catfish. For Catfish 2003, some operations that fed medicated feed
to fry/fingerlings used both Terramycin and Romet; by Catfish 2010, the percentage of
operations using these two medicated feeds had declined, from 80.7 percent of
operations to 14.2 percent for Terramycin and from 42.3 percent of operations to
26.6 percent for Romet.
b. For operations that fed medicated feed to fry/fingerlings in the year preceding the study,
percentage of fingerling operations by type of medicated feed used:
Percent Fingerling Operations
Catfish 2003 Catfish 2010
Medicated Feed Percent Std. Error Percent Std. Error
Terramycin® 80.7 (2.8) 14.2 (0.8)
Romet® 42.3 (4.2) 26.6 (1.3)
Aquaflor® 60.2 (1.5)
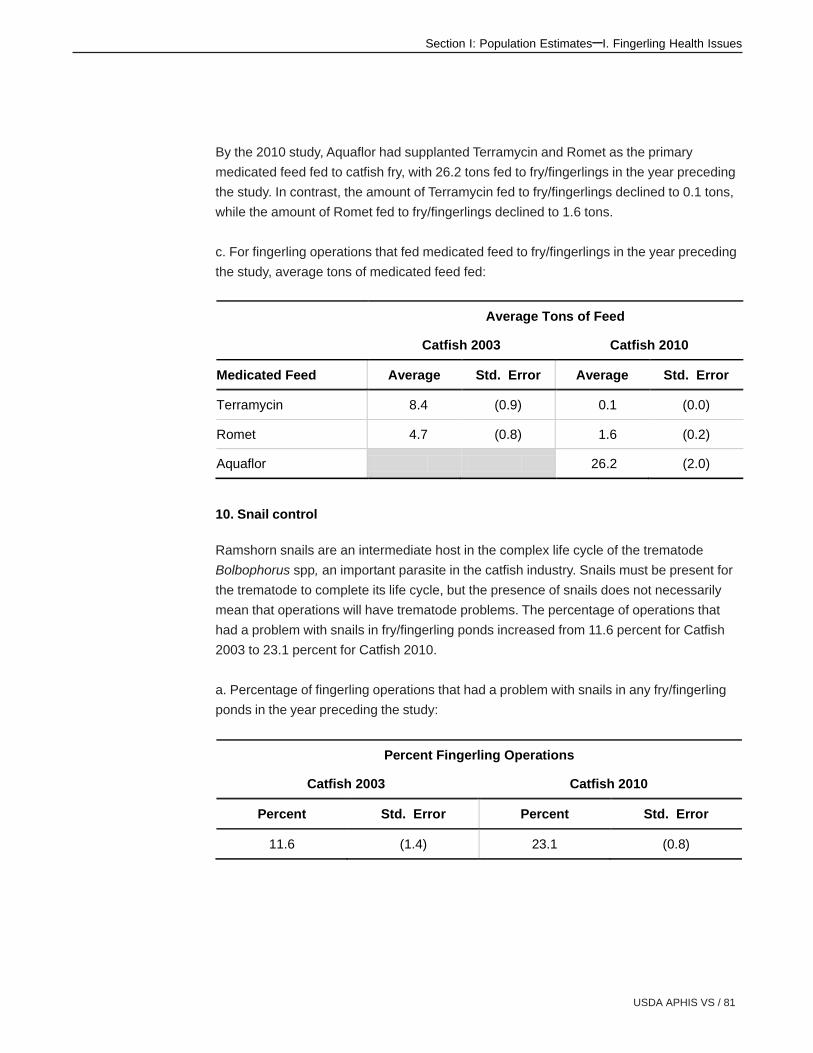
USDA APHIS VS / 81
Section I: Population Estimates–I. Fingerling Health Issues
By the 2010 study, Aquaflor had supplanted Terramycin and Romet as the primary
medicated feed fed to catfish fry, with 26.2 tons fed to fry/fingerlings in the year preceding
the study. In contrast, the amount of Terramycin fed to fry/fingerlings declined to 0.1 tons,
while the amount of Romet fed to fry/fingerlings declined to 1.6 tons.
c. For fingerling operations that fed medicated feed to fry/fingerlings in the year preceding
the study, average tons of medicated feed fed:
10. Snail control
Ramshorn snails are an intermediate host in the complex life cycle of the trematode
Bolbophorus spp, an important parasite in the catfish industry. Snails must be present for
the trematode to complete its life cycle, but the presence of snails does not necessarily
mean that operations will have trematode problems. The percentage of operations that
had a problem with snails in fry/fingerling ponds increased from 11.6 percent for Catfish
2003 to 23.1 percent for Catfish 2010.
a. Percentage of fingerling operations that had a problem with snails in any fry/fingerling
ponds in the year preceding the study:
Percent Fingerling Operations
Catfish 2003 Catfish 2010
Percent Std. Error Percent Std. Error
11.6 (1.4) 23.1 (0.8)
Average Tons of Feed
Catfish 2003 Catfish 2010
Medicated Feed Average Std. Error Average Std. Error
Terramycin 8.4 (0.9) 0.1 (0.0)
Romet 4.7 (0.8) 1.6 (0.2)
Aquaflor 26.2 (2.0)
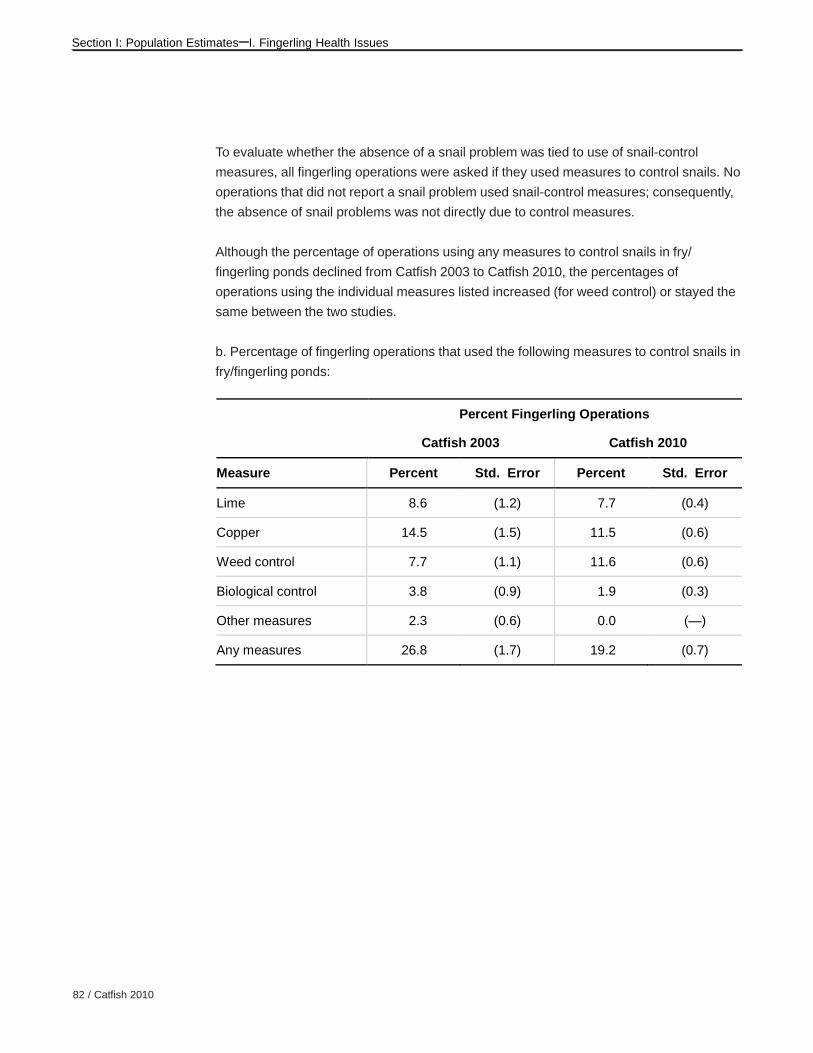
82 / Catfish 2010
Section I: Population Estimates–I. Fingerling Health Issues
To evaluate whether the absence of a snail problem was tied to use of snail-control
measures, all fingerling operations were asked if they used measures to control snails. No
operations that did not report a snail problem used snail-control measures; consequently,
the absence of snail problems was not directly due to control measures.
Although the percentage of operations using any measures to control snails in fry/
fingerling ponds declined from Catfish 2003 to Catfish 2010, the percentages of
operations using the individual measures listed increased (for weed control) or stayed the
same between the two studies.
b. Percentage of fingerling operations that used the following measures to control snails in
fry/fingerling ponds:
Percent Fingerling Operations
Catfish 2003 Catfish 2010
Measure Percent Std. Error Percent Std. Error
Lime 8.6 (1.2) 7.7 (0.4)
Copper 14.5 (1.5) 11.5 (0.6)
Weed control 7.7 (1.1) 11.6 (0.6)
Biological control 3.8 (0.9) 1.9 (0.3)
Other measures 2.3 (0.6) 0.0 (—)
Any measures 26.8 (1.7) 19.2 (0.7)

USDA APHIS VS / 83
Section II: Population Estimates–A. Inventory Characteristics
Section II: Population Estimates, Foodsize Catfish
A. InventoryCharacteristics
1. Genetic lines
From Catfish 2003 to Catfish 2010, the percentages of operations raising channel x blue
hybrid catfish or unspecified channel catfish increased, while the percentages of
operations raising NWAC103, Kansas, Goldkist, or other channel catfish lines decreased.
For both study years, the majority of operations raised unspecified channel catfish.
a. Percentage of foodsize-fish operations that had any of the following lines of fish present
on January 1 of the study year:
Percent Foodsize-fish Operations
Catfish 2003 Catfish 2010
Line Percent Std. Error Percent Std. Error
NWAC103 5.9 (0.5) 1.5 (0.1)
Kansas 7.0 (0.5) 3.1 (0.2)
Goldkist1 28.4 (0.9) 7.0 (0.3)
Auburn 1.3 (0.1)
Norris 0.3 (0.1)
Channel x blue hybrid catfish
2.1 (0.3) 21.2 (0.5)
Other channel catfish line
10.0 (0.6) 1.0 (0.1)
Unspecified channel catfish2
65.3 (1.0) 81.9 (0.4) 1Catfish 2010 included Harvest Select catfish with Goldkist catfish.
2Catfish 2003 asked about “unknown line.”

84 / Catfish 2010
Section II: Population Estimates–A. Inventory Characteristics
The percentages of foodsize fish by genetic line showed similar patterns to the
percentages of operations raising particular lines of catfish. From one study to the next,
unspecified channel catfish and channel x blue hybrid catfish increased as a percentage
of fish present, while NWAC103, Goldkist, and other channel catfish lines declined as a
percentage of fish present. For both studies, the majority of fish present were unspecified
channel catfish.
b. Percentage of foodsize fish by line of fish present on January 1 of the study year:
Percent Foodsize-fish
Catfish 2003 Catfish 2010
Line Percent Std. Error Percent Std. Error
NWAC103 2.4 (0.5) 0.5 (0.2)
Kansas 2.6 (0.5) 2.2 (0.8)
Goldkist1 22.4 (3.3) 4.2 (1.2)
Auburn 0.1 (0.0)
Norris 0.1 (0.0)
Channel x blue hybrid catfish
1.2 (0.3) 5.9 (1.0)
Other channel catfish line
6.9 (1.4) 1.3 (0.8)
Unspecified channel catfish2
64.4 (3.5) 85.8 (2.4)
Total 100.0 100.0 1Catfish 2010 included Harvest Select catfish with Goldkist catfish.
2Catfish 2003 asked about “unknown line.”
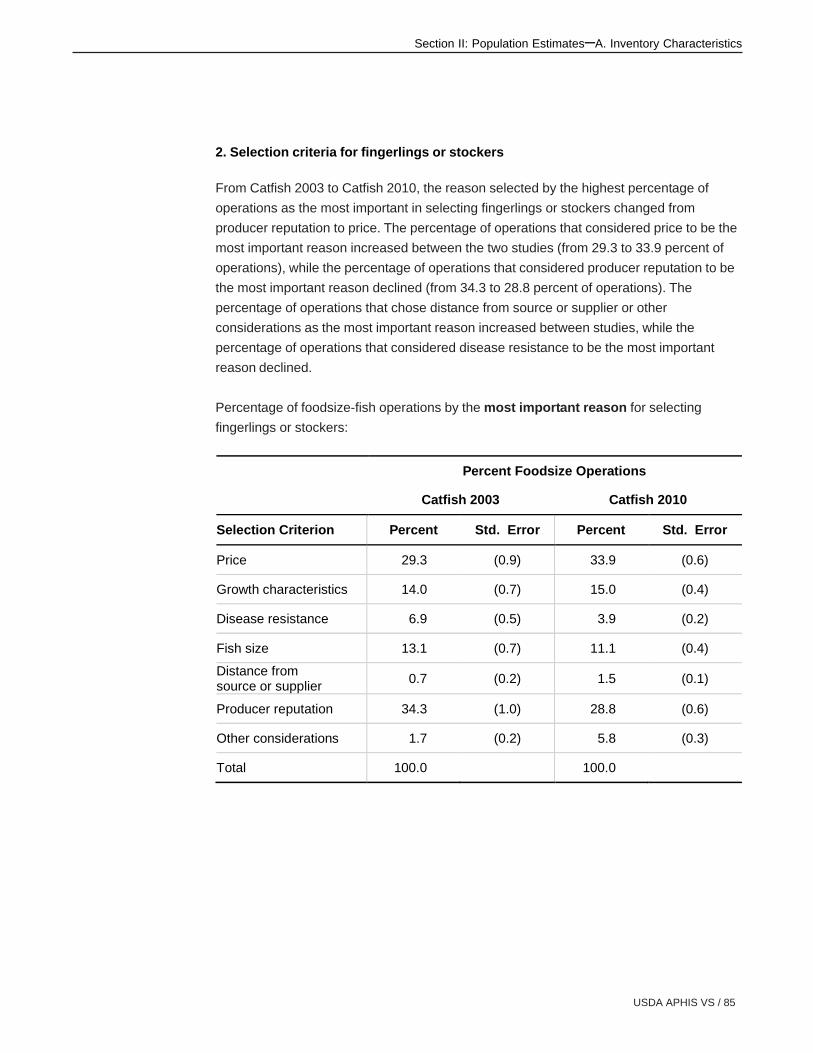
USDA APHIS VS / 85
Section II: Population Estimates–A. Inventory Characteristics
2. Selection criteria for fingerlings or stockers
From Catfish 2003 to Catfish 2010, the reason selected by the highest percentage of
operations as the most important in selecting fingerlings or stockers changed from
producer reputation to price. The percentage of operations that considered price to be the
most important reason increased between the two studies (from 29.3 to 33.9 percent of
operations), while the percentage of operations that considered producer reputation to be
the most important reason declined (from 34.3 to 28.8 percent of operations). The
percentage of operations that chose distance from source or supplier or other
considerations as the most important reason increased between studies, while the
percentage of operations that considered disease resistance to be the most important
reason declined.
Percentage of foodsize-fish operations by the most important reason for selecting
fingerlings or stockers:
Percent Foodsize Operations
Catfish 2003 Catfish 2010
Selection Criterion Percent Std. Error Percent Std. Error
Price 29.3 (0.9) 33.9 (0.6)
Growth characteristics 14.0 (0.7) 15.0 (0.4)
Disease resistance 6.9 (0.5) 3.9 (0.2)
Fish size 13.1 (0.7) 11.1 (0.4)
Distance from source or supplier
0.7 (0.2) 1.5 (0.1)
Producer reputation 34.3 (1.0) 28.8 (0.6)
Other considerations 1.7 (0.2) 5.8 (0.3)
Total 100.0 100.0

86 / Catfish 2010
Section II: Population Estimates–B. Stocking Practices
B. StockingPractices
1. Stocking density
The stocking density of fingerlings in catfish production ponds is a key production variable
and can have far-reaching production implications. Variability in stocking rate among
operations has been attributed to differences in production goals, facilities, and other
resources that vary from farm to farm.
From Catfish 2003 to Catfish 2010, the operation average number of fish stocked per acre
declined.
a. Operation average and weighted average stocking rate (fish typically stocked per
surface acre) for foodfish ponds, by size of operation:
Average Number Stocked per Acre
Catfish 2003 Catfish 2010
Stocking Rate Percent Std. Error Percent Std. Error
Operation 5,752 (38) 5,553 (24)
Weighted average 6,390 (178) 5,836 (176)
For both the 2003 and 2010 studies, most foodsize-fish operations usually stocked
between 4,001 and 8,000 fish per acre. Although this overall pattern was similar for the
two studies, there was a slight decrease between studies in the percentage of operations
stocking 6,001 to 8,000 fish per acre and a slight increase in the percentage of operations
stocking fewer than 2,001 fish per acre.
b. Percentage of operations by number of fish per acre usually stocked in growout ponds:
Percent Operations
Catfish 2003 Catfish 2010
Number Fish per Acre Percent Std. Error Percent Std. Error
Fewer than 2,001 3.6 (0.3) 6.4 (0.3)
2,001 to 4,000 14.9 (0.7) 16.6 (0.4)
4,001 to 6,000 48.4 (1.0) 47.3 (0.6)
6,001 to 8,000 26.5 (0.9) 23.4 (0.5)
More than 8,000 6.6 (0.5) 6.3 (0.3)
Total 100.0 100.0

USDA APHIS VS / 87
Section II: Population Estimates–B. Stocking Practices
2. Sources of fish
From Catfish 2003 to Catfish 2010, the percentage of operations that purchased fish as
fingerlings from another operation to stock into ponds increased, while the percentage of
operations that purchased fish as fry from another source decreased. Purchasing fish as
fingerlings rather than as fry might have fewer risks and result in greater productivity.
a. Percentage of foodsize-fish operations that stocked any fish into growout ponds, by
source of fish in the year preceding the study:
Percent Foodsize-fish Operations
Catfish 2003 Catfish 2010
Source Percent Std. Error Percent Std. Error
Purchased as fry from another source
17.5 (0.8) 9.6 (0.5)
Purchased as fingerlings from another operation
69.4 (0.9) 78.6 (0.7)
Produced by this operation
19.6 (0.8) 17.6 (0.6)
The percentages of fish stocked by source showed a similar pattern to the percentages of
operations that used the listed sources. From Catfish 2003 to Catfish 2010, the
percentage of fish purchased as fingerlings from another operation increased, while the
percentage of fish purchased as fry from another operation decreased.
b. Operation average percentage of fish stocked into growout ponds, by source of fish in
the year preceding the study:
Operation Average Percent Fish Stocked
Catfish 2003 Catfish 2010
Source Percent Std. Error Percent Std. Error
Purchased as fry from another source
15.2 (0.7) 7.4 (0.4)
Purchased as fingerlings from another operation
66.6 (0.9) 76.1 (0.7)
Produced by this operation
18.2 (0.8) 16.5 (0.6)
Total 100.0 100.0

88 / Catfish 2010
Section II: Population Estimates–B. Stocking Practices
3. Sizes of fish stocked
The tables in Section B.1 (above) indicate a slight trend between the two studies of higher
percentages of operations stocking fewer fish per acre. This apparent trend might be
related to the size of fish being stocked in growout ponds. From Catfish 2003 to Catfish
2010, the operation average percentage of fish stocked that were more than 8 inches long
increased from 12.1 to 56.6 percent, while the percentage of 6- to 8-inch fish stocked
declined from 63.7 to 33.2 percent. The percentage of fish stocked that were 5 inches
long or less also decreased between studies. One factor that has likely contributed to the
increased size of fish stocked in growout ponds is the increased use of channel x blue
hybrid catfish (see Section II, tables A.1.a and A.1.b), because hybrid fingerlings grow
faster and are typically larger at the end of the fingerling growing season.
Operation average percentage of fish stocked in growout ponds by size group*:
Operation Average Percent Fish Stocked
Catfish 2003 Catfish 2010
Size Group Percent Std. Error Percent Std. Error
5 in. or less (less than 40 lb/ 1,000 fish)
24.2 (0.8) 10.2 (3.7)
6 to 8 in. (40 to 70 lb/1,000 fish)
63.7 (0.8) 33.2 (8.3)
More than 8 in. (more than 70 lb/1,000 fish)
12.1 (0.6) 56.6 (9.3)
Total 100.0 100.0
*Catfish 2003 asked about typical stocking practices, while Catfish 2010 asked about fish stocked during 2009.

USDA APHIS VS / 89
Section II: Population Estimates–B. Stocking Practices

90 / Catfish 2010
Section II: Population Estimates–B. Stocking Practices
4. Types of ponds stocked
Many catfish producers place fingerlings into ponds with existing catfish, a practice known
as understocking. Understocking enhances use of pond resources and provides for more
continual harvesting of fish (and resulting increased cash flow).
Despite the large standard errors for Catfish 2010, the data indicate that the operation
average percentage of fingerlings stocked into growout ponds already containing fish
decreased between studies, while the operation average percentage of fingerlings
stocked in growout ponds empty of fish increased slightly. The increased use of channel x
blue hybrid catfish (see Section II, tables A.1.a and A.1.b) might be contributing to the
decline in understocking because of the single-batch production processes typically used
for hybrid catfish.
Operation average percentage of fingerlings stocked in the year preceding the study by
pond type:
Operation Average Percent Fingerlings Stocked
Catfish 2003 Catfish 2010
Pond Type Percent Std. Error Percent Std. Error
Growout ponds that already contain fish (understocking)
83.3 (0.7) 54.9 (12.1)
Growout ponds empty of fish 12.8 (0.6) 39.8 (12.8)
Nursery (stocker) ponds 3.9 (0.4) 5.3 (2.0)
Total 100.0 100.0

USDA APHIS VS / 91
Section II: Population Estimates–B. Stocking Practices
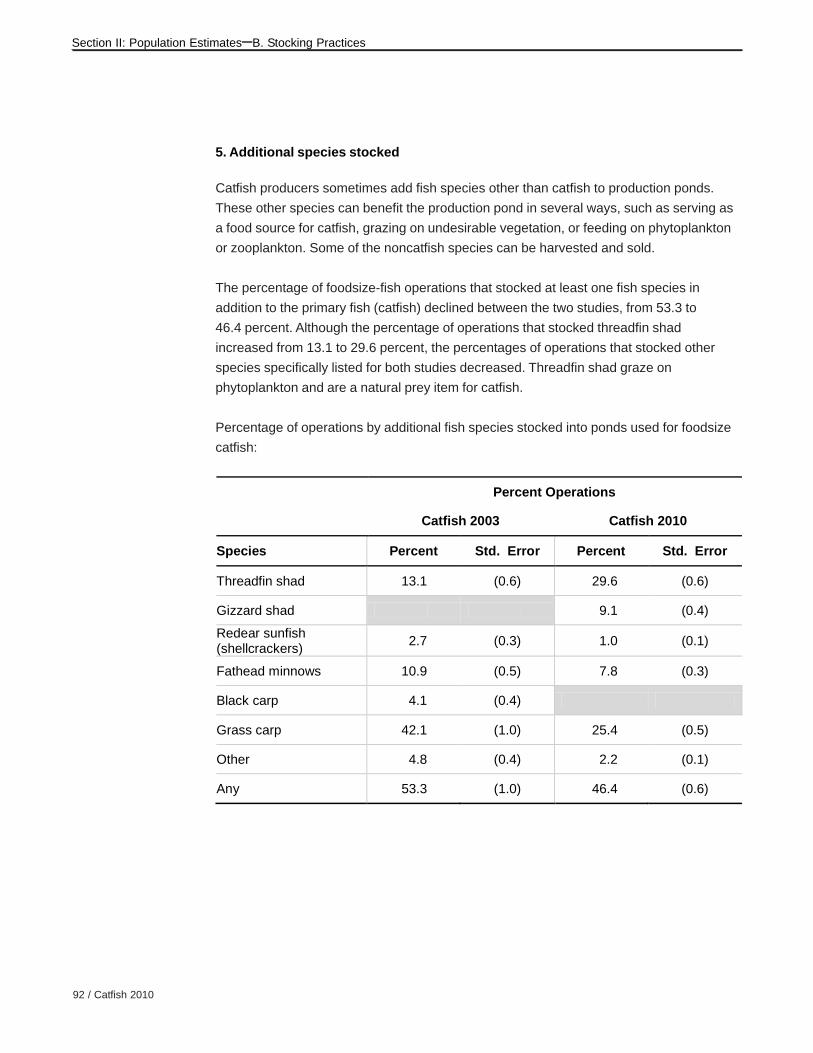
92 / Catfish 2010
Section II: Population Estimates–B. Stocking Practices
5. Additional species stocked
Catfish producers sometimes add fish species other than catfish to production ponds.
These other species can benefit the production pond in several ways, such as serving as
a food source for catfish, grazing on undesirable vegetation, or feeding on phytoplankton
or zooplankton. Some of the noncatfish species can be harvested and sold.
The percentage of foodsize-fish operations that stocked at least one fish species in
addition to the primary fish (catfish) declined between the two studies, from 53.3 to
46.4 percent. Although the percentage of operations that stocked threadfin shad
increased from 13.1 to 29.6 percent, the percentages of operations that stocked other
species specifically listed for both studies decreased. Threadfin shad graze on
phytoplankton and are a natural prey item for catfish.
Percentage of operations by additional fish species stocked into ponds used for foodsize
catfish:
Percent Operations
Catfish 2003 Catfish 2010
Species Percent Std. Error Percent Std. Error
Threadfin shad 13.1 (0.6) 29.6 (0.6)
Gizzard shad 9.1 (0.4)
Redear sunfish (shellcrackers)
2.7 (0.3) 1.0 (0.1)
Fathead minnows 10.9 (0.5) 7.8 (0.3)
Black carp 4.1 (0.4)
Grass carp 42.1 (1.0) 25.4 (0.5)
Other 4.8 (0.4) 2.2 (0.1)
Any 53.3 (1.0) 46.4 (0.6)
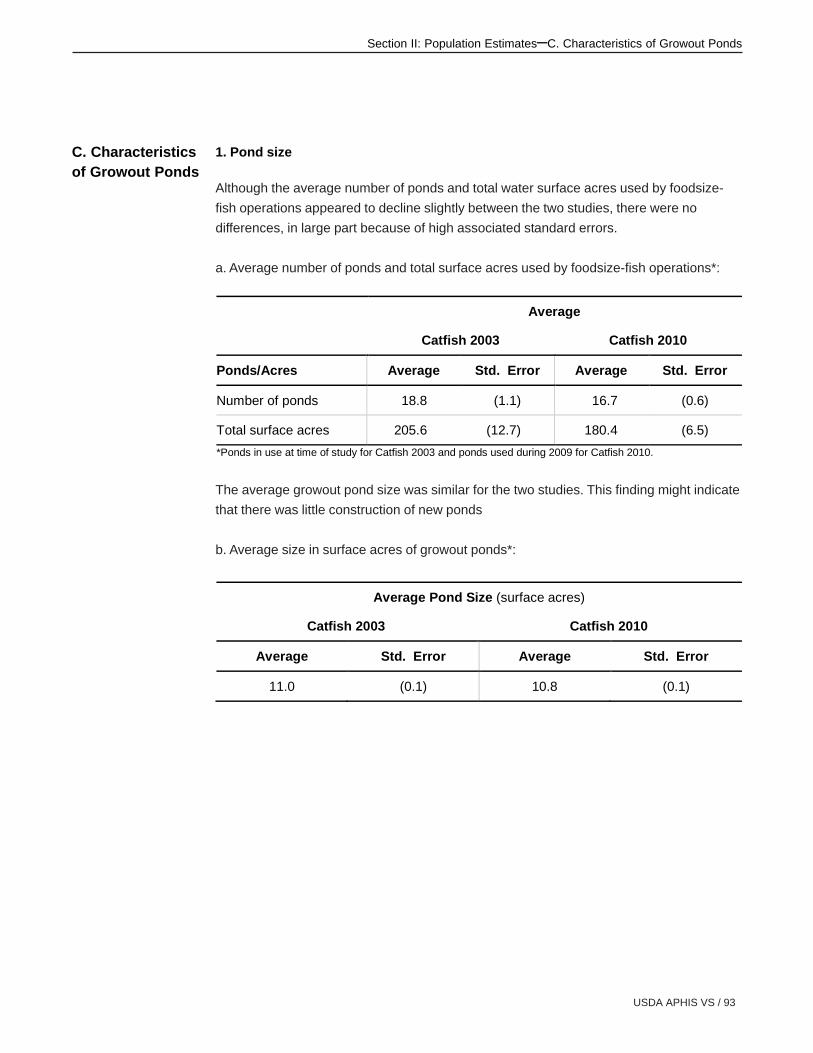
USDA APHIS VS / 93
Section II: Population Estimates–C. Characteristics of Growout Ponds
C. Characteristicsof Growout Ponds
1. Pond size
Although the average number of ponds and total water surface acres used by foodsize-
fish operations appeared to decline slightly between the two studies, there were no
differences, in large part because of high associated standard errors.
a. Average number of ponds and total surface acres used by foodsize-fish operations*:
Average
Catfish 2003 Catfish 2010
Ponds/Acres Average Std. Error Average Std. Error
Number of ponds 18.8 (1.1) 16.7 (0.6)
Total surface acres 205.6 (12.7) 180.4 (6.5)
*Ponds in use at time of study for Catfish 2003 and ponds used during 2009 for Catfish 2010.
The average growout pond size was similar for the two studies. This finding might indicate
that there was little construction of new ponds
b. Average size in surface acres of growout ponds*:
Average Pond Size (surface acres)
Catfish 2003 Catfish 2010
Average Std. Error Average Std. Error
11.0 (0.1) 10.8 (0.1)

94 / Catfish 2010
Section II: Population Estimates–C. Characteristics of Growout Ponds
For both studies, more than half of all growout ponds were 10 to 15 surface acres. The
only change from Catfish 2003 to Catfish 2010 in the sizes of growout ponds used was a
decrease in the percentage of ponds of 16 to 20 surface acres.
c. Percentage of all growout ponds used for production* by size of pond (surface acres):
Percent Growout Ponds
Catfish 2003 Catfish 2010
Pond Size (surface acres for foodsize fish) Percent Std. Error Percent Std. Error
Less than 5 9.8 (0.8) 8.2 (0.3)
5 to 9 20.0 (0.8) 23.1 (0.9)
10 to 15 52.7 (1.7) 57.8 (1.1)
16 to 20 15.2 (1.6) 7.3 (0.2)
More than 20 2.3 (0.6) 3.6 (0.2)
Total 100.0 100.0
*Ponds in use at time of study for Catfish 2003 and ponds used during 2009 for Catfish 2010.
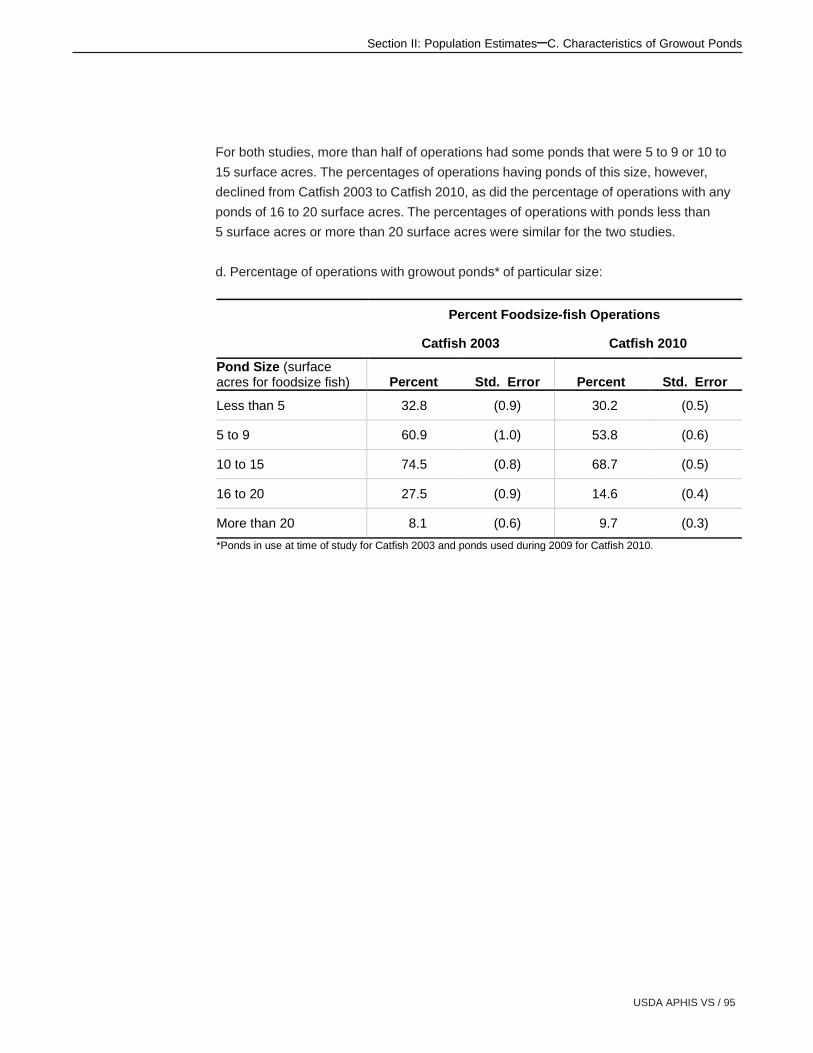
USDA APHIS VS / 95
Section II: Population Estimates–C. Characteristics of Growout Ponds
For both studies, more than half of operations had some ponds that were 5 to 9 or 10 to
15 surface acres. The percentages of operations having ponds of this size, however,
declined from Catfish 2003 to Catfish 2010, as did the percentage of operations with any
ponds of 16 to 20 surface acres. The percentages of operations with ponds less than
5 surface acres or more than 20 surface acres were similar for the two studies.
d. Percentage of operations with growout ponds* of particular size:
Percent Foodsize-fish Operations
Catfish 2003 Catfish 2010
Pond Size (surface acres for foodsize fish) Percent Std. Error Percent Std. Error
Less than 5 32.8 (0.9) 30.2 (0.5)
5 to 9 60.9 (1.0) 53.8 (0.6)
10 to 15 74.5 (0.8) 68.7 (0.5)
16 to 20 27.5 (0.9) 14.6 (0.4)
More than 20 8.1 (0.6) 9.7 (0.3)
*Ponds in use at time of study for Catfish 2003 and ponds used during 2009 for Catfish 2010.
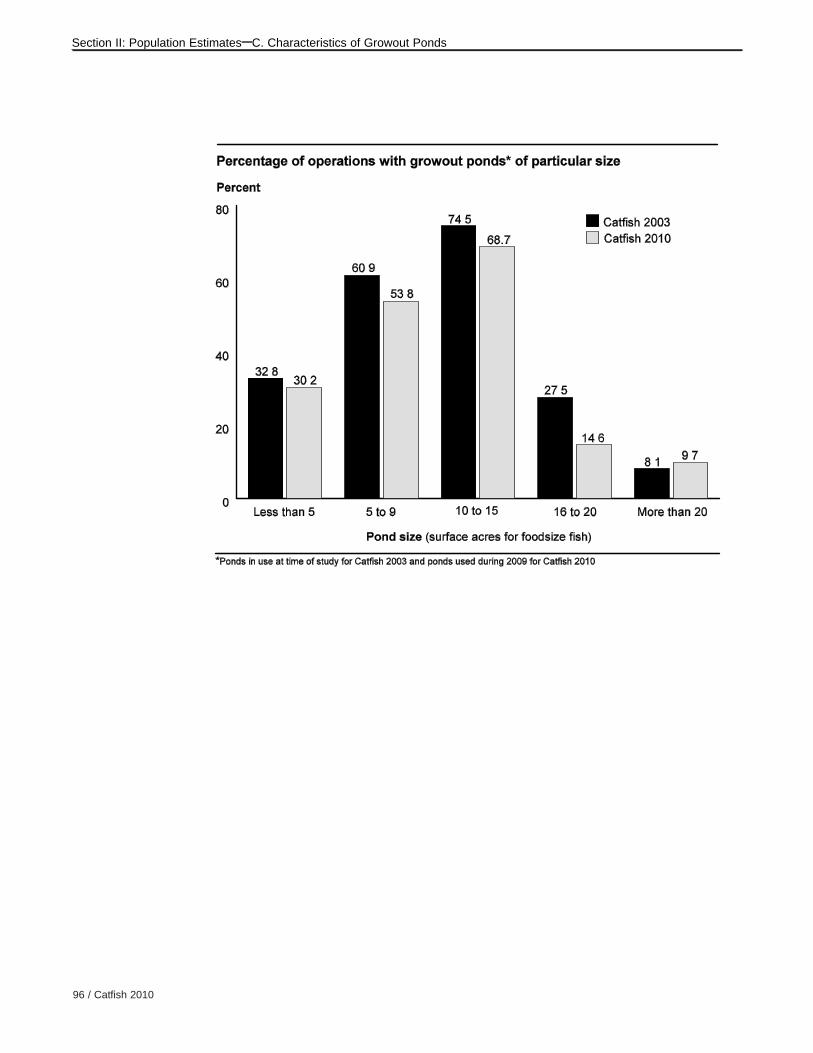
96 / Catfish 2010
Section II: Population Estimates–C. Characteristics of Growout Ponds

USDA APHIS VS / 97
Section II: Population Estimates–C. Characteristics of Growout Ponds
2. Water source
Although well water is typically dependable, free of wild fish and potential fish pathogens,
and less likely to contain undesirable materials, pumping the water necessitates additional
equipment and is costly. Surface water is not always dependable and can contain wild
fish, potential pathogens, and other undesirable materials.
The percentages of ponds filled by the listed water sources were similar for the two
studies, with the exception of ponds filled by “other” sources, which declined from
2 percent to zero.
Percentage of growout ponds* by water source:
Percent Growout ponds
Catfish 2003 Catfish 2010
Water Source Percent Std. Error Percent Std. Error
Well (levee pond) 72.5 (2.1) 76.5 (1.0)
Surface water (watershed pond, stream, spring)
25.5 (1.9) 23.5 (1.0)
Other 2.0 (0.3) 0.0 (—)
Total 100.0 100.0
*Ponds in use at time of study for Catfish 2003 and ponds used during 2009 for Catfish 2010.

98 / Catfish 2010
Section II: Population Estimates–C. Characteristics of Growout Ponds
3. Pond water depth
The recommended depth for growout ponds is 3 to 5 feet deep, but depth tends to vary in
watershed ponds, which often are constructed in hilly terrain with variations in topography.
From Catfish 2003 to Catfish 2010, the percentage of operations with an average pond
depth less than 4.0 feet deep decreased, from 4.1 percent of operations to 2.7 percent.
The percentages of operations with an average pond depth in the remaining listed depth
categories were similar for the studies.
a. Percentage of foodsize-fish operations by average pond* water depth:
Percent Foodsize-fish Operations
Catfish 2003 Catfish 2010
Average Pond Water Depth (feet) Percent Std. Error Percent Std. Error
Less than 4.0 4.1 (0.4) 2.7 (0.2)
4.0 to 5.0 72.8 (0.8) 74.8 (0.5)
Greater than 5.0 to 6.0 14.1 (0.7) 14.3 (0.4)
Greater than 6.0 9.0 (0.5) 8.2 (0.3)
Total 100.0 100.0
*Ponds in use at time of study for Catfish 2003 and ponds used during 2009 for Catfish 2010.

USDA APHIS VS / 99
Section II: Population Estimates–C. Characteristics of Growout Ponds
The percentage of operations with a maximum pond depth greater than 6.0 feet deep
increased from 56.9 percent for Catfish 2003 to 71.7 percent for Catfish 2010.
Concomitantly, the percentages of operations with maximum pond depths of 4.0 to
5.0 feet or greater than 5.0 to 6.0 feet declined between studies. These changes are more
likely due to changes in the population of operations (e.g., operations going out of
business) than to changes in existing pond depths or to new pond construction.
b. Percentage of foodsize-fish operations by maximum pond* water depth:
Percent Foodsize-fish Operations
Catfish 2003 Catfish 2010
Maximum Pond Water Depth (feet) Percent Std. Error Percent Std. Error
Less than 4.0 0.2 (0.1) 0.5 (0.1)
4.0 to 5.0 16.5 (0.7) 10.3 (0.3)
Greater than 5.0 to 6.0 26.4 (0.9) 17.5 (0.4)
Greater than 6.0 56.9 (0.9) 71.7 (0.5)
Total 100.0 100.0
*Ponds in use at time of study for Catfish 2003 and ponds used during 2009 for Catfish 2010.

100 / Catfish 2010
Section II: Population Estimates–D. Management of Production Ponds
D. Management ofProduction Ponds
1. Levee management
The percentage of operations using either of the listed measures for levee management
increased slightly from Catfish 2003 to Catfish 2010, with more than 95 percent of
foodsize-fish operations using at least one of the two listed measures in 2010.
Interestingly, the percentages of operations using the specific listed measures decreased
slightly between studies.
Percentage of foodsize-fish operations that use the following measures to control erosion
or improve vehicle access on levees:
Percent Foodsize-fish Operations
Catfish 2003 Catfish 2010
Levee Management Measure Percent Std. Error Percent Std. Error Vegetation on levee sides
94.1 (0.4) 91.0 (0.3)
Gravel on levee tops 86.2 (0.6) 81.3 (0.4)
Either measure 94.1 (0.4) 95.7 (0.2)
2. Draining and renovation
Data from the two studies indicate that, overall, foodsize-fish operations are waiting longer
between drainings or complete renovations of growout ponds. From Catfish 2003 to
Catfish 2010, the percentage of operations waiting 16 or more years to drain ponds
increased, with more than one-fifth of operations (22.2 percent) waiting 16 or more years
in 2010. Concomitantly, the percentages of operations waiting 2 to 5 or 6 to 10 years to
drain ponds declined between studies.

USDA APHIS VS / 101
Section II: Population Estimates–D. Management of Production Ponds
The trend was similar for complete renovations of ponds. From Catfish 2003 to Catfish
2010, the percentage of operations waiting 16 or more years between complete
renovations of ponds increased, with almost one-third of operations (31.0 percent) waiting
16 or more years between complete renovations of ponds in 2010. For all other waiting
times (1, 2 to 5, 6 to 10, or 11 to 15 years), the percentages of operations declined
between studies.
a. Percentage of foodsize-fish operations by usual number of years between draining or
complete renovations of growout ponds:
Percent Foodsize-fish Operations
Catfish 2003 Catfish 2010
Years Between… Percent Std. Error Percent Std. Error
Draining
1 3.1 (0.5) 2.2 (0.2)
2 to 5 24.6 (1.2) 16.5 (0.5)
6 to 10 48.5 (1.4) 41.9 (0.7)
11 to 15 17.0 (1.2) 17.2 (0.6)
16 or more 6.8 (0.8) 22.2 (0.6)
Total 100.0 100.0
Complete renovations
1 1.0 (0.2) 0.0 (—)
2 to 5 8.9 (0.7) 5.8 (0.3)
6 to 10 52.1 (1.5) 38.9 (0.7)
11 to 15 28.8 (1.4) 24.3 (0.7)
16 or more 9.2 (0.9) 31.0 (0.7)
Total 100.0 100.0

102 / Catfish 2010
Section II: Population Estimates–D. Management of Production Ponds
The trends seen above (table D.2.a) are supported by the operation average number of
years between pond management activities, which increased from Catfish 2003 to Catfish
2010 for both draining and complete renovations of ponds.
b. Operation average number of years between draining or complete renovations of
ponds:
Operation Average Number of Years
Catfish 2003 Catfish 2010
Pond Management Activity Average Std. Error Average Std. Error
Draining 9.1 (0.1) 11.7 (0.1)
Complete renovations 11.0 (0.1) 14.0 (0.1)
3. Water-level management
Lowering the water level in ponds in the fall can help reduce or prevent levee erosion.
From Catfish 2003 to Catfish 2010, the percentage of operations allowing the water level
to drop passively increased from 38.4 percent of operations to 44.0 percent.
Concomitantly, the percentage of operations actively releasing water to lower the level
decreased from 22.2 percent of operations to 14.5 percent. The percentage of operations
maintaining the water level was similar for the two studies.
Percentage of foodsize-fish operations by water-level management practice used in the
fall:
Percent Foodsize-fish Operations
Catfish 2003 Catfish 2010
Management Practice for Water Level Percent Std. Error Percent Std. Error Release water to lower level
22.2 (0.9) 14.5 (0.4)
Allow level to drop without intervention
38.4 (1.0) 44.0 (0.6)
Maintain water level (do not let water level drop)
39.4 (1.0) 41.5 (0.6)
Total 100.0 100.0

USDA APHIS VS / 103
Section II: Population Estimates–D. Management of Production Ponds
4. Monitoring of dissolved oxygen
Problems with low dissolved oxygen are more likely to occur in growout ponds with high
phytoplankton blooms, which can be caused by high fish densities and high feeding rates.
By closely monitoring oxygen levels in ponds, operations are more likely to identify
problems in time to intervene and prevent death losses.
From Catfish 2003 to Catfish 2010, the percentage of operations using automated
sensors more than doubled, from 17.2 to 40.9 percent. The percentage of operations
using hand monitors decreased between studies from three-fourths of operations
(75.1 percent) to slightly less than half of operations (48.9 percent). The percentage of
operations that did not regularly monitor dissolved oxygen levels increased slightly from
one study to the next.
Percentage of foodsize-fish operations by primary method used to regularly monitor
dissolved oxygen in growout ponds*:
Percent Foodsize-fish Operations
Catfish 2003 Catfish 2010
Method Percent Std. Error Percent Std. Error
Automated sensors 17.2 (0.7) 40.9 (0.6)
Hand monitor (oxygen meter)
75.1 (0.8) 48.9 (0.6)
Other 1.0 (0.2) 0.8 (0.1)
Did not regularly monitor dissolved oxygen levels
6.7 (0.4) 9.4 (0.3)
Total 100.0 100.0
*Method used during 2002 for Catfish 2003 and during 2009 for Catfish 2010.

104 / Catfish 2010
Section II: Population Estimates–D. Management of Production Ponds
5. Horsepower of fixed aeration
The average horsepower of fixed aeration per surface acre of growout ponds increased
from 1.9 hp/acre for Catfish 2003 to 2.5 hp/acre for Catfish 2010.
Operation average horsepower of fixed aeration per surface acre of growout ponds:
Operation Average Horsepower (hp/acre)
Catfish 2003 Catfish 2010
Average Std. Error Average Std. Error
1.9 (0.0) 2.5 (0.0)

USDA APHIS VS / 105
Section II: Population Estimates–D. Management of Production Ponds
6. Emergency aerators
Emergency aerators are mobile units used to supplement fixed aeration; they are usually
run by tractors using power take-offs. The number of emergency aerators available for
use was similar for Catfish 2003 and Catfish 2010.
Average number of emergency aerators (power take-offs or PTOs) on foodsize-fish
operations:
Average Number of Emergency Aerators
Catfish 2003 Catfish 2010
Average Std. Error Average Std. Error
9.1 (0.5) 10.1 (0.3)

106 / Catfish 2010
Section II: Population Estimates–E. Water Quality and Treatment
E. Water Qualityand Treatments
1. Chloride level
As noted for fry/fingerling ponds (see table G.7), high chloride levels in ponds can help
protect fish against nitrite exposure, which can cause a problem with oxygen
transportation in the blood known as brown blood disease.
Typically, pond chloride levels that exceed 100 ppm make it unnecessary to regularly
monitor nitrite levels. The operation average chloride level in growout ponds during
summer months was similar for the two studies and exceeded 100 ppm.
Operation average chloride level (parts per million) in growout ponds during summer:
Operation Average Chloride Level (ppm)
Catfish 2003 Catfish 2010
Average Std. Error Average Std. Error
110.4 (4.1) 117.9 (0.8)
2. Salt use
Adding salt to growout ponds increases chloride levels in the water, thereby protecting
against brown blood disease. For both studies, more than half of operations routinely
added salt to maintain a desired chloride level, although the percentage of operations that
routinely added salt declined slightly from Catfish 2003 to Catfish 2010. The percentage of
operations that did not add salt increased from 27.4 to 31.3 percent. The percentage of
operations that added salt only in response to health problems was similar for the two
studies.
Percentage of foodsize-fish operations by use of salt in growout ponds*:
Percent Foodsize-fish Operations
Catfish 2003 Catfish 2010
Salt Use Percent Std. Error Percent Std. Error
Routinely added salt to maintain a desired chloride level
53.5 (0.9) 50.1 (0.6)
Added salt only in response to health problems
19.1 (0.8) 18.6 (0.5)
Did not add salt 27.4 (0.7) 31.3 (0.5)
Total 100.0 100.0
*General method used for Catfish 2003 and during 2009 for Catfish 2010.

USDA APHIS VS / 107
Section II: Population Estimates–E. Water Quality and Treatments
3. Alkalinity
Higher alkalinity helps reduce the toxicity of dissolved metals to fish, and alkalinity of at
least 20 ppm is recommended.
For both studies, the majority of operations maintained an alkalinity of 20 ppm or more in
growout ponds. For most of the listed levels of alkalinity, the percentages of operations
were similar for the two studies; however, the percentage of operations with alkalinity of
200 ppm or more increased slightly from Catfish 2003 to Catfish 2010.
a. Percentage of foodsize-fish operations by alkalinity (ppm) of the water used in growout
ponds:
Percent Foodsize-fish Operations
Catfish 2003 Catfish 2010
Alkalinity (ppm) Percent Std. Error Percent Std. Error
Less than 20 9.4 (0.9) 10.8 (0.6)
20 to 99 27.2 (1.3) 26.7 (0.8)
100 to 199 57.3 (1.5) 52.7 (0.9)
200 or more 6.1 (0.6) 9.8 (0.4)
Total 100.0 100.0
The operation average alkalinity increased from Catfish 2003 to Catfish 2010.
b. Operation average alkalinity (ppm) of water used in growout ponds:
Operation Average Alkalinity (ppm)
Catfish 2003 Catfish 2010
Average Std. Error Average Std. Error
102.3 (1.6) 117.9 (0.8)

108 / Catfish 2010
Section II: Population Estimates–E. Water Quality and Treatment
From Catfish 2003 to Catfish 2010, the percentage of operations that routinely added
calcium (typically in the form of agricultural lime, hydrated lime, or gypsum) to growout
ponds to maintain a desired alkalinity decreased from 14.2 to 10.0 percent of operations,
while the percentage of operations that added calcium only in response to health
problems increased, from 15.8 to 23.3 percent of operations. For both studies, the
majority of operations did not add calcium to growout ponds, but this percentage
decreased slightly between studies, from 70.0 to 66.7 percent of operations.
c. Percentage of foodsize-fish operations by method of adding calcium (typically in the
form of agricultural lime, hydrated lime, or gypsum) to ponds to maintain alkalinity:
Percent Foodsize-fish Operations
Catfish 2003 Catfish 2010
Method Percent Std. Error Percent Std. Error
Routinely add calcium to maintain a desired alkalinity and hardness
14.2 (0.7) 10.0 (0.4)
Add calcium only in response to health problems
15.8 (0.7) 23.3 (0.5)
Do not add calcium to growout ponds
70.0 (0.9) 66.7 (0.6)
Total 100.0 100.0

USDA APHIS VS / 109
Section II: Population Estimates–E. Water Quality and Treatments
4. Water quality testing
Good water quality can help keep catfish healthy by helping prevent specific diseases and
by reducing stress, which makes fish more susceptible to disease problems. Data from
the two studies indicate that, in general, operations have reduced the frequency of water
quality testing in growout ponds. From Catfish 2003 to Catfish 2010, the percentage of
operations that did not test water quality in growout ponds increased from 15.6 to
20.2 percent, and the percentage of operations testing water quality less than once a
month also increased, from 18.7 to 28.7 percent. The percentage of operations that tested
water quality in growout ponds at least once a month declined, from 43.0 to 35.2 percent.
The percentage of operations that tested only in response to health problems decreased,
from 22.7 to 15.9 percent of operations.
a. Percentage of foodsize-fish operations by frequency of water quality testing in growout
ponds*:
Percent Foodsize-fish Operations
Catfish 2003 Catfish 2010
Frequency Percent Std. Error Percent Std. Error
At least once a month 43.0 (1.0) 35.2 (0.6)
Less than once a month 18.7 (0.8) 28.7 (0.6)
In response to health problems only
22.7 (0.8) 15.9 (0.4)
Not tested 15.6 (0.6) 20.2 (0.4)
Total 100.0 100.0
*General testing practices used for Catfish 2003; practice during 2009 used for Catfish 2010.

110 / Catfish 2010
Section II: Population Estimates–E. Water Quality and Treatment
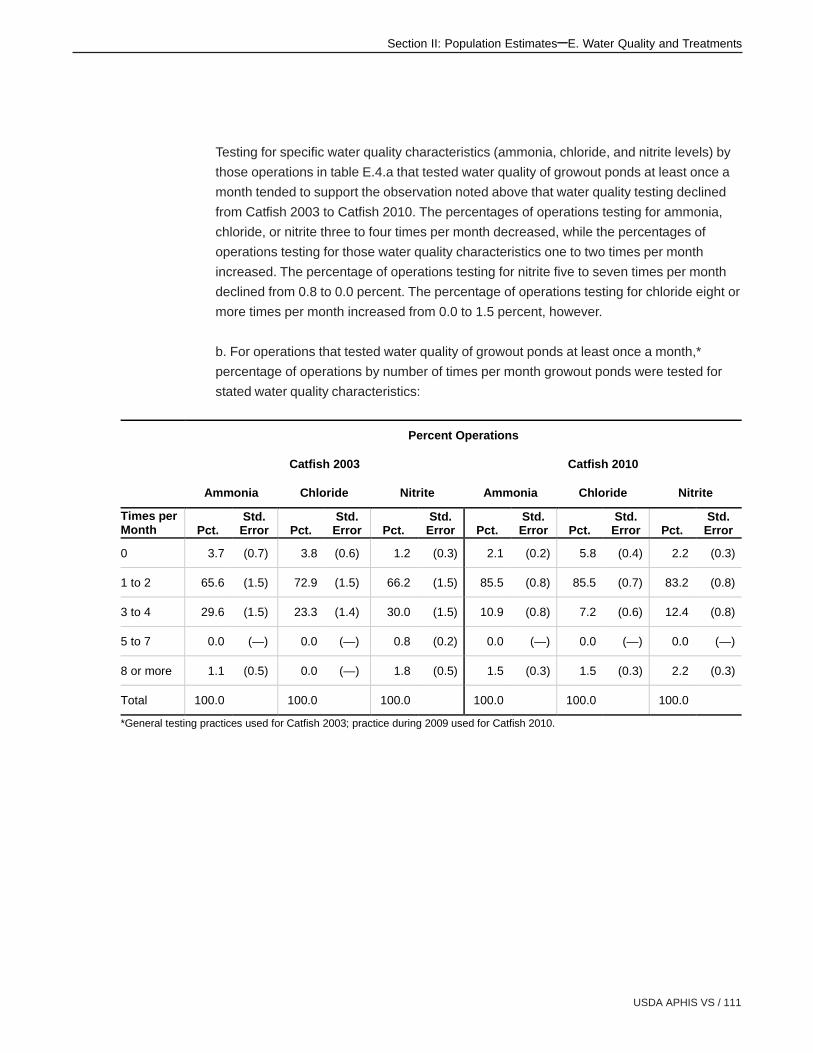
USDA APHIS VS / 111
Section II: Population Estimates–E. Water Quality and Treatments
Testing for specific water quality characteristics (ammonia, chloride, and nitrite levels) by
those operations in table E.4.a that tested water quality of growout ponds at least once a
month tended to support the observation noted above that water quality testing declined
from Catfish 2003 to Catfish 2010. The percentages of operations testing for ammonia,
chloride, or nitrite three to four times per month decreased, while the percentages of
operations testing for those water quality characteristics one to two times per month
increased. The percentage of operations testing for nitrite five to seven times per month
declined from 0.8 to 0.0 percent. The percentage of operations testing for chloride eight or
more times per month increased from 0.0 to 1.5 percent, however.
b. For operations that tested water quality of growout ponds at least once a month,*
percentage of operations by number of times per month growout ponds were tested for
stated water quality characteristics:
Percent Operations
Catfish 2003 Catfish 2010
Ammonia Chloride Nitrite Ammonia Chloride Nitrite
Times per Month Pct.
Std. Error Pct.
Std. Error Pct.
Std. Error Pct.
Std. Error Pct.
Std. Error Pct.
Std. Error
0 3.7 (0.7) 3.8 (0.6) 1.2 (0.3) 2.1 (0.2) 5.8 (0.4) 2.2 (0.3)
1 to 2 65.6 (1.5) 72.9 (1.5) 66.2 (1.5) 85.5 (0.8) 85.5 (0.7) 83.2 (0.8)
3 to 4 29.6 (1.5) 23.3 (1.4) 30.0 (1.5) 10.9 (0.8) 7.2 (0.6) 12.4 (0.8)
5 to 7 0.0 (—) 0.0 (—) 0.8 (0.2) 0.0 (—) 0.0 (—) 0.0 (—)
8 or more 1.1 (0.5) 0.0 (—) 1.8 (0.5) 1.5 (0.3) 1.5 (0.3) 2.2 (0.3)
Total 100.0 100.0 100.0 100.0 100.0 100.0
*General testing practices used for Catfish 2003; practice during 2009 used for Catfish 2010.

112 / Catfish 2010
Section II: Population Estimates–E. Water Quality and Treatment
5. Algae management
Overgrowth of algae can lead to lower levels of dissolved oxygen in the water at night.
Certain types of algae in growout ponds also cause some problems with off-flavor in fish.
The percentage of operations that used a control program to prevent algae overgrowth
was similar for Catfish 2003 and Catfish 2010. The percentage of operations that used no
algae control treatments, however, increased from 28.1 to 34.3 percent, while the
percentage of operations that used algae control only in response to problems decreased
from about one-third of operations (34.1 percent) to about one-fourth (24.8 percent).
a. Percentage of foodsize-fish operations by usual algae management practice:
Percent Foodsize-fish Operations
Catfish 2003 Catfish 2010
Algae Management Practice Percent Std. Error Percent Std. Error Prevent algae overgrowth with a control program
37.8 (1.0) 40.9 (0.6)
Control bloom only in response to problems such as off-flavor
34.1 (1.0) 24.8 (0.5)
No algae control treatments
28.1 (0.8) 34.3 (0.5)
Total 100.0 100.0

USDA APHIS VS / 113
Section II: Population Estimates–E. Water Quality and Treatments
On operations that typically used algae control programs, the percentage of growout
ponds included in the control program increased from Catfish 2003 to Catfish 2010 for
operations with 20 to 49 or 50 to 149 surface acres for foodsize fish.
b. For operations that typically used algae control programs, percentage of growout ponds
included in the control program,* by size of operation:
Percent Growout Ponds
Catfish 2003 Catfish 2010
Size of Operation (surface acres for foodsize fish) Percent Std. Error Percent Std. Error
1 to 19 98.6 (0.8) 97.9 (0.5)
20 to 49 94.0 (1.2) 98.6 (0.2)
50 to 149 90.1 (1.5) 97.9 (0.3)
150 or more 77.1 (6.3) 88.7 (1.6)
All operations 80.4 (5.0) 91.6 (1.2)
*During 2002 for Catfish 2003 and during 2009 for Catfish 2010.
From Catfish 2003 to Catfish 2010, the percentage of operations using biological control
methods in algae control programs increased, while the percentage of operations using
“other” algae control methods decreased.
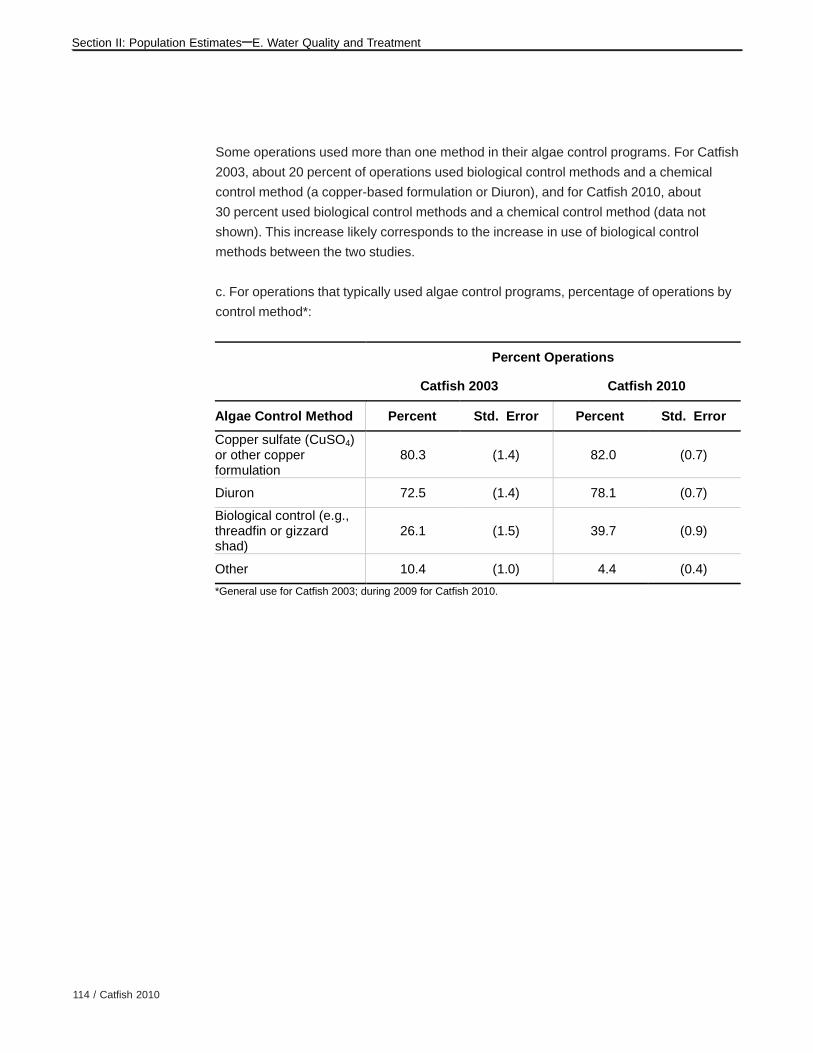
114 / Catfish 2010
Section II: Population Estimates–E. Water Quality and Treatment
Some operations used more than one method in their algae control programs. For Catfish
2003, about 20 percent of operations used biological control methods and a chemical
control method (a copper-based formulation or Diuron), and for Catfish 2010, about
30 percent used biological control methods and a chemical control method (data not
shown). This increase likely corresponds to the increase in use of biological control
methods between the two studies.
c. For operations that typically used algae control programs, percentage of operations by
control method*:
Percent Operations
Catfish 2003 Catfish 2010
Algae Control Method Percent Std. Error Percent Std. Error
Copper sulfate (CuSO4) or other copper formulation
80.3 (1.4) 82.0 (0.7)
Diuron 72.5 (1.4) 78.1 (0.7)
Biological control (e.g., threadfin or gizzard shad)
26.1 (1.5) 39.7 (0.9)
Other 10.4 (1.0) 4.4 (0.4)
*General use for Catfish 2003; during 2009 for Catfish 2010.

USDA APHIS VS / 115
Section II: Population Estimates–E. Water Quality and Treatments
Typically, catfish producers begin algae control programs in the period March through
June, when warmer weather and longer days promote algae growth, and end programs as
the weather cools. Overall, this pattern was true for operations in the two studies. Some
minor differences occurred between the studies that suggest some producers might be
extending the length of the algae control program. The percentage of operations that
began treatment in May declined from Catfish 2003 to Catfish 2010, and the percentage
of operations that started programs in March and April increased from 37.4 to
45.4 percent. The percentage of producers that ended the algae control program in
September declined between the two studies and the percentage ending the program in
November increased. .
d. For operations that used copper sulfate (or other copper formulation) or Diuron to
control algae, percentage of operations by month that the program began and ended
during the previous year:
Percent Foodsize-fish Operations
Beginning Month Ending Month
Catfish 2003 Catfish 2010 Catfish 2003 Catfish 2010
Month Pct. Std.
Error Pct. Std.
Error Pct. Std. Error Pct.
Std. Error
January 4.1 (0.7) 4.1 (0.4) 0.0 (—) 0.0 (—)
February 2.0 (0.5) 0.7 (0.2) 0.0 (—) 0.0 (—)
March 12.7 (1.3) 16.4 (0.8) 0.4 (0.1) 0.0 (—)
April 24.7 (1.5) 29.0 (0.9) 0.0 (—) 0.0 (—)
May 34.7 (1.8) 24.6 (0.9) 0.0 (—) 0.0 (—)
June 17.6 (1.4) 19.8 (0.9) 0.0 (—) 0.0 (—)
July 3.7 (0.7) 5.4 (0.4) 2.5 (0.5) 2.7 (0.4)
August 0.5 (0.2) 0.0 (—) 5.9 (0.9) 8.1 (0.6)
September 0.0 (—) 0.0 (—) 27.4 (1.6) 18.1 (0.8)
October 0.0 (—) 0.0 (—) 45.5 (1.8) 42.0 (1.0)
November 0.0 (—) 0.0 (—) 13.2 (1.2) 24.2 (0.9)
December 0.0 (—) 0.0 (—) 5.1 (0.8) 4.9 (0.5)
Total 100.0 100.0 100.0 100.0
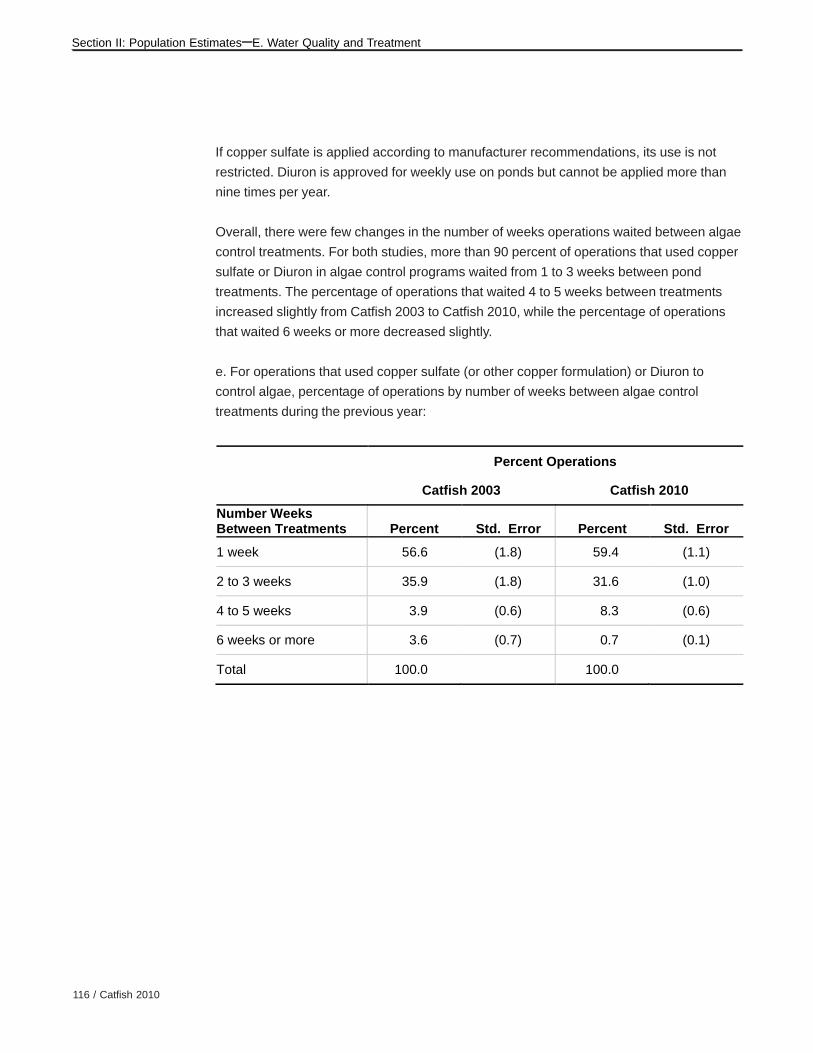
116 / Catfish 2010
Section II: Population Estimates–E. Water Quality and Treatment
If copper sulfate is applied according to manufacturer recommendations, its use is not
restricted. Diuron is approved for weekly use on ponds but cannot be applied more than
nine times per year.
Overall, there were few changes in the number of weeks operations waited between algae
control treatments. For both studies, more than 90 percent of operations that used copper
sulfate or Diuron in algae control programs waited from 1 to 3 weeks between pond
treatments. The percentage of operations that waited 4 to 5 weeks between treatments
increased slightly from Catfish 2003 to Catfish 2010, while the percentage of operations
that waited 6 weeks or more decreased slightly.
e. For operations that used copper sulfate (or other copper formulation) or Diuron to
control algae, percentage of operations by number of weeks between algae control
treatments during the previous year:
Percent Operations
Catfish 2003 Catfish 2010
Number Weeks Between Treatments Percent Std. Error Percent Std. Error
1 week 56.6 (1.8) 59.4 (1.1)
2 to 3 weeks 35.9 (1.8) 31.6 (1.0)
4 to 5 weeks 3.9 (0.6) 8.3 (0.6)
6 weeks or more 3.6 (0.7) 0.7 (0.1)
Total 100.0 100.0

USDA APHIS VS / 117
Section II: Population Estimates–E. Water Quality and Treatments
6. Snail control
Ramshorn snails are an intermediate host for trematodes. Controlling snails in ponds can
help prevent trematode-related problems.
For both studies, slightly more than one-tenth of operations had a problem with snails in
any growout ponds in the year before the study.
a. Percentage of operations that had a problem with snails in any growout ponds in the
previous year:
Percent Foodsize-fish Operations
Catfish 2003 Catfish 2010
Percent Std. Error Percent Std. Error
12.7 (0.7) 11.1 (0.4)
All operations were asked about their snail-control practices. Although copper remained
the control measure used by the highest percentage of operations, the percentage of
operations that used copper declined from Catfish 2003 to Catfish 2010. The percentage
of operations using lime (most likely hydrated lime) or any control measure also declined
between studies.
b. Percentage of operations that used the following measures to control snails in growout
ponds:
Percent Foodsize-fish Operations
Catfish 2003 Catfish 2010
Snail Control Measure Percent Std. Error Percent Std. Error
Lime 11.1 (0.7) 4.1 (0.2)
Copper 13.0 (0.7) 9.4 (0.3)
Weed control 4.6 (0.5) 3.5 (0.2)
Biological control 1.8 (0.4) 3.0 (0.2)
Other 0.7 (0.2) 0.0 (—)
Any 19.9 (0.8) 13.0 (0.4)
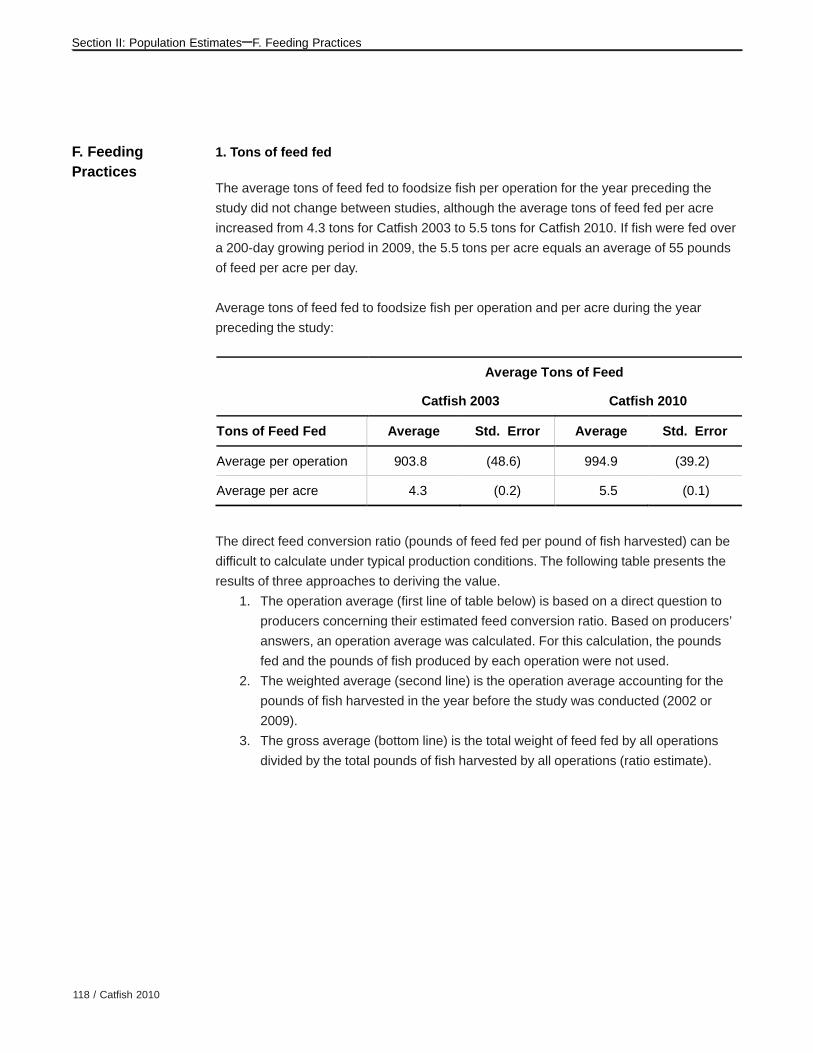
118 / Catfish 2010
Section II: Population Estimates–F. Feeding Practices
F. FeedingPractices
1. Tons of feed fed
The average tons of feed fed to foodsize fish per operation for the year preceding the
study did not change between studies, although the average tons of feed fed per acre
increased from 4.3 tons for Catfish 2003 to 5.5 tons for Catfish 2010. If fish were fed over
a 200-day growing period in 2009, the 5.5 tons per acre equals an average of 55 pounds
of feed per acre per day.
Average tons of feed fed to foodsize fish per operation and per acre during the year
preceding the study:
Average Tons of Feed
Catfish 2003 Catfish 2010
Tons of Feed Fed Average Std. Error Average Std. Error
Average per operation 903.8 (48.6) 994.9 (39.2)
Average per acre 4.3 (0.2) 5.5 (0.1)
The direct feed conversion ratio (pounds of feed fed per pound of fish harvested) can be
difficult to calculate under typical production conditions. The following table presents the
results of three approaches to deriving the value.
1. The operation average (first line of table below) is based on a direct question to
producers concerning their estimated feed conversion ratio. Based on producers’
answers, an operation average was calculated. For this calculation, the pounds
fed and the pounds of fish produced by each operation were not used.
2. The weighted average (second line) is the operation average accounting for the
pounds of fish harvested in the year before the study was conducted (2002 or
2009).
3. The gross average (bottom line) is the total weight of feed fed by all operations
divided by the total pounds of fish harvested by all operations (ratio estimate).

USDA APHIS VS / 119
Section II: Population Estimates–F. Feeding Practices
Although the operation average based on producer estimates of feed conversion ratios
was similar for the two studies, the ratios calculated by weighted average or gross
average declined. The reduction in the amount of feed fed per pound of fish harvested
might reflect improvements in feeds, genetic lines, fish health, or other management
factors. The observed decline might also reflect operations that reduced feeding levels
and/or production, possibly because of financial constraints.
Average pounds of feed fed per pound of fish harvested during the year prior to the study:
Operation Average (lb feed/lb fish harvested)
Catfish 2003 Catfish 2010
Average Average Std. Error Average Std. Error
Operation average 2.2 (0.0) 2.2 (0.0)
Weighted average1 2.3 (0.0) 2.2 (0.0)
Gross average2 2.3 (0.0) 2.1 (0.0) 1Operation average weighted by pounds of fish harvested.
2Annual feed divided by pounds of foodsize fish harvested.
3. Protein in feed
Although a protein level of 32 percent was considered standard for catfish feed in the
past, a level of 28 percent has been shown to be adequate for foodsize fish. Some
producers feed protein levels as high as 36 percent; these higher protein levels may
reduce body fat, leading to a leaner product.

120 / Catfish 2010
Section II: Population Estimates–F. Feeding Practices
The protein level primarily fed by the highest percentage of operations changed from
32 percent for Catfish 2003 to 28 percent for Catfish 2010. Between studies, the
percentage of operations primarily using catfish feed with a protein level of 32 percent
declined from 62.3 to 40.4 percent. Concomitantly, the percentage of operations using
feed with 28 percent protein increased, from 35.2 to 57.3 percent.
Percentage of foodsize-fish operations by protein level in feed primarily fed to foodsize
fish*:
Percent Foodsize-fish Operations
Catfish 2003 Catfish 2010
Protein Level (percent) Percent Std. Error Percent Std. Error
28 35.2 (0.9) 57.3 (0.6)
32 62.3 (1.0) 40.4 (0.6)
35 1.5 (0.3) 0.8 (0.1)
Other 1.0 (0.1) 1.5 (0.2)
Total 100.0 100.0
*Catfish 2003 asked in general about the protein level of feed fed to foodsize fish, whereas Catfish 2010 asked about the protein level of feed fed primarily during 2009.

USDA APHIS VS / 121
Section II: Population Estimates–F. Feeding Practices
4. Seasonal feeding practices
The amount catfish eat is related to water temperature, and at lower temperatures, they
may feed inconsistently; therefore, many producers vary their feeding method by season.
Overall, the seasonal feeding patterns for foodsize fish for the year prior to the study were
similar for Catfish 2003 and Catfish 2010. In both studies, the majority of producers fed
catfish every day during the warmer months (May through August), while the majority of
producers fed catfish on alternate days during the typically cooler months (March and April
and September and October). During all seasons in both studies, a higher percentage of
operations fed catfish to satiation (combining every day and alternate day feeding) than
fed to a maximum feeding limit (combining every day and alternate day feeding).

122 / Catfish 2010
Section II: Population Estimates–F. Feeding Practices
Some of the individual percentages changed between studies, however. The percentage
of operations feeding every day to satiation decreased from Catfish 2003 to Catfish 2010
for the cooler months of March and April and increased for the warmer months of May
through August. The percentage of operations feeding every day but with a maximum
feeding limit declined between studies for each season. For the March to April period, the
percentage of operations feeding alternate days to satiation increased between studies,
while the percentage of operations feeding alternate days with a maximum feeding limit
decreased.
a. Percentage of foodsize-fish operations by seasonal feeding method most commonly
used for foodsize fish in the year prior to the study:
Percent Foodsize-fish Operations
Catfish 2003 Catfish 2010
Mar–Apr May–Aug Sep–Oct Mar–Apr May–Aug Sep–Oct
Feeding Method Pct.
Std. Error Pct.
Std. Error Pct.
Std. Error Pct.
Std. Error Pct.
Std. Error Pct.
Std. Error
Every day to satiation (all they can eat)
12.5 (0.6) 39.9 (1.0) 17.1 (0.8) 7.9 (0.3) 46.1 (0.6) 18.8 (0.5)
Every day but with a maximum feeding limit
13.7 (0.7) 31.4 (0.9) 18.5 (0.8) 8.9 (0.3) 25.0 (0.5) 12.1 (0.4)
Alternate days to satiation
37.8 (1.0) 16.5 (0.7) 35.0 (1.0) 48.1 (0.6) 16.2 (0.4) 38.1 (0.6)
Alternate days with a maximum feeding limit
22.8 (0.9) 9.2 (0.6) 19.0 (0.8) 19.5 (0.5) 8.2 (0.3) 20.8 (0.5)
Other 13.2 (0.7) 3.0 (0.3) 10.4 (0.6) 15.6 (0.5) 4.5 (0.3) 10.2 (0.4)
Total 100.0 100.0 100.0 100.0 100.0 100.0

USDA APHIS VS / 123
Section II: Population Estimates–F. Feeding Practices
Although catfish feed less during winter, some evidence suggests that, when
temperatures are appropriate, producers should provide some feed to help catfish
maintain body weight and condition.
For the December to February time period, however, the percentage of operations that fed
zero days per week increased from 30.1 percent for Catfish 2003 to 56.8 percent for
Catfish 2010. Additionally, of Catfish 2010 operations that fed fish during the winter, the
highest percentage (37.3 percent) fed them 1 to 3 days per week, while the highest
percentage of Catfish 2003 operations (53.1 percent) fed fish 4 or more days per week.
b. Percentage of operations by average number of days per week foodsize fish were fed
from December through February:
Percent Foodsize-fish Operations
Catfish 2003 Catfish 2010
Average Number Days per Week Percent Std. Error Percent Std. Error
0 30.1 (0.9) 56.8 (0.6)
1 to 3 9.7 (0.6) 37.3 (0.6)
4 or more 53.1 (1.0) 0.8 (0.1)
No food fish on hand in winter
7.1 (0.4) 5.1 (0.2)
Total 100.0 100.0

124 / Catfish 2010
Section II: Population Estimates–F. Feeding Practices
5. Maximum feed fed to foodsize-fish
The amount of feed fed daily during the highest feeding month reflects the intensity of
production. The operation average pounds of feed fed per acre, per day, in the year
preceding the study increased from 108.4 pounds per acre for Catfish 2003 to
120.0 pounds per acre for Catfish 2010. This result agrees with the increase in the
average tons of feed fed per acre (table F.1).
a. Operation average pounds of feed fed per acre, per day, to foodsize fish in all ponds
during the highest feeding month in the year preceding the study:
Operation Average (lb/acre/day)
Catfish 2003 Catfish 2010
Average Std. Error Average Std. Error
108.4 (0.9) 120.0 (0.6)
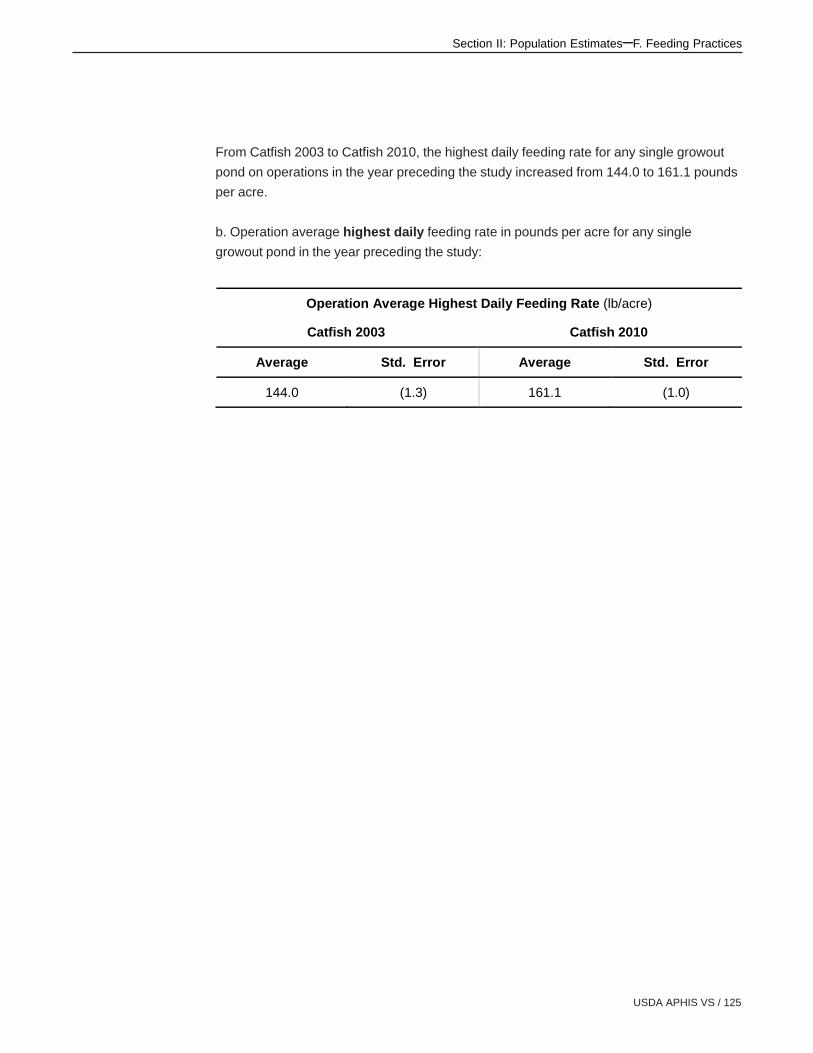
USDA APHIS VS / 125
Section II: Population Estimates–F. Feeding Practices
From Catfish 2003 to Catfish 2010, the highest daily feeding rate for any single growout
pond on operations in the year preceding the study increased from 144.0 to 161.1 pounds
per acre.
b. Operation average highest daily feeding rate in pounds per acre for any single
growout pond in the year preceding the study:
Operation Average Highest Daily Feeding Rate (lb/acre)
Catfish 2003 Catfish 2010
Average Std. Error Average Std. Error
144.0 (1.3) 161.1 (1.0)
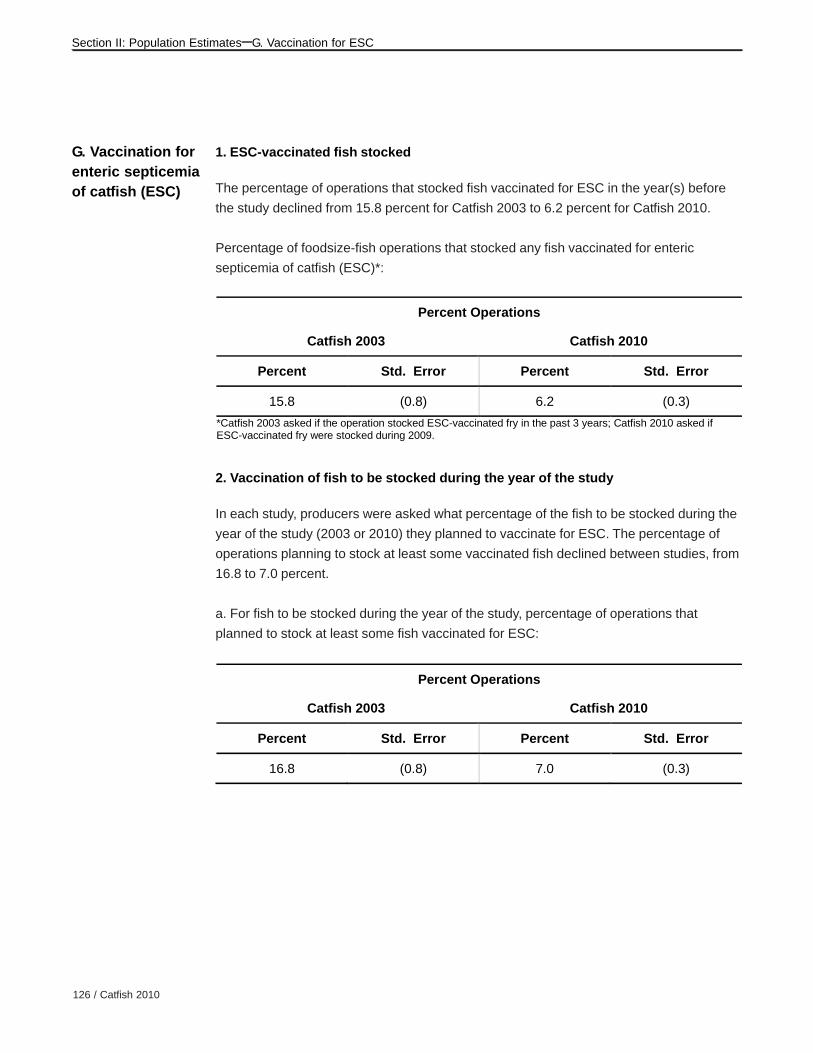
126 / Catfish 2010
Section II: Population Estimates–G. Vaccination for ESC
G. Vaccination forenteric septicemiaof catfish (ESC)
1. ESC-vaccinated fish stocked
The percentage of operations that stocked fish vaccinated for ESC in the year(s) before
the study declined from 15.8 percent for Catfish 2003 to 6.2 percent for Catfish 2010.
Percentage of foodsize-fish operations that stocked any fish vaccinated for enteric
septicemia of catfish (ESC)*:
Percent Operations
Catfish 2003 Catfish 2010
Percent Std. Error Percent Std. Error
15.8 (0.8) 6.2 (0.3)
*Catfish 2003 asked if the operation stocked ESC-vaccinated fry in the past 3 years; Catfish 2010 asked if ESC-vaccinated fry were stocked during 2009.
2. Vaccination of fish to be stocked during the year of the study
In each study, producers were asked what percentage of the fish to be stocked during the
year of the study (2003 or 2010) they planned to vaccinate for ESC. The percentage of
operations planning to stock at least some vaccinated fish declined between studies, from
16.8 to 7.0 percent.
a. For fish to be stocked during the year of the study, percentage of operations that
planned to stock at least some fish vaccinated for ESC:
Percent Operations
Catfish 2003 Catfish 2010
Percent Std. Error Percent Std. Error
16.8 (0.8) 7.0 (0.3)
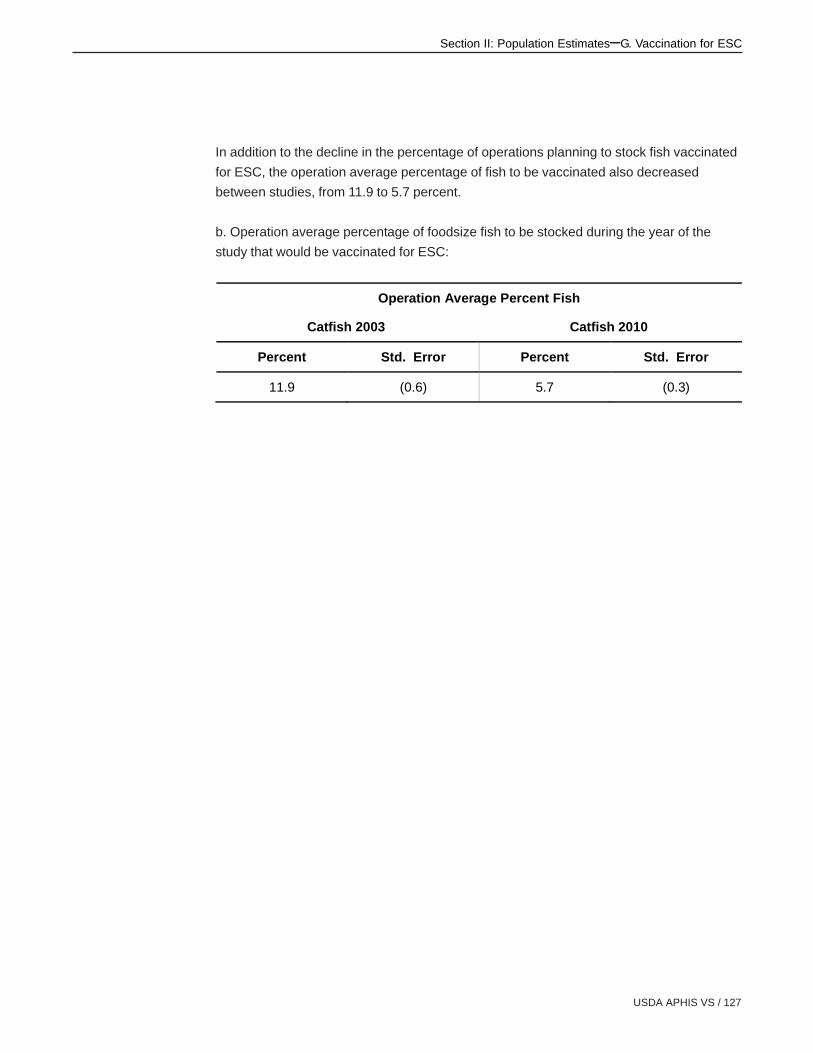
USDA APHIS VS / 127
Section II: Population Estimates–G. Vaccination for ESC
In addition to the decline in the percentage of operations planning to stock fish vaccinated
for ESC, the operation average percentage of fish to be vaccinated also decreased
between studies, from 11.9 to 5.7 percent.
b. Operation average percentage of foodsize fish to be stocked during the year of the
study that would be vaccinated for ESC:
Operation Average Percent Fish
Catfish 2003 Catfish 2010
Percent Std. Error Percent Std. Error
11.9 (0.6) 5.7 (0.3)

128 / Catfish 2010
Section II: Population Estimates–H. Foodsize-fish Health Issues
H. Foodsize-fishHealth Issues
1. Causes of foodsize-fish loss
From Catfish 2003 to Catfish 2010, the percentages of operations that lost any foodsize
fish to ESC, columnaris, anemia, winter kill, or visceral toxicosis of catfish declined. The
percentage of operations that lost fish to ESC declined from 60.6 to 36.6 percent of
operations, while the percentage that lost fish to columnaris declined from 50.4 to
39.0 percent.
Overall, however, the percentage of operations that lost any fish to any of the causes
increased between studies. This might be explained in part by the addition of predation
and low dissolved oxygen to the list of causes of loss in Catfish 2010. Predation by birds
and other animals caused loss on the highest percentage of operations for Catfish 2010,
affecting more than half of all foodsize-fish operations (53.9 percent).

USDA APHIS VS / 129
Section II: Population Estimates–H. Foodsize-fish Health Issues
Percent Foodsize-fish Operations
Catfish 2003 Catfish 2010
Cause of Loss Percent Std. Error Percent Std. Error
Enteric septicemia of catfish (ESC, hole-in-head disease)
60.6 (0.9) 36.6 (0.6)
Columnaris 50.4 (1.0) 39.0 (0.6)
Ich 4.1 (0.4) 4.9 (0.3)
Proliferative gill disease (PGD, hamburger gill disease)
12.7 (0.7) 13.6 (0.4)
Anemia (white lip, no blood)
14.4 (0.8) 7.9 (0.4)
Winter kill (Saprolegnia fungus)
32.9 (1.0) 20.6 (0.5)
Visceral toxicosis of catfish (VTC, twisted gut, botulism)
9.7 (0.7) 5.2 (0.2)
Trematodes 4.3 (0.5) 3.7 (0.2)
Predation (birds or other animals)
53.9 (0.6)
Low dissolved oxygen 28.1 (0.5)
Other 2.8 (0.4) 9.3 (0.3)
Any 72.9 (1.0) 79.2 (0.5)
The percentage of operations that reported fish loss to “other” causes increased between
studies. In Catfish 2010, respondents specified causes such as Aeromonas, heat, and
algal toxins, although many did not specify a cause for the “other” loss category.
a. Percentage of foodsize-fish operations that lost any foodsize fish to the following
causes in the year preceding the study:

130 / Catfish 2010
Section II: Population Estimates–H. Foodsize-fish Health Issues
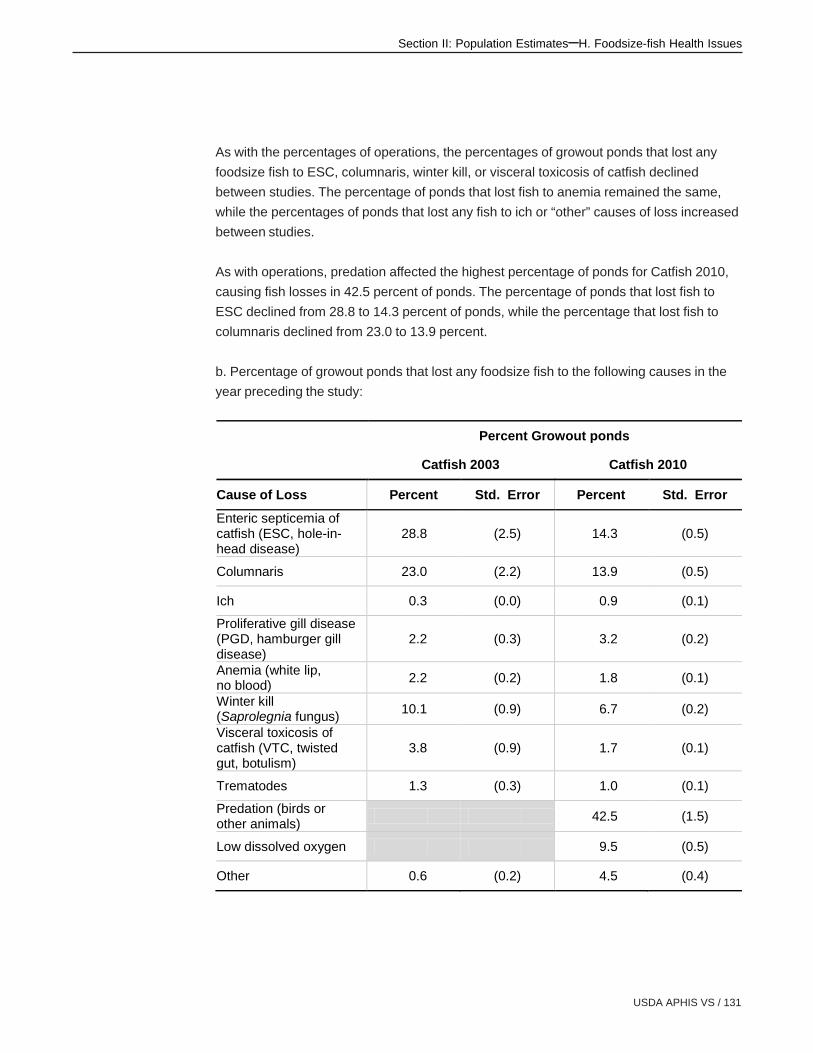
USDA APHIS VS / 131
Section II: Population Estimates–H. Foodsize-fish Health Issues
As with the percentages of operations, the percentages of growout ponds that lost any
foodsize fish to ESC, columnaris, winter kill, or visceral toxicosis of catfish declined
between studies. The percentage of ponds that lost fish to anemia remained the same,
while the percentages of ponds that lost any fish to ich or “other” causes of loss increased
between studies.
As with operations, predation affected the highest percentage of ponds for Catfish 2010,
causing fish losses in 42.5 percent of ponds. The percentage of ponds that lost fish to
ESC declined from 28.8 to 14.3 percent of ponds, while the percentage that lost fish to
columnaris declined from 23.0 to 13.9 percent.
b. Percentage of growout ponds that lost any foodsize fish to the following causes in the
year preceding the study:
Percent Growout ponds
Catfish 2003 Catfish 2010
Cause of Loss Percent Std. Error Percent Std. Error
Enteric septicemia of catfish (ESC, hole-in-head disease)
28.8 (2.5) 14.3 (0.5)
Columnaris 23.0 (2.2) 13.9 (0.5)
Ich 0.3 (0.0) 0.9 (0.1)
Proliferative gill disease (PGD, hamburger gill disease)
2.2 (0.3) 3.2 (0.2)
Anemia (white lip, no blood)
2.2 (0.2) 1.8 (0.1)
Winter kill (Saprolegnia fungus)
10.1 (0.9) 6.7 (0.2)
Visceral toxicosis of catfish (VTC, twisted gut, botulism)
3.8 (0.9) 1.7 (0.1)
Trematodes 1.3 (0.3) 1.0 (0.1)
Predation (birds or other animals)
42.5 (1.5)
Low dissolved oxygen 9.5 (0.5)
Other 0.6 (0.2) 4.5 (0.4)

132 / Catfish 2010
Section II: Population Estimates–H. Foodsize-fish Health Issues
Quantifying the amount of fish lost during a mortality event can be difficult. Producers
were asked to categorize the average loss per event as light, moderate, or severe based
on the estimated number of pounds of fish lost.
In Catfish 2010, the percentages of operations categorizing losses as light increased for
all listed causes of loss with the exception of the “other” causes (and predation and low
dissolved oxygen, which weren’t included in Catfish 2003). The percentages of operations
categorizing losses as severe decreased for ESC, columnaris, ich, PGD, anemia, winter
kill, and VTC and were similar for trematodes. The percentages of operations categorizing
losses as moderate decreased for ESC, columnaris, PGD, winter kill, VTC, trematodes,
and “other” causes and remained the same for ich and anemia. As noted above, “other”
causes of loss were an exception, with a higher percentage of Catfish 2010 operations
categorizing these losses as severe. For Catfish 2010, more than two-thirds of “other”
losses that were severe were reported to be Aeromonas (data not shown).

USDA APHIS VS / 133
Section II: Population Estimates–H. Foodsize-fish Health Issues
c. For operations that lost fish in growout ponds to the following causes of loss in the year
preceding the study, percentage of operations by severity of average loss (in pounds of
fish per operation) per mortality event:
Percent Foodsize-fish Operations
Average Loss per Event (lb)
Catfish 2003 Catfish 2010
Light (Less than 200)
Moderate (200–2,000)
Severe (More than
2,000) Light
(Less than 200) Moderate
(200–2,000)
Severe (More than
2,000) Cause of Loss Pct.
Std. Error Pct.
Std. Error Pct.
Std. Error Pct.
Std. Error Pct.
Std. Error Pct.
Std. Error
Enteric septicemia of catfish (ESC, hole-in-head disease)
50.5 (1.4) 39.5 (1.4) 10.0 (0.8) 68.9 (1.0) 24.7 (0.9) 6.4 (0.5)
Columnaris 49.0 (1.5) 36.5 (1.5) 14.5 (1.1) 58.0 (1.0) 31.3 (1.0) 10.7 (0.7)
Ich 44.3 (4.6) 13.3 (3.0) 42.4 (4.9) 89.4 (1.5) 5.3 (1.1) 5.3 (1.1)
Proliferative gill disease (PGD, hamburger gill disease)
37.9 (3.0) 26.7 (2.7) 35.4 (2.9) 74.3 (1.5) 14.7 (1.1) 11.0 (1.2)
Anemia (white lip, no blood)
32.3 (2.7) 25.9 (2.9) 41.8 (3.1) 54.9 (2.4) 19.0 (1.9) 26.1 (2.2)
Winter kill (Saprolegnia fungus)
40.6 (1.9) 33.1 (1.9) 26.3 (1.8) 69.2 (1.3) 18.3 (1.1) 12.5 (1.0)
Visceral toxicosis of catfish (VTC, twisted gut, botulism)
42.6 (3.6) 24.2 (3.1) 33.2 (3.6) 71.0 (1.7) 9.1 (0.4) 19.9 (1.7)
Trematodes 41.4 (5.8) 40.0 (5.7) 18.6 (4.7) 60.6 (3.2) 12.8 (2.4) 26.6 (2.9)
Predation (birds or other animals)
67.2 (0.7) 27.7 (0.7) 5.1 (0.3)
Low dissolved oxygen
49.4 (1.1) 27.8 (1.0) 22.8 (1.0)
Other 22.6 (6.1) 41.2 (6.1) 36.2 (6.2) 27.4 (1.8) 19.4 (1.4) 53.2 (1.9)

134 / Catfish 2010
Section II: Population Estimates–H. Foodsize-fish Health Issues
From Catfish 2003 to Catfish 2010, the percentages of ponds with severe losses
decreased for ich, PGD, and winter kill and remained the same for ESC, columnaris,
anemia, VTC, and trematodes. In general, the percentages of growout ponds affected by
the listed causes of loss increased between studies in the no loss or light loss categories
and decreased or remained the same in the moderate or severe loss categories. For
example, the percentage of ponds with no loss to ESC increased between studies while
the percentages of ponds with light or moderate loss decreased and the percentage of
ponds with severe loss remained the same. This pattern did not hold, however, for loss
attributed to “other” causes; the percentage of ponds with no loss decreased between
studies while the percentages of ponds with light, moderate, or severe losses increased.
In Catfish 2010, some respondents specified Aeromonas, which has been reported to
cause severe losses in portions of the industry, as a cause of “other” losses.

USDA APHIS VS / 135
Section II: Population Estimates–H. Foodsize-fish Health Issues
d. Percentage of all growout ponds by severity of average loss (in pounds of fish per
operation) per mortality event in the year preceding the study:
Percent Ponds
Average Loss per Event (lb)
None Light
(Less than 200) Moderate
(200–2,000)
Severe (more than
2,000)
Cause of Loss Study Pct.
Std. Error Pct.
Std. Error Pct.
Std. Error Pct.
Std. Error Total
Enteric septicemia of catfish (ESC, hole-in-head disease)
2003 71.2 (2.5) 16.9 (2.9) 9.2 (0.9) 2.7 (0.6) 100.0
2010 85.7 (0.5) 8.3 (0.4) 4.8 (0.5) 1.2 (0.2) 100.0
Columnaris 2003 77.0 (2.2) 7.3 (0.6) 12.7 (2.6) 3.0 (0.6) 100.0
2010 86.1 (0.5) 6.7 (0.3) 3.7 (0.3) 3.5 (0.4) 100.0
Ich 2003 99.7 (0.0) 0.2 (0.0) 0.0 (0.0) 0.1 (0.0) 100.0
2010 99.1 (0.1) 0.9 (0.1) 0.0 (0.0) 0.0 (0.0) 100.0
Proliferative gill disease (PGD, hamburger gill disease)
2003 97.8 (0.3) 0.6 (0.1) 1.0 (0.2) 0.6 (0.1) 100.0
2010 96.8 (0.2) 2.3 (0.1) 0.7 (0.1) 0.2 (0.0) 100.0
Anemia (white lip, no blood)
2003 97.8 (0.2) 0.7 (0.1) 0.8 (0.2) 0.7 (0.1) 100.0
2010 98.2 (0.1) 0.9 (0.1) 0.1 (0.0) 0.8 (0.1) 100.0
Winter kill (Saprolegnia fungus)
2003 89.9 (0.9) 3.8 (0.5) 3.6 (0.5) 2.7 (0.5) 100.0
2010 93.3 (0.2) 5.0 (0.3) 0.8 (0.1) 0.9 (0.1) 100.0
VTC (twisted gut, visceral toxicosis, botulism)
2003 96.2 (0.9) 0.7 (0.1) 2.4 (0.9) 0.7 (0.2) 100.0
2010 98.3 (0.1) 1.0 (0.1) 0.0 (0.0) 0.7 (0.1) 100.0
Trematodes 2003 98.7 (0.3) 0.5 (0.2) 0.7 (0.2) 0.1 (0.0) 100.0
2010 99.1 (0.1) 0.7 (0.1) 0.1 (0.0) 0.1 (0.0) 100.0
Predation (birds or other animals)
2003
2010 57.5 (1.5) 22.7 (0.9) 14.6 (0.8) 5.2 (0.5) 100.0
Low dissolved oxygen
2003
2010 90.5 (0.5) 5.9 (0.5) 2.3 (0.1) 1.3 (0.1) 100.0
Other 2003 99.4 (0.2) 0.4 (0.2) 0.1 (0.0) 0.1 (0.0) 100.0
2010 95.5 (0.4) 1.2 (0.1) 1.6 (0.3) 1.7 (0.1) 100.0
136 / Catfish 2010
Section II: Population Estimates–H. Foodsize-fish Health Issues
2. Fish health problems related to algal toxins
Algal toxins are organic molecules produced by freshwater and marine algae that can
sicken or kill fish or reduce product quality.
The percentage of operations that had fish health problems related to algal toxins
appeared to decrease between the two studies, but the numbers are not directly
comparable. For Catfish 2003, only operations that described themselves as very or
somewhat familiar with algal toxins were asked the question about fish health problems
related to algal toxins during the previous 3 years. For Catfish 2010, all operations were
asked about fish health problems related to algal toxins.
Percentage of operations having fish health problems related to algal toxins* in the
previous 3 years:
Percent Operations
Catfish 2003 Catfish 2010
Percent Std. Error Percent Std. Error
38.4 (1.2) 13.6 (0.4)
*Catfish 2003 asked this question only of operations that were very or somewhat familiar with algal toxins, whereas Catfish 2010 asked the question of all operations.
3. Use of medicated feed
The percentage of operations that fed medicated feed to foodsize fish during the year
preceding the study decreased from Catfish 2003 to Catfish 2010. In contrast, the
percentage of fingerling operations that fed medicated feed to fry did not change
substantially between studies (Section I, table I.9.a).
a. Percentage of operations that fed medicated feed to foodsize fish during the year
preceding the study:
Percent Foodsize-fish Operations
Catfish 2003 Catfish 2010
Percent Std. Error Percent Std. Error
11.0 (0.7) 8.2 (0.3)

USDA APHIS VS / 137
Section II: Population Estimates–H. Foodsize-fish Health Issues
For operations that fed medicated feed to foodsize fish during the year preceding the
study, the percentage that fed Terramycin decreased from 67.5 to 26.0 percent; this result
likely reflects the introduction of Aquaflor, which is the only antimicrobial approved for
treatment of both ESC and columnaris. More than one-third of Catfish 2010 operations
(36.3 percent) that fed medicated feed fed Aquaflor to foodsize fish in 2009. The
percentage of operations feeding Romet to foodsize fish was similar for the two studies.
b. For operations that fed any medicated feed to foodsize fish during the year preceding
the study, percentage of operations by type of medicated feed used:
As for catfish fry (see Section I, table I.9.b), Aquaflor was the primary medicated feed fed
to foodsize catfish in Catfish 2010, with operations feeding an average of 22.3 tons to
foodsize fish in the year preceding the study. The average amount of Romet fed to
foodsize fish increased from 6.0 to 10.8 tons, while the amount of Terramycin fed to
foodsize fish declined from 11.4 to 2.8 tons.
c. For foodsize-fish operations that fed the listed medicated feed to foodsize fish during
the year preceding the study, operation average tons of medicated feed fed:
Operation Average (tons)
Catfish 2003 Catfish 2010
Feed Average Std. Error Average Std. Error
Terramycin 11.4 (0.9) 2.8 (0.1)
Romet 6.0 (0.6) 10.8 (0.5)
Aquaflor 22.3 (2.3)
Percent Operations
Catfish 2003 Catfish 2010
Feed Percent Std. Error Percent Std. Error
Terramycin 67.5 (3.1) 26.0 (1.8)
Romet 45.2 (3.6) 50.2 (2.1)
Aquaflor 36.3 (2.1)

138 / Catfish 2010
Section II: Population Estimates–H. Foodsize-fish Health Issues
4. Diagnostic laboratory testing
The percentage of operations that submitted foodsize-fish samples to a diagnostic
laboratory for any reason during the year preceding the study was similar for Catfish 2003
and Catfish 2010. However, the percentages of operations submitting samples to confirm
a cause of disease or identify an unknown disease declined slightly from Catfish 2003 to
Catfish 2010. The percentages of operations that submitted samples to detect a problem
early or for other reasons were similar for the studies.
a. Percentage of operations that submitted any foodsize-fish samples to a diagnostic
laboratory during the year preceding the study, by reason for submission:
Percent Operations
Catfish 2003 Catfish 2010
Reason Percent Std. Error Percent Std. Error
Detect problem early 15.1 (0.7) 17.0 (0.4)
Confirm cause of disease 25.7 (0.9) 21.6 (0.5)
Identify unknown disease 18.5 (0.8) 16.0 (0.4)
Other 1.5 (0.2) 1.0 (0.1)
Any 33.8 (0.9) 32.1 (0.5)
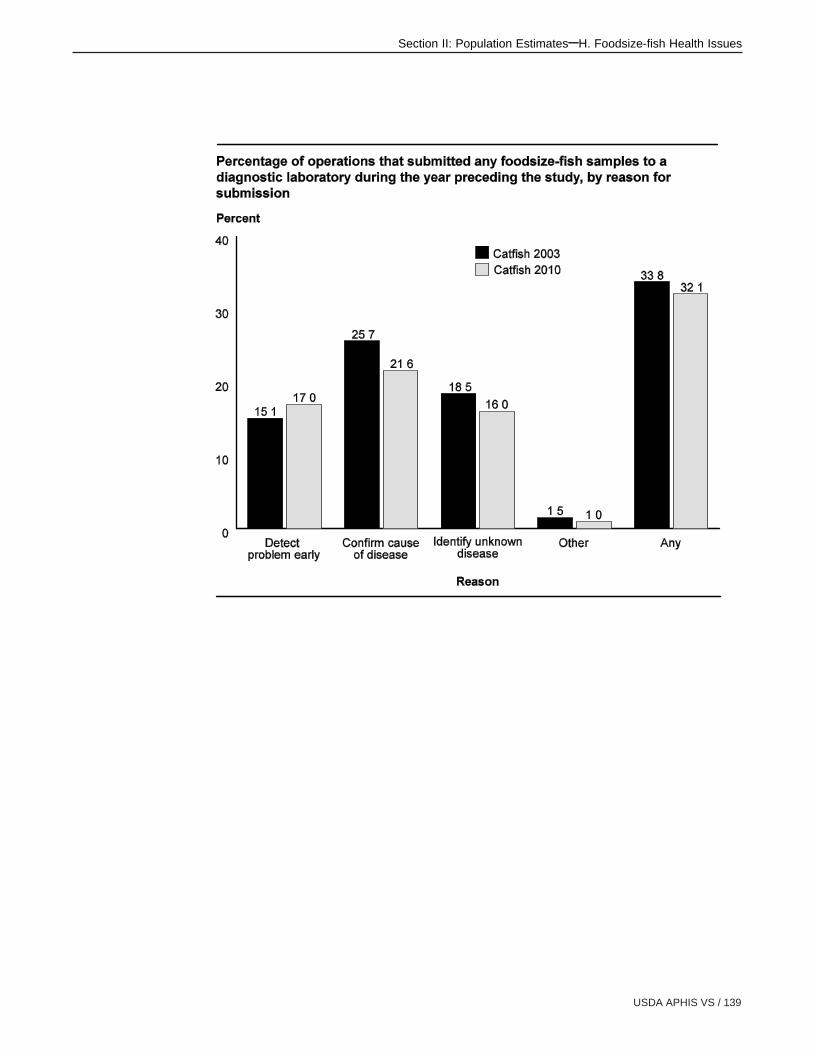
USDA APHIS VS / 139
Section II: Population Estimates–H. Foodsize-fish Health Issues
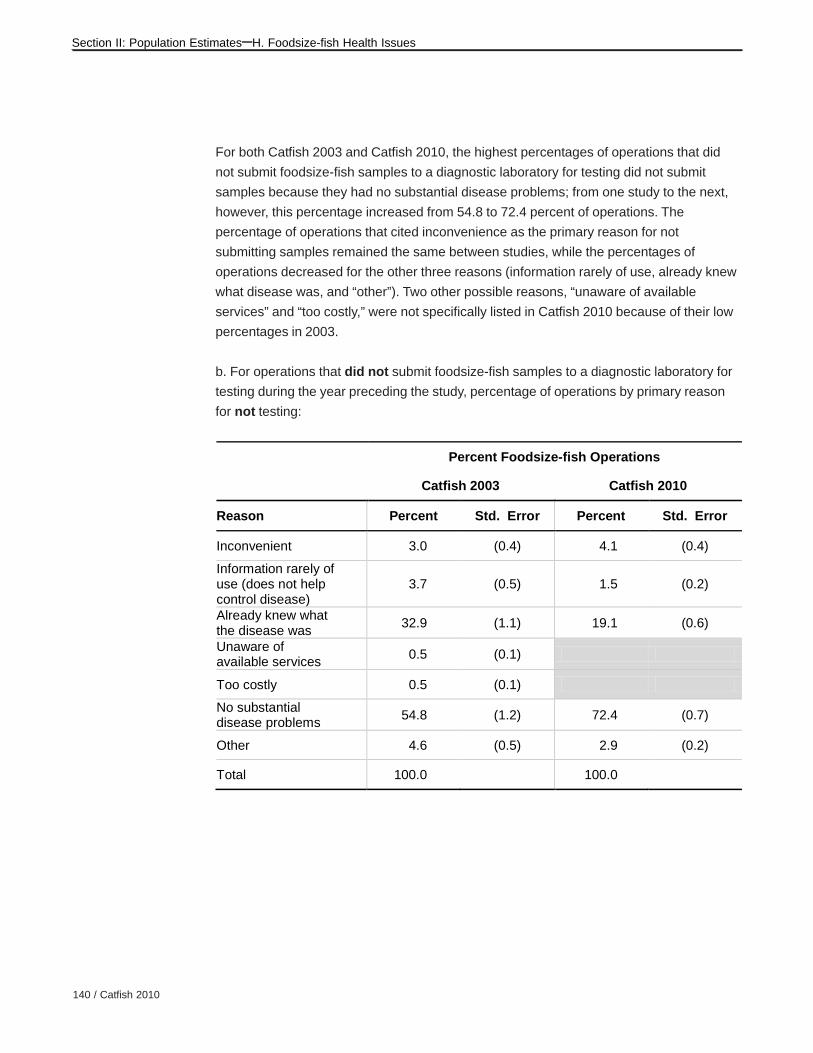
140 / Catfish 2010
Section II: Population Estimates–H. Foodsize-fish Health Issues
For both Catfish 2003 and Catfish 2010, the highest percentages of operations that did
not submit foodsize-fish samples to a diagnostic laboratory for testing did not submit
samples because they had no substantial disease problems; from one study to the next,
however, this percentage increased from 54.8 to 72.4 percent of operations. The
percentage of operations that cited inconvenience as the primary reason for not
submitting samples remained the same between studies, while the percentages of
operations decreased for the other three reasons (information rarely of use, already knew
what disease was, and “other”). Two other possible reasons, “unaware of available
services” and “too costly,” were not specifically listed in Catfish 2010 because of their low
percentages in 2003.
b. For operations that did not submit foodsize-fish samples to a diagnostic laboratory for
testing during the year preceding the study, percentage of operations by primary reason
for not testing:
Percent Foodsize-fish Operations
Catfish 2003 Catfish 2010
Reason Percent Std. Error Percent Std. Error
Inconvenient 3.0 (0.4) 4.1 (0.4)
Information rarely of use (does not help control disease)
3.7 (0.5) 1.5 (0.2)
Already knew what the disease was
32.9 (1.1) 19.1 (0.6)
Unaware of available services
0.5 (0.1)
Too costly 0.5 (0.1)
No substantial disease problems
54.8 (1.2) 72.4 (0.7)
Other 4.6 (0.5) 2.9 (0.2)
Total 100.0 100.0

USDA APHIS VS / 141
Section II: Population Estimates–I. Harvesting Practices
I. HarvestingPractices
1. Pounds of fish harvested
The operation average pounds of catfish harvested per acre was higher for Catfish 2010
than for Catfish 2003.
Operation average pounds of fish harvested per acre:
Operation Average Pounds Fish Harvested (lb/acre)
Catfish 2003 Catfish 2010*
Average Std. Error Average Std. Error
3,698 (187) 4,512 (47)
* Catfish 2003 asked about foodsize fish harvested during 2002. Catfish 2010 asked about channel and channel x blue hybrid foodsize fish harvested during 2009.
2. Ponds harvested
Foodsize fish were harvested from a higher percentage of growout ponds in the year
preceding the study for Catfish 2010 than for Catfish 2003. This increase might reflect a
need on the part of producers to maximize use of resources.
Percentage of growout ponds from which foodsize fish were harvested during the year
preceding the study:
Percent Ponds
Catfish 2003 Catfish 2010
Percent Std. Error Percent Std. Error
76.1 (3.7) 85.8 0.5
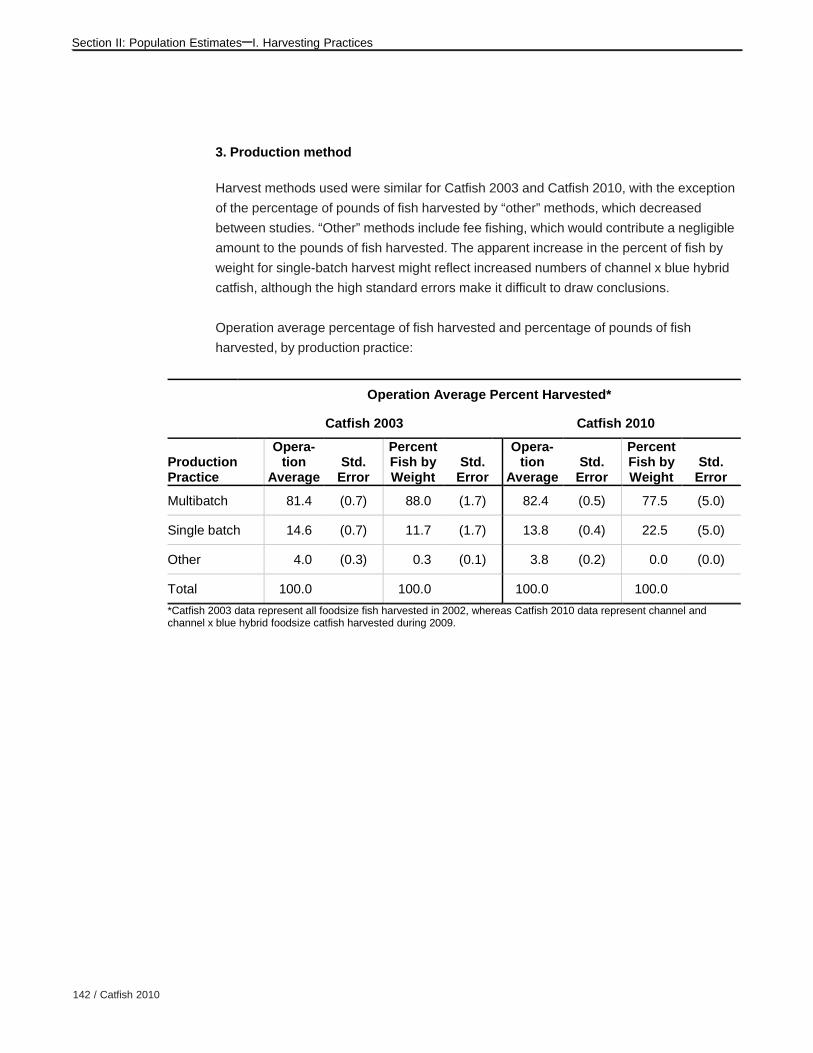
142 / Catfish 2010
Section II: Population Estimates–I. Harvesting Practices
3. Production method
Harvest methods used were similar for Catfish 2003 and Catfish 2010, with the exception
of the percentage of pounds of fish harvested by “other” methods, which decreased
between studies. “Other” methods include fee fishing, which would contribute a negligible
amount to the pounds of fish harvested. The apparent increase in the percent of fish by
weight for single-batch harvest might reflect increased numbers of channel x blue hybrid
catfish, although the high standard errors make it difficult to draw conclusions.
Operation average percentage of fish harvested and percentage of pounds of fish
harvested, by production practice:
Operation Average Percent Harvested*
Catfish 2003 Catfish 2010
Production Practice
Opera-tion
Average Std.
Error
Percent Fish by Weight
Std. Error
Opera-tion
Average Std.
Error
Percent Fish by Weight
Std. Error
Multibatch 81.4 (0.7) 88.0 (1.7) 82.4 (0.5) 77.5 (5.0)
Single batch 14.6 (0.7) 11.7 (1.7) 13.8 (0.4) 22.5 (5.0)
Other 4.0 (0.3) 0.3 (0.1) 3.8 (0.2) 0.0 (0.0)
Total 100.0 100.0 100.0 100.0
*Catfish 2003 data represent all foodsize fish harvested in 2002, whereas Catfish 2010 data represent channel and channel x blue hybrid foodsize catfish harvested during 2009.
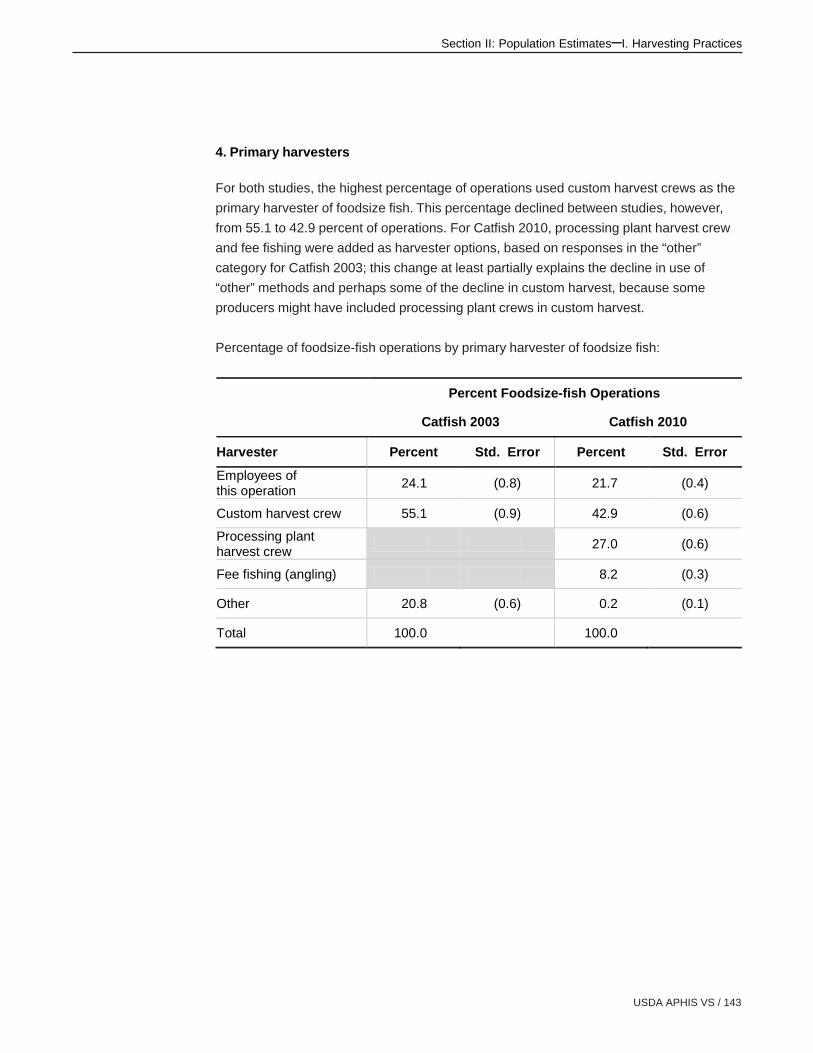
USDA APHIS VS / 143
Section II: Population Estimates–I. Harvesting Practices
4. Primary harvesters
For both studies, the highest percentage of operations used custom harvest crews as the
primary harvester of foodsize fish. This percentage declined between studies, however,
from 55.1 to 42.9 percent of operations. For Catfish 2010, processing plant harvest crew
and fee fishing were added as harvester options, based on responses in the “other”
category for Catfish 2003; this change at least partially explains the decline in use of
“other” methods and perhaps some of the decline in custom harvest, because some
producers might have included processing plant crews in custom harvest.
Percentage of foodsize-fish operations by primary harvester of foodsize fish:
Percent Foodsize-fish Operations
Catfish 2003 Catfish 2010
Harvester Percent Std. Error Percent Std. Error
Employees of this operation
24.1 (0.8) 21.7 (0.4)
Custom harvest crew 55.1 (0.9) 42.9 (0.6)
Processing plant harvest crew
27.0 (0.6)
Fee fishing (angling) 8.2 (0.3)
Other 20.8 (0.6) 0.2 (0.1)
Total 100.0 100.0
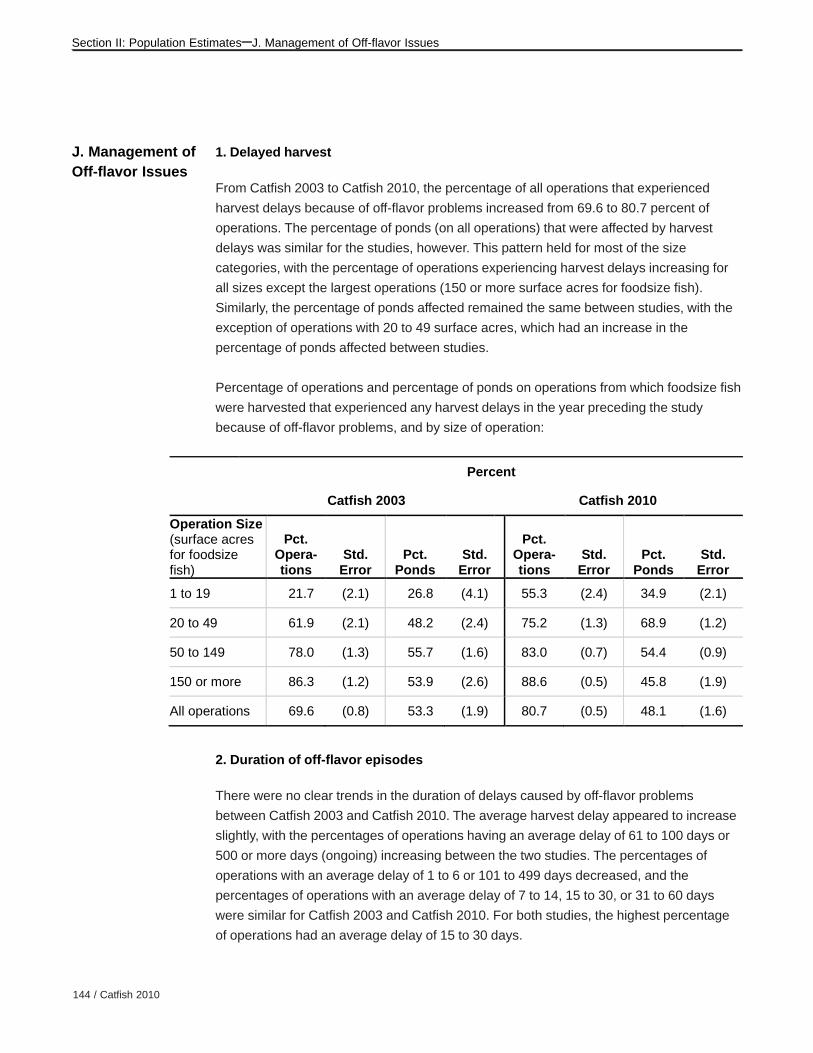
144 / Catfish 2010
Section II: Population Estimates–J. Management of Off-flavor Issues
J. Management ofOff-flavor Issues
1. Delayed harvest
From Catfish 2003 to Catfish 2010, the percentage of all operations that experienced
harvest delays because of off-flavor problems increased from 69.6 to 80.7 percent of
operations. The percentage of ponds (on all operations) that were affected by harvest
delays was similar for the studies, however. This pattern held for most of the size
categories, with the percentage of operations experiencing harvest delays increasing for
all sizes except the largest operations (150 or more surface acres for foodsize fish).
Similarly, the percentage of ponds affected remained the same between studies, with the
exception of operations with 20 to 49 surface acres, which had an increase in the
percentage of ponds affected between studies.
Percentage of operations and percentage of ponds on operations from which foodsize fish
were harvested that experienced any harvest delays in the year preceding the study
because of off-flavor problems, and by size of operation:
Percent
Catfish 2003 Catfish 2010
Operation Size (surface acres for foodsize fish)
Pct. Opera-tions
Std. Error
Pct. Ponds
Std. Error
Pct. Opera-tions
Std. Error
Pct. Ponds
Std. Error
1 to 19 21.7 (2.1) 26.8 (4.1) 55.3 (2.4) 34.9 (2.1)
20 to 49 61.9 (2.1) 48.2 (2.4) 75.2 (1.3) 68.9 (1.2)
50 to 149 78.0 (1.3) 55.7 (1.6) 83.0 (0.7) 54.4 (0.9)
150 or more 86.3 (1.2) 53.9 (2.6) 88.6 (0.5) 45.8 (1.9)
All operations 69.6 (0.8) 53.3 (1.9) 80.7 (0.5) 48.1 (1.6)
2. Duration of off-flavor episodes
There were no clear trends in the duration of delays caused by off-flavor problems
between Catfish 2003 and Catfish 2010. The average harvest delay appeared to increase
slightly, with the percentages of operations having an average delay of 61 to 100 days or
500 or more days (ongoing) increasing between the two studies. The percentages of
operations with an average delay of 1 to 6 or 101 to 499 days decreased, and the
percentages of operations with an average delay of 7 to 14, 15 to 30, or 31 to 60 days
were similar for Catfish 2003 and Catfish 2010. For both studies, the highest percentage
of operations had an average delay of 15 to 30 days.
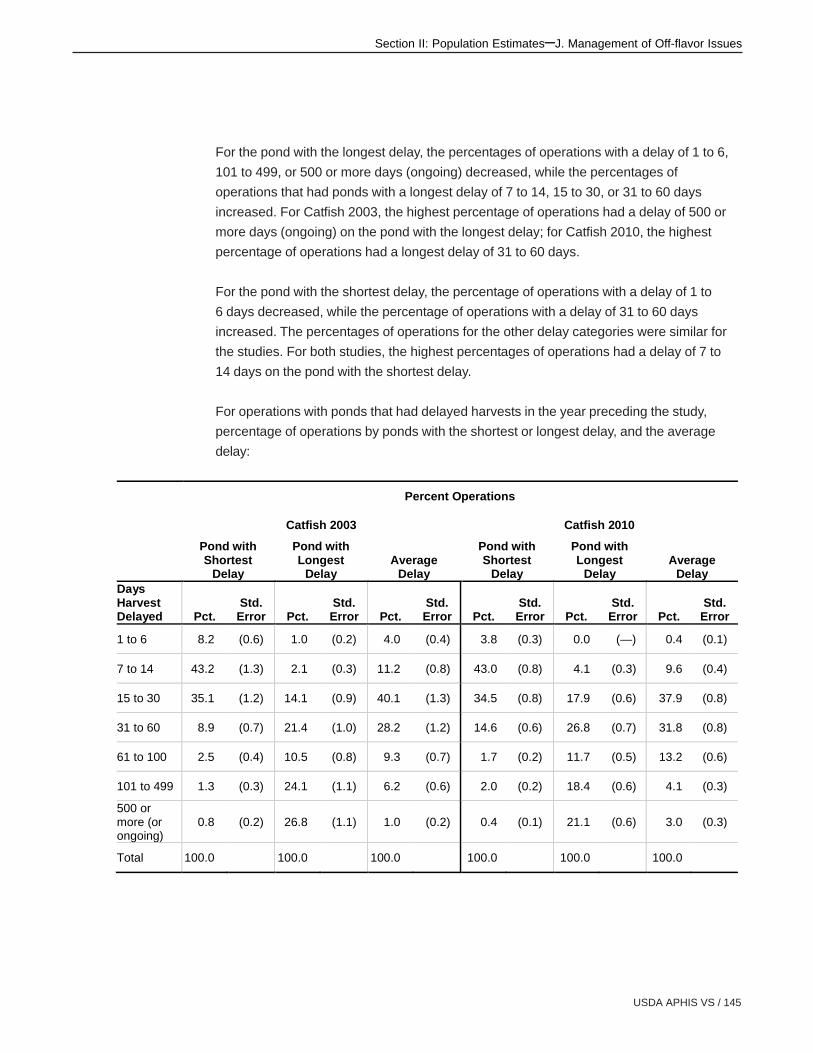
USDA APHIS VS / 145
Section II: Population Estimates–J. Management of Off-flavor Issues
For the pond with the longest delay, the percentages of operations with a delay of 1 to 6,
101 to 499, or 500 or more days (ongoing) decreased, while the percentages of
operations that had ponds with a longest delay of 7 to 14, 15 to 30, or 31 to 60 days
increased. For Catfish 2003, the highest percentage of operations had a delay of 500 or
more days (ongoing) on the pond with the longest delay; for Catfish 2010, the highest
percentage of operations had a longest delay of 31 to 60 days.
For the pond with the shortest delay, the percentage of operations with a delay of 1 to
6 days decreased, while the percentage of operations with a delay of 31 to 60 days
increased. The percentages of operations for the other delay categories were similar for
the studies. For both studies, the highest percentages of operations had a delay of 7 to
14 days on the pond with the shortest delay.
For operations with ponds that had delayed harvests in the year preceding the study,
percentage of operations by ponds with the shortest or longest delay, and the average
delay:
Percent Operations
Catfish 2003 Catfish 2010
Pond with Shortest
Delay
Pond with Longest
Delay Average
Delay
Pond with Shortest
Delay
Pond with Longest
Delay Average
Delay Days Harvest Delayed Pct.
Std. Error Pct.
Std. Error Pct.
Std. Error Pct.
Std. Error Pct.
Std. Error Pct.
Std. Error
1 to 6 8.2 (0.6) 1.0 (0.2) 4.0 (0.4) 3.8 (0.3) 0.0 (—) 0.4 (0.1)
7 to 14 43.2 (1.3) 2.1 (0.3) 11.2 (0.8) 43.0 (0.8) 4.1 (0.3) 9.6 (0.4)
15 to 30 35.1 (1.2) 14.1 (0.9) 40.1 (1.3) 34.5 (0.8) 17.9 (0.6) 37.9 (0.8)
31 to 60 8.9 (0.7) 21.4 (1.0) 28.2 (1.2) 14.6 (0.6) 26.8 (0.7) 31.8 (0.8)
61 to 100 2.5 (0.4) 10.5 (0.8) 9.3 (0.7) 1.7 (0.2) 11.7 (0.5) 13.2 (0.6)
101 to 499 1.3 (0.3) 24.1 (1.1) 6.2 (0.6) 2.0 (0.2) 18.4 (0.6) 4.1 (0.3)
500 or more (or ongoing)
0.8 (0.2) 26.8 (1.1) 1.0 (0.2) 0.4 (0.1) 21.1 (0.6) 3.0 (0.3)
Total 100.0 100.0 100.0 100.0 100.0 100.0

146 / Catfish 2010
Section II: Population Estimates–J. Management of Off-flavor Issues
3. Treatment of harvest-delayed ponds
Because off-flavor problems in catfish often are caused by metabolites from algae,
treatments are commonly related to algae control, such as chemical treatments using
Diuron and copper sulfate.
For Catfish 2003 and Catfish 2010, the highest percentage of ponds with delayed harvest
received both Diuron and copper sulfate treatment. The percentage of ponds treated with
copper sulfate only declined between the studies, while the percentages of ponds that
received the other chemical treatments or no treatment were similar for the two studies.
For ponds with delayed harvests because of off-flavor problems, percentage of ponds that
were treated with the following chemicals:
Percent Ponds
Catfish 2003 Catfish 2010
Chemical Percent Std. Error Percent Std. Error
Diuron only 27.2 (2.3) 23.7 (2.1)
Copper sulfate only 12.1 (1.3) 6.7 (0.3)
Both Diuron and copper sulfate
32.6 (2.9) 36.5 (1.5)
No treatment 28.1 (1.7) 33.1 (1.5)
Total 100.0 100.0

USDA APHIS VS / 147
Section II: Population Estimates–K. General
K. General 1. Record-keeping practices
Records are a very important tool in production management. Producers with thorough
records can measure the differences associated with management or other changes and
maximize the operation’s profitability.
Although the percentage of operations that kept any records was similar for Catfish 2003
and Catfish 2010, the percentages of operations that kept records on stocking, feeding,
and “other” topics decreased slightly between studies. The percentage of operations that
kept records related to disease increased. In both studies, the highest percentages of
operations kept records on harvesting, feeding, or stocking
Percentage of operations that kept the following types of written or computerized records:
Percent Operations
Catfish 2003 Catfish 2010
Record Type Percent Std. Error Percent Std. Error
Stocking 78.5 (0.8) 73.1 (0.7)
Harvesting 80.9 (0.8) 81.1 (0.6)
Disease 26.5 (0.9) 30.1 (0.7)
Feeding 79.0 (0.8) 75.0 (0.6)
Water quality 48.4 (1.0) 48.5 (0.8)
Breeding 10.2 (0.6) 12.1 (0.5)
Other 5.5 (0.4) 1.7 (0.2)
Any 86.6 (0.7) 84.9 (0.5)
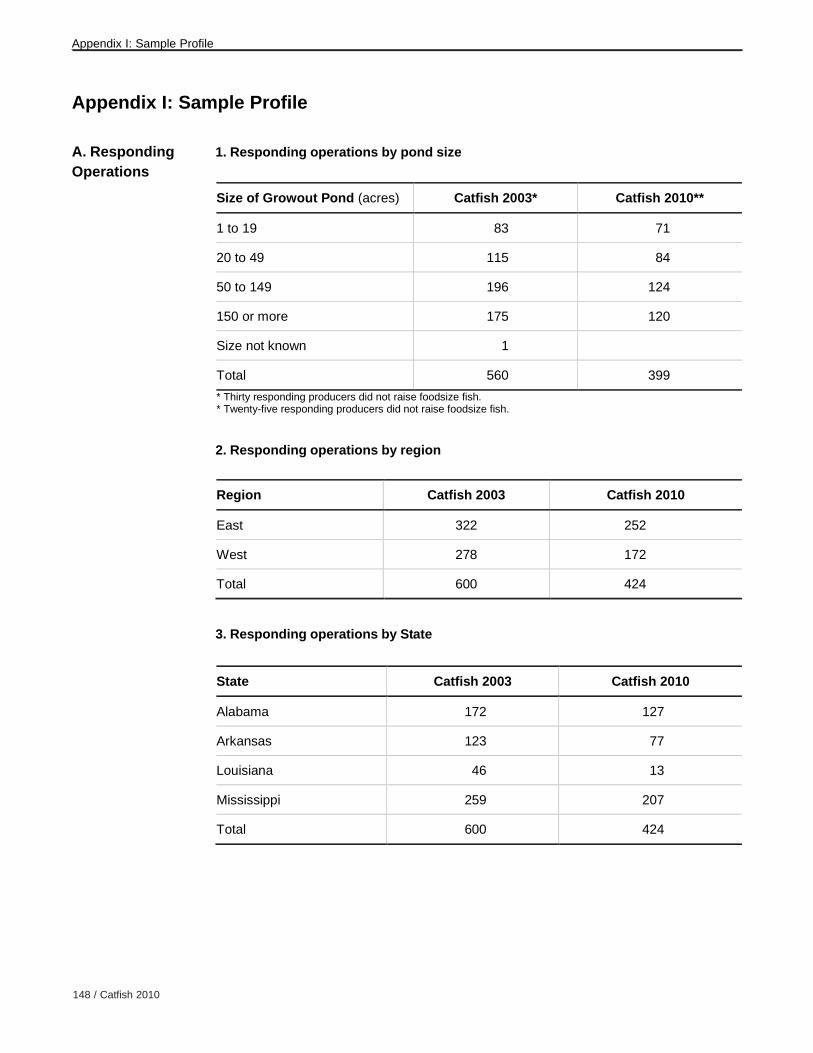
148 / Catfish 2010
Appendix I: Sample Profile
A. RespondingOperations
1. Responding operations by pond size
Size of Growout Pond (acres) Catfish 2003* Catfish 2010**
1 to 19 83 71
20 to 49 115 84
50 to 149 196 124
150 or more 175 120
Size not known 1
Total 560 399
* Thirty responding producers did not raise foodsize fish. * Twenty-five responding producers did not raise foodsize fish. 2. Responding operations by region
Region Catfish 2003 Catfish 2010
East 322 252
West 278 172
Total 600 424
3. Responding operations by State
State Catfish 2003 Catfish 2010
Alabama 172 127
Arkansas 123 77
Louisiana 46 13
Mississippi 259 207
Total 600 424
Appendix I: Sample Profile
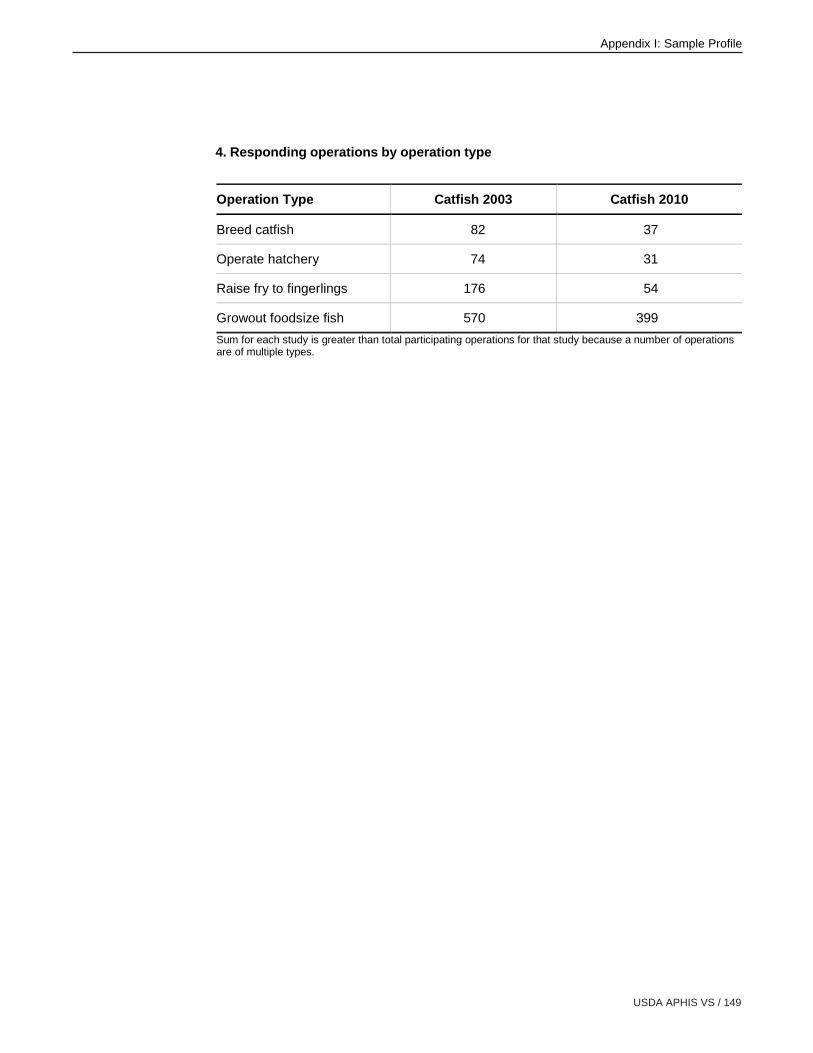
USDA APHIS VS / 149
Appendix I: Sample Profile
4. Responding operations by operation type
Operation Type Catfish 2003 Catfish 2010
Breed catfish 82 37
Operate hatchery 74 31
Raise fry to fingerlings 176 54
Growout foodsize fish 570 399
Sum for each study is greater than total participating operations for that study because a number of operations are of multiple types.

150 / Catfish 2010
Appendix II: U.S. Catfish Acreage Inventory and Operations
A. RegionalSummary for 2003
Source: NASS Catfish Production report, February 5, 2004.
Number Surface Acres Intended for
Use January 1–June 30, 2003
State
Foodsize Fingerlings Broodfish
2002 Total Sales
(x$1,000)
January 1, 2003,
Number of Operations
Alabama* 22,900 1,500 630 76,045 231
Arkansas* 28,500 4,200 650 56,380 155
California 1,810 360 90 7,875 38
Florida 590 45 15 756 34
Georgia 700 115 60 1,411 43
Illinois 65 45 10 226 12
Kentucky 460 95 15 1,180 60
Louisiana* 8,600 1,050 170 15,812 57
Mississippi* 86,000 16,800 3,000 243,226 405
Missouri 690 590 55 1,070 31
North Carolina 1,480 140 60 3,143 46
South Carolina 70 25 20 617 13
Texas 570 105 55 3,672 36
Total for Study States* (Percent of U.S.)
146,000 (95.8%)
23,550 (93.9%)
4,450 (92.1%)
391,463 (95.2%)
848 (73.0%)
Total U.S. (13 States) 152,435 25,070 4,830 411,413 1,161 * Study States (Alabama, Arkansas, Louisiana, and Mississippi).
Appendix II: U.S. Catfish Acreage Inventory and Operations

USDA APHIS VS / 151
Appendix II: U.S. Catfish Acreage Inventory and Operations
B. RegionalSummary for 2010
Source: NASS Catfish Production report, January 28, 2011.
State
Number Surface Acres Intended for Use
January 1–June 30, 2010
Water Surface Acres Used/Intended for
Production Jan 1–Jun 30 2009 Total
Sales (x$1,000)
January 1, 2008,
Number of Operations4 Foodsize Fingerlings Broodfish 2009 2010
Alabama1 19,200 380 120 22,100 19,800 90,688 252
Arkansas1 16,600 2,200 250 25,000 19,200 44,914 155
California 1,4005 190 80 2,400 1,8005 8,074 55
Louisiana1 1,700 50 0 6,300 1,800 8,395 31
Mississippi1 52,000 9,700 1,300 80,200 64,000 196,787 427
North Carolina
1,600 200 50 2,200 1,900 5,495 53
Texas 2,600 190 70 3,800 2,900 12,644 149
Other States2
1,900 1,300 370 4,900 3,700 5,570 495
Total for study states1
(Percent of U.S.)
89,500 (92.3%)5
12,330 (86.8%)
1,670 (74.6%)3
133,600 (90.9%)
104,800 (91.1%)5
340,784 (91.5%)
865 (53.5%)
Total U.S. 97,0005 14,210 2,240 146,900 115,1005 372,567 1,617 1 Study States (Alabama, Arkansas, Louisiana, and Mississippi). 2 States whose estimates are not shown and States suppressed because of disclosure concerns. 3 Excluding Louisiana. 4 Source: NASS Catfish Production report, January 30, 2009 (most recent State-level publication for number of operations). 5 Numbers updated from those presented in Catfish 2010 Parts I and II, which were obtained from NASS Catfish Production
report, January 29, 2010. January 1, 2009, U.S. operations equaled 1,306; January 1, 2010, U.S. operations equaled 994.

152 / Catfish 2010
Appendix II: U.S. Catfish Acreage Inventory and Operations
C. Number ofOperations andWater SurfaceAcres used forProduction,2003–11
Year
Water Surface Acres Used for Production
Jan 1–Jun 30 Total Sales (x$1,000)
Number of Operations
(on January 1)
2003 187,200 409,918 1,161
2004 183,190 463,413 1,149
2005 175,940 482,295 1,124
2006 170,370 484,005 1,035
2007 163,676 454,593 1,240
2008 163,100 409,998 1,617
2009 146,900 372,567 1,306
2010 115,100 402,584 994
2011 99,600 Not available 909
Source: NASS Catfish Production reports.
D. Number ofWater SurfaceAcres used forProduction byOperations in theFour Study States,2003 and 2010
State
Number of Operations (on January 1)
Water Surface Acres Used for Production
Jan 1–Jun 30
2003 2010* 2003 2010
Alabama 231 NA 25,500 19,800
Arkansas 155 NA 34,000 19,200
Louisiana 57 NA 9,900 1,800
Mississippi 405 NA 109,000 64,000
* In 2009, NASS began publishing State-level number of operations only every five years, in conjunction with the Census of Agriculture. Source: NASS Catfish Production reports.