united states air force working capital fund and business processes are continuously ... management...
TRANSCRIPT
UNITED STATES AIR FORCE
WORKING CAPITAL FUND (Appropriation: 4930)
Fiscal Year (FY) 2013
Budget Estimates February 2012

THIS PAGE INTENTIONALLY LEFT BLANK

AIR FORCE WORKING CAPITAL FUNDFISCAL YEAR (FY) 2013 BUDGET ESTIMATESTABLE OF CONTENTS
AFWCF SUMMARY.......................................................................................................................................................................1OPERATING BUDGET................................................................................................................................................................11
CONSOLIDATED SUSTAINMENT ACTIVITY GROUP.........................................................................................................13SUPPLY MANAGEMENT ACTIVITY GROUP - RETAIL.......................................................................................................45TRANSPORTATION WORKING CAPITAL FUND ...............................................................................................................67
CAPITAL BUDGET.....................................................................................................................................................................91
THIS PAGE INTENTIONALLY LEFT BLANK
AFWCF SUMMARY

AIR FORCE WORKING CAPITAL FUND
SUMMARY
AFWCF SUMMARY
1
THIS PAGE INTENTIONALLY LEFT BLANK
AFWCF SUMMARY
2
AFWCF Overview - FY 2013 Budget Estimates
Air Force Working Capital Fund Fiscal Year (FY) 2013 Budget Estimates
The FY 2013 Air Force Working Capital Funds (AFWCF) Budget Estimates reflect current execution plans and Air Force initiatives to improve the efficiency and effectiveness of our activities while continuing to meet the needs of the war fighting forces. Successful WCF operations are essential to the Air Force mission. In order to continue as a world class operation, logistics and business processes are continuously improved to ensure war fighters receive the right item at the right place, right time and lowest cost. Activity Group Overview The AFWCF conducts business in two primary areas: the Consolidated Sustainment Activity Group (CSAG) and the Supply Management Activity Group-Retail (SMAG-R). The Transportation Working Capital Fund (TWCF), for which the Air Force assumed responsibility of cash oversight in FY 1998, is part of this submission. However, United States Transportation Command (USTRANSCOM), rather than the Air Force, has the day-to-day management responsibility for TWCF operations. Air Force Core Strategic Capabilities In support of Air Force core functions, the AFWCF activities provide maintenance services, weapon system parts, base and medical supplies, and transportation services. The working capital funds are integral to readiness and sustainability of our air and space assets and our ability to deploy forces around the globe and across any theater in support of Overseas Contingency Operations and National Military Strategy requirements. Maintenance depots provide the equipment, skills and repair services necessary to keep forces operating worldwide. Supply management activities procure and manage inventories of consumable and reparable spare parts required to keep all elements of the force structure mission ready. USTRANSCOM provides the worldwide mobility element of the global engagement vision. Directly or indirectly, working capital fund activities provide warfighters the key services needed to meet mission capability requirements.
AFWCF SUMMARY
3
AFWCF Overview - FY 2013 Budget Estimates
Consolidated Sustainment Activity Group
The mission of the Consolidated Sustainment Activity Group (CSAG) is supply management of reparable and consumable items, as well as maintenance services. The activity operates with two divisions: Maintenance and Supply.
The CSAG Supply Division is primarily responsible for Air Force-managed, depot-level reparable spares and consumable spares unique to Air Force. The Supply Division provides a wide range of logistics support services including requirements forecasting, item introduction, cataloging, provisioning, procurement, repair, technical support, data management, item disposal, distribution management and transportation. The CSAG Supply Division is committed to implementing improvements that meet customer demands and decrease cost by examining new ways of doing business and leveraging new technologies to support war fighter needs. The Supply Division is working to reduce the impact of Diminishing Manufacturing Sources and Material Shortages (DMSMS) and other obsolescence issues associated with aircraft fleets of 24 years average age. Due to fleet age, the number of parts with no qualified manufacturing or repair source is expected to increase over the next decade. Additionally, suppliers are increasingly unwilling or unable to produce and/or repair aging spare parts. To address these DMSMS and other obsolescence issues, the CSAG Supply Division re-engineers parts which can no longer be produced or repaired. The Supply Division also proactively identifies parts for which availability is at risk due to DMSMS issues and takes appropriate action to minimize adverse impact to weapon system readiness or total ownership cost. The CSAG Maintenance Division repairs systems and spare parts to ensure readiness in peacetime and to provide sustainment for current Overseas Contingency Operations (OCO). This division operates on funds received from customers through sales of services. In peacetime, the Air Force enhances readiness by efficiently and economically repairing, overhauling and modifying aircraft, engines, missiles, components and software to meet customer demands. The Maintenance Division’s depots have unique skills and equipment required to support and overhaul both new, complex components as well as aging weapon systems. During wartime or contingencies, the depots can surge repair operations and realign capacity to support the war fighter’s immediate needs. Additionally, initiatives are underway to ensure the depots are poised to fulfill war fighter mission needs with the best product at the best price. These initiatives include benchmarking programs to identify industry leaders in various production processes and the institutionalizing of lean principles within the workforce. Contract depot maintenance transitioned from the working capital fund at the end of FY 2008 when the activity ceased accepting new orders. All accounting records closed out as of 31 July FY 2011. This change brings the user and provider of contract depot maintenance services closer together and removes the WCF from its role as the “middleman.”
AFWCF SUMMARY
4
AFWCF Overview - FY 2013 Budget Estimates
Supply Management Activity Group–Retail
The Supply Management Activity Group-Retail (SMAG-R) manages over 1.1 million inventory items including weapon system spare parts, medical-dental supplies and equipment, and other supply items used in non-weapon system applications. The Air Force SMAG-R is a critical component in the support of combat readiness by procuring materiel and selling spares to authorized retail customers. The activity operates with three divisions: General Support, Medical Dental, and Academy. The Medical Dental Division inventory includes a War Reserve Materiel (WRM) Stockpile. WRM provides initial war fighting capability until re-supply lines can sustain wartime demands for medical and dental supplies and equipment.
Transportation Working Capital Funds
USTRANSCOM's mission is to provide air, land, and sea transportation for the Department of Defense (DOD) in time of peace and war, with a primary focus on wartime readiness. The $13.0 billion TWCF budget provides synchronized transportation and sustainment, making it possible to project and maintain national power where needed, with the greatest speed and agility, the highest efficiency, and the most reliable level of trust and accuracy. The USTRANSCOM accomplishes its joint mission through three Component Commands: Air Mobility Command (AMC), Military Sealift Command (MSC), and Military Surface Deployment and Distribution Command (SDDC). This joint team of transportation components provides mobility forces and assets for a seamless transition from peace to war. USTRANSCOM is always ready to meet the strategic mobility needs of our nation. A brief description of the role of each component follows: -Air Mobility Command provides airlift and aeromedical evacuation for U.S. forces. -Military Sealift Command supports the nation by delivering common-user supplies and equipment across the world's oceans. -Surface Deployment and Distribution Command provides global surface deployment and distribution services to meet the nation's objectives. USTRANSCOM components provide the critical link to the Services' core competencies in organizing, training, and equipping forces. They provide lines of communication to the Services, ensuring assets are available when needed for the transition from peace to war. The surge from peacetime sustainment to a massive deployment of people and material in support of Overseas Contingency Operations is the most recent example of USTRANSCOM’s ability to execute its mission. Their successes result from the synergy of military and commercial lift (air, land, and sea), air refueling, port operations, and afloat prepositioning-all requiring the team efforts of the Commander's Staff and their components.
AFWCF SUMMARY
5
AFWCF Overview - FY 2013 Budget Estimates
Air Force Initiatives
As part of on-going Air Force efficiency initiatives, the AFWCF will incrementally achieve savings in Depot Maintenance and Supply Chain management activities. Supply Chain efficiency initiatives include optimizing on-hand AF inventory to reduce buy and repair costs, improving asset visibility to reduce requisition redundancies, and expediting asset movement through the distribution pipeline. Depot Maintenance will target consumption reductions associated with improvements of aircraft flow days and repair services.
The Air Force campaign called eLog21 or Expeditionary Logistics for the 21st Century is designed to bring logistics operations into the 21st Century by modernizing processes and systems with new expeditionary, network-centric, enterprise wide processes and systems. As processes continue to be improved, the war fighter will receive the right support at the right place and the right time. eLog21 is referred to as an umbrella effort made of strategic initiatives that focus on improving processes and information technology so that the Air Force can achieve the goals of increased equipment availability and reduced Operations and Support costs. With those goals in mind, the Air Force is implementing initiatives that capitalize on industry best practices used in the areas of repair processes, inventory management and cost control. Several initiatives included under the umbrella of eLog21 are detailed in the CSAG Overview section of this budget submission.
Initiatives beyond eLog21 continue to impact AFWCF activities. The Air Force formally builds functional and financial performance plans to assess business operations at Air Force Materiel Command and Air Logistics Centers. Bi-monthly reviews with the Deputy Chief of Staff for Logistics, Installations and Mission Support continue, focusing attention on cost performance and the delivery of quality parts and maintenance on time. Additionally, the Air Force continues to make improvements in our financial and reporting structures through close cooperation with the Office of the Secretary of Defense and the Defense Finance and Accounting Service. Financial reporting improvements allow us to work closely with customers by having consistent and timely data, resulting in the ability to identify discrepancies between the accounting system and the logistics feeder systems from which data is supplied.
AFWCF SUMMARY
6
AFWCF Overview - FY 2013 Budget Estimates
Direct Appropriations
In FY 2011, AFWCF requested a total of $83.9 million in direct appropriations. Air Force received $66.9 million for Medical Dental War Reserve Material (WRM) requirements; USTRANSCOM received Overseas Contingency Operations (OCO) funding for transportation of Fallen Heroes, $15.0 million, and for container deconsolidation, $2.0 million.
In FY 2012, AFWCF received a total of $77.4M in direct appropriations. Air Force received $65.4 million for Medical Dental WRM requirements; and USTRANSCOM received OCO funding for transportation of Fallen Heroes, $10.0 million, and for container deconsolidation, $2.0 million.
In FY 2013, AFWCF requests a total of $285.9 million in direct appropriations. Air Force requests $45.5 for Medical Dental WRM; and USTRANSCOM requests OCO funding for Transportation of Fallen Heroes, $10.0M, and C-17 Engine Maintenance, $230.4 million.
Cash Management
In FY 2011, the AFWCF cash balance increased minimally, $81.6 million, to $1,026.2 million. The ending balance is 8 days of cash based on disbursements, 6 months of capital outlays, and an allowance for unliquidated WRM direct appropriations. In FY 2012, AFWCF cash is projected to remain stable for an ending balance of $1,070.4 million, 9 days of cash. In FY 2013, AFWCF cash decreases $819.8 million to $250.6 million, 2 days of cash. The balance decreases primarily due to Air Force setting rates to achieve zero Accumulated Operating Balance (decreasing cash $588.7 million) and TWCF projecting operating losses ($231.1M). The Air Force will take appropriate action to ensure cash levels remain adequate for operational and capital program disbursements.
AFWCF SUMMARY
7
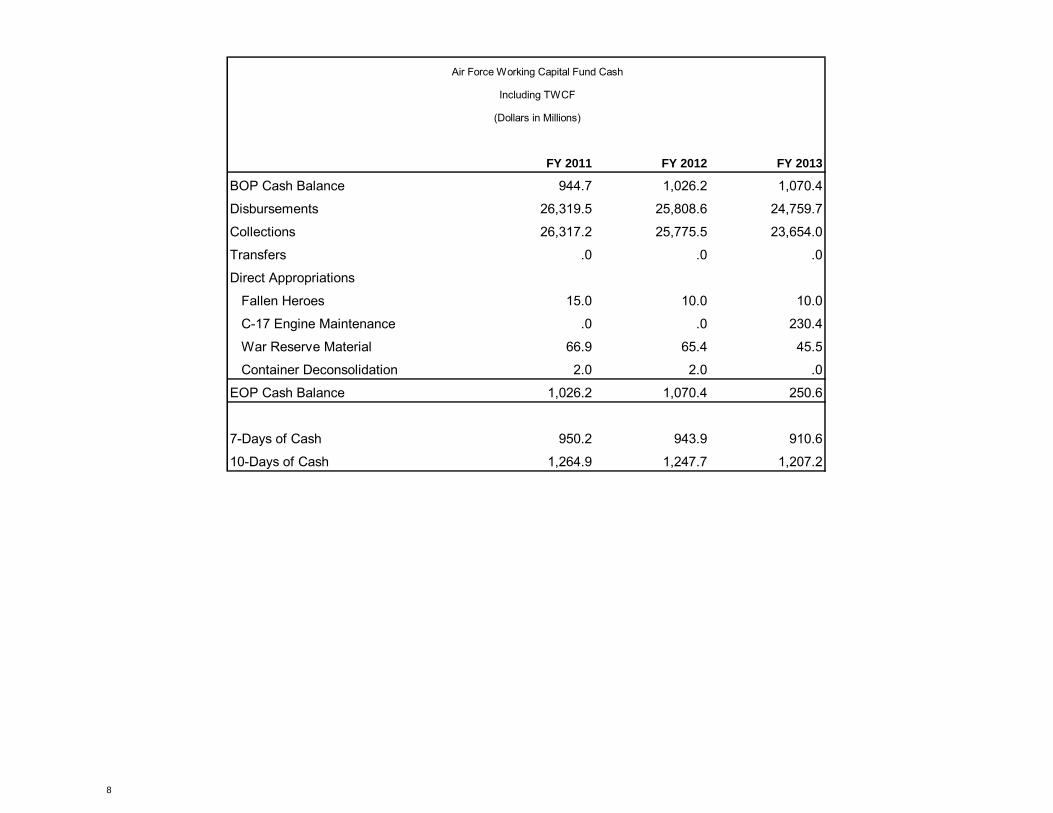
Air Force Working Capital Fund Cash
Including TWCF
(Dollars in Millions)
FY 2011 FY 2012 FY 2013
BOP Cash Balance 944.7 1,026.2 1,070.4
Disbursements 26,319.5 25,808.6 24,759.7
Collections 26,317.2 25,775.5 23,654.0
Transfers .0 .0 .0
Direct Appropriations
Fallen Heroes 15.0 10.0 10.0
C-17 Engine Maintenance .0 .0 230.4
War Reserve Material 66.9 65.4 45.5
Container Deconsolidation 2.0 2.0 .0
EOP Cash Balance 1,026.2 1,070.4 250.6
7-Days of Cash 950.2 943.9 910.6
10-Days of Cash 1,264.9 1,247.7 1,207.2
AFWCF SUMMARY
8

Current Version Air Force Working Capital Fund AFWCF Summary FY11 PB
Total Fund Summary(Dollars in Millions)
FY 2011 FY 2012 FY 2013
Total Revenue Total Revenue 26,098.9 26,924.1 24,983.5
Cost of Goods Sold Cost of Goods Sold 26,067.5 26,984.4 25,880.5
War Reserve Material WRM (53.8) (78.2) (45.5)
Net Operating Result (NOR) Net Operating Result (NOR) (22.4) (138.5) (942.4)
Accumulated Operating Result (AOR)1 Accumulated Operating Result (AOR)1398.0 131.5 .0
Civilian End Strength Civilian End Strength 32,339 32,360 30,254
Military End Strength Military End Strength 12,831 14,281 14,275
Civilian Workyears Civilian Workyears 30,011 32,355 31,271
Military Workyears Military Workyears 12,562 12,732 12,708
Capital Budget Capital Budget 291.0 329.1 378.0
Direct Appropriation2 Direct Appropriation 83.9 77.4 285.9
1 - Includes Non-Recoverable AOR Adjustments2 - Includes WRM, Container Deconsolidation, Transportation of Fallen Heroes, and C-17 Engine Maintenance
AFWCF Summary
AFWCF SUMMARY
9

THIS PAGE INTENTIONALLY LEFT BLANK
AFWCF SUMMARY
10

AIR FORCE WORKING CAPITAL FUND
OPERATING BUDGET
OPERATING BUDGET
11

THIS PAGE INTENTIONALLY LEFT BLANK
OPERATING BUDGET
12
AIR FORCE WORKING CAPITAL FUND
CONSOLIDATED SUSTAINMENT
ACTIVITY GROUP
CONSOLIDATED SUSTAINMENT ACTIVITY GROUP
13

THIS PAGE INTENTIONALLY LEFT BLANK
CONSOLIDATED SUSTAINMENT ACTIVITY GROUP
14
CSAG Overview – FY 2013 Budget Estimates
Consolidated Sustainment Activity Group Fiscal Year (FY) 2013 Budget Estimates
The Consolidated Sustainment Activity Group (CSAG) is an innovative approach to business in the U.S. Air Force Working Capital Fund (AFWCF). The CSAG reflects the combination of the Depot Maintenance Activity Group (DMAG) and the Material Support Division (MSD) from the Supply Management Activity Group into a single enterprise in FY 2009. This consolidation eliminated internal financial transactions between MSD and DMAG and is structured to improve customer support by efficiently working as one entity. Under CSAG, business operations formerly known as DMAG are characterized as the Maintenance Division. Likewise, business operations formerly known as MSD are designated the Supply Division. The mission of CSAG is supply management of reparable and consumable items as well as maintenance services. Reparable supply items are economically maintained through overhaul or repair. Consumable supply items are consumed in use or discarded when worn out or broken because they cannot be repaired economically. Maintenance Division Description
The Maintenance Division repairs systems and spare parts to ensure readiness in peacetime and to provide sustainment for current Overseas Contingency Operations (OCO). The division operates on funds received from its customers through sales of its services. In peacetime, the Air Force enhances readiness by efficiently and economically repairing, overhauling and modifying aircraft, engines, missiles, components and software to meet customer demands. The Maintenance Division’s depots have unique skills and equipment required to support and overhaul both new, complex components as well as aging weapon systems. An extremely important facet of the depots is that during the current contingencies, the Air Force can surge repair operations and realign capacity to support the war fighter’s immediate needs. Business initiatives are underway to reduce cost, improve performance and increase availability of aircraft through an enterprise-wide repair capability, managed within a centralized repair network. These improvements are critical to the Maintenance Division remaining a fundamental element of both readiness and sustainability by providing a cost effective, rapid repair capability.
Historically, repair and overhaul were accomplished by organic depots that Air Force Materiel Command (AFMC) manages and contractor facilities. Beginning in FY 2009 the Maintenance Division no longer accepts new orders for contract depot maintenance. The transition of contract depot maintenance from the Working Capital Fund (WCF) began FY 2003 and completed FY 2008. The AFWCF closed out all accounting records for contract depot maintenance as of 31 July 2011.
CONSOLIDATED SUSTAINMENT ACTIVITY GROUP
15
CSAG Overview – FY 2013 Budget Estimates
The CSAG Maintenance Division ensures support of mission essential workloads and support of workloads that commercial sources cannot or will not perform. The division’s services include repair, overhaul and modification of aircraft, missiles, engines, engine modules and associated component items, exchangeable spare parts and other major end items. Other services include local manufacture, software maintenance, aircraft storage and reclamation, and support to base tenants. Organic maintenance sites include:
Ogden Air Logistics Center (OO-ALC), Ogden, UT Oklahoma City Air Logistics Center (OC-ALC), Oklahoma City, OK Warner Robins Air Logistics Center (WR-ALC), Warner Robins, GA Aerospace Maintenance and Regeneration Group (AMARG), Tucson, AZ
Supply Division Description
The Supply Division is primarily responsible for Air Force-managed, depot-level reparable spares and consumable spares unique to the Air Force. Reparable supply items are economically maintained through overhaul or repair. Consumable supply items are consumed in use or discarded when worn out or broken because they cannot be repaired economically. In addition to management of these inventories, the Supply Division provides a wide range of logistics support services including requirements forecasting, item introduction, cataloging, provisioning, procurement, repair, technical support, data management, item disposal, distribution management and transportation. These CSAG Supply Division services are executed under the auspices of the Air Force Global Logistics Support Center (AFGLSC). The AFGLSC is designed to establish an Air Force supply chain management capability that provides enterprise planning, global command and control and a single focal point in support of logistics requirements.
CSAG Customer Base
Maintenance and Supply customers include Air Force Major Commands (including Air National Guard & Air Force Reserves), the Army, the Navy, other WCF activities such as the Transportation Working Capital Fund, other government agencies, public-private partnerships and foreign countries.
CONSOLIDATED SUSTAINMENT ACTIVITY GROUP
16
CSAG Overview – FY 2013 Budget Estimates
CSAG Initiatives As part of Air Force efficiency initiatives, the AFWCF will incrementally achieve savings in Supply Chain Management and Depot Maintenance activities. Operating within the Air Force campaign Expeditionary Logistics for the 21st Century (eLog21), Supply Chain efficiency initiatives focus on optimizing on-hand AF inventory to reduce buy and repair costs, improving asset visibility to reduce requisition redundancies, delivering support with increased velocity, and modernizing processes to improve weapon system and equipment availability. Initiatives include: - Strategic Sourcing: An analytical and collaborative approach to sourcing spares. It incorporates pre-award collaboration, acquisition planning, and fosters enhanced business arrangements to achieve desired long-term outcomes. - Demand Forecast Accuracy (DFA): Prior to 2010 there was no standardized, collaborative process to objectively measure the accuracy of the demand forecast (how well the supply chain forecasted customer demands). The DFA metric was developed to objectively assess the accuracy of forecasting demand. - Supply Chain Workforce Optimization: Assess and eliminate duplicative Supply positions. - Improve Service Contract Oversight: A formal process for reviewing and consolidating all service contracts to ensure inherently governmental workload is realigned internally and to consolidate like contracts and eliminate duplication. These continued actions are in line with the SECDEF initiatives to reduce dependency on contractor support. - CSAG Overhead: A formal review of all Must-Pay accounts to ensure requirements are optimally aligned. Collaborating with DLA to obtain cost information for the areas of Storage, Over & Above, Issues & Receipts, and Over Ocean to highlight opportunities for savings. Additionally, Second Destination Transportation for large commodities of supply is under review for optimization. In support of Maintenance Division, several eLog21 initiatives are underway with the intent of reducing depot maintenance cost, improving performance and aircraft availability. Specifically, the Repair Network Integration (RNI) initiative aims to establish an enterprise-wide repair capability managed within a centralized repair chain that gains efficiencies through standardized repair processes; dynamically adjusts to changing demand; and effectively utilizes depots and Centralized Repair Facilities. Additionally, to increase aircraft availability the Air Force is piloting a High Velocity Maintenance (HVM) program benchmarked against best practices in the civilian aviation industry. HVM facilitates dramatic improvements in “how” the work is accomplished, resulting in reduced aircraft down time. Keys tenets of HVM are to establish “mechanic centric focus” processes that keep the mechanic on the aircraft turning wrenches; to advance aircraft condition knowledge; and to divide work packages into more manageable, executable packages.
CONSOLIDATED SUSTAINMENT ACTIVITY GROUP
17

CSAG Overview – FY 2013 Budget Estimates
These improvements are critical to the Maintenance Division fundamentally supporting readiness and sustainability by providing a cost effective, rapid repair capability. The Maintenance Division will: a) continue to provide a core Air Force depot capability to retain an in-house source of technical competence; b) continually seek new methods for efficient use of resources such as partnering, government owned/contractor operated facilities, and field teams augmenting in-house operations; and c) continue to find innovative ways to decrease flow days for systems and components, increase parts availability to the repair line and control material costs through process reviews, adoption of commercial practices and engineered standards.
CONSOLIDATED SUSTAINMENT ACTIVITY GROUP
18
CSAG Overview – FY 2013 Budget Estimates
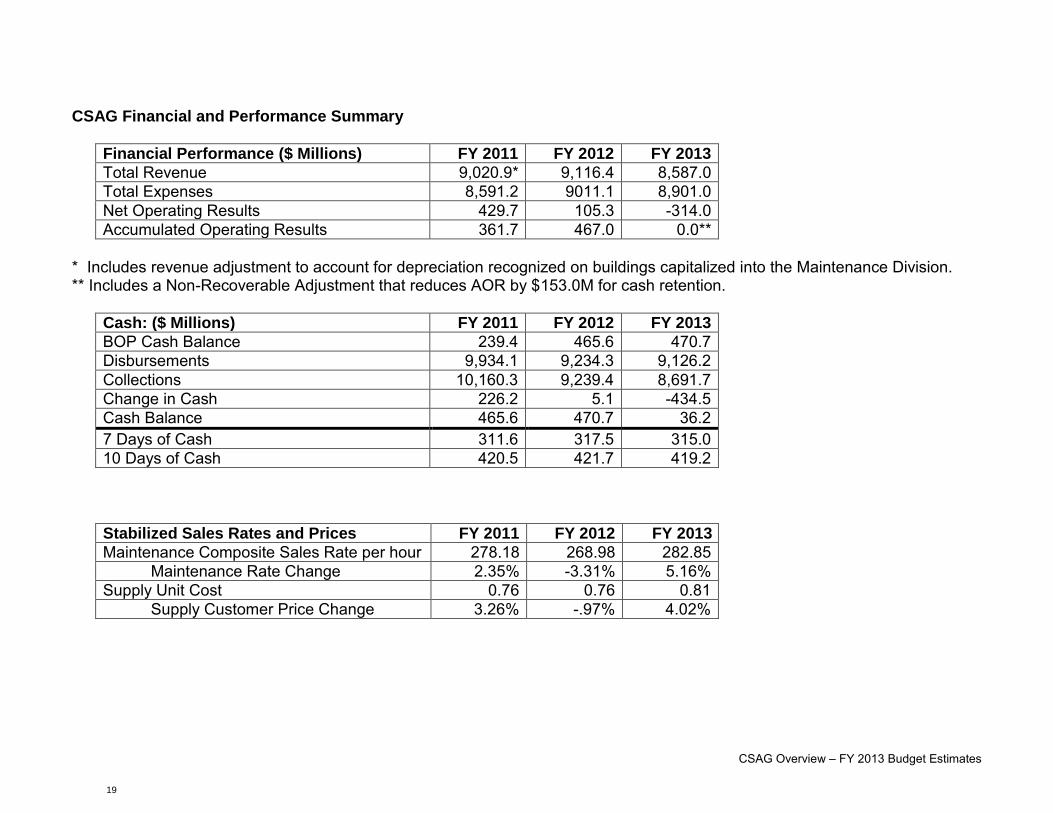
CSAG Financial and Performance Summary
Financial Performance ($ Millions) FY 2011 FY 2012 FY 2013
Total Revenue 9,020.9* 9,116.4 8,587.0 Total Expenses 8,591.2 9011.1 8,901.0 Net Operating Results 429.7 105.3 -314.0 Accumulated Operating Results 361.7 467.0 0.0**
* Includes revenue adjustment to account for depreciation recognized on buildings capitalized into the Maintenance Division. ** Includes a Non-Recoverable Adjustment that reduces AOR by $153.0M for cash retention.
Cash: ($ Millions) FY 2011 FY 2012 FY 2013
BOP Cash Balance 239.4 465.6 470.7 Disbursements 9,934.1 9,234.3 9,126.2 Collections 10,160.3 9,239.4 8,691.7 Change in Cash 226.2 5.1 -434.5 Cash Balance 465.6 470.7 36.2 7 Days of Cash 311.6 317.5 315.0 10 Days of Cash 420.5 421.7 419.2
Stabilized Sales Rates and Prices FY 2011 FY 2012 FY 2013
Maintenance Composite Sales Rate per hour 278.18 268.98 282.85
Maintenance Rate Change 2.35% -3.31% 5.16%
Supply Unit Cost 0.76 0.76 0.81 Supply Customer Price Change 3.26% -.97% 4.02%
CONSOLIDATED SUSTAINMENT ACTIVITY GROUP
19
CSAG Overview – FY 2013 Budget Estimates
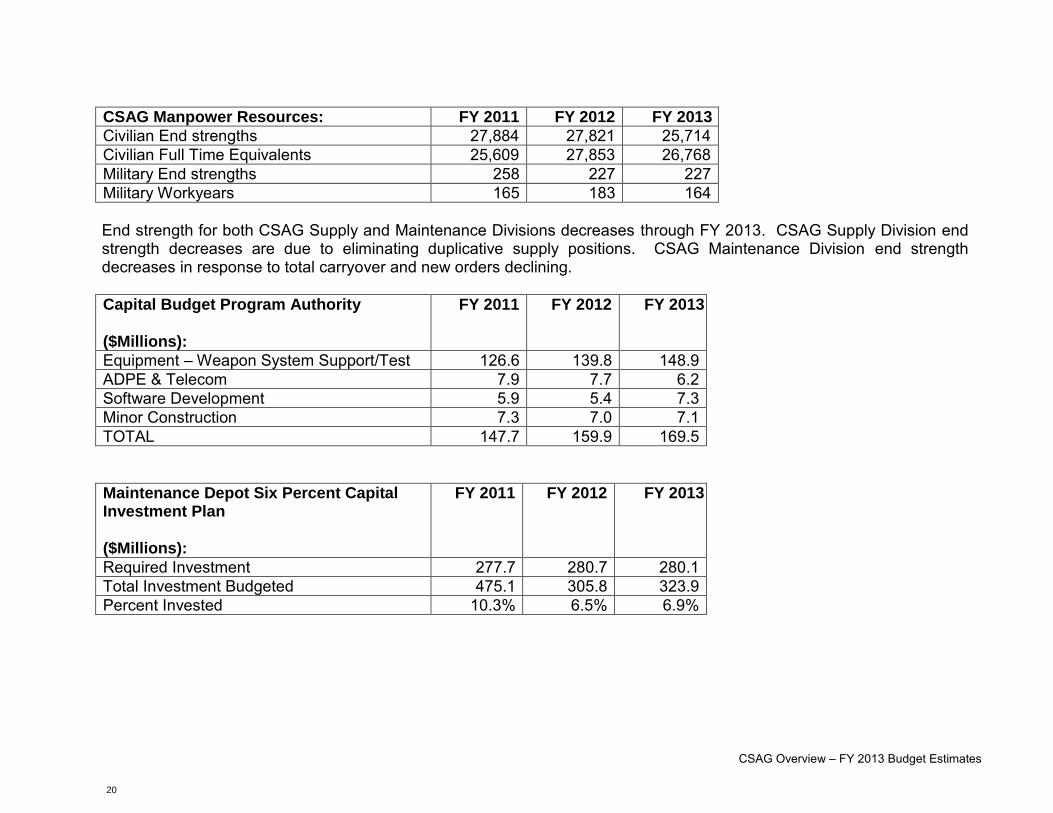
CSAG Manpower Resources: FY 2011 FY 2012 FY 2013
Civilian End strengths 27,884 27,821 25,714 Civilian Full Time Equivalents 25,609 27,853 26,768 Military End strengths 258 227 227 Military Workyears 165 183 164 End strength for both CSAG Supply and Maintenance Divisions decreases through FY 2013. CSAG Supply Division end strength decreases are due to eliminating duplicative supply positions. CSAG Maintenance Division end strength decreases in response to total carryover and new orders declining.
Capital Budget Program Authority
($Millions):
FY 2011 FY 2012 FY 2013
Equipment – Weapon System Support/Test 126.6 139.8 148.9 ADPE & Telecom 7.9 7.7 6.2 Software Development 5.9 5.4 7.3 Minor Construction 7.3 7.0 7.1 TOTAL 147.7 159.9 169.5
Maintenance Depot Six Percent Capital Investment Plan
($Millions):
FY 2011 FY 2012 FY 2013
Required Investment 277.7 280.7 280.1 Total Investment Budgeted 475.1 305.8 323.9 Percent Invested 10.3% 6.5% 6.9%
CONSOLIDATED SUSTAINMENT ACTIVITY GROUP
20
CSAG Overview – FY 2013 Budget Estimates
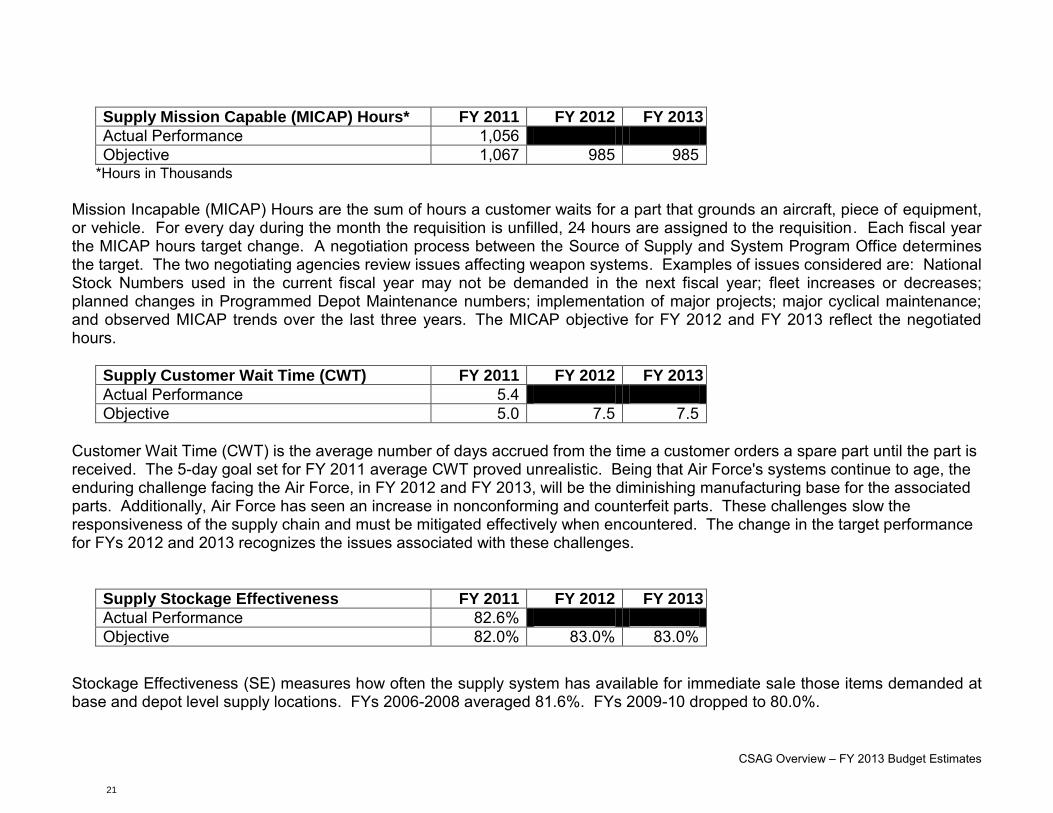
Supply Mission Capable (MICAP) Hours* FY 2011 FY 2012 FY 2013
Actual Performance 1,056 Objective 1,067 985 985
*Hours in Thousands
Mission Incapable (MICAP) Hours are the sum of hours a customer waits for a part that grounds an aircraft, piece of equipment, or vehicle. For every day during the month the requisition is unfilled, 24 hours are assigned to the requisition. Each fiscal year the MICAP hours target change. A negotiation process between the Source of Supply and System Program Office determines the target. The two negotiating agencies review issues affecting weapon systems. Examples of issues considered are: National Stock Numbers used in the current fiscal year may not be demanded in the next fiscal year; fleet increases or decreases; planned changes in Programmed Depot Maintenance numbers; implementation of major projects; major cyclical maintenance; and observed MICAP trends over the last three years. The MICAP objective for FY 2012 and FY 2013 reflect the negotiated hours.
Supply Customer Wait Time (CWT) FY 2011 FY 2012 FY 2013
Actual Performance 5.4 Objective 5.0 7.5 7.5
Customer Wait Time (CWT) is the average number of days accrued from the time a customer orders a spare part until the part is received. The 5-day goal set for FY 2011 average CWT proved unrealistic. Being that Air Force's systems continue to age, the enduring challenge facing the Air Force, in FY 2012 and FY 2013, will be the diminishing manufacturing base for the associated parts. Additionally, Air Force has seen an increase in nonconforming and counterfeit parts. These challenges slow the responsiveness of the supply chain and must be mitigated effectively when encountered. The change in the target performance for FYs 2012 and 2013 recognizes the issues associated with these challenges.
Supply Stockage Effectiveness FY 2011 FY 2012 FY 2013
Actual Performance 82.6% Objective 82.0% 83.0% 83.0%
Stockage Effectiveness (SE) measures how often the supply system has available for immediate sale those items demanded at base and depot level supply locations. FYs 2006-2008 averaged 81.6%. FYs 2009-10 dropped to 80.0%.
CONSOLIDATED SUSTAINMENT ACTIVITY GROUP
21
CSAG Overview – FY 2013 Budget Estimates
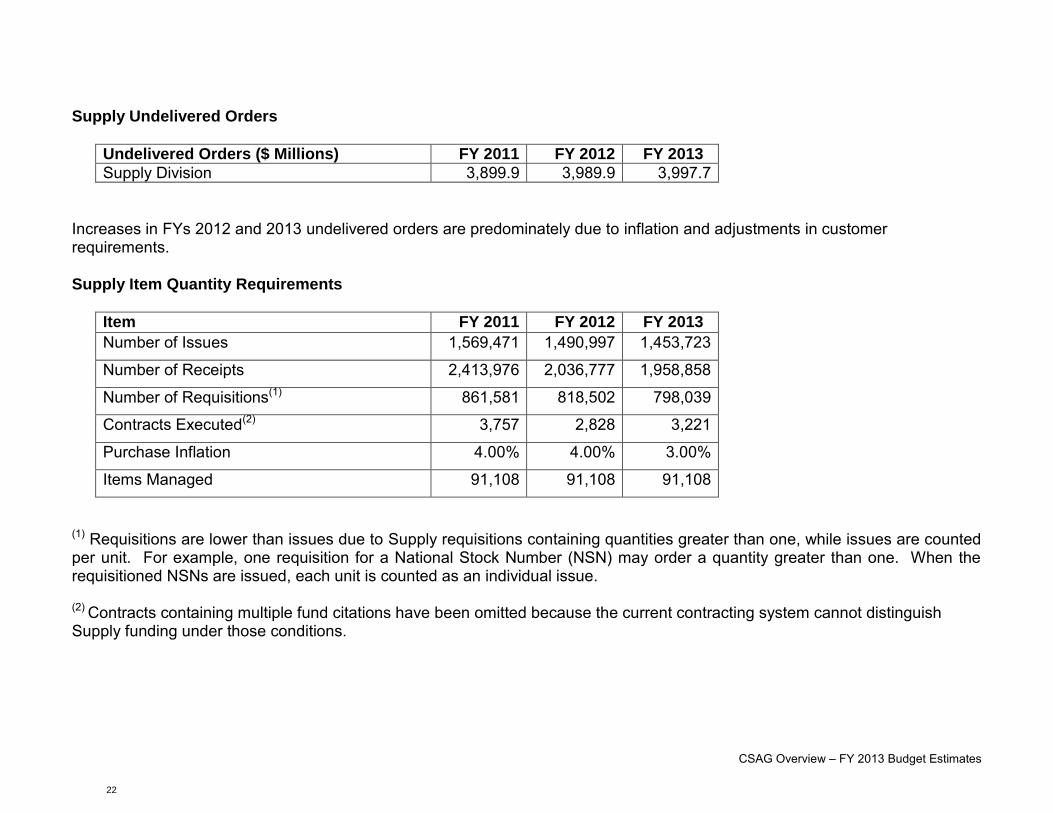
Supply Undelivered Orders
Undelivered Orders ($ Millions) FY 2011 FY 2012 FY 2013
Supply Division 3,899.9 3,989.9 3,997.7
Increases in FYs 2012 and 2013 undelivered orders are predominately due to inflation and adjustments in customer requirements.
Supply Item Quantity Requirements
Item FY 2011 FY 2012 FY 2013
Number of Issues 1,569,471 1,490,997 1,453,723
Number of Receipts 2,413,976 2,036,777 1,958,858
Number of Requisitions(1) 861,581 818,502 798,039
Contracts Executed(2) 3,757 2,828 3,221
Purchase Inflation 4.00% 4.00% 3.00%
Items Managed 91,108 91,108 91,108
(1) Requisitions are lower than issues due to Supply requisitions containing quantities greater than one, while issues are counted per unit. For example, one requisition for a National Stock Number (NSN) may order a quantity greater than one. When the requisitioned NSNs are issued, each unit is counted as an individual issue. (2) Contracts containing multiple fund citations have been omitted because the current contracting system cannot distinguish Supply funding under those conditions.
CONSOLIDATED SUSTAINMENT ACTIVITY GROUP
22
CSAG Overview – FY 2013 Budget Estimates
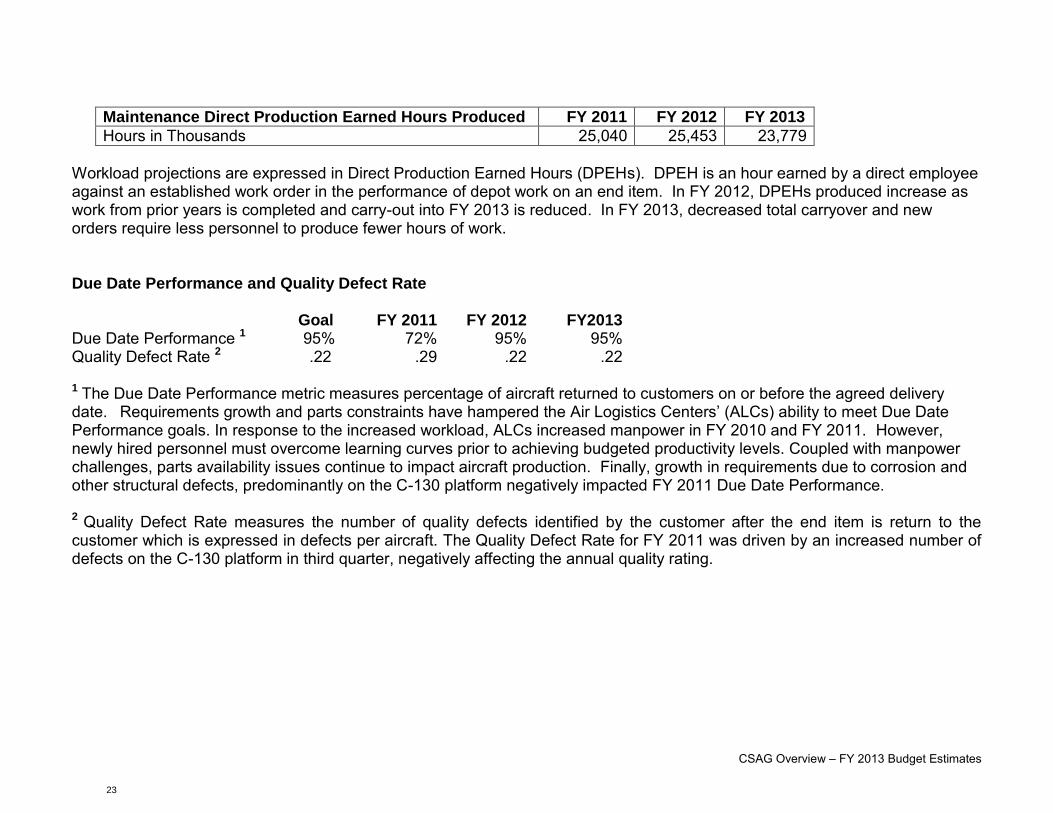
Maintenance Direct Production Earned Hours Produced FY 2011 FY 2012 FY 2013
Hours in Thousands 25,040 25,453 23,779
Workload projections are expressed in Direct Production Earned Hours (DPEHs). DPEH is an hour earned by a direct employee against an established work order in the performance of depot work on an end item. In FY 2012, DPEHs produced increase as work from prior years is completed and carry-out into FY 2013 is reduced. In FY 2013, decreased total carryover and new orders require less personnel to produce fewer hours of work. Due Date Performance and Quality Defect Rate Goal FY 2011 FY 2012 FY2013 Due Date Performance 1 95% 72% 95% 95% Quality Defect Rate 2 .22 .29 .22 .22 1 The Due Date Performance metric measures percentage of aircraft returned to customers on or before the agreed delivery
date. Requirements growth and parts constraints have hampered the Air Logistics Centers’ (ALCs) ability to meet Due Date Performance goals. In response to the increased workload, ALCs increased manpower in FY 2010 and FY 2011. However, newly hired personnel must overcome learning curves prior to achieving budgeted productivity levels. Coupled with manpower challenges, parts availability issues continue to impact aircraft production. Finally, growth in requirements due to corrosion and other structural defects, predominantly on the C-130 platform negatively impacted FY 2011 Due Date Performance. 2 Quality Defect Rate measures the number of quality defects identified by the customer after the end item is return to the customer which is expressed in defects per aircraft. The Quality Defect Rate for FY 2011 was driven by an increased number of defects on the C-130 platform in third quarter, negatively affecting the annual quality rating.
CONSOLIDATED SUSTAINMENT ACTIVITY GROUP
23

THIS PAGE INTENTIONALLY LEFT BLANK
CONSOLIDATED SUSTAINMENT ACTIVITY GROUP
24
Fund 2
(Dollars in Millions)
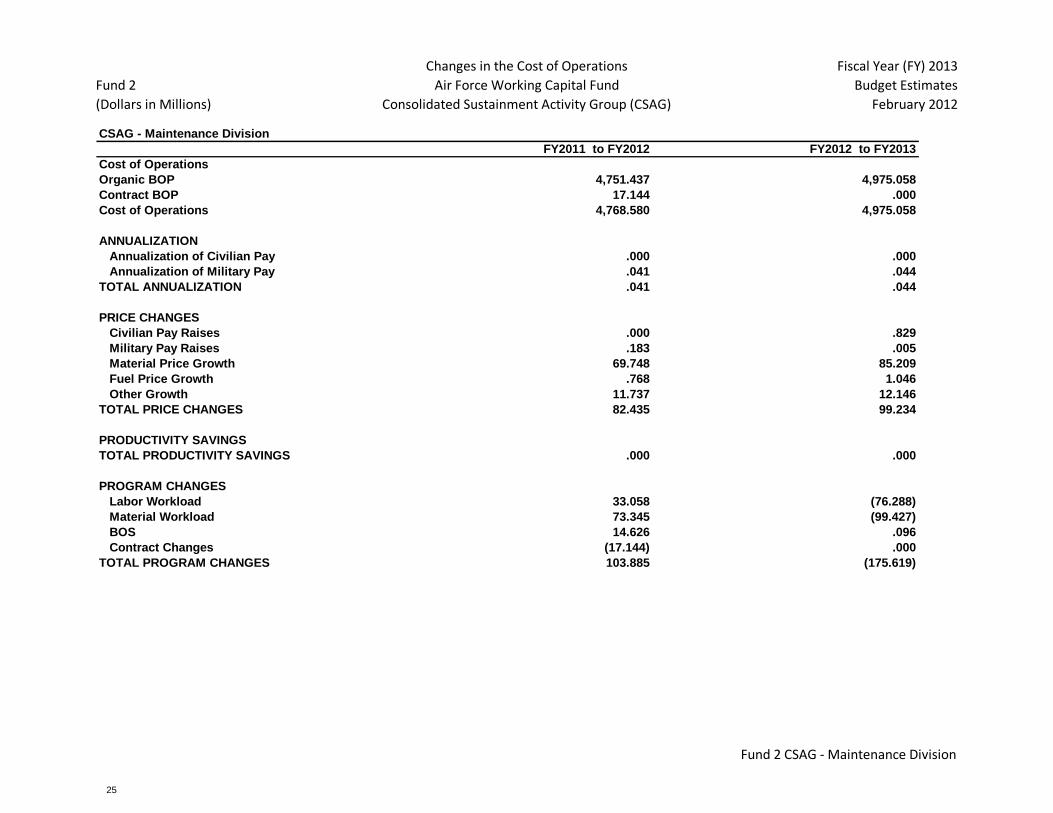
Changes in the Cost of Operations
Air Force Working Capital Fund
Consolidated Sustainment Activity Group (CSAG)
Fiscal Year (FY) 2013
Budget Estimates
February 2012
CSAG - Maintenance Division
FY2011 to FY2012 FY2012 to FY2013
Cost of Operations
Organic BOP 4,751.437 4,975.058
Contract BOP 17.144 .000
Cost of Operations 4,768.580 4,975.058
ANNUALIZATION
Annualization of Civilian Pay .000 .000
Annualization of Military Pay .041 .044
TOTAL ANNUALIZATION .041 .044
PRICE CHANGES
Civilian Pay Raises .000 .829
Military Pay Raises .183 .005
Material Price Growth 69.748 85.209
Fuel Price Growth .768 1.046
Other Growth 11.737 12.146
TOTAL PRICE CHANGES 82.435 99.234
PRODUCTIVITY SAVINGS
TOTAL PRODUCTIVITY SAVINGS .000 .000
PROGRAM CHANGES
Labor Workload 33.058 (76.288)
Material Workload 73.345 (99.427)
BOS 14.626 .096
Contract Changes (17.144) .000
TOTAL PROGRAM CHANGES 103.885 (175.619)
Fund 2 CSAG - Maintenance Division
CONSOLIDATED SUSTAINMENT ACTIVITY GROUP
25
Fund 2
(Dollars in Millions)
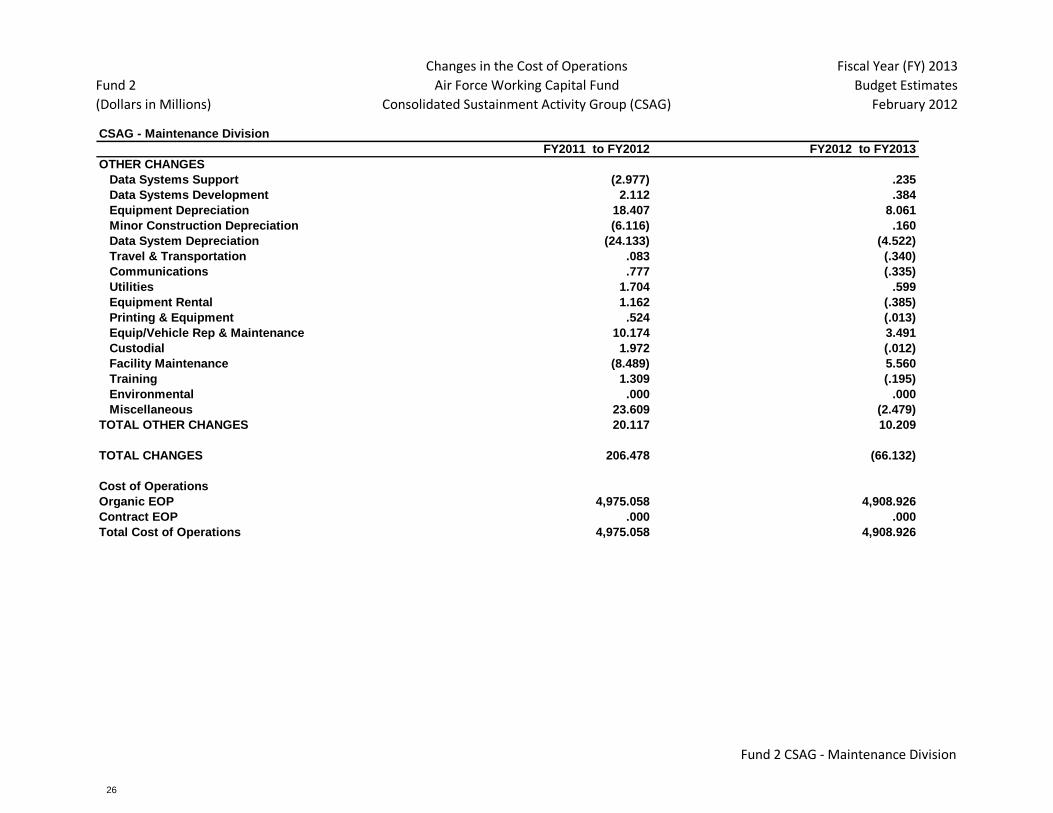
Changes in the Cost of Operations
Air Force Working Capital Fund
Consolidated Sustainment Activity Group (CSAG)
Fiscal Year (FY) 2013
Budget Estimates
February 2012
CSAG - Maintenance Division
FY2011 to FY2012 FY2012 to FY2013
OTHER CHANGES
Data Systems Support (2.977) .235
Data Systems Development 2.112 .384
Equipment Depreciation 18.407 8.061
Minor Construction Depreciation (6.116) .160
Data System Depreciation (24.133) (4.522)
Travel & Transportation .083 (.340)
Communications .777 (.335)
Utilities 1.704 .599
Equipment Rental 1.162 (.385)
Printing & Equipment .524 (.013)
Equip/Vehicle Rep & Maintenance 10.174 3.491
Custodial 1.972 (.012)
Facility Maintenance (8.489) 5.560
Training 1.309 (.195)
Environmental .000 .000
Miscellaneous 23.609 (2.479)
TOTAL OTHER CHANGES 20.117 10.209
TOTAL CHANGES 206.478 (66.132)
Cost of Operations
Organic EOP 4,975.058 4,908.926
Contract EOP .000 .000
Total Cost of Operations 4,975.058 4,908.926
Fund 2 CSAG - Maintenance Division
CONSOLIDATED SUSTAINMENT ACTIVITY GROUP
26

Fund 6
(Dollars in Millions)
Depot Maintenance Six Percent Capital Investment Plan
Air Force Working Capital Fund
Consolidated Sustainment Activity Group (CSAG)
Fiscal Year (FY) 2013
Budget Estimates
February 2012
CSAG - Maintenance Division
2009-2011 2010-2012 2011-2013 FY2011 FY2012 FY2013 FY2011 FY2012 FY2013
6.00% 6.00% 6.00%
RevenueRevenue
Working Capital Fund Working Capital Fund 4,628.000 4,678.000 4,669.000
Appropriations Appropriations .000 .000 .000
Total RevenueTotal Revenue 4,628.000 4,678.000 4,669.000
Required InvestmentRequired Investment 277.680 280.680 280.140
AF Depot InvestmentAF Depot Investment
Facility, Restoration & Modernization Facility Restoration & Modernization1
109.486 28.800 29.730
Equipment Equipment 175.807 115.554 129.095
Equipment Expense Equipment Expense .107 13.754 10.295
Aircraft Procurement (3010) Aircraft Procurement (3010)2
175.700 101.800 118.800
WCF Capital Investment Program WCF Capital Investment Program 138.827 152.955 160.605
Productivity Enhancements Productivity Enhancements3
9.200 8.500 4.500
AF MILCON (3300) AF MILCON (3300) 41.800 .000 .000
Component Total InvestmentComponent Total Investment 475.120 305.809 323.930
Variance of Required to Actual InvestmentVariance of Required to Actual Investment 197.440 25.129 43.790
(Postive number exceeds 6% requirement)(Postive number exceeds 6% requirement)
3. Applicable to transitioning equipment/technology through prototyping, testing, demonstration, and production qualification to utilization in the depot production
environment.
1. Per FY 2012 National Defense Authorization Act (NDAA), sustainment of facilities is not included in the 6% calculation and has been removed from the line previously
named "Facility Sustainment, Restoration & Modernization" for FY 2012 and FY 2013. However, the FY 2011 data on that line includes facility sustainment.
Revenue
3 Year Average DifferenceBudget Capital
2. Efforts funded with Aircraft Procurement (3010) include: support equipment development, procurement, installation and validation; tooling manufacturing and
modification; software licensing and testing; engineering support; test equipment; and repair manuals.
Fund 6 CSAG - Maintenance Division
CONSOLIDATED SUSTAINMENT ACTIVITY GROUP
27
Fund 11
(Dollars in Millions)
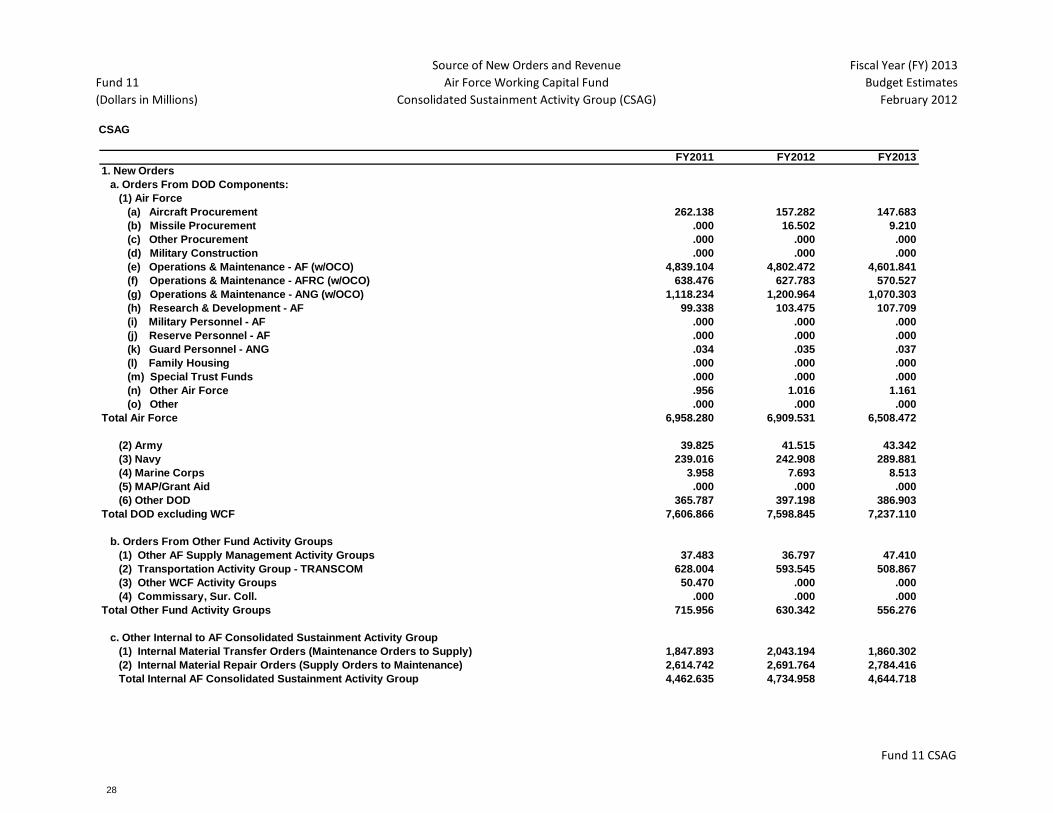
Source of New Orders and Revenue
Air Force Working Capital Fund
Consolidated Sustainment Activity Group (CSAG)
Fiscal Year (FY) 2013
Budget Estimates
February 2012
CSAG
FY2011 FY2012 FY2013
1. New Orders1. New Orders
a. Orders From DOD Components: a. Orders From DOD Components:
(1) Air Force (1) Air Force
(a) Aircraft Procurement (a) Aircraft Procurement 262.138 157.282 147.683
(b) Missile Procurement (b) Missile Procurement .000 16.502 9.210
(c) Other Procurement (c) Other Procurement .000 .000 .000
(d) Military Construction (d) Military Construction .000 .000 .000
(e) Operations & Maintenance - AF (w/OCO) (e) Operations & Maintenance - AF (w/OCO) 4,839.104 4,802.472 4,601.841
(f) Operations & Maintenance - AFRC (w/OCO) (f) Operations & Maintenance - AFRC (w/OCO) 638.476 627.783 570.527
(g) Operations & Maintenance - ANG (w/OCO) (g) Operations & Maintenance - ANG (w/OCO) 1,118.234 1,200.964 1,070.303
(h) Research & Development - AF (h) Research & Development - AF 99.338 103.475 107.709
(i) Military Personnel - AF (i) Military Personnel - AF .000 .000 .000
(j) Reserve Personnel - AF (j) Reserve Personnel - AF .000 .000 .000
(k) Guard Personnel - ANG (k) Guard Personnel - ANG .034 .035 .037
(l) Family Housing (l) Family Housing .000 .000 .000
(m) Special Trust Funds (m) Special Trust Funds .000 .000 .000
(n) Other Air Force (n) Other Air Force .956 1.016 1.161
(o) Other (o) Other .000 .000 .000
Total Air ForceTotal Air Force 6,958.280 6,909.531 6,508.472
(2) Army (2) Army 39.825 41.515 43.342
(3) Navy (3) Navy 239.016 242.908 289.881
(4) Marine Corps (4) Marine Corps 3.958 7.693 8.513
(5) MAP/Grant Aid (5) MAP/Grant Aid .000 .000 .000
(6) Other DOD (6) Other DOD 365.787 397.198 386.903
Total DOD excluding WCFTotal DOD excluding WCF 7,606.866 7,598.845 7,237.110
b. Orders From Other Fund Activity Groups b. Orders From Other Fund Activity Groups
(1) Other AF Supply Management Activity Groups (1) Other AF Supply Management Activity Groups 37.483 36.797 47.410
(2) Transportation Activity Group - TRANSCOM (2) Transportation Activity Group - TRANSCOM 628.004 593.545 508.867
(3) Other WCF Activity Groups (3) Other WCF Activity Groups 50.470 .000 .000
(4) Commissary, Sur. Coll. (4) Commissary, Sur. Coll. .000 .000 .000
Total Other Fund Activity GroupsTotal Other Fund Activity Groups 715.956 630.342 556.276
c. Other Internal to AF Consolidated Sustainment Activity Group c. Other Internal to AF Consolidated Sustainment Activity Group
(1) Internal Material Transfer Orders (Maintenance Orders to Supply) (1) Internal Material Transfer Orders (Maintenance Orders to Supply) 1,847.893 2,043.194 1,860.302
(2) Internal Material Repair Orders (Supply Orders to Maintenance) (2) Internal Material Repair Orders (Supply Orders to Maintenance) 2,614.742 2,691.764 2,784.416
Total Internal AF Consolidated Sustainment Activity Group Total Internal AF Consolidated Sustainment Activity Group 4,462.635 4,734.958 4,644.718
Fund 11 CSAG
CONSOLIDATED SUSTAINMENT ACTIVITY GROUP
28
Fund 11
(Dollars in Millions)
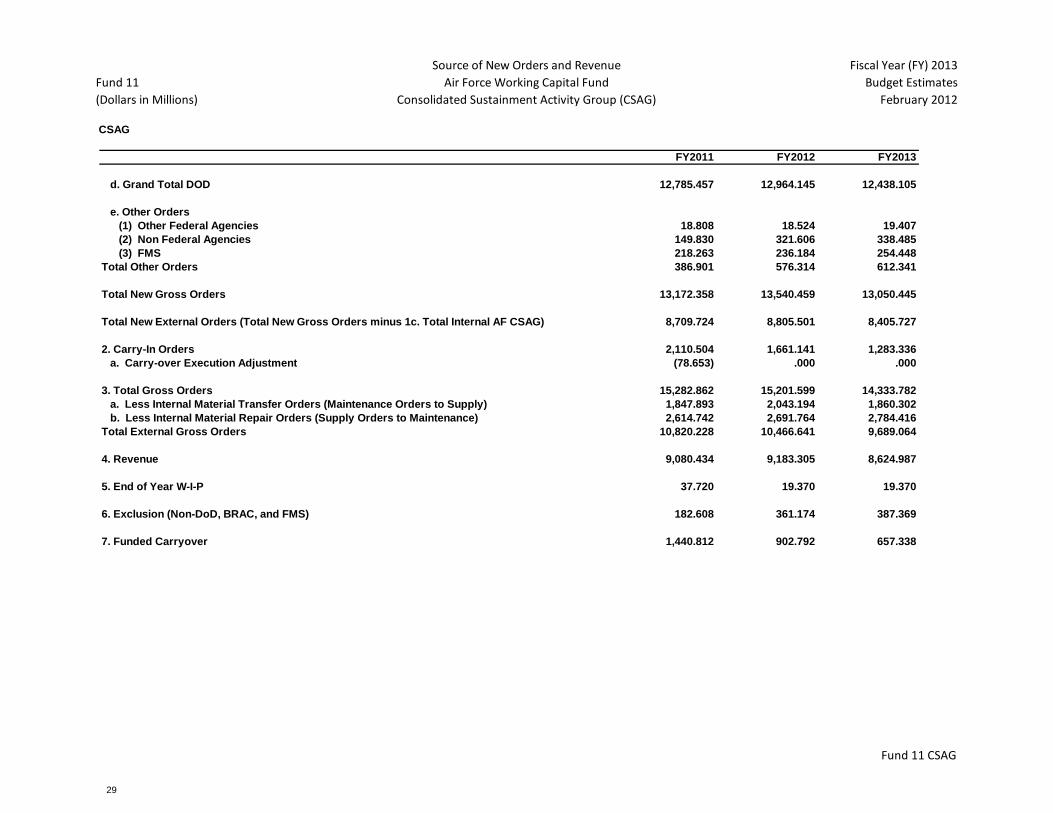
Source of New Orders and Revenue
Air Force Working Capital Fund
Consolidated Sustainment Activity Group (CSAG)
Fiscal Year (FY) 2013
Budget Estimates
February 2012
CSAG
FY2011 FY2012 FY2013
d. Grand Total DOD d. Grand Total DOD 12,785.457 12,964.145 12,438.105
e. Other Orders e. Other Orders
(1) Other Federal Agencies (1) Other Federal Agencies 18.808 18.524 19.407
(2) Non Federal Agencies (2) Non Federal Agencies 149.830 321.606 338.485
(3) FMS (3) FMS 218.263 236.184 254.448
Total Other OrdersTotal Other Orders 386.901 576.314 612.341
Total New Gross OrdersTotal New Gross Orders 13,172.358 13,540.459 13,050.445
Total External OrdersTotal New External Orders (Total New Gross Orders minus 1c. Total Internal AF CSAG) 8,709.724 8,805.501 8,405.727
2. Carry-In Orders2. Carry-In Orders 2,110.504 1,661.141 1,283.336
a. Carry-over Execution Adjustment a. Carry-over Execution Adjustment (78.653) .000 .000
3. Total Gross Orders3. Total Gross Orders 15,282.862 15,201.599 14,333.782
a. Less Internal Material Transfer Orders (Maintenance Orders to Supply) a. Less Internal Material Transfer Orders (Maintenance Orders to Supply) 1,847.893 2,043.194 1,860.302
b. Less Internal Material Repair Orders (Supply Orders to Maintenance) b. Less Internal Material Repair Orders (Supply Orders to Maintenance) 2,614.742 2,691.764 2,784.416
Total External Gross OrdersTotal External Gross Orders 10,820.228 10,466.641 9,689.064
4. Revenue4. Revenue 9,080.434 9,183.305 8,624.987
5. End of Year W-I-P5. End of Year W-I-P 37.720 19.370 19.370
6. Exclusion (Non-DoD, BRAC, and FMS)6. Exclusion (Non-DoD, BRAC, and FMS) 182.608 361.174 387.369
7. Funded Carryover7. Funded Carryover 1,440.812 902.792 657.338
Fund 11 CSAG
CONSOLIDATED SUSTAINMENT ACTIVITY GROUP
29

Fund 11A
(Dollars in Millions)
Carryover Reconciliation
Air Force Working Capital Fund
Consolidated Sustainment Activity Group (CSAG)
Fiscal Year (FY) 2013
Budget Estimates
February 2012
CSAG - Maintenance Division
External Orders FY2011 FY2012 FY2013
Gross Carry-in 1,960.122 1,553.071 1,180.982
Adjustments to Carry-In During Execution (78.078) 0.000 0.000
WIP 21.864 35.558 19.336
1 Net Carry-in 1,860.180 1,517.513 1,161.646
2 Revenue (Billings) 3,807.790 4,025.716 3,825.521
3 New Orders 3,478.817 3,653.626 3,622.736
4 Exclusion (FMS, BRAC, Other Federal Agencies, Non-Federal Agencies) 182.608 361.174 387.369
Exclusion (Unplanned Orders, Inducted Late) * 71.362 0.000 0.000
Exclusion Adjustment 0.000 0.000 0.000
Total Exclusion (FMS, BRAC, Other Federal Agencies, Non-Federal Agencies) 253.970 361.174 387.369
5 Orders for Carry-over Calculation 3,224.846 3,292.452 3,235.367
6 Weighted Composite Outlay Rate (New Orders) 60.46% 62.47% 63.02%
7 Carry-over Rate (New Orders) 39.54% 37.53% 36.98%
Carry-over Rate (Prior Year Multi-Year Funds) ** 44.26% 100.00% 100.00%
Carry-over Rate (Prior Year Software) 22.77% 28.16% 24.40%
8 Allowable Carry-over (New Orders) 1,274.972 1,235.808 1,196.529
Allowable Carry-over (Prior Year Multi-Year Funds) ** 73.761 0.000 0.000
Allowable Carry-over (Prior Year Software) 84.302 97.863 74.726
Total Allowable Carry-over 1,433.036 1,333.670 1,271.255
9 Unbilled Balance 1,553.071 1,180.982 978.196
Exclusion Adjustment 0.000 0.000 0.000
Total Unbilled Balance 1,553.071 1,180.982 978.196
10 Work-in-Process Carry-over 35.558 19.336 19.336
11 Actual Carry-over 1,517.513 1,161.646 958.860
Exclusion (FMS, BRAC, Other Federal & Agency, Non-Federal) and Inv Capital Rev 32.758 101.164 128.398
Exclusion (Late Inducted Orders) * 67.435 0.000 0.000
12 Calculated Actual Carry-over 1,417.320 1,060.482 830.462
Excess Carryover (15.715) (273.188) (440.793)
(Negative number best)
thus no exclusion required.
If the multi-year credit methodology had not been used in FY 2011, excess carryover would increase $73.8 million to $58.0 million.
* FY 2011 excludes unplanned orders received late in the year, which impacted carryover. FYs 2012 and 2013 do not include estimates for unplanned orders,
** FY 2011 also includes the multi-year credit methodology; FY 2012 and FY 2013 do not, in compliance with Financial Management Regulation update.
Fund 11A CSAG - Maintenance Division
CONSOLIDATED SUSTAINMENT ACTIVITY GROUP
30

Fund 14
(Dollars in Millions)
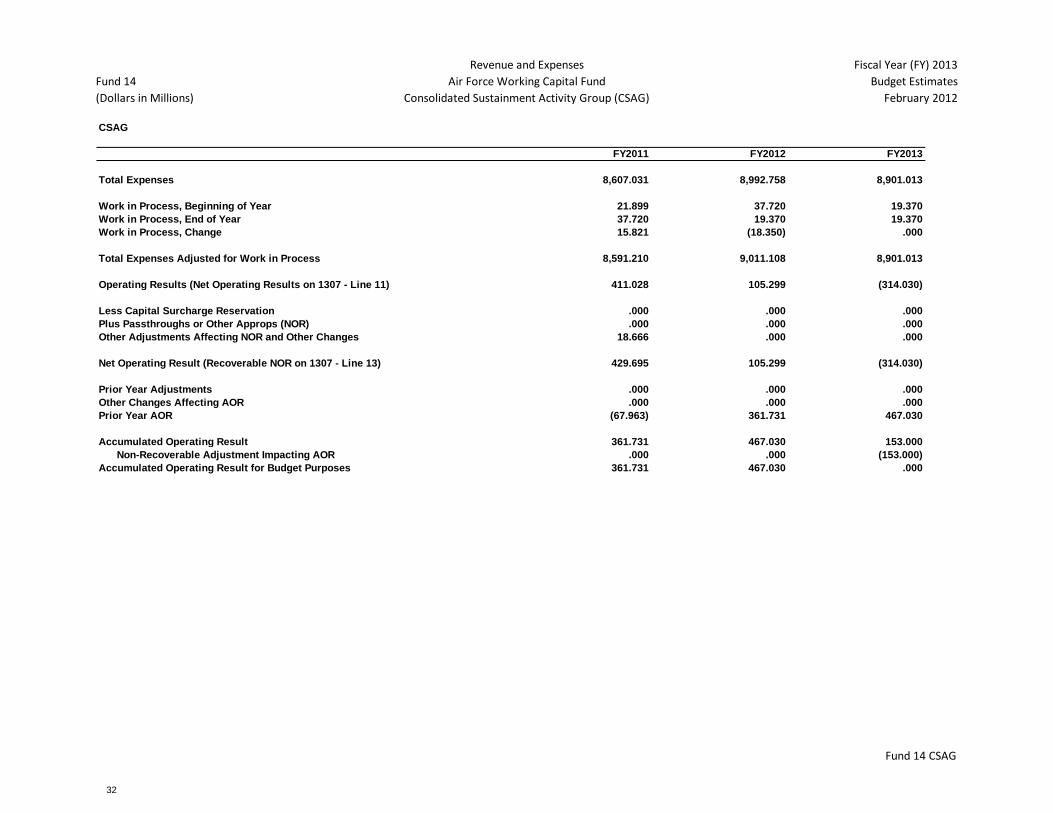
Revenue and Expenses
Air Force Working Capital Fund
Consolidated Sustainment Activity Group (CSAG)
Fiscal Year (FY) 2013
Budget Estimates
February 2012
CSAG
FY2011 FY2012 FY2013
Revenue: Revenue:
Income: Income:
Maintenance Division Maintenance Division 3,815.876 4,025.716 3,825.521
Supply Division (Material Gross Sales) Supply Division (Material Gross Sales)5,264.558 5,157.589 4,799.465
Less Credit Returns Less Credit Returns 147.543 124.208 110.756
Total Income Total Income 8,932.891 9,059.097 8,514.231
Depreciation Offset (Major Construction) Depreciation Offset (Major Construction).000 .000 .000
Other Revenue Other Revenue 69.348 57.310 72.752
Total Other Revenue Total Other Revenue 69.348 57.310 72.752
Total Revenue Total Net Revenue 9,002.239 9,116.407 8,586.983
Expenses: Expenses:
Maintenance Division Maintenance Division
Cost of Repair (Direct and POH Costs) Cost of Repair (Direct and POH Costs)4,261.037 4,434.795 4,376.514
Supply Division Supply Division
Cost of Material Sold Cost of Material Sold 430.422 482.355 441.861
Cost of Material Repair Cost of Material Repair 1,373.143 1,457.839 1,544.558
Condemnation Material Expense Recovery (CMER) Condemnation Material Expense Recovery (CMER)828.740 885.774 852.198
Other Expenses Other Expenses 38.135 57.310 72.752
Subtotal Material & Other Expenses Subtotal Material & Other Expenses2,670.440 2,883.278 2,911.369
Business Operations Business Operations
Military Personnel Military Personnel 9.963 11.243 11.209
Civilian Personnel Civilian Personnel 371.883 372.895 369.832
Travel &Transportation of Personnel Travel &Transportation of Personnel6.162 6.854 6.647
Materials & Supplies Materials & Supplies 38.615 55.022 51.516
Equipment Equipment 47.536 45.756 48.680
Other Purchases from Revolving Funds Other Purchases from Revolving Funds335.160 310.354 298.009
Transportation of Things Transportation of Things 68.081 84.201 85.680
Capital Investment Depreciation Capital Investment Depreciation88.269 63.490 59.787
Printing and Reproduction Printing and Reproduction .937 1.223 1.229
Advisory and Assistance Services Advisory and Assistance Services58.968 34.293 29.353
Rent, Comm, Utilities and Misc Charges Rent, Comm, Utilities and Misc Charges92.250 103.814 109.223
Other Purchased Services Other Purchased Services 557.731 585.541 541.964
Cost of Direct Reimbursable Material Cost of Direct Reimbursable Material.000 .000 .000
Initial Spares Initial Spares .000 .000 .000
Other Direct Reimbursements Other Direct Reimbursements.000 .000 .000
Total Operating Expenses Total Operating Expenses 1,675.555 1,674.685 1,613.130
Fund 14 CSAG
CONSOLIDATED SUSTAINMENT ACTIVITY GROUP
31
Fund 14
(Dollars in Millions)
Revenue and Expenses
Air Force Working Capital Fund
Consolidated Sustainment Activity Group (CSAG)
Fiscal Year (FY) 2013
Budget Estimates
February 2012
CSAG
FY2011 FY2012 FY2013
Total Expenses Total Expenses 8,607.031 8,992.758 8,901.013
Work in Process, Beginning of Year Work in Process, Beginning of Year21.899 37.720 19.370
Work in Process, End of Year Work in Process, End of Year 37.720 19.370 19.370
Work in Process, Change Work in Process, Change 15.821 (18.350) .000
Total Expenses Adjusted for Work in Process Total Expenses Adjusted for Work in Process8,591.210 9,011.108 8,901.013
Operating Results (Net Operating Results on 1307 - Line 11) Operating Results 411.028 105.299 (314.030)
Less Capital Surcharge Reservation Less Capital Surcharge Reservation.000 .000 .000
Plus Passthroughs or Other Approps (NOR) Plus Passthroughs or Other Approps (NOR).000 .000 .000
Other Adjustments Affecting NOR and Other Changes Other Adjustments Affecting NOR and Other Changes18.666 .000 .000
Net Operating Result (Recoverable NOR on 1307 - Line 13) Net Operating Result 429.695 105.299 (314.030)
Prior Year Adjustments Prior Year Adjustments .000 .000 .000
Other Changes Affecting AOR Other Changes Affecting AOR .000 .000 .000
Prior Year AOR Prior Year AOR (67.963) 361.731 467.030
Accumulated Operating Result Accumulated Operating Result361.731 467.030 153.000
Non-Recoverable Adjustment Impacting AOR Non-Recoverable Adjustment Impacting AOR.000 .000 (153.000)
Accumulated Operating Result for Budget Purposes Accumulated Operating Result for Budget Purposes361.731 467.030 .000
Fund 14 CSAG
CONSOLIDATED SUSTAINMENT ACTIVITY GROUP
32
Fund 16
(Dollars in Millions)
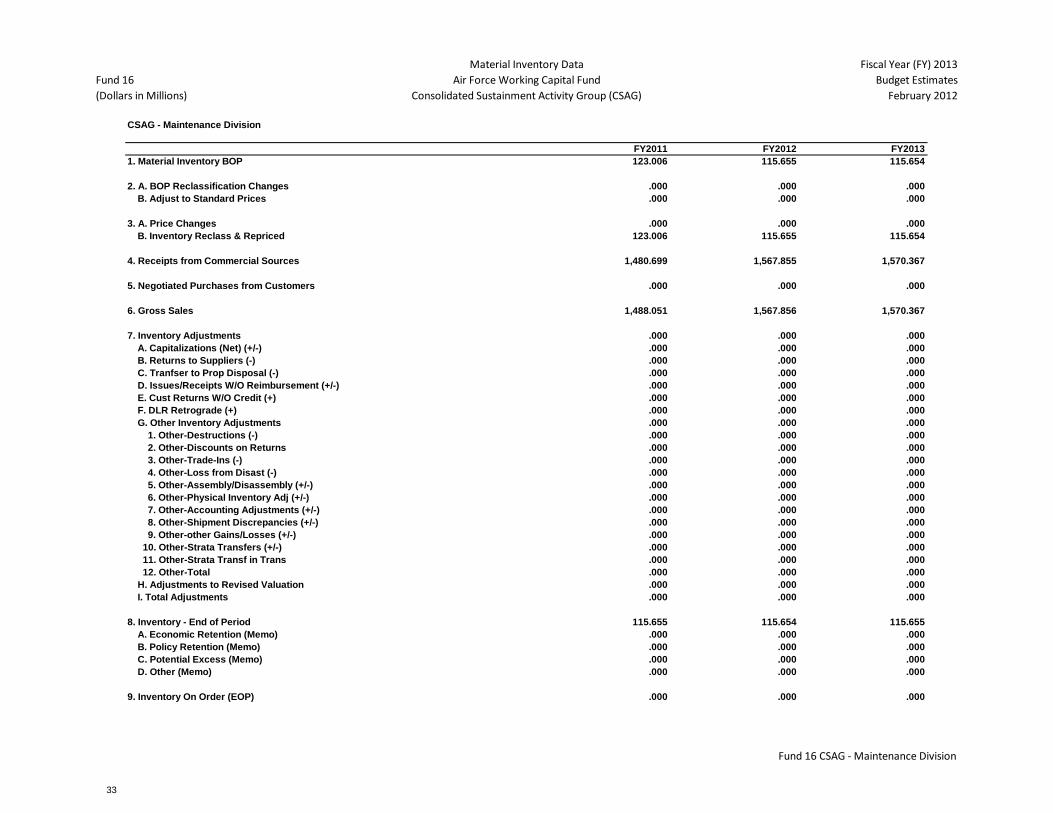
Material Inventory Data
Air Force Working Capital Fund
Consolidated Sustainment Activity Group (CSAG)
Fiscal Year (FY) 2013
Budget Estimates
February 2012
CSAG - Maintenance Division
FY2011 FY2012 FY2013
1. Material Inventory BOP 123.006 115.655 115.654
2. A. BOP Reclassification Changes .000 .000 .000
B. Adjust to Standard Prices .000 .000 .000
3. A. Price Changes .000 .000 .000
B. Inventory Reclass & Repriced 123.006 115.655 115.654
4. Receipts from Commercial Sources 1,480.699 1,567.855 1,570.367
5. Negotiated Purchases from Customers .000 .000 .000
6. Gross Sales 1,488.051 1,567.856 1,570.367
7. Inventory Adjustments .000 .000 .000
A. Capitalizations (Net) (+/-) .000 .000 .000
B. Returns to Suppliers (-) .000 .000 .000
C. Tranfser to Prop Disposal (-) .000 .000 .000
D. Issues/Receipts W/O Reimbursement (+/-) .000 .000 .000
E. Cust Returns W/O Credit (+) .000 .000 .000
F. DLR Retrograde (+) .000 .000 .000
G. Other Inventory Adjustments .000 .000 .000
1. Other-Destructions (-) .000 .000 .000
2. Other-Discounts on Returns .000 .000 .000
3. Other-Trade-Ins (-) .000 .000 .000
4. Other-Loss from Disast (-) .000 .000 .000
5. Other-Assembly/Disassembly (+/-) .000 .000 .000
6. Other-Physical Inventory Adj (+/-) .000 .000 .000
7. Other-Accounting Adjustments (+/-) .000 .000 .000
8. Other-Shipment Discrepancies (+/-) .000 .000 .000
9. Other-other Gains/Losses (+/-) .000 .000 .000
10. Other-Strata Transfers (+/-) .000 .000 .000
11. Other-Strata Transf in Trans .000 .000 .000
12. Other-Total .000 .000 .000
H. Adjustments to Revised Valuation .000 .000 .000
I. Total Adjustments .000 .000 .000
8. Inventory - End of Period 115.655 115.654 115.655
A. Economic Retention (Memo) .000 .000 .000
B. Policy Retention (Memo) .000 .000 .000
C. Potential Excess (Memo) .000 .000 .000
D. Other (Memo) .000 .000 .000
9. Inventory On Order (EOP) .000 .000 .000
Fund 16 CSAG - Maintenance Division
CONSOLIDATED SUSTAINMENT ACTIVITY GROUP
33
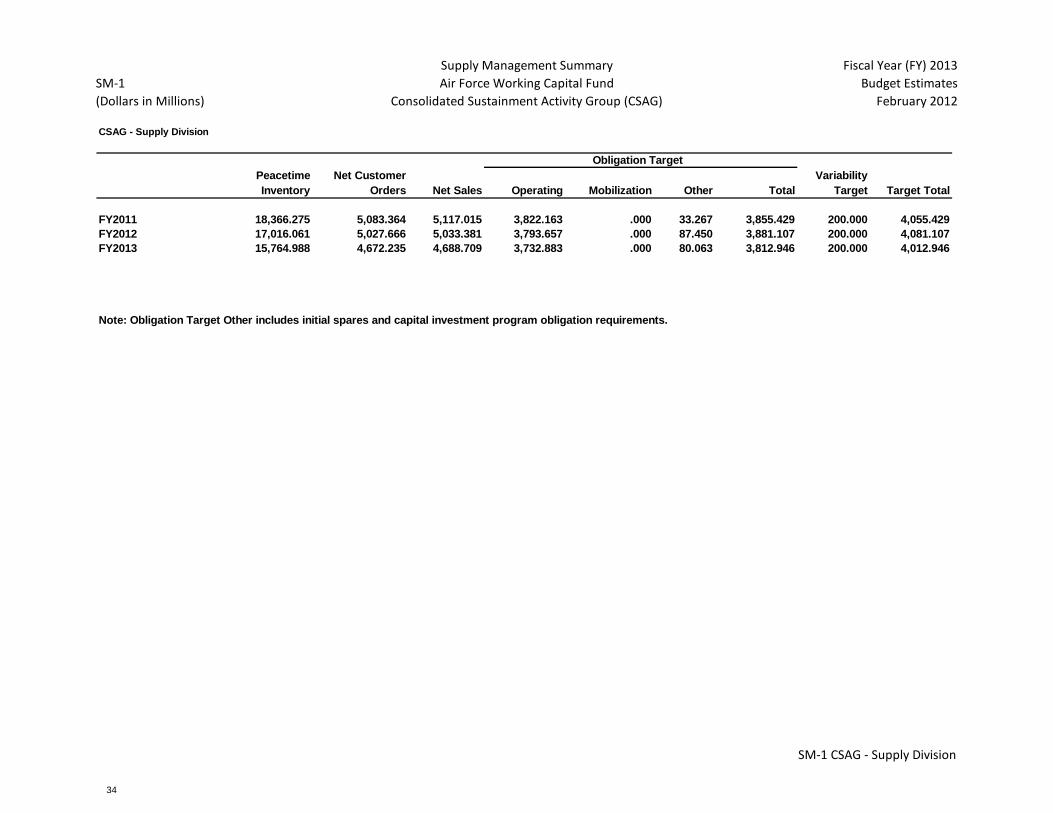
SM-1
(Dollars in Millions)
Supply Management Summary
Air Force Working Capital Fund
Consolidated Sustainment Activity Group (CSAG)
Fiscal Year (FY) 2013
Budget Estimates
February 2012
CSAG - Supply Division
Peacetime
Inventory
Net Customer
Orders Net Sales Operating Mobilization Other Total
Variability
Target Target Total
FY2011 CSAG - Supply Division18,366.275 5,083.364 5,117.015 3,822.163 .000 33.267 3,855.429 200.000 4,055.429
FY2012 CSAG - Supply Division17,016.061 5,027.666 5,033.381 3,793.657 .000 87.450 3,881.107 200.000 4,081.107
FY2013 CSAG - Supply Division15,764.988 4,672.235 4,688.709 3,732.883 .000 80.063 3,812.946 200.000 4,012.946
Note: Obligation Target Other includes initial spares and capital investment program obligation requirements.
Obligation Target
SM-1 CSAG - Supply Division
CONSOLIDATED SUSTAINMENT ACTIVITY GROUP
34

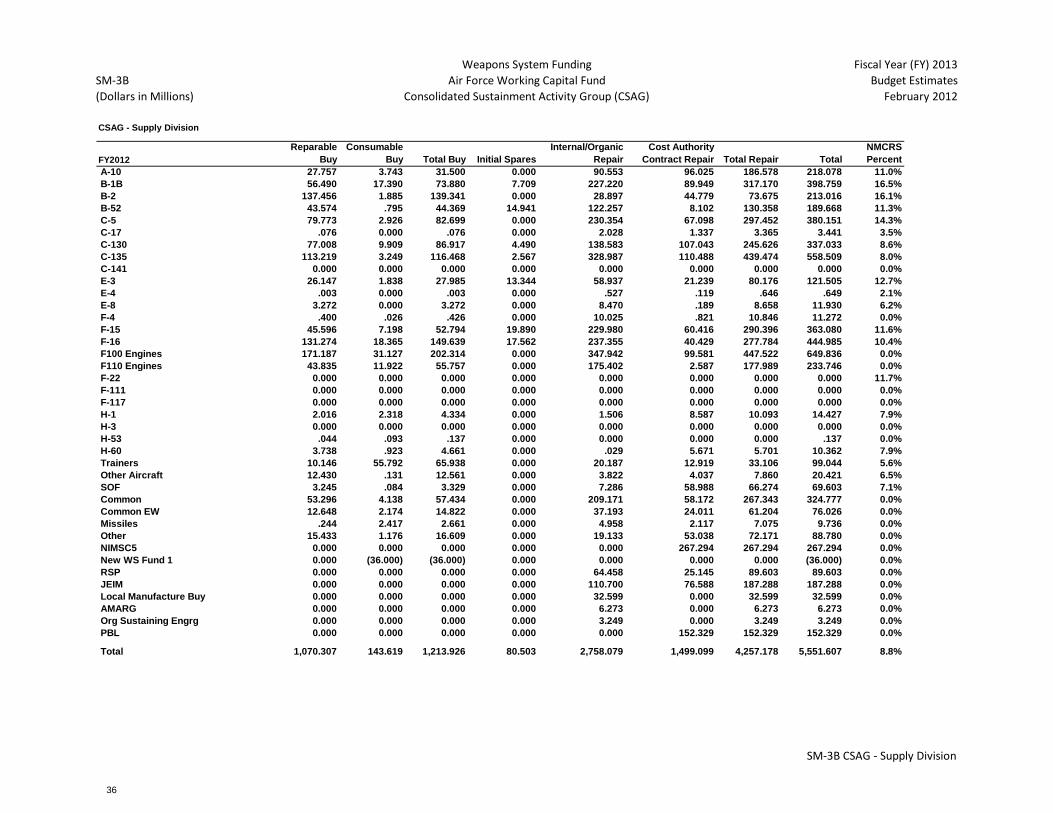
SM-3B
(Dollars in Millions)
Weapons System Funding
Air Force Working Capital Fund
Consolidated Sustainment Activity Group (CSAG)
Fiscal Year (FY) 2013
Budget Estimates
February 2012
CSAG - Supply Division
FY2011
Reparable
Buy
Consumable
Buy Total Buy Initial Spares
Internal/Organic
Repair
Cost Authority
Contract Repair Total Repair Total
NMCRS
Percent
A-10 13.317 0.000 13.317 0.000 66.417 84.202 150.619 163.936 11.4%
B-1B 34.480 7.249 41.729 7.184 55.139 13.205 68.344 117.257 15.9%
B-2 214.569 .687 215.256 1.444 9.629 .857 10.486 227.186 15.9%
B-52 75.672 .113 75.785 .669 78.567 0.000 78.567 155.021 11.2%
C-5 31.223 .148 31.371 0.000 114.256 57.559 171.815 203.186 12.6%
C-17 .221 0.000 .221 0.000 0.000 0.000 0.000 .221 3.5%
C-130 103.020 1.462 104.482 0.000 83.767 172.074 255.841 360.323 8.5%
C-135 90.433 2.150 92.583 0.000 159.585 46.025 205.610 298.193 8.3%
C-141 (.016) 0.000 (.016) 0.000 0.000 0.000 0.000 (.016) 0.0%
E-3 17.684 .862 18.546 8.008 15.398 0.000 15.398 41.952 13.9%
E-4 0.000 0.000 0.000 0.000 0.000 0.000 0.000 0.000 3.5%
E-8 (.001) 0.000 (.001) 0.000 0.000 0.000 0.000 (.001) 6.8%
F-4 .389 0.000 .389 0.000 14.434 1.863 16.297 16.686 0.0%
F-15 48.146 .086 48.232 6.752 212.716 28.907 241.623 296.607 12.3%
F-16 82.916 0.000 82.916 .079 191.554 28.796 220.350 303.345 10.8%
F100 Engines 305.247 43.520 348.767 0.000 272.293 104.630 376.923 725.690 0.0%
F110 Engines 20.360 14.339 34.699 0.000 .842 3.085 3.927 38.626 0.0%
F-22 0.000 0.000 0.000 0.000 0.000 0.000 0.000 0.000 12.8%
F-111 0.000 0.000 0.000 0.000 0.000 0.000 0.000 0.000 0.0%
F-117 0.000 0.000 0.000 0.000 0.000 0.000 0.000 0.000 0.0%
H-1 3.240 0.000 3.240 0.000 0.000 1.117 1.117 4.357 9.2%
H-3 0.000 0.000 0.000 0.000 0.000 0.000 0.000 0.000 0.0%
H-53 (.015) (.218) (.233) 0.000 0.000 0.000 0.000 (.233) 0.0%
H-60 10.745 0.000 10.745 0.000 0.000 .679 .679 11.424 8.6%
Trainers 27.030 .012 27.042 0.000 .196 20.467 20.663 47.705 6.1%
Other Aircraft 0.000 0.000 0.000 0.000 0.000 20.295 20.295 20.295 7.2%
SOF 5.583 0.000 5.583 0.000 7.665 35.317 42.982 48.565 6.8%
Common 63.421 10.894 74.315 0.000 1,035.157 217.001 1,252.158 1,326.473 0.0%
Common EW 14.326 .184 14.510 0.000 136.882 131.169 268.051 282.561 0.0%
Missiles 4.964 .207 5.171 0.000 15.351 6.468 21.819 26.990 0.0%
Other 10.903 .572 11.475 0.000 50.473 53.292 103.765 115.240 0.0%
NIMSC5 0.000 0.000 0.000 0.000 0.000 266.576 266.576 266.576 0.0%
New WS Fund 1 0.000 0.000 0.000 0.000 0.000 0.000 0.000 0.000 0.0%
RSP 0.000 0.000 0.000 0.000 0.000 0.000 0.000 0.000 0.0%
JEIM 0.000 0.000 0.000 0.000 83.230 71.400 154.629 154.629 0.0%
Local Manufacture Buy 0.000 0.000 0.000 0.000 20.366 0.000 20.366 20.366 0.0%
AMARG 0.000 0.000 0.000 0.000 9.332 0.000 9.332 9.332 0.0%
Org Sustaining Engrg 0.000 0.000 0.000 0.000 8.215 0.000 8.215 8.215 0.0%
PBL 0.000 0.000 0.000 0.000 0.000 72.980 72.980 72.980 0.0%
Total 1,177.856 82.267 1,260.123 24.136 2,641.464 1,437.963 4,079.428 5,363.687 9.1%
SM-3B CSAG - Supply Division
CONSOLIDATED SUSTAINMENT ACTIVITY GROUP
35
SM-3B
(Dollars in Millions)
Weapons System Funding
Air Force Working Capital Fund
Consolidated Sustainment Activity Group (CSAG)
Fiscal Year (FY) 2013
Budget Estimates
February 2012
CSAG - Supply Division
FY2012
Reparable
Buy
Consumable
Buy Total Buy Initial Spares
Internal/Organic
Repair
Cost Authority
Contract Repair Total Repair Total
NMCRS
Percent
A-10 27.757 3.743 31.500 0.000 90.553 96.025 186.578 218.078 11.0%
B-1B 56.490 17.390 73.880 7.709 227.220 89.949 317.170 398.759 16.5%
B-2 137.456 1.885 139.341 0.000 28.897 44.779 73.675 213.016 16.1%
B-52 43.574 .795 44.369 14.941 122.257 8.102 130.358 189.668 11.3%
C-5 79.773 2.926 82.699 0.000 230.354 67.098 297.452 380.151 14.3%
C-17 .076 0.000 .076 0.000 2.028 1.337 3.365 3.441 3.5%
C-130 77.008 9.909 86.917 4.490 138.583 107.043 245.626 337.033 8.6%
C-135 113.219 3.249 116.468 2.567 328.987 110.488 439.474 558.509 8.0%
C-141 0.000 0.000 0.000 0.000 0.000 0.000 0.000 0.000 0.0%
E-3 26.147 1.838 27.985 13.344 58.937 21.239 80.176 121.505 12.7%
E-4 .003 0.000 .003 0.000 .527 .119 .646 .649 2.1%
E-8 3.272 0.000 3.272 0.000 8.470 .189 8.658 11.930 6.2%
F-4 .400 .026 .426 0.000 10.025 .821 10.846 11.272 0.0%
F-15 45.596 7.198 52.794 19.890 229.980 60.416 290.396 363.080 11.6%
F-16 131.274 18.365 149.639 17.562 237.355 40.429 277.784 444.985 10.4%
F100 Engines 171.187 31.127 202.314 0.000 347.942 99.581 447.522 649.836 0.0%
F110 Engines 43.835 11.922 55.757 0.000 175.402 2.587 177.989 233.746 0.0%
F-22 0.000 0.000 0.000 0.000 0.000 0.000 0.000 0.000 11.7%
F-111 0.000 0.000 0.000 0.000 0.000 0.000 0.000 0.000 0.0%
F-117 0.000 0.000 0.000 0.000 0.000 0.000 0.000 0.000 0.0%
H-1 2.016 2.318 4.334 0.000 1.506 8.587 10.093 14.427 7.9%
H-3 0.000 0.000 0.000 0.000 0.000 0.000 0.000 0.000 0.0%
H-53 .044 .093 .137 0.000 0.000 0.000 0.000 .137 0.0%
H-60 3.738 .923 4.661 0.000 .029 5.671 5.701 10.362 7.9%
Trainers 10.146 55.792 65.938 0.000 20.187 12.919 33.106 99.044 5.6%
Other Aircraft 12.430 .131 12.561 0.000 3.822 4.037 7.860 20.421 6.5%
SOF 3.245 .084 3.329 0.000 7.286 58.988 66.274 69.603 7.1%
Common 53.296 4.138 57.434 0.000 209.171 58.172 267.343 324.777 0.0%
Common EW 12.648 2.174 14.822 0.000 37.193 24.011 61.204 76.026 0.0%
Missiles .244 2.417 2.661 0.000 4.958 2.117 7.075 9.736 0.0%
Other 15.433 1.176 16.609 0.000 19.133 53.038 72.171 88.780 0.0%
NIMSC5 0.000 0.000 0.000 0.000 0.000 267.294 267.294 267.294 0.0%
New WS Fund 1 0.000 (36.000) (36.000) 0.000 0.000 0.000 0.000 (36.000) 0.0%
RSP 0.000 0.000 0.000 0.000 64.458 25.145 89.603 89.603 0.0%
JEIM 0.000 0.000 0.000 0.000 110.700 76.588 187.288 187.288 0.0%
Local Manufacture Buy 0.000 0.000 0.000 0.000 32.599 0.000 32.599 32.599 0.0%
AMARG 0.000 0.000 0.000 0.000 6.273 0.000 6.273 6.273 0.0%
Org Sustaining Engrg 0.000 0.000 0.000 0.000 3.249 0.000 3.249 3.249 0.0%
PBL 0.000 0.000 0.000 0.000 0.000 152.329 152.329 152.329 0.0%
Total 1,070.307 143.619 1,213.926 80.503 2,758.079 1,499.099 4,257.178 5,551.607 8.8%
SM-3B CSAG - Supply Division
CONSOLIDATED SUSTAINMENT ACTIVITY GROUP
36

SM-3B
(Dollars in Millions)
Weapons System Funding
Air Force Working Capital Fund
Consolidated Sustainment Activity Group (CSAG)
Fiscal Year (FY) 2013
Budget Estimates
February 2012
CSAG - Supply Division
FY2013
Reparable
Buy
Consumable
Buy Total Buy Initial Spares
Internal/Organic
Repair
Cost Authority
Contract Repair Total Repair Total
NMCRS
Percent
A-10 17.716 0.000 17.716 0.000 71.445 71.603 143.048 160.764 11.1%
B-1B 85.281 15.042 100.323 22.125 234.682 92.056 326.738 449.186 16.1%
B-2 57.872 1.159 59.031 5.109 28.758 49.423 78.181 142.321 14.1%
B-52 44.931 .684 45.615 11.324 117.462 9.446 126.908 183.847 11.5%
C-5 81.098 2.307 83.405 0.000 214.934 58.535 273.469 356.874 13.4%
C-17 .205 0.000 .205 0.000 1.454 1.565 3.019 3.224 3.4%
C-130 44.824 9.966 54.790 0.000 124.969 111.735 236.704 291.494 8.8%
C-135 99.980 5.667 105.647 2.048 323.369 109.353 432.722 540.417 8.6%
C-141 0.000 0.000 0.000 0.000 0.000 0.000 0.000 0.000 0.0%
E-3 29.314 1.542 30.856 13.528 58.746 23.062 81.808 126.192 13.2%
E-4 0.000 0.000 0.000 0.000 .457 .030 .487 .487 2.6%
E-8 2.563 0.000 2.563 0.000 8.187 .136 8.323 10.886 6.7%
F-4 .488 .026 .514 0.000 10.732 .825 11.558 12.072 0.0%
F-15 31.498 7.379 38.877 14.649 196.563 65.130 261.693 315.219 12.0%
F-16 97.537 21.673 119.210 2.383 200.222 47.230 247.452 369.045 10.6%
F100 Engines 215.146 28.175 243.321 0.000 374.572 64.226 438.798 682.119 0.0%
F110 Engines 41.100 16.732 57.832 0.000 171.408 2.804 174.212 232.044 0.0%
F-22 0.000 0.000 0.000 0.000 0.000 0.000 0.000 0.000 11.5%
F-111 0.000 0.000 0.000 0.000 0.000 0.000 0.000 0.000 0.0%
F-117 0.000 0.000 0.000 0.000 0.000 0.000 0.000 0.000 0.0%
H-1 1.123 2.420 3.543 0.000 1.524 9.311 10.835 14.378 8.5%
H-3 0.000 0.000 0.000 0.000 0.000 0.000 0.000 0.000 0.0%
H-53 .047 .108 .155 0.000 0.000 .005 .005 .160 0.0%
H-60 3.326 .984 4.310 0.000 .015 8.316 8.331 12.641 7.7%
Trainers 22.898 29.934 52.832 0.000 21.934 16.727 38.660 91.492 5.9%
Other Aircraft 6.783 .144 6.927 0.000 4.325 5.281 9.607 16.534 6.6%
SOF 49.033 .680 49.713 0.000 7.976 83.290 91.266 140.979 6.5%
Common 51.050 4.307 55.357 0.000 210.404 65.311 275.715 331.072 0.0%
Common EW 4.188 1.174 5.362 0.000 37.049 26.066 63.115 68.477 0.0%
Missiles .305 3.159 3.464 0.000 5.731 5.475 11.206 14.670 0.0%
Other 14.565 1.995 16.560 0.000 21.773 64.250 86.024 102.584 0.0%
NIMSC5 0.000 0.000 0.000 0.000 0.000 299.207 299.207 299.207 0.0%
New WS Fund 1 0.000 (36.000) (36.000) 0.000 0.000 0.000 0.000 (36.000) 0.0%
RSP 0.000 0.000 0.000 0.000 69.726 29.055 98.780 98.780 0.0%
JEIM 0.000 0.000 0.000 0.000 117.705 79.642 197.347 197.347 0.0%
Local Manufacture Buy 0.000 0.000 0.000 0.000 33.576 0.000 33.576 33.576 0.0%
AMARG 0.000 0.000 0.000 0.000 6.461 0.000 6.461 6.461 0.0%
Org Sustaining Engrg 0.000 0.000 0.000 0.000 5.363 0.000 5.363 5.363 0.0%
PBL 0.000 0.000 0.000 0.000 0.000 154.114 154.114 154.114 0.0%
Total 1,002.871 119.257 1,122.128 71.166 2,681.523 1,553.209 4,234.731 5,428.025 8.9%
SM-3B CSAG - Supply Division
CONSOLIDATED SUSTAINMENT ACTIVITY GROUP
37

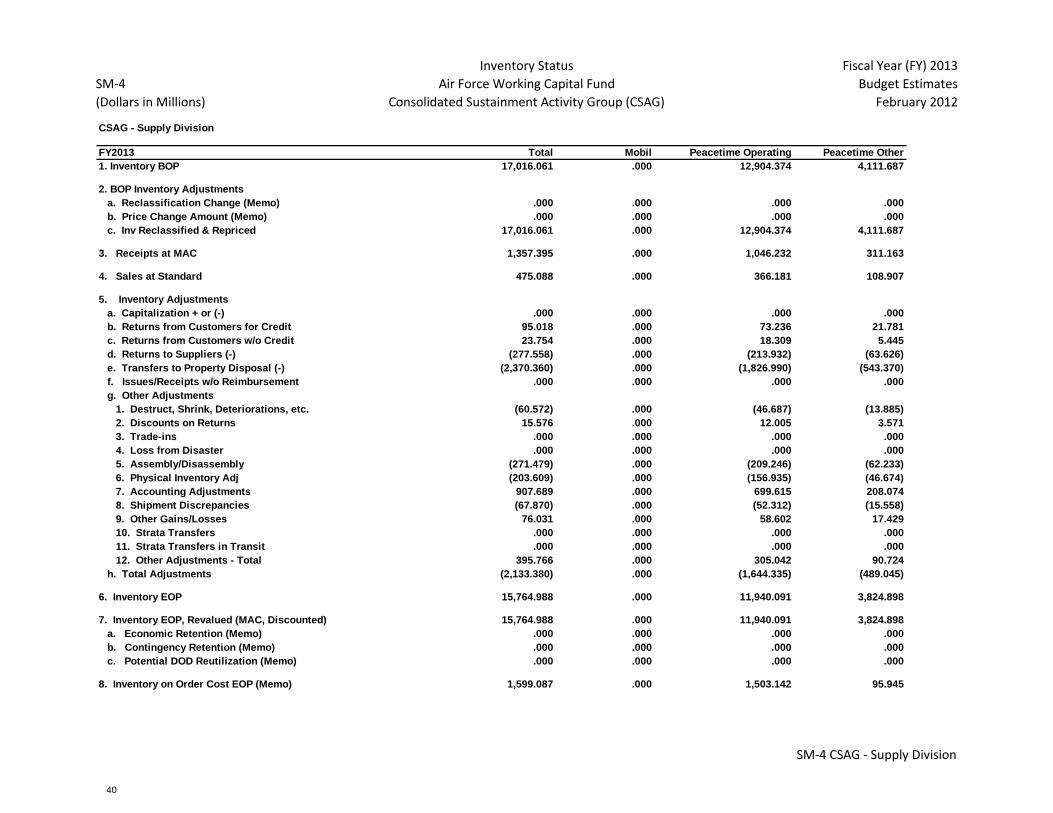
SM-4
(Dollars in Millions)
Inventory Status
Air Force Working Capital Fund
Consolidated Sustainment Activity Group (CSAG)
Fiscal Year (FY) 2013
Budget Estimates
February 2012
CSAG - Supply Division
FY2011 Total Mobil Peacetime Operating Peacetime Other
1. Inventory BOP 20,058.052 .000 15,249.035 4,809.017
2. BOP Inventory Adjustments
a. Reclassification Change (Memo) .000 .000 .000 .000
b. Price Change Amount (Memo) .000 .000 .000 .000
c. Inv Reclassified & Repriced 20,058.052 .000 15,249.035 4,809.017
3. Receipts at MAC 1,274.985 .000 982.714 292.271
4. Sales at Standard 446.245 .000 343.950 102.295
5. Inventory Adjustments
a. Capitalization + or (-) 31.212 .000 24.057 7.155
b. Returns from Customers for Credit 89.249 .000 68.790 20.459
c. Returns from Customers w/o Credit 22.312 .000 17.197 5.115
d. Returns to Suppliers (-) (307.536) .000 (237.038) (70.498)
e. Transfers to Property Disposal (-) (3,044.351) .000 (2,346.479) (697.872)
f. Issues/Receipts w/o Reimbursement .000 .000 .000 .000
g. Other Adjustments
1. Destruct, Shrink, Deteriorations, etc. (71.281) .000 (54.941) (16.340)
2. Discounts on Returns 70.677 .000 54.475 16.202
3. Trade-ins .000 .000 .000 .000
4. Loss from Disaster .000 .000 .000 .000
5. Assembly/Disassembly (254.997) .000 (196.543) (58.454)
6. Physical Inventory Adj (191.248) .000 (147.407) (43.841)
7. Accounting Adjustments 1,109.571 .000 855.218 254.353
8. Shipment Discrepancies (63.749) .000 (49.136) (14.614)
9. Other Gains/Losses 89.623 .000 69.079 20.545
10. Strata Transfers .000 .000 .000 .000
11. Strata Transfers in Transit .000 .000 .000 .000
12. Other Adjustments - Total 688.596 .000 530.745 157.851
h. Total Adjustments (2,520.517) .000 (1,942.727) (577.790)
6. Inventory EOP 18,366.275 .000 13,945.071 4,421.203
7. Inventory EOP, Revalued (MAC, Discounted) 18,366.275 .000 13,945.071 4,421.203
a. Economic Retention (Memo) 2,806.031 .000 .000 2,806.031
b. Contingency Retention (Memo) 1,951.529 .000 .000 1,951.529
c. Potential DOD Reutilization (Memo) 51.457 .000 .000 51.457
8. Inventory on Order Cost EOP (Memo) 1,559.959 .000 1,466.361 93.598
SM-4 CSAG - Supply Division
CONSOLIDATED SUSTAINMENT ACTIVITY GROUP
38

SM-4
(Dollars in Millions)
Inventory Status
Air Force Working Capital Fund
Consolidated Sustainment Activity Group (CSAG)
Fiscal Year (FY) 2013
Budget Estimates
February 2012
CSAG - Supply Division
FY2012 Total Mobil Peacetime Operating Peacetime Other
1. Inventory BOP 18,366.275 .000 13,945.071 4,421.203
2. BOP Inventory Adjustments
a. Reclassification Change (Memo) .000 .000 .000 .000
b. Price Change Amount (Memo) .000 .000 .000 .000
c. Inv Reclassified & Repriced 18,366.275 .000 13,945.071 4,421.203
3. Receipts at MAC 1,379.584 .000 1,063.335 316.249
4. Sales at Standard 482.854 .000 372.167 110.687
5. Inventory Adjustments
a. Capitalization + or (-) .000 .000 .000 .000
b. Returns from Customers for Credit 96.571 .000 74.433 22.137
c. Returns from Customers w/o Credit 24.143 .000 18.608 5.534
d. Returns to Suppliers (-) (272.918) .000 (210.356) (62.562)
e. Transfers to Property Disposal (-) (2,330.738) .000 (1,796.451) (534.287)
f. Issues/Receipts w/o Reimbursement .000 .000 .000 .000
g. Other Adjustments
1. Destruct, Shrink, Deteriorations, etc. (59.560) .000 (45.907) (13.653)
2. Discounts on Returns 15.316 .000 11.805 3.511
3. Trade-ins .000 .000 .000 .000
4. Loss from Disaster .000 .000 .000 .000
5. Assembly/Disassembly (275.917) .000 (212.667) (63.250)
6. Physical Inventory Adj (206.938) .000 (159.500) (47.438)
7. Accounting Adjustments 750.013 .000 578.084 171.929
8. Shipment Discrepancies (68.979) .000 (53.167) (15.812)
9. Other Gains/Losses 82.064 .000 63.252 18.812
10. Strata Transfers .000 .000 .000 .000
11. Strata Transfers in Transit .000 .000 .000 .000
12. Other Adjustments - Total 235.999 .000 181.900 54.099
h. Total Adjustments (2,246.943) .000 (1,731.865) (515.078)
6. Inventory EOP 17,016.061 .000 12,904.374 4,111.687
7. Inventory EOP, Revalued (MAC, Discounted) 17,016.061 .000 12,904.374 4,111.687
a. Economic Retention (Memo) 2,399.143 .000 .000 2,399.143
b. Contingency Retention (Memo) 1,668.548 .000 .000 1,668.548
c. Potential DOD Reutilization (Memo) 43.995 .000 .000 43.995
8. Inventory on Order Cost EOP (Memo) 1,595.943 .000 1,500.186 95.757
SM-4 CSAG - Supply Division
CONSOLIDATED SUSTAINMENT ACTIVITY GROUP
39
SM-4
(Dollars in Millions)
Inventory Status
Air Force Working Capital Fund
Consolidated Sustainment Activity Group (CSAG)
Fiscal Year (FY) 2013
Budget Estimates
February 2012
CSAG - Supply Division
FY2013 Total Mobil Peacetime Operating Peacetime Other
1. Inventory BOP 17,016.061 .000 12,904.374 4,111.687
2. BOP Inventory Adjustments
a. Reclassification Change (Memo) .000 .000 .000 .000
b. Price Change Amount (Memo) .000 .000 .000 .000
c. Inv Reclassified & Repriced 17,016.061 .000 12,904.374 4,111.687
3. Receipts at MAC 1,357.395 .000 1,046.232 311.163
4. Sales at Standard 475.088 .000 366.181 108.907
5. Inventory Adjustments
a. Capitalization + or (-) .000 .000 .000 .000
b. Returns from Customers for Credit 95.018 .000 73.236 21.781
c. Returns from Customers w/o Credit 23.754 .000 18.309 5.445
d. Returns to Suppliers (-) (277.558) .000 (213.932) (63.626)
e. Transfers to Property Disposal (-) (2,370.360) .000 (1,826.990) (543.370)
f. Issues/Receipts w/o Reimbursement .000 .000 .000 .000
g. Other Adjustments
1. Destruct, Shrink, Deteriorations, etc. (60.572) .000 (46.687) (13.885)
2. Discounts on Returns 15.576 .000 12.005 3.571
3. Trade-ins .000 .000 .000 .000
4. Loss from Disaster .000 .000 .000 .000
5. Assembly/Disassembly (271.479) .000 (209.246) (62.233)
6. Physical Inventory Adj (203.609) .000 (156.935) (46.674)
7. Accounting Adjustments 907.689 .000 699.615 208.074
8. Shipment Discrepancies (67.870) .000 (52.312) (15.558)
9. Other Gains/Losses 76.031 .000 58.602 17.429
10. Strata Transfers .000 .000 .000 .000
11. Strata Transfers in Transit .000 .000 .000 .000
12. Other Adjustments - Total 395.766 .000 305.042 90.724
h. Total Adjustments (2,133.380) .000 (1,644.335) (489.045)
6. Inventory EOP 15,764.988 .000 11,940.091 3,824.898
7. Inventory EOP, Revalued (MAC, Discounted) 15,764.988 .000 11,940.091 3,824.898
a. Economic Retention (Memo) .000 .000 .000 .000
b. Contingency Retention (Memo) .000 .000 .000 .000
c. Potential DOD Reutilization (Memo) .000 .000 .000 .000
8. Inventory on Order Cost EOP (Memo) 1,599.087 .000 1,503.142 95.945
SM-4 CSAG - Supply Division
CONSOLIDATED SUSTAINMENT ACTIVITY GROUP
40
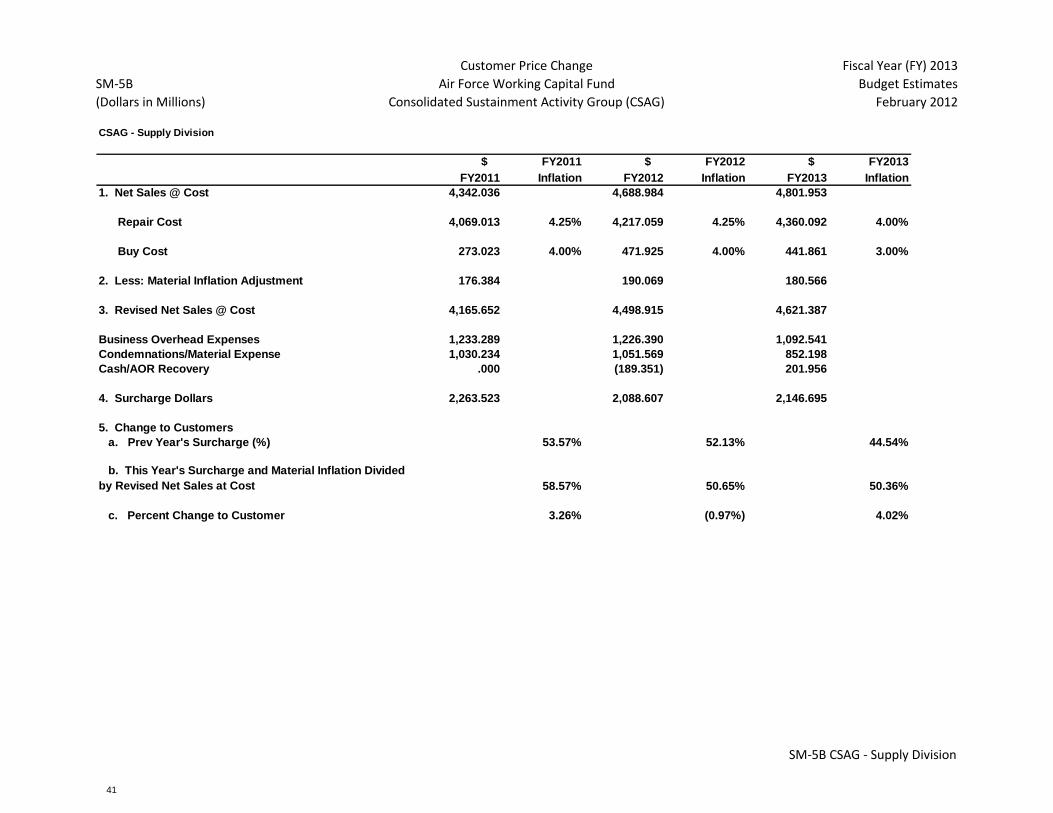
SM-5B
(Dollars in Millions)
Customer Price Change
Air Force Working Capital Fund
Consolidated Sustainment Activity Group (CSAG)
Fiscal Year (FY) 2013
Budget Estimates
February 2012
CSAG - Supply Division
$ FY2011 $ FY2012 $ FY2013
FY2011 Inflation FY2012 Inflation FY2013 Inflation
1. Net Sales @ Cost 4,342.036 4,688.984 4,801.953
Repair Cost 4,069.013 4.25% 4,217.059 4.25% 4,360.092 4.00%
Buy Cost 273.023 4.00% 471.925 4.00% 441.861 3.00%
2. Less: Material Inflation Adjustment 176.384 190.069 180.566
3. Revised Net Sales @ Cost 4,165.652 4,498.915 4,621.387
Business Overhead Expenses 1,233.289 1,226.390 1,092.541
Condemnations/Material Expense 1,030.234 1,051.569 852.198
Cash/AOR Recovery .000 (189.351) 201.956
4. Surcharge Dollars 2,263.523 2,088.607 2,146.695
5. Change to Customers
a. Prev Year's Surcharge (%) 53.57% 52.13% 44.54%
b. This Year's Surcharge and Material Inflation Divided
by Revised Net Sales at Cost 58.57% 50.65% 50.36%
c. Percent Change to Customer 3.26% (0.97%) 4.02%
SM-5B CSAG - Supply Division
CONSOLIDATED SUSTAINMENT ACTIVITY GROUP
41

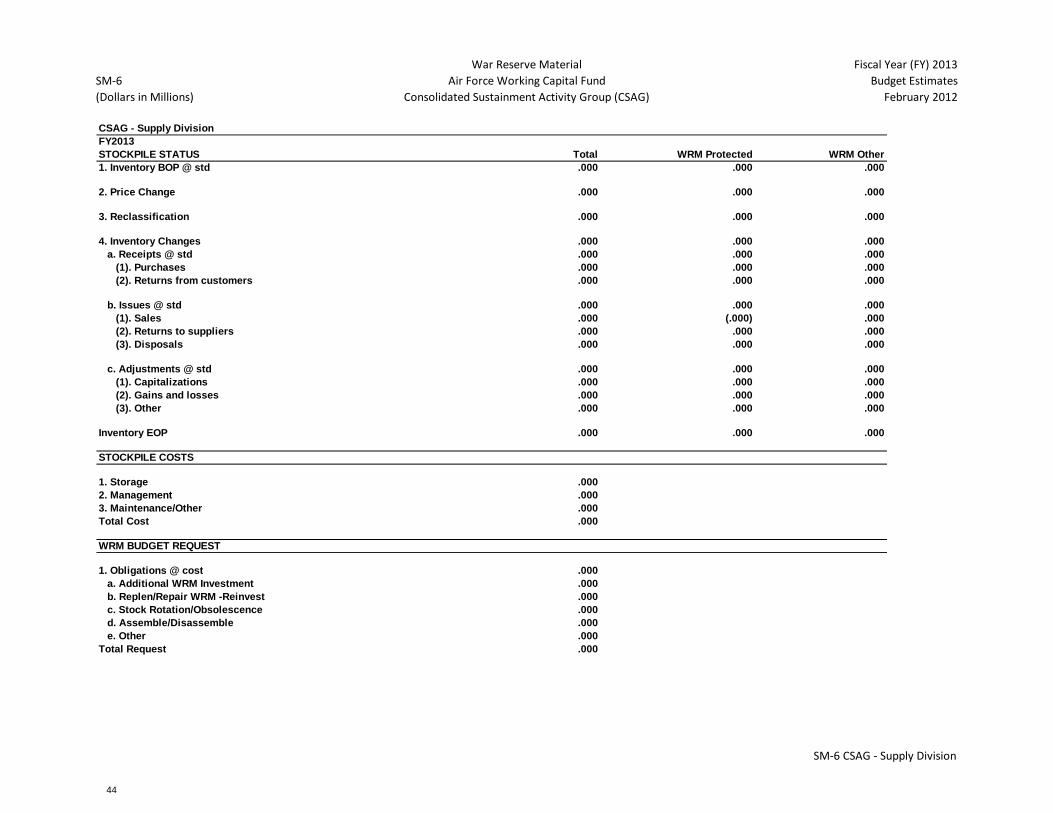
SM-6
(Dollars in Millions)
War Reserve Material
Air Force Working Capital Fund
Consolidated Sustainment Activity Group (CSAG)
Fiscal Year (FY) 2013
Budget Estimates
February 2012
CSAG - Supply Division
FY2011
STOCKPILE STATUS Total WRM Protected WRM Other
1. Inventory BOP @ std .000 .000 .000
2. Price Change .000 .000 .000
3. Reclassification .000 .000 .000
4. Inventory Changes .000 .000 .000
a. Receipts @ std .000 .000 .000
(1). Purchases .000 .000 .000
(2). Returns from customers .000 .000 .000
b. Issues @ std .000 .000 .000
(1). Sales .000 (.000) .000
(2). Returns to suppliers .000 .000 .000
(3). Disposals .000 .000 .000
c. Adjustments @ std .000 .000 .000
(1). Capitalizations .000 .000 .000
(2). Gains and losses .000 .000 .000
(3). Other .000 .000 .000
Inventory EOP .000 .000 .000
STOCKPILE COSTS
1. Storage .000
2. Management .000
3. Maintenance/Other .000
Total Cost .000
WRM BUDGET REQUEST
1. Obligations @ cost .000
a. Additional WRM Investment .000
b. Replen/Repair WRM -Reinvest .000
c. Stock Rotation/Obsolescence .000
d. Assemble/Disassemble .000
e. Other .000
Total Request .000
SM-6 CSAG - Supply Division
CONSOLIDATED SUSTAINMENT ACTIVITY GROUP
42

SM-6
(Dollars in Millions)
War Reserve Material
Air Force Working Capital Fund
Consolidated Sustainment Activity Group (CSAG)
Fiscal Year (FY) 2013
Budget Estimates
February 2012
CSAG - Supply Division
FY2012
STOCKPILE STATUS Total WRM Protected WRM Other
1. Inventory BOP @ std .000 .000 .000
2. Price Change .000 .000 .000
3. Reclassification .000 .000 .000
4. Inventory Changes .000 .000 .000
a. Receipts @ std .000 .000 .000
(1). Purchases .000 .000 .000
(2). Returns from customers .000 .000 .000
b. Issues @ std .000 .000 .000
(1). Sales .000 (.000) .000
(2). Returns to suppliers .000 .000 .000
(3). Disposals .000 .000 .000
c. Adjustments @ std .000 .000 .000
(1). Capitalizations .000 .000 .000
(2). Gains and losses .000 .000 .000
(3). Other .000 .000 .000
Inventory EOP .000 .000 .000
STOCKPILE COSTS
1. Storage .000
2. Management .000
3. Maintenance/Other .000
Total Cost .000
WRM BUDGET REQUEST
1. Obligations @ cost .000
a. Additional WRM Investment .000
b. Replen/Repair WRM -Reinvest .000
c. Stock Rotation/Obsolescence .000
d. Assemble/Disassemble .000
e. Other .000
Total Request .000
SM-6 CSAG - Supply Division
CONSOLIDATED SUSTAINMENT ACTIVITY GROUP
43
SM-6
(Dollars in Millions)
War Reserve Material
Air Force Working Capital Fund
Consolidated Sustainment Activity Group (CSAG)
Fiscal Year (FY) 2013
Budget Estimates
February 2012
CSAG - Supply Division
FY2013
STOCKPILE STATUS Total WRM Protected WRM Other
1. Inventory BOP @ std .000 .000 .000
2. Price Change .000 .000 .000
3. Reclassification .000 .000 .000
4. Inventory Changes .000 .000 .000
a. Receipts @ std .000 .000 .000
(1). Purchases .000 .000 .000
(2). Returns from customers .000 .000 .000
b. Issues @ std .000 .000 .000
(1). Sales .000 (.000) .000
(2). Returns to suppliers .000 .000 .000
(3). Disposals .000 .000 .000
c. Adjustments @ std .000 .000 .000
(1). Capitalizations .000 .000 .000
(2). Gains and losses .000 .000 .000
(3). Other .000 .000 .000
Inventory EOP .000 .000 .000
STOCKPILE COSTS
1. Storage .000
2. Management .000
3. Maintenance/Other .000
Total Cost .000
WRM BUDGET REQUEST
1. Obligations @ cost .000
a. Additional WRM Investment .000
b. Replen/Repair WRM -Reinvest .000
c. Stock Rotation/Obsolescence .000
d. Assemble/Disassemble .000
e. Other .000
Total Request .000
SM-6 CSAG - Supply Division
CONSOLIDATED SUSTAINMENT ACTIVITY GROUP
44
AIR FORCE WORKING CAPITAL FUND
SUPPLY MANAGEMENT ACTIVITY
GROUP RETAIL
SUPPLY MANAGEMENT ACTIVITY GROUP - RETAIL
45

THIS PAGE INTENTIONALLY LEFT BLANK
SUPPLY MANAGEMENT ACTIVITY GROUP - RETAIL
46
SMAG–R Overview - FY013 Budget Estimates
Supply Management Activity Group–Retail Overview Fiscal Year (FY) 2013 Budget Estimates
Activity Group Overview The Air Force Supply Management Activity Group–Retail (SMAG-R) is comprised of three divisions: General Support, Medical-Dental, and the United States Air Force Academy. SMAG–Retail Mission Description The Air Force SMAG-R manages nearly 1.1 million inventory items including weapon system spare parts, medical-dental supplies and equipment, and other supply items used in non-weapon system applications. SMAG-R is a critical component in the support of combat readiness. It procures materiel and makes spares available to authorized customers. Within SMAG-R, the Medical-Dental Division inventory includes a War Reserve Material (WRM) Stockpile. WRM provides initial war fighting capability until re-supply lines can sustain wartime demands for medical and dental supplies and equipment. SMAG-R provides a wide range of logistics support services including requirements forecasting, item introduction, cataloging, provisioning, procurement, repair, technical support, data management, item disposal, distribution management and transportation. Inventories are an integral part of SMAG-R and are maintained by each of the divisions in support of customer requirements. The SMAG-R objective is to replenish inventories and provide supplies to customers in a timely manner within customer funding constraints, while maintaining fund solvency. SMAG-R generates revenue from sales of various supplies to a diverse customer base. Primary SMAG-R customers are Air Force Major Commands (including Air Force Reserve and Air National Guard), Foreign Military Sales, Army, Navy and non-DoD activities, as well as other working capital activity groups, such as Air Force Consolidated Sustainment Activity Group – Maintenance Division.
SUPPLY MANAGEMENT ACTIVITY GROUP - RETAIL
47

SMAG–R Overview - FY013 Budget Estimates
Division Overviews The General Support Division (GSD) manages nearly 1.1 million different items which are procured from Defense Logistics Agency (DLA) and General Services Administration (GSA). GSD customers use the majority of these items to support field and depot maintenance of aircraft; ground and airborne communication; and electronic systems as well as other sophisticated systems and equipment. The General Support Division also manages many items related to installation, maintenance, and administrative functions. In addition, GSD manages stock levels and procurement for critical Overseas Contingency Operation (OCO) requirements. The Medical-Dental Division (MDD) manages approximately 8,700 items for 74 Medical Treatment Facilities (MTF) worldwide supported by 85 individual MDD working capital fund accounts. All supply and equipment requirements generated by AF treatment facilities are procured through this division. The Medical-Dental Division also maintains the WRM requirements. The Air Force Academy Division finances the purchase of uniforms and uniform accessories for sale to cadets in accordance with regulations of the Air Force Academy and related statutes. The customer base consists of approximately 4,500 cadets. The Air Force Academy Division procures both distinctive uniforms and accessories from various manufacturing contractors as well as regular Air Force uniforms purchased through the Defense Logistics Agency. War Reserve Materiel (WRM) / Direct Appropriation The Medical-Dental Division’s WRM provides supplies and equipment vital to support forces in the full range of military operations for the first 30 days of a contingency operation, and provides force health protection materiel to all deploying Air Force active, reserve, and guard personnel. Availability of this materiel ensures Air Force personnel can deploy as scheduled and that contingency operations can be conducted until re-supply lines are established and materiel is routinely received from the contiguous United States. The Medical-Dental Division finances contingency medical assets with a direct Congressional appropriation that enables procurement of medical WRM for the Air Force. The Surgeon General of the Air Force is responsible for programming and executing funding to provide contingency health care in accordance with Combatant Commander Operational Plans.
SUPPLY MANAGEMENT ACTIVITY GROUP - RETAIL
48

SMAG–R Overview - FY013 Budget Estimates
The direct appropriation funds establishment and sustainment of 2,917 assemblages and Force Health Protection assets that are maintained in the Medical-Dental Division until required to provide direct support to the war fighters. Approximately one third of WRM pharmaceuticals must be replaced annually because of shelf life or emergence of newer, more effective treatments. Medical equipment requires constant upgrade to maintain the medical standard of care for required deployable capability. New technology constantly allows for replacement of equipment with smaller, more proficient models which often drives a change in other supply requirements. In FY 2011 and FY 2012, the Medical-Dental Division received $66.9 million and $65.4 million, respectively, in direct appropriations for the WRM program. In FY 2013, the WRM direct appropriation funding requested is $45.5 million. Additionally, revenue earned from the sale of WRM is reinvested in the WRM program to replenish inventory issued. In FY 2012 and 2013, $10.0 million and $25.2 million are anticipated to be reinvested, respectively. Between FY 2012 and FY 2013, the Medical-Dental Division will modernize the Critical Care Air Transport Team capabilities, transition to an Expeditionary Patient Staging capability, and complete the fielding of the Stacking Litter System, Next Generation Patient Liquid Oxygen System, the Aeromedical Evacuation Liaison Team, and Expeditionary Medical Support (EMEDS) Healthcare Response Team (HRT). In addition, the program will focus on improving Nuclear, Biological, and Chemical (NBC) defense capability by modernizing NBC defense equipment assemblages and the patient decontamination capability. Other programs include modernizing specialty set capability, telemedicine, and the expeditionary blood program. Way Ahead Initiatives continue within the SMAG-Retail to modernize processes. Supply chain processes are transforming to improve weapon system and equipment availability, and to deliver customer support with increased velocity. The Air Force SMAG-R continues to emphasize cost control in order to provide the best value to the customer and achieve Department of Defense efficiency initiative goals. Supply Chain efficiency initiatives include optimizing on-hand AF inventory to reduce costs, improving asset visibility to reduce requisition redundancies, and expediting asset movement through the distribution pipeline. In addition, the Medical-Dental Division will continue to use various Just-In-Time purchasing vehicles such as Prime Vendor (PV), Decentralized Blank Purchase Agreements (DBPAs), and Government Purchase Cards (GPCs) to streamline operations and maximize/realize all possible efficiencies and economy.
SUPPLY MANAGEMENT ACTIVITY GROUP - RETAIL
49
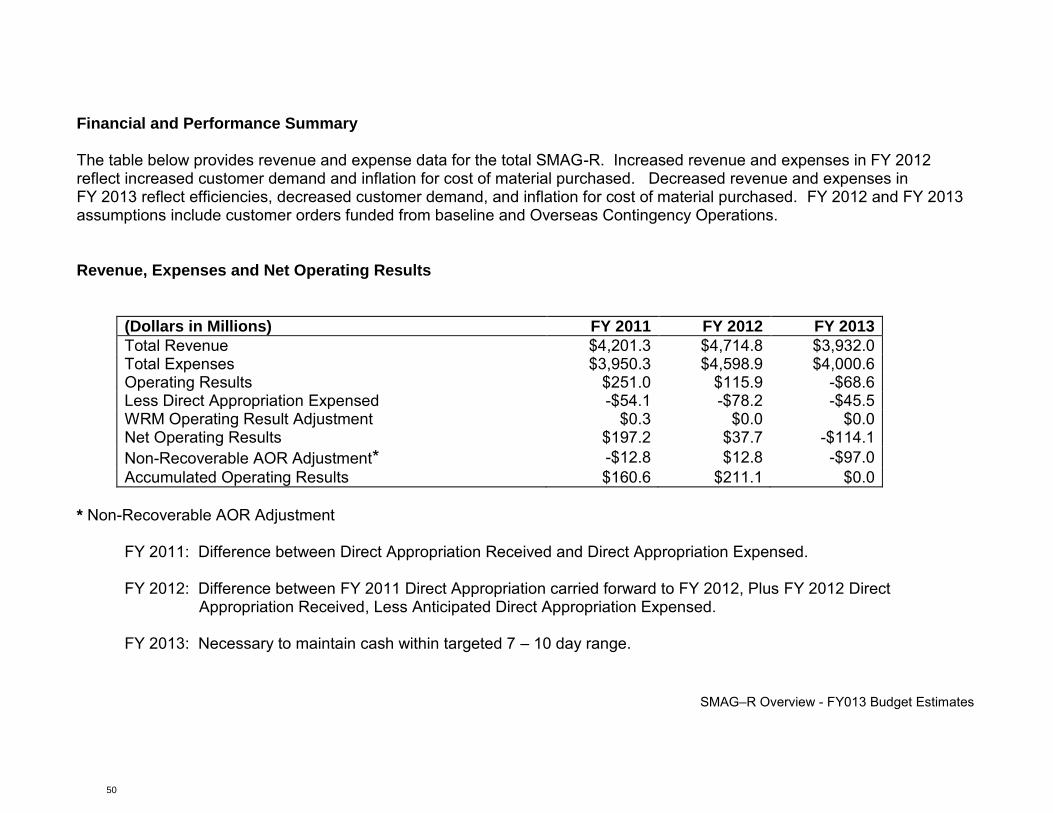
SMAG–R Overview - FY013 Budget Estimates
Financial and Performance Summary The table below provides revenue and expense data for the total SMAG-R. Increased revenue and expenses in FY 2012 reflect increased customer demand and inflation for cost of material purchased. Decreased revenue and expenses in FY 2013 reflect efficiencies, decreased customer demand, and inflation for cost of material purchased. FY 2012 and FY 2013 assumptions include customer orders funded from baseline and Overseas Contingency Operations. Revenue, Expenses and Net Operating Results
(Dollars in Millions) FY 2011 FY 2012 FY 2013
Total Revenue $4,201.3 $4,714.8 $3,932.0 Total Expenses $3,950.3 $4,598.9 $4,000.6 Operating Results $251.0 $115.9 -$68.6 Less Direct Appropriation Expensed -$54.1 -$78.2 -$45.5 WRM Operating Result Adjustment $0.3 $0.0 $0.0 Net Operating Results $197.2 $37.7 -$114.1 Non-Recoverable AOR Adjustment* -$12.8 $12.8 -$97.0 Accumulated Operating Results $160.6 $211.1 $0.0
* Non-Recoverable AOR Adjustment FY 2011: Difference between Direct Appropriation Received and Direct Appropriation Expensed. FY 2012: Difference between FY 2011 Direct Appropriation carried forward to FY 2012, Plus FY 2012 Direct Appropriation Received, Less Anticipated Direct Appropriation Expensed. FY 2013: Necessary to maintain cash within targeted 7 – 10 day range.
SUPPLY MANAGEMENT ACTIVITY GROUP - RETAIL
50

SMAG–R Overview - FY013 Budget Estimates
Cash Management
(Dollars in Millions) FY 2011 FY 2012 FY 2013
BOP Cash Balance $70.1 $203.3 $242.0 Disbursements $4,077.9 $4,670.1 $4,066.0 Collections $3,896.7 $4,843.4 $3,931.4 WRM $66.9 $65.4 $45.5 Change in Cash $133.2 $38.7 -$154.1 EOP Cash Balance $203.3 $242.0 $87.9 7 Days of Cash $158.6 $159.9 $142.9 10 Days of Cash $210.0 $211.8 $190.8
Analysis of Undelivered Orders Undelivered Orders are orders/obligations incurred for which goods have not been delivered or services not performed. This amount includes any orders for which advance payment has been made but for which delivery or performance has not yet occurred.
Dollars in Millions FY 2011 FY 2012 FY 2013
General Support Division $783.3 $669.5 $697.8 Medical-Dental Division $132.7 $126.0 $130.5 Academy Division $0.0 $0.1 $0.1 Total SMAG-Retail $916.0 $795.6 $828.4
Undelivered Orders for throughout all fiscal years average remain relatively consistent when compared to Total Net Orders for the fiscal year.
SUPPLY MANAGEMENT ACTIVITY GROUP - RETAIL
51
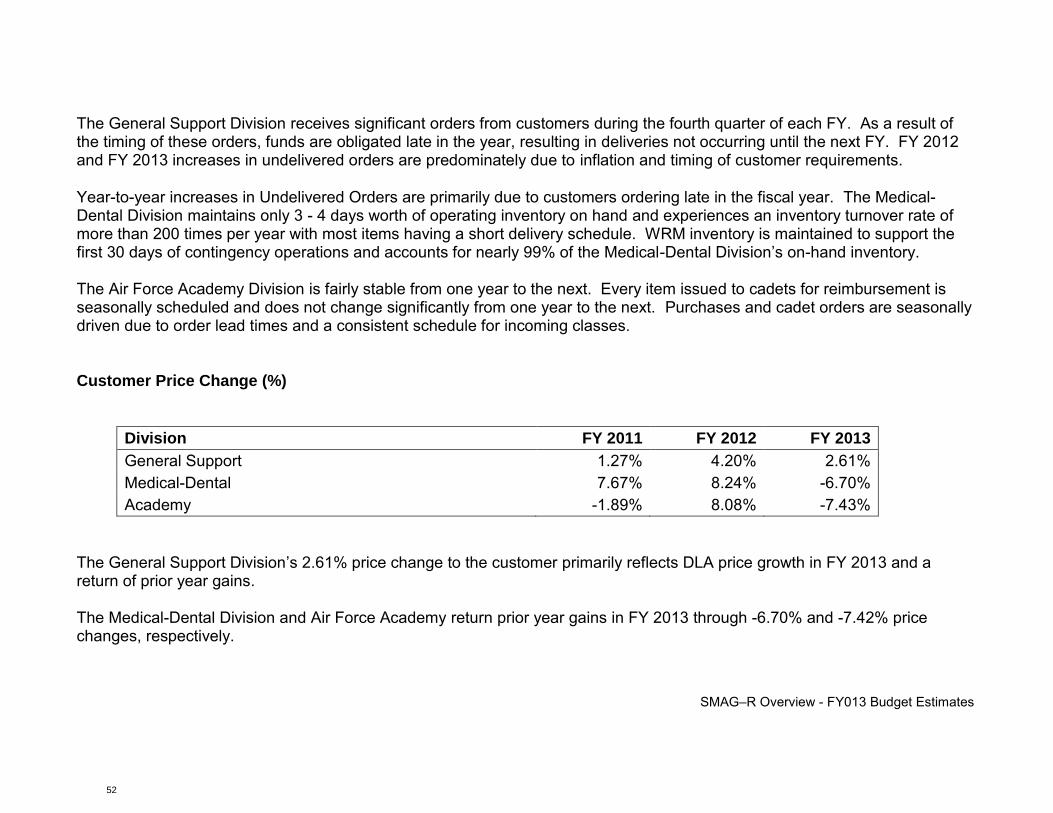
SMAG–R Overview - FY013 Budget Estimates
The General Support Division receives significant orders from customers during the fourth quarter of each FY. As a result of the timing of these orders, funds are obligated late in the year, resulting in deliveries not occurring until the next FY. FY 2012 and FY 2013 increases in undelivered orders are predominately due to inflation and timing of customer requirements.
Year-to-year increases in Undelivered Orders are primarily due to customers ordering late in the fiscal year. The Medical-Dental Division maintains only 3 - 4 days worth of operating inventory on hand and experiences an inventory turnover rate of more than 200 times per year with most items having a short delivery schedule. WRM inventory is maintained to support the first 30 days of contingency operations and accounts for nearly 99% of the Medical-Dental Division’s on-hand inventory. The Air Force Academy Division is fairly stable from one year to the next. Every item issued to cadets for reimbursement is seasonally scheduled and does not change significantly from one year to the next. Purchases and cadet orders are seasonally driven due to order lead times and a consistent schedule for incoming classes. Customer Price Change (%)
Division FY 2011 FY 2012 FY 2013
General Support 1.27% 4.20% 2.61% Medical-Dental 7.67% 8.24% -6.70% Academy -1.89% 8.08% -7.43%
The General Support Division’s 2.61% price change to the customer primarily reflects DLA price growth in FY 2013 and a return of prior year gains. The Medical-Dental Division and Air Force Academy return prior year gains in FY 2013 through -6.70% and -7.42% price changes, respectively.
SUPPLY MANAGEMENT ACTIVITY GROUP - RETAIL
52
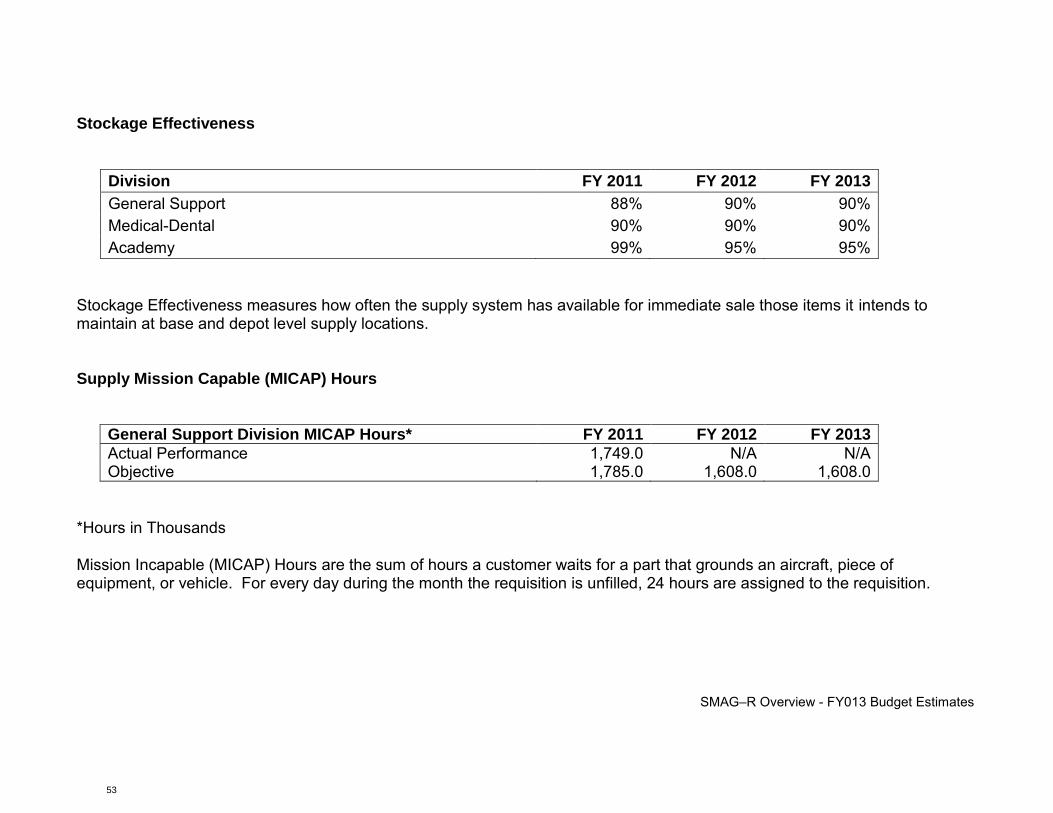
SMAG–R Overview - FY013 Budget Estimates
Stockage Effectiveness
Division FY 2011 FY 2012 FY 2013
General Support 88% 90% 90% Medical-Dental 90% 90% 90% Academy 99% 95% 95%
Stockage Effectiveness measures how often the supply system has available for immediate sale those items it intends to maintain at base and depot level supply locations. Supply Mission Capable (MICAP) Hours
General Support Division MICAP Hours* FY 2011 FY 2012 FY 2013 Actual Performance 1,749.0 N/A N/A Objective 1,785.0 1,608.0 1,608.0
*Hours in Thousands
Mission Incapable (MICAP) Hours are the sum of hours a customer waits for a part that grounds an aircraft, piece of equipment, or vehicle. For every day during the month the requisition is unfilled, 24 hours are assigned to the requisition.
SUPPLY MANAGEMENT ACTIVITY GROUP - RETAIL
53

SMAG–R Overview - FY013 Budget Estimates
Customer Wait Time
General Support Division FY 2011 FY 2012 FY 2013
Actual Performance 7.7 N/A N/A Objective 7.0 7.0 7.0
Customer Wait Time (CWT) is the average number of days accrued from the time a customer orders a spare part until the part is received. FY 2011 actual performance exceeds the objective due to increased CSAG-Maintenance backorders resulting from the inventory transfer to DLA associated with the BRAC Supply, Storage, and Distribution initiative. The table above presents annual CWT. The average CWT time has stabilized and improved to 7.1 days in the 4th quarter of FY 2011. Item Quantity Requirements
Item FY 2011 FY 2012 FY 2013
Number of Issues 7,724,976 7,940,366 8,187,567
Number of Receipts 6,560,625 6,744,408 6,985,646
Number of Requisitions 6,718,696 6,978,319 7,241,993
Contracts Executed * 11,001 11,290 11,609
Purchase Inflation 4.44% 3.81% 4.16%
Items Managed 1,095,569 1,095,569 1,095,569 * Contracts Executed do not include Medical-Dental Division contracts. The Air Force Medical Operations Agency (AFMOA) is no longer provided this information from the Defense Medical Logistics Support System (DMLSS). A system change is underway with an estimated completion date of FY 2014.
SUPPLY MANAGEMENT ACTIVITY GROUP - RETAIL
54
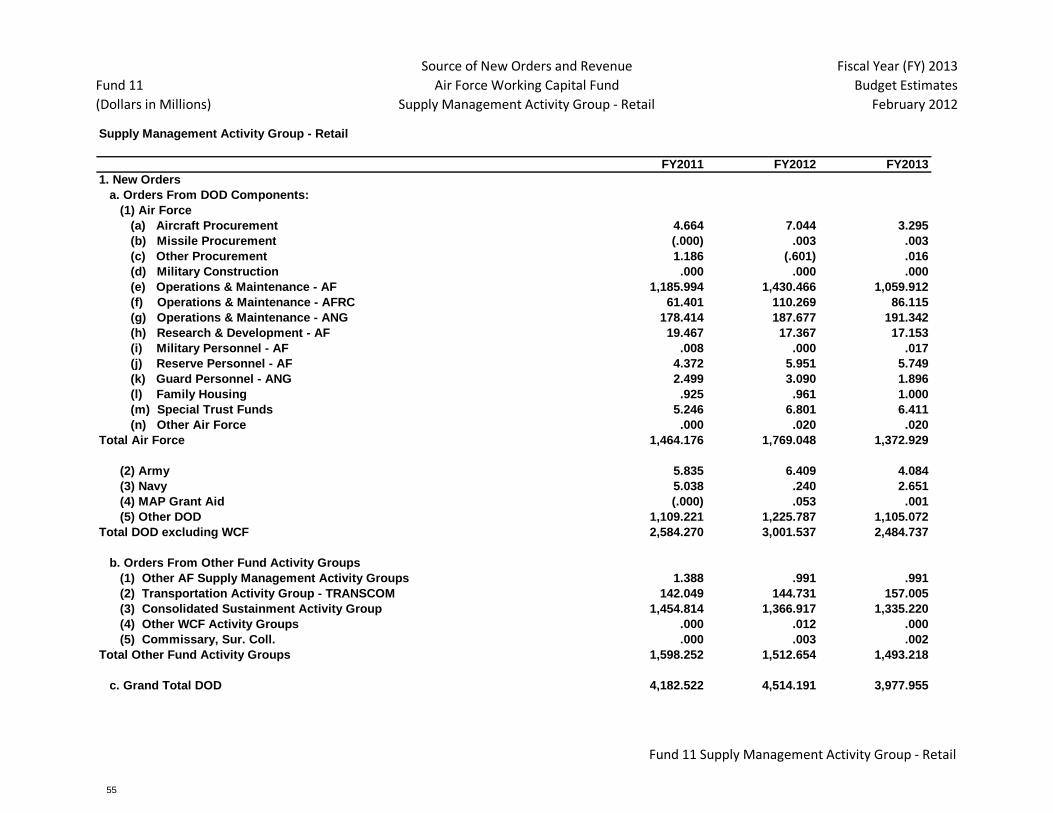
Fund 11
(Dollars in Millions)
Source of New Orders and Revenue
Air Force Working Capital Fund
Supply Management Activity Group - Retail
Fiscal Year (FY) 2013
Budget Estimates
February 2012
Supply Management Activity Group - Retail
FY2011 FY2012 FY2013
1. New Orders 1. New Orders
a. Orders From DOD Components: a. Orders From DOD Components:
(1) Air Force (1) Air Force
(a) Aircraft Procurement (a) Aircraft Procurement4.664 7.044 3.295
(b) Missile Procurement (b) Missile Procurement(.000) .003 .003
(c) Other Procurement (c) Other Procurement1.186 (.601) .016
(d) Military Construction (d) Military Construction.000 .000 .000
(e) Operations & Maintenance - AF (e) Operations & Maintenance - AF1,185.994 1,430.466 1,059.912
(f) Operations & Maintenance - AFRC (f) Operations & Maintenance - AFRC61.401 110.269 86.115
(g) Operations & Maintenance - ANG (g) Operations & Maintenance - ANG178.414 187.677 191.342
(h) Research & Development - AF (h) Research & Development - AF19.467 17.367 17.153
(i) Military Personnel - AF (i) Military Personnel - AF.008 .000 .017
(j) Reserve Personnel - AF (j) Reserve Personnel - AF4.372 5.951 5.749
(k) Guard Personnel - ANG (k) Guard Personnel - ANG2.499 3.090 1.896
(l) Family Housing (l) Family Housing.925 .961 1.000
(m) Special Trust Funds (m) Special Trust Funds5.246 6.801 6.411
(n) Other Air Force (n) Other Air Force.000 .020 .020
Total Air Force Total Air Force1,464.176 1,769.048 1,372.929
(2) Army (2) Army 5.835 6.409 4.084
(3) Navy (3) Navy 5.038 .240 2.651
(4) MAP Grant Aid (4) MAP Grant Aid(.000) .053 .001
(5) Other DOD (5) Other DOD1,109.221 1,225.787 1,105.072
Total DOD excluding WCF Total DOD excluding WCF2,584.270 3,001.537 2,484.737
b. Orders From Other Fund Activity Groups b. Orders From Other Fund Activity Groups
(1) Other AF Supply Management Activity Groups (1) Other AF Supply Management Activity Groups1.388 .991 .991
(2) Transportation Activity Group - TRANSCOM (2) Transportation Activity Group - TRANSCOM142.049 144.731 157.005
(3) Consolidated Sustainment Activity Group (3) Consolidated Sustainment Activity Group1,454.814 1,366.917 1,335.220
(4) Other WCF Activity Groups (4) Other WCF Activity Groups.000 .012 .000
(5) Commissary, Sur. Coll. (5) Commissary, Sur. Coll..000 .003 .002
Total Other Fund Activity Groups Total Other Fund Activity Groups1,598.252 1,512.654 1,493.218
c. Grand Total DOD c. Grand Total DOD4,182.522 4,514.191 3,977.955
Fund 11 Supply Management Activity Group - Retail
SUPPLY MANAGEMENT ACTIVITY GROUP - RETAIL
55

Fund 11
(Dollars in Millions)
Source of New Orders and Revenue
Air Force Working Capital Fund
Supply Management Activity Group - Retail
Fiscal Year (FY) 2013
Budget Estimates
February 2012
Supply Management Activity Group - Retail
FY2011 FY2012 FY2013
d. Other Orders d. Other Orders
(1) Other Federal Agencies (1) Other Federal Agencies6.261 3.765 5.239
(2) Non Federal Agencies (2) Non Federal Agencies.370 3.086 .995
(3) FMS (3) FMS 1.692 .776 1.026
Total Other Orders Total Other Orders8.323 7.627 7.260
Total New Gross Orders Total New Gross Orders4,190.845 4,521.817 3,985.215
2. Carry-In Orders (BOP) 2. Carry-In Orders896.480 944.155 774.170
3. Total Gross Orders 3. Total Gross Orders5,087.325 5,465.972 4,759.385
4. Carry-Out Orders (-) (EOP) 4. Carry-Out Orders (EOP)944.155 774.170 814.818
5. Gross Sales (-) 5. Gross Sales (-)4,143.170 4,691.802 3,944.567
6. Credit Returns (-) 6. Credit Returns (-)53.428 60.047 58.066
7. Net Sales 7. Net Sales 4,089.742 4,631.755 3,886.501
Fund 11 Supply Management Activity Group - Retail
SUPPLY MANAGEMENT ACTIVITY GROUP - RETAIL
56
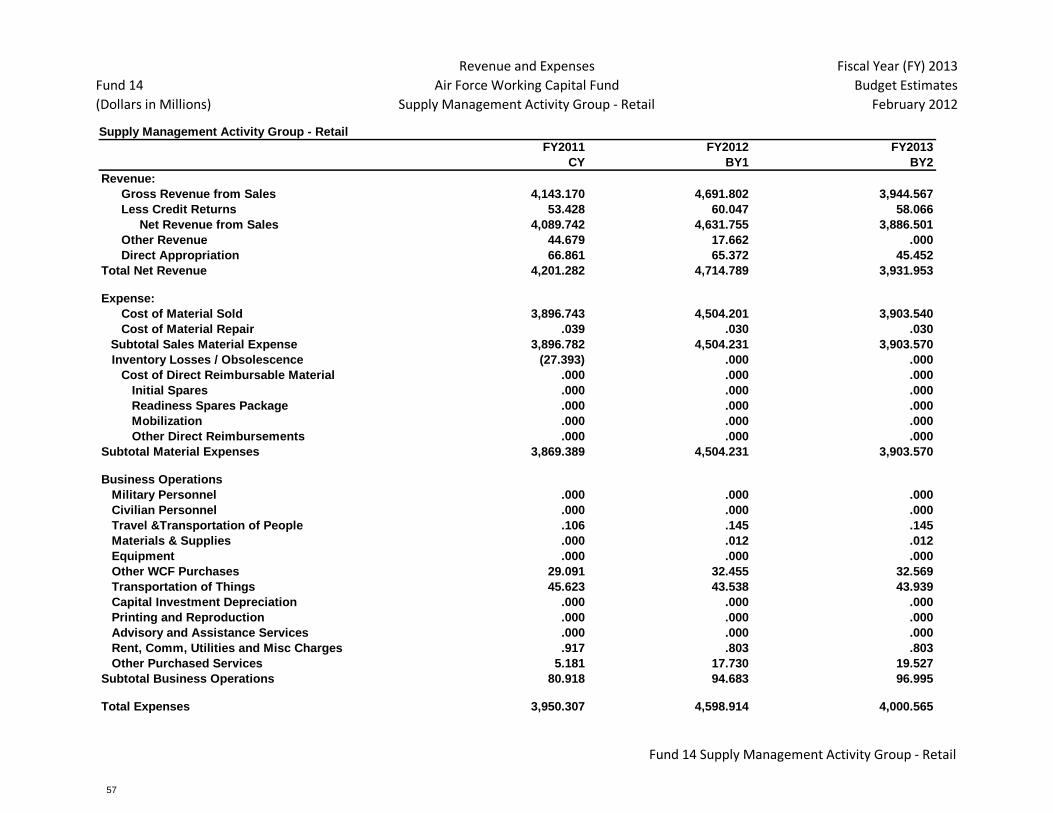
Fund 14
(Dollars in Millions)
Revenue and Expenses
Air Force Working Capital Fund
Supply Management Activity Group - Retail
Fiscal Year (FY) 2013
Budget Estimates
February 2012
Supply Management Activity Group - Retail
FY2011 FY2012 FY2013
CY BY1 BY2
Revenue:Revenue: Revenue:
Gross Revenue from Sales Gross Revenue from Sales Gross Revenue from Sales4,143.170 4,691.802 3,944.567
Less Credit Returns Less Credit Returns Less Credit Returns53.428 60.047 58.066
Net Revenue from SalesNet Revenue from Sales Net Revenue from Sales4,089.742 4,631.755 3,886.501
Other Revenue Other Revenue Other Revenue44.679 17.662 .000
Direct Appropriation Direct Appropriation Direct Reimbursables66.861 65.372 45.452
Total Net RevenueTotal Net Revenue Total Net Revenue4,201.282 4,714.789 3,931.953
Expense:Expense: Expense:
Cost of Material Sold Cost of Material Sold Cost of Material Sold3,896.743 4,504.201 3,903.540
Cost of Material Repair Cost of Material Repair Cost of Material Repair.039 .030 .030
Subtotal Sales Material ExpenseSubtotal Sales Material Expense Subtotal Sales Material Expense3,896.782 4,504.231 3,903.570
Inventory Losses / Obsolescence Inventory Losses / Obsolescence Inventory Losses / Obsolescence(27.393) .000 .000
Cost of Direct Reimbursable Material Cost of Direct Reimbursable Material Cost of Direct Reimbursable Material.000 .000 .000
Initial Spares Initial Spares Initial Spares.000 .000 .000
Readiness Spares Package Readiness Spares Package Readiness Spares Package.000 .000 .000
Mobilization Mobilization Mobilization .000 .000 .000
Other Direct Reimbursements Other Direct Reimbursements Other Direct Reimbursements.000 .000 .000
Subtotal Material ExpensesSubtotal Material Expenses Subtotal Material Expenses3,869.389 4,504.231 3,903.570
Business OperationsBusiness Operations Business Operations
Military Personnel Military Personnel Military Personnel.000 .000 .000
Civilian Personnel Civilian Personnel Civilian Personnel.000 .000 .000
Travel &Transportation of People Travel &Transportation of People Travel &Transportation of People.106 .145 .145
Materials & Supplies Materials & Supplies Materials & Supplies.000 .012 .012
Equipment Equipment Equipment .000 .000 .000
Other WCF Purchases Other WCF Purchases Other WCF Purchases29.091 32.455 32.569
Transportation of Things Transportation of Things Transportation of Things45.623 43.538 43.939
Capital Investment Depreciation Capital Investment Depreciation Capital Investment Depreciation.000 .000 .000
Printing and Reproduction Printing and Reproduction Printing and Reproduction.000 .000 .000
Advisory and Assistance Services Advisory and Assistance Services Advisory and Assistance Services.000 .000 .000
Rent, Comm, Utilities and Misc Charges Rent, Comm, Utilities and Misc Charges Rent, Comm, Utilities and Misc Charges.917 .803 .803
Other Purchased Services Other Purchased Services Other Purchased Services5.181 17.730 19.527
Subtotal Business OperationsSubtotal Business Operations Subtotal Business Operations80.918 94.683 96.995
Total ExpensesTotal Expenses Total Expenses3,950.307 4,598.914 4,000.565
Fund 14 Supply Management Activity Group - Retail
SUPPLY MANAGEMENT ACTIVITY GROUP - RETAIL
57

Fund 14
(Dollars in Millions)
Revenue and Expenses
Air Force Working Capital Fund
Supply Management Activity Group - Retail
Fiscal Year (FY) 2013
Budget Estimates
February 2012
Supply Management Activity Group - Retail
FY2011 FY2012 FY2013
CY BY1 BY2
Operating ResultOperating Result Operating Result250.975 115.875 (68.612)
Less Capital SurchargeLess Capital Surcharge Less Capital Surcharge.000 .000 .000
Less Direct AppropriationsLess Direct Appropriations Less Direct Appropriations(54.059) (78.174) (45.452)
Plus Passthroughs or Other Approps (NOR)Plus Passthroughs or Other Approps (NOR) Plus Passthroughs or Other Approps (NOR).000 .000 .000
Less Mobilization / WRM (NOR)Adjustment for Mobilization / WRM NOR Mobilization (NOR).253 .000 .000
Other Changes (NOR)Other Changes (NOR) Other Changes (NOR).000 .000 .000
NET OPERATING RESULT (NOR)NET OPERATING RESULT (NOR) NET OPERATING RESULT (NOR)197.170 37.701 (114.064)
Prior Year Adjustments (AOR)Prior Year Adjustments (AOR) Prior Year Adjustments (AOR).000 .000 .000
Other Changes (AOR)Other Changes (AOR) Other Changes (AOR).000 .000 .000
Plus Prior Year AORPlus Prior Year AOR Plus Prior Year AOR(23.806) 160.561 211.064
Accumulated Operating Result (AOR)Accumulated Operating Result (AOR) Accumulated Operating Result (AOR)173.363 198.262 97.000
Non-Recoverable Adjustment (AOR) Non-Recoverable Adjustment (AOR) Non-Recoverable Adjustment (AOR)(12.802) 12.802 (97.000)
Accumulated Operating Result for Budget PurposesAccumulated Operating Result for Budget Purposes Accumulated Operating Result for Budget Purposes160.561 211.064 .000
Fund 14 Supply Management Activity Group - Retail
SUPPLY MANAGEMENT ACTIVITY GROUP - RETAIL
58
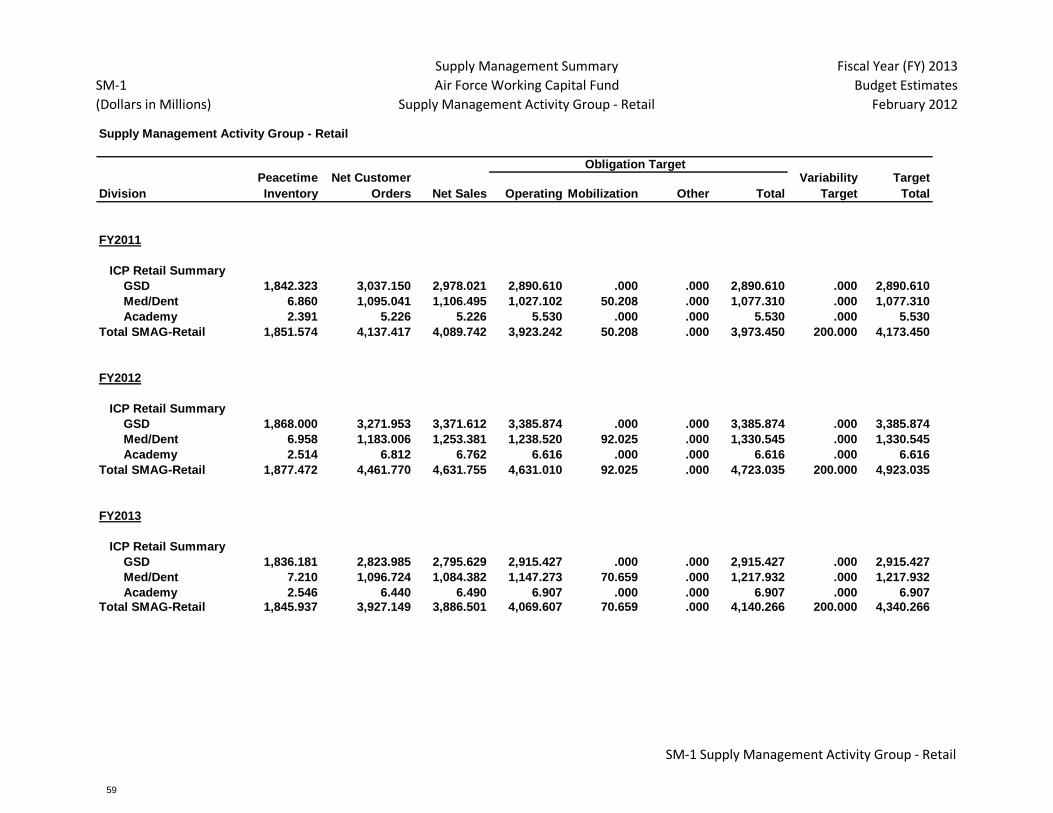
SM-1
(Dollars in Millions)
Supply Management Summary
Air Force Working Capital Fund
Supply Management Activity Group - Retail
Fiscal Year (FY) 2013
Budget Estimates
February 2012
Supply Management Activity Group - Retail
Division
Peacetime
Inventory
Net Customer
Orders Net Sales Operating Mobilization Other Total
Variability
Target
Target
Total
FY2011
ICP Retail Summary
1,842.323 3,037.150 2,978.021 2,890.610 .000 .000 2,890.610 .000 2,890.610
6.860 1,095.041 1,106.495 1,027.102 50.208 .000 1,077.310 .000 1,077.310
2.391 5.226 5.226 5.530 .000 .000 5.530 .000 5.530
Total SMAG-Retail 1,851.574 4,137.417 4,089.742 3,923.242 50.208 .000 3,973.450 200.000 4,173.450
FY2012
ICP Retail Summary
1,868.000 3,271.953 3,371.612 3,385.874 .000 .000 3,385.874 .000 3,385.874
6.958 1,183.006 1,253.381 1,238.520 92.025 .000 1,330.545 .000 1,330.545
2.514 6.812 6.762 6.616 .000 .000 6.616 .000 6.616
Total SMAG-Retail 1,877.472 4,461.770 4,631.755 4,631.010 92.025 .000 4,723.035 200.000 4,923.035
FY2013
ICP Retail Summary
1,836.181 2,823.985 2,795.629 2,915.427 .000 .000 2,915.427 .000 2,915.427
7.210 1,096.724 1,084.382 1,147.273 70.659 .000 1,217.932 .000 1,217.932
2.546 6.440 6.490 6.907 .000 .000 6.907 .000 6.907
Total SMAG-Retail 1,845.937 3,927.149 3,886.501 4,069.607 70.659 .000 4,140.266 200.000 4,340.266
Med/Dent
Academy
GSD
Med/Dent
Academy
Obligation Target
GSD
Med/Dent
Academy
GSD
SM-1 Supply Management Activity Group - Retail
SUPPLY MANAGEMENT ACTIVITY GROUP - RETAIL
59
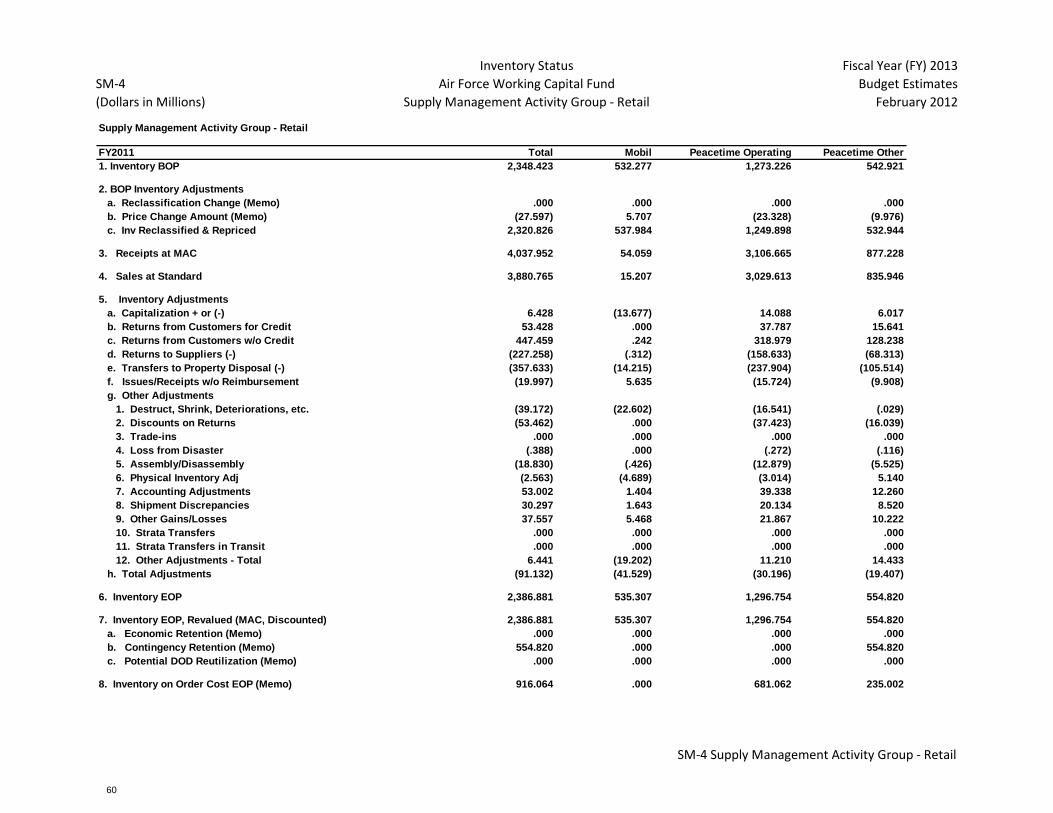
SM-4
(Dollars in Millions)
Inventory Status
Air Force Working Capital Fund
Supply Management Activity Group - Retail
Fiscal Year (FY) 2013
Budget Estimates
February 2012
Supply Management Activity Group - Retail
FY2011 Total Mobil Peacetime Operating Peacetime Other
1. Inventory BOP 2,348.423 532.277 1,273.226 542.921
2. BOP Inventory Adjustments
a. Reclassification Change (Memo) .000 .000 .000 .000
b. Price Change Amount (Memo) (27.597) 5.707 (23.328) (9.976)
c. Inv Reclassified & Repriced 2,320.826 537.984 1,249.898 532.944
3. Receipts at MAC 4,037.952 54.059 3,106.665 877.228
4. Sales at Standard 3,880.765 15.207 3,029.613 835.946
5. Inventory Adjustments
a. Capitalization + or (-) 6.428 (13.677) 14.088 6.017
b. Returns from Customers for Credit 53.428 .000 37.787 15.641
c. Returns from Customers w/o Credit 447.459 .242 318.979 128.238
d. Returns to Suppliers (-) (227.258) (.312) (158.633) (68.313)
e. Transfers to Property Disposal (-) (357.633) (14.215) (237.904) (105.514)
f. Issues/Receipts w/o Reimbursement (19.997) 5.635 (15.724) (9.908)
g. Other Adjustments
1. Destruct, Shrink, Deteriorations, etc. (39.172) (22.602) (16.541) (.029)
2. Discounts on Returns (53.462) .000 (37.423) (16.039)
3. Trade-ins .000 .000 .000 .000
4. Loss from Disaster (.388) .000 (.272) (.116)
5. Assembly/Disassembly (18.830) (.426) (12.879) (5.525)
6. Physical Inventory Adj (2.563) (4.689) (3.014) 5.140
7. Accounting Adjustments 53.002 1.404 39.338 12.260
8. Shipment Discrepancies 30.297 1.643 20.134 8.520
9. Other Gains/Losses 37.557 5.468 21.867 10.222
10. Strata Transfers .000 .000 .000 .000
11. Strata Transfers in Transit .000 .000 .000 .000
12. Other Adjustments - Total 6.441 (19.202) 11.210 14.433
h. Total Adjustments (91.132) (41.529) (30.196) (19.407)
6. Inventory EOP 2,386.881 535.307 1,296.754 554.820
7. Inventory EOP, Revalued (MAC, Discounted) 2,386.881 535.307 1,296.754 554.820
a. Economic Retention (Memo) .000 .000 .000 .000
b. Contingency Retention (Memo) 554.820 .000 .000 554.820
c. Potential DOD Reutilization (Memo) .000 .000 .000 .000
8. Inventory on Order Cost EOP (Memo) 916.064 .000 681.062 235.002
SM-4 Supply Management Activity Group - Retail
SUPPLY MANAGEMENT ACTIVITY GROUP - RETAIL
60

SM-4
(Dollars in Millions)
Inventory Status
Air Force Working Capital Fund
Supply Management Activity Group - Retail
Fiscal Year (FY) 2013
Budget Estimates
February 2012
Supply Management Activity Group - Retail
FY2012 Total Mobil Peacetime Operating Peacetime Other
1. Inventory BOP 2,386.881 535.307 1,296.754 554.820
2. BOP Inventory Adjustments
a. Reclassification Change (Memo) .000 .000 .000 .000
b. Price Change Amount (Memo) (33.269) .000 (23.278) (9.991)
c. Inv Reclassified & Repriced 2,353.612 535.307 1,273.476 544.829
3. Receipts at MAC 4,657.418 65.372 3,586.176 1,005.870
4. Sales at Standard 4,476.804 10.000 3,498.928 967.877
5. Inventory Adjustments
a. Capitalization + or (-) (8.787) (19.063) 7.248 3.028
b. Returns from Customers for Credit 60.027 .000 42.709 17.318
c. Returns from Customers w/o Credit 420.261 (.412) 294.393 126.281
d. Returns to Suppliers (-) (220.802) .000 (154.621) (66.182)
e. Transfers to Property Disposal (-) (345.229) (13.617) (232.542) (99.070)
f. Issues/Receipts w/o Reimbursement (20.234) 5.750 (15.925) (10.059)
g. Other Adjustments
1. Destruct, Shrink, Deteriorations, etc. (36.817) (21.795) (15.020) (.002)
2. Discounts on Returns (60.352) .000 (42.247) (18.106)
3. Trade-ins .000 .000 .000 .000
4. Loss from Disaster .000 .000 .000 .000
5. Assembly/Disassembly (21.458) (.360) (14.763) (6.335)
6. Physical Inventory Adj (2.892) .000 (2.017) (.875)
7. Accounting Adjustments 60.045 1.200 44.787 14.058
8. Shipment Discrepancies 39.316 1.725 26.294 11.297
9. Other Gains/Losses 50.475 26.200 15.914 8.361
10. Strata Transfers .000 .000 .000 .000
11. Strata Transfers in Transit .000 .000 .000 .000
12. Other Adjustments - Total 28.317 6.970 12.948 8.399
h. Total Adjustments (86.447) (20.372) (45.791) (20.284)
6. Inventory EOP 2,447.779 570.307 1,314.934 562.538
7. Inventory EOP, Revalued (MAC, Discounted) 2,447.779 570.307 1,314.934 562.538
a. Economic Retention (Memo) 2.138 .000 .000 2.138
b. Contingency Retention (Memo) 560.400 .000 .000 560.400
c. Potential DOD Reutilization (Memo) .000 .000 .000 .000
8. Inventory on Order Cost EOP (Memo) 795.597 .000 594.755 200.842
SM-4 Supply Management Activity Group - Retail
SUPPLY MANAGEMENT ACTIVITY GROUP - RETAIL
61
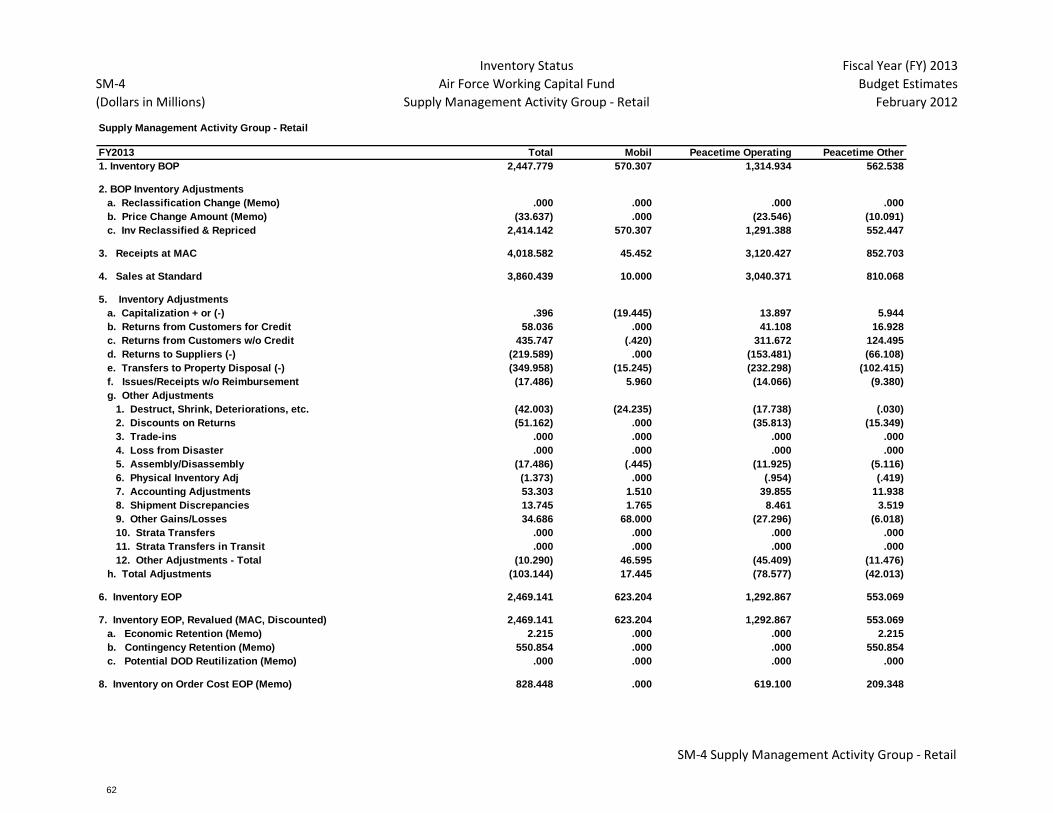
SM-4
(Dollars in Millions)
Inventory Status
Air Force Working Capital Fund
Supply Management Activity Group - Retail
Fiscal Year (FY) 2013
Budget Estimates
February 2012
Supply Management Activity Group - Retail
FY2013 Total Mobil Peacetime Operating Peacetime Other
1. Inventory BOP 2,447.779 570.307 1,314.934 562.538
2. BOP Inventory Adjustments
a. Reclassification Change (Memo) .000 .000 .000 .000
b. Price Change Amount (Memo) (33.637) .000 (23.546) (10.091)
c. Inv Reclassified & Repriced 2,414.142 570.307 1,291.388 552.447
3. Receipts at MAC 4,018.582 45.452 3,120.427 852.703
4. Sales at Standard 3,860.439 10.000 3,040.371 810.068
5. Inventory Adjustments
a. Capitalization + or (-) .396 (19.445) 13.897 5.944
b. Returns from Customers for Credit 58.036 .000 41.108 16.928
c. Returns from Customers w/o Credit 435.747 (.420) 311.672 124.495
d. Returns to Suppliers (-) (219.589) .000 (153.481) (66.108)
e. Transfers to Property Disposal (-) (349.958) (15.245) (232.298) (102.415)
f. Issues/Receipts w/o Reimbursement (17.486) 5.960 (14.066) (9.380)
g. Other Adjustments
1. Destruct, Shrink, Deteriorations, etc. (42.003) (24.235) (17.738) (.030)
2. Discounts on Returns (51.162) .000 (35.813) (15.349)
3. Trade-ins .000 .000 .000 .000
4. Loss from Disaster .000 .000 .000 .000
5. Assembly/Disassembly (17.486) (.445) (11.925) (5.116)
6. Physical Inventory Adj (1.373) .000 (.954) (.419)
7. Accounting Adjustments 53.303 1.510 39.855 11.938
8. Shipment Discrepancies 13.745 1.765 8.461 3.519
9. Other Gains/Losses 34.686 68.000 (27.296) (6.018)
10. Strata Transfers .000 .000 .000 .000
11. Strata Transfers in Transit .000 .000 .000 .000
12. Other Adjustments - Total (10.290) 46.595 (45.409) (11.476)
h. Total Adjustments (103.144) 17.445 (78.577) (42.013)
6. Inventory EOP 2,469.141 623.204 1,292.867 553.069
7. Inventory EOP, Revalued (MAC, Discounted) 2,469.141 623.204 1,292.867 553.069
a. Economic Retention (Memo) 2.215 .000 .000 2.215
b. Contingency Retention (Memo) 550.854 .000 .000 550.854
c. Potential DOD Reutilization (Memo) .000 .000 .000 .000
8. Inventory on Order Cost EOP (Memo) 828.448 .000 619.100 209.348
SM-4 Supply Management Activity Group - Retail
SUPPLY MANAGEMENT ACTIVITY GROUP - RETAIL
62
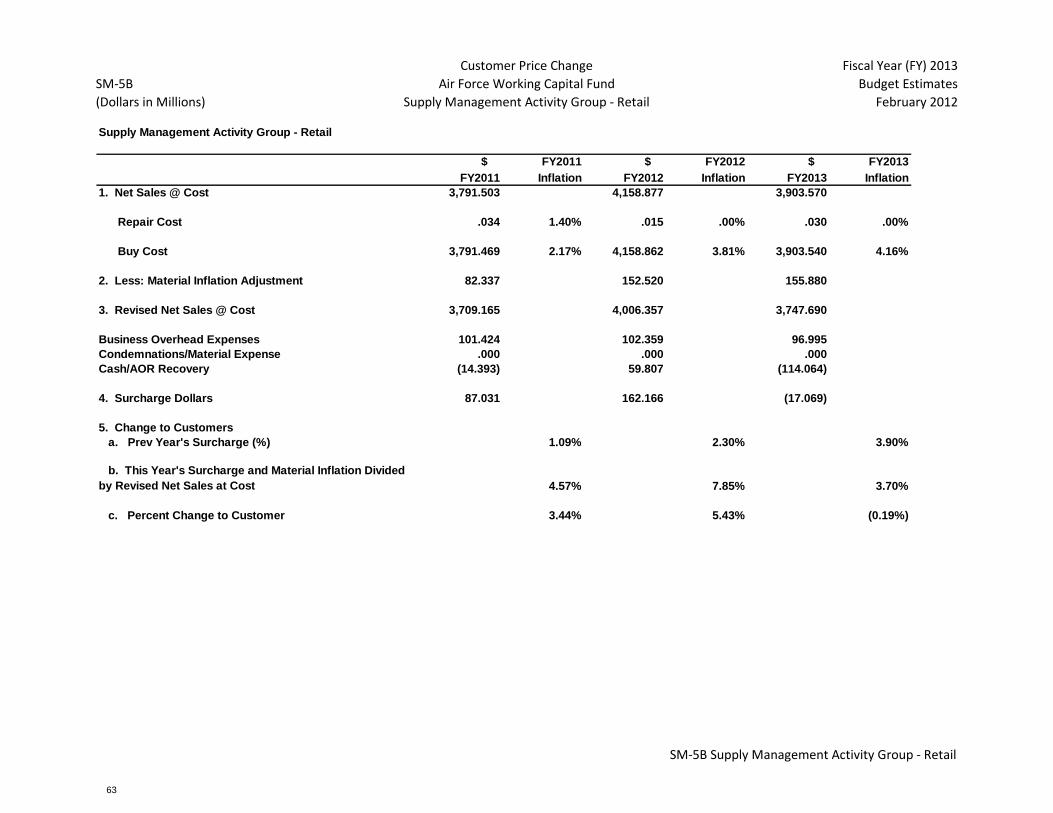
SM-5B
(Dollars in Millions)
Customer Price Change
Air Force Working Capital Fund
Supply Management Activity Group - Retail
Fiscal Year (FY) 2013
Budget Estimates
February 2012
Supply Management Activity Group - Retail
$ FY2011 $ FY2012 $ FY2013
FY2011 Inflation FY2012 Inflation FY2013 Inflation
1. Net Sales @ Cost 3,791.503 4,158.877 3,903.570
Repair Cost .034 1.40% .015 .00% .030 .00%
Buy Cost 3,791.469 2.17% 4,158.862 3.81% 3,903.540 4.16%
2. Less: Material Inflation Adjustment 82.337 152.520 155.880
3. Revised Net Sales @ Cost 3,709.165 4,006.357 3,747.690
Business Overhead Expenses 101.424 102.359 96.995
Condemnations/Material Expense .000 .000 .000
Cash/AOR Recovery (14.393) 59.807 (114.064)
4. Surcharge Dollars 87.031 162.166 (17.069)
5. Change to Customers
a. Prev Year's Surcharge (%) 1.09% 2.30% 3.90%
b. This Year's Surcharge and Material Inflation Divided
by Revised Net Sales at Cost 4.57% 7.85% 3.70%
c. Percent Change to Customer 3.44% 5.43% (0.19%)
SM-5B Supply Management Activity Group - Retail
SUPPLY MANAGEMENT ACTIVITY GROUP - RETAIL
63
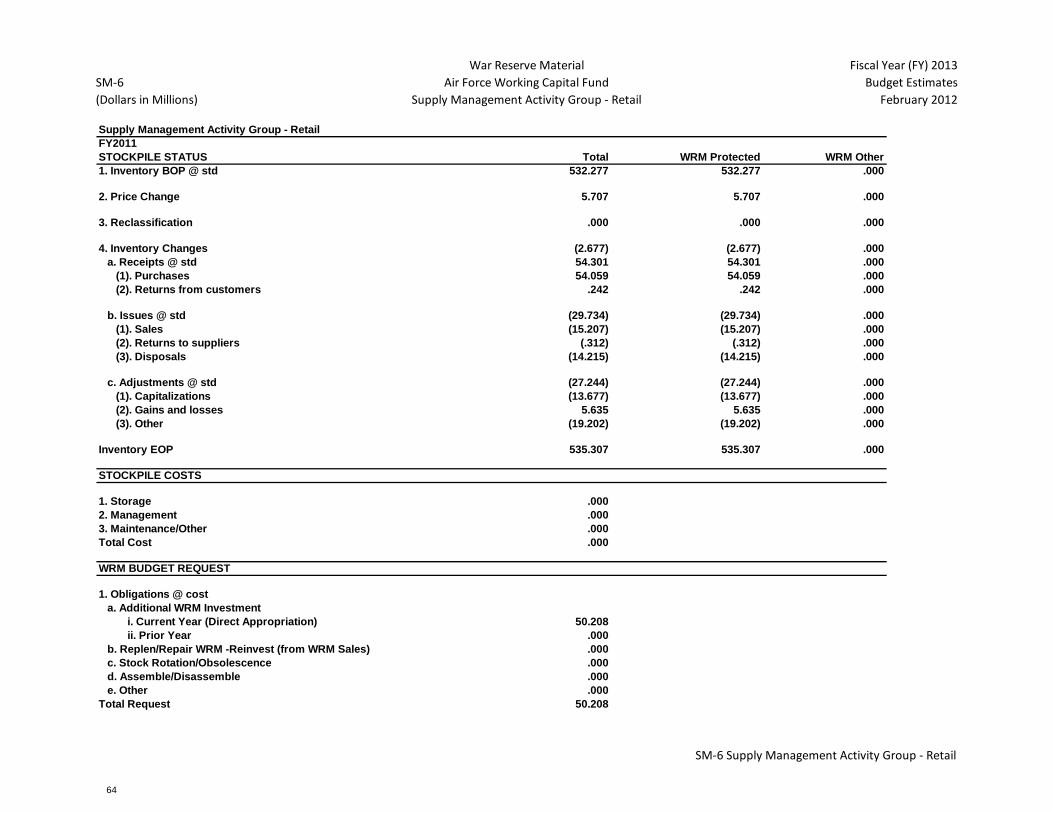
SM-6
(Dollars in Millions)
War Reserve Material
Air Force Working Capital Fund
Supply Management Activity Group - Retail
Fiscal Year (FY) 2013
Budget Estimates
February 2012
Supply Management Activity Group - Retail
FY2011
STOCKPILE STATUS Total WRM Protected WRM Other
1. Inventory BOP @ std 1. Inventory BOP @ std 532.277 532.277 .000
2. Price Change 2. Price Change 5.707 5.707 .000
3. Reclassification 3. Reclassification .000 .000 .000
4. Inventory Changes 4. Inventory Changes (2.677) (2.677) .000
a. Receipts @ std a. Receipts @ std 54.301 54.301 .000
(1). Purchases (1). Purchases 54.059 54.059 .000
(2). Returns from customers (2). Returns from customers .242 .242 .000
b. Issues @ std b. Issues @ std (29.734) (29.734) .000
(1). Sales (1). Sales (15.207) (15.207) .000
(2). Returns to suppliers (2). Returns to suppliers (.312) (.312) .000
(3). Disposals (3). Disposals (14.215) (14.215) .000
c. Adjustments @ std c. Adjustments @ std (27.244) (27.244) .000
(1). Capitalizations (1). Capitalizations (13.677) (13.677) .000
(2). Gains and losses (2). Gains and losses 5.635 5.635 .000
(3). Other (3). Other (19.202) (19.202) .000
Inventory EOP Inventory EOP 535.307 535.307 .000
STOCKPILE COSTS
1. Storage 1. Storage .000
2. Management 2. Management .000
3. Maintenance/Other 3. Maintenance/Other .000
Total Cost Total Cost .000
WRM BUDGET REQUEST
1. Obligations @ cost 1. Obligations @ cost
a. Additional WRM Investment a. Additional WRM Investment
i. Current Year (Direct Appropriation) i. Current Year (Direct Appropriation) 50.208
ii. Prior Year ii. Prior Year .000
b. Replen/Repair WRM -Reinvest (from WRM Sales) b. Replen/Repair WRM -Reinvest (from WRM Sales).000
c. Stock Rotation/Obsolescence c. Stock Rotation/Obsolescence .000
d. Assemble/Disassemble d. Assemble/Disassemble .000
e. Other e. Other .000
Total Request Total Request 50.208
SM-6 Supply Management Activity Group - Retail
SUPPLY MANAGEMENT ACTIVITY GROUP - RETAIL
64
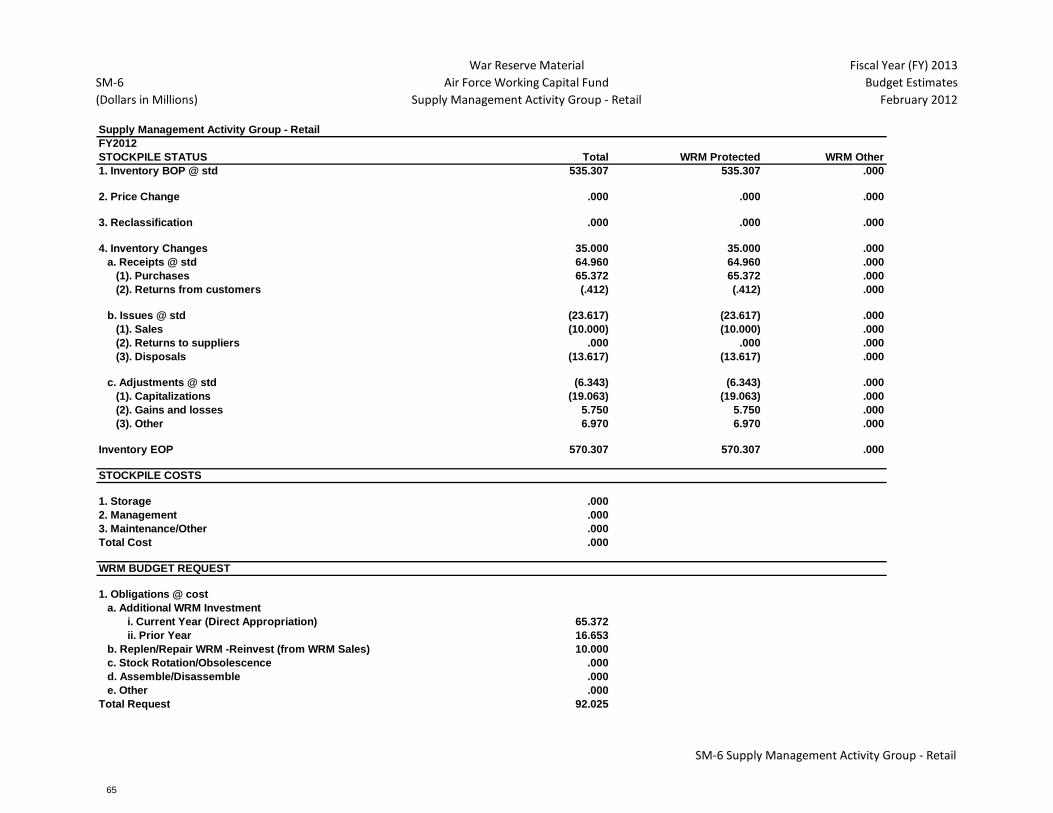
SM-6
(Dollars in Millions)
War Reserve Material
Air Force Working Capital Fund
Supply Management Activity Group - Retail
Fiscal Year (FY) 2013
Budget Estimates
February 2012
Supply Management Activity Group - Retail
FY2012
STOCKPILE STATUS Total WRM Protected WRM Other
1. Inventory BOP @ std 1. Inventory BOP @ std 535.307 535.307 .000
2. Price Change 2. Price Change .000 .000 .000
3. Reclassification 3. Reclassification .000 .000 .000
4. Inventory Changes 4. Inventory Changes 35.000 35.000 .000
a. Receipts @ std a. Receipts @ std 64.960 64.960 .000
(1). Purchases (1). Purchases 65.372 65.372 .000
(2). Returns from customers (2). Returns from customers (.412) (.412) .000
b. Issues @ std b. Issues @ std (23.617) (23.617) .000
(1). Sales (1). Sales (10.000) (10.000) .000
(2). Returns to suppliers (2). Returns to suppliers .000 .000 .000
(3). Disposals (3). Disposals (13.617) (13.617) .000
c. Adjustments @ std c. Adjustments @ std (6.343) (6.343) .000
(1). Capitalizations (1). Capitalizations (19.063) (19.063) .000
(2). Gains and losses (2). Gains and losses 5.750 5.750 .000
(3). Other (3). Other 6.970 6.970 .000
Inventory EOP Inventory EOP 570.307 570.307 .000
STOCKPILE COSTS
1. Storage 1. Storage .000
2. Management 2. Management .000
3. Maintenance/Other 3. Maintenance/Other .000
Total Cost Total Cost .000
WRM BUDGET REQUEST
1. Obligations @ cost 1. Obligations @ cost
a. Additional WRM Investment a. Additional WRM Investment
i. Current Year (Direct Appropriation) i. Current Year (Direct Appropriation) 65.372
ii. Prior Year ii. Prior Year 16.653
b. Replen/Repair WRM -Reinvest (from WRM Sales) b. Replen/Repair WRM -Reinvest (from WRM Sales)10.000
c. Stock Rotation/Obsolescence c. Stock Rotation/Obsolescence .000
d. Assemble/Disassemble d. Assemble/Disassemble .000
e. Other e. Other .000
Total Request Total Request 92.025
SM-6 Supply Management Activity Group - Retail
SUPPLY MANAGEMENT ACTIVITY GROUP - RETAIL
65

SM-6
(Dollars in Millions)
War Reserve Material
Air Force Working Capital Fund
Supply Management Activity Group - Retail
Fiscal Year (FY) 2013
Budget Estimates
February 2012
Supply Management Activity Group - Retail
FY2013
STOCKPILE STATUS Total WRM Protected WRM Other
1. Inventory BOP @ std 1. Inventory BOP @ std 570.307 570.307 .000
2. Price Change 2. Price Change .000 .000 .000
3. Reclassification 3. Reclassification .000 .000 .000
4. Inventory Changes 4. Inventory Changes 52.897 52.897 .000
a. Receipts @ std a. Receipts @ std 45.032 45.032 .000
(1). Purchases (1). Purchases 45.452 45.452 .000
(2). Returns from customers (2). Returns from customers (.420) (.420) .000
b. Issues @ std b. Issues @ std (25.245) (25.245) .000
(1). Sales (1). Sales (10.000) (10.000) .000
(2). Returns to suppliers (2). Returns to suppliers .000 .000 .000
(3). Disposals (3). Disposals (15.245) (15.245) .000
c. Adjustments @ std c. Adjustments @ std 33.110 33.110 .000
(1). Capitalizations (1). Capitalizations (19.445) (19.445) .000
(2). Gains and losses (2). Gains and losses 5.960 5.960 .000
(3). Other (3). Other 46.595 46.595 .000
Inventory EOP Inventory EOP 623.204 623.204 .000
STOCKPILE COSTS
1. Storage 1. Storage .000
2. Management 2. Management .000
3. Maintenance/Other 3. Maintenance/Other .000
Total Cost Total Cost .000
WRM BUDGET REQUEST
1. Obligations @ cost 1. Obligations @ cost
a. Additional WRM Investment a. Additional WRM Investment
i. Current Year (Direct Appropriation) i. Current Year (Direct Appropriation) 45.452
ii. Prior Year ii. Prior Year .000
b. Replen/Repair WRM -Reinvest (from WRM Sales) b. Replen/Repair WRM -Reinvest (from WRM Sales)25.207
c. Stock Rotation/Obsolescence c. Stock Rotation/Obsolescence .000
d. Assemble/Disassemble d. Assemble/Disassemble .000
e. Other e. Other .000
Total Request Total Request 70.659
SM-6 Supply Management Activity Group - Retail
SUPPLY MANAGEMENT ACTIVITY GROUP - RETAIL
66
AIR FORCE WORKING CAPITAL FUND
UNITED STATES
TRANSPORTATION COMMAND
TRANSPORTATION WORKING CAPITAL FUND
67
THIS PAGE INTENTIONALLY LEFT BLANK
TRANSPORTATION WORKING CAPITAL FUND
68
TWCF Budget Analysis Overview
United States Transportation Command Transportation Working Capital Fund Fiscal Year (FY) 2013 Budget Analysis
Background
This submission provides justification for the United States Transportation Command (USTRANSCOM) Transportation Working Capital Fund (TWCF) budget. The Secretary of Defense has designated the Commander, United States Transportation Command (CDR USTRANSCOM) as the single Department of Defense (DOD) manager for the Defense Transportation System (DTS) in peace and war. As such, all common-user transportation assets are under the command authority of CDR USTRANSCOM, except for Service unique or theater assigned assets. Commander, USTRANSCOM is also the DOD’s Distribution Process Owner (DPO), charged with coordinating and overseeing the DOD distribution system and developing and implementing distribution process improvements that enhance defense logistics and global supply chain management systems. USTRANSCOM submits the TWCF budget as a distinct subset of the Air Force Working Capital Fund (AFWCF) budget submission. It reflects the cost authority needed to meet peacetime operations, Overseas Contingency Operations (OCO), the surge/readiness requirements to support the National Military Strategy, and to synchronize deployment distribution planning and execution across DOD as the Global Distribution Synchronizer, USTRANSCOM’s newest Unified Command Plan mission. Capital funding supports the Department's In-Transit Visibility and Command and Control needs, facilitating continuous process improvement and modernization.
Composition of Component Business Areas USTRANSCOM’s mission is to provide air, land, and sea transportation for the Department of Defense (DOD) in time of peace and war, with a primary focus on wartime readiness. Our $13 billion budget provides synchronized transportation and sustainment, making it possible to project and maintain national power where needed, with the greatest speed and agility, the highest efficiency, and the most reliable level of trust and accuracy. We accomplish our joint mission through our three Component Commands— Air Mobility Command (AMC), Military Sealift Command (MSC), and Military Surface Deployment and Distribution Command (SDDC). This joint team of transportation components provides mobility forces and assets for a seamless transition from peace to war. USTRANSCOM is always ready to meet the strategic mobility needs of our nation. A brief description of the role of each Component follows:
TRANSPORTATION WORKING CAPITAL FUND
69

TWCF Budget Analysis Overview
Air Mobility Command provides airlift, air refueling, special air mission, and aeromedical evacuation for U.S. forces. AMC also supplies forces to theater commands to support wartime tasking. They are the single manager for air mobility. Military Sealift Command supports our nation by delivering supplies and conducting specialized missions across the world’s oceans. Surface Deployment and Distribution Command provides global surface deployment and distribution services to meet the nation’s objectives. Our components provide the critical link to the Services’ core competencies in organizing, training, and equipping forces. They provide lines of communication to the Services, ensuring assets are available when needed for the transition from peace to war. The surge from peacetime sustainment to a massive deployment of people and material in support of Overseas Contingency Operations is the most recent example of our ability to execute our mission. Our successes result from the synergy of military and commercial lift (air, land, and sea), air refueling, port operations, and afloat prepositioning—all requiring the team efforts of the Commander’s Staff and our components. Budget Highlights One of DOD’s highest priority goals is to maintain a robust and responsive defense transportation and distribution system as a critical element of America's national security strategy for rapid power projection and sustainment. USTRANSCOM's ability to move U.S. forces, equipment, and supplies, often at a moment’s notice, enables us to defend vital national interests anywhere in the world. Additionally, USTRANSCOM’s efforts as the DOD DPO to improve joint logistics support continue to produce results. Working with the DOD, regional combatant commands, agencies, and the Services, USTRANSCOM is leading the collaborative effort to make joint logistics a reality – leveraging experience and using information technology to consolidate logistics requirements in real time, compress the decision cycle, and continually improve response capabilities supporting our diverse customers and their requirements. USTRANSCOM is synchronizing the deployment, distribution, and sustainment of forces to achieve maximum efficiency and interoperability by eliminating duplication and standardizing practices. Working with our Joint Deployment and Distribution Enterprise (JDDE) partners, USTRANSCOM has implemented initiatives such as the Joint Task Force-Port Opening (JTF-PO), which will dramatically improve port activation processes and timelines. The Defense Transportation Coordination (DTC) is providing visibility of CONUS freight movement, enabling load consolidation, increased use of cost effective intermodal solutions and intelligent scheduling. Combining our command-wide analytical capabilities, USTRANSCOM established the Joint TWCF Billing
TRANSPORTATION WORKING CAPITAL FUND
70
TWCF Budget Analysis Overview
Center and the Joint Distribution Process Analysis Center (JDPAC). Creating further economies, the JDPAC functions as the major focal point for analyzing, modeling, understanding, and resolving complex logistics issues through the application of state-of-the-art research, decision support tools, and best practices to distribution, deployment, and sustainment operations. USTRANSCOM, as the global distribution synchronizer, is the combatant command responsible for the alignment of distribution planning and related activities of the other combatant commands, services, Defense agencies and activities to facilitate coordinated and decentralized execution across geographic boundaries. Together with its components and national partners, USTRANSCOM is building a truly seamless, end-to-end defense logistics enterprise. Our support for the OCO dominates the cost changes from FY 2011 to FY 2013. We are on track with our Base Realignment and Closure (BRAC) plan to save the taxpayer $1.2 billion over the next 20 years. SDDC, our Army component command, completed BRAC movements from Ft. Eustis, VA to Scott AFB, IL. This realignment has facilitated consolidation savings plus fused operations. FY 2011 through FY 2013 contain Overseas Contingency Operations assumptions. FY 2011 data includes actual results. Economies and Efficiencies
Productivity and Cost Avoidance Initiatives and Organizational Streamlining: Since 1994, USTRANSCOM productivity and cost avoidance initiatives and organizational streamlining efforts have resulted in savings of over $2.8 billion. These include:
Renegotiating ship contracts Reducing ship testing periods Initiating fuel savings techniques for ship charters and military aircraft Operating aircraft channels and utilizing aircraft more efficiently Revising flying hour models to reduce flying hours Phasing out unneeded commercial air passenger and cargo capacity Eliminating redundancies between components Accelerating implementation of BRAC actions Rightsizing port infrastructure Consolidating command headquarters Streamlining organizational structures
TRANSPORTATION WORKING CAPITAL FUND
71

TWCF Budget Analysis Overview
Implementing cost savings/efficiency initiatives (SECDEF directed efficiencies, insourcing savings, and manpower efficiencies)
Improving container utilization on ocean liner missions Distribution Process Owner (DPO) Cost Avoidance Initiatives: Since Commander, USTRANSCOM’s designation as DPO, in 2004 through September 2011, the DPO has validated $5.7 billion in cost avoidance initiatives. The savings accrue to the DOD budget (primarily contingency supplementals) and allow the Services to purchase other high priority items. Initiatives include:
Shifting transportation modes from air to sea and truck to rail Canceling redundant orders or contracts due to supply system interventions Identifying and returning lost transportation equipment to the supply system Canceling redundant refrigerated container contracts Comparing non-standard transportation mode rates prior to awarding contracts Creating an in-field repair capability for airlift pallets Working with Combatant Commands to utilize the most efficient transportation modes Engaging Services early in deployment process to maximize use of sealift and multi-modal operations Improving container utilization on ocean liner missions
Costs
COST ($ IN MILLIONS)
FY 2011
FY 2012
FY 2013
AMC $9,633 $10,092 $9,784 MSC $1,082 $774 $914 SDDC $2,802 $2,497 $2,270 Defense Courier Division (DCD) $9 $11 $11 Total $13,526 $13,374 $12,979
TRANSPORTATION WORKING CAPITAL FUND
72
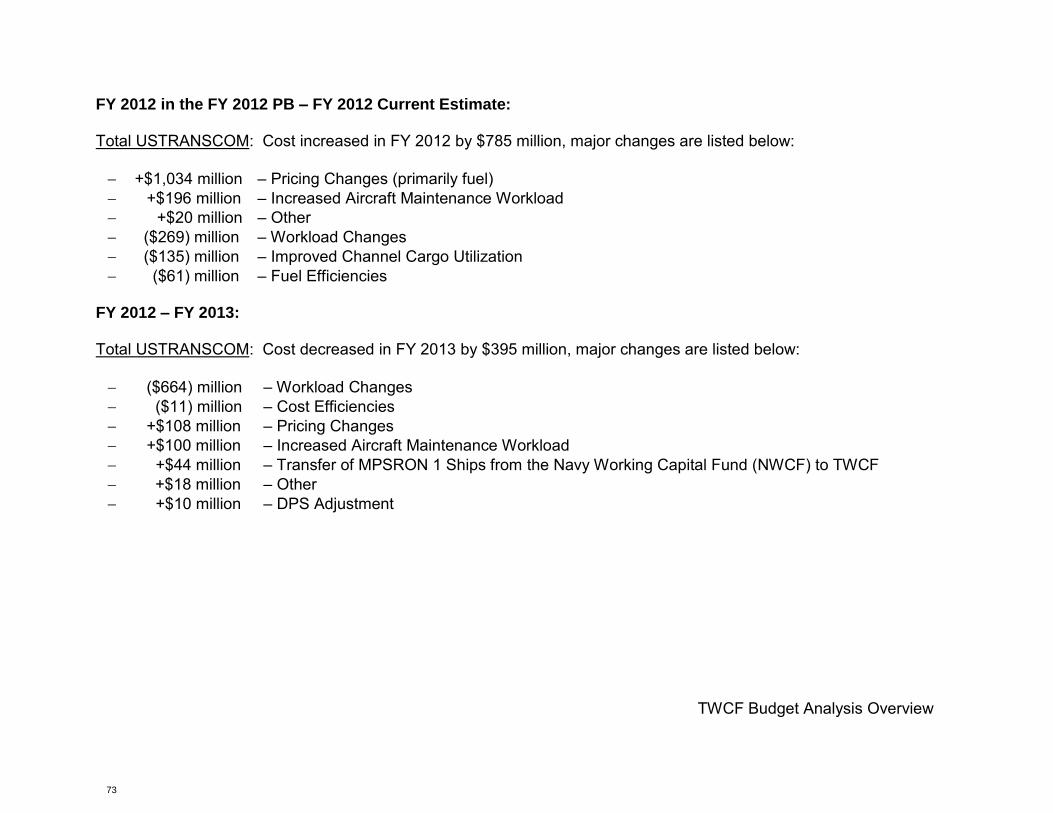
TWCF Budget Analysis Overview
FY 2012 in the FY 2012 PB – FY 2012 Current Estimate: Total USTRANSCOM: Cost increased in FY 2012 by $785 million, major changes are listed below: +$1,034 million – Pricing Changes (primarily fuel) +$196 million – Increased Aircraft Maintenance Workload +$20 million – Other ($269) million – Workload Changes ($135) million – Improved Channel Cargo Utilization ($61) million – Fuel Efficiencies
FY 2012 – FY 2013: Total USTRANSCOM: Cost decreased in FY 2013 by $395 million, major changes are listed below: ($664) million – Workload Changes ($11) million – Cost Efficiencies +$108 million – Pricing Changes +$100 million – Increased Aircraft Maintenance Workload +$44 million – Transfer of MPSRON 1 Ships from the Navy Working Capital Fund (NWCF) to TWCF +$18 million – Other +$10 million – DPS Adjustment
TRANSPORTATION WORKING CAPITAL FUND
73

TWCF Budget Analysis Overview
Revenue
REVENUE ($ IN MILLIONS)
FY 2011
FY 2012
FY 2013
AMC $9,242 $9,778 $9,319 MSC $944 $761 $943 SDDC $2,679 $2,541 $2,193 DCD $12 $13 $10 Total $12,877 $13,093 $12,465
Revenue: Revenue estimates are derived by using approved stabilized rates multiplied by various workload measures (i.e., flying hours, ton miles, passenger miles, ship days, measurement tons, and vehicles). While workload can vary widely, prices established during the budget process generally remain fixed during the year of execution. However, to avoid excessive build up or depletion of cash balances that have taken place in the recent past, USTRANSCOM’s rates can be adjusted to maintain AFWCF solvency or to prevent the buildup of excess cash. Because USTRANSCOM’s airlift rates are set to compete with private sector rates, they do not cover the cost of the unique readiness requirements of military airlift operations. The Air Force and USTRANSCOM are collaborating on alternatives to address the negative operating results.
Net Operating Result (NOR) / Accumulated Operating Result (AOR)
NOR/AOR ($ IN MILLIONS)
FY 2011
FY 2012
FY 2013
NOR -$649 -$281 -$514 Ending AOR -$124 -$547 $0
TRANSPORTATION WORKING CAPITAL FUND
74
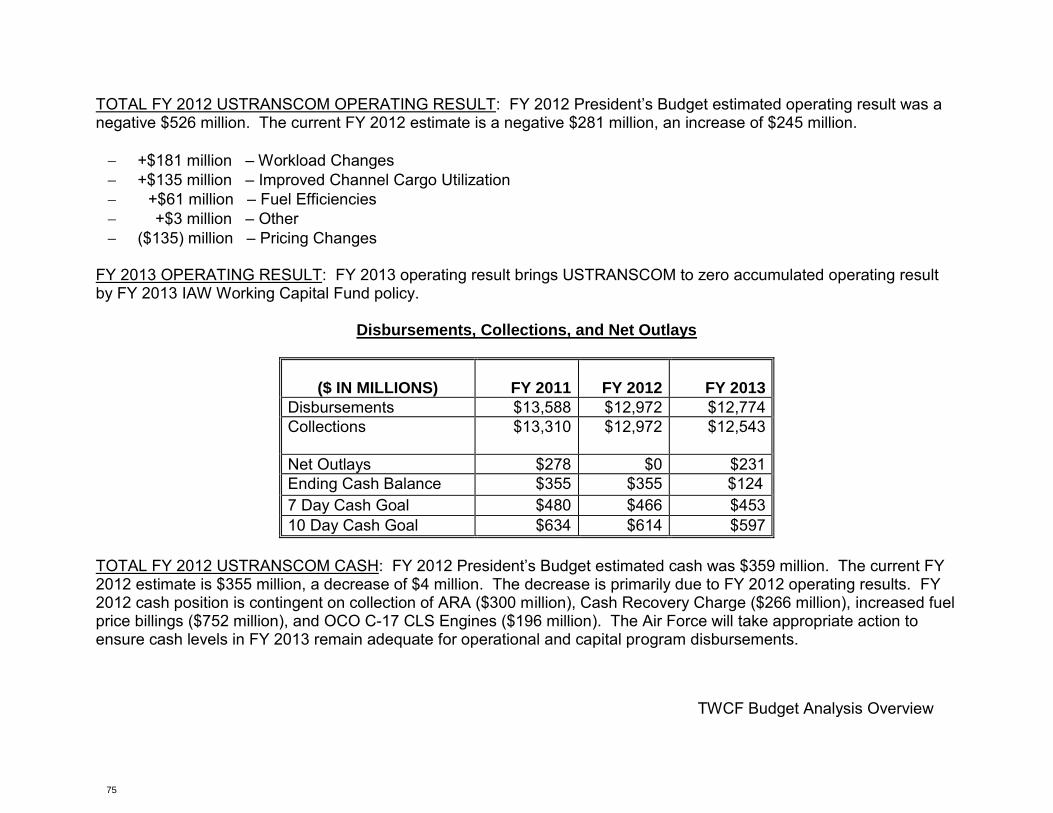
TWCF Budget Analysis Overview
TOTAL FY 2012 USTRANSCOM OPERATING RESULT: FY 2012 President’s Budget estimated operating result was a negative $526 million. The current FY 2012 estimate is a negative $281 million, an increase of $245 million. +$181 million – Workload Changes +$135 million – Improved Channel Cargo Utilization +$61 million – Fuel Efficiencies +$3 million – Other ($135) million – Pricing Changes
FY 2013 OPERATING RESULT: FY 2013 operating result brings USTRANSCOM to zero accumulated operating result by FY 2013 IAW Working Capital Fund policy.
Disbursements, Collections, and Net Outlays
($ IN MILLIONS)
FY 2011
FY 2012
FY 2013
Disbursements $13,588 $12,972 $12,774 Collections $13,310 $12,972 $12,543
Net Outlays $278 $0 $231 Ending Cash Balance $355 $355 $124 7 Day Cash Goal $480 $466 $453 10 Day Cash Goal $634 $614 $597
TOTAL FY 2012 USTRANSCOM CASH: FY 2012 President’s Budget estimated cash was $359 million. The current FY 2012 estimate is $355 million, a decrease of $4 million. The decrease is primarily due to FY 2012 operating results. FY 2012 cash position is contingent on collection of ARA ($300 million), Cash Recovery Charge ($266 million), increased fuel price billings ($752 million), and OCO C-17 CLS Engines ($196 million). The Air Force will take appropriate action to ensure cash levels in FY 2013 remain adequate for operational and capital program disbursements.
TRANSPORTATION WORKING CAPITAL FUND
75
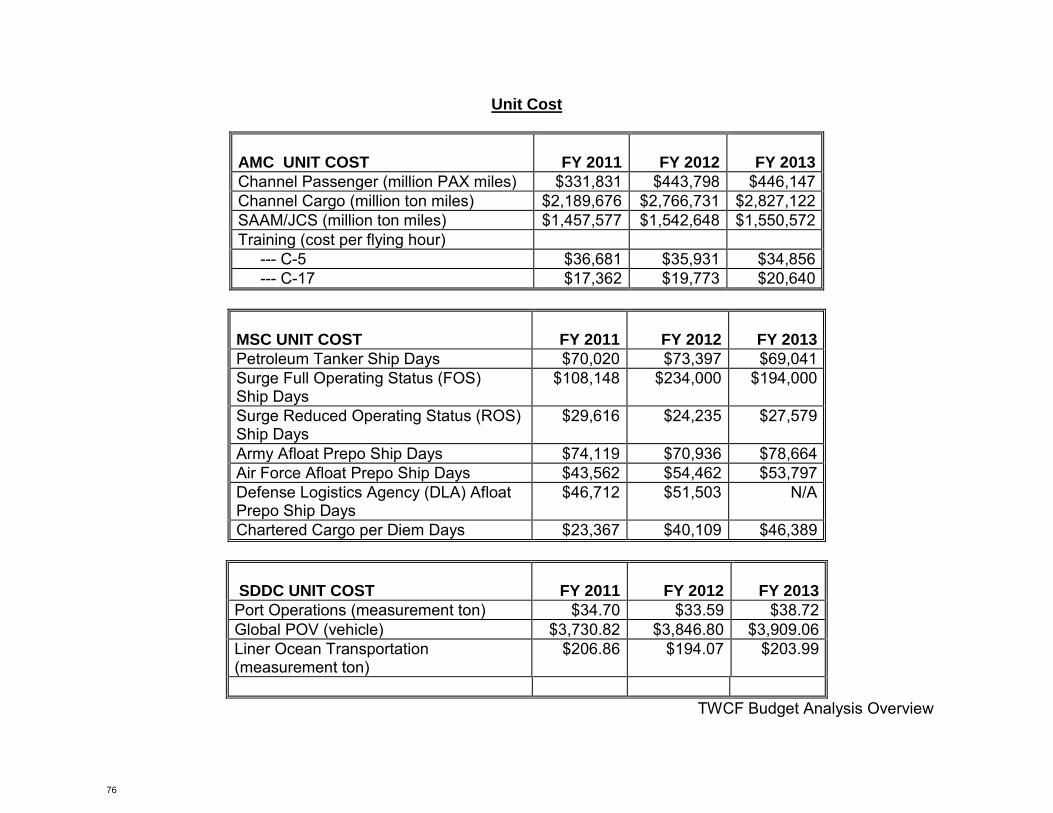
TWCF Budget Analysis Overview
Unit Cost
AMC UNIT COST
FY 2011
FY 2012
FY 2013
Channel Passenger (million PAX miles) $331,831 $443,798 $446,147 Channel Cargo (million ton miles) $2,189,676 $2,766,731 $2,827,122 SAAM/JCS (million ton miles) $1,457,577 $1,542,648 $1,550,572 Training (cost per flying hour) --- C-5 $36,681 $35,931 $34,856 --- C-17 $17,362 $19,773 $20,640
MSC UNIT COST
FY 2011
FY 2012
FY 2013
Petroleum Tanker Ship Days $70,020 $73,397 $69,041 Surge Full Operating Status (FOS) Ship Days
$108,148 $234,000 $194,000
Surge Reduced Operating Status (ROS) Ship Days
$29,616 $24,235 $27,579
Army Afloat Prepo Ship Days $74,119 $70,936 $78,664 Air Force Afloat Prepo Ship Days $43,562 $54,462 $53,797 Defense Logistics Agency (DLA) Afloat Prepo Ship Days
$46,712 $51,503 N/A
Chartered Cargo per Diem Days $23,367 $40,109 $46,389
SDDC UNIT COST
FY 2011
FY 2012
FY 2013
Port Operations (measurement ton) $34.70 $33.59 $38.72 Global POV (vehicle) $3,730.82 $3,846.80 $3,909.06 Liner Ocean Transportation (measurement ton)
$206.86 $194.07 $203.99
TRANSPORTATION WORKING CAPITAL FUND
76

TWCF Budget Analysis Overview
DCD UNIT COST FY 2011 FY 2012 FY 2013
Cost per pound delivered $5.93 $7.20 $7.40
Workload
AMC WORKLOAD
FY 2011
FY 2012
FY 2013
Channel Passenger (million PAX miles) 910 842 836 Channel Cargo (million ton miles) 1,143 1,086 1,025 SAAM/JCS (million ton miles) 3,998 3,776 3,628 Training-C-5 (flying hours) 2,947 2,605 2,605 Training-C-17 (flying hours) 24,369 25,490 25,490
MSC WORKLOAD
FY 2011
FY 2012
FY 2013
Petroleum Tanker Ship Days 2,972 2,714 2,710 Surge FOS Ship Days 135 50 50 Surge ROS Ship Days 3,650 3,660 5,040 Army Afloat Prepositioning Ship Days 2,867 2,928 2,920 Air Force Afloat Prepositioning Ship Days
730 762 790
DLA Afloat Prepositioning Ship Days 730 732 N/A Chartered Cargo Ship Days 2,542 1,830 2,160
TRANSPORTATION WORKING CAPITAL FUND
77

TWCF Budget Analysis Overview
SDDC WORKLOAD
FY 2011
FY 2012
FY 2013
Port Operations (measurement ton) 8,396,000 8,039,000 7,094,000 Global POV (vehicle) 68,430 65,847 65,847 Liner Ocean Transportation (measurement ton)
10,327,000 9,520,000 7,890,000
DCD WORKLOAD
FY 2011
FY 2012
FY 2013
Pounds Delivered 1,500,000 1,500,000 1,500,000
Customer Rate Changes
AMC RATE CHANGES
FY 2012
FY 2013
Channel Passenger 1.7% 1.7% Channel Cargo 1.7% 1.7% SAAM/JCS -3.3% 7.0% Training -2.8% 5.9%
MSC RATE CHANGES
FY 2012
FY 2013
Petroleum Tankerships 37.2% -1.0% Surge FOS 72.1% -17.1% Surge ROS 19.7% 66.7% Army Afloat Prepositioning -15.8% 18.6% Air Force Afloat Prepositioning 32.8% 7.4% DLA Afloat Prepositioning 33.2% N/A Chartered Cargo 26.9% 2.4%
TRANSPORTATION WORKING CAPITAL FUND
78
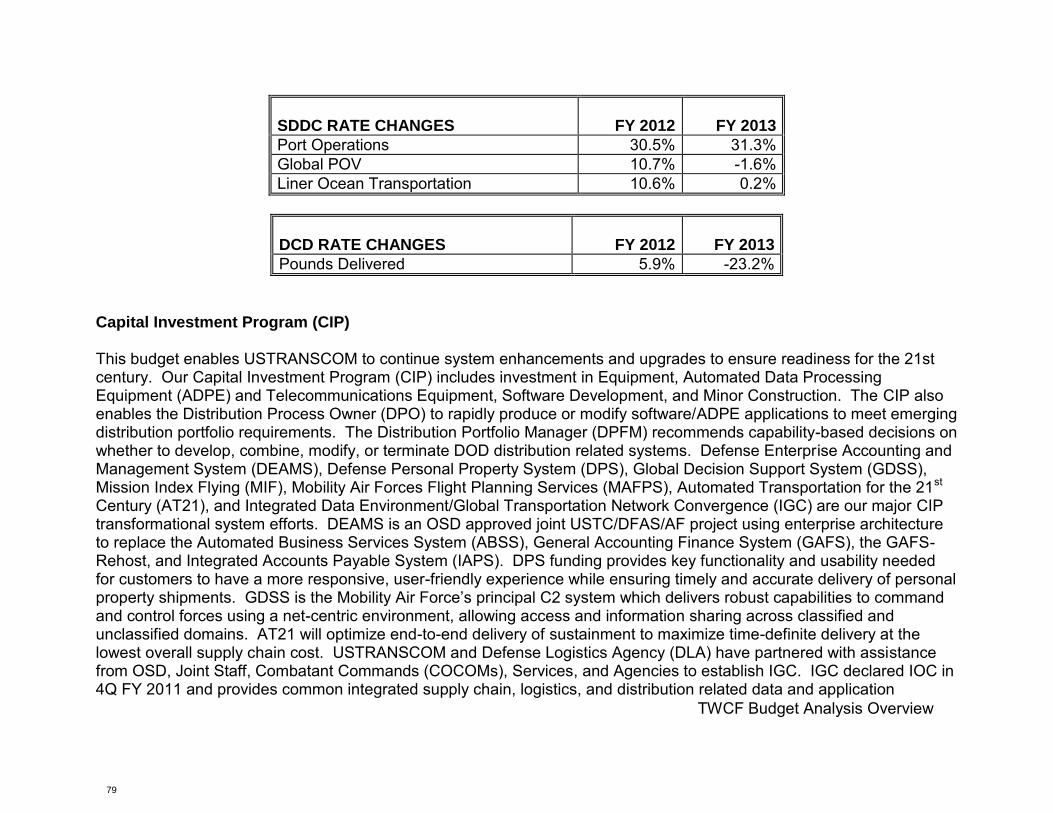
TWCF Budget Analysis Overview
SDDC RATE CHANGES
FY 2012
FY 2013
Port Operations 30.5% 31.3% Global POV 10.7% -1.6% Liner Ocean Transportation 10.6% 0.2%
DCD RATE CHANGES
FY 2012
FY 2013
Pounds Delivered 5.9% -23.2% Capital Investment Program (CIP)
This budget enables USTRANSCOM to continue system enhancements and upgrades to ensure readiness for the 21st century. Our Capital Investment Program (CIP) includes investment in Equipment, Automated Data Processing Equipment (ADPE) and Telecommunications Equipment, Software Development, and Minor Construction. The CIP also enables the Distribution Process Owner (DPO) to rapidly produce or modify software/ADPE applications to meet emerging distribution portfolio requirements. The Distribution Portfolio Manager (DPFM) recommends capability-based decisions on whether to develop, combine, modify, or terminate DOD distribution related systems. Defense Enterprise Accounting and Management System (DEAMS), Defense Personal Property System (DPS), Global Decision Support System (GDSS), Mission Index Flying (MIF), Mobility Air Forces Flight Planning Services (MAFPS), Automated Transportation for the 21st Century (AT21), and Integrated Data Environment/Global Transportation Network Convergence (IGC) are our major CIP transformational system efforts. DEAMS is an OSD approved joint USTC/DFAS/AF project using enterprise architecture to replace the Automated Business Services System (ABSS), General Accounting Finance System (GAFS), the GAFS-Rehost, and Integrated Accounts Payable System (IAPS). DPS funding provides key functionality and usability needed for customers to have a more responsive, user-friendly experience while ensuring timely and accurate delivery of personal property shipments. GDSS is the Mobility Air Force’s principal C2 system which delivers robust capabilities to command and control forces using a net-centric environment, allowing access and information sharing across classified and unclassified domains. AT21 will optimize end-to-end delivery of sustainment to maximize time-definite delivery at the lowest overall supply chain cost. USTRANSCOM and Defense Logistics Agency (DLA) have partnered with assistance from OSD, Joint Staff, Combatant Commands (COCOMs), Services, and Agencies to establish IGC. IGC declared IOC in 4Q FY 2011 and provides common integrated supply chain, logistics, and distribution related data and application
TRANSPORTATION WORKING CAPITAL FUND
79
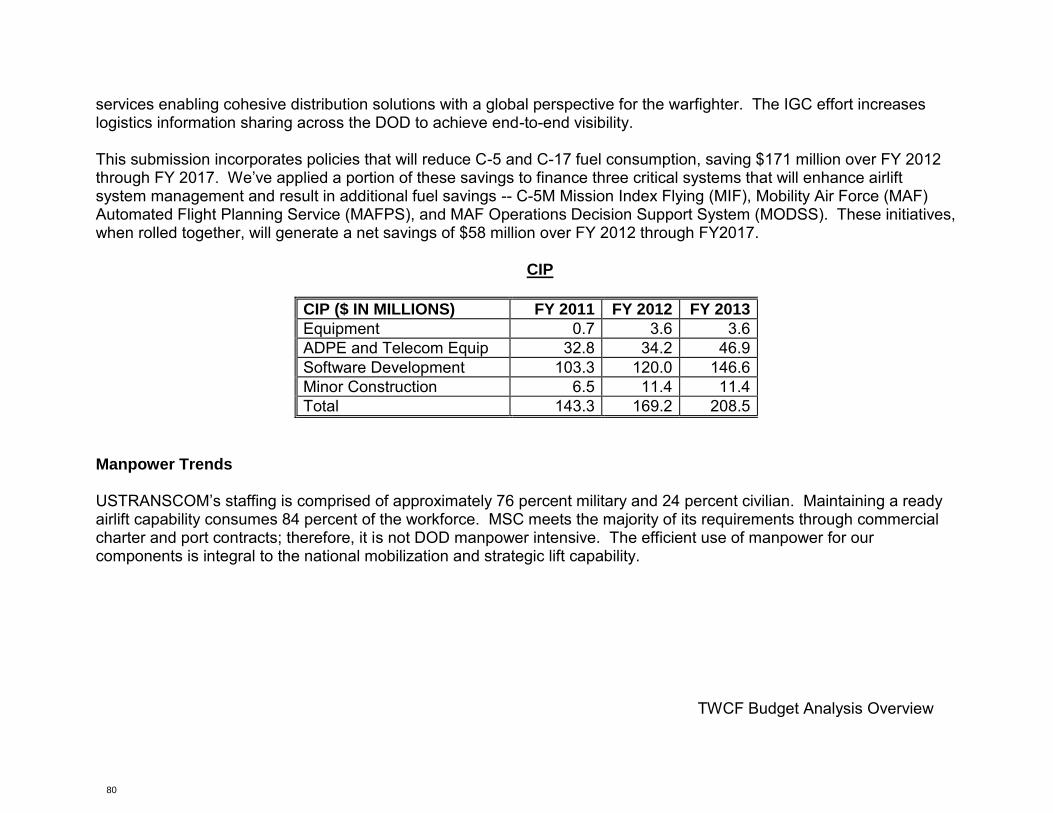
TWCF Budget Analysis Overview
services enabling cohesive distribution solutions with a global perspective for the warfighter. The IGC effort increases logistics information sharing across the DOD to achieve end-to-end visibility. This submission incorporates policies that will reduce C-5 and C-17 fuel consumption, saving $171 million over FY 2012 through FY 2017. We’ve applied a portion of these savings to finance three critical systems that will enhance airlift system management and result in additional fuel savings -- C-5M Mission Index Flying (MIF), Mobility Air Force (MAF) Automated Flight Planning Service (MAFPS), and MAF Operations Decision Support System (MODSS). These initiatives, when rolled together, will generate a net savings of $58 million over FY 2012 through FY2017. CIP
CIP ($ IN MILLIONS) FY 2011 FY 2012 FY 2013
Equipment 0.7 3.6 3.6 ADPE and Telecom Equip 32.8 34.2 46.9 Software Development 103.3 120.0 146.6 Minor Construction 6.5 11.4 11.4 Total 143.3 169.2 208.5
Manpower Trends USTRANSCOM’s staffing is comprised of approximately 76 percent military and 24 percent civilian. Maintaining a ready airlift capability consumes 84 percent of the workforce. MSC meets the majority of its requirements through commercial charter and port contracts; therefore, it is not DOD manpower intensive. The efficient use of manpower for our components is integral to the national mobilization and strategic lift capability.
TRANSPORTATION WORKING CAPITAL FUND
80
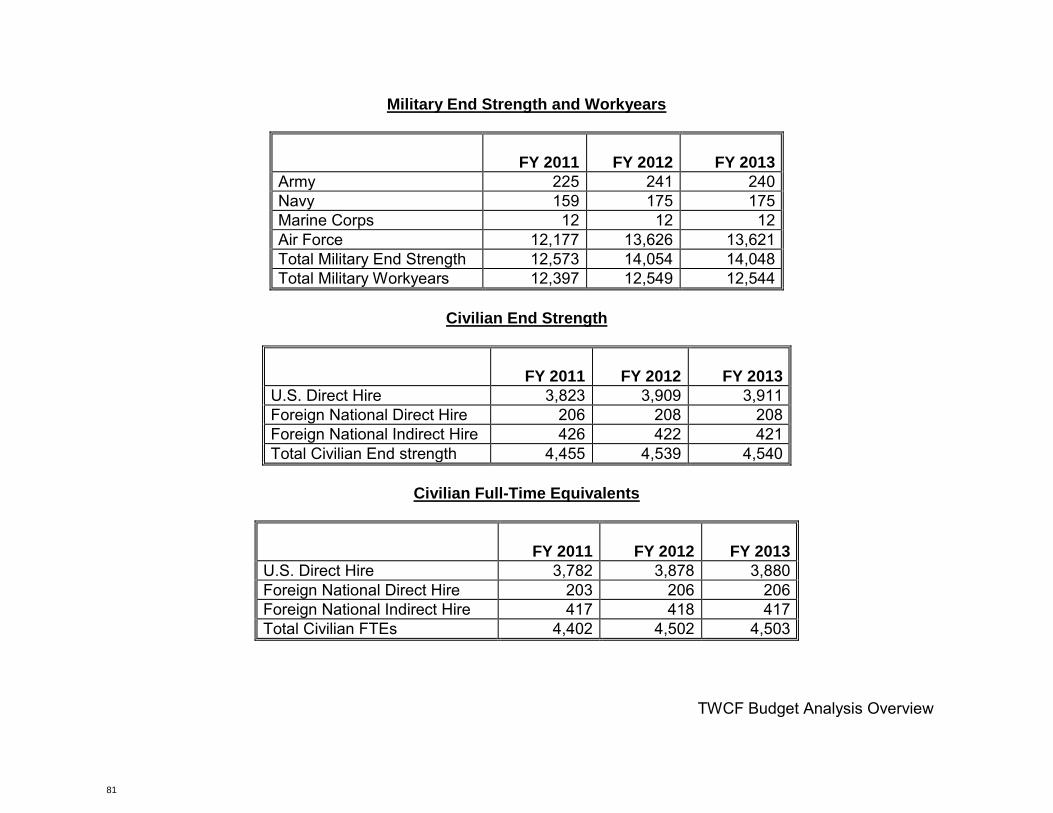
TWCF Budget Analysis Overview
Military End Strength and Workyears
FY 2011
FY 2012
FY 2013
Army 225 241 240 Navy 159 175 175 Marine Corps 12 12 12 Air Force 12,177 13,626 13,621 Total Military End Strength 12,573 14,054 14,048 Total Military Workyears 12,397 12,549 12,544
Civilian End Strength
FY 2011
FY 2012
FY 2013
U.S. Direct Hire 3,823 3,909 3,911 Foreign National Direct Hire 206 208 208 Foreign National Indirect Hire 426 422 421 Total Civilian End strength 4,455 4,539 4,540
Civilian Full-Time Equivalents
FY 2011
FY 2012
FY 2013
U.S. Direct Hire 3,782 3,878 3,880 Foreign National Direct Hire 203 206 206 Foreign National Indirect Hire 417 418 417 Total Civilian FTEs 4,402 4,502 4,503
TRANSPORTATION WORKING CAPITAL FUND
81
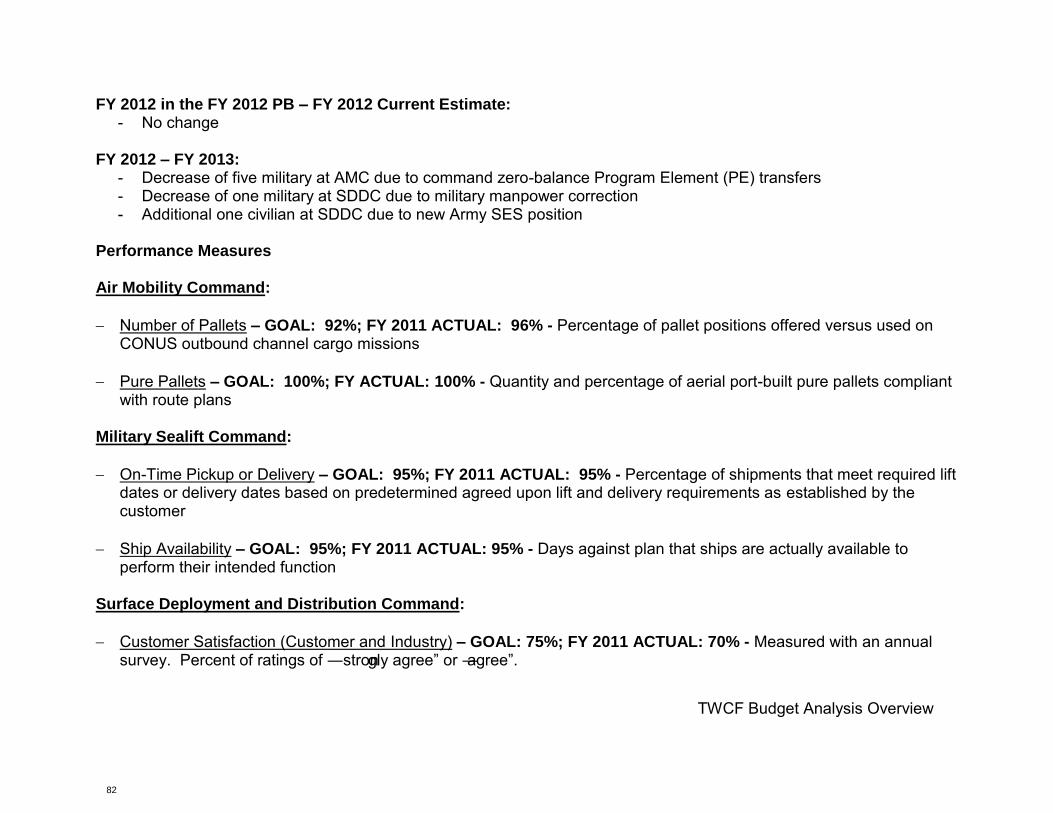
TWCF Budget Analysis Overview
FY 2012 in the FY 2012 PB – FY 2012 Current Estimate: - No change
FY 2012 – FY 2013:
- Decrease of five military at AMC due to command zero-balance Program Element (PE) transfers - Decrease of one military at SDDC due to military manpower correction - Additional one civilian at SDDC due to new Army SES position
Performance Measures Air Mobility Command:
Number of Pallets – GOAL: 92%; FY 2011 ACTUAL: 96% - Percentage of pallet positions offered versus used on CONUS outbound channel cargo missions
Pure Pallets – GOAL: 100%; FY ACTUAL: 100% - Quantity and percentage of aerial port-built pure pallets compliant with route plans
Military Sealift Command: On-Time Pickup or Delivery – GOAL: 95%; FY 2011 ACTUAL: 95% - Percentage of shipments that meet required lift
dates or delivery dates based on predetermined agreed upon lift and delivery requirements as established by the customer
Ship Availability – GOAL: 95%; FY 2011 ACTUAL: 95% - Days against plan that ships are actually available to
perform their intended function Surface Deployment and Distribution Command:
Customer Satisfaction (Customer and Industry) – GOAL: 75%; FY 2011 ACTUAL: 70% - Measured with an annual survey. Percent of ratings of ―strongly agree‖ or ―agree‖.
TRANSPORTATION WORKING CAPITAL FUND
82
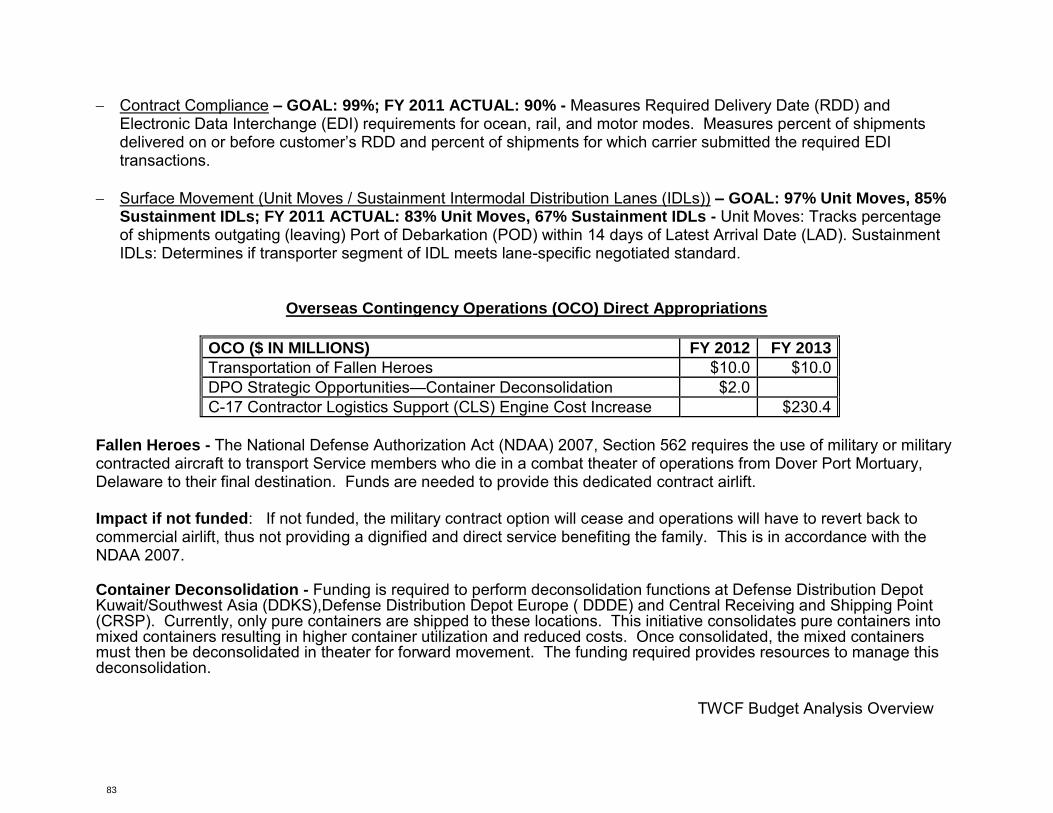
TWCF Budget Analysis Overview
Contract Compliance – GOAL: 99%; FY 2011 ACTUAL: 90% - Measures Required Delivery Date (RDD) and Electronic Data Interchange (EDI) requirements for ocean, rail, and motor modes. Measures percent of shipments delivered on or before customer’s RDD and percent of shipments for which carrier submitted the required EDI transactions.
Surface Movement (Unit Moves / Sustainment Intermodal Distribution Lanes (IDLs)) – GOAL: 97% Unit Moves, 85%
Sustainment IDLs; FY 2011 ACTUAL: 83% Unit Moves, 67% Sustainment IDLs - Unit Moves: Tracks percentage of shipments outgating (leaving) Port of Debarkation (POD) within 14 days of Latest Arrival Date (LAD). Sustainment IDLs: Determines if transporter segment of IDL meets lane-specific negotiated standard.
Overseas Contingency Operations (OCO) Direct Appropriations
OCO ($ IN MILLIONS) FY 2012 FY 2013
Transportation of Fallen Heroes $10.0 $10.0 DPO Strategic Opportunities—Container Deconsolidation $2.0 C-17 Contractor Logistics Support (CLS) Engine Cost Increase $230.4
Fallen Heroes - The National Defense Authorization Act (NDAA) 2007, Section 562 requires the use of military or military contracted aircraft to transport Service members who die in a combat theater of operations from Dover Port Mortuary, Delaware to their final destination. Funds are needed to provide this dedicated contract airlift. Impact if not funded: If not funded, the military contract option will cease and operations will have to revert back to commercial airlift, thus not providing a dignified and direct service benefiting the family. This is in accordance with the NDAA 2007. Container Deconsolidation - Funding is required to perform deconsolidation functions at Defense Distribution Depot Kuwait/Southwest Asia (DDKS),Defense Distribution Depot Europe ( DDDE) and Central Receiving and Shipping Point (CRSP). Currently, only pure containers are shipped to these locations. This initiative consolidates pure containers into mixed containers resulting in higher container utilization and reduced costs. Once consolidated, the mixed containers must then be deconsolidated in theater for forward movement. The funding required provides resources to manage this deconsolidation.
TRANSPORTATION WORKING CAPITAL FUND
83
TWCF Budget Analysis Overview
Impact if not funded: Projected enterprise performance improvements and savings will be significantly delayed if this Distribution Process Owner Strategic Opportunities (DSO) initiative is not funded. C-17 Contractor Logistics Support (CLS) Engine Cost Increase - AMC identified a FY 2012 and FY 2013 shortfall due to increased C-17 engine CLS costs justified by excessive wear and tear from operating in the contingency environment. Impact if not funded: If not funded, there will be upwards of 21 aircraft unavailable and/or limited to CONUS missions. Grounding of upwards of 21 aircraft represents over 17% of the AMC fleet unavailable for missions. This means that 17% of the time that AMC is tasked for a C-17 mission there may not be an aircraft available to do the mission.
TRANSPORTATION WORKING CAPITAL FUND
84

Fund 2
(Dollars in Millions)
Changes in the Cost of Operations
Air Force Working Capital Fund
Transportation Working Capital Fund (TWCF)
Fiscal Year (FY) 2013
Budget Estimates
February 2012
United States Transportation Command
FY2011 to FY2012
Cost of Operations $13,526.3
Estimate in President's Budget $12,588.8
Estimated Impact
Pricing Adjustments: $1,034.4
a. Total Pay Raises $.0
(1) Civilian Personnel Raises $.0
(2) Military Personnel Raises $.0
b. Annualization of Prior Year Pay Raises $.0
(1) Civilian Personnel Annualization $.0
(2) Military Personnel Annualization $.0
c. Commercial Transportation Pricing Changes $584.4
d. General Purchase Inflation $13.7
e. Decreased Aircraft Maintenance Prices ($1.4)
f. Fuel Pricing $437.7
Productivity Initiatives & Other Efficiencies: ($197.1)
a. Improved Channel Cargo Utilization ($135.0)
b. Fuel Efficiencies Due to Consumption Policy ($33.6)
c. Fuel Efficiencies Due to IT Initiatives ($27.2)
d. Reduced Air Transport Use ($1.3)
Program Changes: ($51.7)
a. Workload Changes ($268.8)
b. Increased Aircraft Maintenance $196.1
c. Other $21.0
EOP Estimate $13,374.4
Fund 2 United States Transportation Command
TRANSPORTATION WORKING CAPITAL FUND
85
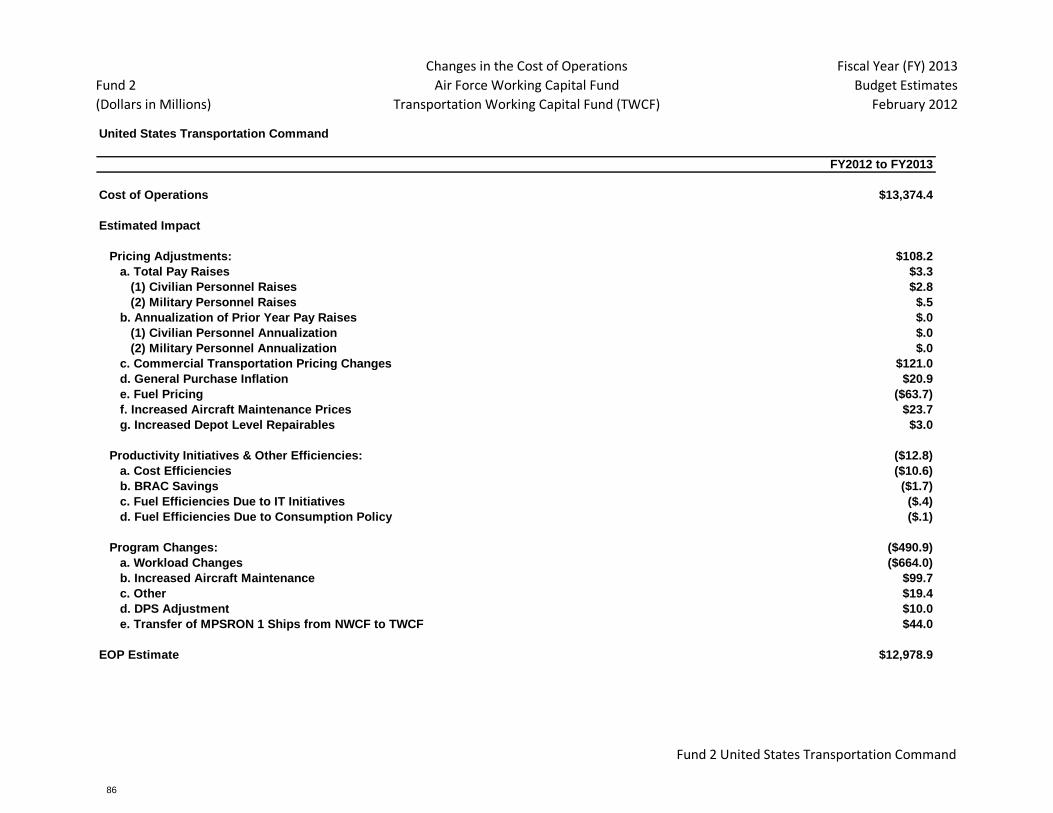
Fund 2
(Dollars in Millions)
Changes in the Cost of Operations
Air Force Working Capital Fund
Transportation Working Capital Fund (TWCF)
Fiscal Year (FY) 2013
Budget Estimates
February 2012
United States Transportation Command
FY2012 to FY2013
Cost of Operations $13,374.4
Estimated Impact
Pricing Adjustments: $108.2
a. Total Pay Raises $3.3
(1) Civilian Personnel Raises $2.8
(2) Military Personnel Raises $.5
b. Annualization of Prior Year Pay Raises $.0
(1) Civilian Personnel Annualization $.0
(2) Military Personnel Annualization $.0
c. Commercial Transportation Pricing Changes $121.0
d. General Purchase Inflation $20.9
e. Fuel Pricing ($63.7)
f. Increased Aircraft Maintenance Prices $23.7
g. Increased Depot Level Repairables $3.0
Productivity Initiatives & Other Efficiencies: ($12.8)
a. Cost Efficiencies ($10.6)
b. BRAC Savings ($1.7)
c. Fuel Efficiencies Due to IT Initiatives ($.4)
d. Fuel Efficiencies Due to Consumption Policy ($.1)
Program Changes: ($490.9)
a. Workload Changes ($664.0)
b. Increased Aircraft Maintenance $99.7
c. Other $19.4
d. DPS Adjustment $10.0
e. Transfer of MPSRON 1 Ships from NWCF to TWCF $44.0
EOP Estimate $12,978.9
Fund 2 United States Transportation Command
TRANSPORTATION WORKING CAPITAL FUND
86
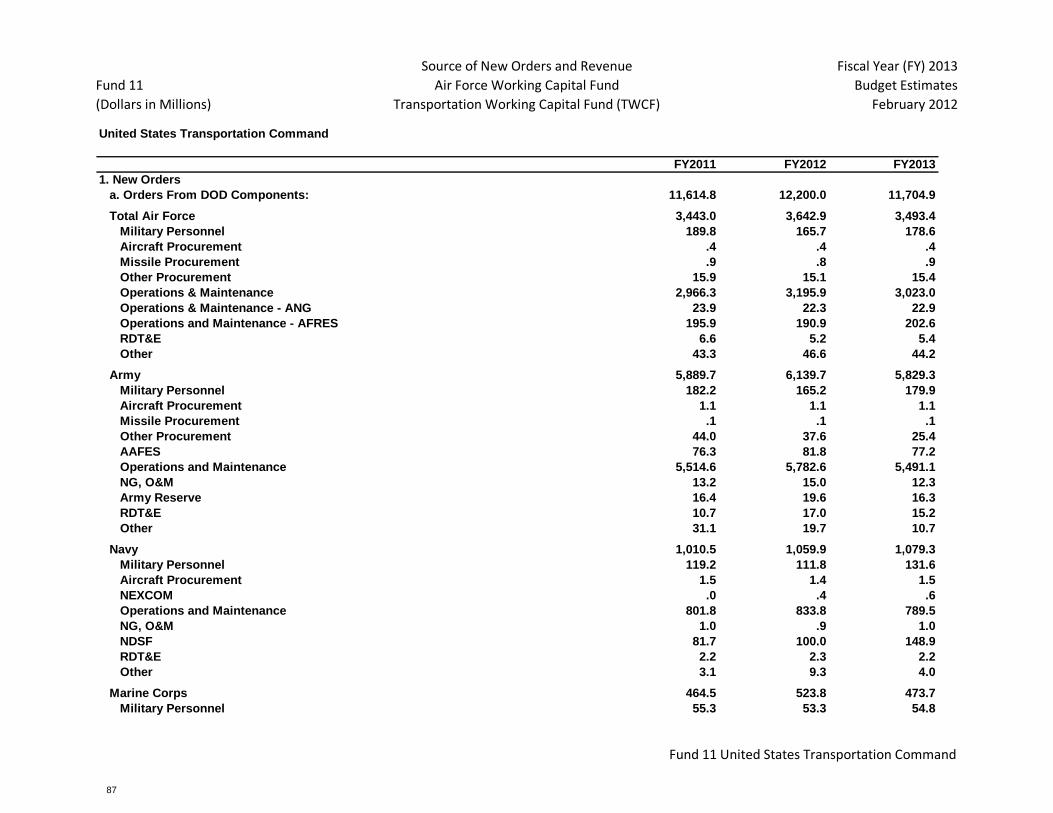
Fund 11
(Dollars in Millions)
Source of New Orders and Revenue
Air Force Working Capital Fund
Transportation Working Capital Fund (TWCF)
Fiscal Year (FY) 2013
Budget Estimates
February 2012
United States Transportation Command
FY2011 FY2012 FY2013
1. New Orders 1. New Orders
a. Orders From DOD Components: a. Orders From DOD Components: 11,614.8 12,200.0 11,704.9
Total Air Force Total Air Force 3,443.0 3,642.9 3,493.4
Military Personnel Military Personnel - AF 189.8 165.7 178.6
Aircraft Procurement Aircraft Procurement .4 .4 .4
Missile Procurement Missile Procurement .9 .8 .9
Other Procurement Other Procurement 15.9 15.1 15.4
Operations & Maintenance Operations & Maintenance - AF 2,966.3 3,195.9 3,023.0
Operations & Maintenance - ANG Operations & Maintenance - ANG 23.9 22.3 22.9
Operations and Maintenance - AFRES AFRES 195.9 190.9 202.6
RDT&E RDT&E - Air Force 6.6 5.2 5.4
Other Other - Air Force 43.3 46.6 44.2
Army Army 5,889.7 6,139.7 5,829.3
Military Personnel Military Personnel - Army 182.2 165.2 179.9
Aircraft Procurement Aircraft Procurement - Army 1.1 1.1 1.1
Missile Procurement Missile Procurement - Army .1 .1 .1
Other Procurement Other Procurement - Army 44.0 37.6 25.4
AAFES AAFES 76.3 81.8 77.2
Operations and Maintenance Operations and Maintenance - Army 5,514.6 5,782.6 5,491.1
NG, O&M NG, O&M - Army 13.2 15.0 12.3
Army Reserve Army Reserve 16.4 19.6 16.3
RDT&E RDT&E - Army 10.7 17.0 15.2
Other Other - Army 31.1 19.7 10.7
Navy Navy 1,010.5 1,059.9 1,079.3
Military Personnel Military Personnel - Navy 119.2 111.8 131.6
Aircraft Procurement Aircraft Procurement - Navy 1.5 1.4 1.5
NEXCOM NEXCOM .0 .4 .6
Operations and Maintenance Operations and Maintenance - Navy 801.8 833.8 789.5
NG, O&M NG, O&M - Navy 1.0 .9 1.0
NDSF NDSF 81.7 100.0 148.9
RDT&E RDT&E - Navy 2.2 2.3 2.2
Other Other - Navy 3.1 9.3 4.0
Marine Corps Marine Corps 464.5 523.8 473.7
Military Personnel Military Personnel - Marines 55.3 53.3 54.8
Fund 11 United States Transportation Command
TRANSPORTATION WORKING CAPITAL FUND
87
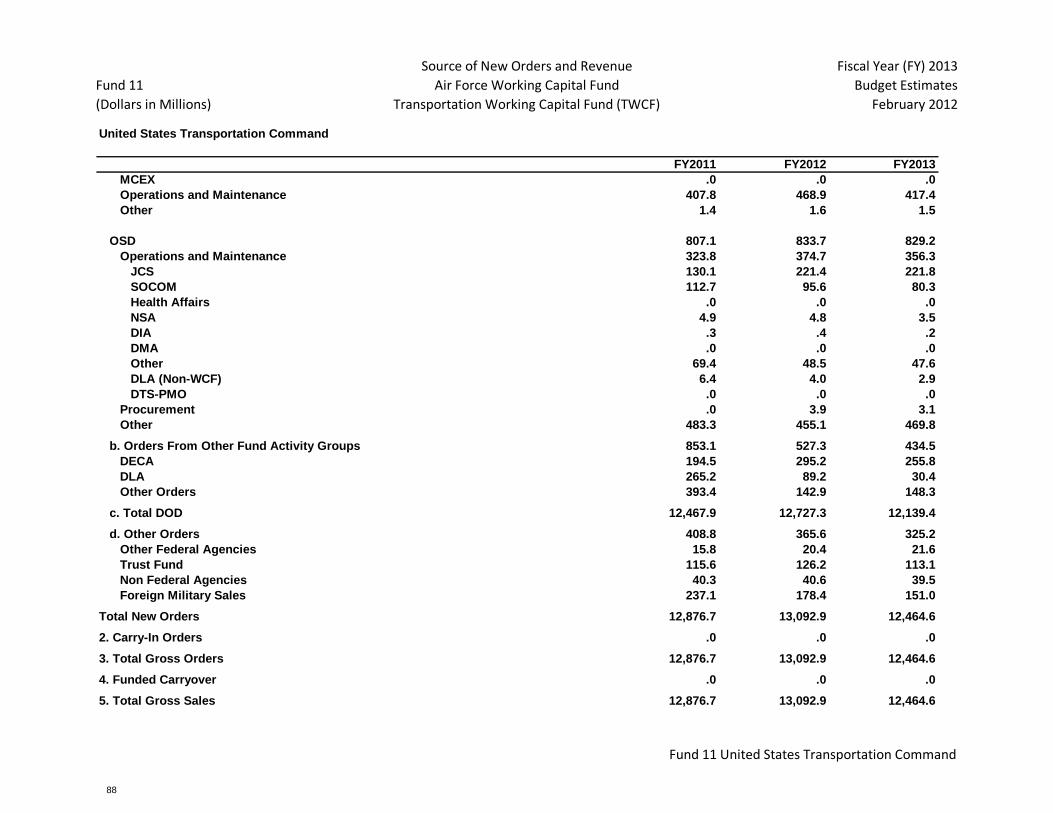
Fund 11
(Dollars in Millions)
Source of New Orders and Revenue
Air Force Working Capital Fund
Transportation Working Capital Fund (TWCF)
Fiscal Year (FY) 2013
Budget Estimates
February 2012
United States Transportation Command
FY2011 FY2012 FY2013
MCEX MCEX .0 .0 .0
Operations and Maintenance Operations and Maintenance - Marines 407.8 468.9 417.4
Other Other - Marines 1.4 1.6 1.5
OSD OSD 807.1 833.7 829.2
Operations and Maintenance Operations and Maintenance - OSD 323.8 374.7 356.3
JCS Operations and Maintenance - JCS 130.1 221.4 221.8
SOCOM Operations and Maintenance - SOCOM 112.7 95.6 80.3
Health Affairs Operations and Maintenance - Health Affairs .0 .0 .0
NSA Operations and Maintenance - NSA 4.9 4.8 3.5
DIA Operations and Maintenance - DIA .3 .4 .2
DMA Operations and Maintenance - DMA .0 .0 .0
Other Operations and Maintenance - Other 69.4 48.5 47.6
DLA (Non-WCF) Operations and Maintenance - DLA (Non-WCF)6.4 4.0 2.9
DTS-PMO Operations and Maintenance - DTS-PMO .0 .0 .0
Procurement Procurement - OSD .0 3.9 3.1
Other Other - OSD 483.3 455.1 469.8
b. Orders From Other Fund Activity Groups b. Orders From Other Fund Activity Groups 853.1 527.3 434.5
DECA DECA 194.5 295.2 255.8
DLA DLA 265.2 89.2 30.4
Other Orders Other Orders 393.4 142.9 148.3
c. Total DOD c. Grand Total DOD 12,467.9 12,727.3 12,139.4
d. Other Orders d. Other Orders 408.8 365.6 325.2
Other Federal Agencies Other Federal Agencies 15.8 20.4 21.6
Trust Fund Trust Fund 115.6 126.2 113.1
Non Federal Agencies Non Federal Agencies 40.3 40.6 39.5
Foreign Military Sales FMS 237.1 178.4 151.0
Total New Orders Total New Orders 12,876.7 13,092.9 12,464.6
2. Carry-In Orders 2. Carry-In Orders .0 .0 .0
3. Total Gross Orders 3. Total Gross Orders 12,876.7 13,092.9 12,464.6
4. Funded Carryover 4. Funded Carryover .0 .0 .0
5. Total Gross Sales 5. Total Gross Sales 12,876.7 13,092.9 12,464.6
Fund 11 United States Transportation Command
TRANSPORTATION WORKING CAPITAL FUND
88
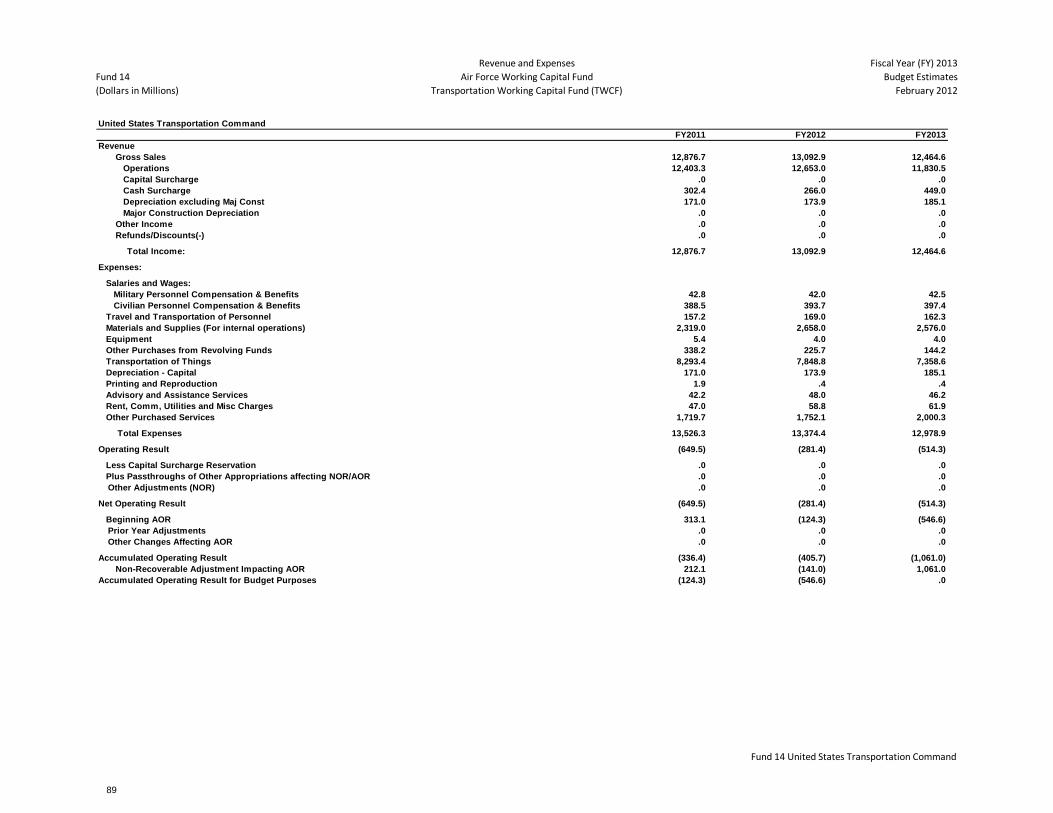
Fund 14
(Dollars in Millions)
Revenue and Expenses
Air Force Working Capital Fund
Transportation Working Capital Fund (TWCF)
Fiscal Year (FY) 2013
Budget Estimates
February 2012
United States Transportation Command
FY2011 FY2012 FY2013
Revenue
Gross Sales 12,876.7 13,092.9 12,464.6
Operations 12,403.3 12,653.0 11,830.5
Capital Surcharge .0 .0 .0
Cash Surcharge 302.4 266.0 449.0
Depreciation excluding Maj Const 171.0 173.9 185.1
Major Construction Depreciation .0 .0 .0
Other Income .0 .0 .0
Refunds/Discounts(-) .0 .0 .0
Total Income: 12,876.7 13,092.9 12,464.6
Expenses:
Salaries and Wages:
Military Personnel Compensation & Benefits 42.8 42.0 42.5
Civilian Personnel Compensation & Benefits 388.5 393.7 397.4
Travel and Transportation of Personnel 157.2 169.0 162.3
Materials and Supplies (For internal operations) 2,319.0 2,658.0 2,576.0
Equipment 5.4 4.0 4.0
Other Purchases from Revolving Funds 338.2 225.7 144.2
Transportation of Things 8,293.4 7,848.8 7,358.6
Depreciation - Capital 171.0 173.9 185.1
Printing and Reproduction 1.9 .4 .4
Advisory and Assistance Services Other Purchases from Revolving Funds 42.2 48.0 46.2
Rent, Comm, Utilities and Misc Charges 47.0 58.8 61.9
Other Purchased Services 1,719.7 1,752.1 2,000.3
Total Expenses 13,526.3 13,374.4 12,978.9
Operating Result (649.5) (281.4) (514.3)
Less Capital Surcharge Reservation .0 .0 .0
Plus Passthroughs of Other Appropriations affecting NOR/AOR .0 .0 .0
Other Adjustments (NOR) .0 .0 .0
Net Operating Result (649.5) (281.4) (514.3)
Beginning AOR 313.1 (124.3) (546.6)
Prior Year Adjustments .0 .0 .0
Other Changes Affecting AOR .0 .0 .0
Accumulated Operating Result (336.4) (405.7) (1,061.0)
Non-Recoverable Adjustment Impacting AOR Non-Recoverable Adjustment (AOR) 212.1 (141.0) 1,061.0
Accumulated Operating Result for Budget Purposes (124.3) (546.6) .0
Fund 14 United States Transportation Command
TRANSPORTATION WORKING CAPITAL FUND
89

THIS PAGE INTENTIONALLY LEFT BLANK
TRANSPORTATION WORKING CAPITAL FUND
90
AIR FORCE WORKING CAPITAL FUND
CAPITAL BUDGET
CAPITAL BUDGET
91

THIS PAGE INTENTIONALLY LEFT BLANK
CAPITAL BUDGET
92
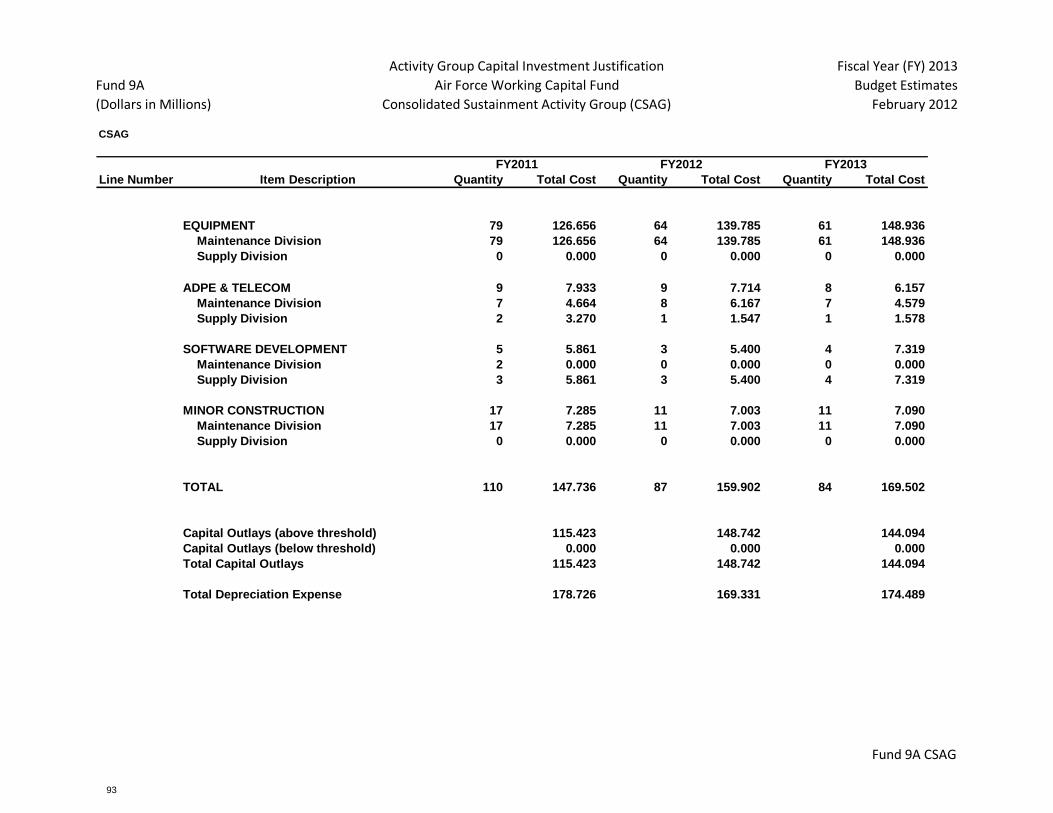
Fund 9A
(Dollars in Millions)
Activity Group Capital Investment Justification
Air Force Working Capital Fund
Consolidated Sustainment Activity Group (CSAG)
Fiscal Year (FY) 2013
Budget Estimates
February 2012
CSAG
Quantity 2 Quantity 2 Quantity 2
Line Number Item Description Quantity Total Cost Quantity Total Cost Quantity Total Cost
EQUIPMENT 79 126.656 64 139.785 61 148.936
Maintenance Division 79 126.656 64 139.785 61 148.936
Supply Division 0 0.000 0 0.000 0 0.000
ADPE & TELECOM 9 7.933 9 7.714 8 6.157
Maintenance Division 7 4.664 8 6.167 7 4.579
Supply Division 2 3.270 1 1.547 1 1.578
SOFTWARE DEVELOPMENT 5 5.861 3 5.400 4 7.319
Maintenance Division 2 0.000 0 0.000 0 0.000
Supply Division 3 5.861 3 5.400 4 7.319
MINOR CONSTRUCTION 17 7.285 11 7.003 11 7.090
Maintenance Division 17 7.285 11 7.003 11 7.090
Supply Division 0 0.000 0 0.000 0 0.000
TOTAL 110 147.736 87 159.902 84 169.502
Capital Outlays (above threshold) 115.423 148.742 144.094
Capital Outlays (below threshold) 0.000 0.000 0.000
Total Capital Outlays 115.423 148.742 144.094
Total Depreciation Expense 178.726 169.331 174.489
FY2011 FY2012 FY2013
Fund 9A CSAG
CAPITAL BUDGET
93

Q Activity Group Capital Investment Justification Fiscal Year (FY) 2013Fund 9B Air Force Working Capital Fund Budget Estimates(Dollars in Thousands) Consolidated Sustainment Activity Group (CSAG) February 2012
Department of the Air Force Line No. & Item Description Activity IdentificationDepot Maintenance Equipment WSS HQ AFMC
Element of Cost Quantity Unit Cost Total Cost Quantity Unit Cost Total Cost Quantity Unit Cost Total Cost- A(5) Other Equipment 1 110,276.2 110,276.2 1 135,884.0 135,884.0 1 144,336.0 144,336.0TOTAL 1 110,276.2 110,276.2 1 135,884.0 135,884.0 1 144,336.0 144,336.0Narrative Justification:
Description
Economic Analysis
Impact
Without the required equipment, the Air Force would be unable to provide reliable, cost-effective and timely depot support services and products to operational forces around the world. Depots would be unable to accommodate workload requirements and produce acceptable end state products. Depot infrastructure would deteriorate and become unproductive. Ability to execute capital budgets in support of mission objectives would be severely hampered. The aformentioned investments are critical to remaining competitive and provide combat mission support.
FY2011 FY2012 FY2013
This capability represents an array of capital equipment investment requirements that aligns with the overall Air Force strategic objectives for sustaining depot facilities and equipment. Projects are in direct support of Aircraft, Missiles, Engines, Exchangeable, or Other Depot mission. They are designed, scheduled, and installed in accordance with established Air Logistics or Aerospace Maintenance and Regeneration Group processes and priorities. Weapon System Sustainment (WSS) projects support the depot maintenance mission requirements to sustain the existing organic industrial base, save dollars through increased productivity, and support customer requirements. The equipment, when replaced, upgraded, integrated, or combined into depot industrial operations, leads to efficiency and personnel safety improvements; supports hazardous waste minimization and pollution prevention efforts; enhances product quality; and increases customer satisfaction in performing the Air Force mission. Time sensitivity of projects to accommodate new or emerging workload requirements and produce an acceptable end state is a critical factor in depot operations. As such, program and execution in this line is essential as equipment requirements may change. Documentation and project justification support are certified and maintained on file, including, when appropriate, economic analyses.
An Economic Analysis was completed and is on file.
Fund 9B CSAG - Maintenance Division
CAPITAL BUDGET
94
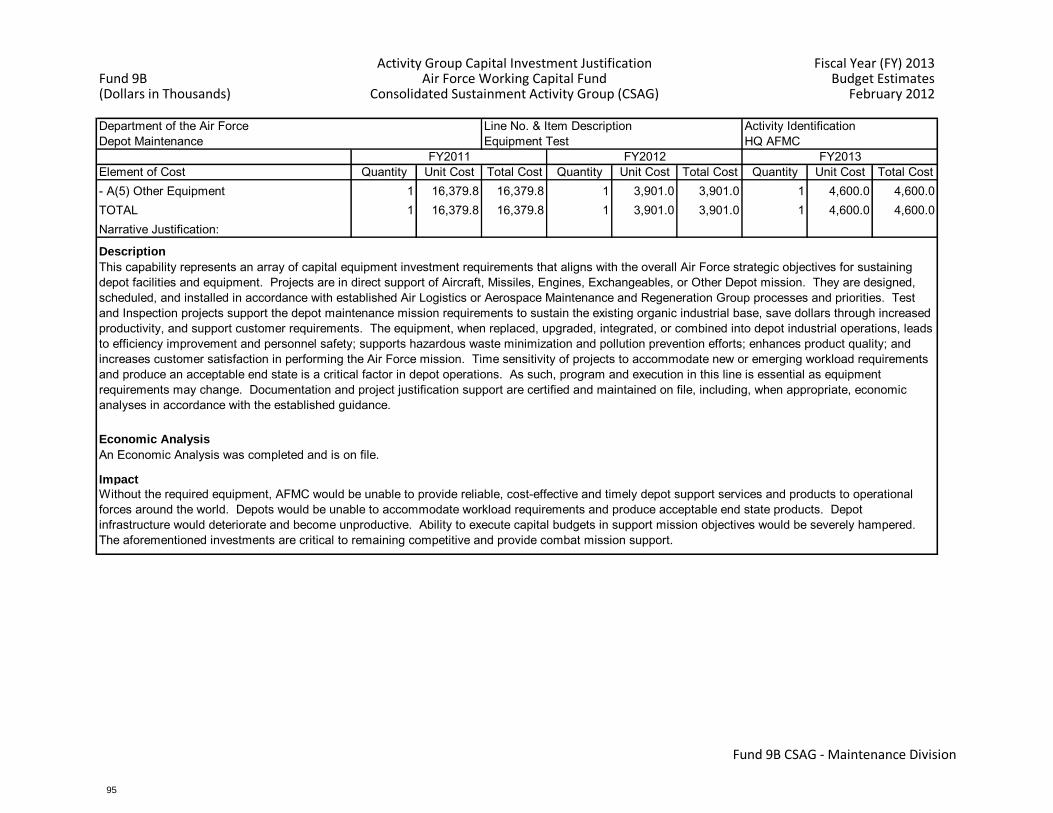
Q Activity Group Capital Investment Justification Fiscal Year (FY) 2013Fund 9B Air Force Working Capital Fund Budget Estimates(Dollars in Thousands) Consolidated Sustainment Activity Group (CSAG) February 2012
Department of the Air Force Line No. & Item Description Activity IdentificationDepot Maintenance Equipment Test HQ AFMC
Element of Cost Quantity Unit Cost Total Cost Quantity Unit Cost Total Cost Quantity Unit Cost Total Cost- A(5) Other Equipment 1 16,379.8 16,379.8 1 3,901.0 3,901.0 1 4,600.0 4,600.0TOTAL 1 16,379.8 16,379.8 1 3,901.0 3,901.0 1 4,600.0 4,600.0Narrative Justification:
Description
Economic Analysis
Impact
Without the required equipment, AFMC would be unable to provide reliable, cost-effective and timely depot support services and products to operational forces around the world. Depots would be unable to accommodate workload requirements and produce acceptable end state products. Depot infrastructure would deteriorate and become unproductive. Ability to execute capital budgets in support mission objectives would be severely hampered. The aforementioned investments are critical to remaining competitive and provide combat mission support.
FY2011 FY2012 FY2013
This capability represents an array of capital equipment investment requirements that aligns with the overall Air Force strategic objectives for sustaining depot facilities and equipment. Projects are in direct support of Aircraft, Missiles, Engines, Exchangeables, or Other Depot mission. They are designed, scheduled, and installed in accordance with established Air Logistics or Aerospace Maintenance and Regeneration Group processes and priorities. Test and Inspection projects support the depot maintenance mission requirements to sustain the existing organic industrial base, save dollars through increased productivity, and support customer requirements. The equipment, when replaced, upgraded, integrated, or combined into depot industrial operations, leads to efficiency improvement and personnel safety; supports hazardous waste minimization and pollution prevention efforts; enhances product quality; and increases customer satisfaction in performing the Air Force mission. Time sensitivity of projects to accommodate new or emerging workload requirements and produce an acceptable end state is a critical factor in depot operations. As such, program and execution in this line is essential as equipment requirements may change. Documentation and project justification support are certified and maintained on file, including, when appropriate, economic analyses in accordance with the established guidance.
An Economic Analysis was completed and is on file.
Fund 9B CSAG - Maintenance Division
CAPITAL BUDGET
95

Q Activity Group Capital Investment Justification Fiscal Year (FY) 2013Fund 9B Air Force Working Capital Fund Budget Estimates(Dollars in Thousands) Consolidated Sustainment Activity Group (CSAG) February 2012
Department of the Air Force Line No. & Item Description Activity IdentificationDepot Maintenance ADPE & TELECOM HQ AFMC
Element of Cost Quantity Unit Cost Total Cost Quantity Unit Cost Total Cost Quantity Unit Cost Total Cost- B(5) Other ADPE/Telecomm 1 4,663.5 4,663.5 1 6,167.0 6,167.0 1 4,579.0 4,579.0TOTAL 1 4,663.5 4,663.5 1 6,167.0 6,167.0 1 4,579.0 4,579.0Narrative Justification:
Description
Economic Analysis
Impact
Hardware upgrades are critical to maintaining system reliability and improving operating performance. The new operating system will improve CSAG Maintenance Division's capability to actively monitor and make corrective actions in financial and operational performance. Infrastructure upgrades must be placed into service prior to upgrading the new operating system. The Air Force will be unable to track financial and operational performance without the planned infrastructure replacement and improvement. Lack of investment will impact the depot’s ability to effectively monitor performance which results in cost increases and reduction in aircraft availability for the warfighter.
FY2011 FY2012 FY2013
This capability represents an array of capital ADPE and Telecommunications investment that aligns with the overall Air Force strategic objectives for sustaining depot facilities and equipment. Projects will upgrade the infrastructure required to maintain the Depot Maintenance Accounting and Production System (DMAPS) and other depot maintenance legacy systems. All upgrades are implemented within one common infrastructure. This effort will upgrade fiber optics, routers, servers and other infrastructure items required to support the implementation of an XP (operating system) network. The aforementioned investment is required to ensure commonality and to replace equipment before failure due to age. The equipment replacement is in accordance with the logistics strategic plan approved by the Deputy Under Secretary of Defense (Logistics).
An Economic Analysis was completed and is on file.
Fund 9B CSAG - Maintenance Division
CAPITAL BUDGET
96

Q Activity Group Capital Investment Justification Fiscal Year (FY) 2013Fund 9B Air Force Working Capital Fund Budget Estimates(Dollars in Thousands) Consolidated Sustainment Activity Group (CSAG) February 2012
Department of the Air Force Line No. & Item Description Activity IdentificationDepot Maintenance SOFTWARE DEVELOPMENT HQ AFMC
Element of Cost Quantity Unit Cost Total Cost Quantity Unit Cost Total Cost Quantity Unit Cost Total Cost- C(5) Other Software Development 1 .0 .0 0 .0 .0 0 .0 .0TOTAL 1 .0 .0 0 .0 .0 0 .0 .0Narrative Justification:
Description
Economic Analysis
Impact
Planned system upgrades are critical to maintaining continuous visibility for asset management as well as real-time decisions regarding efficient and effective maintenance due to changing conditions not only from the field but from within the maintenance wings themselves. The changes made to existing systems will allow successful implementation of more efficient maintenance concepts in order to effectively utilize the Air Logistics Centers' resources. Efficiencies critical for long-term success will not be realized if projects remain unfunded.
FY2011 FY2012 FY2013
This capability provides for the development and acquisition of both operating and application software which support depot maintenance operations. Software requirements include systems programs, application programs, commercial-off-the-shelf (COTS) software, independent subroutines, databases, and software documentation. System application software may be acquired through (1) the purchase of a COTS system; (2) the development of new applications through either internal development (in-house) or contractual effort; or (3) the modernization of existing software that significantly expands and/or enhances its existing capabilities.
An Economic Analysis was completed and is on file.
Fund 9B CSAG - Maintenance Division
CAPITAL BUDGET
97
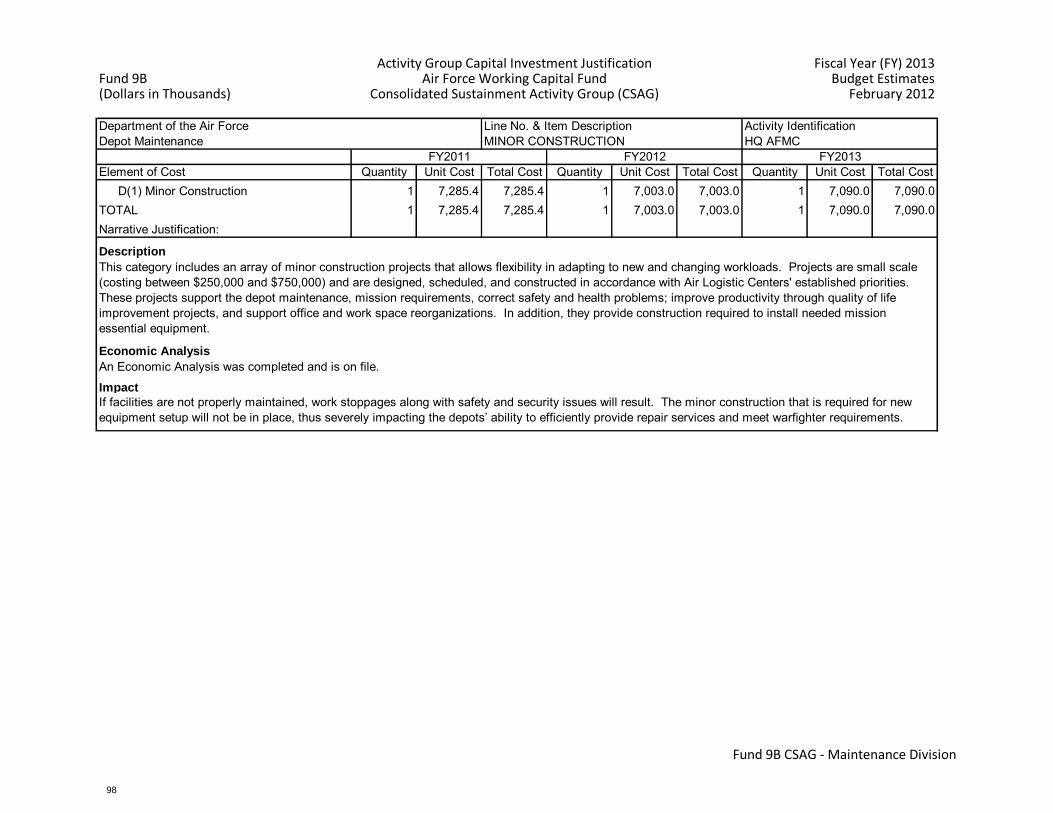
Q Activity Group Capital Investment Justification Fiscal Year (FY) 2013Fund 9B Air Force Working Capital Fund Budget Estimates(Dollars in Thousands) Consolidated Sustainment Activity Group (CSAG) February 2012
Department of the Air Force Line No. & Item Description Activity IdentificationDepot Maintenance MINOR CONSTRUCTION HQ AFMC
Element of Cost Quantity Unit Cost Total Cost Quantity Unit Cost Total Cost Quantity Unit Cost Total CostD(1) Minor Construction 1 7,285.4 7,285.4 1 7,003.0 7,003.0 1 7,090.0 7,090.0
TOTAL 1 7,285.4 7,285.4 1 7,003.0 7,003.0 1 7,090.0 7,090.0Narrative Justification:
Description
Economic Analysis
Impact
If facilities are not properly maintained, work stoppages along with safety and security issues will result. The minor construction that is required for new equipment setup will not be in place, thus severely impacting the depots’ ability to efficiently provide repair services and meet warfighter requirements.
FY2011 FY2012 FY2013
This category includes an array of minor construction projects that allows flexibility in adapting to new and changing workloads. Projects are small scale (costing between $250,000 and $750,000) and are designed, scheduled, and constructed in accordance with Air Logistic Centers' established priorities. These projects support the depot maintenance, mission requirements, correct safety and health problems; improve productivity through quality of life improvement projects, and support office and work space reorganizations. In addition, they provide construction required to install needed mission essential equipment.
An Economic Analysis was completed and is on file.
Fund 9B CSAG - Maintenance Division
CAPITAL BUDGET
98

Q Activity Group Capital Investment Justification Fiscal Year (FY) 2013Fund 9B Air Force Working Capital Fund Budget Estimates(Dollars in Thousands) Consolidated Sustainment Activity Group (CSAG) February 2012
Department of the Air Force Line No. & Item Description Activity IdentificationSupply Management PRPS HQ AFMC
Element of Cost Quantity Unit Cost Total Cost Quantity Unit Cost Total Cost Quantity Unit Cost Total Cost- C(2) System Development 0 .0 .0 0 .0 .0 1 1,865.0 1,865.0TOTAL 0 .0 .0 0 .0 .0 1 1,865.0 1,865.0Narrative Justification:
Description
Economic Analysis
Impact
PRPS (Software) Interface to CRMS: The change from receiving quarterly repair forecast to daily requirements calculations reduces emergency contract actions, increases repair order accuracy and timeliness and ultimately leads to increased aircraft availability. PRPS (Software) BizTalk: The removal of the Biztalk services requires a replacement service for the PRPS application to continue interface processing. Failure to fund the creation of the system software to replace Biztalk would essentially render PRPS system non-operational. PRPS (Software) Interface to SMART: This newly added functionality will satisfy the Aircraft Sustainment Directorate (ASD) reporting requirements and compliance with future mandates to use PRPS as the standard purchase request system for weapon system sustainment and acquisition.
FY2011 FY2012 FY2013
Purchase Request Process System (PRPS) (Software) Interface to Contract Repair Management System (CRMS) $415K: PRPS requires an interface connection with the CRMS to feed daily repair computations, which will provide timely contract repair quantities and allow for real-time intervention to accomplish data changes. PRPS (Software) BizTalk $950K: Air Force plans to remove the Microsoft BizTalk interface messaging service. Custom developed code is required as a replacement for the Biztalk COTS product. PRPS (Software) Interface to SMART $500K: Air Force policy directs all program financial data flow through Comprehensive Cost and Requirement System (CCaR) to the System Metrics and Reporting Tool (SMART) as part of program data requirements and flow. This interface through the executive dashboard of CCaR allows the Aircraft Sustainment Directorate (ASD) community to tie commitment documents (purchase requests, and delivery order requests) back to specific program financial requirements and flow to correct finance and obligation accounts. FY 2013 NDAA certification submission for PRPS (Software) CRMS, BizTalk, and SMART is underway. PRPS (Software) Interface to CRMS: Initial design of this requirement is expected in FY 2013 and design, test and fielding is expected in FY 2014. The requirement has been vetted through the Functional Requirements Board (FRB ) and through the Program Management Office (PMO) with use case input. PRPS Software Interface to CRMS was included in the FY 2012 NDAA Certification package.
An Economic Analysis (EA) for this entire package has been completed, approved and is on file. PRPS (Soft) Interface to BizTalk/SMART: A Cost Analysis is complete and is on file.
Fund 9B CSAG - Supply Division
CAPITAL BUDGET
99
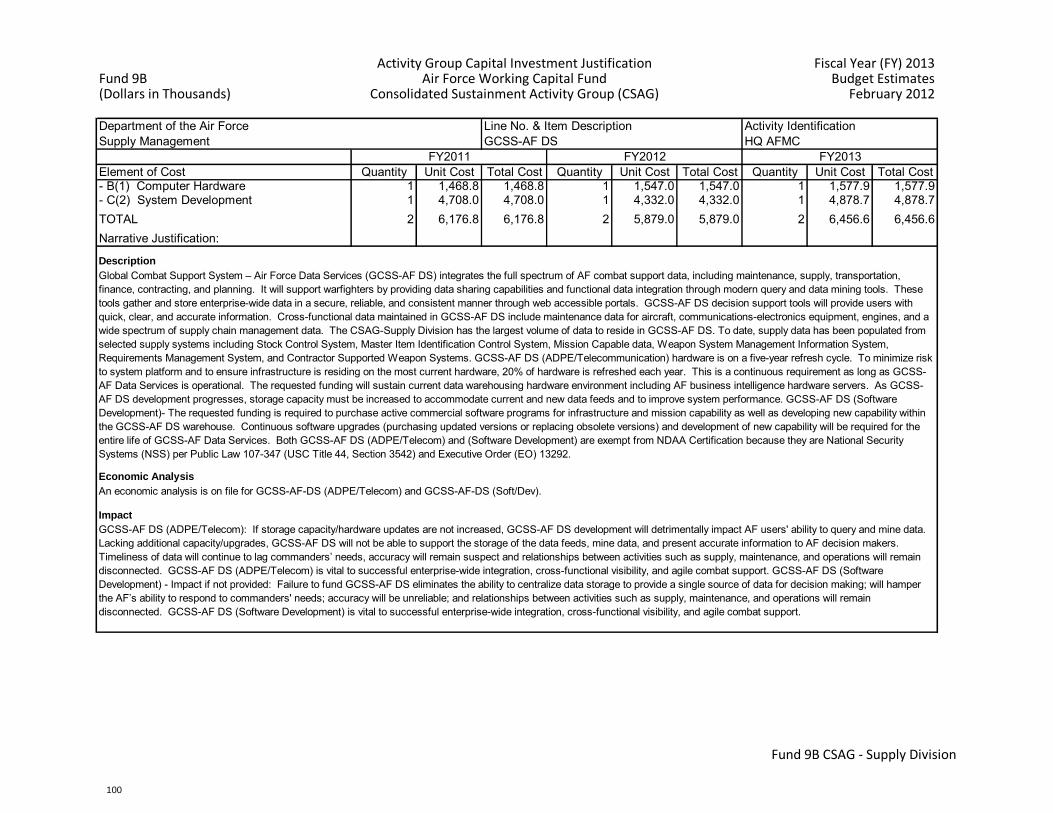
Q Activity Group Capital Investment Justification Fiscal Year (FY) 2013Fund 9B Air Force Working Capital Fund Budget Estimates(Dollars in Thousands) Consolidated Sustainment Activity Group (CSAG) February 2012
Department of the Air Force Line No. & Item Description Activity IdentificationSupply Management GCSS-AF DS HQ AFMC
Element of Cost Quantity Unit Cost Total Cost Quantity Unit Cost Total Cost Quantity Unit Cost Total Cost- B(1) Computer Hardware 1 1,468.8 1,468.8 1 1,547.0 1,547.0 1 1,577.9 1,577.9- C(2) System Development 1 4,708.0 4,708.0 1 4,332.0 4,332.0 1 4,878.7 4,878.7TOTAL 2 6,176.8 6,176.8 2 5,879.0 5,879.0 2 6,456.6 6,456.6Narrative Justification:
Description
Economic Analysis
Impact
GCSS-AF DS (ADPE/Telecom): If storage capacity/hardware updates are not increased, GCSS-AF DS development will detrimentally impact AF users' ability to query and mine data. Lacking additional capacity/upgrades, GCSS-AF DS will not be able to support the storage of the data feeds, mine data, and present accurate information to AF decision makers. Timeliness of data will continue to lag commanders’ needs, accuracy will remain suspect and relationships between activities such as supply, maintenance, and operations will remain disconnected. GCSS-AF DS (ADPE/Telecom) is vital to successful enterprise-wide integration, cross-functional visibility, and agile combat support. GCSS-AF DS (Software Development) - Impact if not provided: Failure to fund GCSS-AF DS eliminates the ability to centralize data storage to provide a single source of data for decision making; will hamper the AF’s ability to respond to commanders' needs; accuracy will be unreliable; and relationships between activities such as supply, maintenance, and operations will remain disconnected. GCSS-AF DS (Software Development) is vital to successful enterprise-wide integration, cross-functional visibility, and agile combat support.
FY2011 FY2012 FY2013
Global Combat Support System – Air Force Data Services (GCSS-AF DS) integrates the full spectrum of AF combat support data, including maintenance, supply, transportation, finance, contracting, and planning. It will support warfighters by providing data sharing capabilities and functional data integration through modern query and data mining tools. These tools gather and store enterprise-wide data in a secure, reliable, and consistent manner through web accessible portals. GCSS-AF DS decision support tools will provide users with quick, clear, and accurate information. Cross-functional data maintained in GCSS-AF DS include maintenance data for aircraft, communications-electronics equipment, engines, and a wide spectrum of supply chain management data. The CSAG-Supply Division has the largest volume of data to reside in GCSS-AF DS. To date, supply data has been populated from selected supply systems including Stock Control System, Master Item Identification Control System, Mission Capable data, Weapon System Management Information System, Requirements Management System, and Contractor Supported Weapon Systems. GCSS-AF DS (ADPE/Telecommunication) hardware is on a five-year refresh cycle. To minimize risk to system platform and to ensure infrastructure is residing on the most current hardware, 20% of hardware is refreshed each year. This is a continuous requirement as long as GCSS-AF Data Services is operational. The requested funding will sustain current data warehousing hardware environment including AF business intelligence hardware servers. As GCSS-AF DS development progresses, storage capacity must be increased to accommodate current and new data feeds and to improve system performance. GCSS-AF DS (Software Development)- The requested funding is required to purchase active commercial software programs for infrastructure and mission capability as well as developing new capability within the GCSS-AF DS warehouse. Continuous software upgrades (purchasing updated versions or replacing obsolete versions) and development of new capability will be required for the entire life of GCSS-AF Data Services. Both GCSS-AF DS (ADPE/Telecom) and (Software Development) are exempt from NDAA Certification because they are National Security Systems (NSS) per Public Law 107-347 (USC Title 44, Section 3542) and Executive Order (EO) 13292.
An economic analysis is on file for GCSS-AF-DS (ADPE/Telecom) and GCSS-AF-DS (Soft/Dev).
Fund 9B CSAG - Supply Division
CAPITAL BUDGET
100
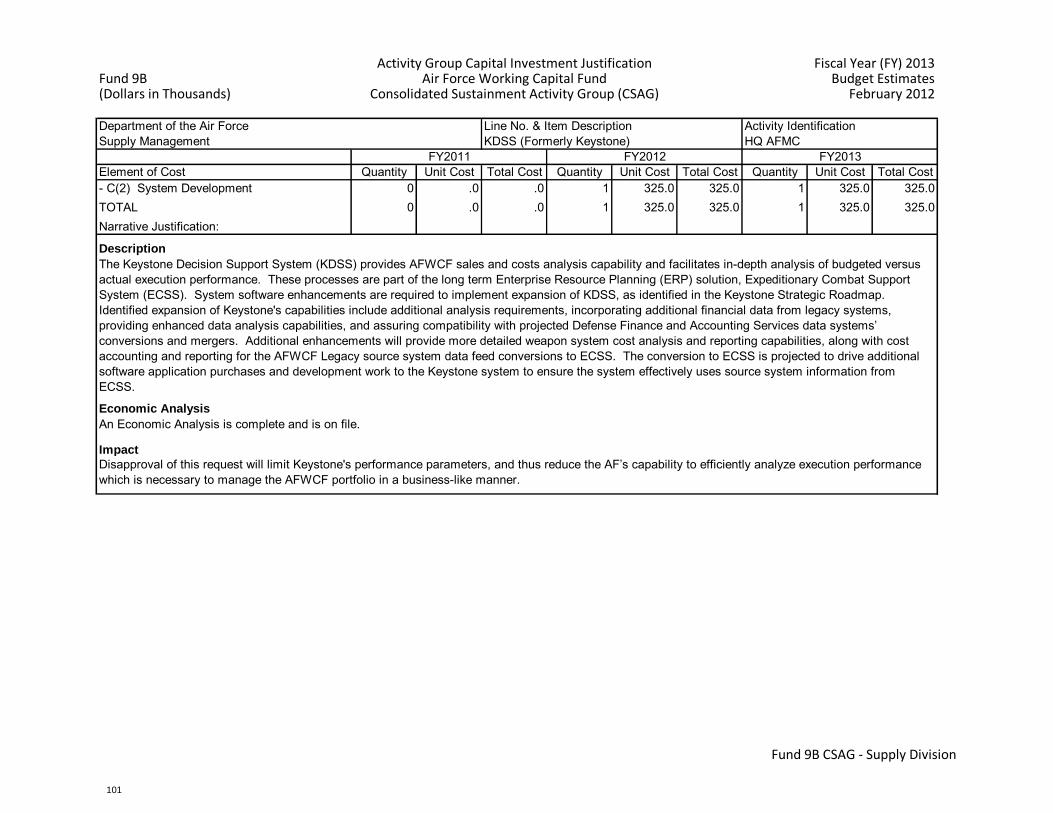
Q Activity Group Capital Investment Justification Fiscal Year (FY) 2013Fund 9B Air Force Working Capital Fund Budget Estimates(Dollars in Thousands) Consolidated Sustainment Activity Group (CSAG) February 2012
Department of the Air Force Line No. & Item Description Activity IdentificationSupply Management KDSS (Formerly Keystone) HQ AFMC
Element of Cost Quantity Unit Cost Total Cost Quantity Unit Cost Total Cost Quantity Unit Cost Total Cost- C(2) System Development 0 .0 .0 1 325.0 325.0 1 325.0 325.0TOTAL 0 .0 .0 1 325.0 325.0 1 325.0 325.0Narrative Justification:
Description
Economic Analysis
Impact
Disapproval of this request will limit Keystone's performance parameters, and thus reduce the AF’s capability to efficiently analyze execution performance which is necessary to manage the AFWCF portfolio in a business-like manner.
FY2011 FY2012 FY2013
The Keystone Decision Support System (KDSS) provides AFWCF sales and costs analysis capability and facilitates in-depth analysis of budgeted versus actual execution performance. These processes are part of the long term Enterprise Resource Planning (ERP) solution, Expeditionary Combat Support System (ECSS). System software enhancements are required to implement expansion of KDSS, as identified in the Keystone Strategic Roadmap. Identified expansion of Keystone's capabilities include additional analysis requirements, incorporating additional financial data from legacy systems, providing enhanced data analysis capabilities, and assuring compatibility with projected Defense Finance and Accounting Services data systems’ conversions and mergers. Additional enhancements will provide more detailed weapon system cost analysis and reporting capabilities, along with cost accounting and reporting for the AFWCF Legacy source system data feed conversions to ECSS. The conversion to ECSS is projected to drive additional software application purchases and development work to the Keystone system to ensure the system effectively uses source system information from ECSS.
An Economic Analysis is complete and is on file.
Fund 9B CSAG - Supply Division
CAPITAL BUDGET
101
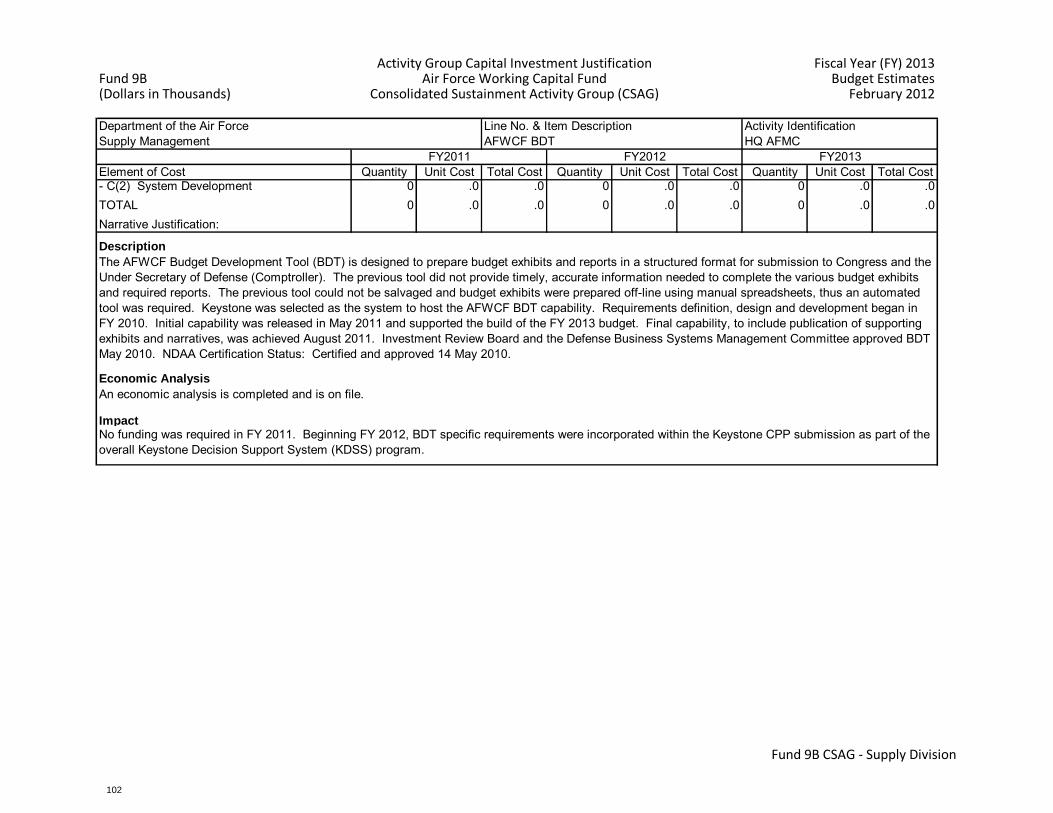
Q Activity Group Capital Investment Justification Fiscal Year (FY) 2013Fund 9B Air Force Working Capital Fund Budget Estimates(Dollars in Thousands) Consolidated Sustainment Activity Group (CSAG) February 2012
Department of the Air Force Line No. & Item Description Activity IdentificationSupply Management AFWCF BDT HQ AFMC
Element of Cost Quantity Unit Cost Total Cost Quantity Unit Cost Total Cost Quantity Unit Cost Total Cost- C(2) System Development 0 .0 .0 0 .0 .0 0 .0 .0TOTAL 0 .0 .0 0 .0 .0 0 .0 .0Narrative Justification:
Description
Economic Analysis
ImpactNo funding was required in FY 2011. Beginning FY 2012, BDT specific requirements were incorporated within the Keystone CPP submission as part of the overall Keystone Decision Support System (KDSS) program.
FY2011 FY2012 FY2013
The AFWCF Budget Development Tool (BDT) is designed to prepare budget exhibits and reports in a structured format for submission to Congress and the Under Secretary of Defense (Comptroller). The previous tool did not provide timely, accurate information needed to complete the various budget exhibits and required reports. The previous tool could not be salvaged and budget exhibits were prepared off-line using manual spreadsheets, thus an automated tool was required. Keystone was selected as the system to host the AFWCF BDT capability. Requirements definition, design and development began in FY 2010. Initial capability was released in May 2011 and supported the build of the FY 2013 budget. Final capability, to include publication of supporting exhibits and narratives, was achieved August 2011. Investment Review Board and the Defense Business Systems Management Committee approved BDT May 2010. NDAA Certification Status: Certified and approved 14 May 2010.
An economic analysis is completed and is on file.
Fund 9B CSAG - Supply Division
CAPITAL BUDGET
102
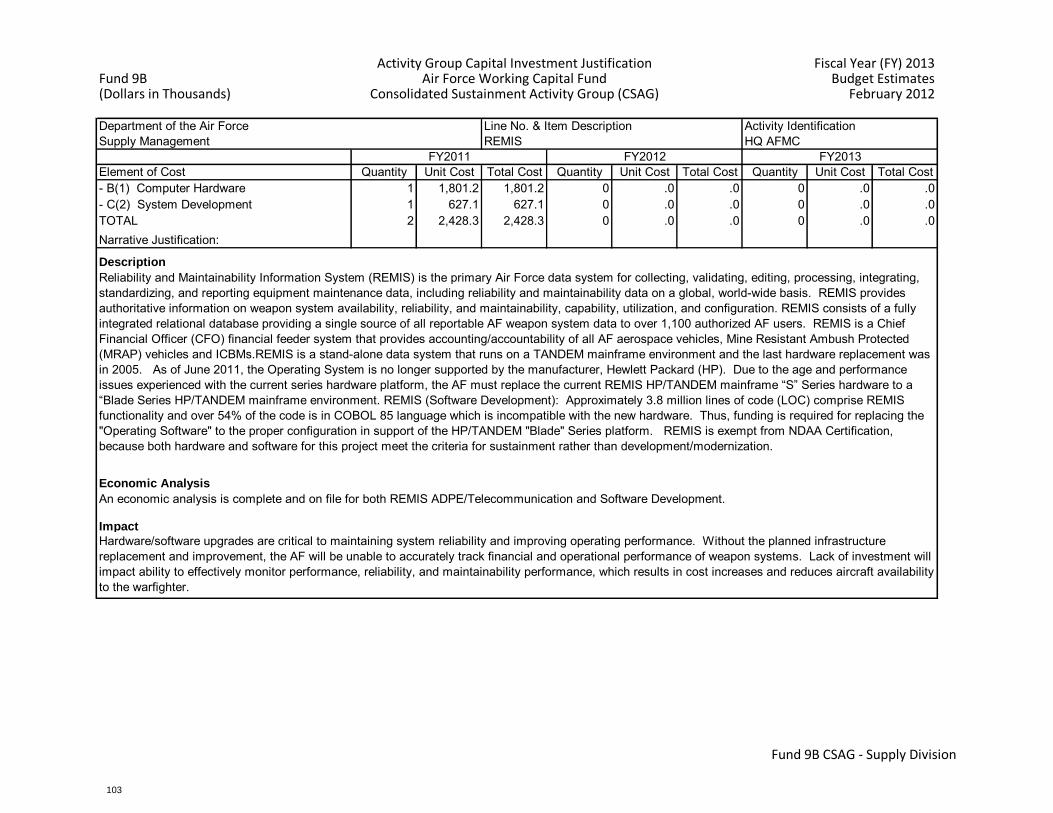
Q Activity Group Capital Investment Justification Fiscal Year (FY) 2013Fund 9B Air Force Working Capital Fund Budget Estimates(Dollars in Thousands) Consolidated Sustainment Activity Group (CSAG) February 2012
Department of the Air Force Line No. & Item Description Activity IdentificationSupply Management REMIS HQ AFMC
Element of Cost Quantity Unit Cost Total Cost Quantity Unit Cost Total Cost Quantity Unit Cost Total Cost- B(1) Computer Hardware 1 1,801.2 1,801.2 0 .0 .0 0 .0 .0- C(2) System Development 1 627.1 627.1 0 .0 .0 0 .0 .0TOTAL 2 2,428.3 2,428.3 0 .0 .0 0 .0 .0Narrative Justification:
Description
Economic Analysis
Impact
Hardware/software upgrades are critical to maintaining system reliability and improving operating performance. Without the planned infrastructure replacement and improvement, the AF will be unable to accurately track financial and operational performance of weapon systems. Lack of investment will impact ability to effectively monitor performance, reliability, and maintainability performance, which results in cost increases and reduces aircraft availability to the warfighter.
FY2011 FY2012 FY2013
Reliability and Maintainability Information System (REMIS) is the primary Air Force data system for collecting, validating, editing, processing, integrating, standardizing, and reporting equipment maintenance data, including reliability and maintainability data on a global, world-wide basis. REMIS provides authoritative information on weapon system availability, reliability, and maintainability, capability, utilization, and configuration. REMIS consists of a fully integrated relational database providing a single source of all reportable AF weapon system data to over 1,100 authorized AF users. REMIS is a Chief Financial Officer (CFO) financial feeder system that provides accounting/accountability of all AF aerospace vehicles, Mine Resistant Ambush Protected (MRAP) vehicles and ICBMs.REMIS is a stand-alone data system that runs on a TANDEM mainframe environment and the last hardware replacement was in 2005. As of June 2011, the Operating System is no longer supported by the manufacturer, Hewlett Packard (HP). Due to the age and performance issues experienced with the current series hardware platform, the AF must replace the current REMIS HP/TANDEM mainframe “S” Series hardware to a “Blade Series HP/TANDEM mainframe environment. REMIS (Software Development): Approximately 3.8 million lines of code (LOC) comprise REMIS functionality and over 54% of the code is in COBOL 85 language which is incompatible with the new hardware. Thus, funding is required for replacing the "Operating Software" to the proper configuration in support of the HP/TANDEM "Blade" Series platform. REMIS is exempt from NDAA Certification, because both hardware and software for this project meet the criteria for sustainment rather than development/modernization.
An economic analysis is complete and on file for both REMIS ADPE/Telecommunication and Software Development.
Fund 9B CSAG - Supply Division
CAPITAL BUDGET
103

Q Activity Group Capital Investment Justification Fiscal Year (FY) 2013Fund 9B Air Force Working Capital Fund Budget Estimates(Dollars in Thousands) Consolidated Sustainment Activity Group (CSAG) February 2012
Department of the Air Force Line No. & Item Description Activity IdentificationSupply Management EXPRESS HQ AFMC
Element of Cost Quantity Unit Cost Total Cost Quantity Unit Cost Total Cost Quantity Unit Cost Total Cost- C(2) System Development 1 525.6 525.6 1 743.0 743.0 1 250.0 250.0TOTAL 1 525.6 525.6 1 743.0 743.0 1 250.0 250.0Narrative Justification:
Description
Economic Analysis
Impact
Failure to implement will have an extremely negative impact on EXPRESS ability to quickly respond to CSPEC simulated assessments. If funding is not approved, the AF will not have the capability to perform short-run analysis of impact changes in operational tempo, deployments, etc., will have on wholesale supply and maintenance. This lack of capability will have a negative impact on the warfighters’ ability to respond to the fight and once in the fight respond to changes and impact overall ability to stay in the fight.
FY2011 FY2012 FY2013
Funding for FY 2012 supports Execution and Prioritization of Repair Support System (EXPRESS) enhancement of current EXPRESS Planning Module (EPM) capabilities and improvement of the interface so that EXPRESS will be able to respond to Combat Spares Planning, Execution and Control (CSPEC) simulated assessments. EXPRESS requires an enhanced interface between Air Force and Defense Logistics Agency (DLA) data systems in order for EXPRESS to provide information such as Kit Serial Number (KSN), updated authorized Readiness Spares Package (RSP) quantity and updated RSP item demand rates. The planned EPM makes the application more flexible and responsive in assessing the impacts on wholesale supply and maintenance from changes in operational tempo, deployments, etc. This capability supports critical warfighter needs. FY 2013 NDAA certification submission for EXPRESS is underway. FY 2011 - Capabilities delivered relieve constraints to organic repair by enhancing the interface between AF and DLA data systems. FY 2012 - Capabilities will modify the EXPRESS Planning Module (EPM) to supply the Combat Spares Planning, Execution, and Control (CSPEC) Process. This will allow the application more flexibility and improved responses to short-run requests. FY 2013 - Capabilities will allow for the creation and transmittal of information from EXPRESS to DLA on DLA parts requirements, thus providing enhanced EXPRESS ability to identify shortages on DLA parts.
A complete Cost Analysis is on file.
Fund 9B CSAG - Supply Division
CAPITAL BUDGET
104
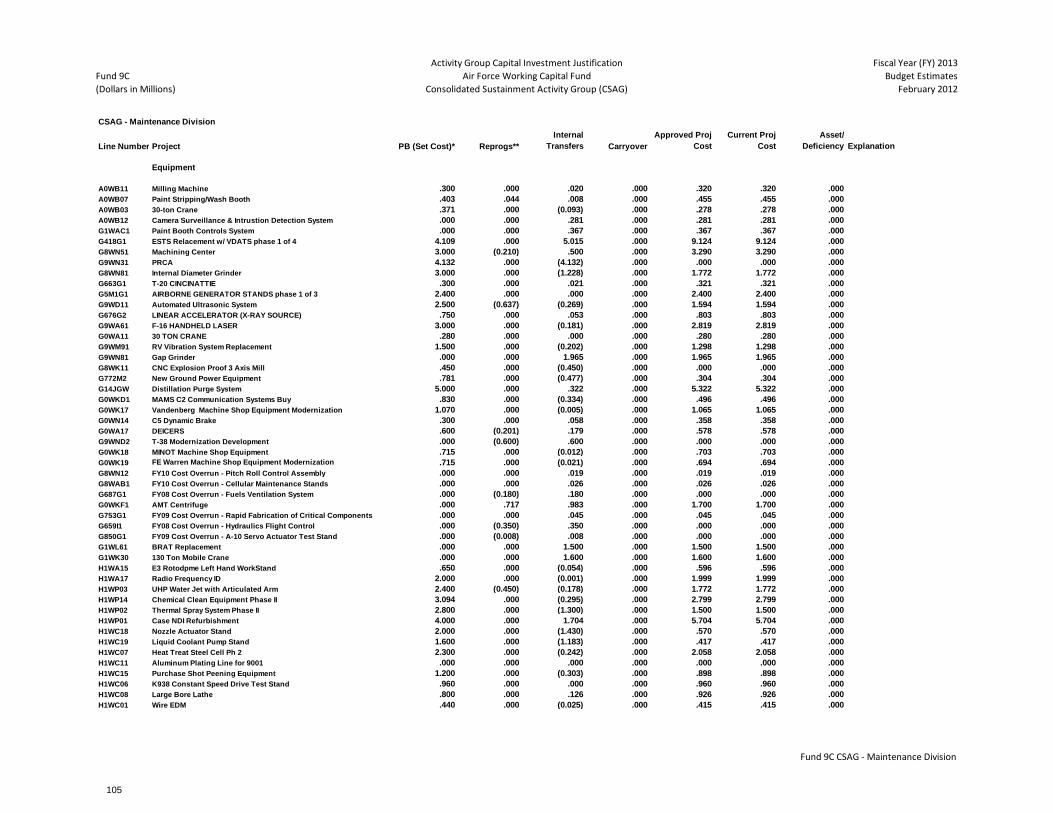
Fund 9C
(Dollars in Millions)
Activity Group Capital Investment Justification
Air Force Working Capital Fund
Consolidated Sustainment Activity Group (CSAG)
Fiscal Year (FY) 2013
Budget Estimates
February 2012
CSAG - Maintenance Division
Line Number Project PB (Set Cost)* Reprogs**
Internal
Transfers Carryover
Approved Proj
Cost
Current Proj
Cost
Asset/
Deficiency Explanation
Equipment
A0WB11 Milling Machine .300 .000 .020 .000 .320 .320 .000
A0WB07 Paint Stripping/Wash Booth .403 .044 .008 .000 .455 .455 .000
A0WB03 30-ton Crane .371 .000 (0.093) .000 .278 .278 .000
A0WB12 Camera Surveillance & Intrustion Detection System .000 .000 .281 .000 .281 .281 .000
G1WAC1 Paint Booth Controls System .000 .000 .367 .000 .367 .367 .000
G418G1 ESTS Relacement w/ VDATS phase 1 of 4 4.109 .000 5.015 .000 9.124 9.124 .000
G8WN51 Machining Center 3.000 (0.210) .500 .000 3.290 3.290 .000
G9WN31 PRCA 4.132 .000 (4.132) .000 .000 .000 .000
G8WN81 Internal Diameter Grinder 3.000 .000 (1.228) .000 1.772 1.772 .000
G663G1 T-20 CINCINATTIE .300 .000 .021 .000 .321 .321 .000
G5M1G1 AIRBORNE GENERATOR STANDS phase 1 of 3 2.400 .000 .000 .000 2.400 2.400 .000
G9WD11 Automated Ultrasonic System 2.500 (0.637) (0.269) .000 1.594 1.594 .000
G676G2 LINEAR ACCELERATOR (X-RAY SOURCE) .750 .000 .053 .000 .803 .803 .000
G9WA61 F-16 HANDHELD LASER 3.000 .000 (0.181) .000 2.819 2.819 .000
G0WA11 30 TON CRANE .280 .000 .000 .000 .280 .280 .000
G9WM91 RV Vibration System Replacement 1.500 .000 (0.202) .000 1.298 1.298 .000
G9WN81 Gap Grinder .000 .000 1.965 .000 1.965 1.965 .000
G8WK11 CNC Explosion Proof 3 Axis Mill .450 .000 (0.450) .000 .000 .000 .000
G772M2 New Ground Power Equipment .781 .000 (0.477) .000 .304 .304 .000
G14JGW Distillation Purge System 5.000 .000 .322 .000 5.322 5.322 .000
G0WKD1 MAMS C2 Communication Systems Buy .830 .000 (0.334) .000 .496 .496 .000
G0WK17 Vandenberg Machine Shop Equipment Modernization 1.070 .000 (0.005) .000 1.065 1.065 .000
G0WN14 C5 Dynamic Brake .300 .000 .058 .000 .358 .358 .000
G0WA17 DEICERS .600 (0.201) .179 .000 .578 .578 .000
G9WND2 T-38 Modernization Development .000 (0.600) .600 .000 .000 .000 .000
G0WK18 MINOT Machine Shop Equipment .715 .000 (0.012) .000 .703 .703 .000
G0WK19 FE Warren Machine Shop Equipment Modernization .715 .000 (0.021) .000 .694 .694 .000
G8WN12 FY10 Cost Overrun - Pitch Roll Control Assembly .000 .000 .019 .000 .019 .019 .000
G8WAB1 FY10 Cost Overrun - Cellular Maintenance Stands .000 .000 .026 .000 .026 .026 .000
G687G1 FY08 Cost Overrun - Fuels Ventilation System .000 (0.180) .180 .000 .000 .000 .000
G0WKF1 AMT Centrifuge .000 .717 .983 .000 1.700 1.700 .000
G753G1 FY09 Cost Overrun - Rapid Fabrication of Critical Components .000 .000 .045 .000 .045 .045 .000
G659I1 FY08 Cost Overrun - Hydraulics Flight Control .000 (0.350) .350 .000 .000 .000 .000
G850G1 FY09 Cost Overrun - A-10 Servo Actuator Test Stand .000 (0.008) .008 .000 .000 .000 .000
G1WL61 BRAT Replacement .000 .000 1.500 .000 1.500 1.500 .000
G1WK30 130 Ton Mobile Crane .000 .000 1.600 .000 1.600 1.600 .000
H1WA15 E3 Rotodpme Left Hand WorkStand .650 .000 (0.054) .000 .596 .596 .000
H1WA17 Radio Frequency ID 2.000 .000 (0.001) .000 1.999 1.999 .000
H1WP03 UHP Water Jet with Articulated Arm 2.400 (0.450) (0.178) .000 1.772 1.772 .000
H1WP14 Chemical Clean Equipment Phase II 3.094 .000 (0.295) .000 2.799 2.799 .000
H1WP02 Thermal Spray System Phase II 2.800 .000 (1.300) .000 1.500 1.500 .000
H1WP01 Case NDI Refurbishment 4.000 .000 1.704 .000 5.704 5.704 .000
H1WC18 Nozzle Actuator Stand 2.000 .000 (1.430) .000 .570 .570 .000
H1WC19 Liquid Coolant Pump Stand 1.600 .000 (1.183) .000 .417 .417 .000
H1WC07 Heat Treat Steel Cell Ph 2 2.300 .000 (0.242) .000 2.058 2.058 .000
H1WC11 Aluminum Plating Line for 9001 .000 .000 .000 .000 .000 .000 .000
H1WC15 Purchase Shot Peening Equipment 1.200 .000 (0.303) .000 .898 .898 .000
H1WC06 K938 Constant Speed Drive Test Stand .960 .000 .000 .000 .960 .960 .000
H1WC08 Large Bore Lathe .800 .000 .126 .000 .926 .926 .000
H1WC01 Wire EDM .440 .000 (0.025) .000 .415 .415 .000
Fund 9C CSAG - Maintenance Division
CAPITAL BUDGET
105
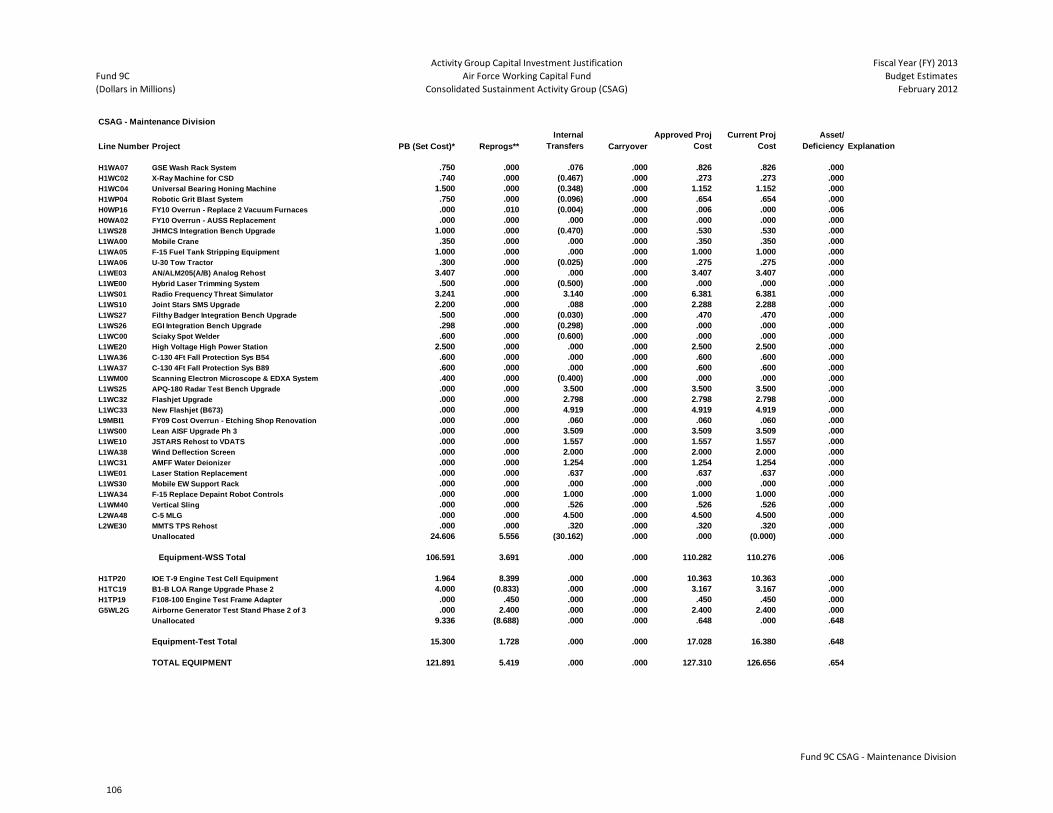
Fund 9C
(Dollars in Millions)
Activity Group Capital Investment Justification
Air Force Working Capital Fund
Consolidated Sustainment Activity Group (CSAG)
Fiscal Year (FY) 2013
Budget Estimates
February 2012
CSAG - Maintenance Division
Line Number Project PB (Set Cost)* Reprogs**
Internal
Transfers Carryover
Approved Proj
Cost
Current Proj
Cost
Asset/
Deficiency Explanation
H1WA07 GSE Wash Rack System .750 .000 .076 .000 .826 .826 .000
H1WC02 X-Ray Machine for CSD .740 .000 (0.467) .000 .273 .273 .000
H1WC04 Universal Bearing Honing Machine 1.500 .000 (0.348) .000 1.152 1.152 .000
H1WP04 Robotic Grit Blast System .750 .000 (0.096) .000 .654 .654 .000
H0WP16 FY10 Overrun - Replace 2 Vacuum Furnaces .000 .010 (0.004) .000 .006 .000 .006
H0WA02 FY10 Overrun - AUSS Replacement .000 .000 .000 .000 .000 .000 .000
L1WS28 JHMCS Integration Bench Upgrade 1.000 .000 (0.470) .000 .530 .530 .000
L1WA00 Mobile Crane .350 .000 .000 .000 .350 .350 .000
L1WA05 F-15 Fuel Tank Stripping Equipment 1.000 .000 .000 .000 1.000 1.000 .000
L1WA06 U-30 Tow Tractor .300 .000 (0.025) .000 .275 .275 .000
L1WE03 AN/ALM205(A/B) Analog Rehost 3.407 .000 .000 .000 3.407 3.407 .000
L1WE00 Hybrid Laser Trimming System .500 .000 (0.500) .000 .000 .000 .000
L1WS01 Radio Frequency Threat Simulator 3.241 .000 3.140 .000 6.381 6.381 .000
L1WS10 Joint Stars SMS Upgrade 2.200 .000 .088 .000 2.288 2.288 .000
L1WS27 Filthy Badger Integration Bench Upgrade .500 .000 (0.030) .000 .470 .470 .000
L1WS26 EGI Integration Bench Upgrade .298 .000 (0.298) .000 .000 .000 .000
L1WC00 Sciaky Spot Welder .600 .000 (0.600) .000 .000 .000 .000
L1WE20 High Voltage High Power Station 2.500 .000 .000 .000 2.500 2.500 .000
L1WA36 C-130 4Ft Fall Protection Sys B54 .600 .000 .000 .000 .600 .600 .000
L1WA37 C-130 4Ft Fall Protection Sys B89 .600 .000 .000 .000 .600 .600 .000
L1WM00 Scanning Electron Microscope & EDXA System .400 .000 (0.400) .000 .000 .000 .000
L1WS25 APQ-180 Radar Test Bench Upgrade .000 .000 3.500 .000 3.500 3.500 .000
L1WC32 Flashjet Upgrade .000 .000 2.798 .000 2.798 2.798 .000
L1WC33 New Flashjet (B673) .000 .000 4.919 .000 4.919 4.919 .000
L9MBI1 FY09 Cost Overrun - Etching Shop Renovation .000 .000 .060 .000 .060 .060 .000
L1WS00 Lean AISF Upgrade Ph 3 .000 .000 3.509 .000 3.509 3.509 .000
L1WE10 JSTARS Rehost to VDATS .000 .000 1.557 .000 1.557 1.557 .000
L1WA38 Wind Deflection Screen .000 .000 2.000 .000 2.000 2.000 .000
L1WC31 AMFF Water Deionizer .000 .000 1.254 .000 1.254 1.254 .000
L1WE01 Laser Station Replacement .000 .000 .637 .000 .637 .637 .000
L1WS30 Mobile EW Support Rack .000 .000 .000 .000 .000 .000 .000
L1WA34 F-15 Replace Depaint Robot Controls .000 .000 1.000 .000 1.000 1.000 .000
L1WM40 Vertical Sling .000 .000 .526 .000 .526 .526 .000
L2WA48 C-5 MLG .000 .000 4.500 .000 4.500 4.500 .000
L2WE30 MMTS TPS Rehost .000 .000 .320 .000 .320 .320 .000
Unallocated 24.606 5.556 (30.162) .000 .000 (0.000) .000
Equipment-WSS Total 106.591 3.691 .000 .000 110.282 110.276 .006
H1TP20 IOE T-9 Engine Test Cell Equipment 1.964 8.399 .000 .000 10.363 10.363 .000
H1TC19 B1-B LOA Range Upgrade Phase 2 4.000 (0.833) .000 .000 3.167 3.167 .000
H1TP19 F108-100 Engine Test Frame Adapter .000 .450 .000 .000 .450 .450 .000
G5WL2G Airborne Generator Test Stand Phase 2 of 3 .000 2.400 .000 .000 2.400 2.400 .000
Unallocated 9.336 (8.688) .000 .000 .648 .000 .648
Equipment-Test Total 15.300 1.728 .000 .000 17.028 16.380 .648
TOTAL EQUIPMENT 121.891 5.419 .000 .000 127.310 126.656 .654
Fund 9C CSAG - Maintenance Division
CAPITAL BUDGET
106
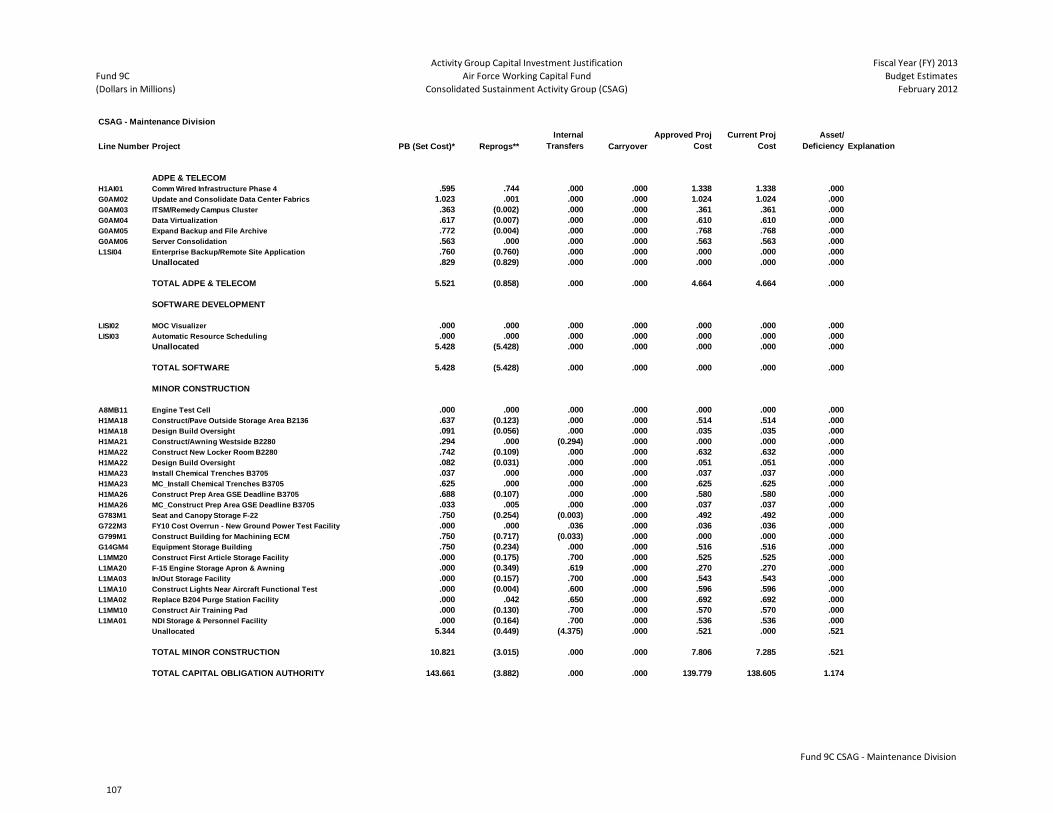
Fund 9C
(Dollars in Millions)
Activity Group Capital Investment Justification
Air Force Working Capital Fund
Consolidated Sustainment Activity Group (CSAG)
Fiscal Year (FY) 2013
Budget Estimates
February 2012
CSAG - Maintenance Division
Line Number Project PB (Set Cost)* Reprogs**
Internal
Transfers Carryover
Approved Proj
Cost
Current Proj
Cost
Asset/
Deficiency Explanation
ADPE & TELECOM
H1AI01 Comm Wired Infrastructure Phase 4 .595 .744 .000 .000 1.338 1.338 .000
G0AM02 Update and Consolidate Data Center Fabrics 1.023 .001 .000 .000 1.024 1.024 .000
G0AM03 ITSM/Remedy Campus Cluster .363 (0.002) .000 .000 .361 .361 .000
G0AM04 Data Virtualization .617 (0.007) .000 .000 .610 .610 .000
G0AM05 Expand Backup and File Archive .772 (0.004) .000 .000 .768 .768 .000
G0AM06 Server Consolidation .563 .000 .000 .000 .563 .563 .000
L1SI04 Enterprise Backup/Remote Site Application .760 (0.760) .000 .000 .000 .000 .000
Unallocated .829 (0.829) .000 .000 .000 .000 .000
TOTAL ADPE & TELECOM 5.521 (0.858) .000 .000 4.664 4.664 .000
SOFTWARE DEVELOPMENT
LISI02 MOC Visualizer .000 .000 .000 .000 .000 .000 .000
LISI03 Automatic Resource Scheduling .000 .000 .000 .000 .000 .000 .000
Unallocated 5.428 (5.428) .000 .000 .000 .000 .000
TOTAL SOFTWARE 5.428 (5.428) .000 .000 .000 .000 .000
MINOR CONSTRUCTION
A8MB11 Engine Test Cell .000 .000 .000 .000 .000 .000 .000
H1MA18 Construct/Pave Outside Storage Area B2136 .637 (0.123) .000 .000 .514 .514 .000
H1MA18 Design Build Oversight .091 (0.056) .000 .000 .035 .035 .000
H1MA21 Construct/Awning Westside B2280 .294 .000 (0.294) .000 .000 .000 .000
H1MA22 Construct New Locker Room B2280 .742 (0.109) .000 .000 .632 .632 .000
H1MA22 Design Build Oversight .082 (0.031) .000 .000 .051 .051 .000
H1MA23 Install Chemical Trenches B3705 .037 .000 .000 .000 .037 .037 .000
H1MA23 MC_Install Chemical Trenches B3705 .625 .000 .000 .000 .625 .625 .000
H1MA26 Construct Prep Area GSE Deadline B3705 .688 (0.107) .000 .000 .580 .580 .000
H1MA26 MC_Construct Prep Area GSE Deadline B3705 .033 .005 .000 .000 .037 .037 .000
G783M1 Seat and Canopy Storage F-22 .750 (0.254) (0.003) .000 .492 .492 .000
G722M3 FY10 Cost Overrun - New Ground Power Test Facility .000 .000 .036 .000 .036 .036 .000
G799M1 Construct Building for Machining ECM .750 (0.717) (0.033) .000 .000 .000 .000
G14GM4 Equipment Storage Building .750 (0.234) .000 .000 .516 .516 .000
L1MM20 Construct First Article Storage Facility .000 (0.175) .700 .000 .525 .525 .000
L1MA20 F-15 Engine Storage Apron & Awning .000 (0.349) .619 .000 .270 .270 .000
L1MA03 In/Out Storage Facility .000 (0.157) .700 .000 .543 .543 .000
L1MA10 Construct Lights Near Aircraft Functional Test .000 (0.004) .600 .000 .596 .596 .000
L1MA02 Replace B204 Purge Station Facility .000 .042 .650 .000 .692 .692 .000
L1MM10 Construct Air Training Pad .000 (0.130) .700 .000 .570 .570 .000
L1MA01 NDI Storage & Personnel Facility .000 (0.164) .700 .000 .536 .536 .000
Unallocated 5.344 (0.449) (4.375) .000 .521 .000 .521
TOTAL MINOR CONSTRUCTION 10.821 (3.015) .000 .000 7.806 7.285 .521
TOTAL CAPITAL OBLIGATION AUTHORITY 143.661 (3.882) .000 .000 139.779 138.605 1.174
Fund 9C CSAG - Maintenance Division
CAPITAL BUDGET
107

Fund 9C
(Dollars in Millions)
Activity Group Capital Investment Justification
Air Force Working Capital Fund
Consolidated Sustainment Activity Group (CSAG)
Fiscal Year (FY) 2013
Budget Estimates
February 2012
CSAG - Supply Division
FY2011
Line
Number Approved Project PB (Set Cost) Reprogs*
Internal
Transfers
Approved Proj
Cost
Current Proj
Cost (Est)
Asset/
Deficiency Explanation
A. Equipment
Total .000 .000 .000 .000 .000 .000
B. ADPE/Telecomm
GCSS-AF DS 1.523 (.000) .000 1.523 1.469 .054
REMIS 2.000 (.000) (.000) 2.000 1.801 .199
Total 3.523 (.000) (.000) 3.523 3.270 .199
C. Software Development
AFWCF BDT .572 (.000) .000 .572 .000 .572
GCSS-AF DS 4.708 .000 .000 4.708 4.708 .000
KDSS (formerly Keystone) .325 (.000) .000 .325 .000 .325
EXPRESS .000 .527 .000 .527 .526 .001 EXPRESS (FY 2011 Unfunded Request
Submitted April 2011) Funds
reprogrammed from CSAG-Maintenance.
REMIS .500 .000 .000 .500 .627 (.127)
Total 6.105 .527 .000 6.632 5.861 .771
D. Minor Construction
Total .000 .000 .000 .000 .000 .000
FY TOTAL 9.628 .527 .000 10.155 9.131 1.024
Fund 9C CSAG SD
CAPITAL BUDGET
108
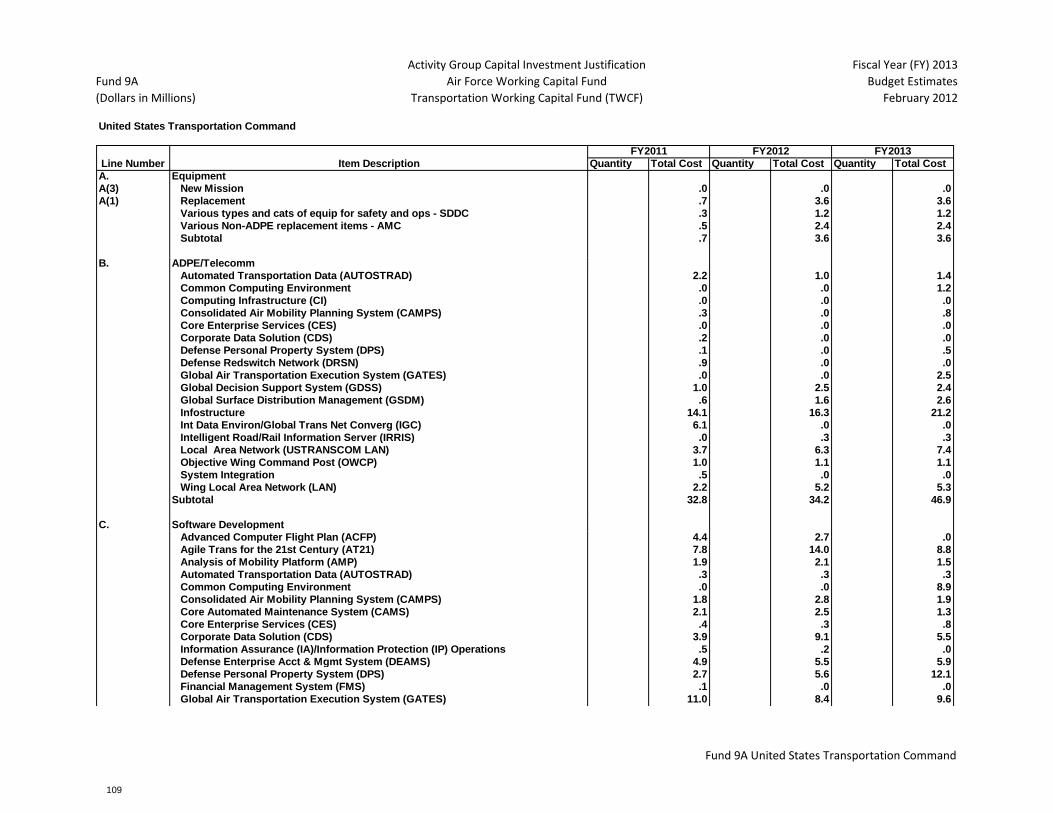
Fund 9A
(Dollars in Millions)
Activity Group Capital Investment Justification
Air Force Working Capital Fund
Transportation Working Capital Fund (TWCF)
Fiscal Year (FY) 2013
Budget Estimates
February 2012
United States Transportation Command
Quantity Total Cost Quantity Total Cost Quantity Total Cost
A. Equipment
A(3) New Mission .0 .0 .0
A(1) Replacement .7 3.6 3.6
Various types and cats of equip for safety and ops - SDDC .3 1.2 1.2
Various Non-ADPE replacement items - AMC .5 2.4 2.4
Subtotal .7 3.6 3.6
B. ADPE/Telecomm
Automated Transportation Data (AUTOSTRAD) 2.2 1.0 1.4
Common Computing Environment .0 .0 1.2
Computing Infrastructure (CI) .0 .0 .0
Consolidated Air Mobility Planning System (CAMPS) .3 .0 .8
Core Enterprise Services (CES) .0 .0 .0
Corporate Data Solution (CDS) .2 .0 .0
Defense Personal Property System (DPS) .1 .0 .5
Defense Redswitch Network (DRSN) .9 .0 .0
Global Air Transportation Execution System (GATES) .0 .0 2.5
Global Decision Support System (GDSS) 1.0 2.5 2.4
Global Surface Distribution Management (GSDM) .6 1.6 2.6
Infostructure 14.1 16.3 21.2
Int Data Environ/Global Trans Net Converg (IGC) 6.1 .0 .0
Intelligent Road/Rail Information Server (IRRIS) .0 .3 .3
Local Area Network (USTRANSCOM LAN) 3.7 6.3 7.4
Objective Wing Command Post (OWCP) 1.0 1.1 1.1
System Integration .5 .0 .0
Wing Local Area Network (LAN) 2.2 5.2 5.3
Subtotal 32.8 34.2 46.9
C. Software Development
Advanced Computer Flight Plan (ACFP) 4.4 2.7 .0
Agile Trans for the 21st Century (AT21) 7.8 14.0 8.8
Analysis of Mobility Platform (AMP) 1.9 2.1 1.5
Automated Transportation Data (AUTOSTRAD) .3 .3 .3
Common Computing Environment .0 .0 8.9
Consolidated Air Mobility Planning System (CAMPS) 1.8 2.8 1.9
Core Automated Maintenance System (CAMS) 2.1 2.5 1.3
Core Enterprise Services (CES) .4 .3 .8
Corporate Data Solution (CDS) 3.9 9.1 5.5
Information Assurance (IA)/Information Protection (IP) Operations .5 .2 .0
Defense Enterprise Acct & Mgmt System (DEAMS) 4.9 5.5 5.9
Defense Personal Property System (DPS) 2.7 5.6 12.1
Financial Management System (FMS) .1 .0 .0
Global Air Transportation Execution System (GATES) 11.0 8.4 9.6
Line Number Item Description
FY2011 FY2012 FY2013
Fund 9A United States Transportation Command
CAPITAL BUDGET
109
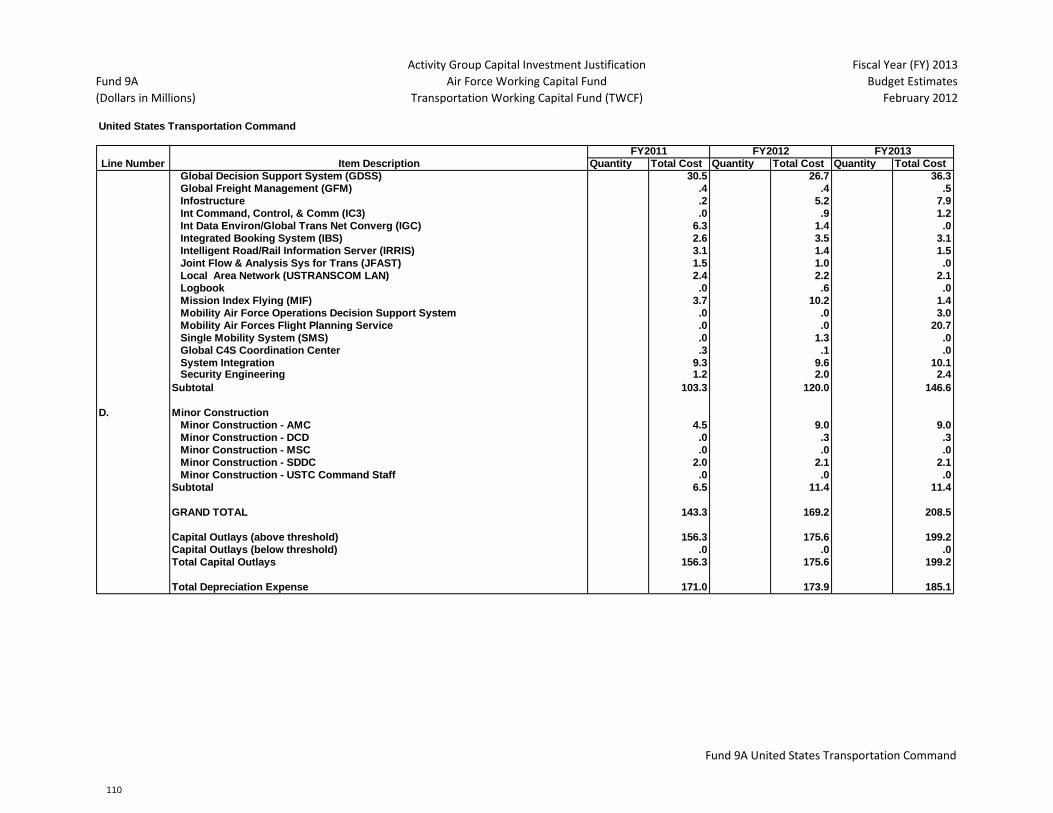
Fund 9A
(Dollars in Millions)
Activity Group Capital Investment Justification
Air Force Working Capital Fund
Transportation Working Capital Fund (TWCF)
Fiscal Year (FY) 2013
Budget Estimates
February 2012
United States Transportation Command
Quantity Total Cost Quantity Total Cost Quantity Total CostLine Number Item Description
FY2011 FY2012 FY2013
Global Decision Support System (GDSS) 30.5 26.7 36.3
Global Freight Management (GFM) .4 .4 .5
Infostructure .2 5.2 7.9
Int Command, Control, & Comm (IC3) .0 .9 1.2
Int Data Environ/Global Trans Net Converg (IGC) 6.3 1.4 .0
Integrated Booking System (IBS) 2.6 3.5 3.1
Intelligent Road/Rail Information Server (IRRIS) 3.1 1.4 1.5
Joint Flow & Analysis Sys for Trans (JFAST) 1.5 1.0 .0
Local Area Network (USTRANSCOM LAN) 2.4 2.2 2.1
Logbook .0 .6 .0
Mission Index Flying (MIF) 3.7 10.2 1.4
Mobility Air Force Operations Decision Support System .0 .0 3.0
Mobility Air Forces Flight Planning Service .0 .0 20.7
Single Mobility System (SMS) .0 1.3 .0
Global C4S Coordination Center .3 .1 .0
System Integration 9.3 9.6 10.1 Security Engineering 1.2 2.0 2.4
Subtotal 103.3 120.0 146.6
D. Minor Construction
Minor Construction - AMC 4.5 9.0 9.0
Minor Construction - DCD .0 .3 .3
Minor Construction - MSC .0 .0 .0
Minor Construction - SDDC 2.0 2.1 2.1
Minor Construction - USTC Command Staff .0 .0 .0
Subtotal 6.5 11.4 11.4
GRAND TOTAL 143.3 169.2 208.5
Capital Outlays (above threshold) 156.3 175.6 199.2
Capital Outlays (below threshold) .0 .0 .0
Total Capital Outlays 156.3 175.6 199.2
Total Depreciation Expense 171.0 173.9 185.1
Fund 9A United States Transportation Command
CAPITAL BUDGET
110
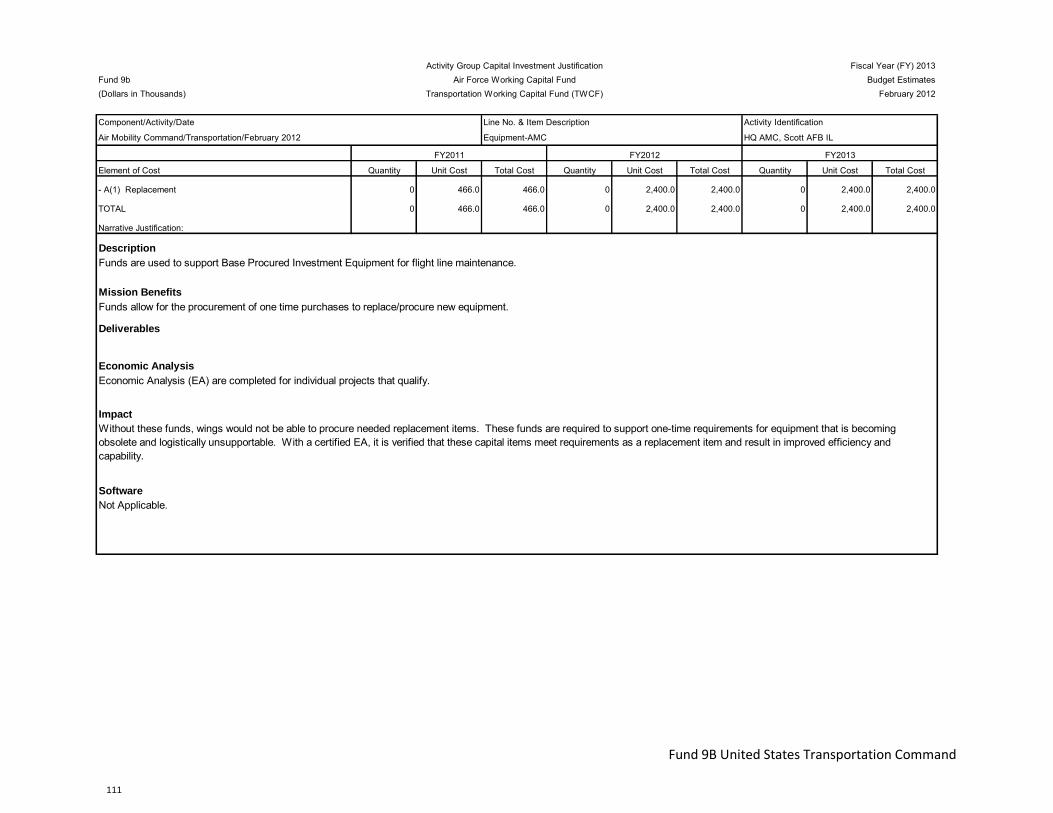
Q Activity Group Capital Investment Justification Fiscal Year (FY) 2013Fund 9b Air Force Working Capital Fund Budget Estimates(Dollars in Thousands) Transportation Working Capital Fund (TWCF) February 2012
Component/Activity/Date Line No. & Item Description Activity Identification
Air Mobility Command/Transportation/February 2012 Equipment-AMC HQ AMC, Scott AFB IL
Element of Cost Quantity Unit Cost Total Cost Quantity Unit Cost Total Cost Quantity Unit Cost Total Cost
- A(1) Replacement 0 466.0 466.0 0 2,400.0 2,400.0 0 2,400.0 2,400.0
TOTAL 0 466.0 466.0 0 2,400.0 2,400.0 0 2,400.0 2,400.0
Narrative Justification:
Description
Mission Benefits
Deliverables
Economic Analysis
Impact
Software
Without these funds, wings would not be able to procure needed replacement items. These funds are required to support one-time requirements for equipment that is becoming obsolete and logistically unsupportable. With a certified EA, it is verified that these capital items meet requirements as a replacement item and result in improved efficiency and capability.
Not Applicable.
FY2011 FY2012 FY2013
Funds are used to support Base Procured Investment Equipment for flight line maintenance.
Funds allow for the procurement of one time purchases to replace/procure new equipment.
Economic Analysis (EA) are completed for individual projects that qualify.
Fund 9B United States Transportation Command
CAPITAL BUDGET
111
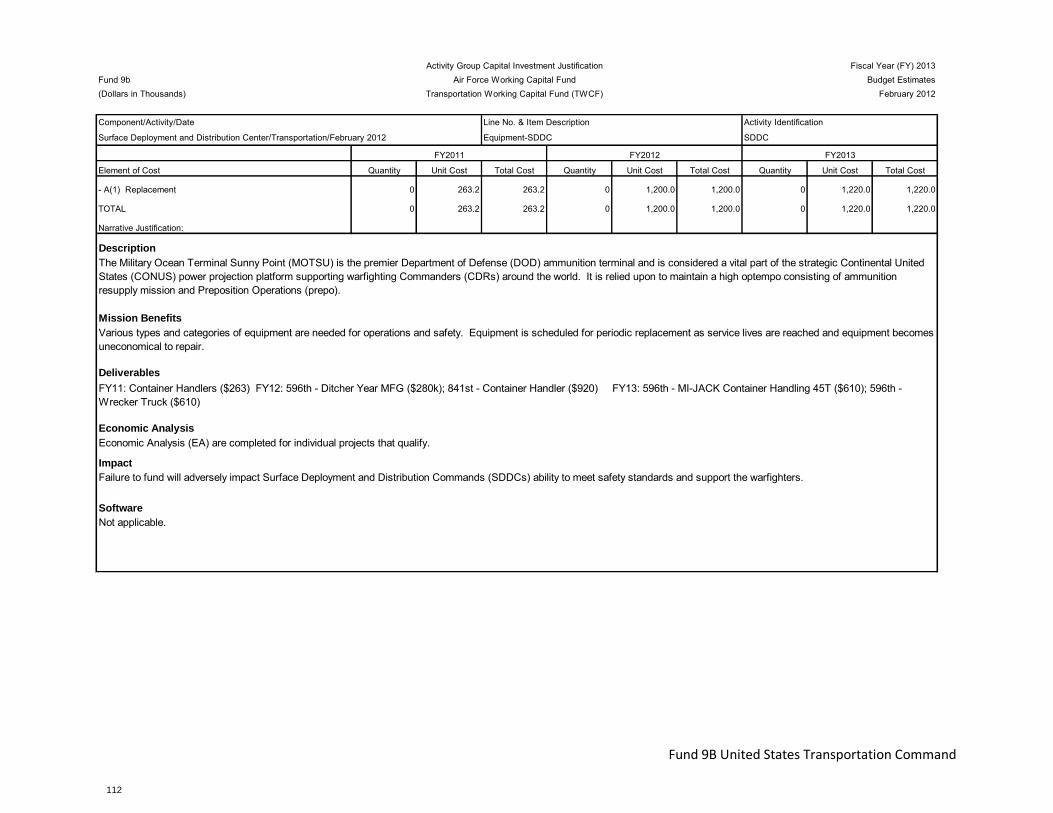
Q Activity Group Capital Investment Justification Fiscal Year (FY) 2013Fund 9b Air Force Working Capital Fund Budget Estimates(Dollars in Thousands) Transportation Working Capital Fund (TWCF) February 2012
Component/Activity/Date Line No. & Item Description Activity Identification
Surface Deployment and Distribution Center/Transportation/February 2012 Equipment-SDDC SDDC
Element of Cost Quantity Unit Cost Total Cost Quantity Unit Cost Total Cost Quantity Unit Cost Total Cost
- A(1) Replacement 0 263.2 263.2 0 1,200.0 1,200.0 0 1,220.0 1,220.0
TOTAL 0 263.2 263.2 0 1,200.0 1,200.0 0 1,220.0 1,220.0
Narrative Justification:
Description
Mission Benefits
Deliverables
Economic Analysis
Impact
Software
Failure to fund will adversely impact Surface Deployment and Distribution Commands (SDDCs) ability to meet safety standards and support the warfighters.
Not applicable.
FY2011 FY2012 FY2013
The Military Ocean Terminal Sunny Point (MOTSU) is the premier Department of Defense (DOD) ammunition terminal and is considered a vital part of the strategic Continental United States (CONUS) power projection platform supporting warfighting Commanders (CDRs) around the world. It is relied upon to maintain a high optempo consisting of ammunition resupply mission and Preposition Operations (prepo).
Various types and categories of equipment are needed for operations and safety. Equipment is scheduled for periodic replacement as service lives are reached and equipment becomes uneconomical to repair.
Economic Analysis (EA) are completed for individual projects that qualify.
FY11: Container Handlers ($263) FY12: 596th - Ditcher Year MFG ($280k); 841st - Container Handler ($920) FY13: 596th - MI-JACK Container Handling 45T ($610); 596th - Wrecker Truck ($610)
Fund 9B United States Transportation Command
CAPITAL BUDGET
112
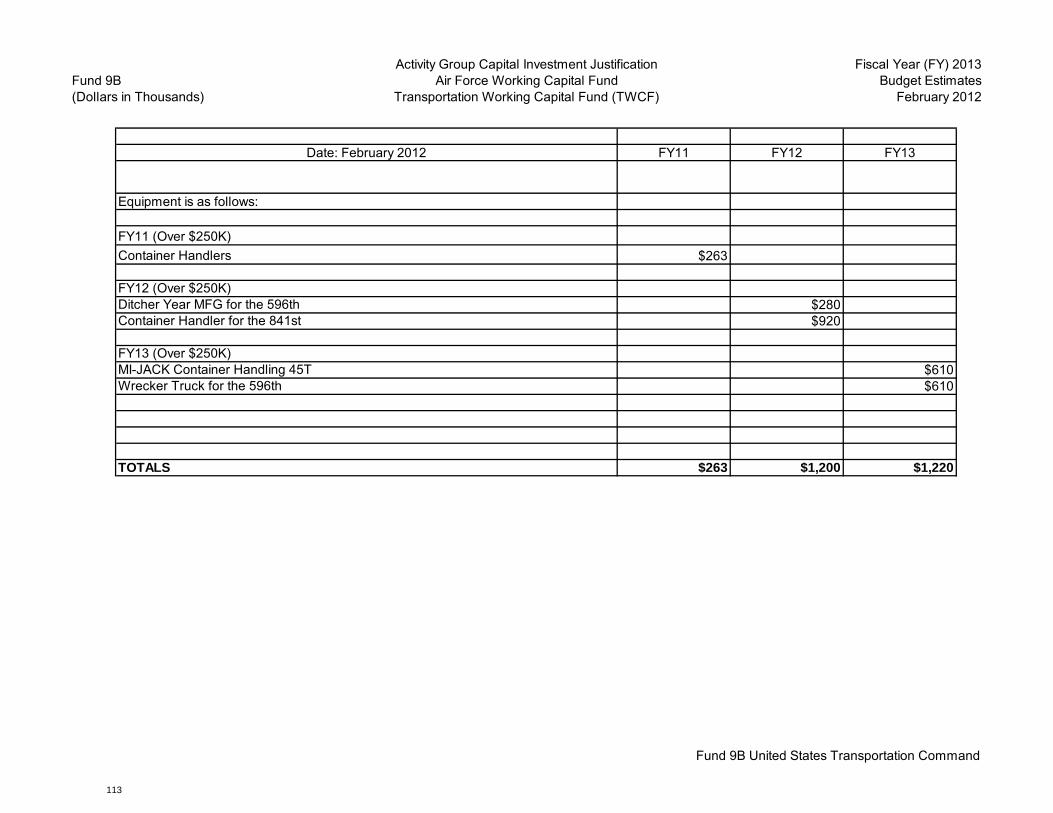
Fund 9B(Dollars in Thousands)
Activity Group Capital Investment JustificationAir Force Working Capital Fund
Transportation Working Capital Fund (TWCF)
Fiscal Year (FY) 2013Budget Estimates
February 2012
Date: February 2012 FY11 FY12 FY13
Equipment is as follows:
FY11 (Over $250K)Container Handlers $263
FY12 (Over $250K)Ditcher Year MFG for the 596th $280Container Handler for the 841st $920
FY13 (Over $250K)MI-JACK Container Handling 45T $610Wrecker Truck for the 596th $610
TOTALS $263 $1,200 $1,220
Fund 9B United States Transportation Command
CAPITAL BUDGET
113
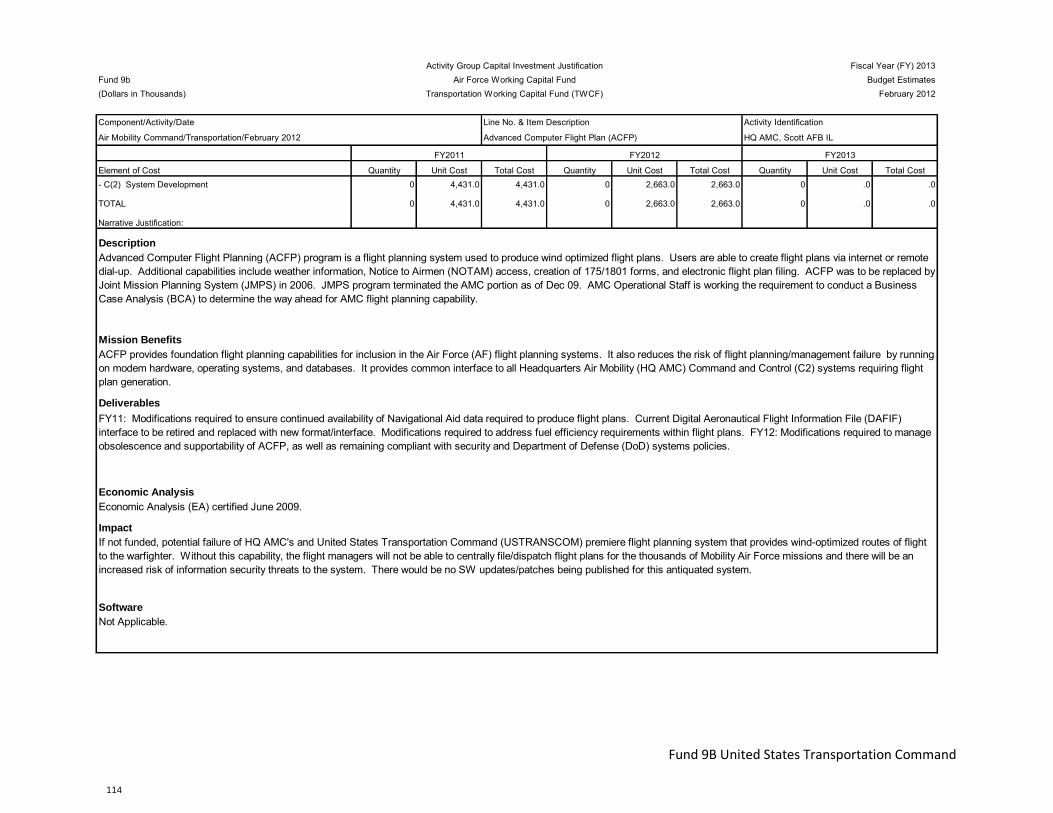
Activity Group Capital Investment Justification Fiscal Year (FY) 2013Fund 9b Air Force Working Capital Fund Budget Estimates(Dollars in Thousands) Transportation Working Capital Fund (TWCF) February 2012
Component/Activity/Date Line No. & Item Description Activity Identification
Air Mobility Command/Transportation/February 2012 Advanced Computer Flight Plan (ACFP) HQ AMC, Scott AFB IL
Element of Cost Quantity Unit Cost Total Cost Quantity Unit Cost Total Cost Quantity Unit Cost Total Cost- C(2) System Development 0 4,431.0 4,431.0 0 2,663.0 2,663.0 0 .0 .0
TOTAL 0 4,431.0 4,431.0 0 2,663.0 2,663.0 0 .0 .0
Narrative Justification:
Description
Mission Benefits
Deliverables
Economic Analysis
Impact
Software
If not funded, potential failure of HQ AMC's and United States Transportation Command (USTRANSCOM) premiere flight planning system that provides wind-optimized routes of flight to the warfighter. Without this capability, the flight managers will not be able to centrally file/dispatch flight plans for the thousands of Mobility Air Force missions and there will be an increased risk of information security threats to the system. There would be no SW updates/patches being published for this antiquated system.
Not Applicable.
FY2011 FY2012 FY2013
Advanced Computer Flight Planning (ACFP) program is a flight planning system used to produce wind optimized flight plans. Users are able to create flight plans via internet or remote dial-up. Additional capabilities include weather information, Notice to Airmen (NOTAM) access, creation of 175/1801 forms, and electronic flight plan filing. ACFP was to be replaced by Joint Mission Planning System (JMPS) in 2006. JMPS program terminated the AMC portion as of Dec 09. AMC Operational Staff is working the requirement to conduct a Business Case Analysis (BCA) to determine the way ahead for AMC flight planning capability.
ACFP provides foundation flight planning capabilities for inclusion in the Air Force (AF) flight planning systems. It also reduces the risk of flight planning/management failure by running on modem hardware, operating systems, and databases. It provides common interface to all Headquarters Air Mobility (HQ AMC) Command and Control (C2) systems requiring flight plan generation.
Economic Analysis (EA) certified June 2009.
FY11: Modifications required to ensure continued availability of Navigational Aid data required to produce flight plans. Current Digital Aeronautical Flight Information File (DAFIF) interface to be retired and replaced with new format/interface. Modifications required to address fuel efficiency requirements within flight plans. FY12: Modifications required to manage obsolescence and supportability of ACFP, as well as remaining compliant with security and Department of Defense (DoD) systems policies.
Fund 9B United States Transportation Command
CAPITAL BUDGET
114
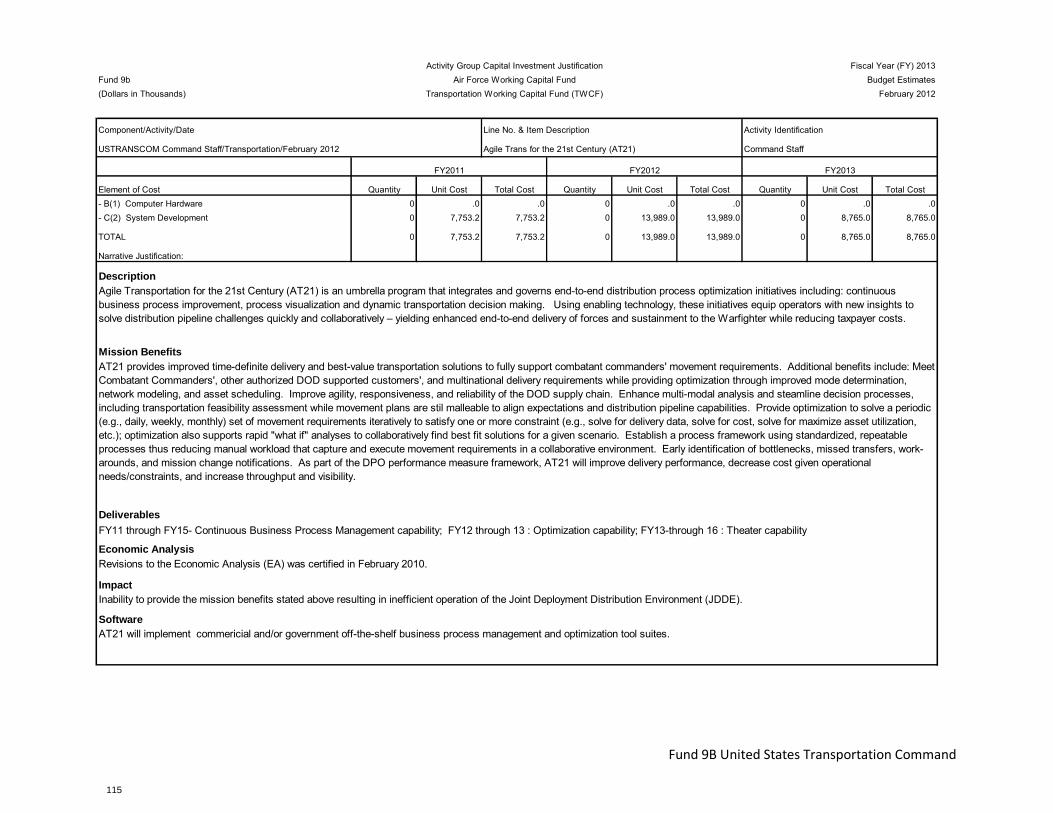
Activity Group Capital Investment Justification Fiscal Year (FY) 2013Fund 9b Air Force Working Capital Fund Budget Estimates(Dollars in Thousands) Transportation Working Capital Fund (TWCF) February 2012
Component/Activity/Date Line No. & Item Description Activity Identification
USTRANSCOM Command Staff/Transportation/February 2012 Agile Trans for the 21st Century (AT21) Command Staff
Element of Cost Quantity Unit Cost Total Cost Quantity Unit Cost Total Cost Quantity Unit Cost Total Cost- B(1) Computer Hardware 0 .0 .0 0 .0 .0 0 .0 .0- C(2) System Development 0 7,753.2 7,753.2 0 13,989.0 13,989.0 0 8,765.0 8,765.0
TOTAL 0 7,753.2 7,753.2 0 13,989.0 13,989.0 0 8,765.0 8,765.0
Narrative Justification:
Description
Mission Benefits
Deliverables
Economic Analysis
Impact
Software
Inability to provide the mission benefits stated above resulting in inefficient operation of the Joint Deployment Distribution Environment (JDDE).
AT21 will implement commericial and/or government off-the-shelf business process management and optimization tool suites.
FY2011 FY2012 FY2013
Agile Transportation for the 21st Century (AT21) is an umbrella program that integrates and governs end-to-end distribution process optimization initiatives including: continuous business process improvement, process visualization and dynamic transportation decision making. Using enabling technology, these initiatives equip operators with new insights to solve distribution pipeline challenges quickly and collaboratively – yielding enhanced end-to-end delivery of forces and sustainment to the Warfighter while reducing taxpayer costs.
AT21 provides improved time-definite delivery and best-value transportation solutions to fully support combatant commanders' movement requirements. Additional benefits include: Meet Combatant Commanders', other authorized DOD supported customers', and multinational delivery requirements while providing optimization through improved mode determination, network modeling, and asset scheduling. Improve agility, responsiveness, and reliability of the DOD supply chain. Enhance multi-modal analysis and steamline decision processes, including transportation feasibility assessment while movement plans are stil malleable to align expectations and distribution pipeline capabilities. Provide optimization to solve a periodic (e.g., daily, weekly, monthly) set of movement requirements iteratively to satisfy one or more constraint (e.g., solve for delivery data, solve for cost, solve for maximize asset utilization, etc.); optimization also supports rapid "what if" analyses to collaboratively find best fit solutions for a given scenario. Establish a process framework using standardized, repeatable processes thus reducing manual workload that capture and execute movement requirements in a collaborative environment. Early identification of bottlenecks, missed transfers, work-arounds, and mission change notifications. As part of the DPO performance measure framework, AT21 will improve delivery performance, decrease cost given operational needs/constraints, and increase throughput and visibility.
Revisions to the Economic Analysis (EA) was certified in February 2010.
FY11 through FY15- Continuous Business Process Management capability; FY12 through 13 : Optimization capability; FY13-through 16 : Theater capability
Fund 9B United States Transportation Command
CAPITAL BUDGET
115
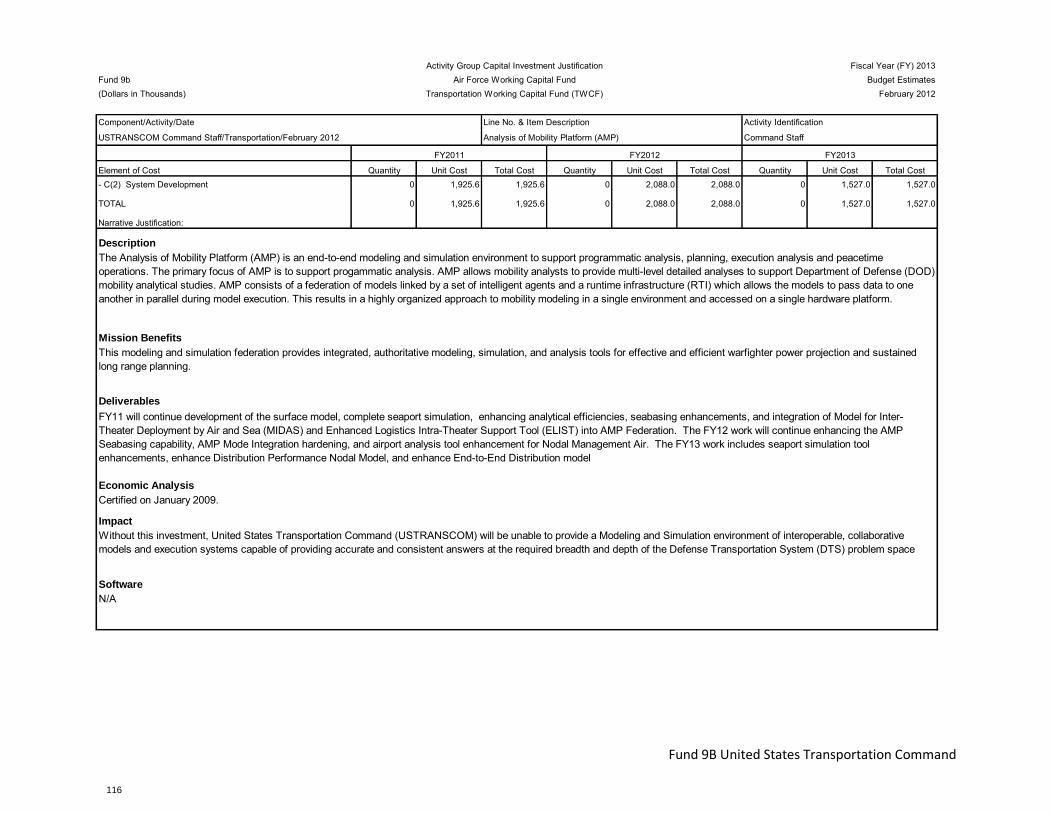
Activity Group Capital Investment Justification Fiscal Year (FY) 2013Fund 9b Air Force Working Capital Fund Budget Estimates(Dollars in Thousands) Transportation Working Capital Fund (TWCF) February 2012
Component/Activity/Date Line No. & Item Description Activity Identification
USTRANSCOM Command Staff/Transportation/February 2012 Analysis of Mobility Platform (AMP) Command Staff
Element of Cost Quantity Unit Cost Total Cost Quantity Unit Cost Total Cost Quantity Unit Cost Total Cost- C(2) System Development 0 1,925.6 1,925.6 0 2,088.0 2,088.0 0 1,527.0 1,527.0
TOTAL 0 1,925.6 1,925.6 0 2,088.0 2,088.0 0 1,527.0 1,527.0
Narrative Justification:
Description
Mission Benefits
Deliverables
Economic Analysis
Impact
Software
Without this investment, United States Transportation Command (USTRANSCOM) will be unable to provide a Modeling and Simulation environment of interoperable, collaborative models and execution systems capable of providing accurate and consistent answers at the required breadth and depth of the Defense Transportation System (DTS) problem space
N/A
FY2011 FY2012 FY2013
The Analysis of Mobility Platform (AMP) is an end-to-end modeling and simulation environment to support programmatic analysis, planning, execution analysis and peacetime operations. The primary focus of AMP is to support progammatic analysis. AMP allows mobility analysts to provide multi-level detailed analyses to support Department of Defense (DOD) mobility analytical studies. AMP consists of a federation of models linked by a set of intelligent agents and a runtime infrastructure (RTI) which allows the models to pass data to one another in parallel during model execution. This results in a highly organized approach to mobility modeling in a single environment and accessed on a single hardware platform.
This modeling and simulation federation provides integrated, authoritative modeling, simulation, and analysis tools for effective and efficient warfighter power projection and sustained long range planning.
Certified on January 2009.
FY11 will continue development of the surface model, complete seaport simulation, enhancing analytical efficiencies, seabasing enhancements, and integration of Model for Inter-Theater Deployment by Air and Sea (MIDAS) and Enhanced Logistics Intra-Theater Support Tool (ELIST) into AMP Federation. The FY12 work will continue enhancing the AMP Seabasing capability, AMP Mode Integration hardening, and airport analysis tool enhancement for Nodal Management Air. The FY13 work includes seaport simulation tool enhancements, enhance Distribution Performance Nodal Model, and enhance End-to-End Distribution model
Fund 9B United States Transportation Command
CAPITAL BUDGET
116

Q Activity Group Capital Investment Justification Fiscal Year (FY) 2013Fund 9b Air Force Working Capital Fund Budget Estimates(Dollars in Thousands) Transportation Working Capital Fund (TWCF) February 2012
Component/Activity/Date Line No. & Item Description Activity Identification
Surface Deployment and Distribution Center/Transportation/February 2012 Automated Transportation Data (AUTOSTRAD) SDDC
Element of Cost Quantity Unit Cost Total Cost Quantity Unit Cost Total Cost Quantity Unit Cost Total Cost- B(1) Computer Hardware 0 2,164.7 2,164.7 0 965.0 965.0 0 1,416.0 1,416.0- C(2) System Development 0 297.3 297.3 0 303.0 303.0 0 308.0 308.0
TOTAL 0 2,462.0 2,462.0 0 1,268.0 1,268.0 0 1,724.0 1,724.0
Narrative Justification:
Description
Mission Benefits
Deliverables
Economic Analysis
Impact
Software
The AUTOSTRAD project funds SDDCs network infrastructure worldwide as well as funds SDDCs internal administrative systems such as tasker tracking, Capability Request (CAPR) tracking; the Electronic Transportation Acquisition (ETA) single sign-on front end to all SDDCs Defense Transportation System (DTS) systems; the consolidated help desk that supports the SDDC systems, and the history database that stores all historical data for the SDDC systems. Autostrad’s Hardware capital funds in FY12 and FY13 will be used to implement VOIP at SDDC Outports. VOIP capability is required to keep SDDC globally connected across its operational user base and ensure automation and communications support is adequate to satisfy SDDC mission requirements.
Unlawful use of Oracle products in SDDC business applications would result if AUTOSTRAD’s software capital requirement is underfunded.
FY2011 FY2012 FY2013
AUTOSTRAD is not a system but rather a program that supports SDDC global connectivity by providing and maintaining US Army network infrastructure and backbone, communications support, SDDC Out Port support, and Enterprise License Agreement support including Oracle, Adobe, and Microsoft. In turn, global connectivity enables SDDC to accomplish its mission in support of the Defense Transportation System and USTRANSCOM. The program provides for on-going modernization of the underlying core of common-user utility functions such as: Local Area Network (LAN) upgrades / Automation Infrastructure / Port Infrastructure / Communications backbone / Video Teleconference (VTC) / Command Operations Center (COC) upgrades / Radio Program / Defense Message System (DMS) / Contract support, etc.
The AUTOSTRAD program supports approximately 2,400 individuals at 52 worldwide headquarters locations, 5 major subordinate commands, and ports. The program provides for operations, maintenance and life cycle HW replacement of LAN/WAN architecture components (including wireless), Information Assurance, Land Mobile Radios, Video Teleconference components, voice, and new communications technologies to keep SDDC globally connected across its operational user base. In addition, the program supports Out Port infrastructure capabilities for all LAN/WAN architecture components,communications backbone, communications infrastructure upgrades at ports and piers, network storage, disaster recovery, Water Ports Rapid Mobile Administration/Data Interface and Communications components, web application to provide a common user interface to SDDCs broad customer base, and any equipment and software supporting network operations.
Certified 15 Jun 10.
FY11, 12, & 13: Software capital funds will support USTRANSCOM Oracle ELA true-up costs. In FY12 and FY13, Hardware capital funds will support implementation of VOIP capability at Out Ports, which will increase efficiency and reliability of voice capabilities.
Fund 9B United States Transportation Command
CAPITAL BUDGET
117

Activity Group Capital Investment Justification Fiscal Year (FY) 2013Fund 9b Air Force Working Capital Fund Budget Estimates(Dollars in Thousands) Transportation Working Capital Fund (TWCF) February 2012
Component/Activity/Date Line No. & Item Description Activity Identification
USTRANSCOM Command Staff/Transportation/February 2012 Common Computing Environment Command Staff
Element of Cost Quantity Unit Cost Total Cost Quantity Unit Cost Total Cost Quantity Unit Cost Total Cost- B(1) Computer Hardware 0 .0 .0 0 .0 .0 0 1,155.0 1,155.0- C(1) Planning/Design 0 .0 .0 0 .0 .0 0 .0 .0- C(2) System Development 0 .0 .0 0 .0 .0 0 8,905.0 8,905.0
TOTAL 0 .0 .0 0 .0 .0 0 10,060.0 10,060.0
Narrative Justification:
Description
Mission Benefits
Deliverables
Impact
Software
Failure to consolidate computing requirements within USTRANSCOM and component C2 applications will result in higher equipment costs and all costs associated with managing, housing, storing, repairing each stovepipe system hardware.
Licensing is provided under this line for USTRANSCOM CCE.
FY2011 FY2012 FY2013
Common Computing Environment (CCE) provides the basic infrastructure consolidation environment to host USTRANSCOM and Component C2 Applications. This environment includes the hardware requirements for USTRANSCOM systems and programs of record. Provides hardware and software licensing, operational resources, integration and sustainment activities for USTRANSCOM CCE.
Provides common platform services, which improves security, provides access control and disaster recovery. Additionally, CCE provides opportunities to leverage a certified and accredited enterprise development and deployment environment responsive to dynamic customer/mission demands in an agile fashion. CCE implementation fuses the number of physical servers, facilities, and support personnel, while improving computing utilization and facilitating on-demand provisioning for increased scalability.
FY13 Deliverables: (1) Enterprise Application Services (EAS) includes Front End development and customization of COTS and Non-COTS products and hardware required for client side production environment, (2) Enterprise Integration Lab (EIL) development and maintenance of the visualization layer and other front end work in a non-COTS environment to include web page and protlet development.
Fund 9B United States Transportation Command
CAPITAL BUDGET
118
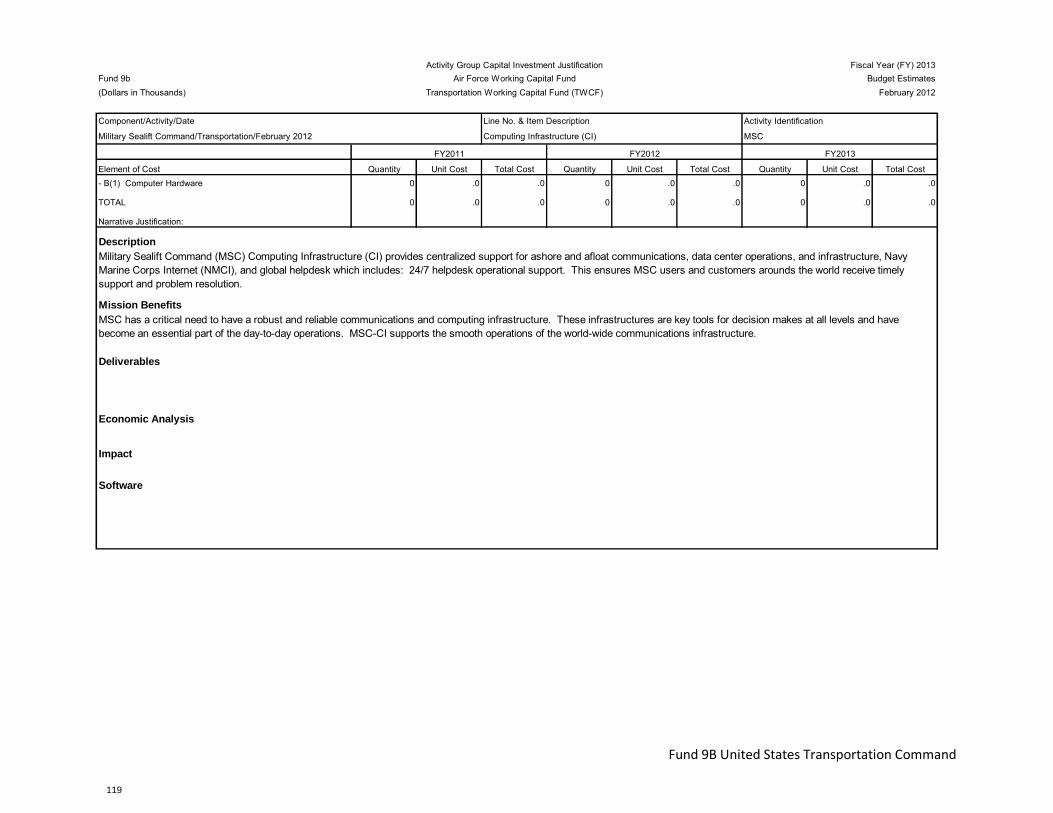
Q Activity Group Capital Investment Justification Fiscal Year (FY) 2013Fund 9b Air Force Working Capital Fund Budget Estimates(Dollars in Thousands) Transportation Working Capital Fund (TWCF) February 2012
Component/Activity/Date Line No. & Item Description Activity Identification
Military Sealift Command/Transportation/February 2012 Computing Infrastructure (CI) MSC
Element of Cost Quantity Unit Cost Total Cost Quantity Unit Cost Total Cost Quantity Unit Cost Total Cost- B(1) Computer Hardware 0 .0 .0 0 .0 .0 0 .0 .0
TOTAL 0 .0 .0 0 .0 .0 0 .0 .0
Narrative Justification:
Description
Mission Benefits
Deliverables
Economic Analysis
Impact
Software
FY2011 FY2012 FY2013
Military Sealift Command (MSC) Computing Infrastructure (CI) provides centralized support for ashore and afloat communications, data center operations, and infrastructure, Navy Marine Corps Internet (NMCI), and global helpdesk which includes: 24/7 helpdesk operational support. This ensures MSC users and customers arounds the world receive timely support and problem resolution.
MSC has a critical need to have a robust and reliable communications and computing infrastructure. These infrastructures are key tools for decision makes at all levels and have become an essential part of the day-to-day operations. MSC-CI supports the smooth operations of the world-wide communications infrastructure.
Fund 9B United States Transportation Command
CAPITAL BUDGET
119
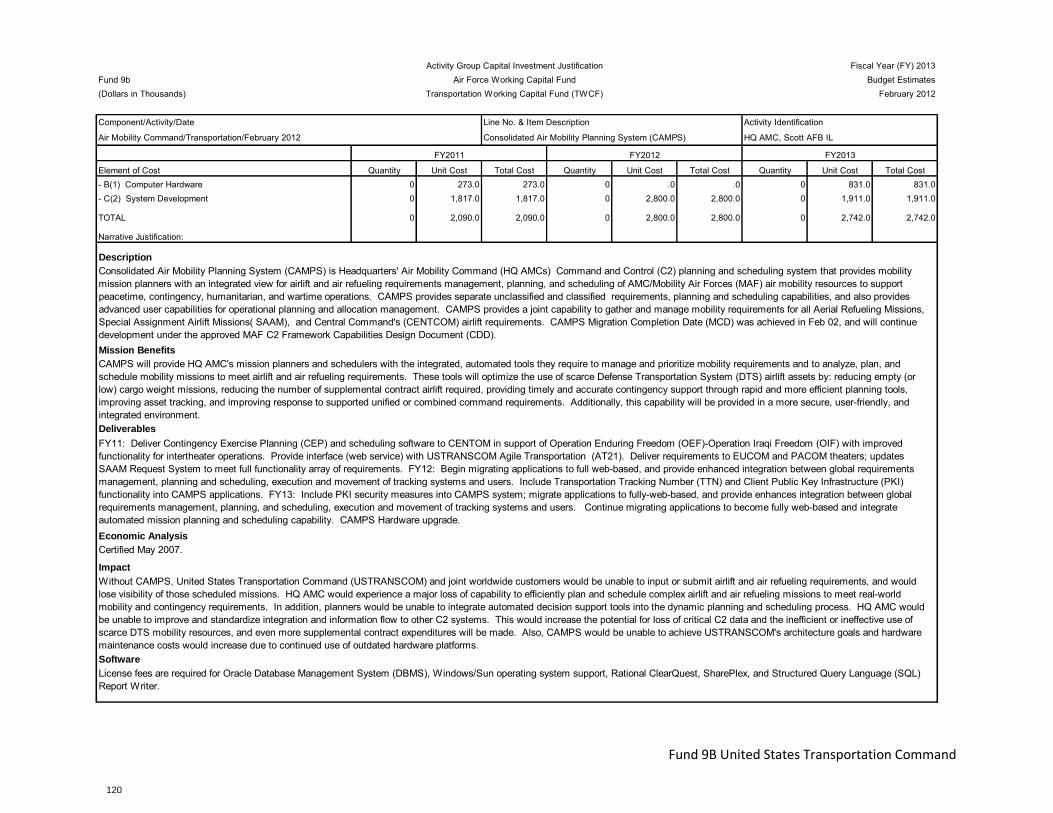
Activity Group Capital Investment Justification Fiscal Year (FY) 2013Fund 9b Air Force Working Capital Fund Budget Estimates(Dollars in Thousands) Transportation Working Capital Fund (TWCF) February 2012
Component/Activity/Date Line No. & Item Description Activity Identification
Air Mobility Command/Transportation/February 2012 Consolidated Air Mobility Planning System (CAMPS) HQ AMC, Scott AFB IL
Element of Cost Quantity Unit Cost Total Cost Quantity Unit Cost Total Cost Quantity Unit Cost Total Cost- B(1) Computer Hardware 0 273.0 273.0 0 .0 .0 0 831.0 831.0- C(2) System Development 0 1,817.0 1,817.0 0 2,800.0 2,800.0 0 1,911.0 1,911.0
TOTAL 0 2,090.0 2,090.0 0 2,800.0 2,800.0 0 2,742.0 2,742.0
Narrative Justification:
Description
Mission Benefits
Deliverables
Economic Analysis
Impact
Software
Without CAMPS, United States Transportation Command (USTRANSCOM) and joint worldwide customers would be unable to input or submit airlift and air refueling requirements, and would lose visibility of those scheduled missions. HQ AMC would experience a major loss of capability to efficiently plan and schedule complex airlift and air refueling missions to meet real-world mobility and contingency requirements. In addition, planners would be unable to integrate automated decision support tools into the dynamic planning and scheduling process. HQ AMC would be unable to improve and standardize integration and information flow to other C2 systems. This would increase the potential for loss of critical C2 data and the inefficient or ineffective use of scarce DTS mobility resources, and even more supplemental contract expenditures will be made. Also, CAMPS would be unable to achieve USTRANSCOM's architecture goals and hardware maintenance costs would increase due to continued use of outdated hardware platforms.
License fees are required for Oracle Database Management System (DBMS), Windows/Sun operating system support, Rational ClearQuest, SharePlex, and Structured Query Language (SQL) Report Writer.
FY2011 FY2012 FY2013
Consolidated Air Mobility Planning System (CAMPS) is Headquarters' Air Mobility Command (HQ AMCs) Command and Control (C2) planning and scheduling system that provides mobility mission planners with an integrated view for airlift and air refueling requirements management, planning, and scheduling of AMC/Mobility Air Forces (MAF) air mobility resources to support peacetime, contingency, humanitarian, and wartime operations. CAMPS provides separate unclassified and classified requirements, planning and scheduling capabilities, and also provides advanced user capabilities for operational planning and allocation management. CAMPS provides a joint capability to gather and manage mobility requirements for all Aerial Refueling Missions, Special Assignment Airlift Missions( SAAM), and Central Command's (CENTCOM) airlift requirements. CAMPS Migration Completion Date (MCD) was achieved in Feb 02, and will continue development under the approved MAF C2 Framework Capabilities Design Document (CDD).
CAMPS will provide HQ AMC's mission planners and schedulers with the integrated, automated tools they require to manage and prioritize mobility requirements and to analyze, plan, and schedule mobility missions to meet airlift and air refueling requirements. These tools will optimize the use of scarce Defense Transportation System (DTS) airlift assets by: reducing empty (or low) cargo weight missions, reducing the number of supplemental contract airlift required, providing timely and accurate contingency support through rapid and more efficient planning tools, improving asset tracking, and improving response to supported unified or combined command requirements. Additionally, this capability will be provided in a more secure, user-friendly, and integrated environment.
Certified May 2007.
FY11: Deliver Contingency Exercise Planning (CEP) and scheduling software to CENTOM in support of Operation Enduring Freedom (OEF)-Operation Iraqi Freedom (OIF) with improved functionality for intertheater operations. Provide interface (web service) with USTRANSCOM Agile Transportation (AT21). Deliver requirements to EUCOM and PACOM theaters; updates SAAM Request System to meet full functionality array of requirements. FY12: Begin migrating applications to full web-based, and provide enhanced integration between global requirements management, planning and scheduling, execution and movement of tracking systems and users. Include Transportation Tracking Number (TTN) and Client Public Key Infrastructure (PKI) functionality into CAMPS applications. FY13: Include PKI security measures into CAMPS system; migrate applications to fully-web-based, and provide enhances integration between global requirements management, planning, and scheduling, execution and movement of tracking systems and users. Continue migrating applications to become fully web-based and integrate automated mission planning and scheduling capability. CAMPS Hardware upgrade.
Fund 9B United States Transportation Command
CAPITAL BUDGET
120
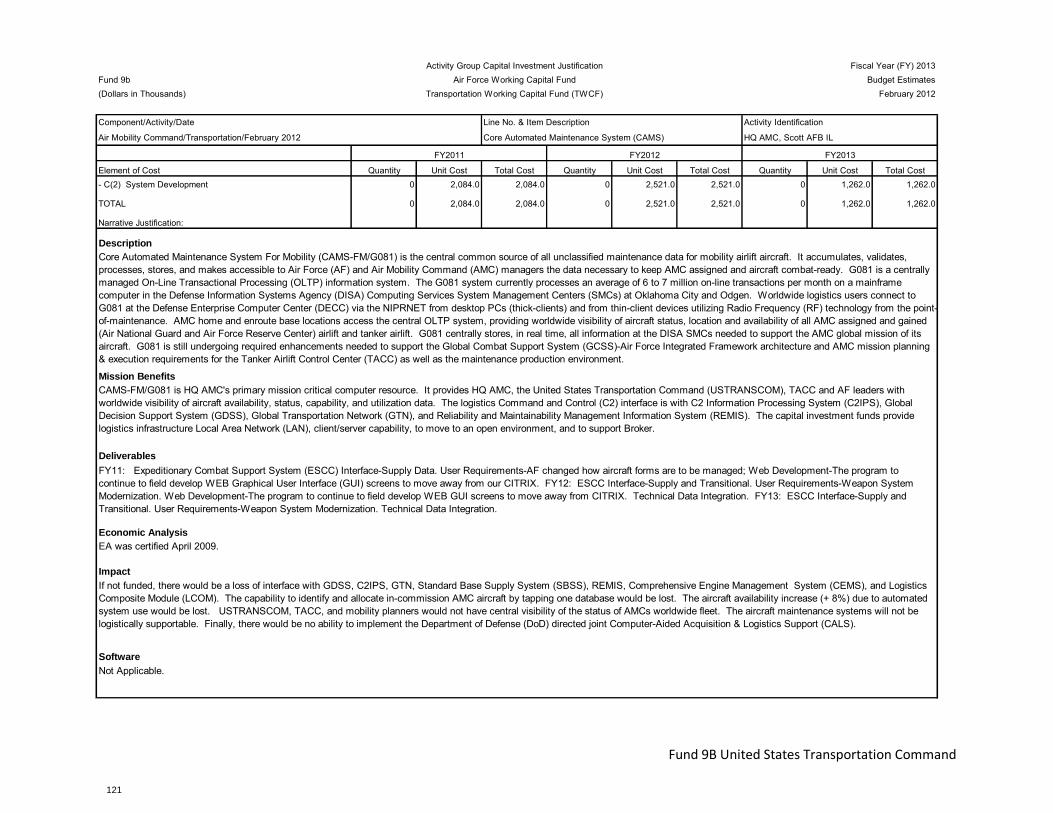
Activity Group Capital Investment Justification Fiscal Year (FY) 2013Fund 9b Air Force Working Capital Fund Budget Estimates(Dollars in Thousands) Transportation Working Capital Fund (TWCF) February 2012
Component/Activity/Date Line No. & Item Description Activity Identification
Air Mobility Command/Transportation/February 2012 Core Automated Maintenance System (CAMS) HQ AMC, Scott AFB IL
Element of Cost Quantity Unit Cost Total Cost Quantity Unit Cost Total Cost Quantity Unit Cost Total Cost- C(2) System Development 0 2,084.0 2,084.0 0 2,521.0 2,521.0 0 1,262.0 1,262.0
TOTAL 0 2,084.0 2,084.0 0 2,521.0 2,521.0 0 1,262.0 1,262.0
Narrative Justification:
Description
Mission Benefits
Deliverables
Economic Analysis
Impact
Software
If not funded, there would be a loss of interface with GDSS, C2IPS, GTN, Standard Base Supply System (SBSS), REMIS, Comprehensive Engine Management System (CEMS), and Logistics Composite Module (LCOM). The capability to identify and allocate in-commission AMC aircraft by tapping one database would be lost. The aircraft availability increase (+ 8%) due to automated system use would be lost. USTRANSCOM, TACC, and mobility planners would not have central visibility of the status of AMCs worldwide fleet. The aircraft maintenance systems will not be logistically supportable. Finally, there would be no ability to implement the Department of Defense (DoD) directed joint Computer-Aided Acquisition & Logistics Support (CALS).
Not Applicable.
FY2011 FY2012 FY2013
Core Automated Maintenance System For Mobility (CAMS-FM/G081) is the central common source of all unclassified maintenance data for mobility airlift aircraft. It accumulates, validates, processes, stores, and makes accessible to Air Force (AF) and Air Mobility Command (AMC) managers the data necessary to keep AMC assigned and aircraft combat-ready. G081 is a centrally managed On-Line Transactional Processing (OLTP) information system. The G081 system currently processes an average of 6 to 7 million on-line transactions per month on a mainframe computer in the Defense Information Systems Agency (DISA) Computing Services System Management Centers (SMCs) at Oklahoma City and Odgen. Worldwide logistics users connect to G081 at the Defense Enterprise Computer Center (DECC) via the NIPRNET from desktop PCs (thick-clients) and from thin-client devices utilizing Radio Frequency (RF) technology from the point-of-maintenance. AMC home and enroute base locations access the central OLTP system, providing worldwide visibility of aircraft status, location and availability of all AMC assigned and gained (Air National Guard and Air Force Reserve Center) airlift and tanker airlift. G081 centrally stores, in real time, all information at the DISA SMCs needed to support the AMC global mission of its aircraft. G081 is still undergoing required enhancements needed to support the Global Combat Support System (GCSS)-Air Force Integrated Framework architecture and AMC mission planning & execution requirements for the Tanker Airlift Control Center (TACC) as well as the maintenance production environment.
CAMS-FM/G081 is HQ AMC's primary mission critical computer resource. It provides HQ AMC, the United States Transportation Command (USTRANSCOM), TACC and AF leaders with worldwide visibility of aircraft availability, status, capability, and utilization data. The logistics Command and Control (C2) interface is with C2 Information Processing System (C2IPS), Global Decision Support System (GDSS), Global Transportation Network (GTN), and Reliability and Maintainability Management Information System (REMIS). The capital investment funds provide logistics infrastructure Local Area Network (LAN), client/server capability, to move to an open environment, and to support Broker.
EA was certified April 2009.
FY11: Expeditionary Combat Support System (ESCC) Interface-Supply Data. User Requirements-AF changed how aircraft forms are to be managed; Web Development-The program to continue to field develop WEB Graphical User Interface (GUI) screens to move away from our CITRIX. FY12: ESCC Interface-Supply and Transitional. User Requirements-Weapon System Modernization. Web Development-The program to continue to field develop WEB GUI screens to move away from CITRIX. Technical Data Integration. FY13: ESCC Interface-Supply and Transitional. User Requirements-Weapon System Modernization. Technical Data Integration.
Fund 9B United States Transportation Command
CAPITAL BUDGET
121
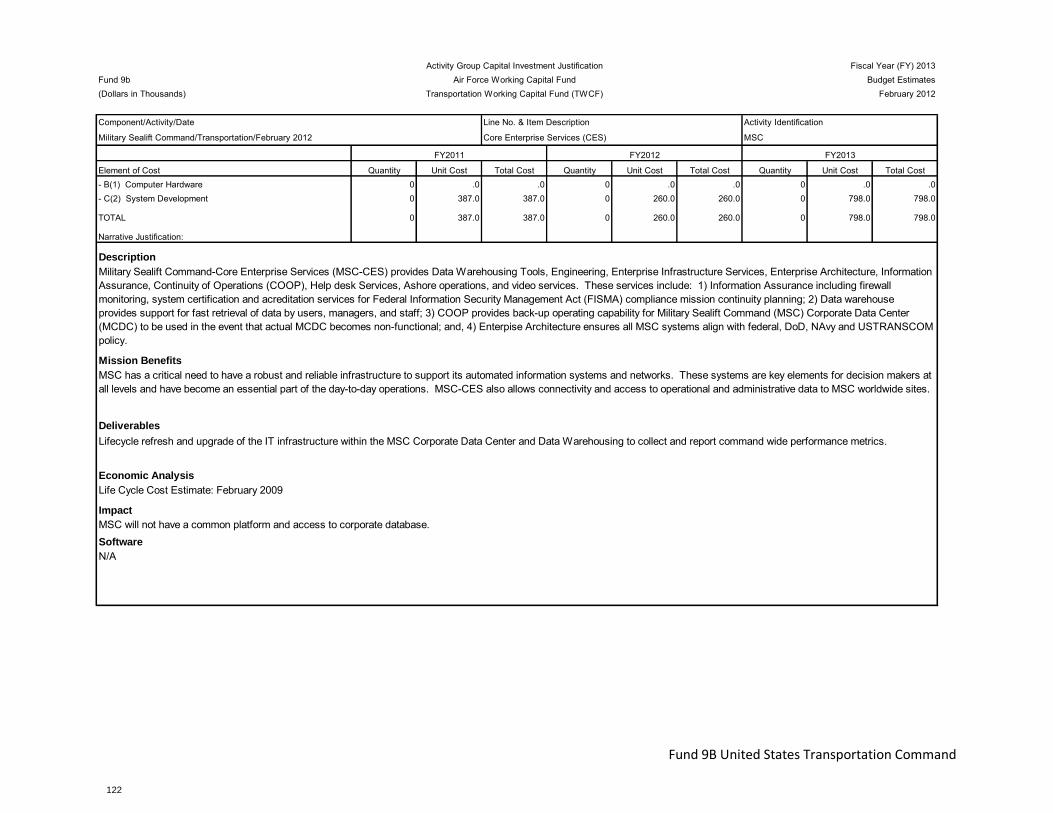
Q Activity Group Capital Investment Justification Fiscal Year (FY) 2013Fund 9b Air Force Working Capital Fund Budget Estimates(Dollars in Thousands) Transportation Working Capital Fund (TWCF) February 2012
Component/Activity/Date Line No. & Item Description Activity Identification
Military Sealift Command/Transportation/February 2012 Core Enterprise Services (CES) MSC
Element of Cost Quantity Unit Cost Total Cost Quantity Unit Cost Total Cost Quantity Unit Cost Total Cost- B(1) Computer Hardware 0 .0 .0 0 .0 .0 0 .0 .0- C(2) System Development 0 387.0 387.0 0 260.0 260.0 0 798.0 798.0
TOTAL 0 387.0 387.0 0 260.0 260.0 0 798.0 798.0
Narrative Justification:
Description
Mission Benefits
Deliverables
Economic Analysis
Impact
Software
MSC will not have a common platform and access to corporate database.
N/A
FY2011 FY2012 FY2013
Military Sealift Command-Core Enterprise Services (MSC-CES) provides Data Warehousing Tools, Engineering, Enterprise Infrastructure Services, Enterprise Architecture, Information Assurance, Continuity of Operations (COOP), Help desk Services, Ashore operations, and video services. These services include: 1) Information Assurance including firewall monitoring, system certification and acreditation services for Federal Information Security Management Act (FISMA) compliance mission continuity planning; 2) Data warehouse provides support for fast retrieval of data by users, managers, and staff; 3) COOP provides back-up operating capability for Military Sealift Command (MSC) Corporate Data Center (MCDC) to be used in the event that actual MCDC becomes non-functional; and, 4) Enterpise Architecture ensures all MSC systems align with federal, DoD, NAvy and USTRANSCOM policy.
MSC has a critical need to have a robust and reliable infrastructure to support its automated information systems and networks. These systems are key elements for decision makers at all levels and have become an essential part of the day-to-day operations. MSC-CES also allows connectivity and access to operational and administrative data to MSC worldwide sites.
Life Cycle Cost Estimate: February 2009
Lifecycle refresh and upgrade of the IT infrastructure within the MSC Corporate Data Center and Data Warehousing to collect and report command wide performance metrics.
Fund 9B United States Transportation Command
CAPITAL BUDGET
122
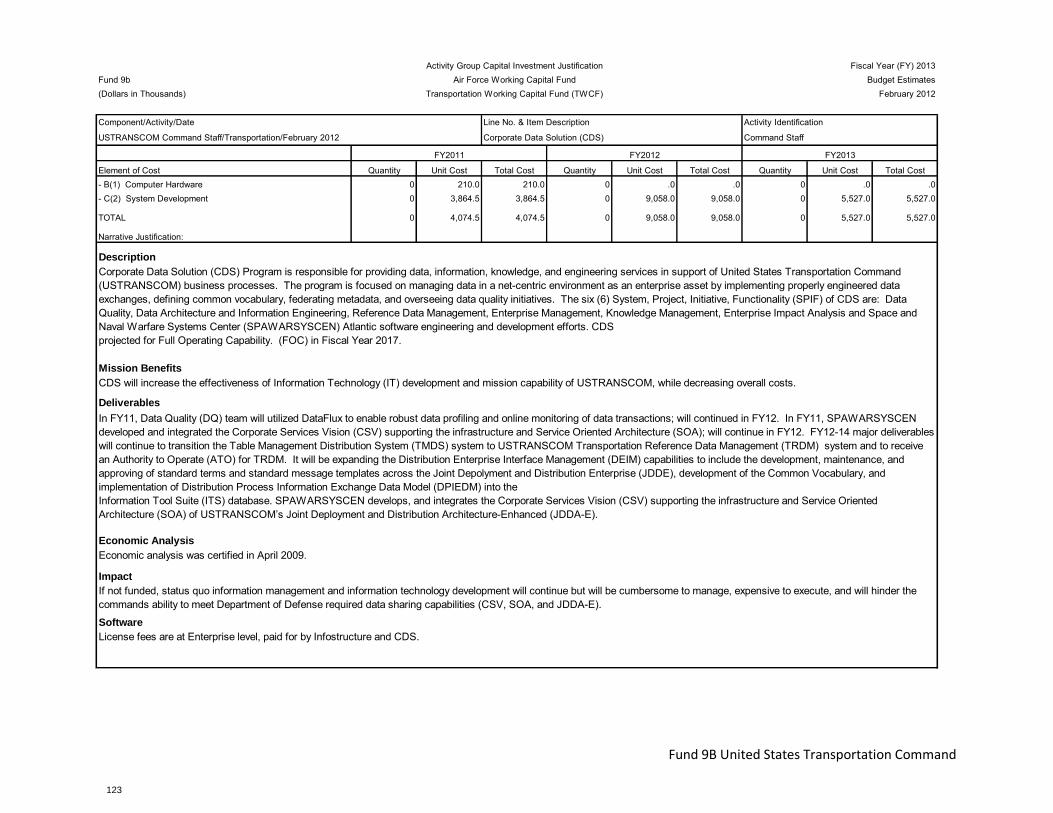
Activity Group Capital Investment Justification Fiscal Year (FY) 2013Fund 9b Air Force Working Capital Fund Budget Estimates(Dollars in Thousands) Transportation Working Capital Fund (TWCF) February 2012
Component/Activity/Date Line No. & Item Description Activity Identification
USTRANSCOM Command Staff/Transportation/February 2012 Corporate Data Solution (CDS) Command Staff
Element of Cost Quantity Unit Cost Total Cost Quantity Unit Cost Total Cost Quantity Unit Cost Total Cost- B(1) Computer Hardware 0 210.0 210.0 0 .0 .0 0 .0 .0- C(2) System Development 0 3,864.5 3,864.5 0 9,058.0 9,058.0 0 5,527.0 5,527.0
TOTAL 0 4,074.5 4,074.5 0 9,058.0 9,058.0 0 5,527.0 5,527.0
Narrative Justification:
Description
Mission Benefits
Deliverables
Economic Analysis
Impact
Software
If not funded, status quo information management and information technology development will continue but will be cumbersome to manage, expensive to execute, and will hinder the commands ability to meet Department of Defense required data sharing capabilities (CSV, SOA, and JDDA-E).
License fees are at Enterprise level, paid for by Infostructure and CDS.
FY2011 FY2012 FY2013
Corporate Data Solution (CDS) Program is responsible for providing data, information, knowledge, and engineering services in support of United States Transportation Command (USTRANSCOM) business processes. The program is focused on managing data in a net-centric environment as an enterprise asset by implementing properly engineered data exchanges, defining common vocabulary, federating metadata, and overseeing data quality initiatives. The six (6) System, Project, Initiative, Functionality (SPIF) of CDS are: Data Quality, Data Architecture and Information Engineering, Reference Data Management, Enterprise Management, Knowledge Management, Enterprise Impact Analysis and Space and Naval Warfare Systems Center (SPAWARSYSCEN) Atlantic software engineering and development efforts. CDS projected for Full Operating Capability. (FOC) in Fiscal Year 2017.
CDS will increase the effectiveness of Information Technology (IT) development and mission capability of USTRANSCOM, while decreasing overall costs.
Economic analysis was certified in April 2009.
In FY11, Data Quality (DQ) team will utilized DataFlux to enable robust data profiling and online monitoring of data transactions; will continued in FY12. In FY11, SPAWARSYSCEN developed and integrated the Corporate Services Vision (CSV) supporting the infrastructure and Service Oriented Architecture (SOA); will continue in FY12. FY12-14 major deliverables will continue to transition the Table Management Distribution System (TMDS) system to USTRANSCOM Transportation Reference Data Management (TRDM) system and to receive an Authority to Operate (ATO) for TRDM. It will be expanding the Distribution Enterprise Interface Management (DEIM) capabilities to include the development, maintenance, and approving of standard terms and standard message templates across the Joint Depolyment and Distribution Enterprise (JDDE), development of the Common Vocabulary, and implementation of Distribution Process Information Exchange Data Model (DPIEDM) into the Information Tool Suite (ITS) database. SPAWARSYSCEN develops, and integrates the Corporate Services Vision (CSV) supporting the infrastructure and Service Oriented Architecture (SOA) of USTRANSCOM’s Joint Deployment and Distribution Architecture-Enhanced (JDDA-E).
Fund 9B United States Transportation Command
CAPITAL BUDGET
123

Activity Group Capital Investment Justification Fiscal Year (FY) 2013Fund 9b Air Force Working Capital Fund Budget Estimates(Dollars in Thousands) Transportation Working Capital Fund (TWCF) February 2012
Component/Activity/Date Line No. & Item Description Activity Identification
USTRANSCOM Command Staff/Transportation/February 2012 Command Staff
Element of Cost Quantity Unit Cost Total Cost Quantity Unit Cost Total Cost Quantity Unit Cost Total Cost
- C(2) System Development 0 451.6 451.6 0 162.0 162.0 0 .0 .0
TOTAL 0 451.6 451.6 0 162.0 162.0 0 .0 .0
Narrative Justification:
Description
Mission Benefits
Deliverables
Economic Analysis
Impact
Software
Information Assurance (IA)/Information Protection (IP) Operations
Failure to provide and improve network security architectures increases the vulnerability of USTRANSCOM and Transportation Component Command mission systems to electronic attacks resulting in the loss of critical command and control functions.
No license fees apply
FY2011 FY2012 FY2013
This program encompasses cyberspace operations defense capabilities providing people, operations, and technology that protect and defend USTRANSCOM information and information systems by ensuring their availability, integrity, authentication, confidentiality and non-repudiation. The program is aligned with the Deputy Assistant Secretary of Defense for Cyber Identity and Information Assurance (CIIA) Strategy.
Develop and enforce Computer Network Defense (CND) policies across the enterprise to achieve an optimal readiness posture against nation state attackers as well as insiders. Evaluates and deploy CND tools and capabilities. Establish mechanisms and procedures within CND response action guidelines that effectively utilize developed CND tools and capabilities to react and respond to events. Mitigate insider threat across DOD through the implementation of advanced tools, processes, and operational capabilities.
Life Cycle Cost Estimate (LCCE) received August 2007.
FY11-13 deliverables includes Communications Security (COMSEC) support for USTRANSCOM DPO operations, keying material, and COMSEC equipment.
Fund 9B United States Transportation Command
CAPITAL BUDGET
124
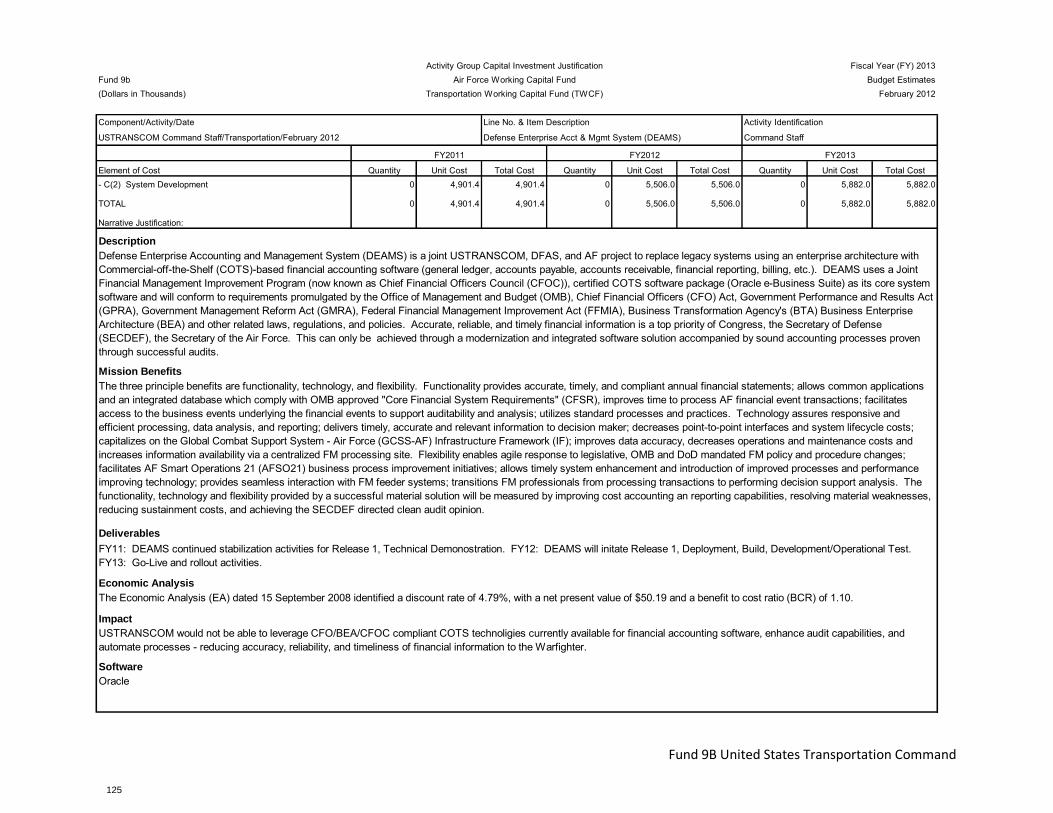
Activity Group Capital Investment Justification Fiscal Year (FY) 2013Fund 9b Air Force Working Capital Fund Budget Estimates(Dollars in Thousands) Transportation Working Capital Fund (TWCF) February 2012
Component/Activity/Date Line No. & Item Description Activity Identification
USTRANSCOM Command Staff/Transportation/February 2012 Defense Enterprise Acct & Mgmt System (DEAMS) Command Staff
Element of Cost Quantity Unit Cost Total Cost Quantity Unit Cost Total Cost Quantity Unit Cost Total Cost- C(2) System Development 0 4,901.4 4,901.4 0 5,506.0 5,506.0 0 5,882.0 5,882.0
TOTAL 0 4,901.4 4,901.4 0 5,506.0 5,506.0 0 5,882.0 5,882.0
Narrative Justification:
Description
Mission Benefits
Deliverables
Economic Analysis
Impact
Software
USTRANSCOM would not be able to leverage CFO/BEA/CFOC compliant COTS technoligies currently available for financial accounting software, enhance audit capabilities, and automate processes - reducing accuracy, reliability, and timeliness of financial information to the Warfighter.
Oracle
FY2011 FY2012 FY2013
Defense Enterprise Accounting and Management System (DEAMS) is a joint USTRANSCOM, DFAS, and AF project to replace legacy systems using an enterprise architecture with Commercial-off-the-Shelf (COTS)-based financial accounting software (general ledger, accounts payable, accounts receivable, financial reporting, billing, etc.). DEAMS uses a Joint Financial Management Improvement Program (now known as Chief Financial Officers Council (CFOC)), certified COTS software package (Oracle e-Business Suite) as its core system software and will conform to requirements promulgated by the Office of Management and Budget (OMB), Chief Financial Officers (CFO) Act, Government Performance and Results Act (GPRA), Government Management Reform Act (GMRA), Federal Financial Management Improvement Act (FFMIA), Business Transformation Agency's (BTA) Business Enterprise Architecture (BEA) and other related laws, regulations, and policies. Accurate, reliable, and timely financial information is a top priority of Congress, the Secretary of Defense (SECDEF), the Secretary of the Air Force. This can only be achieved through a modernization and integrated software solution accompanied by sound accounting processes proven through successful audits.
The three principle benefits are functionality, technology, and flexibility. Functionality provides accurate, timely, and compliant annual financial statements; allows common applications and an integrated database which comply with OMB approved "Core Financial System Requirements" (CFSR), improves time to process AF financial event transactions; facilitates access to the business events underlying the financial events to support auditability and analysis; utilizes standard processes and practices. Technology assures responsive and efficient processing, data analysis, and reporting; delivers timely, accurate and relevant information to decision maker; decreases point-to-point interfaces and system lifecycle costs; capitalizes on the Global Combat Support System - Air Force (GCSS-AF) Infrastructure Framework (IF); improves data accuracy, decreases operations and maintenance costs and increases information availability via a centralized FM processing site. Flexibility enables agile response to legislative, OMB and DoD mandated FM policy and procedure changes; facilitates AF Smart Operations 21 (AFSO21) business process improvement initiatives; allows timely system enhancement and introduction of improved processes and performance improving technology; provides seamless interaction with FM feeder systems; transitions FM professionals from processing transactions to performing decision support analysis. The functionality, technology and flexibility provided by a successful material solution will be measured by improving cost accounting an reporting capabilities, resolving material weaknesses, reducing sustainment costs, and achieving the SECDEF directed clean audit opinion.
The Economic Analysis (EA) dated 15 September 2008 identified a discount rate of 4.79%, with a net present value of $50.19 and a benefit to cost ratio (BCR) of 1.10.
FY11: DEAMS continued stabilization activities for Release 1, Technical Demonostration. FY12: DEAMS will initate Release 1, Deployment, Build, Development/Operational Test. FY13: Go-Live and rollout activities.
Fund 9B United States Transportation Command
CAPITAL BUDGET
125
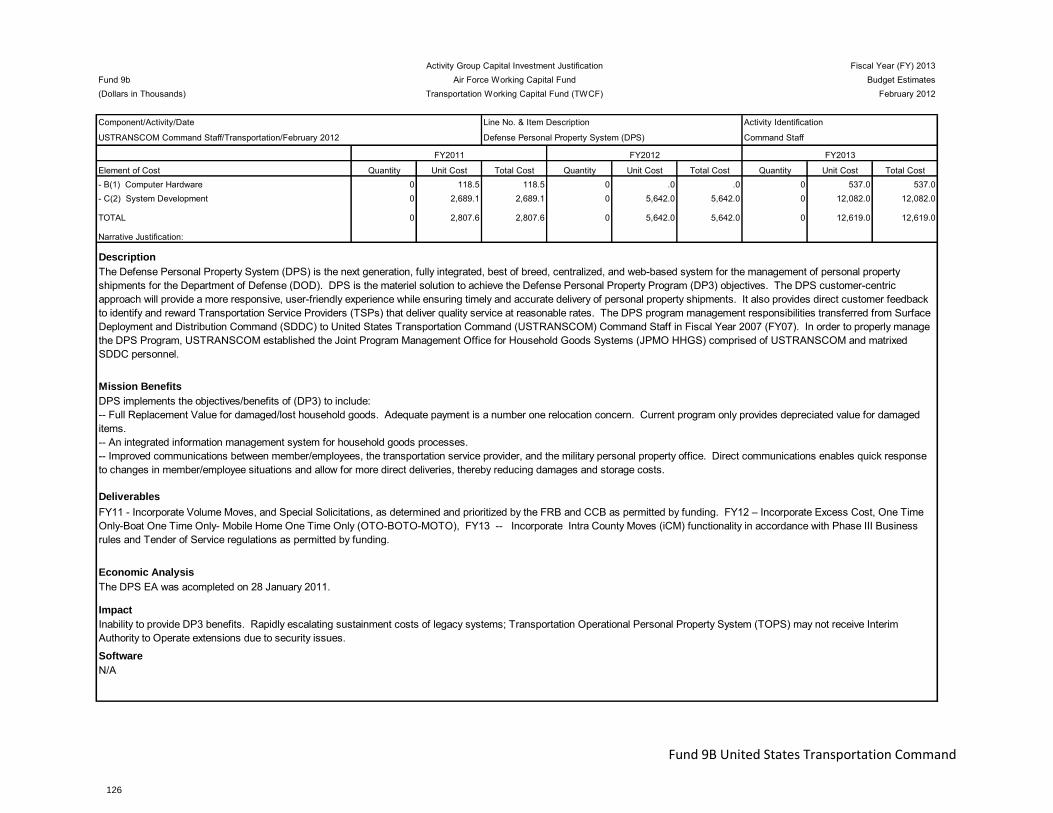
Activity Group Capital Investment Justification Fiscal Year (FY) 2013Fund 9b Air Force Working Capital Fund Budget Estimates(Dollars in Thousands) Transportation Working Capital Fund (TWCF) February 2012
Component/Activity/Date Line No. & Item Description Activity Identification
USTRANSCOM Command Staff/Transportation/February 2012 Defense Personal Property System (DPS) Command Staff
Element of Cost Quantity Unit Cost Total Cost Quantity Unit Cost Total Cost Quantity Unit Cost Total Cost- B(1) Computer Hardware 0 118.5 118.5 0 .0 .0 0 537.0 537.0- C(2) System Development 0 2,689.1 2,689.1 0 5,642.0 5,642.0 0 12,082.0 12,082.0
TOTAL 0 2,807.6 2,807.6 0 5,642.0 5,642.0 0 12,619.0 12,619.0
Narrative Justification:
Description
Mission Benefits
Deliverables
Economic Analysis
Impact
Software
Inability to provide DP3 benefits. Rapidly escalating sustainment costs of legacy systems; Transportation Operational Personal Property System (TOPS) may not receive Interim Authority to Operate extensions due to security issues.
N/A
FY2011 FY2012 FY2013
The Defense Personal Property System (DPS) is the next generation, fully integrated, best of breed, centralized, and web-based system for the management of personal property shipments for the Department of Defense (DOD). DPS is the materiel solution to achieve the Defense Personal Property Program (DP3) objectives. The DPS customer-centric approach will provide a more responsive, user-friendly experience while ensuring timely and accurate delivery of personal property shipments. It also provides direct customer feedback to identify and reward Transportation Service Providers (TSPs) that deliver quality service at reasonable rates. The DPS program management responsibilities transferred from Surface Deployment and Distribution Command (SDDC) to United States Transportation Command (USTRANSCOM) Command Staff in Fiscal Year 2007 (FY07). In order to properly manage the DPS Program, USTRANSCOM established the Joint Program Management Office for Household Goods Systems (JPMO HHGS) comprised of USTRANSCOM and matrixed SDDC personnel.
DPS implements the objectives/benefits of (DP3) to include: -- Full Replacement Value for damaged/lost household goods. Adequate payment is a number one relocation concern. Current program only provides depreciated value for damaged items. -- An integrated information management system for household goods processes. -- Improved communications between member/employees, the transportation service provider, and the military personal property office. Direct communications enables quick response to changes in member/employee situations and allow for more direct deliveries, thereby reducing damages and storage costs.
The DPS EA was acompleted on 28 January 2011.
FY11 - Incorporate Volume Moves, and Special Solicitations, as determined and prioritized by the FRB and CCB as permitted by funding. FY12 – Incorporate Excess Cost, One Time Only-Boat One Time Only- Mobile Home One Time Only (OTO-BOTO-MOTO), FY13 -- Incorporate Intra County Moves (iCM) functionality in accordance with Phase III Business rules and Tender of Service regulations as permitted by funding.
Fund 9B United States Transportation Command
CAPITAL BUDGET
126
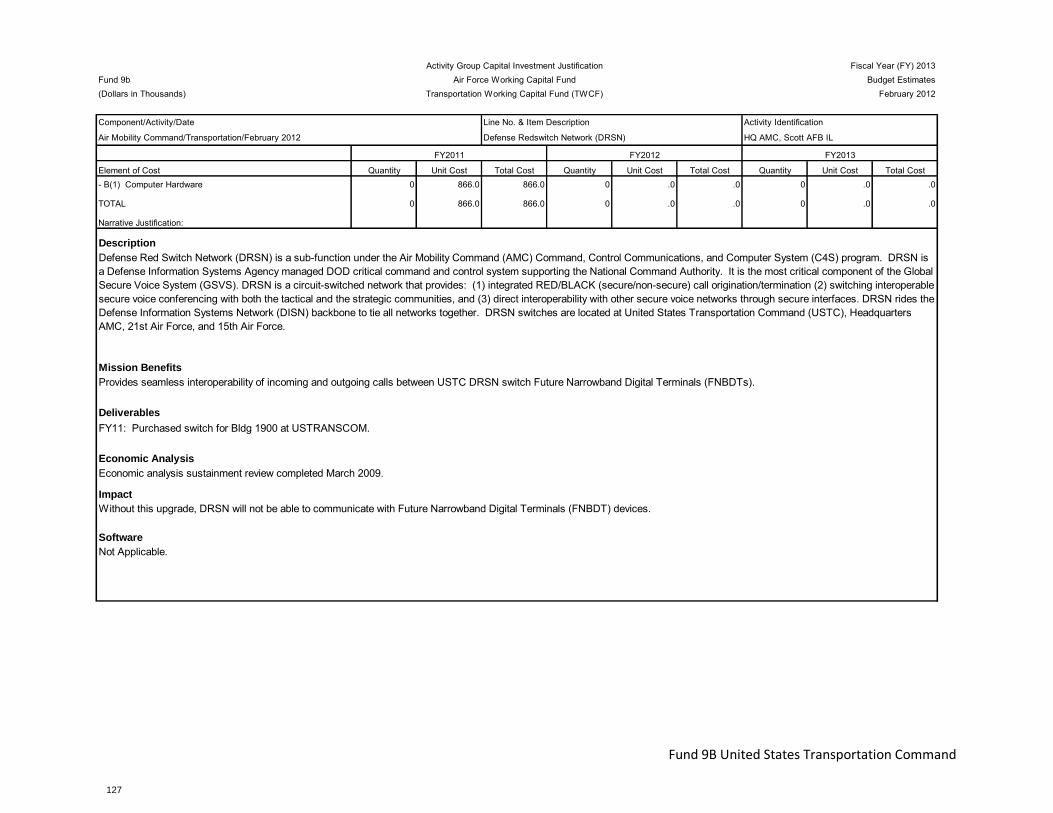
Activity Group Capital Investment Justification Fiscal Year (FY) 2013Fund 9b Air Force Working Capital Fund Budget Estimates(Dollars in Thousands) Transportation Working Capital Fund (TWCF) February 2012
Component/Activity/Date Line No. & Item Description Activity Identification
Air Mobility Command/Transportation/February 2012 Defense Redswitch Network (DRSN) HQ AMC, Scott AFB IL
Element of Cost Quantity Unit Cost Total Cost Quantity Unit Cost Total Cost Quantity Unit Cost Total Cost- B(1) Computer Hardware 0 866.0 866.0 0 .0 .0 0 .0 .0
TOTAL 0 866.0 866.0 0 .0 .0 0 .0 .0
Narrative Justification:
Description
Mission Benefits
Deliverables
Economic Analysis
Impact
Software
Without this upgrade, DRSN will not be able to communicate with Future Narrowband Digital Terminals (FNBDT) devices.
Not Applicable.
FY2011 FY2012 FY2013
Defense Red Switch Network (DRSN) is a sub-function under the Air Mobility Command (AMC) Command, Control Communications, and Computer System (C4S) program. DRSN is a Defense Information Systems Agency managed DOD critical command and control system supporting the National Command Authority. It is the most critical component of the Global Secure Voice System (GSVS). DRSN is a circuit-switched network that provides: (1) integrated RED/BLACK (secure/non-secure) call origination/termination (2) switching interoperable secure voice conferencing with both the tactical and the strategic communities, and (3) direct interoperability with other secure voice networks through secure interfaces. DRSN rides the Defense Information Systems Network (DISN) backbone to tie all networks together. DRSN switches are located at United States Transportation Command (USTC), Headquarters AMC, 21st Air Force, and 15th Air Force.
Provides seamless interoperability of incoming and outgoing calls between USTC DRSN switch Future Narrowband Digital Terminals (FNBDTs).
Economic analysis sustainment review completed March 2009.
FY11: Purchased switch for Bldg 1900 at USTRANSCOM.
Fund 9B United States Transportation Command
CAPITAL BUDGET
127
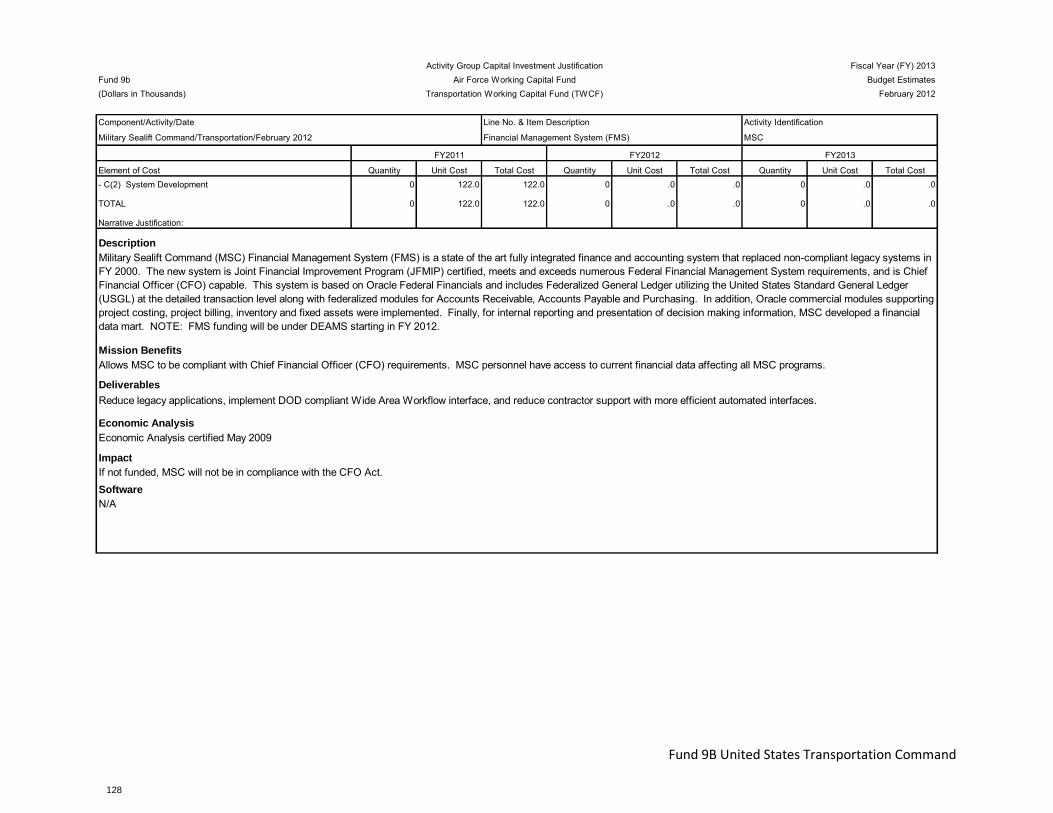
Q Activity Group Capital Investment Justification Fiscal Year (FY) 2013Fund 9b Air Force Working Capital Fund Budget Estimates(Dollars in Thousands) Transportation Working Capital Fund (TWCF) February 2012
Component/Activity/Date Line No. & Item Description Activity Identification
Military Sealift Command/Transportation/February 2012 Financial Management System (FMS) MSC
Element of Cost Quantity Unit Cost Total Cost Quantity Unit Cost Total Cost Quantity Unit Cost Total Cost- C(2) System Development 0 122.0 122.0 0 .0 .0 0 .0 .0
TOTAL 0 122.0 122.0 0 .0 .0 0 .0 .0
Narrative Justification:
Description
Mission Benefits
Deliverables
Economic Analysis
Impact
Software
If not funded, MSC will not be in compliance with the CFO Act.
N/A
FY2011 FY2012 FY2013
Military Sealift Command (MSC) Financial Management System (FMS) is a state of the art fully integrated finance and accounting system that replaced non-compliant legacy systems in FY 2000. The new system is Joint Financial Improvement Program (JFMIP) certified, meets and exceeds numerous Federal Financial Management System requirements, and is Chief Financial Officer (CFO) capable. This system is based on Oracle Federal Financials and includes Federalized General Ledger utilizing the United States Standard General Ledger (USGL) at the detailed transaction level along with federalized modules for Accounts Receivable, Accounts Payable and Purchasing. In addition, Oracle commercial modules supporting project costing, project billing, inventory and fixed assets were implemented. Finally, for internal reporting and presentation of decision making information, MSC developed a financial data mart. NOTE: FMS funding will be under DEAMS starting in FY 2012.
Allows MSC to be compliant with Chief Financial Officer (CFO) requirements. MSC personnel have access to current financial data affecting all MSC programs.
Economic Analysis certified May 2009
Reduce legacy applications, implement DOD compliant Wide Area Workflow interface, and reduce contractor support with more efficient automated interfaces.
Fund 9B United States Transportation Command
CAPITAL BUDGET
128
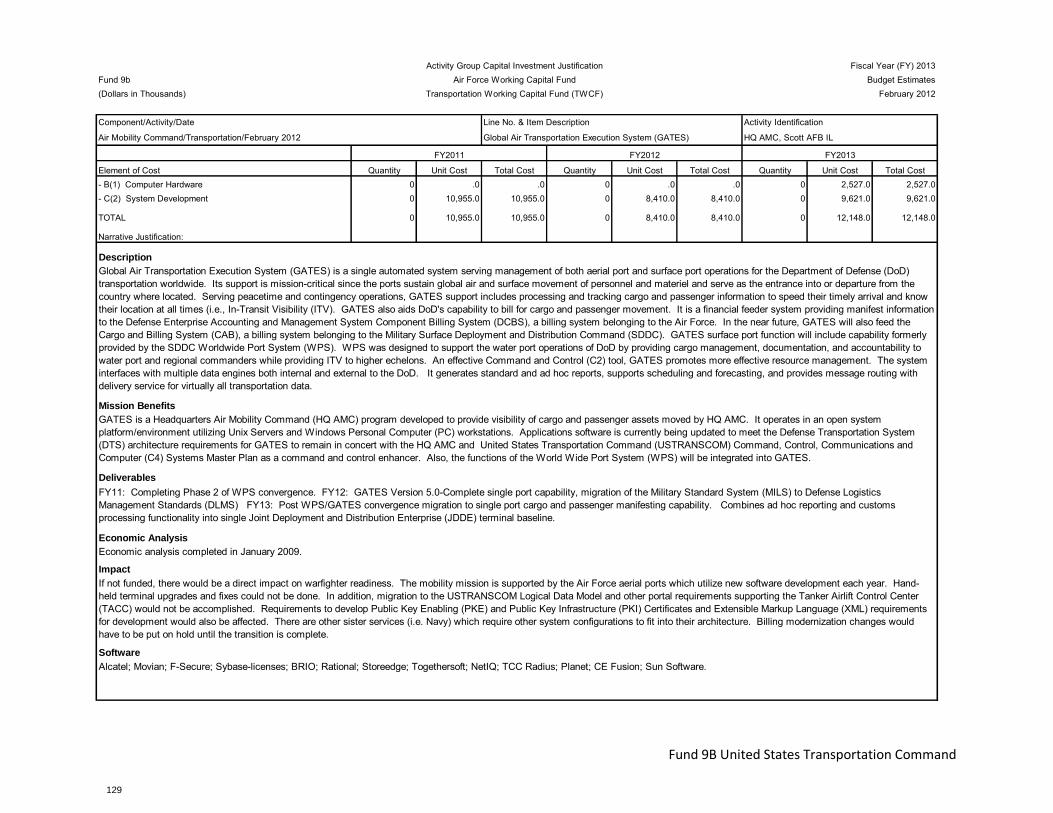
Activity Group Capital Investment Justification Fiscal Year (FY) 2013Fund 9b Air Force Working Capital Fund Budget Estimates(Dollars in Thousands) Transportation Working Capital Fund (TWCF) February 2012
Component/Activity/Date Line No. & Item Description Activity Identification
Air Mobility Command/Transportation/February 2012 Global Air Transportation Execution System (GATES) HQ AMC, Scott AFB IL
Element of Cost Quantity Unit Cost Total Cost Quantity Unit Cost Total Cost Quantity Unit Cost Total Cost- B(1) Computer Hardware 0 .0 .0 0 .0 .0 0 2,527.0 2,527.0- C(2) System Development 0 10,955.0 10,955.0 0 8,410.0 8,410.0 0 9,621.0 9,621.0
TOTAL 0 10,955.0 10,955.0 0 8,410.0 8,410.0 0 12,148.0 12,148.0
Narrative Justification:
Description
Mission Benefits
Deliverables
Economic Analysis
Impact
Software
If not funded, there would be a direct impact on warfighter readiness. The mobility mission is supported by the Air Force aerial ports which utilize new software development each year. Hand-held terminal upgrades and fixes could not be done. In addition, migration to the USTRANSCOM Logical Data Model and other portal requirements supporting the Tanker Airlift Control Center (TACC) would not be accomplished. Requirements to develop Public Key Enabling (PKE) and Public Key Infrastructure (PKI) Certificates and Extensible Markup Language (XML) requirements for development would also be affected. There are other sister services (i.e. Navy) which require other system configurations to fit into their architecture. Billing modernization changes would have to be put on hold until the transition is complete.
Alcatel; Movian; F-Secure; Sybase-licenses; BRIO; Rational; Storeedge; Togethersoft; NetIQ; TCC Radius; Planet; CE Fusion; Sun Software.
FY2011 FY2012 FY2013
Global Air Transportation Execution System (GATES) is a single automated system serving management of both aerial port and surface port operations for the Department of Defense (DoD) transportation worldwide. Its support is mission-critical since the ports sustain global air and surface movement of personnel and materiel and serve as the entrance into or departure from the country where located. Serving peacetime and contingency operations, GATES support includes processing and tracking cargo and passenger information to speed their timely arrival and know their location at all times (i.e., In-Transit Visibility (ITV). GATES also aids DoD's capability to bill for cargo and passenger movement. It is a financial feeder system providing manifest information to the Defense Enterprise Accounting and Management System Component Billing System (DCBS), a billing system belonging to the Air Force. In the near future, GATES will also feed the Cargo and Billing System (CAB), a billing system belonging to the Military Surface Deployment and Distribution Command (SDDC). GATES surface port function will include capability formerly provided by the SDDC Worldwide Port System (WPS). WPS was designed to support the water port operations of DoD by providing cargo management, documentation, and accountability to water port and regional commanders while providing ITV to higher echelons. An effective Command and Control (C2) tool, GATES promotes more effective resource management. The system interfaces with multiple data engines both internal and external to the DoD. It generates standard and ad hoc reports, supports scheduling and forecasting, and provides message routing with delivery service for virtually all transportation data.
GATES is a Headquarters Air Mobility Command (HQ AMC) program developed to provide visibility of cargo and passenger assets moved by HQ AMC. It operates in an open system platform/environment utilizing Unix Servers and Windows Personal Computer (PC) workstations. Applications software is currently being updated to meet the Defense Transportation System (DTS) architecture requirements for GATES to remain in concert with the HQ AMC and United States Transportation Command (USTRANSCOM) Command, Control, Communications and Computer (C4) Systems Master Plan as a command and control enhancer. Also, the functions of the World Wide Port System (WPS) will be integrated into GATES.
Economic analysis completed in January 2009.
FY11: Completing Phase 2 of WPS convergence. FY12: GATES Version 5.0-Complete single port capability, migration of the Military Standard System (MILS) to Defense Logistics Management Standards (DLMS) FY13: Post WPS/GATES convergence migration to single port cargo and passenger manifesting capability. Combines ad hoc reporting and customs processing functionality into single Joint Deployment and Distribution Enterprise (JDDE) terminal baseline.
Fund 9B United States Transportation Command
CAPITAL BUDGET
129
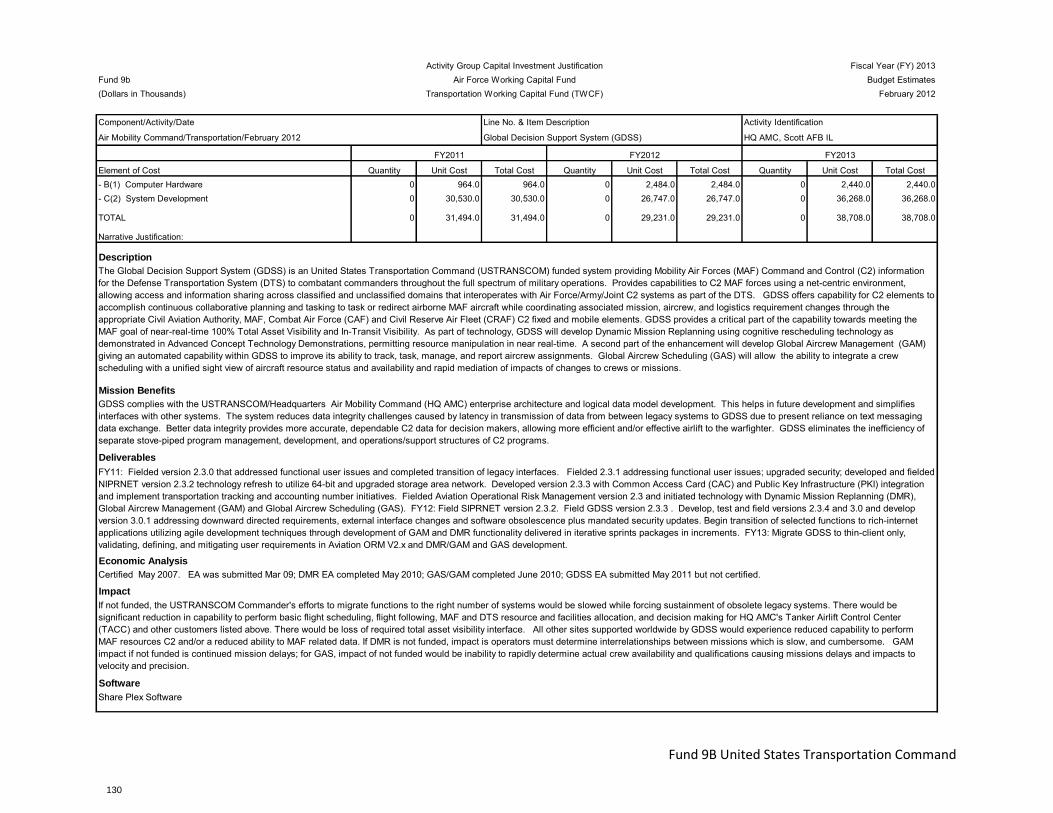
Q Activity Group Capital Investment Justification Fiscal Year (FY) 2013Fund 9b Air Force Working Capital Fund Budget Estimates(Dollars in Thousands) Transportation Working Capital Fund (TWCF) February 2012
Component/Activity/Date Line No. & Item Description Activity Identification
Air Mobility Command/Transportation/February 2012 Global Decision Support System (GDSS) HQ AMC, Scott AFB IL
Element of Cost Quantity Unit Cost Total Cost Quantity Unit Cost Total Cost Quantity Unit Cost Total Cost- B(1) Computer Hardware 0 964.0 964.0 0 2,484.0 2,484.0 0 2,440.0 2,440.0- C(2) System Development 0 30,530.0 30,530.0 0 26,747.0 26,747.0 0 36,268.0 36,268.0
TOTAL 0 31,494.0 31,494.0 0 29,231.0 29,231.0 0 38,708.0 38,708.0
Narrative Justification:
Description
Mission Benefits
Deliverables
Economic Analysis
Impact
Software
If not funded, the USTRANSCOM Commander's efforts to migrate functions to the right number of systems would be slowed while forcing sustainment of obsolete legacy systems. There would be significant reduction in capability to perform basic flight scheduling, flight following, MAF and DTS resource and facilities allocation, and decision making for HQ AMC's Tanker Airlift Control Center (TACC) and other customers listed above. There would be loss of required total asset visibility interface. All other sites supported worldwide by GDSS would experience reduced capability to perform MAF resources C2 and/or a reduced ability to MAF related data. If DMR is not funded, impact is operators must determine interrelationships between missions which is slow, and cumbersome. GAM impact if not funded is continued mission delays; for GAS, impact of not funded would be inability to rapidly determine actual crew availability and qualifications causing missions delays and impacts to velocity and precision.
Share Plex Software
FY2011 FY2012 FY2013
The Global Decision Support System (GDSS) is an United States Transportation Command (USTRANSCOM) funded system providing Mobility Air Forces (MAF) Command and Control (C2) information for the Defense Transportation System (DTS) to combatant commanders throughout the full spectrum of military operations. Provides capabilities to C2 MAF forces using a net-centric environment, allowing access and information sharing across classified and unclassified domains that interoperates with Air Force/Army/Joint C2 systems as part of the DTS. GDSS offers capability for C2 elements to accomplish continuous collaborative planning and tasking to task or redirect airborne MAF aircraft while coordinating associated mission, aircrew, and logistics requirement changes through the appropriate Civil Aviation Authority, MAF, Combat Air Force (CAF) and Civil Reserve Air Fleet (CRAF) C2 fixed and mobile elements. GDSS provides a critical part of the capability towards meeting the MAF goal of near-real-time 100% Total Asset Visibility and In-Transit Visibility. As part of technology, GDSS will develop Dynamic Mission Replanning using cognitive rescheduling technology as demonstrated in Advanced Concept Technology Demonstrations, permitting resource manipulation in near real-time. A second part of the enhancement will develop Global Aircrew Management (GAM) giving an automated capability within GDSS to improve its ability to track, task, manage, and report aircrew assignments. Global Aircrew Scheduling (GAS) will allow the ability to integrate a crew scheduling with a unified sight view of aircraft resource status and availability and rapid mediation of impacts of changes to crews or missions.
GDSS complies with the USTRANSCOM/Headquarters Air Mobility Command (HQ AMC) enterprise architecture and logical data model development. This helps in future development and simplifies interfaces with other systems. The system reduces data integrity challenges caused by latency in transmission of data from between legacy systems to GDSS due to present reliance on text messaging data exchange. Better data integrity provides more accurate, dependable C2 data for decision makers, allowing more efficient and/or effective airlift to the warfighter. GDSS eliminates the inefficiency of separate stove-piped program management, development, and operations/support structures of C2 programs.
Certified May 2007. EA was submitted Mar 09; DMR EA completed May 2010; GAS/GAM completed June 2010; GDSS EA submitted May 2011 but not certified.
FY11: Fielded version 2.3.0 that addressed functional user issues and completed transition of legacy interfaces. Fielded 2.3.1 addressing functional user issues; upgraded security; developed and fielded NIPRNET version 2.3.2 technology refresh to utilize 64-bit and upgraded storage area network. Developed version 2.3.3 with Common Access Card (CAC) and Public Key Infrastructure (PKI) integration and implement transportation tracking and accounting number initiatives. Fielded Aviation Operational Risk Management version 2.3 and initiated technology with Dynamic Mission Replanning (DMR), Global Aircrew Management (GAM) and Global Aircrew Scheduling (GAS). FY12: Field SIPRNET version 2.3.2. Field GDSS version 2.3.3 . Develop, test and field versions 2.3.4 and 3.0 and develop version 3.0.1 addressing downward directed requirements, external interface changes and software obsolescence plus mandated security updates. Begin transition of selected functions to rich-internet applications utilizing agile development techniques through development of GAM and DMR functionality delivered in iterative sprints packages in increments. FY13: Migrate GDSS to thin-client only, validating, defining, and mitigating user requirements in Aviation ORM V2.x and DMR/GAM and GAS development.
Fund 9B United States Transportation Command
CAPITAL BUDGET
130
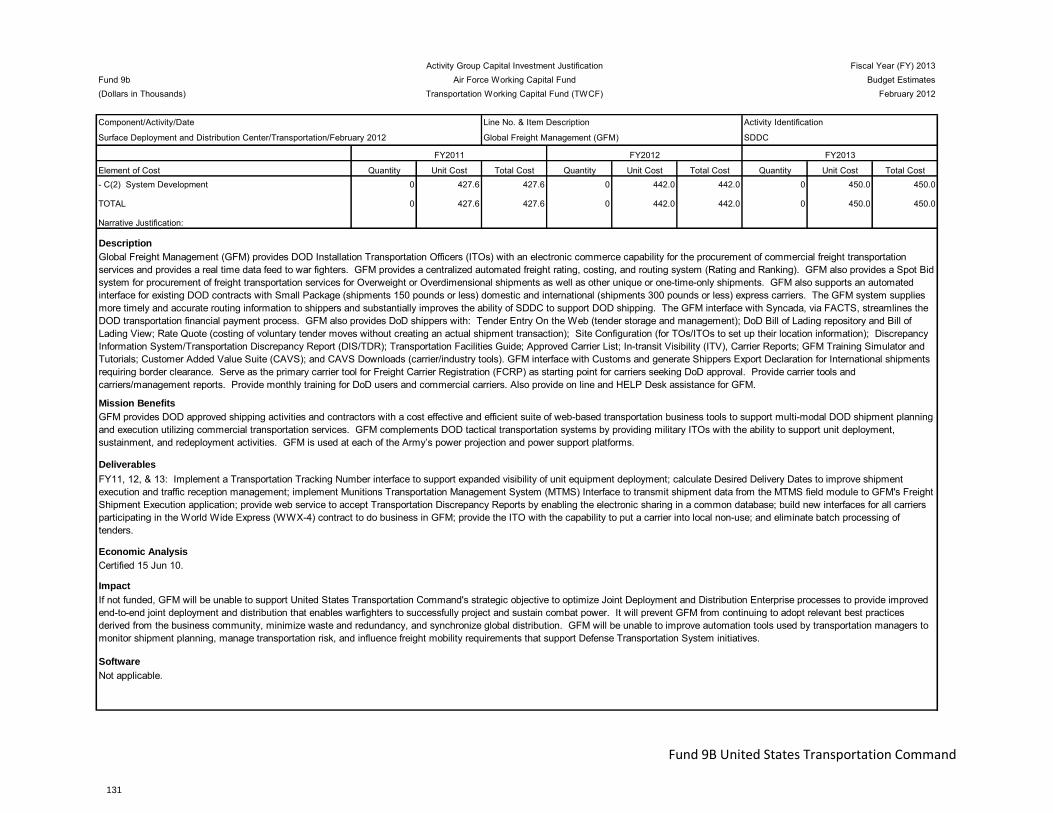
Q Activity Group Capital Investment Justification Fiscal Year (FY) 2013Fund 9b Air Force Working Capital Fund Budget Estimates(Dollars in Thousands) Transportation Working Capital Fund (TWCF) February 2012
Component/Activity/Date Line No. & Item Description Activity Identification
Surface Deployment and Distribution Center/Transportation/February 2012 Global Freight Management (GFM) SDDC
Element of Cost Quantity Unit Cost Total Cost Quantity Unit Cost Total Cost Quantity Unit Cost Total Cost- C(2) System Development 0 427.6 427.6 0 442.0 442.0 0 450.0 450.0
TOTAL 0 427.6 427.6 0 442.0 442.0 0 450.0 450.0
Narrative Justification:
Description
Mission Benefits
Deliverables
Economic Analysis
Impact
Software
If not funded, GFM will be unable to support United States Transportation Command's strategic objective to optimize Joint Deployment and Distribution Enterprise processes to provide improved end-to-end joint deployment and distribution that enables warfighters to successfully project and sustain combat power. It will prevent GFM from continuing to adopt relevant best practices derived from the business community, minimize waste and redundancy, and synchronize global distribution. GFM will be unable to improve automation tools used by transportation managers to monitor shipment planning, manage transportation risk, and influence freight mobility requirements that support Defense Transportation System initiatives.
Not applicable.
FY2011 FY2012 FY2013
Global Freight Management (GFM) provides DOD Installation Transportation Officers (ITOs) with an electronic commerce capability for the procurement of commercial freight transportation services and provides a real time data feed to war fighters. GFM provides a centralized automated freight rating, costing, and routing system (Rating and Ranking). GFM also provides a Spot Bid system for procurement of freight transportation services for Overweight or Overdimensional shipments as well as other unique or one-time-only shipments. GFM also supports an automated interface for existing DOD contracts with Small Package (shipments 150 pounds or less) domestic and international (shipments 300 pounds or less) express carriers. The GFM system supplies more timely and accurate routing information to shippers and substantially improves the ability of SDDC to support DOD shipping. The GFM interface with Syncada, via FACTS, streamlines the DOD transportation financial payment process. GFM also provides DoD shippers with: Tender Entry On the Web (tender storage and management); DoD Bill of Lading repository and Bill of Lading View; Rate Quote (costing of voluntary tender moves without creating an actual shipment transaction); Site Configuration (for TOs/ITOs to set up their location information); Discrepancy Information System/Transportation Discrepancy Report (DIS/TDR); Transportation Facilities Guide; Approved Carrier List; In-transit Visibility (ITV), Carrier Reports; GFM Training Simulator and Tutorials; Customer Added Value Suite (CAVS); and CAVS Downloads (carrier/industry tools). GFM interface with Customs and generate Shippers Export Declaration for International shipments requiring border clearance. Serve as the primary carrier tool for Freight Carrier Registration (FCRP) as starting point for carriers seeking DoD approval. Provide carrier tools and carriers/management reports. Provide monthly training for DoD users and commercial carriers. Also provide on line and HELP Desk assistance for GFM.
GFM provides DOD approved shipping activities and contractors with a cost effective and efficient suite of web-based transportation business tools to support multi-modal DOD shipment planning and execution utilizing commercial transportation services. GFM complements DOD tactical transportation systems by providing military ITOs with the ability to support unit deployment, sustainment, and redeployment activities. GFM is used at each of the Army’s power projection and power support platforms.
Certified 15 Jun 10.
FY11, 12, & 13: Implement a Transportation Tracking Number interface to support expanded visibility of unit equipment deployment; calculate Desired Delivery Dates to improve shipment execution and traffic reception management; implement Munitions Transportation Management System (MTMS) Interface to transmit shipment data from the MTMS field module to GFM's Freight Shipment Execution application; provide web service to accept Transportation Discrepancy Reports by enabling the electronic sharing in a common database; build new interfaces for all carriers participating in the World Wide Express (WWX-4) contract to do business in GFM; provide the ITO with the capability to put a carrier into local non-use; and eliminate batch processing of tenders.
Fund 9B United States Transportation Command
CAPITAL BUDGET
131
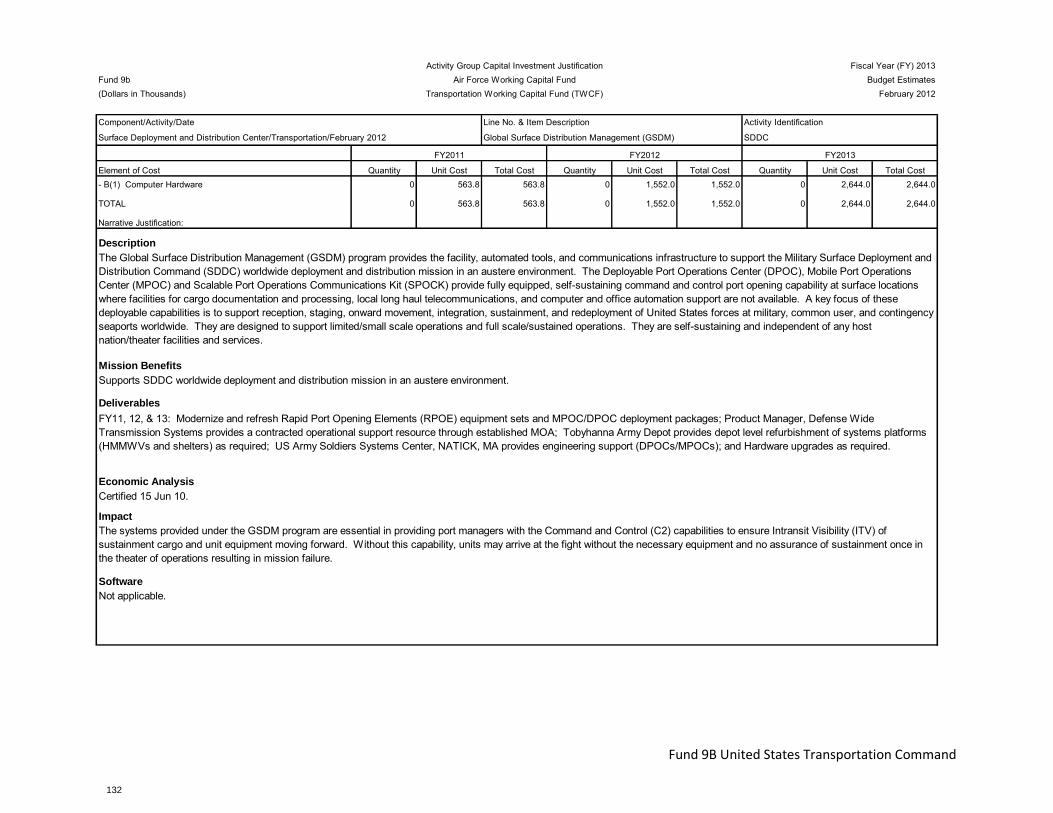
Q Activity Group Capital Investment Justification Fiscal Year (FY) 2013Fund 9b Air Force Working Capital Fund Budget Estimates(Dollars in Thousands) Transportation Working Capital Fund (TWCF) February 2012
Component/Activity/Date Line No. & Item Description Activity Identification
Surface Deployment and Distribution Center/Transportation/February 2012 Global Surface Distribution Management (GSDM) SDDC
Element of Cost Quantity Unit Cost Total Cost Quantity Unit Cost Total Cost Quantity Unit Cost Total Cost- B(1) Computer Hardware 0 563.8 563.8 0 1,552.0 1,552.0 0 2,644.0 2,644.0
TOTAL 0 563.8 563.8 0 1,552.0 1,552.0 0 2,644.0 2,644.0
Narrative Justification:
Description
Mission Benefits
Deliverables
Economic Analysis
Impact
Software
The systems provided under the GSDM program are essential in providing port managers with the Command and Control (C2) capabilities to ensure Intransit Visibility (ITV) of sustainment cargo and unit equipment moving forward. Without this capability, units may arrive at the fight without the necessary equipment and no assurance of sustainment once in the theater of operations resulting in mission failure.
Not applicable.
FY2011 FY2012 FY2013
The Global Surface Distribution Management (GSDM) program provides the facility, automated tools, and communications infrastructure to support the Military Surface Deployment and Distribution Command (SDDC) worldwide deployment and distribution mission in an austere environment. The Deployable Port Operations Center (DPOC), Mobile Port Operations Center (MPOC) and Scalable Port Operations Communications Kit (SPOCK) provide fully equipped, self-sustaining command and control port opening capability at surface locations where facilities for cargo documentation and processing, local long haul telecommunications, and computer and office automation support are not available. A key focus of these deployable capabilities is to support reception, staging, onward movement, integration, sustainment, and redeployment of United States forces at military, common user, and contingency seaports worldwide. They are designed to support limited/small scale operations and full scale/sustained operations. They are self-sustaining and independent of any host nation/theater facilities and services.
Supports SDDC worldwide deployment and distribution mission in an austere environment.
Certified 15 Jun 10.
FY11, 12, & 13: Modernize and refresh Rapid Port Opening Elements (RPOE) equipment sets and MPOC/DPOC deployment packages; Product Manager, Defense Wide Transmission Systems provides a contracted operational support resource through established MOA; Tobyhanna Army Depot provides depot level refurbishment of systems platforms (HMMWVs and shelters) as required; US Army Soldiers Systems Center, NATICK, MA provides engineering support (DPOCs/MPOCs); and Hardware upgrades as required.
Fund 9B United States Transportation Command
CAPITAL BUDGET
132
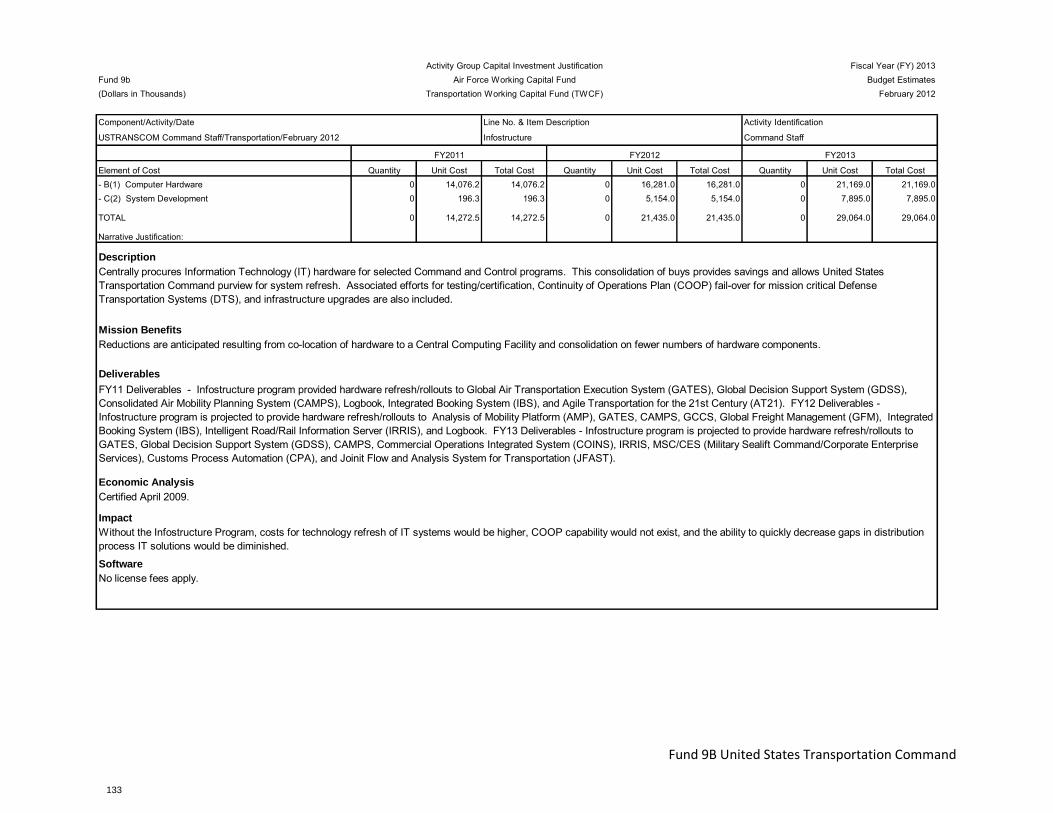
Activity Group Capital Investment Justification Fiscal Year (FY) 2013Fund 9b Air Force Working Capital Fund Budget Estimates(Dollars in Thousands) Transportation Working Capital Fund (TWCF) February 2012
Component/Activity/Date Line No. & Item Description Activity Identification
USTRANSCOM Command Staff/Transportation/February 2012 Infostructure Command Staff
Element of Cost Quantity Unit Cost Total Cost Quantity Unit Cost Total Cost Quantity Unit Cost Total Cost- B(1) Computer Hardware 0 14,076.2 14,076.2 0 16,281.0 16,281.0 0 21,169.0 21,169.0- C(2) System Development 0 196.3 196.3 0 5,154.0 5,154.0 0 7,895.0 7,895.0
TOTAL 0 14,272.5 14,272.5 0 21,435.0 21,435.0 0 29,064.0 29,064.0
Narrative Justification:
Description
Mission Benefits
Deliverables
Economic Analysis
Impact
Software
Without the Infostructure Program, costs for technology refresh of IT systems would be higher, COOP capability would not exist, and the ability to quickly decrease gaps in distribution process IT solutions would be diminished.
No license fees apply.
FY2011 FY2012 FY2013
Centrally procures Information Technology (IT) hardware for selected Command and Control programs. This consolidation of buys provides savings and allows United States Transportation Command purview for system refresh. Associated efforts for testing/certification, Continuity of Operations Plan (COOP) fail-over for mission critical Defense Transportation Systems (DTS), and infrastructure upgrades are also included.
Reductions are anticipated resulting from co-location of hardware to a Central Computing Facility and consolidation on fewer numbers of hardware components.
Certified April 2009.
FY11 Deliverables - Infostructure program provided hardware refresh/rollouts to Global Air Transportation Execution System (GATES), Global Decision Support System (GDSS), Consolidated Air Mobility Planning System (CAMPS), Logbook, Integrated Booking System (IBS), and Agile Transportation for the 21st Century (AT21). FY12 Deliverables - Infostructure program is projected to provide hardware refresh/rollouts to Analysis of Mobility Platform (AMP), GATES, CAMPS, GCCS, Global Freight Management (GFM), Integrated Booking System (IBS), Intelligent Road/Rail Information Server (IRRIS), and Logbook. FY13 Deliverables - Infostructure program is projected to provide hardware refresh/rollouts to GATES, Global Decision Support System (GDSS), CAMPS, Commercial Operations Integrated System (COINS), IRRIS, MSC/CES (Military Sealift Command/Corporate Enterprise Services), Customs Process Automation (CPA), and Joinit Flow and Analysis System for Transportation (JFAST).
Fund 9B United States Transportation Command
CAPITAL BUDGET
133

Q Activity Group Capital Investment Justification Fiscal Year (FY) 2013Fund 9b Air Force Working Capital Fund Budget Estimates(Dollars in Thousands) Transportation Working Capital Fund (TWCF) February 2012
Component/Activity/Date Line No. & Item Description Activity Identification
Military Sealift Command/Transportation/February 2012 Int Command, Control, & Comm (IC3) MSC
Element of Cost Quantity Unit Cost Total Cost Quantity Unit Cost Total Cost Quantity Unit Cost Total Cost- C(2) System Development 0 .0 .0 0 931.0 931.0 0 1,170.0 1,170.0
TOTAL 0 .0 .0 0 931.0 931.0 0 1,170.0 1,170.0
Narrative Justification:
Description
Mission Benefits
Deliverables
Economic Analysis
Impact
Software
If not funded, MSC would not be able to continue tracking sealift assets and ITV would be halted. Migration to integrate systems and business processes also would be impacted.
N/A
FY2011 FY2012 FY2013
Integrated Command, Control and Communications (IC3) is Military Sealift Commands (MSCs) migration program to integrate systems and business process from delibrate planning through execution in a common operating environment. MSC-IC3 is an extention of the Global Command and Control System (GCCS) intrastructure allowing MSC to reduce redundancy in hardware, software, and communications while maintaining compatibility with Department of Defense (DOD), Department of the Navy (DON), and transformation migration initatives. MSC-IC3 interfaces with: United States Transportation Commands (USTRANSCOMs), Global Transformation Network (GTN) to provide ship schedules, Joint Mobility Command Group (JMCG) to provide information for decision making, and Joint Flow and Analysis System for Transformation (JFAST) for execution and deliberate planning. MSC-IC3 interfaces with joint systems such as the Joint Planning and Execution System (JOPES) operating in GCCS for operations/exercise/contingency requirements and the Surface Deployment and Distribution Commands (SDDC) World wide Port System (WPS). IC3 also provides support for standardized communications and client server infrastructure for data warehouse requirements, standardization, and readiness.
IC3 supports the readiness and operations of MSC and is MSCs single integration system in support of Command, Control, Communications, Computers, Intelligence, Surveillance and Reconnaissance (C4SIR) for MSC Defense Transportation System (DTS) responsibilities. IC3 tracks all MSC assets for In-Transit Visibility (ITV) and feeds data to GTN in support of Total Asset Visibility (TAV).
Sustainment Review certified May 2009.
Automated name search, create prototypes for Movement Reports (MOVEREP) and OILSPILL Parsers, Common Operational Enhancements (COP), creation of domain entity for operational program, integration with JOPES, and automatic area command updates.
Fund 9B United States Transportation Command
CAPITAL BUDGET
134

Activity Group Capital Investment Justification Fiscal Year (FY) 2013Fund 9b Air Force Working Capital Fund Budget Estimates(Dollars in Thousands) Transportation Working Capital Fund (TWCF) February 2012
Component/Activity/Date Line No. & Item Description Activity Identification
USTRANSCOM Command Staff/Transportation/February 2012 Int Data Environ/Global Trans Net Converg (IGC) Command Staff
Element of Cost Quantity Unit Cost Total Cost Quantity Unit Cost Total Cost Quantity Unit Cost Total Cost- B(1) Computer Hardware 0 6,130.0 6,130.0 0 .0 .0 0 .0 .0- C(2) System Development 0 6,295.0 6,295.0 0 1,354.0 1,354.0 0 .0 .0
TOTAL 0 12,425.0 12,425.0 0 1,354.0 1,354.0 0 .0 .0
Narrative Justification:
Description
Mission Benefits
Deliverables
Economic Analysis
Impact
Software
Degradation to program will result in severe shortcomings in the Defense Transportation System. Jeopardizes "wholesale through retail/factory to foxhole" In-Transit Visibility (ITV) required to provide DoD visibility of materiel across the spectrum of warfare.
FY2011 FY2012 FY2013
Defense Logistics Agency (DLA) and the United States Transportation Command (USTRANSCOM) are partnering to provide supply chain, distribution, and logistics information fusion through common integrated data and application services enabling development of cohesive business decision solutions both by and for the supported Combatant Commands (COCOMs), Components, Services, Joint Staff, Agencies, and other Federal organizations. The Integrated Data Environment/Global Transportation Network Convergence (IGC) program will create an environment where logistics and distribution data and information from both DLA and USTRANSCOM are accessible from a single place, leveraging work already being done by DLAs Integrated Data Environment (IDE- Initiative #6516) and USTRANSCOMs Global Transportation Network (GTN - Initiative #0886) programs. USTRANSCOM had pursued an earlier effort called Global Transportation Network for the 21st Century (GTN21 - Initiative #6487) which was planned to replace the legacy GTN system. IGC allows the newer Enterprise Data Warehousing capabilities of GTN and the capability deliveries from the IDE to be managed by a single Program Manager; retiring the legacy GTN components in 2011, providing a state-of-the-art capability to perform reporting, ad hoc queries, and multi-dimensional analyses, as well as, ensuring consistent access to common, authoritative logistics data, business rules, and reliable information. IGC enhances capability to interoperate, unifies Information Technology (IT) development across the Domain, synchronizes investment into objective systems, and eliminates legacy/redundant data stores and interfaces.
Mission relates directly to the USTRANSCOM Strategic Goals and Supporting Objectives which include Goal 4.0, "Implement the Defense Transportation System Enterprise Architecture to provide USTRANSCOM and its customers global access to decision quality transportation information" and Goal 4.6, "Provide interoperable, collaborative, and cost effective Command, Control, Communication, and Computer (C4) Systems functional applications that rapidly process data and produce decision quality information which satisfies USTRANSCOM operational and customer requirements."
Economic Analysis completed in May 2007. Economic Analysis Update completed Aug 2008, Sep 2009, and Sep 2010. Next update due in Nov 2011.
FY11 - GTN system sunset. Exercise replacement system for the GTN exercise system (GES). Low-side Continuity of Operations Planning (COOP) and Full Deployment (FD). FY12-Technical refresh on all environments, including Teradata Hardware (H/W) replacement.
Fund 9B United States Transportation Command
CAPITAL BUDGET
135
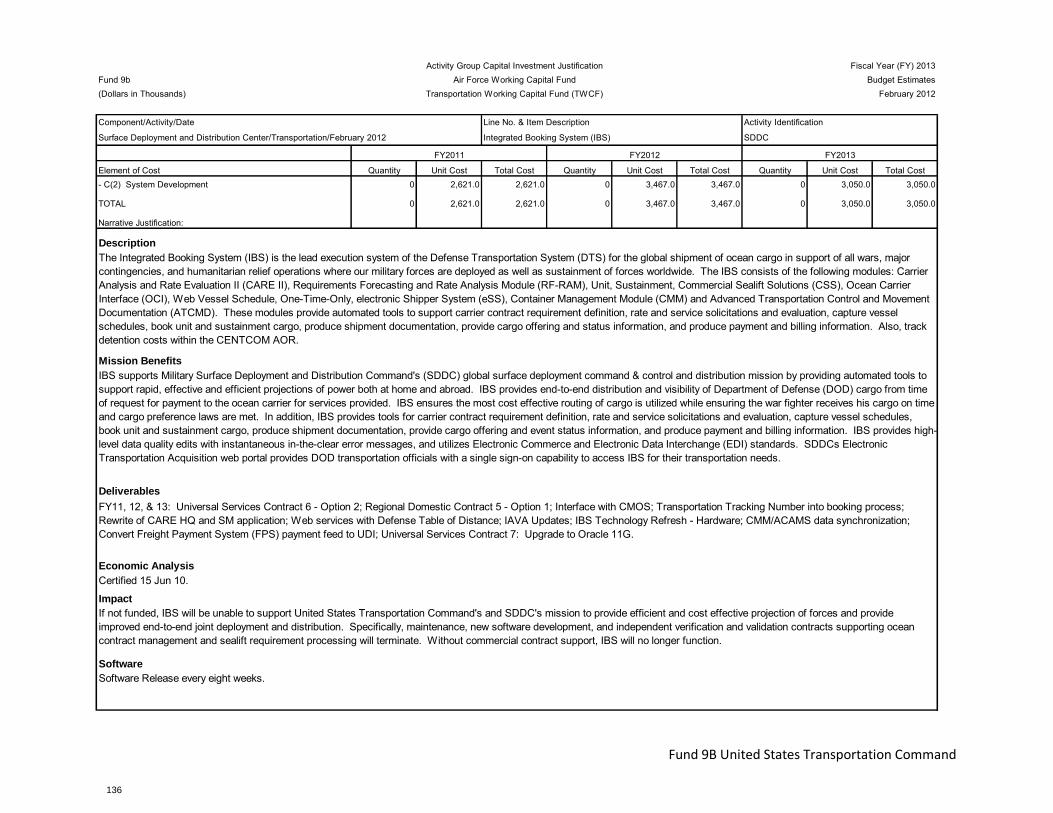
Q Activity Group Capital Investment Justification Fiscal Year (FY) 2013Fund 9b Air Force Working Capital Fund Budget Estimates(Dollars in Thousands) Transportation Working Capital Fund (TWCF) February 2012
Component/Activity/Date Line No. & Item Description Activity Identification
Surface Deployment and Distribution Center/Transportation/February 2012 Integrated Booking System (IBS) SDDC
Element of Cost Quantity Unit Cost Total Cost Quantity Unit Cost Total Cost Quantity Unit Cost Total Cost- C(2) System Development 0 2,621.0 2,621.0 0 3,467.0 3,467.0 0 3,050.0 3,050.0
TOTAL 0 2,621.0 2,621.0 0 3,467.0 3,467.0 0 3,050.0 3,050.0
Narrative Justification:
Description
Mission Benefits
Deliverables
Economic Analysis
Impact
Software
If not funded, IBS will be unable to support United States Transportation Command's and SDDC's mission to provide efficient and cost effective projection of forces and provide improved end-to-end joint deployment and distribution. Specifically, maintenance, new software development, and independent verification and validation contracts supporting ocean contract management and sealift requirement processing will terminate. Without commercial contract support, IBS will no longer function.
Software Release every eight weeks.
FY2011 FY2012 FY2013
The Integrated Booking System (IBS) is the lead execution system of the Defense Transportation System (DTS) for the global shipment of ocean cargo in support of all wars, major contingencies, and humanitarian relief operations where our military forces are deployed as well as sustainment of forces worldwide. The IBS consists of the following modules: Carrier Analysis and Rate Evaluation II (CARE II), Requirements Forecasting and Rate Analysis Module (RF-RAM), Unit, Sustainment, Commercial Sealift Solutions (CSS), Ocean Carrier Interface (OCI), Web Vessel Schedule, One-Time-Only, electronic Shipper System (eSS), Container Management Module (CMM) and Advanced Transportation Control and Movement Documentation (ATCMD). These modules provide automated tools to support carrier contract requirement definition, rate and service solicitations and evaluation, capture vessel schedules, book unit and sustainment cargo, produce shipment documentation, provide cargo offering and status information, and produce payment and billing information. Also, track detention costs within the CENTCOM AOR.
IBS supports Military Surface Deployment and Distribution Command's (SDDC) global surface deployment command & control and distribution mission by providing automated tools to support rapid, effective and efficient projections of power both at home and abroad. IBS provides end-to-end distribution and visibility of Department of Defense (DOD) cargo from time of request for payment to the ocean carrier for services provided. IBS ensures the most cost effective routing of cargo is utilized while ensuring the war fighter receives his cargo on time and cargo preference laws are met. In addition, IBS provides tools for carrier contract requirement definition, rate and service solicitations and evaluation, capture vessel schedules, book unit and sustainment cargo, produce shipment documentation, provide cargo offering and event status information, and produce payment and billing information. IBS provides high-level data quality edits with instantaneous in-the-clear error messages, and utilizes Electronic Commerce and Electronic Data Interchange (EDI) standards. SDDCs Electronic Transportation Acquisition web portal provides DOD transportation officials with a single sign-on capability to access IBS for their transportation needs.
Certified 15 Jun 10.
FY11, 12, & 13: Universal Services Contract 6 - Option 2; Regional Domestic Contract 5 - Option 1; Interface with CMOS; Transportation Tracking Number into booking process; Rewrite of CARE HQ and SM application; Web services with Defense Table of Distance; IAVA Updates; IBS Technology Refresh - Hardware; CMM/ACAMS data synchronization; Convert Freight Payment System (FPS) payment feed to UDI; Universal Services Contract 7: Upgrade to Oracle 11G.
Fund 9B United States Transportation Command
CAPITAL BUDGET
136

Q Activity Group Capital Investment Justification Fiscal Year (FY) 2013Fund 9b Air Force Working Capital Fund Budget Estimates(Dollars in Thousands) Transportation Working Capital Fund (TWCF) February 2012
Component/Activity/Date Line No. & Item Description Activity Identification
Surface Deployment and Distribution Center/Transportation/February 2012 Intelligent Road/Rail Information Server (IRRIS) SDDC
Element of Cost Quantity Unit Cost Total Cost Quantity Unit Cost Total Cost Quantity Unit Cost Total Cost- B(1) Computer Hardware 0 .0 .0 0 289.0 289.0 0 293.0 293.0- C(2) System Development 0 3,075.5 3,075.5 0 1,448.0 1,448.0 0 1,472.0 1,472.0
TOTAL 0 3,075.5 3,075.5 0 1,737.0 1,737.0 0 1,765.0 1,765.0
Narrative Justification:
Description
Mission Benefits
Deliverables
Economic Analysis
Impact
Software
If not funded, the capability to support current worldwide deployments and natural disasters with the tracking of surface shipments will be significantly degraded. Additionally, Surface Deployment and Distribution Command (SDDC) will be unable to realize improvements in efficiencies and elimination of voids to the Department of Defense (DOD) emergency response process in accordance with DOD Distribution and Strategic Plan.
Not Applicable.
FY2011 FY2012 FY2013
The Intelligent Road/Rail Information Server (IRRIS) is a Geospatial Information System (GIS) mapping and situational awareness system which provides a single point of interface for spatial ocean/surface movement control and detailed transportation infrastructure information.
IRRIS provides a single point of interface for worldwide spatial surface movement control, along with the detailed infrastructure information visually displayed supporting rapid deployment. IRRIS mapping engine is an industry standard GIS tool set that supports all Defense and Intelligence content description, cartographic, and data format standards and provides spatial analysis, data analysis and capability interoperability with other DoD systems. IRRIS will become the front spatial presentation piece of the USTRANSCOM enterprise, creating an environment to allow key government staff the real time and static information necessary for planning and executing to fulfill their mission.
Certified 15 Jun 10.
FY11, 12, & 13: Operationalize the Nodal Management and Enhanced GIS initiatives. Develop the capabilities to provide increased in-transit visibility of Arms, Ammunition, and Explosives (AA&E) shipments. Provide a GIS based dedicated road network for assigning sensitive shipments to specific routes. Enhance the control of surface shipments and re-routing of shipments in-transit. Provide tools for actively managing surface shipments and the carriers moving these shipments. Develop the ability to map and query current track of a railcar/barge or map and query all current shipment positions and track shipments regardless of conveyance and change of conveyance in-route with Geospatial mapping. Provides enhanced Intransit Visibility (ITV) and Total Asset Visibility (TAV) throughout the pipeline. Map supplies worldwide; and visualization of Infrastructure Data Software Upgrade.
Fund 9B United States Transportation Command
CAPITAL BUDGET
137
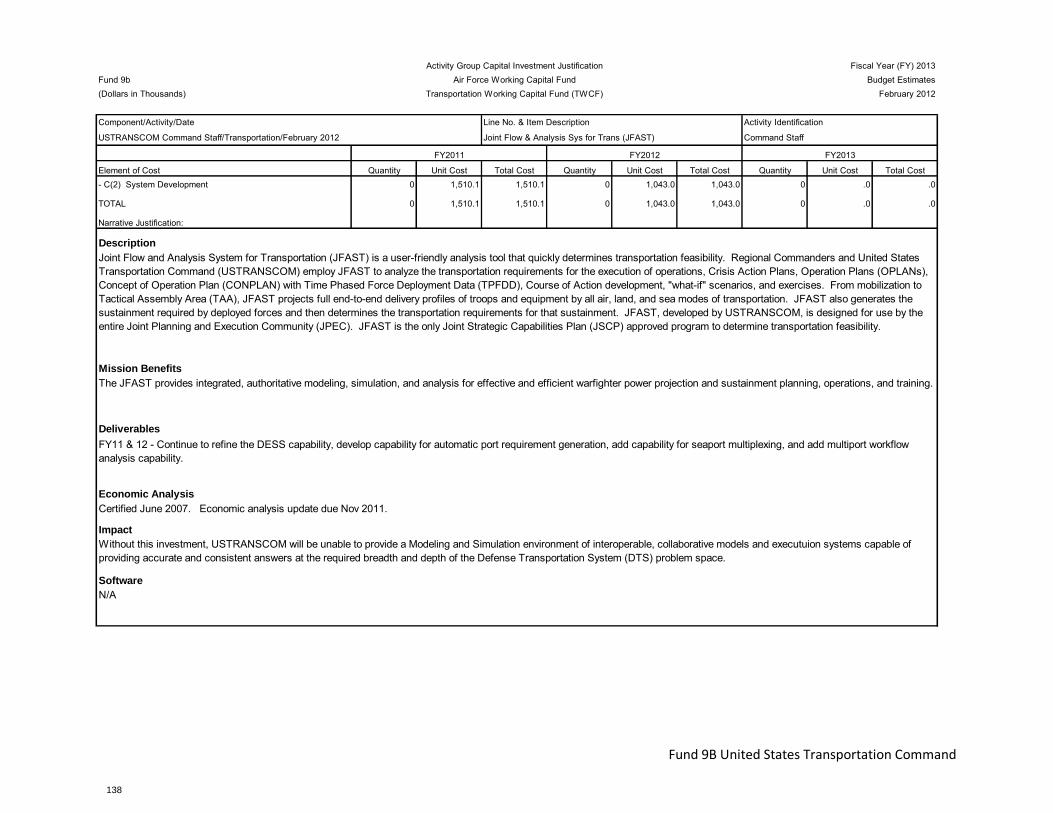
Activity Group Capital Investment Justification Fiscal Year (FY) 2013Fund 9b Air Force Working Capital Fund Budget Estimates(Dollars in Thousands) Transportation Working Capital Fund (TWCF) February 2012
Component/Activity/Date Line No. & Item Description Activity Identification
USTRANSCOM Command Staff/Transportation/February 2012 Joint Flow & Analysis Sys for Trans (JFAST) Command Staff
Element of Cost Quantity Unit Cost Total Cost Quantity Unit Cost Total Cost Quantity Unit Cost Total Cost- C(2) System Development 0 1,510.1 1,510.1 0 1,043.0 1,043.0 0 .0 .0
TOTAL 0 1,510.1 1,510.1 0 1,043.0 1,043.0 0 .0 .0
Narrative Justification:
Description
Mission Benefits
Deliverables
Economic Analysis
Impact
Software
Without this investment, USTRANSCOM will be unable to provide a Modeling and Simulation environment of interoperable, collaborative models and executuion systems capable of providing accurate and consistent answers at the required breadth and depth of the Defense Transportation System (DTS) problem space.
N/A
FY2011 FY2012 FY2013
Joint Flow and Analysis System for Transportation (JFAST) is a user-friendly analysis tool that quickly determines transportation feasibility. Regional Commanders and United States Transportation Command (USTRANSCOM) employ JFAST to analyze the transportation requirements for the execution of operations, Crisis Action Plans, Operation Plans (OPLANs), Concept of Operation Plan (CONPLAN) with Time Phased Force Deployment Data (TPFDD), Course of Action development, "what-if" scenarios, and exercises. From mobilization to Tactical Assembly Area (TAA), JFAST projects full end-to-end delivery profiles of troops and equipment by all air, land, and sea modes of transportation. JFAST also generates the sustainment required by deployed forces and then determines the transportation requirements for that sustainment. JFAST, developed by USTRANSCOM, is designed for use by the entire Joint Planning and Execution Community (JPEC). JFAST is the only Joint Strategic Capabilities Plan (JSCP) approved program to determine transportation feasibility.
The JFAST provides integrated, authoritative modeling, simulation, and analysis for effective and efficient warfighter power projection and sustainment planning, operations, and training.
Certified June 2007. Economic analysis update due Nov 2011.
FY11 & 12 - Continue to refine the DESS capability, develop capability for automatic port requirement generation, add capability for seaport multiplexing, and add multiport workflow analysis capability.
Fund 9B United States Transportation Command
CAPITAL BUDGET
138
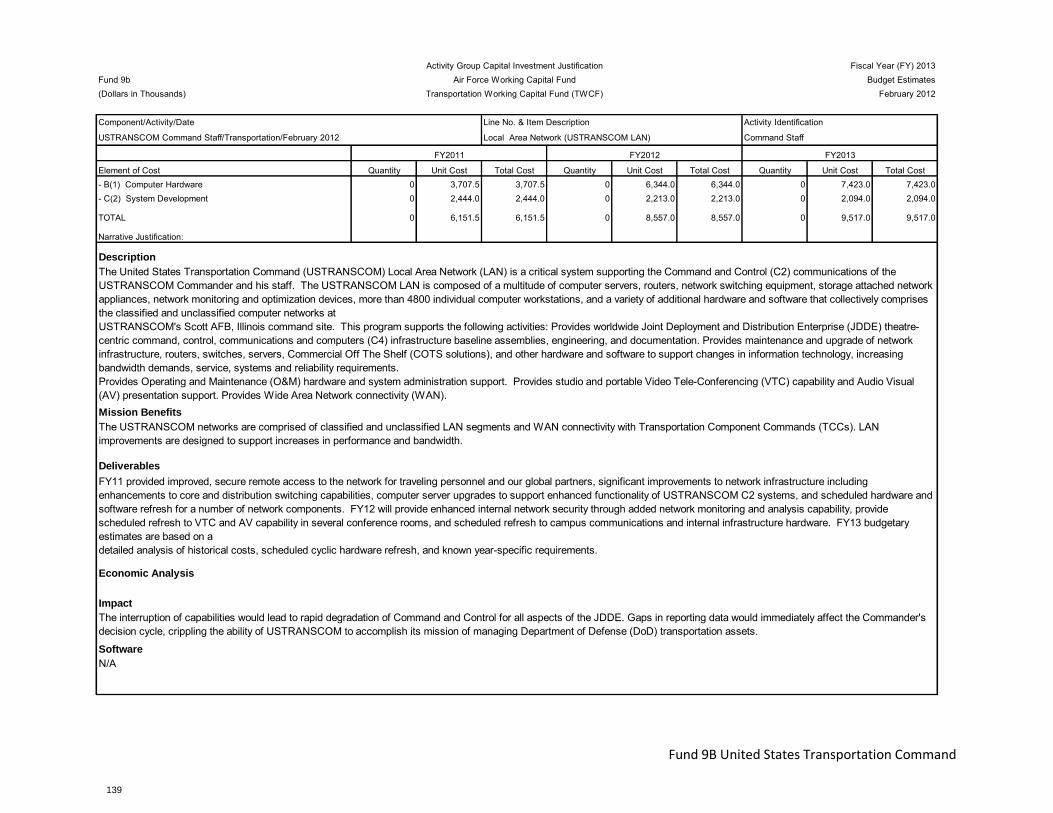
Activity Group Capital Investment Justification Fiscal Year (FY) 2013Fund 9b Air Force Working Capital Fund Budget Estimates(Dollars in Thousands) Transportation Working Capital Fund (TWCF) February 2012
Component/Activity/Date Line No. & Item Description Activity Identification
USTRANSCOM Command Staff/Transportation/February 2012 Local Area Network (USTRANSCOM LAN) Command Staff
Element of Cost Quantity Unit Cost Total Cost Quantity Unit Cost Total Cost Quantity Unit Cost Total Cost- B(1) Computer Hardware 0 3,707.5 3,707.5 0 6,344.0 6,344.0 0 7,423.0 7,423.0- C(2) System Development 0 2,444.0 2,444.0 0 2,213.0 2,213.0 0 2,094.0 2,094.0
TOTAL 0 6,151.5 6,151.5 0 8,557.0 8,557.0 0 9,517.0 9,517.0
Narrative Justification:
Description
Mission Benefits
Deliverables
Economic Analysis
Impact
Software
The interruption of capabilities would lead to rapid degradation of Command and Control for all aspects of the JDDE. Gaps in reporting data would immediately affect the Commander's decision cycle, crippling the ability of USTRANSCOM to accomplish its mission of managing Department of Defense (DoD) transportation assets.
N/A
FY2011 FY2012 FY2013
The United States Transportation Command (USTRANSCOM) Local Area Network (LAN) is a critical system supporting the Command and Control (C2) communications of the USTRANSCOM Commander and his staff. The USTRANSCOM LAN is composed of a multitude of computer servers, routers, network switching equipment, storage attached network appliances, network monitoring and optimization devices, more than 4800 individual computer workstations, and a variety of additional hardware and software that collectively comprises the classified and unclassified computer networks at USTRANSCOM's Scott AFB, Illinois command site. This program supports the following activities: Provides worldwide Joint Deployment and Distribution Enterprise (JDDE) theatre-centric command, control, communications and computers (C4) infrastructure baseline assemblies, engineering, and documentation. Provides maintenance and upgrade of network infrastructure, routers, switches, servers, Commercial Off The Shelf (COTS solutions), and other hardware and software to support changes in information technology, increasing bandwidth demands, service, systems and reliability requirements. Provides Operating and Maintenance (O&M) hardware and system administration support. Provides studio and portable Video Tele-Conferencing (VTC) capability and Audio Visual (AV) presentation support. Provides Wide Area Network connectivity (WAN).
The USTRANSCOM networks are comprised of classified and unclassified LAN segments and WAN connectivity with Transportation Component Commands (TCCs). LAN improvements are designed to support increases in performance and bandwidth.
FY11 provided improved, secure remote access to the network for traveling personnel and our global partners, significant improvements to network infrastructure including enhancements to core and distribution switching capabilities, computer server upgrades to support enhanced functionality of USTRANSCOM C2 systems, and scheduled hardware and software refresh for a number of network components. FY12 will provide enhanced internal network security through added network monitoring and analysis capability, provide scheduled refresh to VTC and AV capability in several conference rooms, and scheduled refresh to campus communications and internal infrastructure hardware. FY13 budgetary estimates are based on a detailed analysis of historical costs, scheduled cyclic hardware refresh, and known year-specific requirements.
Fund 9B United States Transportation Command
CAPITAL BUDGET
139

Activity Group Capital Investment Justification Fiscal Year (FY) 2013Fund 9b Air Force Working Capital Fund Budget Estimates(Dollars in Thousands) Transportation Working Capital Fund (TWCF) February 2012
Component/Activity/Date Line No. & Item Description Activity Identification
USTRANSCOM Command Staff/Transportation/February 2012 Logbook Command Staff
Element of Cost Quantity Unit Cost Total Cost Quantity Unit Cost Total Cost Quantity Unit Cost Total Cost- C(2) System Development 0 .0 .0 0 605.0 605.0 0 .0 .0
TOTAL 0 .0 .0 0 605.0 605.0 0 .0 .0
Narrative Justification:
Description
Mission Benefits
Deliverables
Economic Analysis
Impact
Software
Without this tool, USTRANSCOMs operations hub would resort to several stubby pencil tools previously used. Without this collaborative tool, operators would spend several hours creating, coordinating and working tasks that now take just minutes; additionally, other tools that perform similar functions do not provide the speedy archival search/retrieval capability that Logbook gives its users.
Logbook is FOC and is in Sustainment.
FY2011 FY2012 FY2013
Logbook supports peacetime and wartime Deployment Distribution Operations Center (DDOC) and United States Transportation Command (USTRANSCOM) operations with a command and control information sharing tool that provides concurrent commentary and iterative working of linked tasks. This real-time cataloging and sharing of data/information provides a complete record of all taskings and reports generated within the tool. Logbook provides the means for sharing movement requirement actions with the Transportation Component Commands (TCCs) and for disseminating message traffic within the DDOC.
Logbook is the primary record-copy Command and Control (C2) system within the DDOC and between the DDOC and TCCs. This includes contingency/exercise report generation and publication as well as automated information flow between DDOC shifts/positions and TCCs. Logbook replaces the green record books used for station logs with automated logs capable of archiving, speedy queries, and phone calls/emails with record-copy taskings and suspenses both within USTRANSCOM and to the TCCs.
Economic Analysis certified January 2008.
FY11 development will include improved analytical spreadsheet and math function capabilities. FY12 Logbook investigating transition to AT21/i-Distribute and funds will be used tor a technical refresh to develop this capability.
Fund 9B United States Transportation Command
CAPITAL BUDGET
140
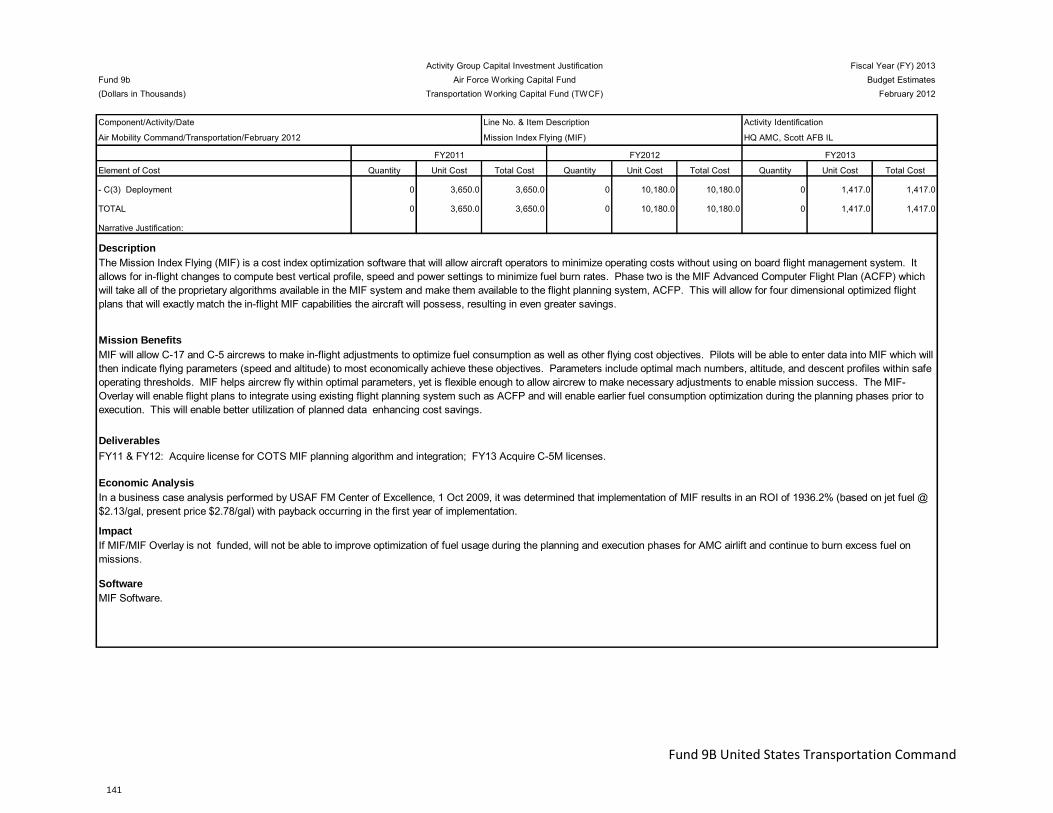
Q Activity Group Capital Investment Justification Fiscal Year (FY) 2013Fund 9b Air Force Working Capital Fund Budget Estimates(Dollars in Thousands) Transportation Working Capital Fund (TWCF) February 2012
Component/Activity/Date Line No. & Item Description Activity Identification
Air Mobility Command/Transportation/February 2012 Mission Index Flying (MIF) HQ AMC, Scott AFB IL
Element of Cost Quantity Unit Cost Total Cost Quantity Unit Cost Total Cost Quantity Unit Cost Total Cost
- C(3) Deployment 0 3,650.0 3,650.0 0 10,180.0 10,180.0 0 1,417.0 1,417.0
TOTAL 0 3,650.0 3,650.0 0 10,180.0 10,180.0 0 1,417.0 1,417.0
Narrative Justification:
Description
Mission Benefits
Deliverables
Economic Analysis
Impact
Software
If MIF/MIF Overlay is not funded, will not be able to improve optimization of fuel usage during the planning and execution phases for AMC airlift and continue to burn excess fuel on missions.
MIF Software.
FY2011 FY2012 FY2013
The Mission Index Flying (MIF) is a cost index optimization software that will allow aircraft operators to minimize operating costs without using on board flight management system. It allows for in-flight changes to compute best vertical profile, speed and power settings to minimize fuel burn rates. Phase two is the MIF Advanced Computer Flight Plan (ACFP) which will take all of the proprietary algorithms available in the MIF system and make them available to the flight planning system, ACFP. This will allow for four dimensional optimized flight plans that will exactly match the in-flight MIF capabilities the aircraft will possess, resulting in even greater savings.
MIF will allow C-17 and C-5 aircrews to make in-flight adjustments to optimize fuel consumption as well as other flying cost objectives. Pilots will be able to enter data into MIF which will then indicate flying parameters (speed and altitude) to most economically achieve these objectives. Parameters include optimal mach numbers, altitude, and descent profiles within safe operating thresholds. MIF helps aircrew fly within optimal parameters, yet is flexible enough to allow aircrew to make necessary adjustments to enable mission success. The MIF-Overlay will enable flight plans to integrate using existing flight planning system such as ACFP and will enable earlier fuel consumption optimization during the planning phases prior to execution. This will enable better utilization of planned data enhancing cost savings.
In a business case analysis performed by USAF FM Center of Excellence, 1 Oct 2009, it was determined that implementation of MIF results in an ROI of 1936.2% (based on jet fuel @ $2.13/gal, present price $2.78/gal) with payback occurring in the first year of implementation.
FY11 & FY12: Acquire license for COTS MIF planning algorithm and integration; FY13 Acquire C-5M licenses.
Fund 9B United States Transportation Command
CAPITAL BUDGET
141
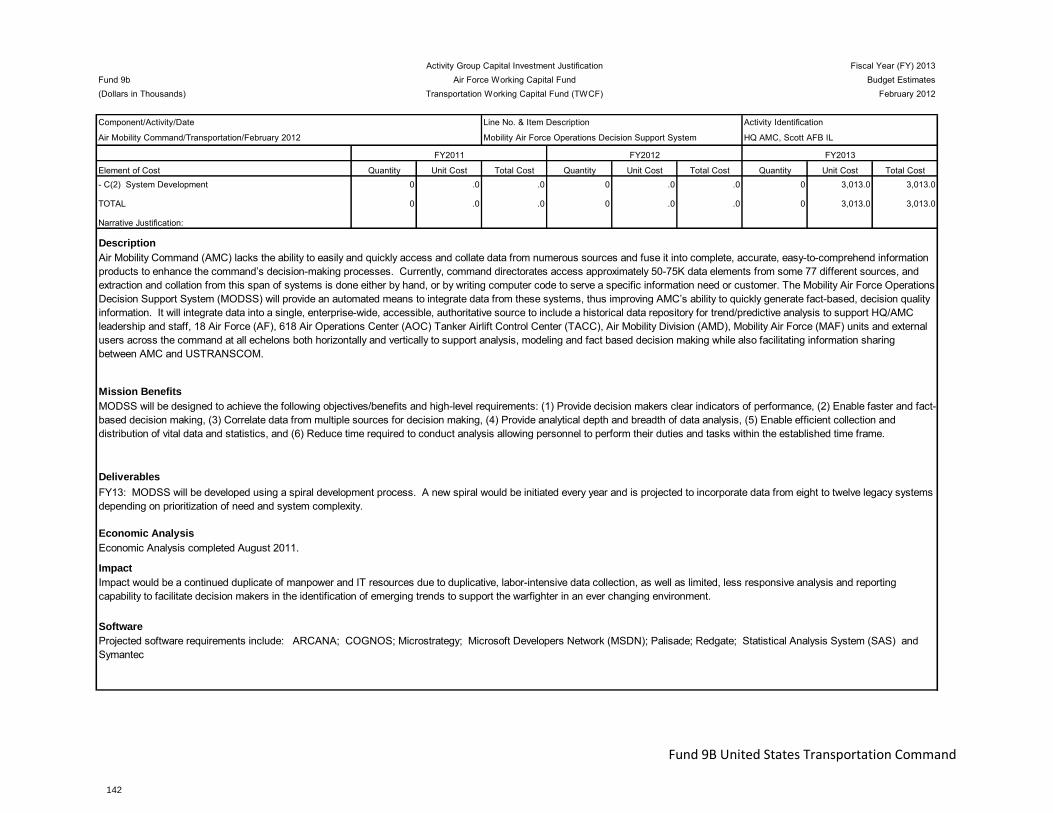
Q Activity Group Capital Investment Justification Fiscal Year (FY) 2013Fund 9b Air Force Working Capital Fund Budget Estimates(Dollars in Thousands) Transportation Working Capital Fund (TWCF) February 2012
Component/Activity/Date Line No. & Item Description Activity Identification
Air Mobility Command/Transportation/February 2012 Mobility Air Force Operations Decision Support System HQ AMC, Scott AFB IL
Element of Cost Quantity Unit Cost Total Cost Quantity Unit Cost Total Cost Quantity Unit Cost Total Cost- C(2) System Development 0 .0 .0 0 .0 .0 0 3,013.0 3,013.0
TOTAL 0 .0 .0 0 .0 .0 0 3,013.0 3,013.0
Narrative Justification:
Description
Mission Benefits
Deliverables
Economic Analysis
Impact
Software
Impact would be a continued duplicate of manpower and IT resources due to duplicative, labor-intensive data collection, as well as limited, less responsive analysis and reporting capability to facilitate decision makers in the identification of emerging trends to support the warfighter in an ever changing environment.
Projected software requirements include: ARCANA; COGNOS; Microstrategy; Microsoft Developers Network (MSDN); Palisade; Redgate; Statistical Analysis System (SAS) and Symantec
FY2011 FY2012 FY2013
Air Mobility Command (AMC) lacks the ability to easily and quickly access and collate data from numerous sources and fuse it into complete, accurate, easy-to-comprehend information products to enhance the command’s decision-making processes. Currently, command directorates access approximately 50-75K data elements from some 77 different sources, and extraction and collation from this span of systems is done either by hand, or by writing computer code to serve a specific information need or customer. The Mobility Air Force Operations Decision Support System (MODSS) will provide an automated means to integrate data from these systems, thus improving AMC’s ability to quickly generate fact-based, decision quality information. It will integrate data into a single, enterprise-wide, accessible, authoritative source to include a historical data repository for trend/predictive analysis to support HQ/AMC leadership and staff, 18 Air Force (AF), 618 Air Operations Center (AOC) Tanker Airlift Control Center (TACC), Air Mobility Division (AMD), Mobility Air Force (MAF) units and external users across the command at all echelons both horizontally and vertically to support analysis, modeling and fact based decision making while also facilitating information sharing between AMC and USTRANSCOM.
MODSS will be designed to achieve the following objectives/benefits and high-level requirements: (1) Provide decision makers clear indicators of performance, (2) Enable faster and fact-based decision making, (3) Correlate data from multiple sources for decision making, (4) Provide analytical depth and breadth of data analysis, (5) Enable efficient collection and distribution of vital data and statistics, and (6) Reduce time required to conduct analysis allowing personnel to perform their duties and tasks within the established time frame.
Economic Analysis completed August 2011.
FY13: MODSS will be developed using a spiral development process. A new spiral would be initiated every year and is projected to incorporate data from eight to twelve legacy systems depending on prioritization of need and system complexity.
Fund 9B United States Transportation Command
CAPITAL BUDGET
142
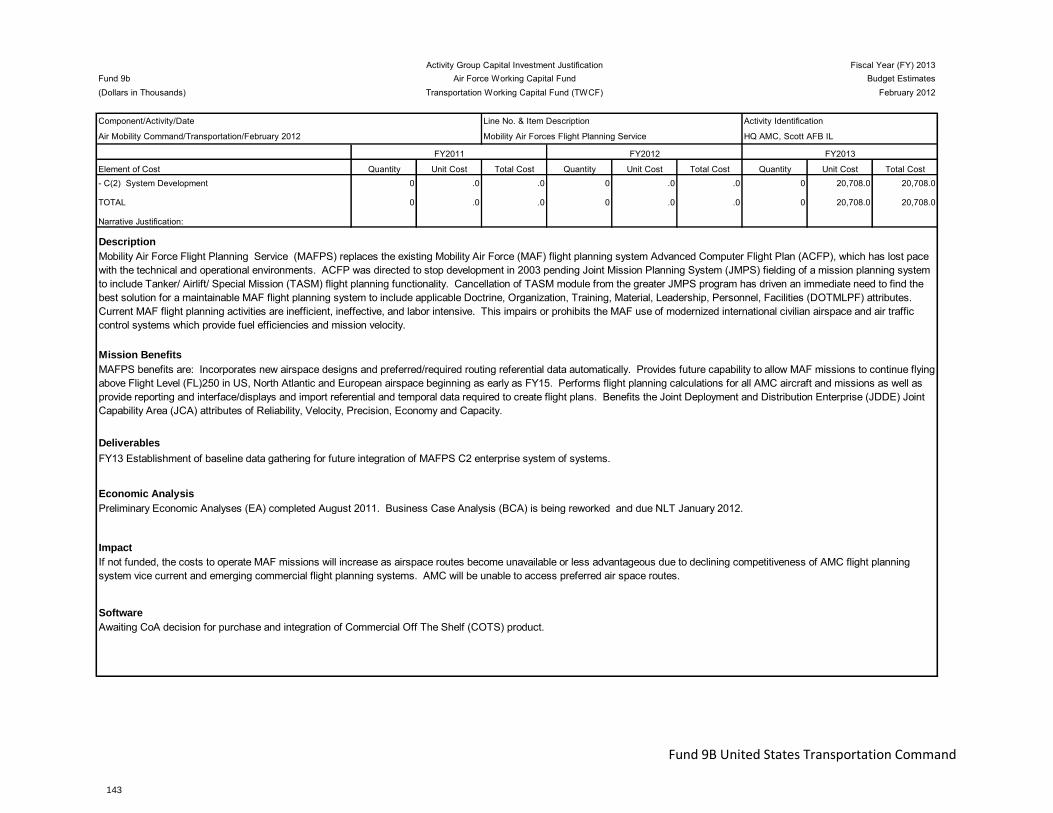
Q Activity Group Capital Investment Justification Fiscal Year (FY) 2013Fund 9b Air Force Working Capital Fund Budget Estimates(Dollars in Thousands) Transportation Working Capital Fund (TWCF) February 2012
Component/Activity/Date Line No. & Item Description Activity Identification
Air Mobility Command/Transportation/February 2012 Mobility Air Forces Flight Planning Service HQ AMC, Scott AFB IL
Element of Cost Quantity Unit Cost Total Cost Quantity Unit Cost Total Cost Quantity Unit Cost Total Cost- C(2) System Development 0 .0 .0 0 .0 .0 0 20,708.0 20,708.0
TOTAL 0 .0 .0 0 .0 .0 0 20,708.0 20,708.0
Narrative Justification:
Description
Mission Benefits
Deliverables
Economic Analysis
Impact
Software
If not funded, the costs to operate MAF missions will increase as airspace routes become unavailable or less advantageous due to declining competitiveness of AMC flight planning system vice current and emerging commercial flight planning systems. AMC will be unable to access preferred air space routes.
Awaiting CoA decision for purchase and integration of Commercial Off The Shelf (COTS) product.
FY2011 FY2012 FY2013
Mobility Air Force Flight Planning Service (MAFPS) replaces the existing Mobility Air Force (MAF) flight planning system Advanced Computer Flight Plan (ACFP), which has lost pace with the technical and operational environments. ACFP was directed to stop development in 2003 pending Joint Mission Planning System (JMPS) fielding of a mission planning system to include Tanker/ Airlift/ Special Mission (TASM) flight planning functionality. Cancellation of TASM module from the greater JMPS program has driven an immediate need to find the best solution for a maintainable MAF flight planning system to include applicable Doctrine, Organization, Training, Material, Leadership, Personnel, Facilities (DOTMLPF) attributes. Current MAF flight planning activities are inefficient, ineffective, and labor intensive. This impairs or prohibits the MAF use of modernized international civilian airspace and air traffic control systems which provide fuel efficiencies and mission velocity.
MAFPS benefits are: Incorporates new airspace designs and preferred/required routing referential data automatically. Provides future capability to allow MAF missions to continue flying above Flight Level (FL)250 in US, North Atlantic and European airspace beginning as early as FY15. Performs flight planning calculations for all AMC aircraft and missions as well as provide reporting and interface/displays and import referential and temporal data required to create flight plans. Benefits the Joint Deployment and Distribution Enterprise (JDDE) Joint Capability Area (JCA) attributes of Reliability, Velocity, Precision, Economy and Capacity.
Preliminary Economic Analyses (EA) completed August 2011. Business Case Analysis (BCA) is being reworked and due NLT January 2012.
FY13 Establishment of baseline data gathering for future integration of MAFPS C2 enterprise system of systems.
Fund 9B United States Transportation Command
CAPITAL BUDGET
143
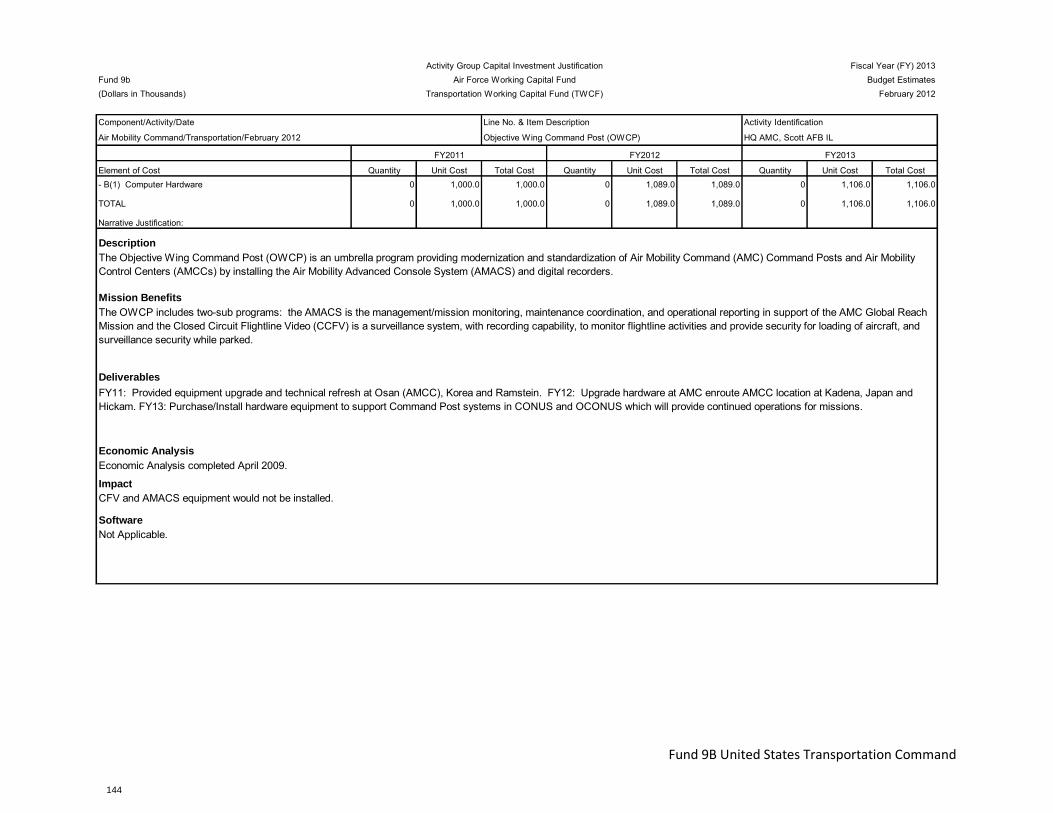
Q Activity Group Capital Investment Justification Fiscal Year (FY) 2013Fund 9b Air Force Working Capital Fund Budget Estimates(Dollars in Thousands) Transportation Working Capital Fund (TWCF) February 2012
Component/Activity/Date Line No. & Item Description Activity Identification
Air Mobility Command/Transportation/February 2012 Objective Wing Command Post (OWCP) HQ AMC, Scott AFB IL
Element of Cost Quantity Unit Cost Total Cost Quantity Unit Cost Total Cost Quantity Unit Cost Total Cost- B(1) Computer Hardware 0 1,000.0 1,000.0 0 1,089.0 1,089.0 0 1,106.0 1,106.0
TOTAL 0 1,000.0 1,000.0 0 1,089.0 1,089.0 0 1,106.0 1,106.0
Narrative Justification:
Description
Mission Benefits
Deliverables
Economic Analysis
Impact
Software
CFV and AMACS equipment would not be installed.
Not Applicable.
FY2011 FY2012 FY2013
The Objective Wing Command Post (OWCP) is an umbrella program providing modernization and standardization of Air Mobility Command (AMC) Command Posts and Air Mobility Control Centers (AMCCs) by installing the Air Mobility Advanced Console System (AMACS) and digital recorders.
The OWCP includes two-sub programs: the AMACS is the management/mission monitoring, maintenance coordination, and operational reporting in support of the AMC Global Reach Mission and the Closed Circuit Flightline Video (CCFV) is a surveillance system, with recording capability, to monitor flightline activities and provide security for loading of aircraft, and surveillance security while parked.
Economic Analysis completed April 2009.
FY11: Provided equipment upgrade and technical refresh at Osan (AMCC), Korea and Ramstein. FY12: Upgrade hardware at AMC enroute AMCC location at Kadena, Japan and Hickam. FY13: Purchase/Install hardware equipment to support Command Post systems in CONUS and OCONUS which will provide continued operations for missions.
Fund 9B United States Transportation Command
CAPITAL BUDGET
144

Activity Group Capital Investment Justification Fiscal Year (FY) 2013Fund 9b Air Force Working Capital Fund Budget Estimates(Dollars in Thousands) Transportation Working Capital Fund (TWCF) February 2012
Component/Activity/Date Line No. & Item Description Activity Identification
USTRANSCOM Command Staff/Transportation/February 2012 Single Mobility System (SMS) Command Staff
Element of Cost Quantity Unit Cost Total Cost Quantity Unit Cost Total Cost Quantity Unit Cost Total Cost- C(2) System Development 0 .0 .0 0 1,328.0 1,328.0 0 .0 .0
TOTAL 0 .0 .0 0 1,328.0 1,328.0 0 .0 .0
Narrative Justification:
Description
Mission Benefits
Deliverables
Economic Analysis
Impact
Software
Customers would be forced to query data from numerous transportation information systems to gather, compare, and report data as movements progress through the planning, scheduling and execution phases. Additionally, USTRANSCOM action officers would be forced back to "hunt and create" methods of building movement groupings, which are in turn tracked for feasibility analysis, tracking, and reporting.
Fairplay software is paid for with operating funds.
FY2011 FY2012 FY2013
Single Mobility System (SMS) is a suite of tools that provide for planning, visibility of requirements and missions (scheduled and unscheduled), and data visualization. SMS provides visibility of Special Assignment Airlift Mission (SAAM), Channel, Operational Support Airlift (OSA), contingency, exercise, Guard and Reserve missions and requirements. Additionally, it provides visibility of ship schedules, booked and manifested cargo, planning tools (Horse Blanket), Surface Deployment and Distribution Command (SDDC) Situation Reports (SITREPS) and Sport Reports (SPOTREPS), port data and decision support tools such as cost calculators, port locators, station and International Civil Aviation Organization (ICAO) workloads as well as mission monitoring of air land and sea conveyances. It provides visualization and analysis of Joint Planning and Execution System (JOPES) data, exercise planning actions, force movement tracking, leading indicators for performance, executive management visualizations, tools for metrics and monitoring the state of the enterprise.
SMS provides United States Transportation Command (USTRANSCOM) and its customers a quick, web-based means of accessing transportation information in a user-friendly format. By fusing data from various systems, users can quickly compare planned, scheduled, and actual movement information. This is a vast improvement over the alternative of logging into various other transportation systems and looking for data, or performing independent queries as needed against the data warehouse.
Economic Analysis (EA) has been provided to TCJ8 for certification.
FY12: Provides visualization and analysis of Joint Planning and Execution System (JOPES) data, exercise planning actions, force movement tracking, leading indicators for performance, executive management visualizations, tools for metrics and monitoring the state of the enterprise.
Fund 9B United States Transportation Command
CAPITAL BUDGET
145

Activity Group Capital Investment Justification Fiscal Year (FY) 2013Fund 9b Air Force Working Capital Fund Budget Estimates(Dollars in Thousands) Transportation Working Capital Fund (TWCF) February 2012
Component/Activity/Date Line No. & Item Description Activity Identification
USTRANSCOM Command Staff/Transportation/February 2012 Global C4S Coordination Center Command Staff
Element of Cost Quantity Unit Cost Total Cost Quantity Unit Cost Total Cost Quantity Unit Cost Total Cost- C(2) System Development 0 280.0 280.0 0 115.0 115.0 0 .0 .0
TOTAL 0 280.0 280.0 0 115.0 115.0 0 .0 .0
Narrative Justification:
Description
Mission Benefits
Deliverables
Economic Analysis
Impact
Software
The USTRANSCOM Global C4S Coordination Center (GCCC) will not have situational awareness of the service levels and availability of selected automated Defense Transportation Systems (DTS) that are critical for USTRANSCOM to execute its operational mission.
No license fees apply
FY2011 FY2012 FY2013
This program encompasses cyberspace operations defense capabilities providing people, operations, and technology that protect and defend USTRANSCOM information and information systems by ensuring their availability, integrity, authentication, confidentiality and non-repudiation. The program is aligned with the Deputy Assistant Secretary of Defense for Cyber Identity and Information Assurance (CIIA) Strategy.
Establish effective indications and warning (I&A) of potential or ongoing attacks against the enterprise. Develop and deploy an IA User Defined Operational picture (UDOP). Conduct near real time and integrated IA and Network Operations (NETOPS) decision making across the enterprise. Harmonize NETOPS, defensive Information Operations (IO), Computer Network Attack (CNA), Computer Network Exploitation (CNE) and Computer Network Defense (CND) policies, doctrine, relationships, and operations.
Life Cycle Cost Estimate received August 2007.
FY11: 24/7 customer centric monitoring of operations and services supported USTRANSCOM's DPO mission, UDOP which provided situational awareness to USTRANSCOM Deployment and Distribution Operations Center and cyber senior leadership, and 24/7 network operations coordination, incident response, and threat analysis. FY12-FY13: Develop a UDOP which presents a cohesive, near real-time enterprise-wide view of Command, Control, Communications and Computer Systems (C4S) capabilities and infrastructure supporting the Joint Deployment and Distribution Enterprise (JDDE) that will ensure the JDDE decision maker has the most current information.
Fund 9B United States Transportation Command
CAPITAL BUDGET
146
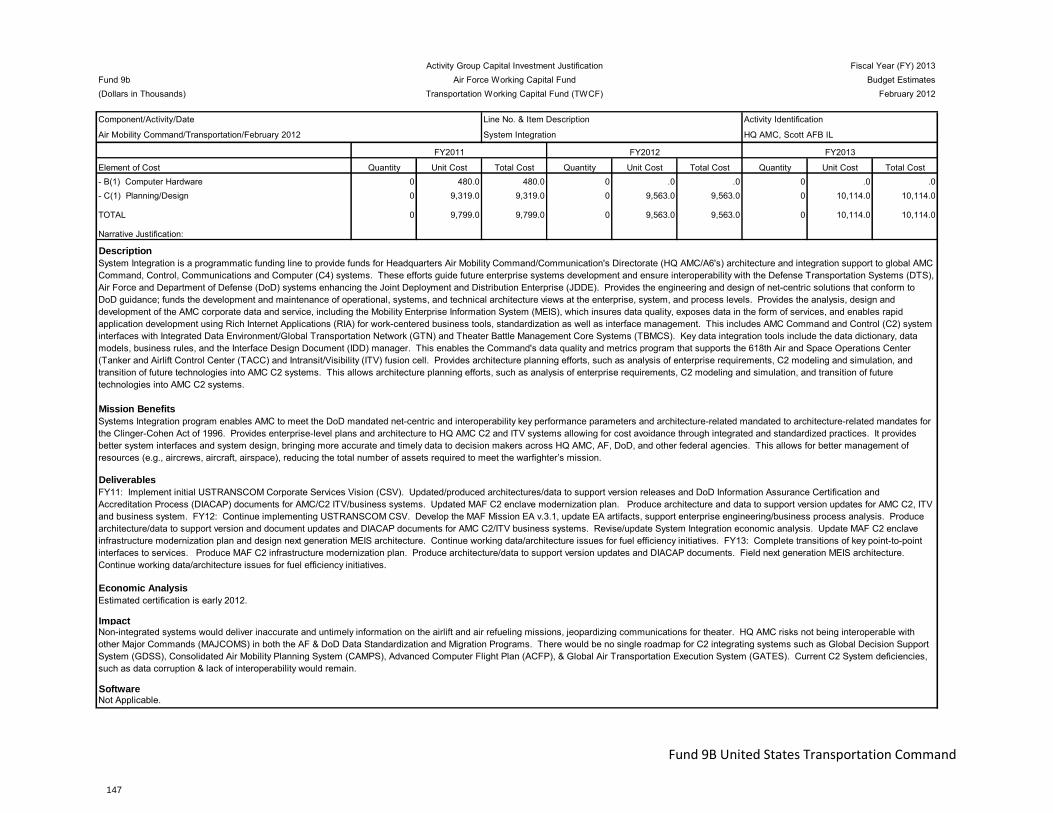
Q Activity Group Capital Investment Justification Fiscal Year (FY) 2013Fund 9b Air Force Working Capital Fund Budget Estimates(Dollars in Thousands) Transportation Working Capital Fund (TWCF) February 2012
Component/Activity/Date Line No. & Item Description Activity Identification
Air Mobility Command/Transportation/February 2012 System Integration HQ AMC, Scott AFB IL
Element of Cost Quantity Unit Cost Total Cost Quantity Unit Cost Total Cost Quantity Unit Cost Total Cost- B(1) Computer Hardware 0 480.0 480.0 0 .0 .0 0 .0 .0- C(1) Planning/Design 0 9,319.0 9,319.0 0 9,563.0 9,563.0 0 10,114.0 10,114.0
TOTAL 0 9,799.0 9,799.0 0 9,563.0 9,563.0 0 10,114.0 10,114.0
Narrative Justification:
Description
Mission Benefits
Deliverables
Economic Analysis
Impact
Software
Non-integrated systems would deliver inaccurate and untimely information on the airlift and air refueling missions, jeopardizing communications for theater. HQ AMC risks not being interoperable with other Major Commands (MAJCOMS) in both the AF & DoD Data Standardization and Migration Programs. There would be no single roadmap for C2 integrating systems such as Global Decision Support System (GDSS), Consolidated Air Mobility Planning System (CAMPS), Advanced Computer Flight Plan (ACFP), & Global Air Transportation Execution System (GATES). Current C2 System deficiencies, such as data corruption & lack of interoperability would remain.
Not Applicable.
FY2011 FY2012 FY2013
System Integration is a programmatic funding line to provide funds for Headquarters Air Mobility Command/Communication's Directorate (HQ AMC/A6's) architecture and integration support to global AMC Command, Control, Communications and Computer (C4) systems. These efforts guide future enterprise systems development and ensure interoperability with the Defense Transportation Systems (DTS), Air Force and Department of Defense (DoD) systems enhancing the Joint Deployment and Distribution Enterprise (JDDE). Provides the engineering and design of net-centric solutions that conform to DoD guidance; funds the development and maintenance of operational, systems, and technical architecture views at the enterprise, system, and process levels. Provides the analysis, design and development of the AMC corporate data and service, including the Mobility Enterprise Information System (MEIS), which insures data quality, exposes data in the form of services, and enables rapid application development using Rich Internet Applications (RIA) for work-centered business tools, standardization as well as interface management. This includes AMC Command and Control (C2) system interfaces with Integrated Data Environment/Global Transportation Network (GTN) and Theater Battle Management Core Systems (TBMCS). Key data integration tools include the data dictionary, data models, business rules, and the Interface Design Document (IDD) manager. This enables the Command's data quality and metrics program that supports the 618th Air and Space Operations Center (Tanker and Airlift Control Center (TACC) and Intransit/Visibility (ITV) fusion cell. Provides architecture planning efforts, such as analysis of enterprise requirements, C2 modeling and simulation, and transition of future technologies into AMC C2 systems. This allows architecture planning efforts, such as analysis of enterprise requirements, C2 modeling and simulation, and transition of future technologies into AMC C2 systems.
Systems Integration program enables AMC to meet the DoD mandated net-centric and interoperability key performance parameters and architecture-related mandated to architecture-related mandates for the Clinger-Cohen Act of 1996. Provides enterprise-level plans and architecture to HQ AMC C2 and ITV systems allowing for cost avoidance through integrated and standardized practices. It provides better system interfaces and system design, bringing more accurate and timely data to decision makers across HQ AMC, AF, DoD, and other federal agencies. This allows for better management of resources (e.g., aircrews, aircraft, airspace), reducing the total number of assets required to meet the warfighter’s mission.
Estimated certification is early 2012.
FY11: Implement initial USTRANSCOM Corporate Services Vision (CSV). Updated/produced architectures/data to support version releases and DoD Information Assurance Certification and Accreditation Process (DIACAP) documents for AMC/C2 ITV/business systems. Updated MAF C2 enclave modernization plan. Produce architecture and data to support version updates for AMC C2, ITV and business system. FY12: Continue implementing USTRANSCOM CSV. Develop the MAF Mission EA v.3.1, update EA artifacts, support enterprise engineering/business process analysis. Produce architecture/data to support version and document updates and DIACAP documents for AMC C2/ITV business systems. Revise/update System Integration economic analysis. Update MAF C2 enclave infrastructure modernization plan and design next generation MEIS architecture. Continue working data/architecture issues for fuel efficiency initiatives. FY13: Complete transitions of key point-to-point interfaces to services. Produce MAF C2 infrastructure modernization plan. Produce architecture/data to support version updates and DIACAP documents. Field next generation MEIS architecture. Continue working data/architecture issues for fuel efficiency initiatives.
Fund 9B United States Transportation Command
CAPITAL BUDGET
147

Activity Group Capital Investment Justification Fiscal Year (FY) 2013Fund 9b Air Force Working Capital Fund Budget Estimates(Dollars in Thousands) Transportation Working Capital Fund (TWCF) February 2012
Component/Activity/Date Line No. & Item Description Activity Identification
USTRANSCOM Command Staff/Transportation/February 2012 Security Engineering Command Staff
Element of Cost Quantity Unit Cost Total Cost Quantity Unit Cost Total Cost Quantity Unit Cost Total Cost- C(2) System Development 0 1,247.5 1,247.5 0 2,004.0 2,004.0 0 2,407.0 2,407.0
TOTAL 0 1,247.5 1,247.5 0 2,004.0 2,004.0 0 2,407.0 2,407.0
Narrative Justification:
Description
Mission Benefits
Deliverables
Economic Analysis
Impact
Software
Failure to provide and improve network security architectures increases the vulnerability of United States Transportation Command (USTRANSCOM) and Transportation Component Command mission systems to electronic attack resulting in the loss of critical command and control functions.
No license fees apply
FY2011 FY2012 FY2013
This program encompasses cyberspace operations defense capabilities providing people, operations, and technology that protect and defend USTRANSCOM information and information systems by ensuring their availability, integrity, authentication, confidentiality and non-repudiation. The program is aligned with the Deputy Assistant Secretary of Defense for Cyber Identity and Information Assurance (CIIA) Strategy.
Ensure that IA is integrated and sustained throughout the lifecycle of all DOD programs. Improve the quality of strategic decision making and net-centric IA governance. Expedite the development and delivery of cynamic IA capabilities through innovation. Enable efficient information sharing and collaboration across traditional boundaries.
Life Cycle Cost Estimate (LCCE) received August 2007.
FY11 deliverables include technical solutions and security architecture engineering for the DSE, malware analysis technical engineering support, and Computer Network Defense Service Provider (CNDSP) assessment support. FY12-FY13: Security engineering support for development of enterprise security standards; deployment of new security capabilities; security evaluations of systems/applications; and program development.
Fund 9B United States Transportation Command
CAPITAL BUDGET
148

Q Activity Group Capital Investment Justification Fiscal Year (FY) 2013Fund 9b Air Force Working Capital Fund Budget Estimates(Dollars in Thousands) Transportation Working Capital Fund (TWCF) February 2012
Component/Activity/Date Line No. & Item Description Activity Identification
Air Mobility Command/Transportation/February 2012 Wing Local Area Network (LAN) HQ AMC, Scott AFB IL
Element of Cost Quantity Unit Cost Total Cost Quantity Unit Cost Total Cost Quantity Unit Cost Total Cost- B(1) Computer Hardware 0 2,199.0 2,199.0 0 5,236.0 5,236.0 0 5,323.0 5,323.0
TOTAL 0 2,199.0 2,199.0 0 5,236.0 5,236.0 0 5,323.0 5,323.0
Narrative Justification:
Description
Mission Benefits
Deliverables
Economic Analysis
Impact
Software
The Wing LAN program provides access to many vital information systems and services. Without it, users cannot access electronic mail, worldwide web file sharing, C2IPS, GCSS, DMS, and base level data processing applications.
Not Applicable.
FY2011 FY2012 FY2013
The Wing Local Area Network (Wing LAN) is Headquarters Air Mobility Command's (HQ AMC) comprehensive plan to implement Local Area Network (LAN) used to access Command and Control (C2) systems including Transportation Working Capital Funds (TWCF) facilities and enroutes. Command-wide hardware includes; intra-building infrastructure and cabling, routers, bridges, repeaters, servers, and technical training (no Personal Computers (PCs)).
Wing LAN provides access to C2 systems, other hosts, and other systems. It builds an enhanced, robust standardized, and reliable command-wide network capability throughout all HQ AMC bases to support implementation of the Department of Defense (DoD), United States Transportation Command (USTRANSCOM), and Air Force (AF) downward directed systems like Combat Information Transport System (CITS), Defense Message System (DMS), Global Command and Control System (GCCS), Global Decision Support System (GDSS), Command and Control Information Processing System (C2IPS) and Global Transportation Network (GTN). This includes intra-building networking infrastructure, servers/gateways, file servers, communications servers, initial technical training, installation, and installation support for unclassified, classified and Radio Frequency (RF) LAN connectivity. This program constantly reassesses the needs of the warfighter and obtains the necessary LAN infrastructure required to sustain current capabilities and implement new C2 systems. Wing LAN also constructs the common platform to improve collection, retrieval, creation, sharing, and reporting data electronically. It discourages units from piecing together LANs which result in disparate, non-standard systems to support the HQ AMC airlift mission.
Economic analysis completed April 2009.
FY11: Provide analysis for proposed upgrades, including premise wiring. FY12: Validate requirements needed to sustain capability at AMC bases, provide upgrades where needed within buildings, including Internet Protocol Version 6 (IPV6) capable equipment to increase AMC’s velocity and capacity to deliver core capabilities. FY13: Validate requirements needed to implement Local and Wide-Area Networks (LAN/WAN) components for AMC bases and enroutes. Provide secure and non-secure data/voice/ video infrastructure upgrades where needed within buildings (including Internet Protocol v6 capable equipment). Extend and implement Voice over Internet Protocol (VoIP) solution to AMC bases. Provide network infrastructure capabilities and technology refresh for capability sustainment.
Fund 9B United States Transportation Command
CAPITAL BUDGET
149
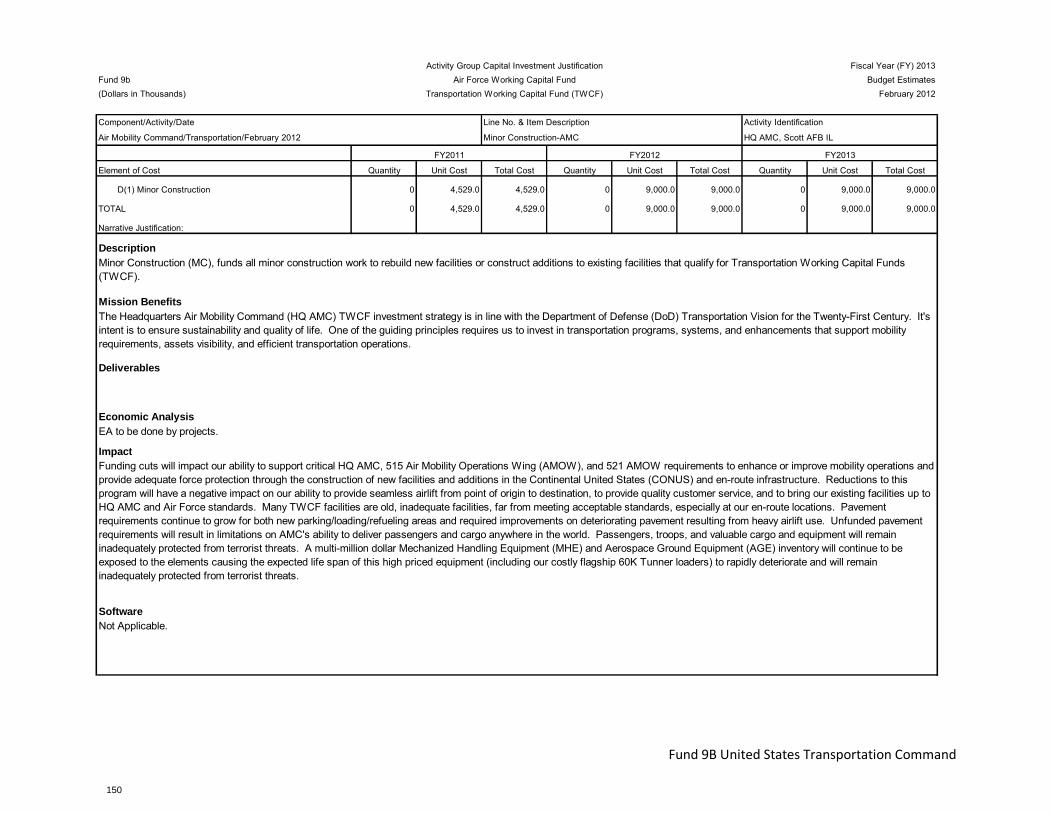
Q Activity Group Capital Investment Justification Fiscal Year (FY) 2013Fund 9b Air Force Working Capital Fund Budget Estimates(Dollars in Thousands) Transportation Working Capital Fund (TWCF) February 2012
Component/Activity/Date Line No. & Item Description Activity Identification
Air Mobility Command/Transportation/February 2012 Minor Construction-AMC HQ AMC, Scott AFB IL
Element of Cost Quantity Unit Cost Total Cost Quantity Unit Cost Total Cost Quantity Unit Cost Total Cost
D(1) Minor Construction 0 4,529.0 4,529.0 0 9,000.0 9,000.0 0 9,000.0 9,000.0
TOTAL 0 4,529.0 4,529.0 0 9,000.0 9,000.0 0 9,000.0 9,000.0
Narrative Justification:
Description
Mission Benefits
Deliverables
Economic Analysis
Impact
Software
Funding cuts will impact our ability to support critical HQ AMC, 515 Air Mobility Operations Wing (AMOW), and 521 AMOW requirements to enhance or improve mobility operations and provide adequate force protection through the construction of new facilities and additions in the Continental United States (CONUS) and en-route infrastructure. Reductions to this program will have a negative impact on our ability to provide seamless airlift from point of origin to destination, to provide quality customer service, and to bring our existing facilities up to HQ AMC and Air Force standards. Many TWCF facilities are old, inadequate facilities, far from meeting acceptable standards, especially at our en-route locations. Pavement requirements continue to grow for both new parking/loading/refueling areas and required improvements on deteriorating pavement resulting from heavy airlift use. Unfunded pavement requirements will result in limitations on AMC's ability to deliver passengers and cargo anywhere in the world. Passengers, troops, and valuable cargo and equipment will remain inadequately protected from terrorist threats. A multi-million dollar Mechanized Handling Equipment (MHE) and Aerospace Ground Equipment (AGE) inventory will continue to be exposed to the elements causing the expected life span of this high priced equipment (including our costly flagship 60K Tunner loaders) to rapidly deteriorate and will remain inadequately protected from terrorist threats.
Not Applicable.
FY2011 FY2012 FY2013
Minor Construction (MC), funds all minor construction work to rebuild new facilities or construct additions to existing facilities that qualify for Transportation Working Capital Funds (TWCF).
The Headquarters Air Mobility Command (HQ AMC) TWCF investment strategy is in line with the Department of Defense (DoD) Transportation Vision for the Twenty-First Century. It's intent is to ensure sustainability and quality of life. One of the guiding principles requires us to invest in transportation programs, systems, and enhancements that support mobility requirements, assets visibility, and efficient transportation operations.
EA to be done by projects.
Fund 9B United States Transportation Command
CAPITAL BUDGET
150
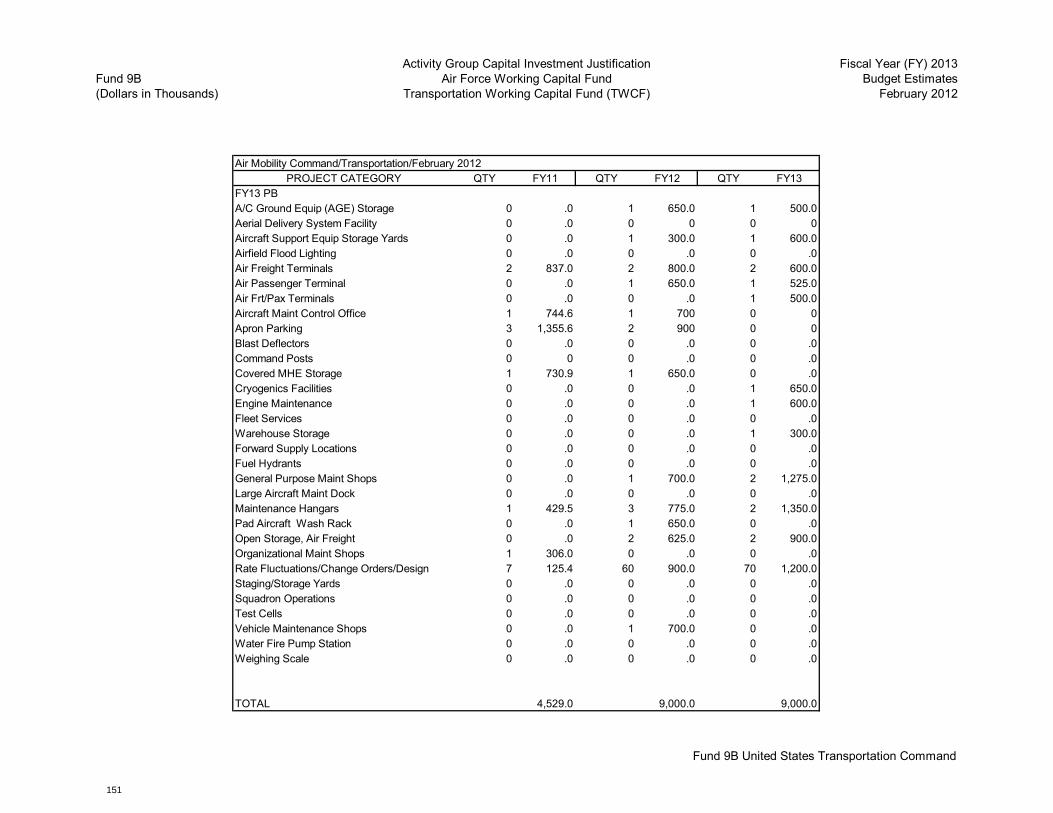
Fund 9B(Dollars in Thousands)
Activity Group Capital Investment JustificationAir Force Working Capital Fund
Transportation Working Capital Fund (TWCF)
Fiscal Year (FY) 2013Budget Estimates
February 2012
Air Mobility Command/Transportation/February 2012PROJECT CATEGORY QTY FY11 QTY FY12 QTY FY13
FY13 PBA/C Ground Equip (AGE) Storage 0 .0 1 650.0 1 500.0Aerial Delivery System Facility 0 .0 0 0 0 0Aircraft Support Equip Storage Yards 0 .0 1 300.0 1 600.0Airfield Flood Lighting 0 .0 0 .0 0 .0Air Freight Terminals 2 837.0 2 800.0 2 600.0Air Passenger Terminal 0 .0 1 650.0 1 525.0Air Frt/Pax Terminals 0 .0 0 .0 1 500.0Aircraft Maint Control Office 1 744.6 1 700 0 0Apron Parking 3 1,355.6 2 900 0 0Blast Deflectors 0 .0 0 .0 0 .0Command Posts 0 0 0 .0 0 .0Covered MHE Storage 1 730.9 1 650.0 0 .0Cryogenics Facilities 0 .0 0 .0 1 650.0Engine Maintenance 0 .0 0 .0 1 600.0Fleet Services 0 .0 0 .0 0 .0Warehouse Storage 0 .0 0 .0 1 300.0Forward Supply Locations 0 .0 0 .0 0 .0Fuel Hydrants 0 .0 0 .0 0 .0General Purpose Maint Shops 0 .0 1 700.0 2 1,275.0Large Aircraft Maint Dock 0 .0 0 .0 0 .0Maintenance Hangars 1 429.5 3 775.0 2 1,350.0Pad Aircraft Wash Rack 0 .0 1 650.0 0 .0Open Storage, Air Freight 0 .0 2 625.0 2 900.0Organizational Maint Shops 1 306.0 0 .0 0 .0Rate Fluctuations/Change Orders/Design 7 125.4 60 900.0 70 1,200.0Staging/Storage Yards 0 .0 0 .0 0 .0Squadron Operations 0 .0 0 .0 0 .0Test Cells 0 .0 0 .0 0 .0Vehicle Maintenance Shops 0 .0 1 700.0 0 .0Water Fire Pump Station 0 .0 0 .0 0 .0Weighing Scale 0 .0 0 .0 0 .0
TOTAL 4,529.0 9,000.0 9,000.0
Fund 9B United States Transportation Command
CAPITAL BUDGET
151
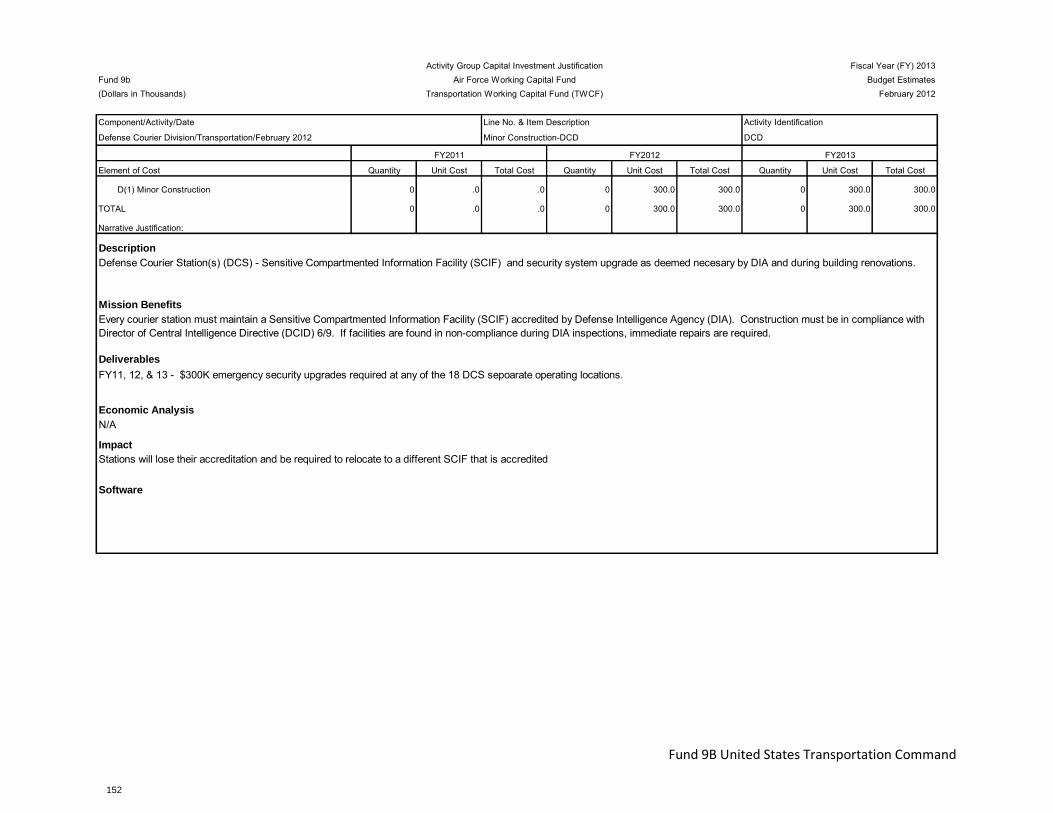
Q Activity Group Capital Investment Justification Fiscal Year (FY) 2013Fund 9b Air Force Working Capital Fund Budget Estimates(Dollars in Thousands) Transportation Working Capital Fund (TWCF) February 2012
Component/Activity/Date Line No. & Item Description Activity Identification
Defense Courier Division/Transportation/February 2012 Minor Construction-DCD DCD
Element of Cost Quantity Unit Cost Total Cost Quantity Unit Cost Total Cost Quantity Unit Cost Total Cost
D(1) Minor Construction 0 .0 .0 0 300.0 300.0 0 300.0 300.0
TOTAL 0 .0 .0 0 300.0 300.0 0 300.0 300.0
Narrative Justification:
Description
Mission Benefits
Deliverables
Economic Analysis
Impact
Software
Stations will lose their accreditation and be required to relocate to a different SCIF that is accredited
FY2011 FY2012 FY2013
Defense Courier Station(s) (DCS) - Sensitive Compartmented Information Facility (SCIF) and security system upgrade as deemed necesary by DIA and during building renovations.
Every courier station must maintain a Sensitive Compartmented Information Facility (SCIF) accredited by Defense Intelligence Agency (DIA). Construction must be in compliance with Director of Central Intelligence Directive (DCID) 6/9. If facilities are found in non-compliance during DIA inspections, immediate repairs are required.
N/A
FY11, 12, & 13 - $300K emergency security upgrades required at any of the 18 DCS sepoarate operating locations.
Fund 9B United States Transportation Command
CAPITAL BUDGET
152

Fund 9B(Dollars in Thousands)
Activity Group Capital Investment JustificationAir Force Working Capital Fund
Transportation Working Capital Fund (TWCF)
Fiscal Year (FY) 2013Budget Estimates
February 2012
Project Category QTY FY11 QTY FY12 QTY FY13
Minor Construction - Emergency Security Upgrades to SCIFs-Emergency Security 0 0 1 300 1 300
Total 0 0 1 300 1 300
Minor Construction (Atch) - DCDExhibit Fund - 9B Activity Group Capital Investment Justification
Fund 9B United States Transportation Command
CAPITAL BUDGET
153
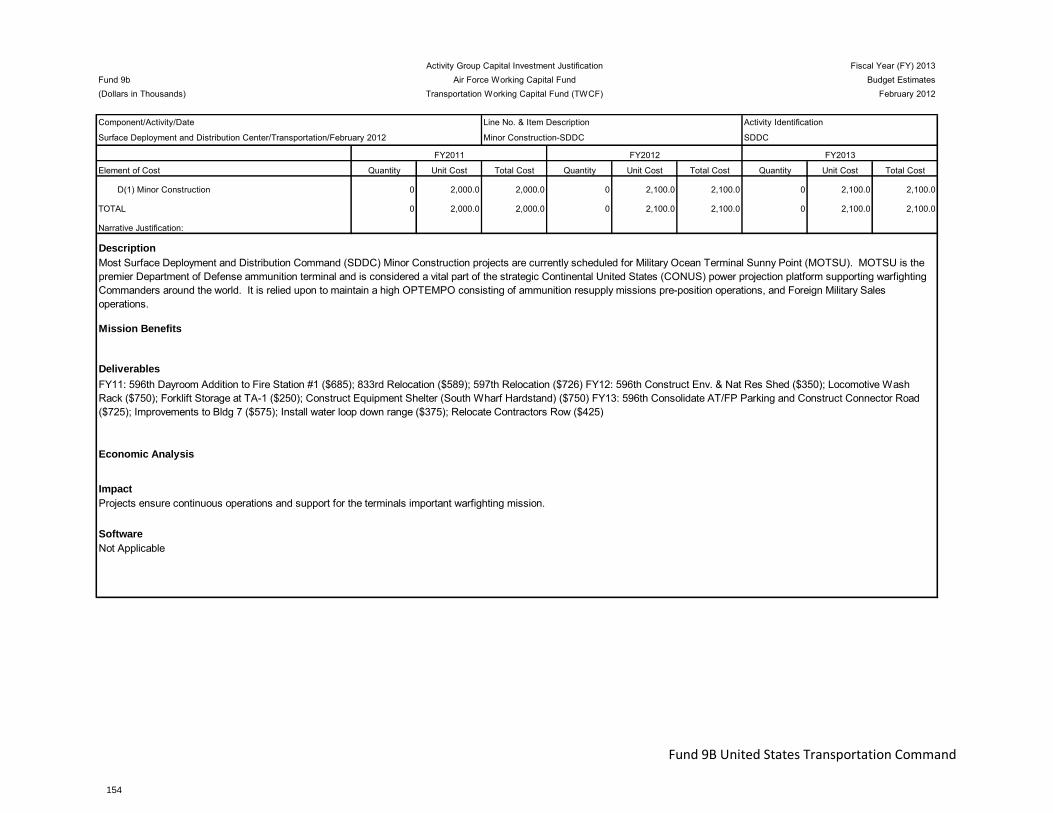
Q Activity Group Capital Investment Justification Fiscal Year (FY) 2013Fund 9b Air Force Working Capital Fund Budget Estimates(Dollars in Thousands) Transportation Working Capital Fund (TWCF) February 2012
Component/Activity/Date Line No. & Item Description Activity Identification
Surface Deployment and Distribution Center/Transportation/February 2012 Minor Construction-SDDC SDDC
Element of Cost Quantity Unit Cost Total Cost Quantity Unit Cost Total Cost Quantity Unit Cost Total Cost
D(1) Minor Construction 0 2,000.0 2,000.0 0 2,100.0 2,100.0 0 2,100.0 2,100.0
TOTAL 0 2,000.0 2,000.0 0 2,100.0 2,100.0 0 2,100.0 2,100.0
Narrative Justification:
Description
Mission Benefits
Deliverables
Economic Analysis
Impact
Software
Projects ensure continuous operations and support for the terminals important warfighting mission.
Not Applicable
FY2011 FY2012 FY2013
Most Surface Deployment and Distribution Command (SDDC) Minor Construction projects are currently scheduled for Military Ocean Terminal Sunny Point (MOTSU). MOTSU is the premier Department of Defense ammunition terminal and is considered a vital part of the strategic Continental United States (CONUS) power projection platform supporting warfighting Commanders around the world. It is relied upon to maintain a high OPTEMPO consisting of ammunition resupply missions pre-position operations, and Foreign Military Sales operations.
FY11: 596th Dayroom Addition to Fire Station #1 ($685); 833rd Relocation ($589); 597th Relocation ($726) FY12: 596th Construct Env. & Nat Res Shed ($350); Locomotive Wash Rack ($750); Forklift Storage at TA-1 ($250); Construct Equipment Shelter (South Wharf Hardstand) ($750) FY13: 596th Consolidate AT/FP Parking and Construct Connector Road ($725); Improvements to Bldg 7 ($575); Install water loop down range ($375); Relocate Contractors Row ($425)
Fund 9B United States Transportation Command
CAPITAL BUDGET
154

Fund 9B(Dollars in Thousands)
Activity Group Capital Investment JustificationAir Force Working Capital Fund
Transportation Working Capital Fund (TWCF)
Fiscal Year (FY) 2013Budget Estimates
February 2012
Date: February 2012 FY11 FY12 FY13
Minor Construction is as follows:
FY11 (Over $250K)Dayroom Addition to Fire Station #1 $685Minor Construction at 833rd $589Minor Construction at 597th $726
FY12 (Over $250K)Construc Env & Nat Res Shed $350Locomotive Wash Rack $750Forklift Storage at TA-1 $250Construct Equipment Shelter (South Wharf Hardstand) $750
FY13 (Over $250K)Consolidate Parking AT/FP & Construct Connector Road $725Improvements to Bldg. 7 $575Install Water Loops Down Range $375Relocate Contractors Row $425
TOTALS $2,000 $2,100 $2,100
Fund 9B United States Transportation Command
CAPITAL BUDGET
155
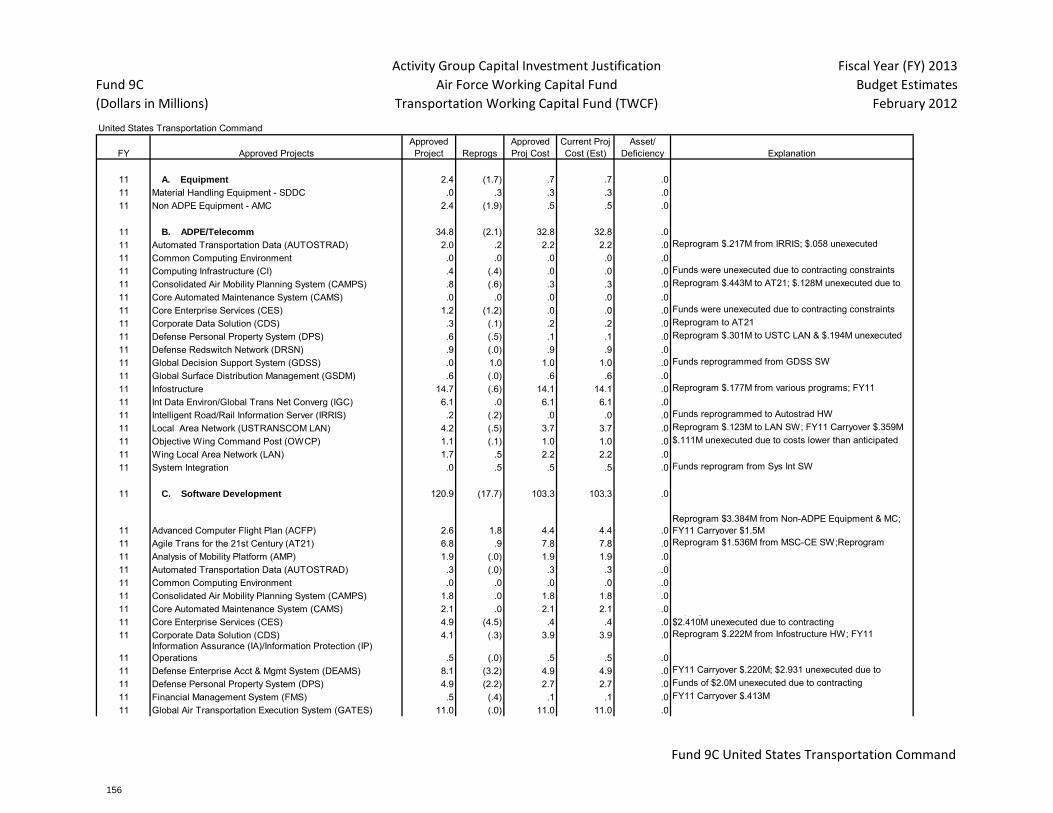
Fund 9C
(Dollars in Millions)
Activity Group Capital Investment Justification
Air Force Working Capital Fund
Transportation Working Capital Fund (TWCF)
Fiscal Year (FY) 2013
Budget Estimates
February 2012
FY Approved ProjectsApproved Project Reprogs
Approved Proj Cost
Current Proj Cost (Est)
Asset/ Deficiency Explanation
11 A. Equipment 2.4 (1.7) .7 .7 .011 Material Handling Equipment - SDDC .0 .3 .3 .3 .011 Non ADPE Equipment - AMC 2.4 (1.9) .5 .5 .0
11 B. ADPE/Telecomm 34.8 (2.1) 32.8 32.8 .011 Automated Transportation Data (AUTOSTRAD) 2.0 .2 2.2 2.2 .0 Reprogram $.217M from IRRIS; $.058 unexecuted11 Common Computing Environment .0 .0 .0 .0 .011 Computing Infrastructure (CI) .4 (.4) .0 .0 .0 Funds were unexecuted due to contracting constraints11 Consolidated Air Mobility Planning System (CAMPS) .8 (.6) .3 .3 .0 Reprogram $.443M to AT21; $.128M unexecuted due to
costs lower than anticipated11 Core Automated Maintenance System (CAMS) .0 .0 .0 .0 .011 Core Enterprise Services (CES) 1.2 (1.2) .0 .0 .0 Funds were unexecuted due to contracting constraints11 Corporate Data Solution (CDS) .3 (.1) .2 .2 .0 Reprogram to AT2111 Defense Personal Property System (DPS) .6 (.5) .1 .1 .0 Reprogram $.301M to USTC LAN & $.194M unexecuted11 Defense Redswitch Network (DRSN) .9 (.0) .9 .9 .011 Global Decision Support System (GDSS) .0 1.0 1.0 1.0 .0 Funds reprogrammed from GDSS SW11 Global Surface Distribution Management (GSDM) .6 (.0) .6 .6 .011 Infostructure 14.7 (.6) 14.1 14.1 .0 Reprogram $.177M from various programs; FY11
Carryover $.567M; $.199M unexecuted11 Int Data Environ/Global Trans Net Converg (IGC) 6.1 .0 6.1 6.1 .011 Intelligent Road/Rail Information Server (IRRIS) .2 (.2) .0 .0 .0 Funds reprogrammed to Autostrad HW11 Local Area Network (USTRANSCOM LAN) 4.2 (.5) 3.7 3.7 .0 Reprogram $.123M to LAN SW; FY11 Carryover $.359M11 Objective Wing Command Post (OWCP) 1.1 (.1) 1.0 1.0 .0 $.111M unexecuted due to costs lower than anticipated11 Wing Local Area Network (LAN) 1.7 .5 2.2 2.2 .011 System Integration .0 .5 .5 .5 .0 Funds reprogram from Sys Int SW
11 C. Software Development 120.9 (17.7) 103.3 103.3 .0
11 Advanced Computer Flight Plan (ACFP) 2.6 1.8 4.4 4.4 .0Reprogram $3.384M from Non-ADPE Equipment & MC; FY11 Carryover $1.5M
11 Agile Trans for the 21st Century (AT21) 6.8 .9 7.8 7.8 .0 Reprogram $1.536M from MSC-CE SW;Reprogram $.489M from MSC-IC3; FY11 Carryover $1.232M11 Analysis of Mobility Platform (AMP) 1.9 (.0) 1.9 1.9 .0
11 Automated Transportation Data (AUTOSTRAD) .3 (.0) .3 .3 .011 Common Computing Environment .0 .0 .0 .0 .011 Consolidated Air Mobility Planning System (CAMPS) 1.8 .0 1.8 1.8 .011 Core Automated Maintenance System (CAMS) 2.1 .0 2.1 2.1 .011 Core Enterprise Services (CES) 4.9 (4.5) .4 .4 .0
Reprogram $1.536M to AT21 & $.241M to Infostructure; $2.410M unexecuted due to contracting
11 Corporate Data Solution (CDS) 4.1 (.3) 3.9 3.9 .0 Reprogram $.222M from Infostructure HW; FY11 Carryover $.503M
11Information Assurance (IA)/Information Protection (IP) Operations .5 (.0) .5 .5 .0
11 Defense Enterprise Acct & Mgmt System (DEAMS) 8.1 (3.2) 4.9 4.9 .0 FY11 Carryover $.220M; $2.931 unexecuted due to milestone B Acquisition Strategy restructure11 Defense Personal Property System (DPS) 4.9 (2.2) 2.7 2.7 .0 Funds of $2.0M unexecuted due to contracting constraints;$.179M unexecuted11 Financial Management System (FMS) .5 (.4) .1 .1 .0 FY11 Carryover $.413M
11 Global Air Transportation Execution System (GATES) 11.0 (.0) 11.0 11.0 .0
United States Transportation Command
Fund 9C United States Transportation Command
CAPITAL BUDGET
156

Fund 9C
(Dollars in Millions)
Activity Group Capital Investment Justification
Air Force Working Capital Fund
Transportation Working Capital Fund (TWCF)
Fiscal Year (FY) 2013
Budget Estimates
February 2012
FY Approved ProjectsApproved Project Reprogs
Approved Proj Cost
Current Proj Cost (Est)
Asset/ Deficiency Explanation
United States Transportation Command
11 Global Decision Support System (GDSS) 31.7 (1.2) 30.5 30.5 .0 Reprogram $.999M to GDSS HW; $.189M unexecuted11 Global Freight Management (GFM) .4 (.0) .4 .4 .011 Infostructure 8.1 (7.9) .2 .2 .0 Funds of $5.588M unexecuted due to contracting
constraints;FY11 Carryover $.889M; $.376M unexecuted11 Int Command, Control, & Comm (IC3) 1.0 (1.0) .0 .0 .0 Reprogram $466K to IBS & $489K to AT2111 Int Data Environ/Global Trans Net Converg (IGC) 5.3 1.0 6.3 6.3 .0 Reprogram from Infostructure SW11 Integrated Booking System (IBS) 2.9 (.3) 2.6 2.6 .0 Reprogram $.466M from MSC-IC3; FY11 Carryover
$.757M11 Intelligent Road/Rail Information Server (IRRIS) 3.1 (.0) 3.1 3.1 .011 Joint Flow & Analysis Sys for Trans (JFAST) 1.8 (.3) 1.5 1.5 .0 Funds of $.218M unexecuted due to contracting
constraints;$.071M unexecuted11 Local Area Network (USTRANSCOM LAN) 2.0 .4 2.4 2.4 .0 Reprogram $.123M from LAN CAP HW & $.301M from DPS11 Logbook .6 (.6) .0 .0 .0 Funds of $.477M unexecuted due to contracting constraints;Reprogram $.118M to Infostructure11 Mission Index Flying (MIF) 3.0 .7 3.7 3.7 .0 Funds reprogrammed from MC
11 Global C4S Coordination Center .3 .0 .3 .3 .011 System Integration 9.8 (.4) 9.3 9.3 .0 Funds reprogrammed to Sys Int HW11 Security Engineering 1.4 (.2) 1.2 1.2 .0 FY11 Carryover $.120M
11 D. Minor Construction 11.3 (4.8) 6.5 6.5 .011 Minor Contruction - AMC 9.0 (4.5) 4.5 4.5 .011 Minor Construction - DCD .3 (.3) .0 .0 .011 Minor Construction - SDDC 2.0 .0 2.0 2.0 .011 Minor Construction - USTC Command Staff .0 .0 .0 .0 .0
11 TOTAL FY 169.5 (26.2) 143.3 143.3 .0
Fund 9C United States Transportation Command
CAPITAL BUDGET
157

Fund 9C
(Dollars in Millions)
Activity Group Capital Investment Justification
Air Force Working Capital Fund
Transportation Working Capital Fund (TWCF)
Fiscal Year (FY) 2013
Budget Estimates
February 2012
FY Approved ProjectsApproved Project Reprogs
Approved Proj Cost
Current Proj Cost (Est)
Asset/ Deficiency Explanation
United States Transportation Command
12 A. Equipment 3.6 .0 3.6 3.6 .012 Material Handling Equipment - SDDC 1.2 .0 1.2 1.2 .012 Non ADPE Equipment - AMC 2.4 .0 2.4 2.4 .0
12 B. ADPE/Telecomm 32.2 2.1 34.2 34.2 .012 Automated Transportation Data (AUTOSTRAD) .9 .0 1.0 1.0 .012 Common Computing Environment .0 .0 .0 .0 .012 Global Decision Support System (GDSS) 2.4 .1 2.5 2.5 .0 Reprogram from GDSS SW12 Global Surface Distribution Management (GSDM) 1.5 .0 1.6 1.6 .0
12 Infostructure 16.2 .1 16.3 16.3 .0 Inflation adjustment12 Intelligent Road/Rail Information Server (IRRIS) .3 .0 .3 .3 .012 Joint Flow & Analysis Sys for Trans (JFAST) .0 .0 .0 .0 .012 Joint Mobility Control Group (JMCG) .0 .0 .0 .0 .012 Local Area Network (USTRANSCOM LAN) 4.4 2.0 6.3 6.3 .0 Reprogram from USTC LAN SW.12 Objective Wing Command Post (OWCP) 1.1 .0 1.1 1.1 .012 Wing Local Area Network (LAN) 5.2 .0 5.2 5.2 .012 System Integration .0 .0 .0 .0 .0
12 C. Software Development 128.7 (8.8) 120.0 120.0 (.0)12 Advanced Computer Flight Plan (ACFP) 2.7 .0 2.7 2.7 .0
12 Agile Trans for the 21st Century (AT21) 10.3 3.6 14.0 14.0 .0 Funded higher command priorities12 Analysis of Mobility Platform (AMP) 2.1 .0 2.1 2.1 .012 Automated Transportation Data (AUTOSTRAD) .3 (.0) .3 .3 .012 Common Computing Environment .0 .0 .0 .0 .012 Consolidated Air Mobility Planning System (CAMPS) 2.5 .3 2.8 2.8 .0 Reprogram from CAMS SW12 Core Automated Maintenance System (CAMS) 3.1 (.6) 2.5 2.5 .0 Funded higher command priorities12 Core Enterprise Services (CES) .7 (.5) .3 .3 .0 Funded higher command priorities
12 Corporate Data Solution (CDS) 7.2 1.9 9.1 9.1 .0 Funded higher command priorities
12Information Assurance (IA)/Information Protection (IP) Operations .5 (.3) .2 .2 .0 Funding realigned between IA goals
12 Defense Enterprise Acct & Mgmt System (DEAMS) 5.4 .1 5.5 5.5 .0 Inflation adjustment
12 Defense Personal Property System (DPS) 7.3 (1.6) 5.6 5.6 .0 Funded higher command priorities12 Financial Management System (FMS) .5 (.5) .0 .0 .0 Funded higher command priorities12 Global Air Transportation Execution System (GATES) 9.4 (1.0) 8.4 8.4 .0 Funded higher command priorities12 Global Decision Support System (GDSS) 33.3 (6.6) 26.7 26.7 .0 Funded higher command priorities12 Global Freight Management (GFM) .4 .0 .4 .4 .0
Fund 9C United States Transportation Command
CAPITAL BUDGET
158
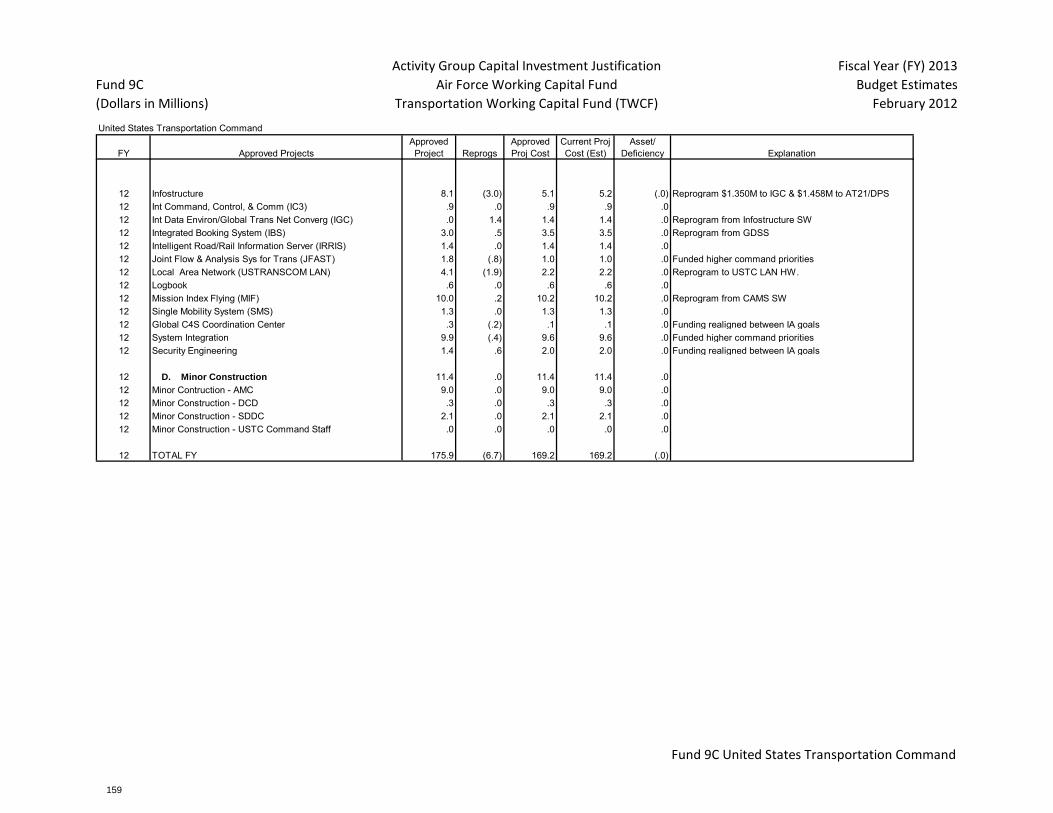
Fund 9C
(Dollars in Millions)
Activity Group Capital Investment Justification
Air Force Working Capital Fund
Transportation Working Capital Fund (TWCF)
Fiscal Year (FY) 2013
Budget Estimates
February 2012
FY Approved ProjectsApproved Project Reprogs
Approved Proj Cost
Current Proj Cost (Est)
Asset/ Deficiency Explanation
United States Transportation Command
12 Infostructure 8.1 (3.0) 5.1 5.2 (.0) Reprogram $1.350M to IGC & $1.458M to AT21/DPS12 Int Command, Control, & Comm (IC3) .9 .0 .9 .9 .012 Int Data Environ/Global Trans Net Converg (IGC) .0 1.4 1.4 1.4 .0 Reprogram from Infostructure SW12 Integrated Booking System (IBS) 3.0 .5 3.5 3.5 .0 Reprogram from GDSS12 Intelligent Road/Rail Information Server (IRRIS) 1.4 .0 1.4 1.4 .012 Joint Flow & Analysis Sys for Trans (JFAST) 1.8 (.8) 1.0 1.0 .0 Funded higher command priorities12 Local Area Network (USTRANSCOM LAN) 4.1 (1.9) 2.2 2.2 .0 Reprogram to USTC LAN HW.12 Logbook .6 .0 .6 .6 .012 Mission Index Flying (MIF) 10.0 .2 10.2 10.2 .0 Reprogram from CAMS SW12 Single Mobility System (SMS) 1.3 .0 1.3 1.3 .012 Global C4S Coordination Center .3 (.2) .1 .1 .0 Funding realigned between IA goals12 System Integration 9.9 (.4) 9.6 9.6 .0 Funded higher command priorities12 Security Engineering 1.4 .6 2.0 2.0 .0 Funding realigned between IA goals
12 D. Minor Construction 11.4 .0 11.4 11.4 .012 Minor Contruction - AMC 9.0 .0 9.0 9.0 .012 Minor Construction - DCD .3 .0 .3 .3 .012 Minor Construction - SDDC 2.1 .0 2.1 2.1 .012 Minor Construction - USTC Command Staff .0 .0 .0 .0 .0
12 TOTAL FY 175.9 (6.7) 169.2 169.2 (.0)
Fund 9C United States Transportation Command
CAPITAL BUDGET
159

THIS PAGE INTENTIONALLY LEFT BLANK
CAPITAL BUDGET
160