united singapore growth fund - uobam.com.sg · growth fund annual report ... in the first half of...
TRANSCRIPT

United Singapore GrowthFundAnnual Report
for the financial year ended 31st December 2014


1
United Singapore Growth Fund(Constituted under a Trust Deed in the Republic of Singapore)
MANAGERUOB Asset Management LtdRegistered Address:80 Raffles PlaceUOB PlazaSingapore 048624Company Registration No. : 198600120Z
OPERATIONS ADDRESS80 Raffles Place#06-00, UOB Plaza 2Singapore 048624Tel: 1800 22 22 228
DIRECTORS OF UOB ASSET MANAGEMENTTerence Ong Sea EngCheo Chai HongThio Boon Kiat
TRUSTEE / REGISTRARHSBC Institutional Trust Services (Singapore) Limited21 Collyer Quay#10-02, HSBC BuildingSingapore 049320
CUSTODIANState Street Bank and Trust CompanyOne Lincoln StreetBoston, MA 02111United States of America
AUDITORSPricewaterhouseCoopers LLP8 Cross Street#17-00, PWC BuildingSingapore 048424
SOLICITORS TO THE MANAGERTan Peng Chin LLC30 Raffles Place#11-00, Chevron HouseSingapore 048622
SOLICITORS TO THE TRUSTEEShook Lin & Bok LLP1 Robinson Road#18-00, AIA TowerSingapore 048542

2
United Singapore Growth Fund(Constituted under a Trust Deed in the Republic of Singapore)
A) Fund Performance
Fund Performance/ Benchmark Returns
3 mth
%Growth
6 mth
%Growth
1 yr
%Growth
3 yrAnn
CompRet
5 yrAnn
CompRet
10 yrAnn
CompRet
SinceInception
28 February 1990Ann
CompRet
United Singapore Growth Fund -1.22 0.26 1.02 9.24 4.04 6.41 6.81Benchmark 3.43 4.54 8.13 11.90 6.32 7.49 5.14
Source: Lipper, a Thomson Reuters Company.
Note: The performance returns of the Fund are in Singapore dollars based on a NAV-to-NAV basis with net dividends reinvested. The benchmark of the Fund: Feb 90 – Dec 12: Straits Times Index; Jan 13 to Present: MSCI Singapore NR.
For the year ended 31 December 2014, the net asset value of the Fund rose 1.0% compared with an 8.1% increase in the benchmark MSCI Singapore Index.
The Fund’s underperformance was largely attributed to adverse stock selection. In the second half of the year, the Fund’s overweight position in the offshore & marine sector was adversely impacted by the significant fall in crude oil prices. The Fund’s holdings in Keppel Corp and Ezion Holdings detracted from performance.
In the first half of the year, the Fund’s underweight positions in commodity companies Olam and Noble, both of which were the subject of mergers and acquisitions (M&A), also detracted from performance.
The Fund’s holdings in DBS, UOB, Capitamalls Asia, Suntec Reit and CapitaCommercial Trust partially mitigated the underperformance.
As at end December 2014, the Fund was 99.5% invested. In terms of sectors, the Fund’s allocation stood at financials (60.4%), telecommunication services (14.0%), industrials (11.1%), consumer discretionary (5.1%), consumer staples (4.9%), energy (3.5%), others (0.5%) with the remainder (0.5%) in cash.
Market Review
The Singapore equity market gained in the period under review, in line with global equity markets. Markets started the year 2014 on a weaker note, due to concerns over global economic growth and deteriorating fundamentals in emerging markets particularly the “fragile five” (Brazil, India, Indonesia, Turkey and South Africa). Markets steadily moved higher through the middle of the year as it became apparent that the poor US data was weather-induced.
In the second half of 2014, the Singapore equity market moved higher as more upbeat corporate earnings overshadowed growth concerns. Investor sentiment was buoyed in part by the strong performance of the US S&P500 Index, which hit record levels. However, unease over the US Federal Reserve’s (Fed’s) monetary tightening plan added to volatility, causing equity markets to decline in early October, and wiping out prior gains.

3
United Singapore Growth Fund(Constituted under a Trust Deed in the Republic of Singapore)
The Singapore market rebounded in the third quarter, underpinned by corporate earnings, which came in better than expected. The slump in crude oil prices raised concerns over growth and adversely impacted investor sentiment. Markets recovered after data pointed to broader economic strength and helped by the US Fed’s comments that it would be patient in normalizing monetary policy.
Singapore’s third quarter 2014 GDP growth of 2.8 per cent surprised. This uptick in growth was seen across most sectors especially from the business services, accommodation and food services and other service industries, which helped to offset a contraction in the construction sector. On the inflation front, Singapore’s consumer price index turned negative in November 2014 for the first time since the global financial crisis, falling by 0.3 per cent.
In terms of sector performance, financials was the best performer, followed by telecommunications. The consumer staples sector managed to eke out a positive return for the year. Meanwhile the industrials and consumer discretionary sectors both ended the year with negative returns.
Fund Strategy and Outlook
Singapore’s Ministry of Trade and Information estimated 2015 GDP growth to be at 2-4 per cent. Domestically, the labour market is expected to remain tight, with low unemployment and job vacancy rates rising. Singapore’s growth is likely to be supported by externally-oriented sectors such as manufacturing, wholesale trade, finance and insurance. Labour-intensive sectors such as retail and food services may see growth negatively impacted by labour constraints, while the construction sector may be adversely impacted by the weakness in the real estate sector.
In terms of sectors, our current strategy is to overweight consumer staples and healthcare sectors. The Fund is underweight the industrials and consumer discretionary sectors.
We believe that the long-term structural growth potential in Singapore, driven by its well-established trade links and strategic geographical location, makes the market an attractive investment destination. Our strategy is to take advantage of these structural opportunities by investing in companies that have sound business models, are positioned in segments offering attractive growth and that have demonstrated operational and financial discipline in the way they manage their businesses.

4
United Singapore Growth Fund(Constituted under a Trust Deed in the Republic of Singapore)
B) Investments at fair value and as a percentage of NAV as at 31 December 2014 under review classified by
Fair Value % of NAV(S$)
i) Country
Hong Kong 4,318,501 5.52 Singapore 72,576,200 92.65 Thailand 1,035,000 1.32
Portfolio of investments 77,929,701 99.49 Other net assets 401,721 0.51
Total 78,331,422 100.00
ii) Industry
Consumer Discretionary 3,974,400 5.07 Consumer Staples 3,819,800 4.88 Energy 2,782,000 3.55 Financials 47,302,551 60.39 Healthcare 389,000 0.50 Industrials 8,706,450 11.12 Telecommunication Services 10,955,500 13.98
Portfolio of investments 77,929,701 99.49 Other net assets 401,721 0.51
Total 78,331,422 100.00
iii) Asset Class
Equities 77,929,701 99.49 Other net assets 401,721 0.51
Total 78,331,422 100.00
iv) Credit rating of debt securities
N/A

5
United Singapore Growth Fund(Constituted under a Trust Deed in the Republic of Singapore)
C) Top Ten Holdings
The top 10 holdings as at 31 December 2014 and 31 December 2013
10 largest holdings at 31 December 2014
Fair Value
Percentage oftotal net assetsattributable to
unitholders(S$) %
DBS GROUP HOLDINGS LIMITED 12,772,000 16.31OVERSEA-CHINESE BANKING CORPORATION LIMITED 10,146,200 12.95UNITED OVERSEAS BANK LIMITED 9,566,700 12.21SINGAPORE TELECOMMUNICATIONS LIMITED 8,970,000 11.45GLOBAL LOGISTIC PROPERTIES LTD 4,216,000 5.38KEPPEL CORPORATION LIMITED 3,540,000 4.52CAPITALAND LIMITED 2,979,000 3.80EZION HOLDINGS LIMITED 2,576,000 3.29UOL GROUP LIMITED 2,227,200 2.84M1 LTD 1,985,500 2.53
10 largest holdings at 31 December 2013
Fair Value
Percentage oftotal net assetsattributable to
unitholders(S$) %
DBS GROUP HOLDINGS LIMITED 16,758,000 13.73UNITED OVERSEAS BANK LIMITED 15,930,000 13.05SINGAPORE TELECOMMUNICATIONS LIMITED 15,408,600 12.62OVERSEA-CHINESE BANKING CORPORATION LIMITED 11,526,000 9.44KEPPEL CORPORATION LIMITED 10,406,700 8.53EZION HOLDINGS LIMITED 7,126,200 5.84GENTING SINGAPORE PLC 6,353,750 5.21GLOBAL LOGISTIC PROPERTIES LTD 4,479,500 3.67CAPITALAND LIMITED 3,939,000 3.23WILMAR INTERNATIONAL LIMITED 3,625,200 2.97

6
United Singapore Growth Fund(Constituted under a Trust Deed in the Republic of Singapore)
D) Exposure to derivatives
i) fair value of derivative contracts and as a percentage of NAV as at 31 December 2014
N/A
ii) net gains/(losses) on derivative contracts realised during the financial year ended 31 December 2014
N/A
iii) net gains/(losses) on outstanding derivative contracts marked to market as at 31 December 2014
N/A
E) Amount and percentage of net asset value (NAV) invested in other schemes as at 31 December 2014
Fair ValueSGD
% of NAV
CAPITACOMMERCIAL TRUST 1,579,500 2.02CAPITAMALL TRUST 775,200 0.99CDL HOSPITALITY TRUST 348,000 0.45KEPPEL DC REIT 152,100 0.19
F) Amount and percentage of borrowings to net asset value (NAV) as at 31 December 2014
N/A
G) Amount of redemptions and subscriptions for the financial year ended 31 December 2014
Total amount of redemptions SGD 48,704,351Total amount of subscriptions SGD 8,837,469
H) The amount and terms of related-party transactions for the financial year ended 31 December 2014
i) As at 31 December 2014, the Fund maintained current accounts with the United Overseas Bank Limited as follows:
Bank balances SGD 28,837
7
United Singapore Growth Fund(Constituted under a Trust Deed in the Republic of Singapore)
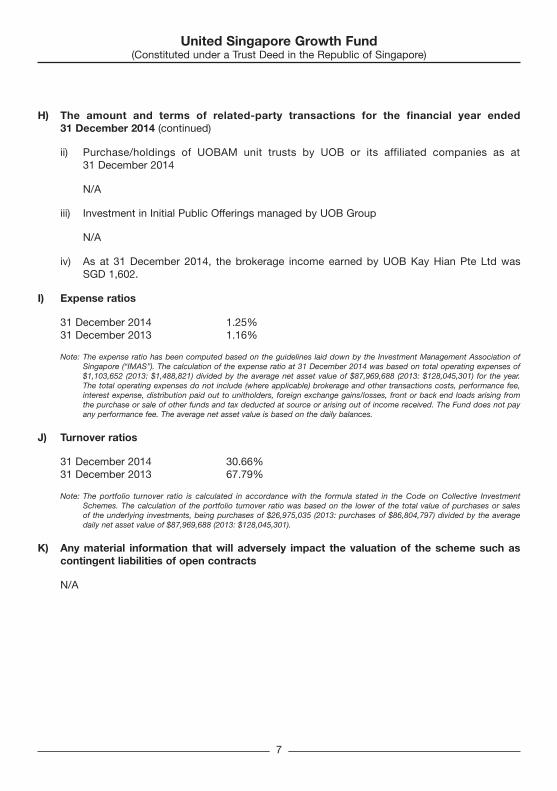
H) The amount and terms of related-party transactions for the financial year ended 31 December 2014 (continued)
ii) Purchase/holdings of UOBAM unit trusts by UOB or its affiliated companies as at 31 December 2014
N/A
iii) Investment in Initial Public Offerings managed by UOB Group
N/A
iv) As at 31 December 2014, the brokerage income earned by UOB Kay Hian Pte Ltd was SGD 1,602.
I) Expense ratios
31 December 2014 1.25%31 December 2013 1.16%
Note: The expense ratio has been computed based on the guidelines laid down by the Investment Management Association of Singapore (“IMAS”). The calculation of the expense ratio at 31 December 2014 was based on total operating expenses of $1,103,652 (2013: $1,488,821) divided by the average net asset value of $87,969,688 (2013: $128,045,301) for the year. The total operating expenses do not include (where applicable) brokerage and other transactions costs, performance fee, interest expense, distribution paid out to unitholders, foreign exchange gains/losses, front or back end loads arising from the purchase or sale of other funds and tax deducted at source or arising out of income received. The Fund does not pay any performance fee. The average net asset value is based on the daily balances.
J) Turnover ratios
31 December 2014 30.66%31 December 2013 67.79%
Note: The portfolio turnover ratio is calculated in accordance with the formula stated in the Code on Collective Investment Schemes. The calculation of the portfolio turnover ratio was based on the lower of the total value of purchases or sales of the underlying investments, being purchases of $26,975,035 (2013: purchases of $86,804,797) divided by the average daily net asset value of $87,969,688 (2013: $128,045,301).
K) Any material information that will adversely impact the valuation of the scheme such as contingent liabilities of open contracts
N/A

8
United Singapore Growth Fund(Constituted under a Trust Deed in the Republic of Singapore)
L) For schemes which invest more than 30% of their deposited property in another scheme, the following key information on the second-mentioned scheme (“the underlying scheme”)1 should be disclosed as well
i) top 10 holdings at fair value and as percentage of NAV as at 31 December 2014 and 31 December 2013.
N/A
ii) expense ratios for the financial year ended 31 December 2014 and 31 December 2013.
N/A
iii) turnover ratios for the financial year ended 31 December 2014 and 31 December 2013.
N/A
M) Soft dollar commissions/arrangements
UOB Asset Management has entered into soft dollars arrangements with selected brokers from whom products and services are received from third parties. The products and services relate essentially to computer hardware and software to the extent that they are used to support the investment decision making process, research and advisory services, economic and political analyses, portfolio analyses including performance measurements, market analyses, data and quotation services, all of which are believed to be helpful in the overall discharge of UOB Asset Management’s duties to clients. As such services generally benefit all of UOB Asset Management’s clients in terms of input into the investment decision making process, the soft credits utilised are not allocated on a specific client basis. The Manager confirms that trades were executed on a best execution basis and there was no churning of trades.
N) Where the scheme offers pre-determined payouts, an explanation on the calculation of the actual payouts received by participants and any significant deviation from the pre-determined payouts
N/A
1 where the underlying scheme is managed by a foreign manager which belongs to the same group of companies as, or has a formal arrangement or investment agreement with, the Singapore manager, the above information should be disclosed on the underlying scheme. In other cases, such information on the underlying scheme should be disclosed only if it is readily available to the Singapore manager.
9
United Singapore Growth Fund(Constituted under a Trust Deed in the Republic of Singapore)
REPORT OF THE TRUSTEE
The Trustee is under a duty to take into custody and hold the assets of United Singapore Growth Fund (the “Fund”) in trust for the unitholders. In accordance with the Securities and Futures Act (Cap. 289), its subsidiary legislation and the Code on Collective Investment Schemes, the Trustee shall monitor the activities of the Manager for compliance with the limitations imposed on the investment and borrowing powers as set out in the Trust Deed in each annual accounting year and report thereon to unitholders in an annual report.
To the best knowledge of the Trustee, the Manager has, in all material respects, managed the Fund during the year covered by these financial statements, set out on pages 12 to 32, in accordance with the limitations imposed on the investment and borrowing powers set out in the Trust Deed.
For and on behalf of the TrusteeHSBC INSTITUTIONAL TRUST SERVICES (SINGAPORE) LIMITED
____________________________________Authorised signatory
24 March 2015
10
United Singapore Growth Fund(Constituted under a Trust Deed in the Republic of Singapore)
STATEMENT BY THE MANAGER
In the opinion of the directors of UOB Asset Management Ltd, the accompanying financial statements set out on pages 12 to 32, comprising the Statement of Total Return, Statement of Financial Position, Statement of Movements of Unitholders’ Funds, Statement of Portfolio and Notes to the Financial Statements are drawn up so as to present fairly, in all material respects, the financial position of United Singapore Growth Fund (the “Fund”) as at 31 December 2014, and the total deficit and changes in unitholders’ funds for the year then ended in accordance with the recommendations of Statement of Recommended Accounting Practice 7 “Reporting Framework for Unit Trusts” issued by the Institute of Singapore Chartered Accountants. At the date of this statement, there are reasonable grounds to believe that the Fund will be able to meet its financial obligations as and when they materialise.
For and on behalf of the ManagerUOB ASSET MANAGEMENT LTD
____________________________________THIO BOON KIATAuthorised signatory
24 March 2015

11
United Singapore Growth Fund(Constituted under a Trust Deed in the Republic of Singapore)
INDEPENDENT AUDITOR’S REPORT TO THE UNITHOLDERS OF UNITED SINGAPORE GROWTH FUND(Constituted under a Trust Deed in the Republic of Singapore)
We have audited the accompanying financial statements of United Singapore Growth Fund (the “Fund”), which comprise the Statement of Financial Position and Statement of Portfolio as at 31 December 2014, the Statement of Total Return and Statement of Movements of Unitholders’ Funds for the year then ended, and a summary of significant accounting policies and other explanatory information, as set out on pages 12 to 32.
Manager’s Responsibility for the Financial Statements
The Fund’s Manager (the “Manager”) is responsible for the preparation and fair presentation of these financial statements in accordance with the recommendations of Statement of Recommended Accounting Practice 7 “Reporting Framework for Unit Trusts” issued by the Institute of Singapore Chartered Accountants, and for such internal control as the Manager determines is necessary to enable the preparation of financial statements that are free from material misstatement, whether due to fraud or error.
Auditor’s Responsibility
Our responsibility is to express an opinion on these financial statements based on our audit. We conducted our audit in accordance with Singapore Standards on Auditing. Those standards require that we comply with ethical requirements and plan and perform the audit to obtain reasonable assurance about whether the financial statements are free from material misstatement.
An audit involves performing procedures to obtain audit evidence about the amounts and disclosures in the financial statements. The procedures selected depend on the auditor’s judgement, including the assessment of the risks of material misstatement of the financial statements, whether due to fraud or error. In making those risk assessments, the auditor considers internal control relevant to the Fund’s preparation and fair presentation of the financial statements in order to design audit procedures that are appropriate in the circumstances, but not for the purpose of expressing an opinion on the effectiveness of the Fund’s internal control. An audit also includes evaluating the appropriateness of accounting policies used and the reasonableness of accounting estimates made by the Manager, as well as evaluating the overall presentation of the financial statements.
We believe that the audit evidence we have obtained is sufficient and appropriate to provide a basis for our audit opinion.
Opinion
In our opinion, the financial statements present fairly, in all material respects, the financial position of the Fund as at 31 December 2014 and the total deficit for the year then ended in accordance with the recommendations of Statement of Recommended Accounting Practice 7 “Reporting Framework for Unit Trusts” issued by the Institute of Singapore Chartered Accountants.
PricewaterhouseCoopers LLPPublic Accountants and Chartered Accountants
Singapore, 24 March 2015
12
United Singapore Growth Fund(Constituted under a Trust Deed in the Republic of Singapore)
The accompanying notes form an integral part of these financial statements.
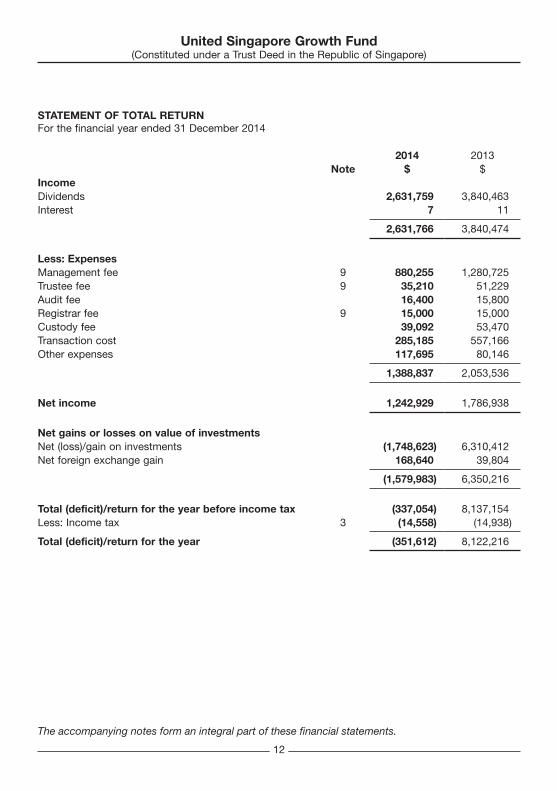
STATEMENT OF TOTAL RETURNFor the financial year ended 31 December 2014
2014 2013Note $ $
IncomeDividends 2,631,759 3,840,463 Interest 7 11
2,631,766 3,840,474
Less: ExpensesManagement fee 9 880,255 1,280,725 Trustee fee 9 35,210 51,229 Audit fee 16,400 15,800 Registrar fee 9 15,000 15,000 Custody fee 39,092 53,470 Transaction cost 285,185 557,166 Other expenses 117,695 80,146
1,388,837 2,053,536
Net income 1,242,929 1,786,938
Net gains or losses on value of investments Net (loss)/gain on investments (1,748,623) 6,310,412 Net foreign exchange gain 168,640 39,804
(1,579,983) 6,350,216
Total (deficit)/return for the year before income tax (337,054) 8,137,154 Less: Income tax 3 (14,558) (14,938)
Total (deficit)/return for the year (351,612) 8,122,216

13
United Singapore Growth Fund(Constituted under a Trust Deed in the Republic of Singapore)
The accompanying notes form an integral part of these financial statements.
STATEMENT OF FINANCIAL POSITIONAs at 31 December 2014
2014 2013Note $ $
ASSETSPortfolio of investments 77,929,701 116,950,229 Receivables 5 170,939 3,858,017 Sales awaiting settlement 410,327 - Cash and bank balances 117,516 1,766,116
Total Assets 78,628,483 122,574,362
LIABILITIESPayables 6 297,061 523,879
Total Liabilities 297,061 523,879
EQUITYNet assets attributable to unitholders 7 78,331,422 122,050,483

14
United Singapore Growth Fund(Constituted under a Trust Deed in the Republic of Singapore)
The accompanying notes form an integral part of these financial statements.
STATEMENT OF MOVEMENTS OF UNITHOLDERS’ FUNDSFor the financial year ended 31 December 2014
2014 2013Note $ $
Net assets attributable to unitholders at the beginning of the financial year 122,050,483 138,413,625 OperationsChange in net assets attributable to unitholders resulting from operations (351,612) 8,122,216
Unitholders’ contributions/(withdrawals)Creation of units 8,837,469 19,853,056 Cancellation of units (48,704,351) (39,858,490)
Change in net assets attributable to unitholders resulting from net creation and cancellation of units (39,866,882) (20,005,434)
Distribution 4 (3,500,567) (4,479,924)
Total decrease in net assets attributable to unitholders (43,719,061) (16,363,142)
Net assets attributable to unitholders at the end of the financial year 7 78,331,422 122,050,483

15
United Singapore Growth Fund(Constituted under a Trust Deed in the Republic of Singapore)
The accompanying notes form an integral part of these financial statements.
STATEMENT OF PORTFOLIOAs at 31 December 2014
Holdings at31 December
2014
Fair value at31 December
2014
Percentage oftotal net assetsattributable tounitholders at 31 December
2014$ %
By Geography - Primary Quoted Equities
HONG KONGHONGKONG LAND HOLDINGS LIMITED 150,000 1,343,651 1.72 JARDINE MATHESON HOLDINGS LIMITED 20,000 1,615,297 2.06 JARDINE STRATEGIC HOLDINGS LIMITED 30,000 1,359,553 1.74
TOTAL HONG KONG 4,318,501 5.52
SINGAPORECAPITACOMMERCIAL TRUST 900,000 1,579,500 2.02 CAPITALAND LIMITED 900,000 2,979,000 3.80 CAPITAMALL TRUST 380,000 775,200 0.99 CDL HOSPITALITY TRUST 200,000 348,000 0.45 DBS GROUP HOLDINGS LIMITED 620,000 12,772,000 16.31 EZION HOLDINGS LIMITED 2,300,000 2,576,000 3.29 GENTING SINGAPORE PLC 1,800,000 1,944,000 2.48 GLOBAL LOGISTIC PROPERTIES LTD 1,700,000 4,216,000 5.38 JAPFA LTD 2,000,000 1,100,000 1.41 JARDINE CYCLE & CARRIAGE LTD 30,000 1,278,000 1.63 KEPPEL CORPORATION LIMITED 400,000 3,540,000 4.52 KEPPEL DC REIT 156,000 152,100 0.19 KEPPEL LAND LTD 350,000 1,197,000 1.53 M1 LTD 550,000 1,985,500 2.53 NOBLE GROUP LTD 640,000 729,600 0.93 OSIM INTERNATIONAL LTD 380,000 752,400 0.96 OVERSEA-CHINESE BANKING CORPORATION
LIMITED 970,000 10,146,200 12.95 RAFFLES MEDICAL GROUP LTD 100,000 389,000 0.50 SINGAPORE TELECOMMUNICATIONS LIMITED 2,300,000 8,970,000 11.45 SINGAPORE TECHNOLOGICAL ENGINEERING
LIMITED 430,000 1,462,000 1.87 SWISSCO HOLDINGS LTD 400,000 206,000 0.26 UNITED OVERSEAS BANK LIMITED 390,000 9,566,700 12.21 UOL GROUP LIMITED 320,000 2,227,200 2.84 WILMAR INTERNATIONAL LIMITED 520,000 1,684,800 2.15
TOTAL SINGAPORE 72,576,200 92.65
16
United Singapore Growth Fund(Constituted under a Trust Deed in the Republic of Singapore)
STATEMENT OF PORTFOLIOAs at 31 December 2014
Holdings at31 December
2014
Fair value at31 December
2014
Percentage oftotal net assetsattributable tounitholders at 31 December
2014$ %
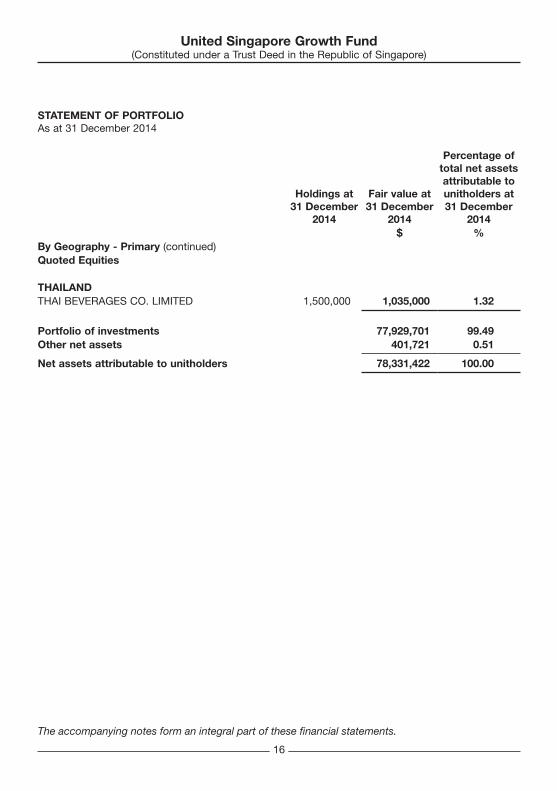
By Geography - Primary (continued)Quoted Equities
THAILANDTHAI BEVERAGES CO. LIMITED 1,500,000 1,035,000 1.32
Portfolio of investments 77,929,701 99.49 Other net assets 401,721 0.51
Net assets attributable to unitholders 78,331,422 100.00
The accompanying notes form an integral part of these financial statements.
17
United Singapore Growth Fund(Constituted under a Trust Deed in the Republic of Singapore)
STATEMENT OF PORTFOLIOAs at 31 December 2014
Percentage of total net assetsattributable tounitholders at31 December
2014
Percentage oftotal net assetsattributable tounitholders at31 December
2013% %
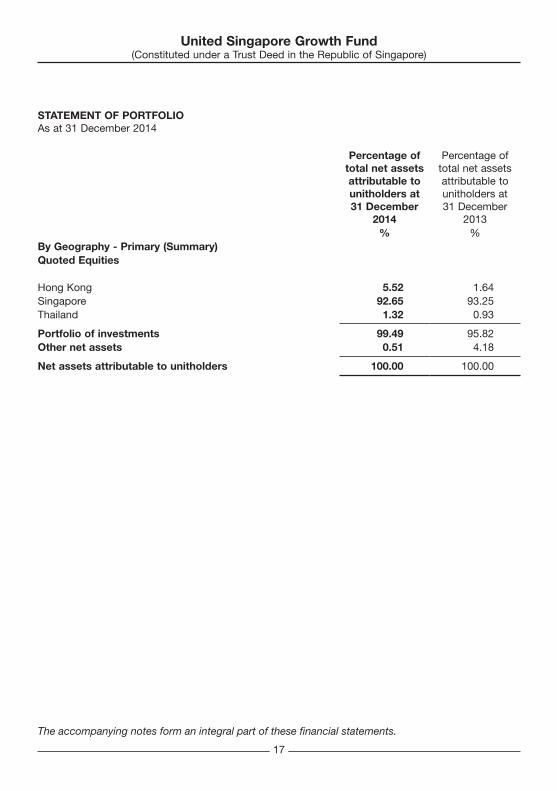
By Geography - Primary (Summary)Quoted Equities
Hong Kong 5.52 1.64 Singapore 92.65 93.25 Thailand 1.32 0.93
Portfolio of investments 99.49 95.82 Other net assets 0.51 4.18
Net assets attributable to unitholders 100.00 100.00
The accompanying notes form an integral part of these financial statements.

18
United Singapore Growth Fund(Constituted under a Trust Deed in the Republic of Singapore)
STATEMENT OF PORTFOLIOAs at 31 December 2014
Fair value at31 December
2014
Percentage of total net assetsattributable tounitholders at31 December
2014
Percentage of total net assetsattributable to unitholders at31 December
2013$ % %
By Industry - SecondaryQuoted Equities
Consumer Discretionary 3,974,400 5.07 5.92 Consumer Staples 3,819,800 4.88 3.90 Energy 2,782,000 3.55 6.34 Financials 47,302,551 60.39 51.46 Healthcare 389,000 0.50 - Industrials 8,706,450 11.12 15.58 Telecommunication Services 10,955,500 13.98 12.62
Portfolio of investments 77,929,701 99.49 95.82 Other net assets 401,721 0.51 4.18
Net assets attributable to unitholders 78,331,422 100.00 100.00
The accompanying notes form an integral part of these financial statements.
19
United Singapore Growth Fund(Constituted under a Trust Deed in the Republic of Singapore)
NOTES TO THE FINANCIAL STATEMENTSFor the financial year ended 31 December 2014
These notes form an integral part of and should be read in conjunction with the accompanying financial statements.
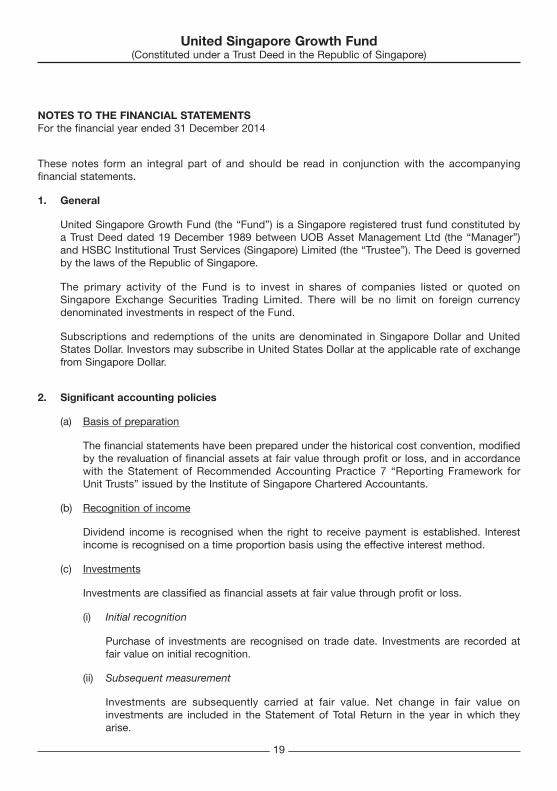
1. General
United Singapore Growth Fund (the “Fund”) is a Singapore registered trust fund constituted by a Trust Deed dated 19 December 1989 between UOB Asset Management Ltd (the “Manager”) and HSBC Institutional Trust Services (Singapore) Limited (the “Trustee”). The Deed is governed by the laws of the Republic of Singapore.
The primary activity of the Fund is to invest in shares of companies listed or quoted on Singapore Exchange Securities Trading Limited. There will be no limit on foreign currency denominated investments in respect of the Fund.
Subscriptions and redemptions of the units are denominated in Singapore Dollar and United States Dollar. Investors may subscribe in United States Dollar at the applicable rate of exchange from Singapore Dollar.
2. Significant accounting policies
(a) Basis of preparation
The financial statements have been prepared under the historical cost convention, modified by the revaluation of financial assets at fair value through profit or loss, and in accordance with the Statement of Recommended Accounting Practice 7 “Reporting Framework for Unit Trusts” issued by the Institute of Singapore Chartered Accountants.
(b) Recognition of income
Dividend income is recognised when the right to receive payment is established. Interest income is recognised on a time proportion basis using the effective interest method.
(c) Investments
Investments are classified as financial assets at fair value through profit or loss.
(i) Initial recognition
Purchase of investments are recognised on trade date. Investments are recorded at fair value on initial recognition.
(ii) Subsequent measurement
Investments are subsequently carried at fair value. Net change in fair value on investments are included in the Statement of Total Return in the year in which they arise.

20
United Singapore Growth Fund(Constituted under a Trust Deed in the Republic of Singapore)
NOTES TO THE FINANCIAL STATEMENTSFor the financial year ended 31 December 2014
2. Significant accounting policies (continued)
(c) Investments (continued)
(iii) Derecognition
Investments are derecognised on the trade date of disposal. The resultant realised gains and losses on the sale of investments are computed on the basis of the difference between the weighted average cost and selling price gross of transaction costs, and are taken up in the Statement of Total Return.
(d) Basis of valuation of investments
The fair value of financial assets and liabilities traded in active markets is based on quoted market prices at the close of trading on the reporting date. The quoted market price used for investments held by the Fund is the last traded market price for both financial assets and financial liabilities where the last traded price falls within the bid-ask spread. In circumstances where the last traded price is not within the bid-ask spread, the Manager will determine the point within the bid-ask spread that is most representative of fair value.
(e) Foreign currency translation
(i) Functional and presentation currency
The Fund’s investors are mainly from Singapore with the subscriptions and redemptions of the units denominated in Singapore Dollar and United States Dollar.
The performance of the Fund is measured and reported to the investors in Singapore Dollar. The Manager considers the Singapore Dollar to be the currency of the primary economic environment in which the Fund operates. The financial statements are presented in Singapore Dollar, which is the Fund’s functional and presentation currency.
(ii) Transactions and balances
Foreign currency transactions are translated into the functional currency using the exchange rates prevailing at the dates of the transactions. Foreign exchange gains and losses resulting from the settlement of such transactions and from the translation at year-end exchange rates of monetary assets and liabilities denominated in foreign currencies are recognised in the Statement of Total Return. Translation differences on non-monetary financial assets and liabilities such as equities are also recognised in the Statement of Total Return within the net gain or loss on investments.
21
United Singapore Growth Fund(Constituted under a Trust Deed in the Republic of Singapore)
NOTES TO THE FINANCIAL STATEMENTSFor the financial year ended 31 December 2014
2. Significant accounting policies (continued)
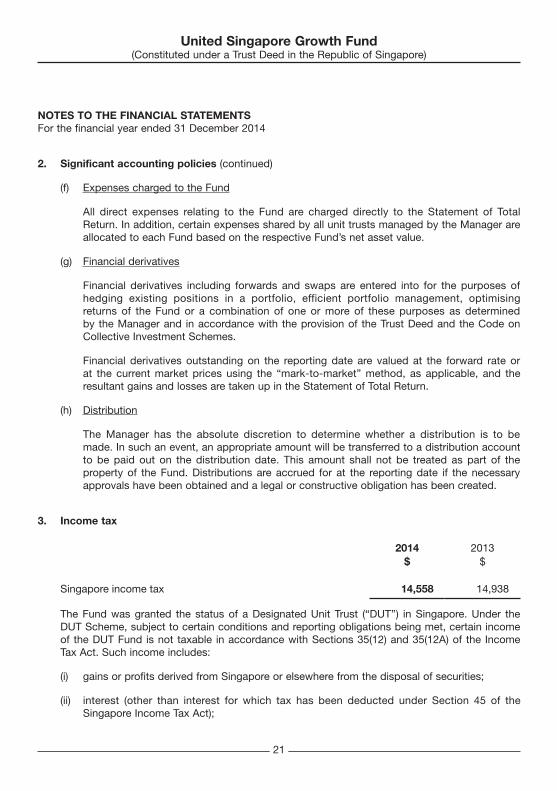
(f) Expenses charged to the Fund
All direct expenses relating to the Fund are charged directly to the Statement of Total Return. In addition, certain expenses shared by all unit trusts managed by the Manager are allocated to each Fund based on the respective Fund’s net asset value.
(g) Financial derivatives
Financial derivatives including forwards and swaps are entered into for the purposes of hedging existing positions in a portfolio, efficient portfolio management, optimising returns of the Fund or a combination of one or more of these purposes as determined by the Manager and in accordance with the provision of the Trust Deed and the Code on Collective Investment Schemes.
Financial derivatives outstanding on the reporting date are valued at the forward rate or at the current market prices using the “mark-to-market” method, as applicable, and the resultant gains and losses are taken up in the Statement of Total Return.
(h) Distribution
The Manager has the absolute discretion to determine whether a distribution is to be made. In such an event, an appropriate amount will be transferred to a distribution account to be paid out on the distribution date. This amount shall not be treated as part of the property of the Fund. Distributions are accrued for at the reporting date if the necessary approvals have been obtained and a legal or constructive obligation has been created.
3. Income tax
2014 2013$ $
Singapore income tax 14,558 14,938
The Fund was granted the status of a Designated Unit Trust (“DUT’’) in Singapore. Under the DUT Scheme, subject to certain conditions and reporting obligations being met, certain income of the DUT Fund is not taxable in accordance with Sections 35(12) and 35(12A) of the Income Tax Act. Such income includes:
(i) gains or profits derived from Singapore or elsewhere from the disposal of securities;
(ii) interest (other than interest for which tax has been deducted under Section 45 of the Singapore Income Tax Act);
22
United Singapore Growth Fund(Constituted under a Trust Deed in the Republic of Singapore)
NOTES TO THE FINANCIAL STATEMENTSFor the financial year ended 31 December 2014
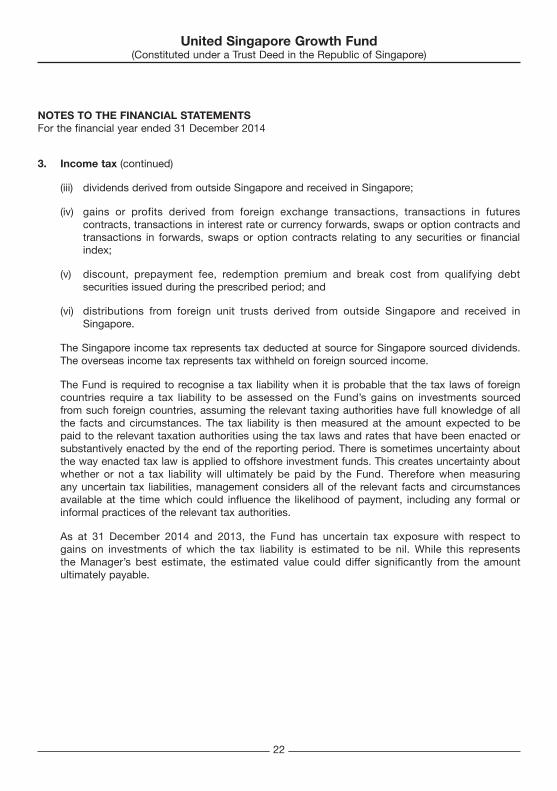
3. Income tax (continued)
(iii) dividends derived from outside Singapore and received in Singapore;
(iv) gains or profits derived from foreign exchange transactions, transactions in futures contracts, transactions in interest rate or currency forwards, swaps or option contracts and transactions in forwards, swaps or option contracts relating to any securities or financial index;
(v) discount, prepayment fee, redemption premium and break cost from qualifying debt securities issued during the prescribed period; and
(vi) distributions from foreign unit trusts derived from outside Singapore and received in Singapore.
The Singapore income tax represents tax deducted at source for Singapore sourced dividends. The overseas income tax represents tax withheld on foreign sourced income.
The Fund is required to recognise a tax liability when it is probable that the tax laws of foreign countries require a tax liability to be assessed on the Fund’s gains on investments sourced from such foreign countries, assuming the relevant taxing authorities have full knowledge of all the facts and circumstances. The tax liability is then measured at the amount expected to be paid to the relevant taxation authorities using the tax laws and rates that have been enacted or substantively enacted by the end of the reporting period. There is sometimes uncertainty about the way enacted tax law is applied to offshore investment funds. This creates uncertainty about whether or not a tax liability will ultimately be paid by the Fund. Therefore when measuring any uncertain tax liabilities, management considers all of the relevant facts and circumstances available at the time which could influence the likelihood of payment, including any formal or informal practices of the relevant tax authorities.
As at 31 December 2014 and 2013, the Fund has uncertain tax exposure with respect to gains on investments of which the tax liability is estimated to be nil. While this represents the Manager’s best estimate, the estimated value could differ significantly from the amount ultimately payable.
23
United Singapore Growth Fund(Constituted under a Trust Deed in the Republic of Singapore)
NOTES TO THE FINANCIAL STATEMENTSFor the financial year ended 31 December 2014
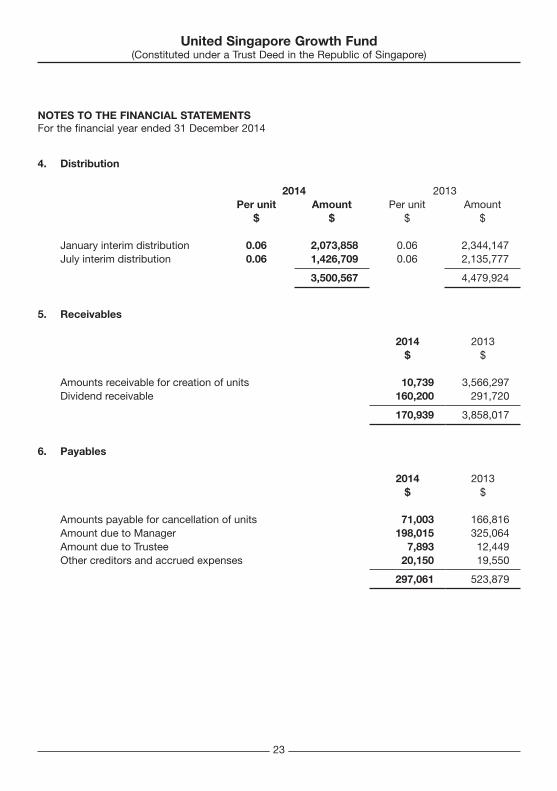
4. Distribution
2014 2013Per unit Amount Per unit Amount
$ $ $ $
January interim distribution 0.06 2,073,858 0.06 2,344,147July interim distribution 0.06 1,426,709 0.06 2,135,777
3,500,567 4,479,924
5. Receivables
2014 2013$ $
Amounts receivable for creation of units 10,739 3,566,297 Dividend receivable 160,200 291,720
170,939 3,858,017
6. Payables
2014 2013$ $
Amounts payable for cancellation of units 71,003 166,816 Amount due to Manager 198,015 325,064 Amount due to Trustee 7,893 12,449 Other creditors and accrued expenses 20,150 19,550
297,061 523,879
24
United Singapore Growth Fund(Constituted under a Trust Deed in the Republic of Singapore)
NOTES TO THE FINANCIAL STATEMENTSFor the financial year ended 31 December 2014
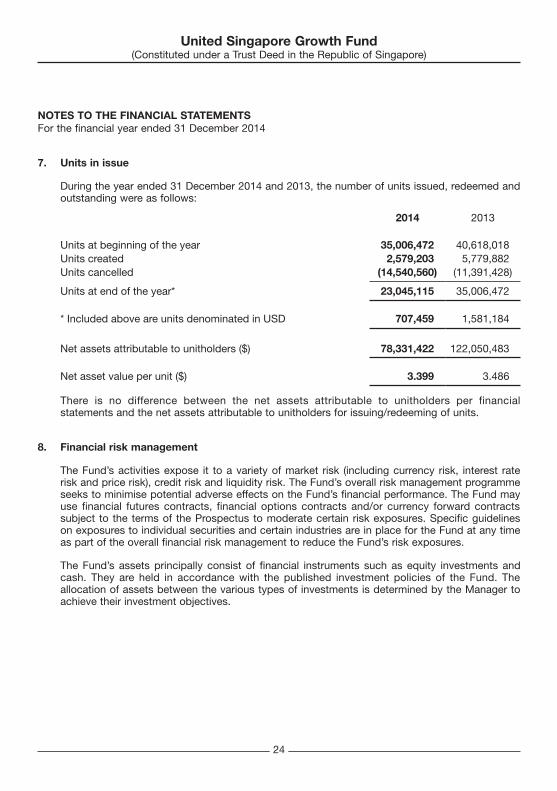
7. Units in issue
During the year ended 31 December 2014 and 2013, the number of units issued, redeemed and outstanding were as follows:
2014 2013
Units at beginning of the year 35,006,472 40,618,018 Units created 2,579,203 5,779,882 Units cancelled (14,540,560) (11,391,428)
Units at end of the year* 23,045,115 35,006,472
* Included above are units denominated in USD 707,459 1,581,184
Net assets attributable to unitholders ($) 78,331,422 122,050,483
Net asset value per unit ($) 3.399 3.486
There is no difference between the net assets attributable to unitholders per financial statements and the net assets attributable to unitholders for issuing/redeeming of units.
8. Financial risk management
The Fund’s activities expose it to a variety of market risk (including currency risk, interest rate risk and price risk), credit risk and liquidity risk. The Fund’s overall risk management programme seeks to minimise potential adverse effects on the Fund’s financial performance. The Fund may use financial futures contracts, financial options contracts and/or currency forward contracts subject to the terms of the Prospectus to moderate certain risk exposures. Specific guidelines on exposures to individual securities and certain industries are in place for the Fund at any time as part of the overall financial risk management to reduce the Fund’s risk exposures.
The Fund’s assets principally consist of financial instruments such as equity investments and cash. They are held in accordance with the published investment policies of the Fund. The allocation of assets between the various types of investments is determined by the Manager to achieve their investment objectives.

25
United Singapore Growth Fund(Constituted under a Trust Deed in the Republic of Singapore)
NOTES TO THE FINANCIAL STATEMENTSFor the financial year ended 31 December 2014
8. Financial risk management (continued)
(a) Market risk
Market risk is the risk of loss arising from uncertainty concerning movements in market prices and rates, including observable variables such as interest rates, credit spreads, exchange rates, and others that may be only indirectly observable such as volatilities and correlations. Market risk includes such factors as changes in economic environment, consumption pattern and investor’s expectation etc. which may have significant impact on the value of the investments. The Fund’s investments are substantially dependent on changes in market prices. The Fund’s investments are monitored by the Manager on a regular basis so as to assess changes in fundamentals and valuation. Although the Manager makes reasonable efforts in the choice of investments, events beyond reasonable control of the Manager could affect the prices of the underlying investments and hence the asset value of the Fund. Guidelines are set to reduce the Fund’s risk exposures to market volatility such as diversifying the portfolio by investing across various geographies, alternatively, the Fund may be hedged using derivative strategies.
(i) Foreign exchange risk
The Fund has monetary financial assets and liabilities denominated in currencies other than the Singapore Dollar and it may be affected favourably or unfavourably by exchange rate regulations or changes in the exchange rates between the Singapore Dollar and such other currencies. The Manager may at his discretion, implement a currency management strategy either to reduce currency volatility or to hedge the currency exposures of the Fund.
The table below summarises the Fund’s exposure to foreign currencies as of the end of the financial year.
As at 31 December 2014
SGD USD Total $ $ $
AssetsPortfolio of investments 73,611,200 4,318,501 77,929,701 Receivables 170,939 - 170,939 Sales awaiting settlement 410,327 - 410,327 Cash and bank balances 90,786 26,730 117,516
Total Assets 74,283,252 4,345,231 78,628,483
Liabilities Payables 279,447 17,614 297,061
Total Liabilities 279,447 17,614 297,061
Net currency exposure 74,003,805 4,327,617
26
United Singapore Growth Fund(Constituted under a Trust Deed in the Republic of Singapore)
NOTES TO THE FINANCIAL STATEMENTSFor the financial year ended 31 December 2014
8. Financial risk management (continued)
(a) Market risk (continued)
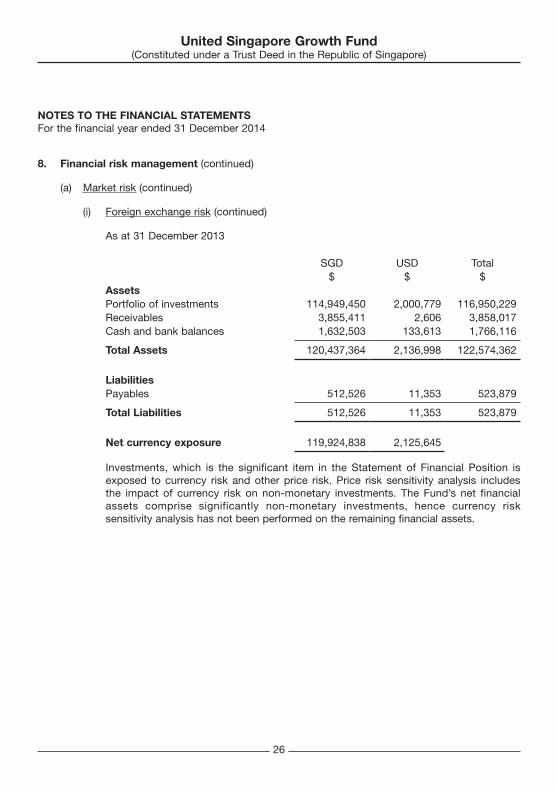
(i) Foreign exchange risk (continued)
As at 31 December 2013
SGD USD Total$ $ $
AssetsPortfolio of investments 114,949,450 2,000,779 116,950,229 Receivables 3,855,411 2,606 3,858,017 Cash and bank balances 1,632,503 133,613 1,766,116
Total Assets 120,437,364 2,136,998 122,574,362
Liabilities Payables 512,526 11,353 523,879
Total Liabilities 512,526 11,353 523,879
Net currency exposure 119,924,838 2,125,645
Investments, which is the significant item in the Statement of Financial Position is exposed to currency risk and other price risk. Price risk sensitivity analysis includes the impact of currency risk on non-monetary investments. The Fund’s net financial assets comprise significantly non-monetary investments, hence currency risk sensitivity analysis has not been performed on the remaining financial assets.
27
United Singapore Growth Fund(Constituted under a Trust Deed in the Republic of Singapore)
NOTES TO THE FINANCIAL STATEMENTSFor the financial year ended 31 December 2014
8. Financial risk management (continued)
(a) Market risk (continued)
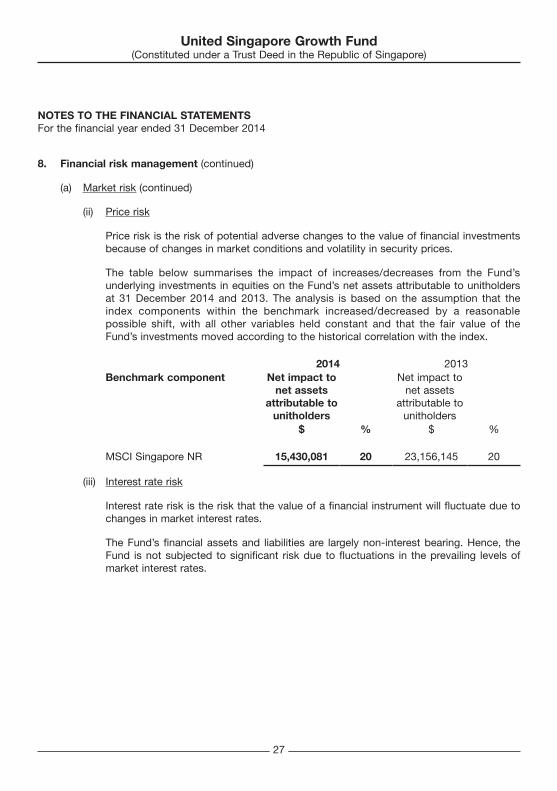
(ii) Price risk
Price risk is the risk of potential adverse changes to the value of financial investments because of changes in market conditions and volatility in security prices.
The table below summarises the impact of increases/decreases from the Fund’s underlying investments in equities on the Fund’s net assets attributable to unitholders at 31 December 2014 and 2013. The analysis is based on the assumption that the index components within the benchmark increased/decreased by a reasonable possible shift, with all other variables held constant and that the fair value of the Fund’s investments moved according to the historical correlation with the index.
2014 2013Benchmark component Net impact to
net assets attributable to
unitholders
Net impact tonet assets
attributable tounitholders
$ % $ %
MSCI Singapore NR 15,430,081 20 23,156,145 20
(iii) Interest rate risk
Interest rate risk is the risk that the value of a financial instrument will fluctuate due to changes in market interest rates.
The Fund’s financial assets and liabilities are largely non-interest bearing. Hence, the Fund is not subjected to significant risk due to fluctuations in the prevailing levels of market interest rates.

28
United Singapore Growth Fund(Constituted under a Trust Deed in the Republic of Singapore)
NOTES TO THE FINANCIAL STATEMENTSFor the financial year ended 31 December 2014
8. Financial risk management (continued)
(b) Liquidity risk
The Fund is exposed to daily cash redemptions and disbursements for the settlements of purchases. The Manager therefore ensures that the Fund maintains sufficient cash and cash equivalents and that it is able to obtain cash from the sale of investments held to meet its liquidity requirements. Reasonable efforts will be taken to invest in securities which are traded in a relatively active market and which can be readily disposed of.
The Fund’s investments in listed securities are considered to be readily realisable as they are listed on an established stock exchange.
The table below analyses the Fund’s financial liabilities into relevant maturity groupings based on the remaining period at the reporting date to the contractual maturity date. The amounts in the table are the contractual undiscounted cash flows. Balances due within 12 months equal their carrying balances, as the impact of discounting is not significant.
As at 31 December 2014Less than3 months
$
Payables 297,061
As at 31 December 2013Less than3 months
$
Payables 523,879
(c) Credit risk
The Fund takes on exposure to credit risk, which is the risk that a counterparty will be unable to pay amounts in full when due. The Fund’s credit risk is concentrated on amounts or securities receivable on the sale and purchase of investments respectively. In order to mitigate exposure to credit risk, all transactions in listed securities are settled/paid for upon delivery and transacted with approved counterparties using an approved list of brokers that are regularly assessed and updated by the Manager.

29
United Singapore Growth Fund(Constituted under a Trust Deed in the Republic of Singapore)
NOTES TO THE FINANCIAL STATEMENTSFor the financial year ended 31 December 2014
8. Financial risk management (continued)
(c) Credit risk (continued)
The table below summarises the credit rating of banks and custodians in which the Fund’s assets are held as at 31 December 2014 and 2013.
The credit ratings are based on the Bank Financial Strength ratings published by the rating agency.
As at 31 December 2014Source of
Credit rating credit rating
BankState Street Bank & Trust Co. B- Moody'sUnited Overseas Bank Limited B Moody's
CustodianState Street Bank & Trust Co. B- Moody’s
As at 31 December 2013Source of
Credit rating credit rating
BankState Street Bank & Trust Co. B- Moody’sUnited Overseas Bank Limited B Moody’s
CustodianState Street Bank & Trust Co. B- Moody’s
The maximum exposure to credit risk at the reporting date is the carrying amount of the financial assets.
(d) Capital management
The Fund’s capital is represented by the net assets attributable to unitholders. The Fund strives to invest the subscriptions of redeemable participating units in investments that meet the Fund’s investment objectives while maintaining sufficient liquidity to meet unitholders’ redemptions.

30
United Singapore Growth Fund(Constituted under a Trust Deed in the Republic of Singapore)
NOTES TO THE FINANCIAL STATEMENTSFor the financial year ended 31 December 2014
8. Financial risk management (continued)
(e) Fair value estimation
The fair value of financial assets and liabilities traded in active markets (such as publicly traded derivatives and trading securities) are based on quoted market prices at the close of trading on the reporting date. The quoted market price used for both financial assets and financial liabilities is the last traded market prices.
The Fund classifies fair value measurements using a fair value hierarchy that reflects the significance of the inputs used in making the measurements. The fair value hierarchy has the following levels:
• Quoted prices (unadjusted) in active markets for identical assets or liabilities (Level 1).• Inputs other than quoted prices included within Level 1 that are observable for the
asset or liability, either directly (that is, as prices) or indirectly (that is, derived from prices) (Level 2).
• Inputs for the asset or liability that are not based on observable market data (that is, unobservable inputs) (Level 3).
The following table analyses within the fair value hierarchy the Fund’s financial assets and liabilities (by class) measured at fair value at 31 December 2014 and 2013:
As at 31 December 2014 Level 1 Level 2 Level 3 Total$ $ $ $
AssetsFinancial assets at fair value through profit or loss- Quoted equities 77,929,701 - - 77,929,701
As at 31 December 2013 Level 1 Level 2 Level 3 Total$ $ $ $
AssetsFinancial assets at fair value through profit or loss- Quoted equities 116,950,229 - - 116,950,229

31
United Singapore Growth Fund(Constituted under a Trust Deed in the Republic of Singapore)
NOTES TO THE FINANCIAL STATEMENTSFor the financial year ended 31 December 2014
8. Financial risk management (continued)
(e) Fair value estimation (continued)
Investments whose values are based on quoted market prices in active markets, and therefore classified within Level 1, comprise active listed equities. The Fund does not adjust the quoted price for these instruments.
Except for cash and cash equivalents which are classified as Level 1, the Fund’s assets and liabilities not measured at fair value at 31 December 2014 and 2013 have been classified as Level 2. The carrying amounts of these assets and liabilities approximate their fair values as at the Statement of Financial Position date.
9. Related party transactions
(a) The Manager and the Trustee of the Fund are UOB Asset Management Ltd and HSBC Institutional Trust Services (Singapore) Limited respectively. UOB Asset Management Ltd is a subsidiary of United Overseas Bank Limited and HSBC Institutional Trust Services (Singapore) Limited is a subsidiary of HSBC Holdings Plc.
Management fee is paid to the Manager, while trustee fee is paid to the Trustee and the registrar fee is paid to HSBC Institutional Trust Services (Singapore) Limited, a subsidiary of HSBC Holdings Plc. These fees paid or payable by the Fund shown in the Statement of Total Return and in the respective Notes to the Financial Statements are on terms set out in the Trust Deed. All other related party transactions are shown elsewhere in the financial statements.
(b) As at the end of the financial year, the Fund maintained the following accounts with a related party:
2014 2013$ $
United Overseas Bank LimitedBank balances 28,837 52,978
(c) The following transactions took place during the financial year between the Fund and United Overseas Bank Limited at terms agreed between the parties:
2014 2013$ $
Bank charges 30 30
32
United Singapore Growth Fund(Constituted under a Trust Deed in the Republic of Singapore)
NOTES TO THE FINANCIAL STATEMENTSFor the financial year ended 31 December 2014
9. Related party transactions (continued)
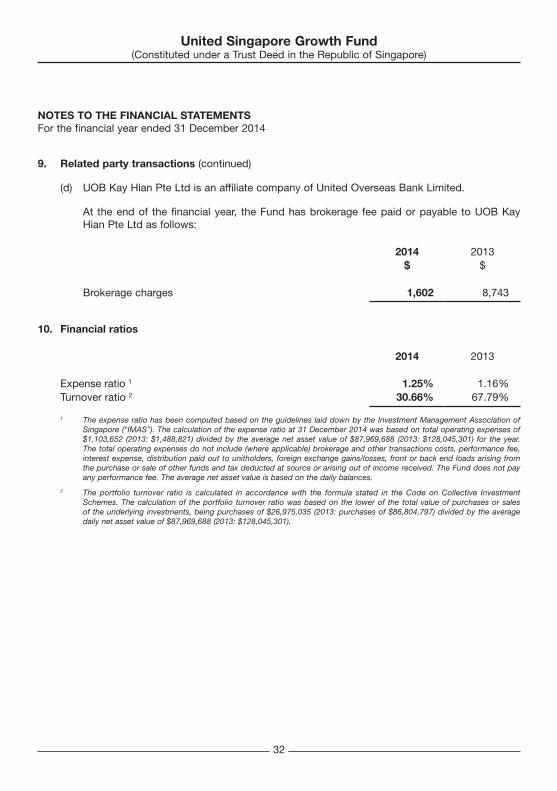
(d) UOB Kay Hian Pte Ltd is an affiliate company of United Overseas Bank Limited.
At the end of the financial year, the Fund has brokerage fee paid or payable to UOB Kay Hian Pte Ltd as follows:
2014 2013$ $
Brokerage charges 1,602 8,743
10. Financial ratios
2014 2013
Expense ratio 1 1.25% 1.16%Turnover ratio 2 30.66% 67.79%
1 The expense ratio has been computed based on the guidelines laid down by the Investment Management Association of Singapore (“IMAS”). The calculation of the expense ratio at 31 December 2014 was based on total operating expenses of $1,103,652 (2013: $1,488,821) divided by the average net asset value of $87,969,688 (2013: $128,045,301) for the year. The total operating expenses do not include (where applicable) brokerage and other transactions costs, performance fee, interest expense, distribution paid out to unitholders, foreign exchange gains/losses, front or back end loads arising from the purchase or sale of other funds and tax deducted at source or arising out of income received. The Fund does not pay any performance fee. The average net asset value is based on the daily balances.
2 The portfolio turnover ratio is calculated in accordance with the formula stated in the Code on Collective Investment Schemes. The calculation of the portfolio turnover ratio was based on the lower of the total value of purchases or sales of the underlying investments, being purchases of $26,975,035 (2013: purchases of $86,804,797) divided by the average daily net asset value of $87,969,688 (2013: $128,045,301).

