united scientific supplies, inc. operation and...
TRANSCRIPT

ZEEMANEFFECTAPPARATUS
1. IntroductionThis apparatuswasdesigned formodernphysics labs atuniversities and colleges. It demonstrates theinfluence of a magnetic field on light emitted in a gas discharge, the Zeeman effect, and shows thequantumnatureoflightandthebehaviorofelectronsinatomsemittinglight.Amercurydischargelampisplacedbetweenthepolepiecesofapowerfulelectromagnetandaninterferencefilterselectsthegreenemissionlineat546.1nm.Theresultinglightbeamispassedtoahighresolution,fixedseparationFabry-Pérotétalonwhose interferencepatterniscapturedbyaCCDcameraandpassedtoacomputer,wherespecial software analyzes the changes observed as themagnetic field is varied. Light can be observedbothparallelandtransversetothemagneticfield,andfiltersallowthepolarizationstatesoftheemittedlinestobeinvestigated.StudentscancollectdataandanalyzeittodeterminethelightwavelengthshiftΔλ,aswellase/mforboundelectronsinanatom.
2. SpecificationsLamp: Mercurydischargelamp,slimdesign,poweredA.C.,1500Vp-p,5W Observedemissionline:3S1(6s7s)->5P2(6s7s)atλ=546.1nm
Electromagnet: Built-incurrent-controlled power supply,90VDC,0-5–1.4A,withanalogammeter Magnetrotatable90°fortransverseorlongitudinalviewing Maximummagneticfieldatlampposition:B=1.3T
Fabry-PérotEtalon: Aperture:40mm Separationofquartzplates:d=2.0mm Highreflectionbandwidth:100nm Centralwavelength:589.3nm
UNITED SCIENTIFIC SUPPLIES, INC. OPERATION AND EXPERIMENT GUIDE

InterferenceFilter: Centralwavelength:546.1nm Transmissionbandwidth:≤10nmPeaktransmission:≥50%
CollimatingLens: Aperture:37mm Focallength:110mm
Environmental: Operatinglimits:0-40°C(32-104°F),relativehumidity�85% Choosealocationfreefromvibrationorelectromagneticinterference
PowerInput: 110VAC/60Hz,190W
CareofApparatus
• TheZeemanEffectApparatusshouldbeusedinadrycleanroomwithgoodventilation.
• Donottouchanyopticalpartwithyourhand.Toremovedustordirt,useaphotographiclensbrush,orblowthedustoffwithcannedair.Donotusecompressedairfromanairlineasthisfrequentlycontainsoildroplets,whichwillcontaminatethesurfaceoftheopticalparts.Stubborndirtmayberemovedbygentlycleaningthesurfacewithacottonballsoakedina1:1mixtureofdenaturedalcoholandether.
• Toprolongthelifeofthemercurylampavoidturningitonandofffrequently.
• Whenapplyingthemagneticfield,increasethecurrentslowlyandavoidleavingthepotentiometerinthezonemarkedbyyellowdotsforlongperiods.Thiswillavoidexcessiveheatgenerationinthemagnet.
3. BasicTheoryAtoms emit or absorb energies in “packets”, or “quanta” which are photons. The orbital motion ofelectrons inanatom,givesrisetotinymagneticdipoles,eachhavingamagneticmoment,μ=(e/2m)L,whereeandmarechargeandrestmassofanelectronandLisitsorbitalangularmomentum. Sincethechargeonanelectronisnegative,μandLareanti-parallel.ForagivenL,therecouldbe(2l+1)orientationsinspace.Thusμtoohas(2l+1)orientationsinspace.Thisisshowninthediagram below:
It shows the allowed values of Lz, for l=1, 2 and10. Thenumberson the z-axis are the values of themagnetic quantum numberml. The figures are drawn to different scales. In the absence of an externalmagnetic field, there is spherical symmetry to the electron distributions (circular orbits of electronsrevolvingroundthenucleus). Ifweapplyanexternal magneticfield,however,thissphericalsymmetrygetsbrokenbecausethemagneticfieldgives auniquedirection,say,alongthez-axis,whichgivesriseto

theZeemaneffect.ThefigurebelowshowstheZeemaneffect. Intheabsenceof themagnetic fieldB,anatomic level with l = 2 (and no spin moment) becomes 5-fold degenerate with energy E0. When B isswitched“on”the levelsplitsinamultipletof5equallyspacedlevels.
Inthepicturebelow,atransitionbetweenanexcitedstateofHelium(l=1)andtheground state(l=0)isdepictedwithfield“off”and“on”. WithB“on”,thereare3distincttransitions possibleduetotheZeemansplittingandhence3distinctspectrallines(triplet)asshown,with differentfrequencies.
AnAdditionalComplication:TheLandegFactorAgain,asanatomicelectronorbitsaroundthenucleus,itproducesamagneticmoment:
μl=-g(e/2m)Lwheregisaconstantcalledthegyromagneticratio,ortheLandeg-factor fororbitalangularmomentum.Anatomicelectronalsohasanintrinsicangularmomentum–spin(S),andsowewouldexpectittoalsohaveamagneticmoment,μs, Thismagneticmomentduetothespinmotionis proportionaltoS,or,
μs =-gs(e/2m)Swhere gs is a constant called the spin gyromagnetic ratio, or the Lande g-factor for spin. In the case oforbital motion,thegyromagneticratiois1.Experimentshowsthatthespingyromagneticratiois2.Thetotalmagneticmomentofanyelectronisjustthesumofitsorbitalandspinmagnetic moments:
μtotal=μl+μs=-e/2m{L+2S}Forhistoricalreasons,thesplittingoflevelsandspectrallinesduetothevariousorbitalmlvaluesiscalledthenormalZeemaneffect.Incaseswherespindoes contribute,wehavetheanomalousZeemaneffect.Forexample,thesplittingoftheHeline (transitionfroml=1tol=0levelshowninthebottomfigureonthepreviouspage)ofenergy21.1eVintoatripletisanexampleofnormalZeemaneffect,sincespinplaysnopart in it. On the other hand the Zeeman pattern that you are studying for the 546 nm transitions inmercury is an example of the anomalous Zeeman effect, where spin does play an important role.Consequently,wedoneedtotakeintoaccounttheg-factorsforthetwolevelsinvolvedinthe transition.TheanomalousZeemaneffectinamercuryatomByapplyinganexternalmagneticfieldB,onecanchangeanatom’senergylevelbyanamount equaltothe

Figure
workdonebythefieldBinrotatingthesetinymagneticdipolesuntiltheybecome paralleltothefieldB.Theworkis
W=-μBThisimpliesthattheenergiesofthephotonsemittedorabsorbedbytheatomwillchangeinamagneticfield. The Netherlands physicist Pieter Zeeman, who received the 1902 Nobel Prize in Physics, firstobservedthiseffect.Zeeman’s isoneofthelandmarkexperimentsinModernPhysicsanditbringsintofocusquantumnatureofatomicandsubatomicworld.Theenergyof suchbound systems isquantized.Theangularmomentumhasasetofpossible orientations—thespaceisalsoquantized.
Keepingthingssimpleforthemoment,inordertoappreciatethisveryimportantand somewhatabstractconceptof“spacequantization”, letusconsiderHe-atom:thereare2 electronsandthespinscancelout.Theseareknownassingletstates.ForHe,oneofthe electronshaszeroorbitalangularmomentumandsothemagneticmomentμ=-(e/2m)Lisduetotheorbitalmotionofthesecondelectronalone.Forthissecondelectron,theangular momentumquantumnumber,l,cantakethevalues,
l=0,1,2,3,……Lhas(2l+1)possibledifferentorientations,correspondingto(2l+1)-valuesofLz=z-component ofL=mlħ,withml=l,l-1,………-l.IntheabsenceofthemagneticfieldB,theenergyissamefor allthesestateswithdifferentm-values.Theenergy levelE0 is(2l+1)-folddegenerate.Whenthefield ison, thedegeneracy is“lifted”andtheenergybecomes,
E=E0+ΔEwhere ΔE=-μB=(e/2m)LzB=(eħ/2m)mlB
When a light-emitting atom is subjected to a magnetic field, its emission lines are split into multiplecomponents at slightly shifted wavelengths. The atomic magnetic moments along a given axis arequantized,andassumedefinedorientationswhensubjectedtoamagneticfield.Intheseorientations,theatoms’boundelectronshavedifferentenergiesthaninthezero-fieldstate,theamountofthedifferencedepending on which of the several allowed orientations an electron assumes. Each energy level istherefore now split into several sub-levels, and transitions between levelswhichwere all of the sameenergy at zero field regardless of the electron orientation have now become a series of different,orientation-dependent transitionsat slightlydifferingenergies.This isexperiencedasasplittingof theobservedspectrallineonimposingamagneticfield.Thetransitionswhichcanbeobservedinamagneticfield are governedby the selection rule for themagneticquantumnumberM, namely that for allowedtransitionsΔM=0or±1,andalsobythestateofpolarizationoftheemittedlight.Linearlypolarizedlightis observed in a direction transverse to the magnetic field, while circularly polarized light is emittedparalleltothefield.Inthisapparatus,thespectrallineobservedisthegreenlineofmercuryat546.1nm,whichsplitsintoninecomponents(Figure1).ThedistributionoftheobservablelinesinamagneticfieldisshowninTable1.
ΔM PerpendiculartoField
ParalleltoField
+1 Linearlypolarized–σ+
Circularlypolarized–σ+0 Linearly
polarized–π
Nolight
-1 Linearlypolarized–σ-
Circularlypolarized–σ-
Table1 Figure 1
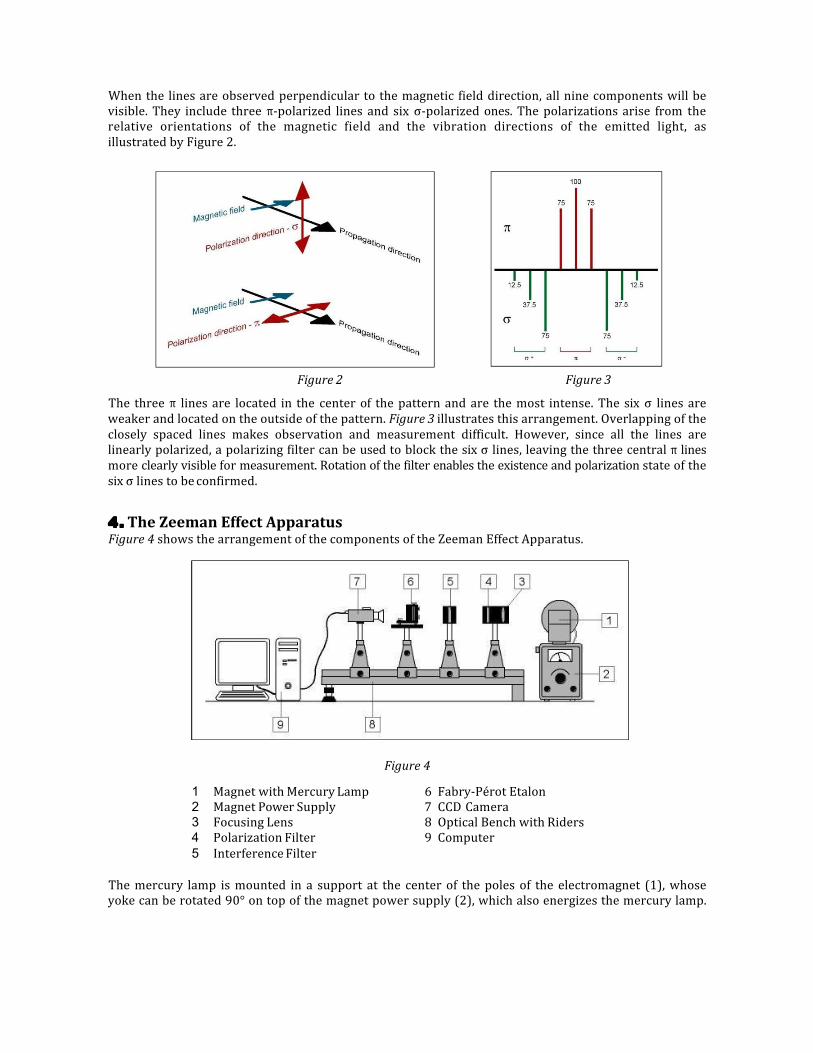
Whenthe linesareobservedperpendiculartothemagnetic fielddirection,allninecomponentswillbevisible.They include three π-polarized lines and six σ-polarizedones. Thepolarizationsarise from therelative orientations of the magnetic field and the vibration directions of the emitted light, asillustratedbyFigure2.
Figure2Figure3
The threeπ linesare located in the centerof thepatternandare themost intense.The six σ linesareweakerandlocatedontheoutsideofthepattern.Figure3illustratesthisarrangement.Overlappingoftheclosely spaced lines makes observation and measurement difficult. However, since all the lines arelinearlypolarized,apolarizingfiltercanbeusedtoblockthesixσlines,leavingthethreecentralπlinesmoreclearlyvisibleformeasurement.Rotationofthefilterenablestheexistenceandpolarizationstateofthesixσlinestobeconfirmed.
4. TheZeemanEffectApparatusFigure4showsthearrangementofthecomponentsoftheZeemanEffectApparatus.
Figure4
1 MagnetwithMercuryLamp 6Fabry-PérotEtalon2 MagnetPowerSupply 7CCDCamera3 FocusingLens 8OpticalBenchwithRiders4 PolarizationFilter 9Computer5 InterferenceFilter
Themercury lamp ismounted in a support at the center of thepoles of the electromagnet (1),whoseyokecanberotated90°ontopofthemagnetpowersupply(2),whichalsoenergizesthemercurylamp.

Lightfromthelampisfocusedbyalens(3)andpassessuccessivelythrougharotatablepolarizationfilter(4)andaninterferencefilter(5),whichselectsthegreenlineat546.1nm,beforefallingonaFabry-Pérotétalon(6).Theétalongeneratesaninterferencepatternofconcentricrings,whichisobservedbyaCCDcamera (7). The optical elements (3) through (7) are mounted on an optical bench (8) for easyadjustment;carefulalignmentoftheopticalarrangementsignificantlyimprovestheinterferencepatternandtheaccuracyoftheresults.ThesignalfromtheCCDcameraispassedtothecomputer(9).SettingUp(Somepartsalreadydone)
• Mount the four riders onto the optical bench and fit the lensandpolarizationfilter,étalon,interferencefilter,andCCDcameraontotheridersasshowninFigure4.• Position the riders on the benchwith the support rods atapproximatelythefollowingseparations:Frontofmagnetyokebase–polarizingfilter:15cmPolarizingfilter-interferencefilter:6cmInterferencefilter–étalonsupporttable:10cmÉtalonsupporttable-CCDcamera–15cm• Carefully adjust the heights of the polarization filter,interference filter,andCCDcamerasothattheircentersarealignedwiththecenterofthemercury lampandclamptheminplace.Fixtheadjustedheightswiththepositioningringsonthesupportrods(see the left figure). This allows the optical elements to be easilyremovedandreplacedaccurately.• PlacetheFabry-Pérotétalononthesupporttable,orientedwiththethreeplateadjustingscrewsonthelampsideandthesingletiltadjustmentscrewonthecameraside.Makesuretheétaloniscenteredontheopticalaxisandsquaretoit.Donotadjusttheplateadjustmentscrews.
OptimizingtheInterferencePatternTheprocedurefordeterminingΔλande/minvolvesmeasuringthediametersofconcentriccircleswhichdifferonlyslightly.Preciseadjustmentoftheopticalsetuptoyieldproperlycenteredandundistortedcircularfringesisimportant for obtaining an accurate result. To obtain a good interference pattern, attention should bepaidtothefollowingfactors:
• EvenilluminationoftheFabry-Pérotétalon.
• Carefulpositioningof thevariousopticalelementsso theyarecenteredalongtheopticalaxisof thesetupandcorrectlyalignedabouttheirverticalaxes.
• PreciseparallelismoftheFabry-Pérotétalonmirrors.
• Optimalfocusandapertureofthecamera.Aligningthesetup:
Check that the centers of the lamp, lens, filter, andétalon are collinear and that each element isperpendiculartotheopticalaxis.Adjustthepositionof the lensalong thebench tomaximize the sizeofthe illuminated area of the étalon. View the étalonfrom the rearandadjust thepositionandheightoftheendofthebenchsothattheinterferencepatterniscenteredintheétalonmirror.
Adjustingthecamera:
Mountthecameraontotheopticalbench,connectittothecomputerandstartthe“EOSUtility”software(click on “Camera settings/Remote shooting”, check the settings are “1, F5.6, 100”, click on “Live viewshoot…”).TheFabry-Pérotfringesarelocatedatinfinity,sothecamerafocusringshouldbeadjustedfordistant viewing. The camera can now bemoved along the bench as close to the back of the étalon aspossibletoexcludedisturbingambientlightandincreasethecontrastinthemonitorimage.Optimizetheimagebyadjustingthefocusandapertureringsasnecessary.
Viewingthepatterns
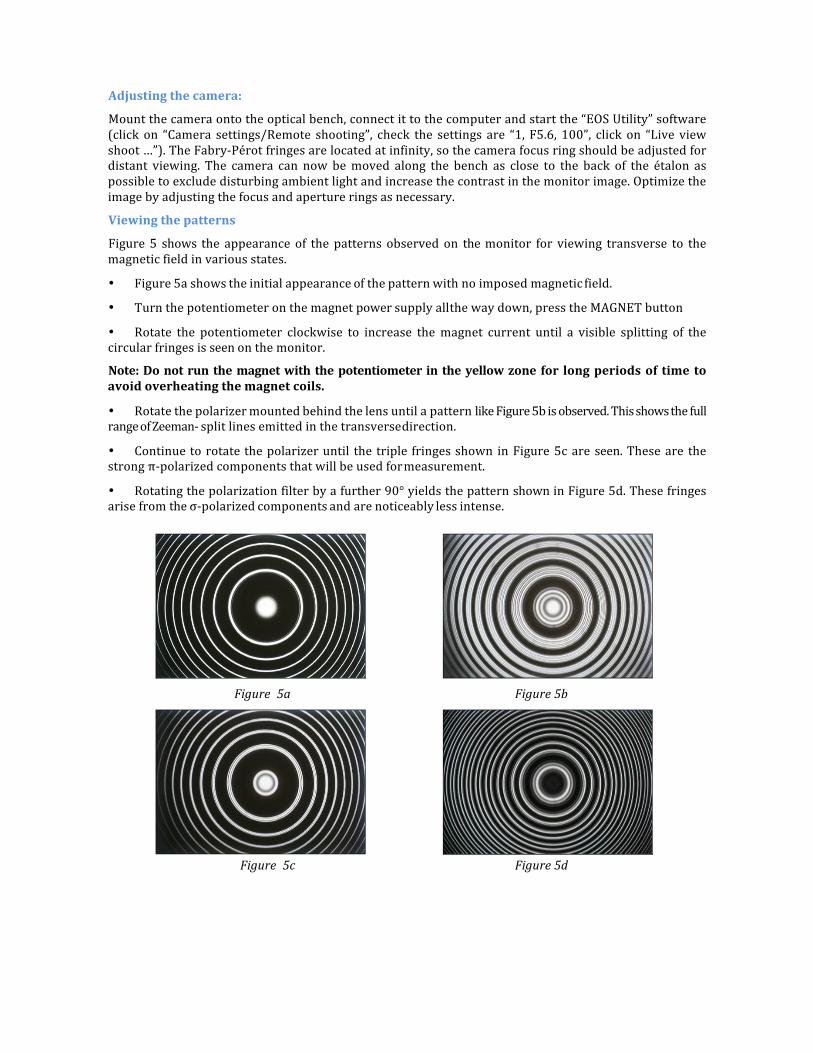
Figure 5 shows the appearance of the patterns observed on themonitor for viewing transverse to themagneticfieldinvariousstates.
• Figure5ashowstheinitialappearanceofthepatternwithnoimposedmagneticfield.
• Turnthepotentiometeronthemagnetpowersupplyallthewaydown,presstheMAGNETbutton
• Rotate the potentiometer clockwise to increase themagnet current until a visible splitting of thecircularfringesisseenonthemonitor.
Note:Donotrunthemagnetwiththepotentiometer intheyellowzone for longperiodsof time toavoidoverheatingthemagnetcoils.
• RotatethepolarizermountedbehindthelensuntilapatternlikeFigure5bisobserved.ThisshowsthefullrangeofZeeman-splitlinesemittedinthetransversedirection.
• Continuetorotatethepolarizeruntil the triplefringesshown inFigure5care seen.Theseare thestrongπ-polarizedcomponentsthatwillbeusedformeasurement.
• Rotatingthepolarizationfilterbyafurther90°yieldsthepatternshowninFigure5d.Thesefringesarisefromtheσ-polarizedcomponentsandarenoticeablylessintense.
Figure 5a Figure5bFigure 5c Figure5d

Savingthetransversepatternforanalysis
• Withthemagnetsetupfortransverseviewing,adjustthepolarizertoobtainaclearpatternofonlythetriplefringesetoftheπ-polarizedemissionasinFigure5c.
• Adjustthemagnetcurrentto1.3Atoyieldclearlyseparatedfringes.• TheEOSsoftwareallowsyoutosavethecapturedpatterninadirectorynamedafterthedateonthedesktopofthecomputer
5. Analysis
Figure6
Figure 6 shows a schematic of the ray paths in the Fabry-Pérot étalon and the focused image at thecamera.Themediumbetweenthetwomirrorsisairwitharefractiveindexof1,soiftheseparationofthemirrorsisd,theopticalpathdifferencebetweentwoadjacentlightbeamsatanangleθis
Δ=2dcosθ.
Forconstructiveinterferencewithlightofwavelengthλ,Δ=kλ,andso
Δ=2dcosθ=kλ
At the center of the pattern, θ = 0 and cosθ = 1. Since cosθ decreaseswith increasing angle from thecenter, the order of interference k is highest at the center of the pattern, and subsequent rings goingoutwardarek-1,k-2,etc.Theraysexitingtheétalonareparallelandwhentheyarefocusedatadistanceffromthecameralens,theincidentangleθispreserved.ThediameterDofaninterferenceringis2f.tanθ(Figure10)andforsmallvaluesofθatthecenterofthepattern,tanθ=θsoθ=D/2f.Approximatingforcosθatsmallangles,weobtainforthekthorderring
2d(1-Dk2/8f2)=kλ (1)
IfthespectrallineunderstudyatfrequencyvisproducedbyanelectrontransitionbetweentwoenergylevelsE2andE1,wehave
hv=E2-E1
InanexternalmagneticfieldB,thepotentialenergyofmagneticdipolemomentis:
E=Mg(eh/4πm)B (2)
whereeandmarethechargeandmassoftheelectron,hisPlanck’sconstant,MisthemagneticquantumnumberandgistheLandéfactor.TheadditionalpotentialenergyshiftstheenergylevelsE1andE2toE1+ΔE1andE2+ΔE2sothenewfrequencyofthetransition,v’isobtainedfrom
hv’=(E2+ΔE2)-(E1+ΔE1)TheshiftΔvinthefrequencyofthelineis
Δv=v-v’=(1/h)(ΔE1-ΔE2)

SubstitutingforΔEfromequation(2)andconvertingfromfrequencytowavelength:
Δλ=(-λ2/c)Δv=(M2g2-M1g1)(λ2/4πc)(e/m)B (3)
Fromequation(1)weobtainforthewavelengthshiftintermsofthekthorderring:
Δλ=λ-λ’=(Dk’2-Dk2)(d/4f2k) (4)
Theeffectivevalueoffcannoteasilybedetermined.Toeliminatef,weintroducethe(k-1)thorderring.Fromequation(1):Subtracting(1)from(5)
2d(1-Dk-12/8f2)=(k -1)λ (5)
d/[4f2(Dk-12-Dk2)]=λ (6)
Solvingequation(6)forf2andsubstitutingintoequation(4): Δλ=(λ/k)(Dk’2-Dk2)/(Dk-12-Dk2) (7)
Fortheringsclosetothecenter,wherecosθ≈1,k≈2d/λ.Substitutinginto(7)gives:
Δλ=(λ2/2d)(Dk’2-Dk2)/(Dk-12 -Dk2) (8)
Combining equations (3) and (8) and rearranging also gives an expression for e/m in terms ofmeasurablequantities:
e/m=[2πc/(dB)][1/(M2g2-M1g1)](Dk’2-Dk2)/(Dk-12 -Dk2) (9)
Analysis isperformedontheπ-polarizedtripletfringesetthatcorrespondstothetransitionsforwhichΔM=0.Table2detailsthemagneticquantumnumbersandLandéfactorsforthesetransitions:
UpperState,3S1
LowerState,5P2
Δ
M
1 1 0
0 0 0
-1 -1 0
g 2 3/2 n/a
Mg
2 3/2 -1/2
0 0 0
-2 -3/2 +1/2
Table2
Comparing thevaluesofΔ(Mg) for these transitionswith the corresponding term inequation (3), it isclear that the wavelength of the central fringe remains unshifted while the outer two are displacedsymmetricallybyanamount1/2(λ2/4πc) (e/m)B.Thisallowsus touse thediametersof twocentrallinesinadjacentordersasDkandDk-1,andthediametersoftheouterlinesasDk’inequation(8)and(9)todetermineΔλande/m.

Appendix1:UsingtheZeemanEffectSoftware
IntroductionTheLabviewprogram“Zeeman”consistsoftwoseparatepages,ortabs.Theyarelisted asFitData,andData.Thefirstpage“FitData”willbewhereyoudothebulkofyourwork.Itis herethatyouwillloadaJPGimageof the rings anddetermine thediametersof the rings in arbitraryunits (in this case, number ofpixels).Thesecondpage“Data”willlist theradiusoftheringsusingthedataonthefirstpage.
OpeningtheImageWiththeprogramopen,firstselecttheJPGyouwishtoanalyzebyclickingonthefoldericonto therightofthetextboxontheFitDatapage.Thiswillopenthebrowser,whereyoucanlocate andselecttheimage.WiththeimagepathloadedintotheFilePathtextbox,youcanruntheprogram.Torun theprogram,click the right arrow located on the top of the programwindow just below themenu selectionitems.Thiswillbethe leftmostbutton justbelow 'Edit'.With theprogramrunning,youshouldseeanimageappearinthecenteroftheprogram.
ImageAdjustmentsOnthefarleftsideoftheimagescreentherearefourbuttons.Thesearemagnify,select, pan,andcursorbuttons.Withthemagnifybuttonselected,youcanclickanywhereonthe imageandtheimagewillcenterandmagnifyaboutthatpoint.Theselectbuttonwillallowyou toselectdifferentcirclesyouhavedrawn,andwillbeusedlater.Thepanbuttonallowsyouto grabanddragtheimage.Finallythecursorbuttonwill allow you to place markers on the image. The markers you place will define the points that theprogramwillfitacircleto,whichishow thegraphwillbeanalyzed.Beforewe start drawing circles, we should discuss the buttons on the right side of the Fit Data page.Startingfromthebottomandworkingourwayup,weseeafilterselectionboxwiththe colorsRed,Green,andBlue.Thewavelengthoftheemissionforthisparticulartransitionliesin thegreen,sowewillwanttofilterouttheredandblue.Dothisbyclickingontheappropriate buttons.Noticethatifyoufilterallthreeyouseenothing,andifyouonlyletredorbluepass throughyouseeonlynoise.Abovethefilterselectionboxisthemaximizecontrastbutton, alongwiththemaxbrightness.Turningthisonmayhelptomakethedarksdarkerandthe brightsbrighter.The“ZoomtoFit”buttonwillresizetheimagesothatyoucanseeitinitsentirety.Abovethisbuttonisthereadout for the Diameter of the circle selected in pixels. (We are only concerned with the relativediametersbetweenrings,sotheunitsofthediameterarenot important,as longastheyarealwaysthesame).Next up is thebutton to remove this circle,whichwill remove the selected circle from the list.Removelastpointisusefulifyouplaceapointand thenrealizethatthepointisnotwhereyouwantittobe. Continuing upward we have the Show/Hide Selected Circle button, which may be useful indeterminingthequalityofthecircle fit.ThedropdownlistlabeledCirclewilllistthecirclesyouareworkingwith.Whenyoubegin therewillbeonlyonecircle.Whenyouhavedefinedthiscirclepressingthebuttontotheright labeledNextCirclewillallowyou to set the current circle andbegindefining thenext.At the very top are two color selectionboxes,which,ifyoulike,willletyoutodefinethecolorsfor circlesyouhaveplacedand/ortheoneyouarecurrentlycreating.
FittingtheCircularDataClickontheanalysistab;onthispageyou’llseeanimageoftheringstructurealongwitha numberofdataentryboxes. Takenoteoftheringsofinterest.Back on the Fit Data tab, you should have already set the filters and contrast to a convenient setting.Magnifyandpanyourimagesothatyoucanseethefirstsetimportantringsclearly.Nowselectthecursor

tool (the bottom onewhich looks like crosshairs).With this tool selected, begin clicking on the imagewhereyoucanbestseeoneoftheringsclearly. Everyclickyou makewillleaveadotontheimagewiththecoloryouhavedefinedfortheselectedcircle.Once youhavefourdotsplaced,acirclewillappear.Besurethatthiscirclebestrepresentsthering byaddingdotsaroundthering.Trytokeepyourdotsevenlyspaced.Withpractice,itwilllikelytakenomorethan4to6dotstodefinethecircleproperly.Ifyouplaceabaddot,clickthe RemoveLastPointbutton.Onceyourfirstringisfitted,pressthenextcirclebutton.Youshouldseethepreviouscircle changecolor.Nowyoucanstartplacingpointsonthesecondring,justasyouhadthefirst. Continuethisprocessuntilyouhavefitalloftheringsofinterest(7total).ZeemanEffectOutline1. Purpose:A)DemonstrateZeemaneffectB)UseZeemaneffecttomeasureΔλande/mforelectron.2. Temporarily remove the camera. Turn on the magnet power supply. If needed move the opticalbench so small Mercury light source is in line with optical bench. Look through the Fabry-Perotinterferometer.Move you head around until you see a ring pattern. Adjust the vertical and horizontalknobs andmove interferometer toward or away from thewall until ring pattern isclose to centered.Adjusttheheightofthepolaroid/lenscombinationforbrightestimage.3. Putthecamerainplace.Turnonthecameraandadjustcameraandopticalpartssoyouareseeingtheringpattern.Someadditionaladjustmentmaybeneededlater.4. Connectcablefromcomputerintocamera.Clickoncameraicononprogramdisplay.Youshouldseeafuzzypattern.Checkthesettingsare.5. Adjust cameraandopticalpartsasneeded to try toget3-4complete rings.This involvesacertainamountoftrialanderror.6. Onceyouhavetheringpatternsavetheimage(jpeg).Turnonthemagnet.Observewhathappensasyou increase the field. Save image formaximumcurrent (~1.5A).Return the current to lowest setting.Turn the polarizer to 0 deg. Observe and describe what happens as you increase the current. Whichcomponentareyouseeing?Saveimageformaximumcurrent.Observeanddescribewhathappenswhenyouchangethepolarizerto90deg.Saveimageformaximumcurrent.7. Theringsyouseewithpolarizerat90degareactuallymadeupof3rings(picomponents).Onceyouhaveagoodimagesaveit.Youneedtohaveenoughofthesmallestringsothatthecenterofthecircleyouwilldrawisinthedisplayarea.Donottouchtheterminalsthetubeisattachedto.Highvoltageneededtooperatetube.Thefieldwillbearound1.3Tesla.Turndownmagnetcurrentalltheway.8. Analyzetheimageasdescribedabove.EstimateΔλande/mandcompareto“bookvalue”.9. Repeatstep8threetimes.Taketheaverageandstandarddeviation.10. Don’tforgettocopyyourimagesforyourreport.