united nations economic commission for europe statistical division price statistics seminar on...
TRANSCRIPT

United Nations Economic Commission for EuropeStatistical DivisionUnited Nations Economic Commission for EuropeStatistical Division
Price Statistics
Seminar on challenges in economic statistics
Tehran, IranNovember 2008
Presentation by Carsten Boldsen Hansen, UNECE([email protected])

November 2008 UNECE Statistical Division Slide 2
Overview
1. Main types of price indices
2. Construction of price indices
3. Calculation of elementary indices
4. Missing prices, seasonal products and quality changes
5. Basic CPI concepts and measures
6. International recommendations
7. Future challenges for CPI
November 2008 UNECE Statistical Division Slide 3
1. Main types of price indices
Consumer price indices
Producer price indices
Export and import price indices
Sectoral price indices

November 2008 UNECE Statistical Division Slide 4
1. Main types of price indices
Consumer price indices (CPI)Measure of average price change on goods and services acquired by the households for consumption
Used for different purposes:- Measure of general inflation- Compensation – i.e. indexation of wages, pensions,
income transfers- Indexation of contracts- Deflation of other economic statistics
Attracts broad interest from many user groups
November 2008 UNECE Statistical Division Slide 5
1. Main types of price indices
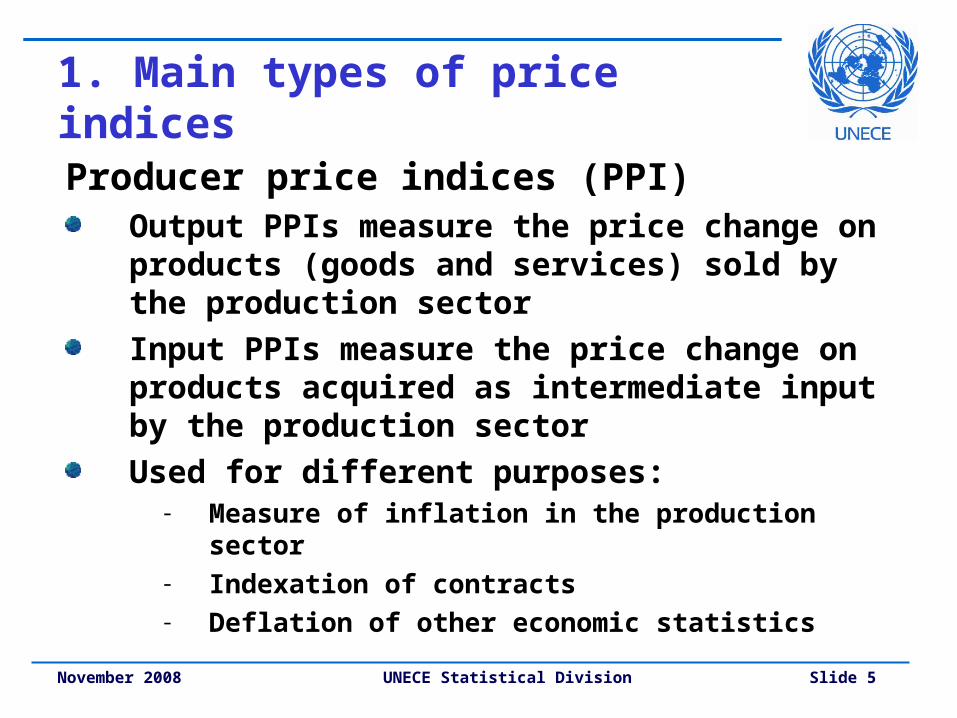
Producer price indices (PPI)Output PPIs measure the price change on products (goods and services) sold by the production sector
Input PPIs measure the price change on products acquired as intermediate input by the production sector
Used for different purposes:- Measure of inflation in the production sector- Indexation of contracts- Deflation of other economic statistics
November 2008 UNECE Statistical Division Slide 6
1. Main types of price indices
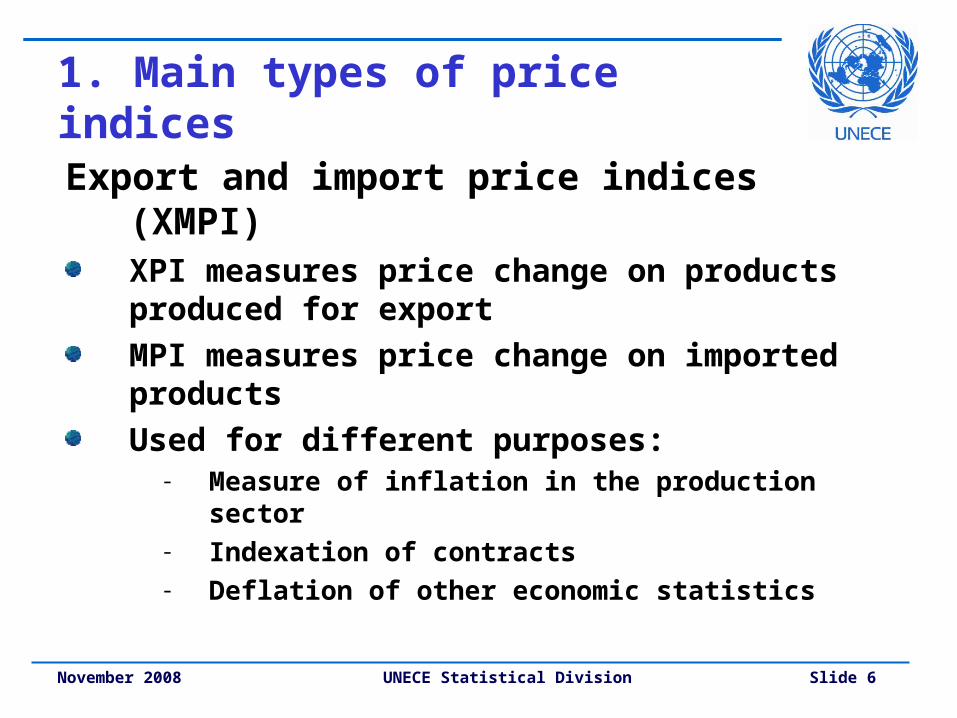
Export and import price indices (XMPI)XPI measures price change on products produced for export
MPI measures price change on imported products
Used for different purposes:- Measure of inflation in the production sector- Indexation of contracts- Deflation of other economic statistics

November 2008 UNECE Statistical Division Slide 7
1. Main types of price indices
Sectoral price indices (XMPI)Building and construction price indices
Agriculture, forestry and fishing
Used for different purposes:- Measure of inflation in the production sector- Indexation of contracts- Deflation of other economic statistics

November 2008 UNECE Statistical Division Slide 8
2. The construction of price indices
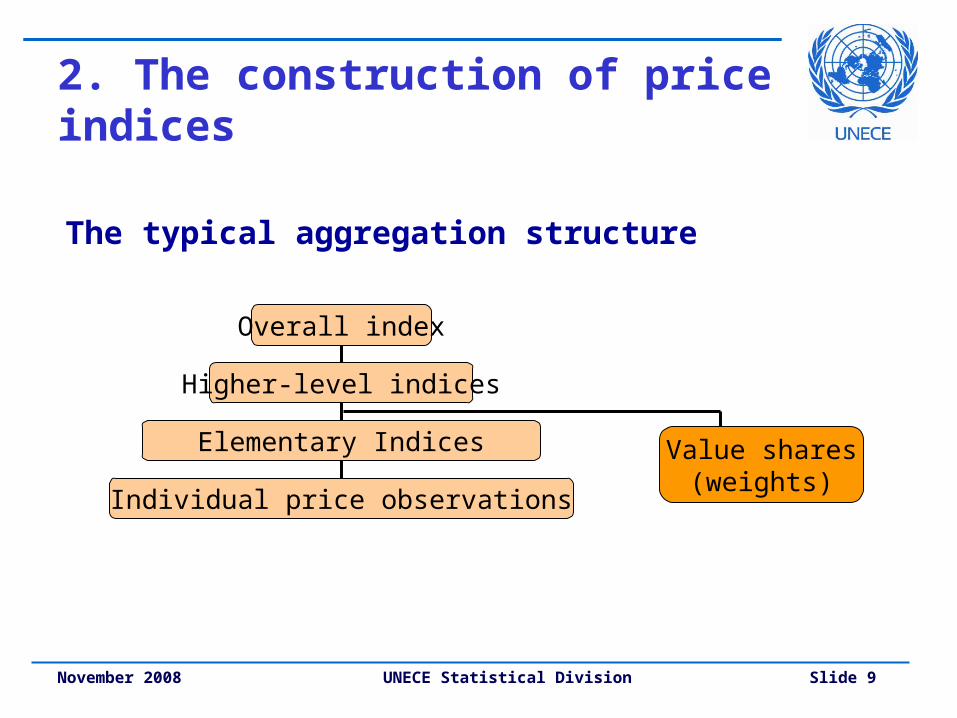
CPIs, PPIs and XMPIs are calculated in two stages:
1. Elementary aggregate indicesCalculated on basis of a sample of prices for individual products (and perhaps individual price weights)
2. Higher-level indicesCalculated as weighted averages of elementary aggregate indices using the value shares as weights
November 2008 UNECE Statistical Division Slide 9
2. The construction of price indices
The typical aggregation structure
Overall index
Higher-level indices
Elementary Indices
Individual price observations
Value shares(weights)
November 2008 UNECE Statistical Division Slide 10
3. Calculation of elementary indices
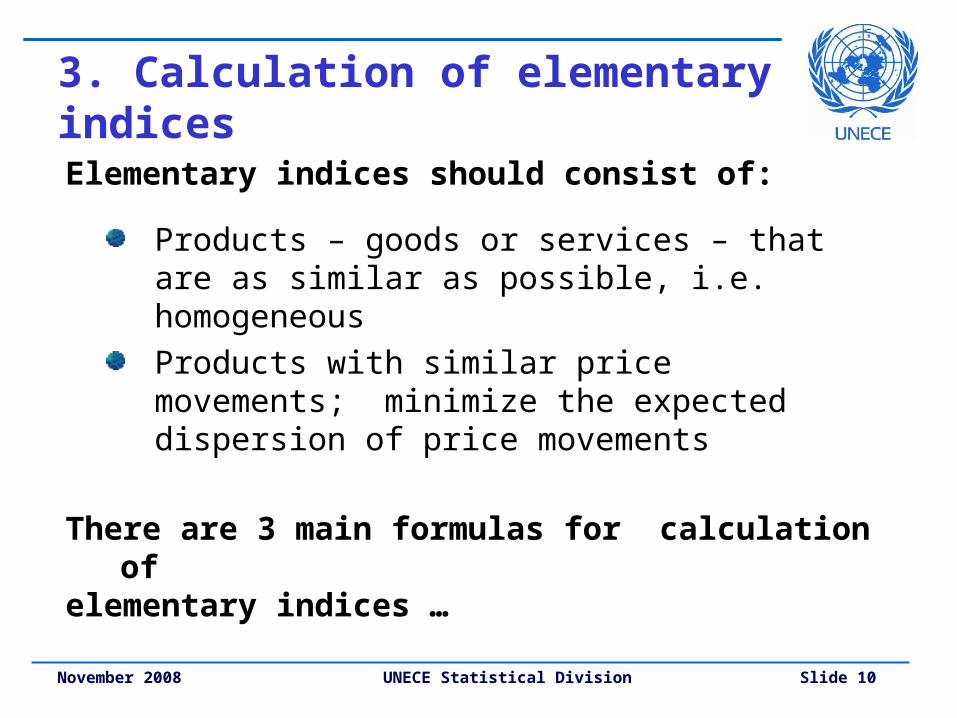
Elementary indices should consist of:
Products – goods or services – that are as similar as possible, i.e. homogeneous
Products with similar price movements; minimize the expected dispersion of price movements
There are 3 main formulas for calculation ofelementary indices …
November 2008 UNECE Statistical Division Slide 11
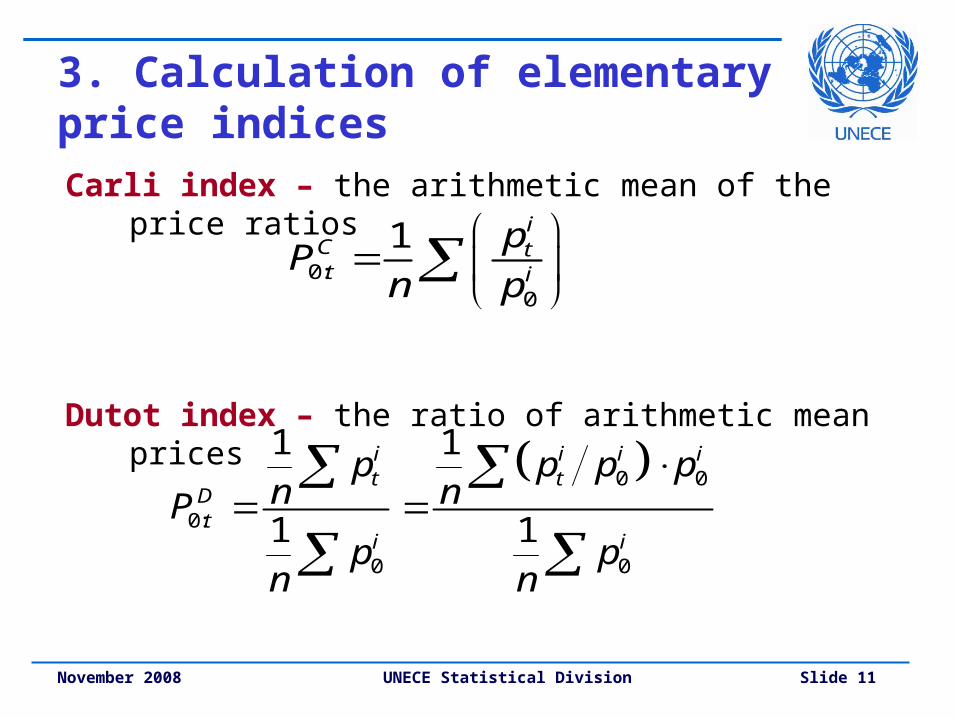
3. Calculation of elementary price indices
Carli index – the arithmetic mean of the price ratios
Dutot index – the ratio of arithmetic mean prices
0:0
1 iC tt i
pP
n p
0 0
0:
0 0
1 1
1 1
i i i it t
Dt
i i
p p p pn nP
p pn n
November 2008 UNECE Statistical Division Slide 12
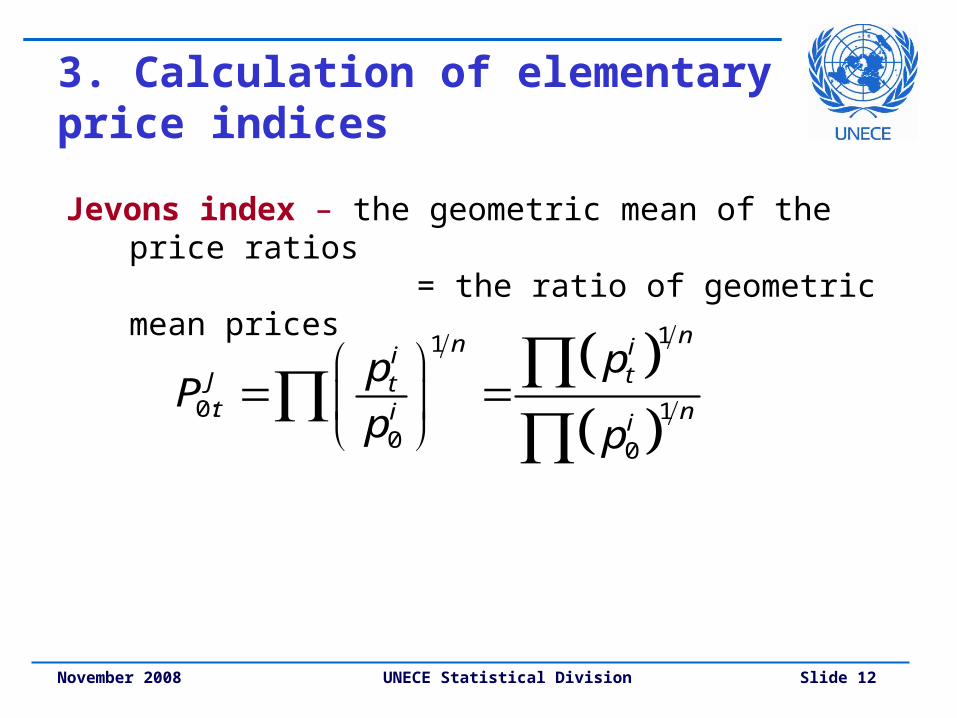
3. Calculation of elementary price indices
Jevons index – the geometric mean of the price ratios = the ratio of geometric mean prices
11
0: 10 0
nn iitJ t
t ni i
ppP
p p
November 2008 UNECE Statistical Division Slide 13
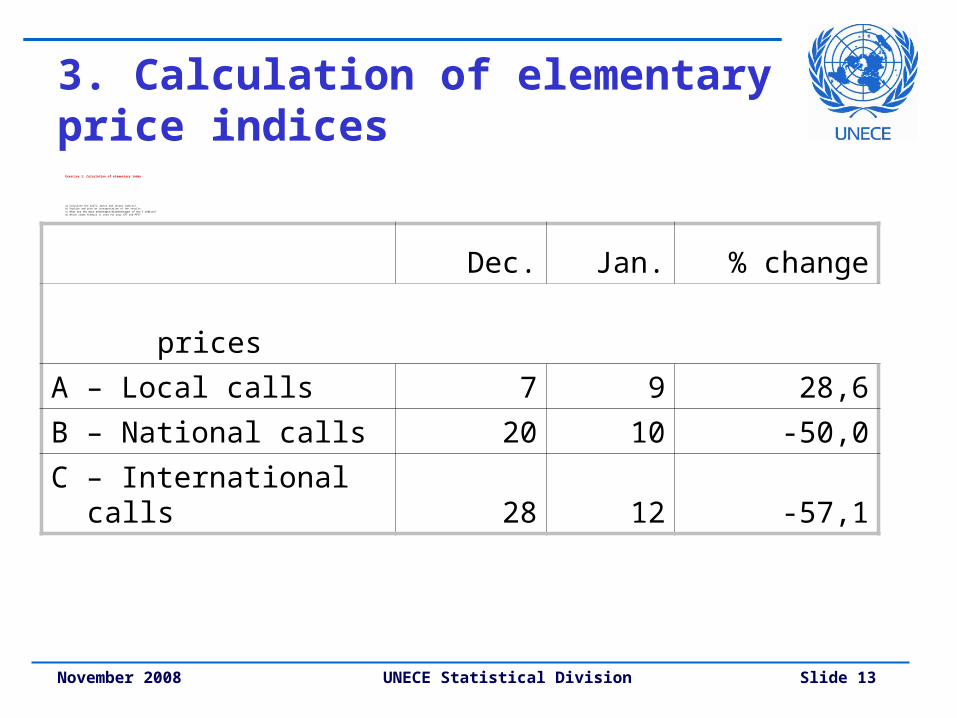
3. Calculation of elementary price indices
Exercise 1: Calculation of elementary index
a) Calculate the Carli, Dutot and Jevons indices!b) Explain and give an interpretation of the results.c) What are the main advantages/disadvantages of the 3 indices?d) Which index formula is used for your CPI and PPI?
Dec. Jan. % change
prices
A – Local calls 7 9 28,6
B – National calls 20 10 -50,0
C – International calls 28 12 -57,1

November 2008 UNECE Statistical Division Slide 14
3. Calculation of elementary price indices
Example 1: Dutot index depends on the price levelDecember January Index
Product 1 25,53 16,06 62,9
Product 2 69,5 69,5 100,0
Product 3 201,67 221,67 109,9
Av. Price 98,9 102,4
Dutot index 102,4/98,9 * 100 = 103,5
Carli index (62,9+100+109,9)/3 * 100 = 90,9
Price changes are weighted according to the price in the reference period:
Price Price weight
Product 1 25,53 0,09
Product 2 69,5 0,23
Product 3 201,67 0,68
Sum 296,7 1,00
Dutot index 62,9*0,09+100*0,23+109,9*0,68 = 103,5

November 2008 UNECE Statistical Division Slide 15
3. Calculation of elementary price indices
Example 2: Upward bias in the Carli
May June June/May
Item A 20,00 25,00 1,25
Item B 25,00 20,00 0,80
Arithm. mean 22,50 22,50 1,00
Geomean 22,36 22,36 1,00
Carli 102,50
Dutot 100,00
Jevons 100,00
Carli gives more weight to price increases than to decreases!
A chained Carli is upward biased and should not be used!
November 2008 UNECE Statistical Division Slide 16
3. Calculation of elementary price indices
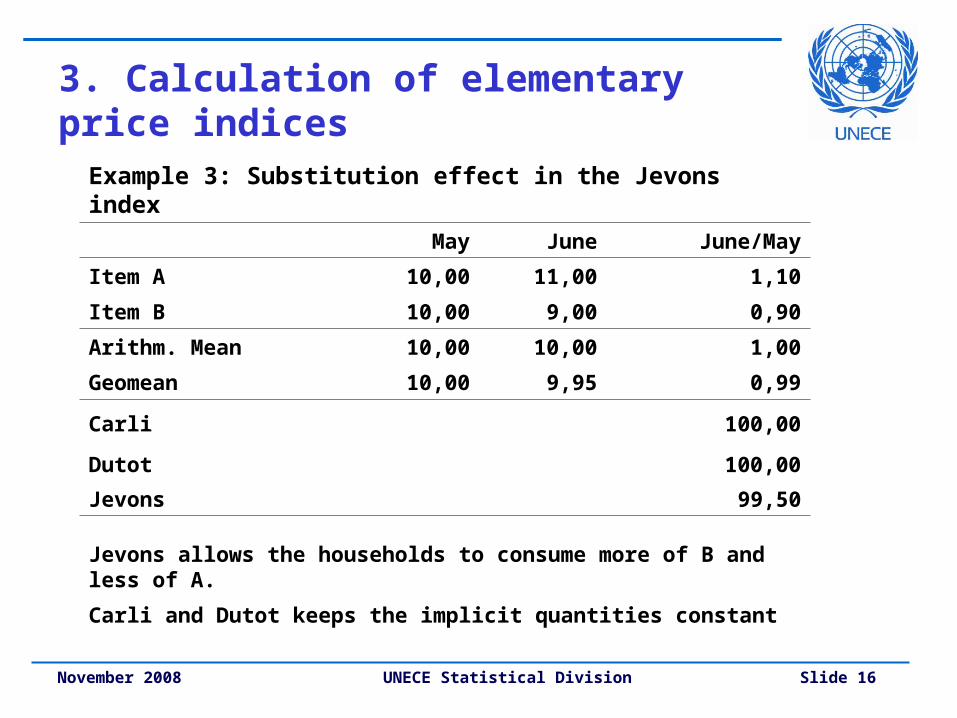
Example 3: Substitution effect in the Jevons index
May June June/May
Item A 10,00 11,00 1,10
Item B 10,00 9,00 0,90
Arithm. Mean 10,00 10,00 1,00
Geomean 10,00 9,95 0,99
Carli 100,00
Dutot 100,00
Jevons 99,50
Jevons allows the households to consume more of B and less of A.
Carli and Dutot keeps the implicit quantities constant
November 2008 UNECE Statistical Division Slide 17
3. Calculation of elementary price indices
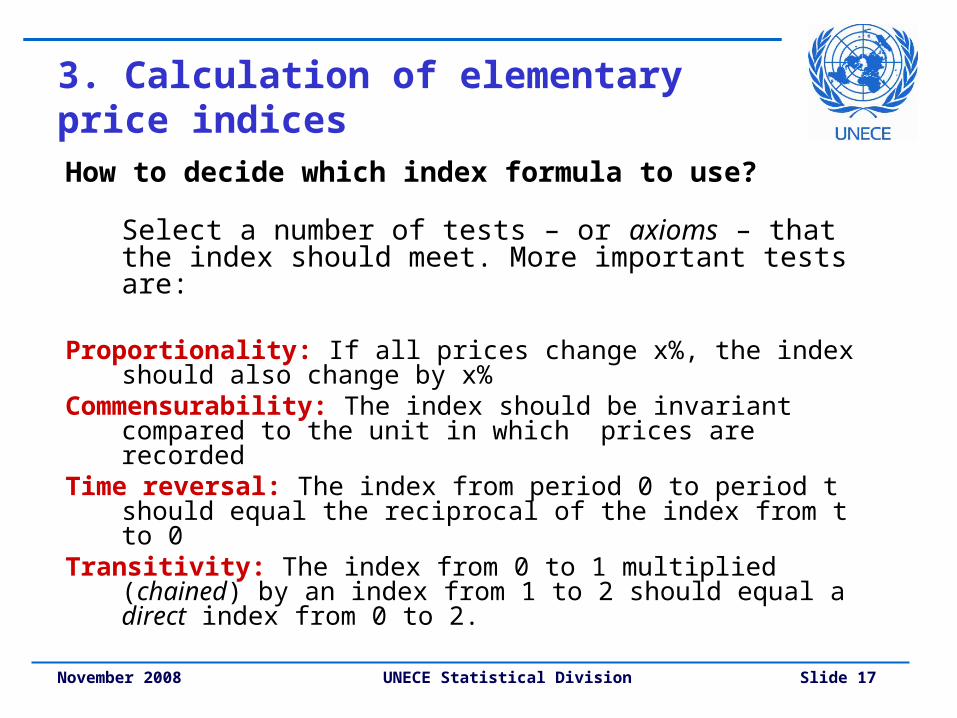
How to decide which index formula to use?
Select a number of tests – or axioms – that the index should meet. More important tests are:
Proportionality: If all prices change x%, the index should also change by x%
Commensurability: The index should be invariant compared to the unit in which prices are recorded
Time reversal: The index from period 0 to period t should equal the reciprocal of the index from t to 0
Transitivity: The index from 0 to 1 multiplied (chained) by an index from 1 to 2 should equal a direct index from 0 to 2.

November 2008 UNECE Statistical Division Slide 18
3. Calculation of elementary price indices
• Carli fails last two – time reversal and transitivity• Dutot fails commensurability• Jevons passes all four • Jevons recommended as the preferred index in
general
Carli Dutot Jevons
Proportionality yes yes yes
Commensurability yes no yes
Time reversal no yes yes
Transitivity no yes yes

November 2008 UNECE Statistical Division Slide 19
3. Calculation of elementary price indices
Chained or direct elementary aggregate indices?
A direct index compares the prices of the current month with those of a fixed reference monthA chained index compares month-to-month price changes and multiplies the monthly indices into long-term price indices
Chained and direct index give same results for Dutot and Jevons. A Chained Carli is upward biased – should not be used!Monthly chained indices appear to have some practical advantages in the treatment of missing prices and imputations
November 2008 UNECE Statistical Division Slide 20
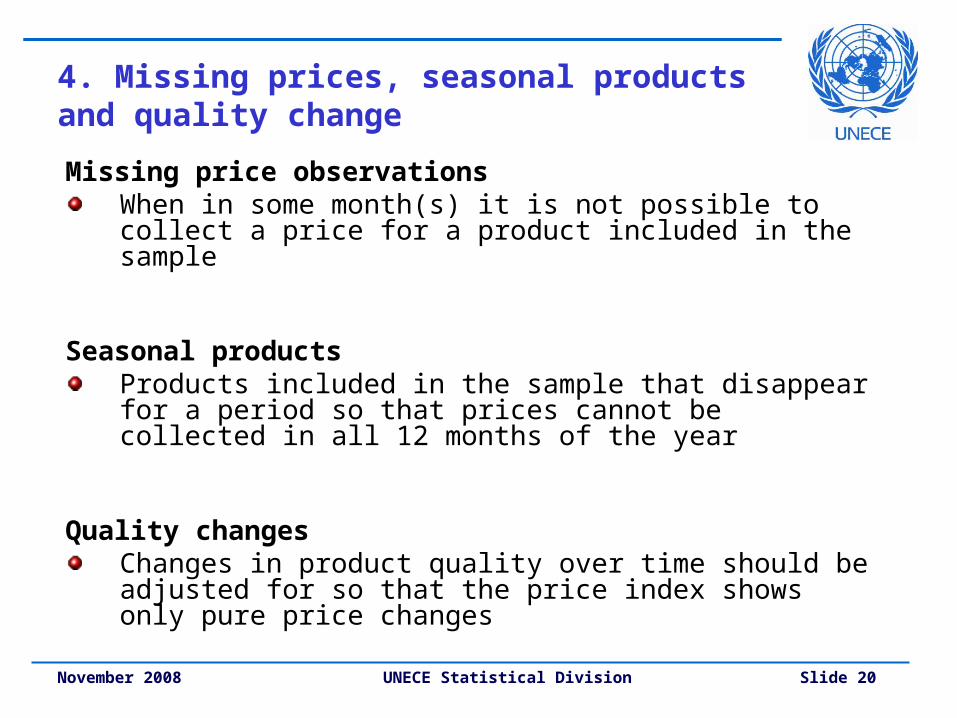
4. Missing prices, seasonal products and quality change
Missing price observationsWhen in some month(s) it is not possible to collect a price for a product included in the sample
Seasonal productsProducts included in the sample that disappear for a period so that prices cannot be collected in all 12 months of the year
Quality changesChanges in product quality over time should be adjusted for so that the price index shows only pure price changes
November 2008 UNECE Statistical Division Slide 21
4. Missing prices
Exercise 2: Missing prices, seasonal products and quality changes are
regular problems in price index compilation Use of inappropriate methods may lead to serious bias in
the price index
a) What are the main problems associated with missing prices, seasonal products and quality changes?
b) What can your price statistics division do to deal with these problems?
November 2008 UNECE Statistical Division Slide 22
4. Missing prices
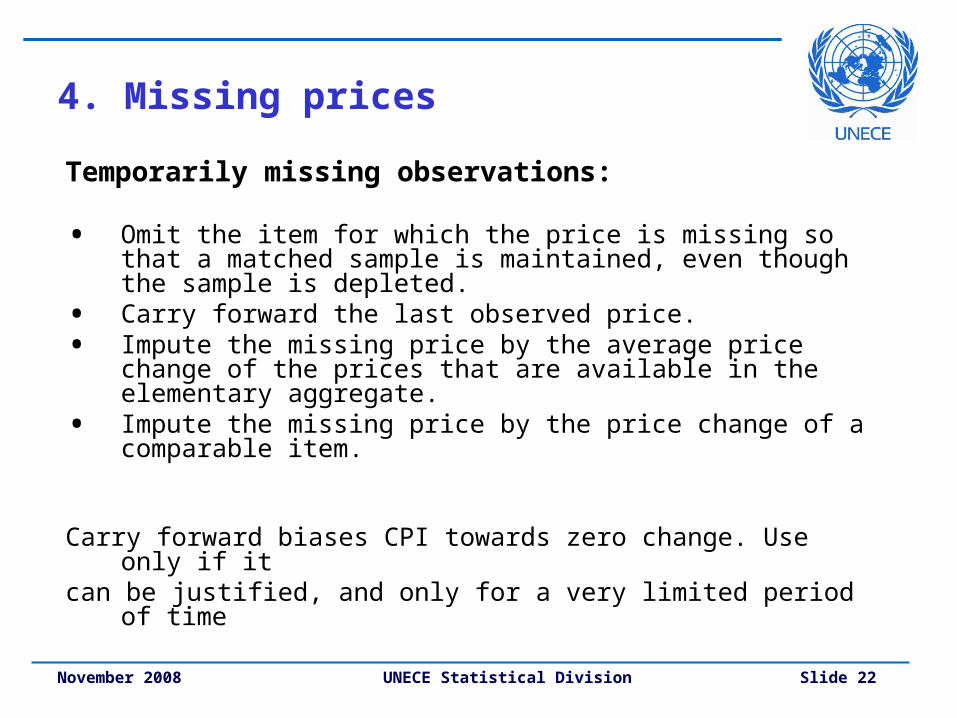
Temporarily missing observations:
• Omit the item for which the price is missing so that a matched sample is maintained, even though the sample is depleted.
• Carry forward the last observed price.• Impute the missing price by the average price change of
the prices that are available in the elementary aggregate.• Impute the missing price by the price change of a
comparable item.
Carry forward biases CPI towards zero change. Use only if it can be justified, and only for a very limited period of time

November 2008 UNECE Statistical Division Slide 23
4. Missing prices
Permanently missing observations:
• Where products disappear permanently, a replacement product has to be sampled and included in the index.
• The replacement product should, ideally, accounts for a significant proportion of sales, is likely to continue to be sold for some time, and be representative of the market the old product covered.

November 2008 UNECE Statistical Division Slide 24
4. Missing prices
Permanently missing observations:
Replacements without overlapping prices:
• Impute price in previous period to ensure the inclusion of the replacement product does not affect the index
Replacements with overlapping prices:
• Involves implicit adjustment for quality difference: the relative prices of the new and old product are assumed to reflect their relative qualities.
• For perfect or nearly perfect markets this may be a valid assumption, but for other markets it may not hold.

November 2008 UNECE Statistical Division Slide 25
4. Seasonal products
Two main approaches:
• The fixed weight approach
• The variable weights approach
The fixed weight approach is most common in use –
• in line with a fixed annual basket approach to the CPI
• it is necessary to estimate a price in of-season periods

November 2008 UNECE Statistical Division Slide 26
4. Seasonal products
Model 1: Carry forward (a)
0
10
20
30
40
50
60
Jan Feb Mar Apr May Jun Jul Aug Sep Oct Nov Dec Jan
In season price Carry forward price
November 2008 UNECE Statistical Division Slide 27
4. Seasonal products
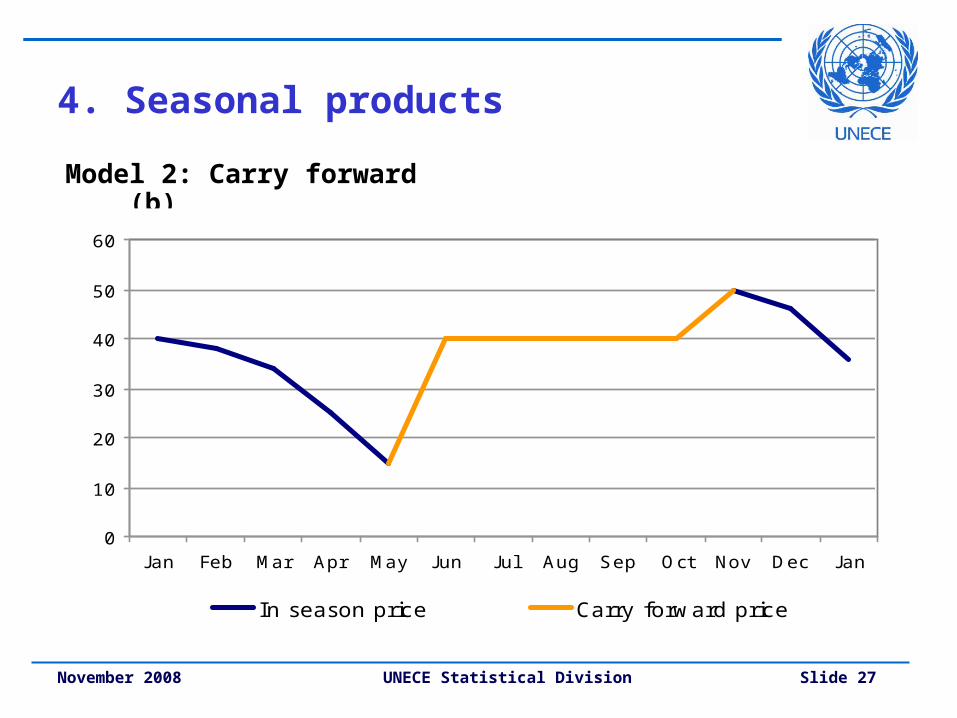
Model 2: Carry forward (b)
0
10
20
30
40
50
60
J an Feb Mar Apr May J un J ul Aug Sep Oct Nov Dec J an
In season price Carry forward price

November 2008 UNECE Statistical Division Slide 28
4. Seasonal products
Model 3: Impute price (a)
0
10
20
30
40
50
60
Jan Feb Mar Apr May Jun Jul Aug Sep Oct Nov Dec Jan
In season price Imputation Price increase

November 2008 UNECE Statistical Division Slide 29
4. Seasonal products
Model 4: Impute price (b)
0
10
20
30
40
50
60
Jan Feb Mar Apr May Jun Jul Aug Sep Oct Nov Dec Jan
In season price Imputation Price increase

November 2008 UNECE Statistical Division Slide 30
4. Seasonal products
Conclusions:
While prices are carried forward, the monthly changes of the CPI will be biased towards zero
imputation avoids, or at least reduces, the bias of the monthly changes of the CPI
the 12 months rate of changes will be (largely) unaffected in all the four models
in the long-term, the CPI will show the correct development in all four models
November 2008 UNECE Statistical Division Slide 31
4. Quality changes
What is the problem with quality changes?
The CPI/PPI aims to measure the average price change of a fixed basket of products
Changes in the baskets other than price changes should not influence the index
Collected prices need be adjusted for the value of quality changes to ensure the price index is showing only real price changes
November 2008 UNECE Statistical Division Slide 32
4. Quality changes
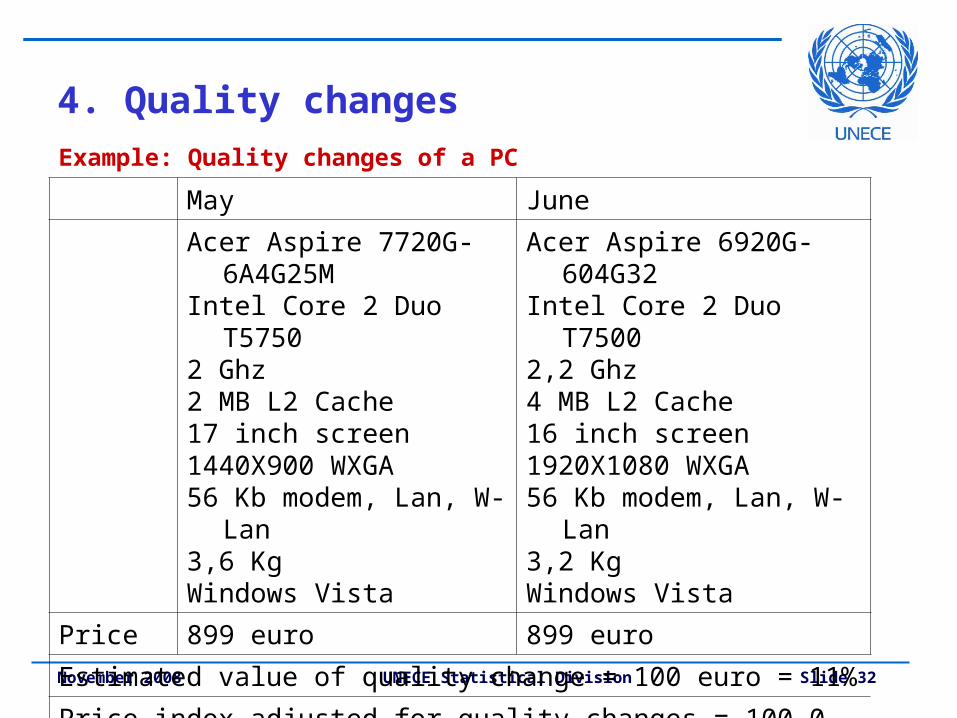
Example: Quality changes of a PC
May June
Acer Aspire 7720G-6A4G25MIntel Core 2 Duo T57502 Ghz 2 MB L2 Cache17 inch screen1440X900 WXGA56 Kb modem, Lan, W-Lan3,6 KgWindows Vista
Acer Aspire 6920G-604G32 Intel Core 2 Duo T75002,2 Ghz 4 MB L2 Cache16 inch screen1920X1080 WXGA56 Kb modem, Lan, W-Lan3,2 KgWindows Vista
Price 899 euro 899 euro
Estimated value of quality change = 100 euro = 11%
Price index adjusted for quality changes = 100,0 – 11,0 = 89,0

November 2008 UNECE Statistical Division Slide 33
4. Quality changesHICP for computers (09.1.3), 2004 = 100
20
30
40
50
60
70
80
90
100
110
120
2004m01 2005m01 2006m01 2007m01 2008m01
EU Bulgaria Hungary Sweden UK Turkey

November 2008 UNECE Statistical Division Slide 34
4. Quality changes
The pace of innovation is high, leading to continual changes in the quality of products
There is not much consistency among countries in the methods they use to deal with quality change
The choice of method can lead to very different results
The way in which a product is replaced by another always imply some assumption about the relative qualities of the 2 products
– You cannot “do nothing”!
November 2008 UNECE Statistical Division Slide 35
4. Quality changes
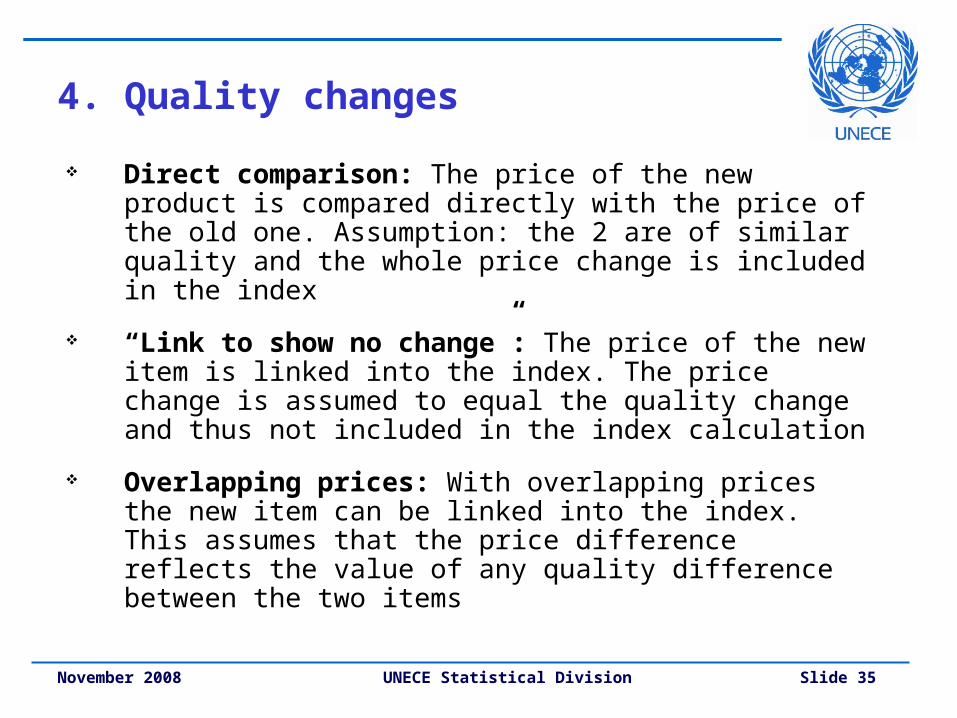
Direct comparison: The price of the new product is compared directly with the price of the old one. Assumption: the 2 are of similar quality and the whole price change is included in the index
“Link to show no change”: The price of the new item is linked into the index. The price change is assumed to equal the quality change and thus not included in the index calculation
Overlapping prices: With overlapping prices the new item can be linked into the index. This assumes that the price difference reflects the value of any quality difference between the two items

November 2008 UNECE Statistical Division Slide 36
4. Quality changes
Matched models only. Only those products for which a price is recorded in both the current and the reference period are included in the calculation of the elementary index. This corresponds to imputation, where the price development of the new product is estimated by the average price development of those product for which matched prices have been recorded
Option prices: If the difference between A and C is the inclusion of an extra option, e.g. a CD-ROM drive in a computer, the extra option can be separately priced and appropriate adjustment made in the recorded price

November 2008 UNECE Statistical Division Slide 37
4. Quality changes
Production costs: Producers can be asked about the difference in cost of producing the old and new item, and the ratio of costs be applied for adjusting the prices
Experts judgement: Persons with detailed product knowledge value the difference between the new and old product, and appropriate adjustment are made in the recorded prices
Hedonic adjustments by use of hedonic regression. Resource and data demanding

November 2008 UNECE Statistical Division Slide 38
4. Quality changes
The Handbook on price and volume measures in national accounts(Eurostat 2001) divides QA methods into 3 groups:
A methods: most appropriate methods B methods: those methods, which can be used in case
an A method cannot be applied C methods: those methods, which shall not be used
Follows a case-by-case approach
The Handbook provides useful guidance and numerous practical examples. It is available from Eurostat’s webpage
November 2008 UNECE Statistical Division Slide 39
4. Quality changes
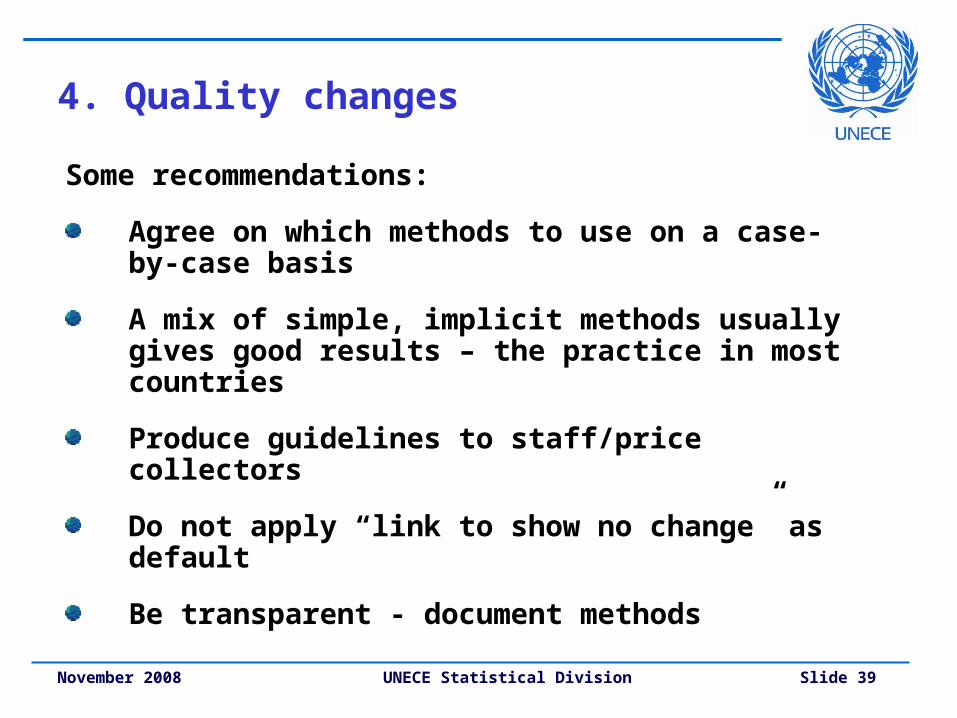
Some recommendations:
Agree on which methods to use on a case-by-case basis
A mix of simple, implicit methods usually gives good results – the practice in most countries
Produce guidelines to staff/price collectors
Do not apply “link to show no change” as default
Be transparent - document methods

November 2008 UNECE Statistical Division Slide 40
5. Basic CPI concepts and measures
The main purpose(s) of the CPI A measure of inflation or cost of living – or both?
Geographical and population coverage
The national concept: covers the consumption expenditure of resident households, whether made in the country or abroad The domestic concept: covers the consumption expenditure inside the country, whether made by resident or foreign households
- weighting data may need be adjusted/supplemented!
The price conceptPurchaser prices - the prices that the household actually pay for goods and services, including taxes less subsidies
November 2008 UNECE Statistical Division Slide 41
5. Basic CPI concepts and measures
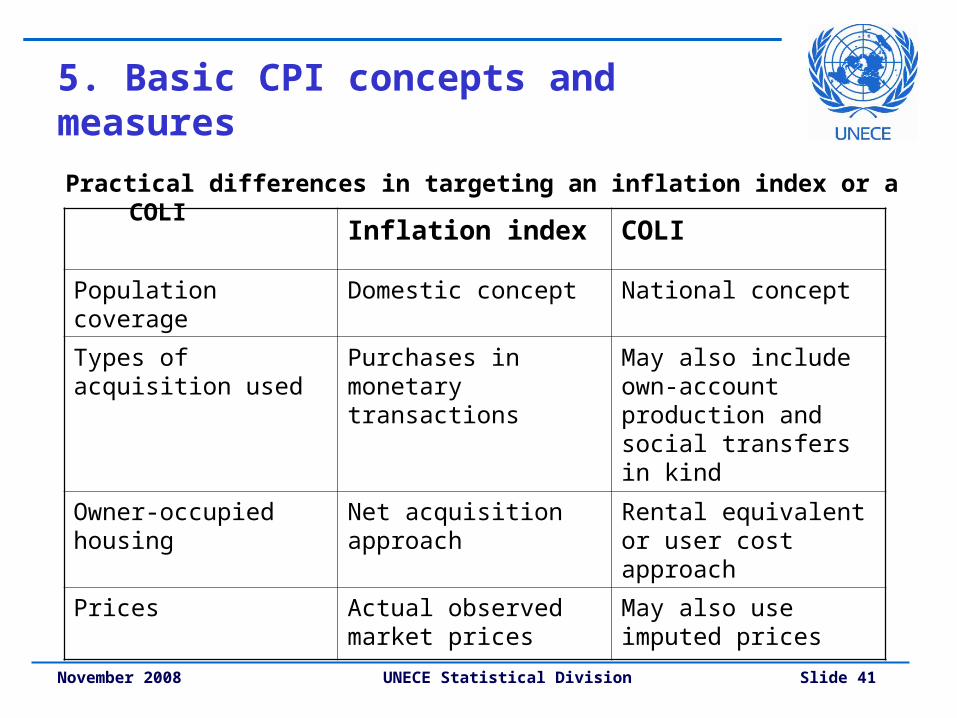
Practical differences in targeting an inflation index or a COLI
Inflation index COLI
Population coverage Domestic concept National concept
Types of acquisition used
Purchases in monetary transactions
May also include own-account production and social transfers in kind
Owner-occupied housing
Net acquisition approach
Rental equivalent or user cost approach
Prices Actual observed market prices
May also use imputed prices

November 2008 UNECE Statistical Division Slide 42
6. International recommendations
The CPI Manual in English/Russian is available from ILO on www.ilo.org/public/english/bureau/stat/guides/cpi/index.htm
Supplementary Handbook: Practical Guide to Compiling Consumer Price Indices. Under production. Draft available on www.unece.org/stats/documents/2008.05.cpi2.htm
Papers from Joint UNECE/ILO meetings on CPI are available on www.unece.org/stats/archive/docs.date.e.htm
Papers from meetings in the Ottawa Group on Price Indices are available from www.ottawagroup.org
November 2008 UNECE Statistical Division Slide 43
7. Future Challenges
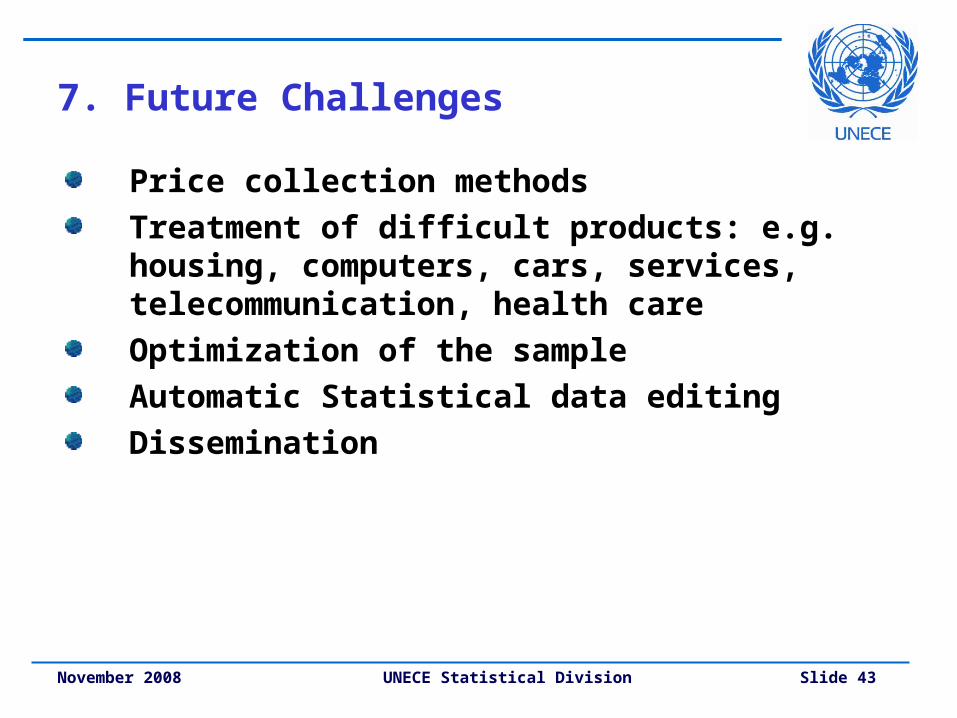
Price collection methods
Treatment of difficult products: e.g. housing, computers, cars, services, telecommunication, health care
Optimization of the sample
Automatic Statistical data editing
Dissemination