united mexican states - instituto mexicano para la...
TRANSCRIPT

United Mexican States
Integration of the North American Dry Bean Market: Implications for Mexican Producers and Consumers
December 2007
Sustainable Development Department
Latin America and the Caribbean Region
Document of the World Bank
in collaboration with the
Instituto Mexicano para la Competitividad


i
CONTENTS
Executive Summary ........................................................................................................................... 1
I. Introduction .................................................................................................................................. 11
II. The International and Domestic Bean Markets ........................................................................... 13 II.1. Mexico within the International Bean Market ................................................................................... 14 II.2. Why Has Growth in Bean Productivity been Slow? .......................................................................... 18 II.3. Public Policies Related to Bean Production in Mexico ..................................................................... 19 II.4. Dry Bean Prices in the United States ................................................................................................. 24 II.5. Dry Bean Consumption in Mexico .................................................................................................... 25
III. Implications of 2008 Tariff Phaseout for Mexico’s Dry Bean Market ..................................... 27 III.1. Integration of the North American Dry Bean Market under NAFTA .............................................. 27 III.2. The Effect of NAFTA under a General Equilibrium Model ............................................................ 29 III.3. Average Variable Cash Cost Curves Analysis ................................................................................. 30
IV. Policy Options to Improve Mexico's Position in the Bean Market under Full Integration ....... 40 IV.1. Access to Markets and Marketing .................................................................................................... 40 IV.2. Marketing and Entrepreneurial Skills (Market Intelligence System) ............................................... 42 IV.3. Campaigning for Beans .................................................................................................................... 43 IV.4. Minimizing Transport Costs ............................................................................................................. 44 IV.5. Minimizing Storage Costs and Facilitating Access to Credit ........................................................... 47 IV. 6. Concluding Remarks ....................................................................................................................... 49
V. Policy Options to Maximize Mexican Producers’ Competitiveness .......................................... 50 V.1. Improving Production Technology .................................................................................................... 50 V.2. Improving Efficiency through Economies of Scale ........................................................................... 55 V.3. Reconverting Land to Other Uses ...................................................................................................... 57 V.4. Planning for climate change .............................................................................................................. 59
References ........................................................................................................................................ 61
Interviews ......................................................................................................................................... 62
Websites consulted........................................................................................................................... 63
Appendix 1. General Equilibrium Model ........................................................................................ 65 A.1. Background ........................................................................................................................................ 65 A.2 The Model........................................................................................................................................... 65 A.3. Full Specification ............................................................................................................................... 66 A.4. Second Module: Agroindustries ........................................................................................................ 71 A.5. Understanding the Agroindustrial GDP in the GEM ......................................................................... 74
Appendix 2. Consumption Markets and Transport Costs ............................................................... 75
Appendix 3. Determining Beans Supply at Each Main Consumption Centers .............................. 77
Appendix 4. Cost Curves for Main Consumption Centers ............................................................. 78

EXECUTIVE SUMMARY
Beans are one of the four agricultural commodities—commonly known as ―sensitive products‖ in
Mexico—whose tariff phaseout period under NAFTA will end in 2008. The other products are sugar,
dairy, and corn. There is concern in many sectors of Mexican society about the short- and long-term
effects that full integration of the North American market for these products will have on Mexican
producers and consumers. Furthermore, full market integration comes at a time when world agricultural
markets, especially those for sugar and grains, are experiencing the volatile effects of increased demand
for biofuels. Because of the uncertainty in market trends caused by these circumstances, the Mexican
government asked the World Bank to prepare policy notes on three of these products—corn, sugar, and
beans—to assess the potential impact of the final phaseout of tariffs, identify potential winners and losers,
and suggest policy options that could help Mexican producers and consumers take full advantage of
market integration. This paper examines these matters in connection with the market for beans1.
Background: The Mexican Bean Sector
Beans are a critical staple food in Mexico, which produces about 1.3 million tons of beans and imports
another 73,000 tons, 95 percent of which come from the United States.2 In addition, Mexico exports about
18,000 tons to the United States, mostly black beans for the Hispanic population. Mexico’s bean
production can be classified into three main categories: black (39 percent of output), light-colored (48
percent), and pinto beans (13 percent).3 The prevalence of different types, both in production and
consumption, varies from region to region.
An estimated 570,000 farmers grow beans for either commercial or subsistence purposes on a total of
about 1.9 million hectares of land.4 Only 110,000 of these farmers are registered with Mexico’s main
agricultural support program—the Programa de Apoyos Directos al Campo (PROCAMPO)—as
specializing in beans. This can be taken as a rough estimate of the minimum number of commercial
producers who, though representing only about 20 percent of all growers, account for approximately 80
percent of total output.5
1 The focus of this study is competitiveness, not poverty alleviation per se. Much of the World Bank’s work in
Mexico and elsewhere is focused on poverty, including the 2005 report Income Generation and Social Protection
for the Poor, which includes a special section on rural poverty. The Bank’s ongoing agricultural public expenditure
review for Mexico will also include equity concerns as a primary criteria for evaluation of spending programs. 2 Mexican bean production represents the average of the past five years (SIAP). Differences from one year to the
next can be considerable (for example, from 2005 to 2006 production increased 67 percent). 3 SIAP. Online data. For 2006 only, since there is no data available for previous years. However, this data is not
consistent with information on imports and consumption by variety data from Sagarpa itself. 4 Hectares are average of the past five years, from the yearbooks 2002–06 (SIAP).
5 FIRA. ―El frijol en México, competitividad y oportunidades de desarrollo.‖ Boletín Informativo 316. May, 2001

2
About 20 percent of all rainfed output is for self-self consumption. Irrigated production (virtually all of
which is commercial) accounts for 39 percent of total commercial output.6 This means that 31 percent of
all output is irrigated. Including both commercial and subsistence farming, average yields using irrigation
are 2.3 times higher (1.6 tons per hectare) than in rain-fed production (0.7 tons per hectare).
Nearly 60 percent of all bean production in Mexico is from the neighboring states of Zacatecas (30.6
percent), Sinaloa (12.5 percent), Durango (11.5 percent), and Nayarit (5.0 percent). The largest producer
outside this area is the southern state of Chiapas, which accounts for 6.4 percent of Mexican production.7
Irrigated production is concentrated in Sinaloa and Nayarit. Although a large majority of bean producers
are subsistence farmers, this policy note focuses on commercial bean production because it accounts for a
large majority of total output and is the sector where the impacts of market integration and the biofuels
shock are most strongly felt.
Bean production in Mexico increased at an average annual rate of about 1 percent between 1996 and
2006, although from year to year production sometimes rose and fell sharply. Imports from the United
States are composed of about equal quantities of black and light-colored beans and account for about 5–6
percent of domestic consumption. These imports may vary significantly from year to year but the overall
trend has been relatively flat.8 Bean processing (particularly bean canning) has been expanding rapidly,
with 90,000 tons canned in 2006. Daily per capita consumption declined from an average of almost 33
grams in 1992-96 to about 30 grams in 2002-05. Over the last 15 years, total consumption has increased
slightly due to population growth.9 Total bean consumption in the United States is about 750,000 tons and
has been decreasing, except for consumption of black beans, which has been increasing rapidly and now
stands at 60,000 tons due to demand from the growing Hispanic population.
Bean prices in Mexico had been falling through most of 2006 and the first half of 2007 but began to rise
again in the third quarter of 2007, while in the United States prices have been increasing since late 2005.
Although prices in the United States for similar varieties are still lower than in Mexico, curiously in
Mexico beans imported from the United States are more expensive than domestically grown beans.
Stocks are currently high in Mexico—over 400,000 tons—and are particularly elevated for black beans.
Government Policy10
There is a long history of government intervention in Mexico’s bean market, going back to the times
when the government regulated prices and marketed output through the Compañía Nacional de
Subsistencias Populares (CONASUPO). As a result of agrarian policy reforms in the late 1980s and
6 SIACON–Sagarpa Database.
7 Data on share of output is from the Sagarpa-USDA working paper ―Estudio del maíz blanco y el frijol seco
México–Estados Unidos,‖ January 3, 2007. 8 Source: FAOStat online database.
9 Ibid.
10 The Bank’s ongoing agricultural public expenditure review for Mexico will address issues related to the general
agricultural support programs such as Procampo and the ASERCA programs, which are not discussed in detail in
these product-specific policy notes.

3
1990s the government no longer fixes prices or markets output, but there are still a number of government
programs benefiting bean farmers, some of which are specific to the bean sector.
The most important agricultural programs to which bean farmers have access are PROCAMPO, Alianza
Contigo, PROMAF (directed at smaller producers),11
the agricultural diesel and energy subsidy, and some
of the support programs run by Apoyos y Servicios a la Comercialización Agropecuaria (ASERCA), in
particular its storage support program and the Factores Críticos, Infraestructura Comercial, and
Organizaciones Económicas programs. Programs specifically oriented to the beans sector are the Fondo
de Riesgo Compartido para el Fomento a los Agronegocios (FOMAGRO) with an annual support
program of about 283 million pesos (2007) and the Apoyo a la Competitividad program with budget of
about 300 million pesos. These programs support diverse investments to improve competitiveness
throughout the bean production and marketing chain and to also help uncompetitive producers convert to
other crops (such as fodder crops in Zacatecas). They do not provide price support.
Trade policy for the sector has been regulated by the tariff phaseout schedule agreed under NAFTA,
which combines tariff-free quotas with declining tariff rates for over-quota imports. Imports have been
above quota in all years between 1997 and 2007, except 2004. The average quota from 1997 through
2007 was 65,500 tons and average imports were 105,500 tons. The tariff rate for over-quota imports was
reduced to 11.8 percent in 2007 and will be eliminated entirely in 2008. A common most-favored nation
tariff of 125.1 percent is applied by Mexico to imports from third countries, though these imports are not
significant.12
Purpose of the Note
The study focuses on the following tasks:
Understanding the main features of the Mexican bean market and how it is affected by the
international market.
Assessing how the phaseout of tariffs under NAFTA might affect Mexican producers and
consumers.
Examining the competitiveness of Mexican bean producers in an open North American market.
Suggesting policy options to improve the competitiveness of Mexican bean producers and
maximize the benefits of market integration for both producers and consumers.
Findings
The main findings of the study are:
1. Little short-term impact is expected from NAFTA’s final phaseout of tariffs because (a) imported
beans supply only a small part of domestic consumption, (about 5 percent), (b) the current tariff is
11
Production chain support subprogram for corn and bean producers of 5 hectares or less. 12
Secretaría de Economía. Sistema de Información Arancelaria Vía Internet. http://www.economia-
snci.gob.mx:8080/siaviWeb/fraccionAction.do?tigie=07133399

4
only 11.8 percent, (c) bean prices in the United States are increasing, which is likely to offset or
exceed the effect of eliminating tariffs, and (d) the United States does not compete in the market
for light-colored beans, which accounts for about 48 percent of Mexico’s production.13
2. While the medium- and long-term situation may change depending on the actions of key groups
of stakeholders, major changes are not expected in the medium-run because (a) the bean sector is
not expanding, (b) there are many bean varieties and their consumption levels depend heavily on
personal and cultural preferences, which are slow to change, and (c) no major technological
breakthroughs in bean production or chain logistics are expected in the medium-term.
3. Imports of U.S. beans as a share of total consumption may continue to increase slowly (despite
being more expensive than domestic beans) as long as Mexican consumers continue to be willing
to pay a price premium based on their cleanness, smaller size, and ease of cooking. However, this
share could decline if domestic farmers decide to compete with U.S. beans on these quality traits
and are able to maintain a price advantage. Mexican exports to U.S. niche markets could also
expand, particularly in canned beans and in bean varieties or products suited to the preferences of
the Hispanic community in the United States.
4. Transportation costs are a major factor (20 percent on average) in the price of beans at main
consumption centers in Mexico. This is due partly to inadequate road infrastructure and other
inefficiencies in the Mexican transport system, and partly to the long distances between
production areas and consumption centers.
5. Average production costs in Mexico (4,149 pesos per ton) are nearly twice as high as in the
United States (2,134 pesos). However, this gap is smaller for farmers using irrigation, who have
average costs of 3,626 pesos per ton compared with 5,323 pesos for rain-fed production (costs
vary little for different types of beans). An important factor in the lower cost of irrigated
production is that growers pay little if anything for water.
6. A comparison of production and transport costs for the main suppliers of beans in the six main
consumption centers examined in the paper (Mexico City, Guadalajara, Monterrey, Torrreón,
Ciudad Obregón, and Tijuana) showed that producers from Sinaloa are the most competitive bean
producers in all these markets.
7. Even if production costs are similar, there is a substantial difference between the price of black
and light colored beans, the latter being much higher than the former. This difference occurs in
both the producer and the wholesale price. The difference suggests that producers are not
adjusting the type of beans grown in accordance with market signals, either because of agro-
ecological reasons that favor the production of certain beans in some areas or because of social
and cultural reasons or lack of technical or market information or even because of market
distortions created by subsidies for this segment of the market.
8. When production plus transport costs are compared with wholesale prices, all main bean suppliers
are competitive in all the markets analyzed. There are large margins, however, between producer
and wholesale prices, which cannot be accounted for by transport costs alone. Because of this, the
producer price, particularly for black beans, is low, below or at the margin of the estimated
production cost of many rain-fed producers, particularly in Zacatecas.
13
Light-colored bean production estimate is from the 2006 SIAP yearbook, although it is not consistent with other
SIAP data.

5
Policy Options
This report identifies several areas in which the government, in some cases in partnership with the private
sector, could take actions that would help Mexican bean producers take advantage of export opportunities
created by the NAFTA and/or would improve their competitiveness in the domestic market.
Reducing transport costs
Given the long distances between major bean producing regions and consumption centers in Mexico,
lowering transport costs is an important element of a strategy to improve the competitiveness of Mexican
growers in both domestic and export markets. Transport represents about 20 percent of the total cost for
Mexican beans delivered to the consumption centers studied in this report. While domestically produced
beans are mainly transported within Mexico by truck, imports from the United States are mainly
transported by rail, which costs less and is more secure. The policy recommendations in the report
regarding transport (which are explained in more detail at IMCO’s website, www.imco.org.mx) address
three main problems: (a) lack of competition and the high transport costs of trucks, (b) limited use of the
railroad system and problems among private rail companies, and (c) inefficiency at customs and port
facilities in border areas.
Recommendations for addressing lack of competition and high trucking costs involve (a) promoting
competition in the sector, (b) renovating the cargo fleet, and (c) improving market information. The most
important recommendations concerned the second problem, rail transport issues, are to (a) create ―last-
mile services,‖ meaning the building of last mile railroad infrastructure to connect main railways to ports,
warehouses, and other key locations to avoid intermediate transportation, (b) find reciprocal mechanisms
to avoid disagreements between railway companies, and (c) publish tariffs for different cargos and
volumes. Recommendations for the third issue, customs and port inefficiencies, involve (a) reducing
paperwork, (b) improving inspection facilities and procedures, (c) better coordinating the work of
different authorities in this area, and (d) improving intermodal facilities throughout Mexico.
It should be recognized that while reducing transport costs improves overall competitiveness, it could lead
to price reductions in grain-deficit areas, with potential adverse effects on producers in these areas. The
information on regional production costs in these notes may help to identify those areas that are both
high-cost and deficit areas, which may be targeted for attention. Potential losses would of course need to
be quantified to see if they are sufficient to justify intervention.
Improving storage facilities and facilitating access to credit
Beans are sensitive to heat and moisture and they cannot be stored for more than a year because they tend
to dry up and become hard to cook. One authoritative source estimates that 10 percent of beans are
currently lost in storage in Mexico. It is important to ensure that storage facilities are high quality and
well maintained to minimize these losses. A well functioning storage market not only provides incentives
to make necessary investments to reduce physical losses, but also increases the liquidity of the
agribusiness financial market by allowing stored commodities to be used as collateral. This may become
especially important as market integration is completed, since U.S. and Canadian exporters will be able to

6
offer attractive prefinancing terms to Mexican importers, giving them a competitive advantage unless
Mexican sellers can do likewise.
Under current law, the system of government-issued permits limits the number storage facilities
(almacenes generales de deposito) in operation. This in turn limits competition, leads to unnecessarily
high transaction costs and reduces incentives and capacity to minimize the cost of inventories or to offer
more attractive mechanisms for financing corn purchases over time. A key policy option recommended
by this report is consideration of a new law on rural warehouses with the objectives of (a) lowering
barriers to market entry to allow more competition, (b) creating a transparent public information system
on prices and inventories, and (c) allowing the issuance of negotiable, endorsable warehouse receipts as a
financial mechanism for stored commodities. The law also should provide for efficient financial
regulation and supervision that ensures the integrity of financial instruments issued by warehouses, a role
currently performed by the Comision Nacional de Bancos y Valores. SAGARPA in 2004 proposed a
comprehensive reform of the system for licensing and regulating warehouses, and the proposed options
need to be explored. A possible model for such reforms is the ―reportos‖ system in the sugar sector, which
allows producers to repurchase the receipt of their inventory at a certain time, paying a premium to the
buyer for holding the receipt. In this way producers can store their crop and sell it when the market is
favorable.
Mechanisms related to storage markets that have proved successful in other countries should also be
considered, such as the Cedula de Productos Rurales (CPR) in Brazil, which is a bond issued by rural
producers, farmers associations, and cooperatives to obtain financing for production. There are many
variations and benefits to the CPR that are explained in more detail in the full report, but in basic terms
the CPR provides crop financing for the production of the crop and manages the producer’s price risk by
linking the debt to the product, thereby transferring price risk to the buyer. Traders and the agroindustry
also benefit through the guarantee and better planning of commodity supply. The most important attribute
of the CPR is, by far, the reduction of risks to the buyers, because it provides for out-of-court settlements
in case of nonperformance or breach of contract. However, for this to work the judiciary must be prepared
to guarantee the success of such suits and there must be sustainable and accessible agricultural and credit
insurance to mitigate risks.
Other measures to enhance rural borrowers’ creditworthiness and their attractiveness to financial
institutions should also be explored. This includes measures to improve the insurance instruments
available to producers. A number of innovative products that improve upon the traditional crop insurance
are being developed or piloted.14
Another option is to target income insurance policy instead of just crop
insurance, in other words, insuring both quantity and price, which would require regulatory changes by
the National Insurance Commission. A joint venture between ASERCA and Agroasemex (the agricultural
insurance institution of the government) could help create such an instrument
14
The traditional crop insurance model—which reimburses losses based on individual claims—has a number of
shortcomings that limit its usefulness, especially in developing countries. For innovative alternatives, see World
Bank, 2005 Managing Agricultural Production Risk: Innovations in Developing Countries, Agriculture and Rural
Development Department, and World Bank, Rural Finance Innovations, Topics and Case Studies, Report No.
32726-GLB, The World Bank, April 2005.

7
Improving market intelligence
The integration of the North American market creates opportunities for Mexican producers to export
beans to the growing Hispanic populations in the United States and Canada, both unprocessed or
processed into higher value-added products (e.g., canned or with special packaging). Some important
Mexican agro-industrial firms are planning to open bean canning plants in the United States.15
To seize
such market opportunities, Mexican producers need more information about consumer preferences and
habits, as well as on how to improve production. While trying to document and find figures on niche
markets for processed beans we found that neither the Ministry of Agriculture nor FIRA has such
information, either for Mexico or for the United States. The creation of a Market Intelligence System to
provide such information and skills for agricultural producers and agribusinesses is of utmost importance.
A useful model is Fundación Chile, which works with both the private and public sector to develop and
expand foreign markets for producers. The key to its success has been a highly trained and appropriately
compensated professional staff. In contrast, Mexico’s Ministry of Agriculture has only a small
information system that lacks information on potential markets, consumption trends, marketing
technology, and other key issues, and has insufficient staff capacity to produce the information needed to
foster substantial gains in agricultural competitiveness.
Enhancing production technology
Obtaining benefits from technology adoption depends on encouraging producers to use improved seed
varieties. Yet according to one expert, only 15 percent of total bean production uses improved seeds. It is
particularly difficult for smaller-scale producers to have access to improved seeds. But there are good
examples of successful programs to at least make larger-scale producers aware of these benefits, such as
the introduction of improved pinto beans in northern Mexico conducted by the Bean/Cowpea
Collaborative Research Support Program along with INIFAP.
Some problems that have impeded the more widespread adoption of improved seeds are addressed by the
new Law for Seed Production, Certification and Commerce, which was approved in April 2007. Some
other options to promote the use of improved bean seed varieties in Mexico are:
Promote public-private partnerships (for example with INIFAP) to develop technologies tailored
for Mexican bean varieties and regions, tapping into bean niche markets.
Make agricultural public research institutions fully autonomous, with independent governing
boards that include private and producer organizations. This could help increase funding from
producer organizations both for research and development and for seed distribution.
Conduct a strong information and training campaign to familiarize farmers and agribusiness
owners with the purpose and use of new technology.
Reduce the very long lead times currently required to take genetically modified varieties through
biosafety protocols and develop and distribute adapted transgenic varieties to market.
15
The two basic reasons for this are the lower quality of Mexican beans and the cheaper transport costs to serve the
Hispanic population in the United States. Both of these constraints are addressed in other recommendations in this
report.

8
In addition, some of the current programs within Alianza Contigo need to be modified in order to promote
technology transfer by:
Improving incentives for private providers of technical services, as these are the weakest link in
the implementation chain. They are recruited on short-term contracts, have no entitlement to
secure employment and receive few economic or moral incentives to do a good job.
Changing the project selection process so that funding decisions are based on quality and cost-
efficiency instead of on a first-come, first-served basis and completeness-of-documentation.
Non- GMO technology may have higher potential for improving the productivity of many Mexican
producers than GMOs. But many of the policy issues that in the past have presented obstacles to
development of this market have been resolved by the passage of the new seed law. Policymaking
attention needs now to be focused on policy towards GMOs. While acknowledging that in the case of
GMOs, it is necessary to first put in place a regulatory framework that includes appropriate safeguards
against the well-known risks, we argue that high priority should be placed on putting in place and making
operational the regulatory process required to introduce GMO corn.
Finally, for both beans and other sectors, promoting decentralization of rural policy could help technology
transfer by forcing state governments to internalize all costs and benefits, thus promoting efficiency and
equity in resource use. For example, transferring most of the funds of production-oriented R&D programs
to the states in the form of block grants could facilitate the application of a territorial approach to rural
development. The national government would still reserve funds for itself, to carry out national-level
execution of R&D that is considered strategic in nature.
Taking advantage of economies of scale
One of the main characteristics of bean production in Mexico is its high degree of fragmentation. There
are 570,000 dry bean producers in Mexico, of which only 110,000 are currently registered in the
PROCAMPO census as specializing in beans.16
Since most producers have small landholdings and market
their own crops, it is difficult for them to gain access to credit and improved production technology and to
integrate into the supply chain. Effective associations would help them achieve economies of scale for
these purposes. Associations of bean producers are relatively new and quite small, so there is still much
work to do in terms of promoting and improving them. Currently many of them are more closely related
to political groups than to concerns about efficiency, according to own association leaders interviewed in
Zacatecas. To facilitate the organization and work of associations truly oriented toward member services,
the Agricultural Cooperatives and Associations Organization Law (Ley para la Organización de
Cooperativas y de Asociaciones Agrícolas) needs to be reviewed with an eye toward reducing red tape
and loosening requirements that currently make it difficult for producers to create new associations.17
16
SAGARPA-USDA, 2007
17 A draft reform of this law, which was proposed in the upper house in 2002, seeks a democratization of agricultural
organizations and a more crucial role in agricultural policy and practices. It also considers an integration of the
supply chains to allow greater investment and reduce risk for individual producers. This proposal was dismissed by

9
Reconversion
For some bean producers with high production costs (including the social opportunity cost of the water
they use), the best option for the medium term would be ―reconversion,‖ that is, changing from beans to
another crop or economic activity. Some agricultural authorities (for example in Zacatecas) are pursuing
public policies to encourage reconversion in such cases.
Specific recommendations in this regard are beyond the scope of this note. It is clear, however, that public
support for switching crops—even if only in the form of extension advice—needs to be based not only on
the agronomic suitability of alternative crops, as has sometimes been the case in the past, but also on
economic considerations. This note recommends the use of ―economic densities‖—a measure of the
return for each dollar invested per hectare for different land uses—as a useful analytical tool. While
decisions cannot be based on economic density alone, it is a good starting point for a cost-benefit analysis
to avoid some of the mistakes made in earlier reconversion programs. Other criteria that also need to be
considered include access to markets, environmental and biological constraints, and market and
productivity trends, among others.
Water policy: the need for action
Even though irrigated areas have much higher yields (in beans as well as other crops) and lower financial
production costs, the true social costs of production are much higher than the financial costs, given the
high economic value of water in Mexico. Promotion of efficient water use is urgently needed to help
avoid future water scarcity problems, particularly in the face of increasing urbanization and the effects of
climate change. The World Bank and the Mexican government have amassed a large body of analysis on
options for reform in the water sector; what is needed now is an action plan. A full discussion of this topic
goes far beyond the purview of this study, but given the importance of irrigation in bean production,
water policy and pricing have significant ramifications for this market. There are a number of options for
placing an economic value on water. One is for the public sector to charge an appropriate price for water
that comes from public investments (dams and large irrigation projects). But other options—such as the
assignment (without charge to the recipient) of tradable water rights—also effectively put a price on water
and encourage its conservation and efficient use, while not imposing any cost on the initial water users. In
any case, a good first step is to phase out current implicit subsidies on electricity use for pumping (Tarifa
9) that encourage overuse of water.
Non-NAFTA imports
Countries entering into preferential trade agreements run the risk that when trade barriers are reduced
among the member countries, a country may find itself importing from a member country at a higher real
economic cost (after accounting for the tariff revenue foregone) than it would pay if it continued to import
the same product from a non-member country. (This is the well-known problem of ―trade diversion‖.)
the Senate’s Rural Development Commission without being discussed at the plenary session, and no further reforms
have been promoted since then.

10
This problem is minimized if the preferential trade area includes a country that is a lowest-cost exporter,
compared to others in the global market. Although the highly differentiated nature of beans makes price
comparisons difficult, it seems likely that the United States is generally a globally competitive producer
of beans, so trade diversion may not be a big issue. Nonetheless, it would be prudent for Mexico to reduce
trade barriers for other non-NAFTA sources of supply as well. This would (a) ensure that if there are
indeed lower-cost sources in the world market, Mexico can take advantage of this; (b) minimize the
possibility that market disruptions in the United States could negatively impact Mexico, and (c) ensure a
competitive environment in this market.
The following actions would be ways in which the government could remove barriers to diversification of
supplies, listed in decreasing order of potential benefits:
Permanently remove non-tariff barriers and eliminate tariffs on an MFN basis for imports from all
countries.
Permanently remove non-tariff barriers and eliminate tariffs for imports from select countries.
Permanently open a low- or no-tariff quota for imports from select countries.
Have a contingency plan in place to quickly take one of the above actions in case of price spikes
in the U.S. market.
The permanent actions would introduce more certainty and allow better planning by private sector
importers and users of beans, and the more comprehensive options would allow more diversification
opportunities.
Consensus building to cope with uncertainty of climate change
Long-term policy-making in these and other agricultural markets will have to cope with many
uncertainties, foremost among them the specter of climate change. Mexico may suffer especially from
reduction in water availability, with serious consequences for its agricultural production overall.18
The
implications of this for competitiveness in the NAFTA market are not clear, however, since some of the
most productive areas of the United States are also expected to suffer, and the impact on global markets is
just beginning to be explored. Given the huge uncertainties involved in all of these forecasts, the most
prudent path for the government is probably to establish early on a consultative process with stakeholders
to monitor and review the evidence on the impacts of climate change in order to stay abreast of the most
recent developments and start to build early consensus on necessary policy actions and investments.
18
Impacts on the Latin America and the Caribbean region will be investigated in depth in the next flagship study of
the Latin American and Caribbean Region of the World Bank,

11
I. INTRODUCTION
The countdown is nearly over. Fourteen years after the North American Free Trade Agreement (NAFTA)
was implemented, tariffs and quotas on U.S. and Canadian exports of sensitive agricultural products to
Mexico will be history. This is not an abrupt end to trade barriers but rather the final stage in a gradual
phaseout. Nevertheless there is general concern within many sectors in Mexico about the effects of this
phaseout, particularly since the United States has a competitive advantage in the production, distribution,
and marketing of some of these goods. Increased competitive pressure in the market for dry beans is
worrying producers and policymakers because even though per capita consumption has been falling, they
still are the second most widely planted crop in Mexico (after corn).19
There are major differences between the dry bean sector in Mexico and its northern neighbors. Yield
disparity is one of the main disadvantages for Mexico. In the United States the average yield per hectare
is 2 tons, while the average in Mexico is 0.80 tons overall and 1.1 tons for commercial producers (who
account for 80 percent of total production). Although lower yields drive up production costs in some parts
of Mexico, imported beans compete against national varieties more on the basis of quality than price.
Because most imported varieties cook faster, consumers save time and spend less on energy.
Discussions on NAFTA have tended to focus on disparities in U.S. and Mexican agricultural subsidies.
But while subsidies are a contributing factor, other important competitive advantages of U.S. producers
are in yields and quality. Although Mexico imports some beans from Canada and Nicaragua, this concept
note will mainly analyze Mexico’s dry bean market in relation to the United States, which accounts for
more than 95 percent of Mexico’s bean imports.
Key elements of this analysis are based on average variable cost and general equilibrium models, which
help understand the implications of price changes for the economy as a whole or for particular markets. In
both models, variation in production costs was analyzed in relation to access to technology, credit, scale
of production, and transport costs, assuming no difference between varieties of beans. It is also important
to note that because reliable regional and time-series information was not always available, regional
consumption of different bean varieties and other important information was estimated, as explained
below.
Considering the above limitations, this concept note analyzes and discusses:
1. How the Mexican bean market works and how it relates to the international market.
2. How the final stage of phasing in NAFTA will affect Mexican producers and consumers.
3. Domestic and international competitiveness of commercial Mexican bean producers.
4. Strengths and challenges of Mexican bean producers
5. Constraints to making the most of the fully integrated North American dry bean market
19
Over 1.8 million hectares of beans were planted in 2006 (SIAP database, 2007).

12
6. Public policies that could help Mexico maximize the benefits of NAFTA, and improve the
competitiveness of Mexican producers, and protect the interests of Mexican consumers. Policy
options discussed in this report include those that have special relevance for the corn market, but
not general subsidy programs, such as Procampo or Ingreso Objectivo, which will be taken up in
the ongoing agricultural public expenditure review.
The focus of this study is competitiveness, not poverty alleviation per se. Much of the World Bank’s work
in Mexico and elsewhere is focused on poverty, including the 2005 report Income Generation and Social
Protection for the Poor, which includes a special section on rural poverty. The ongoing agricultural
public expenditure review will also include equity concerns as a primary criteria for evaluation of
spending programs.
The note is divided into five sections. Following the introduction, the second section analyzes recent
developments in the international bean market, their implications for Mexico’s domestic market, and the
outlook for bean prices in the future. This section also describes the bean market in Mexico, the effect that
price changes in the United States may have on consumption in Mexico, and the main reasons for the
slow growth of Mexican bean production.
The third section examines the effects of the final phaseout of tariffs on the bean sector and the broader
economy, as well as illustrating the benefits NAFTA has already had by using a general equilibrium
model (GEM) to simulate a scenario in which Mexico imported less beans from the United States. The
last part of this section analyzes the competitiveness of Mexican bean producers in six major consumption
centers using data provided by ASERCA. Supply curves for each market allow detailed comparison of the
cost structure of production in rainfed and irrigated areas and call attention to water pricing issues that
could have serious implications for production on irrigated land. The cost analysis also helps assess the
impact of supply logistics on bean prices.
The fourth section presents a set of policy options for reducing marketing and logistical constraints on
Mexican producers under NAFTA. The three main issues addressed are (a) lack of the managerial and
entrepreneurial skills needed to tap into niche markets for dry beans, (b) high transport costs, and (c) lack
of competition and market distortions in the storage warehouse system.
The fifth section presents policy options in the area of production technologies and financial mechanisms
that could increase the competitiveness of commercial producers. These recommendations point to the
urgency of adopting technology (particularly biotechnology), increasing the scale of production by
promoting growers associations, and reconverting some land to other uses based in part on an analysis of
the economic density of different crops. Other areas that are touched on in less detail include (a)
reshaping public policies to encourage investment, (b) improving financial mechanisms by cutting
transaction costs, and (c) making income insurance available as a counterpart to current crop insurance
programs.

13
II. THE INTERNATIONAL AND DOMESTIC BEAN MARKETS
Beans are still one of the main foods consumed in Mexico. Although Mexico is the world’s fifth largest
dry bean producer, it is also the third largest importer and is becoming increasingly dependent on U.S.
beans, which are usually better quality and faster cooking. Mexican yields are relatively low and need to
be improved in most areas, including commercial production. While commercial growers using irrigation
have very high yields, they also depend on virtually free water that they pump with subsidized electricity.
Mexico’s growing stocks of black bean, which accounts for about 30 percent of consumption, puts
downward pressure on prices and demonstrates the need to rethink public policies on commercialization
and storage of beans. Mexico’s bean production has increased only slightly (0.8 percent) during the last
15 years, largely due to lack of investment and technology, land tenure problems, improper public
policies, and cultural issues.
Although dry beans as a commodity classification includes many distinct types of legumes (such as
garbanzo beans, dry peas and lentils), this analysis only deals with the common bean or Phaseolus
vulgaris. The more than 70 varieties of common bean grown in Mexico fall into three general categories:
black, pinto, and light-colored. Of these threee groups, light-colored beans includes the largest number of
varieties, including flor de mayo, flor de junio, bayo, azufrado hidalguillo, peruano, and mayocoba.
About half the bean produced in Mexico are light-colored beans, 30 percent are black beans, and about 20
percent are pinto beans (Table 1).
Table 1. Snapshot of the Bean Sector in Mexico and the United States
Mexico
2002 2006
planted area (ha) 2,228,107 1,809,680
harvested area (ha) 2,054,362 1,723,219
production (ton) 1,549,091 1,385,784
black n.a. 539,689
light color n.a. 656,089
pinto n.a. 190,005
yield (ton / ha) 0.75 0.8
Commercial yield 1.07
producers 570,000 570,000
commercial
non-commercial
exports (ton) 5,572 12,001
imports (ton) 101,206 129,085
commercial production (ton) 1,239,273 1,108,627
non-commercial prodn (ton) 309,818 277,157
United States Beans (United States)
2002 2006
planted area (ha) 780,907 659,544
harvested area (ha) 703,695 622,233
production (ton) 1,539,910 1,231,796
yield (ton / ha) 2.19 1.98
dry bean farms 8,647 n.a.
exports (ton) 339,967 380,456
imports (ton) 124,871 120,452
Sources: SIAP, IQOM, SIAVI, SAGARPA, USDA.

14
Although beans are consumed throughout Mexico, not all varieties are consumed everywhere.
Consumption trends depend on quality, consumer preferences, and tradition. These differences help
explain the enormous price range among varieties. For example, in Mexico City or other markets some
varieties of light-colored beans, such as peruanos and azufrados (especially hidalguillo), cost more than
twice as much as black beans grown in Zacatecas. Black beans are the main type consumed in southern
Mexico and are virtually the only variety consumed in the Yucatan peninsula, whereas light-colored
beans are preferred in the northwestern states. In central Mexico, especially the Mexico City area, all
kinds of beans are consumed. Although there are no public statistics on consumption trends, these
preferences are well known among authorities, distributors, and producers.
The first marketing problem is to match supply and demand for different types of beans, because just as
consumption preferences vary, the type of beans produced also varies from one area to another. Currently
the states of Zacatecas, Durango, and Sinaloa, account for 60 percent of total bean production in Mexico
and together with Chihuahua, Chiapas, and Nayarit they account for 75 percent. Each state specializes in
different varieties because of soil conditions, technological packages, and access to market. For example,
commercial black bean production is basically concentrated in Zacatecas, Durango, and Chiapas. Most
commercial production is found in Zacatecas and Durango because black beans are the most drought and
pest resistant. This means that the crop is transported long distances to main markets. Sinaloa mainly
grows light-colored beans, which fetch higher prices because they have greater access to niche markets in
urban areas, are of better quality, and add value through processing, canning, and packing them with
better technology.
II.1. Mexico within the International Bean Market
The world’s principal dry bean producing countries are Brazil, India, China, Myanmar, Mexico, and the
United States. Although Mexico is ranked fifth in production (see Figure 1), it is also a net importer of
dry beans.
Figure 1. Leading Producers of Dry Beans (2002–06 average)
Thousand tons
1,0961,340
1,6061,902
3,0703,158
0
500
1000
1500
2000
2500
3000
3500
Bra
zil
India
Chin
a
Myanm
ar
Mexi
co US
Source: FAO

15
Figure 2 shows the trade flows between principal dry bean producers and consumers throughout the
world. The size of the circles represents the volume of exported or imported dry beans in each country in
2005; the width of the arrows represents the share of total imports in the consuming countries. Mexico’s
principal dry bean trading partner is the United States, which supplies 95 percent of Mexico’s imports.
The reduction and elimination of tariffs under NAFTA has strengthen that relationship. Imported beans
account for less than 10 percent of national consumption in Mexico. Roughly half of imports are
premium-quality black beans, while the rest are pinto beans.20
Pinto beans represent about 25 percent of
all U.S. exports, and black beans represent about 13 percent of exports.
Figure 2. Trade Flow in Dry Beans (2005)
Main exportersMain importers
>95% of dry
bean imports in
Mexico come
from US
> 85%
60-85%
35-60%
10-35%
< 10%
% of imports and
exports per country
1
2
3
4
1
2
3
Source: FAO Trade Database
Table 2. U.S. and Mexico Dry Bean Trade
2003–05 average (tons)
Imports Exports
Mexico 73,000 18,000
United States 152,000 288,000
Source: FAO.
Mexico exported an average of 18,000 tons of beans per year to the United States during 2000–05, which
accounted for about 12 percent of U.S. imports. These exports were mainly black beans, the type most
consumed by Hispanic population in the United States. Black beans represent about 20 percent of total
U.S. consumption.
As the information above shows, bean trade depends not only on efficiency but also on tastes and
preferences for different varieties. Therefore, although productivity is still an important limitation for
Mexican dry bean producers, there is still room to tap into the U.S. market to meet demand for varieties
20
USDA, Dry Bean Outlook.

16
that are not produced in sufficient quantity domestically. Average yields of U.S. producers (for all beans)
are more than twice the average for all Mexican producers and are still 85 percent higher when compared
only to commercial producers in Mexico (see Figure 3).21
Although productivity varies from one variety to another, this is not mainly due to differences in the
varieties themselves, but rather to differences in soil, weather, technology, and use of improved seed
varieties.22
Thus, the comparison of average yields among countries is still relevant because it denotes
differences in production processes.
Figure 3. Yields in Major Producing Countries
0
0.5
1
1.5
2
1996
1997
1998
1999
2000
2001
2002
2003
2004
2005
2006
US
China
Brazil
Mexico
Myamar
-0.4%
2.7%
3.1%
4.1%
-1.3%
CAGRTon/ha
India
2.0%
Source: FAO and SIAP
As Figure 3 shows, trends for Mexican bean yields have been fair, increasing at a compound annual
growth rate (CAGR) of 2 percent over the past 10 years. But Mexican yields are below those in the
United States, making the future uncertain for Mexican producers. However, Mexico’s low average yield
masks a sharp difference between yields for irrigated and rainfed production. During the 2006 fall/winter
growing season irrigated yields were about twice as high as in rainfed areas, while in the spring/summer
cycle they were 145 percent higher (Figure 4). Although productivity in rainfed areas has increased more
rapidly during the past ten years, at present rates the productivity and income gap between irrigated and
rainfed producers will not close significantly in the short or medium term.23
21
Based on the weighted yield average for 57 municipalities with the highest yields, which account for 70 percent of
total bean production. This yield is 1.07 tons per hectare while the national average yield is 0.8 tons. 22
Differences in costs may be due to differences in seed prices. However, the use of inputs is practically the same,
according to ASERCA and AMSDA, the Association of State-Level Agricultural Ministries. 23
30 percent of bean production was from irrigated land in 2002–04.

17
Figure 4. Yields in Mexico by Technology and Season
0.2
0.4
0.6
0.8
1
1.2
1.4
1.6
1.8
21996
1997
1998
1999
2000
2001
2002
2003
2004
2005
2006
Autum-irrigated
Spring rainfed
Autum-rainfed
Spring-irrigated0.9%
0.9%
1.2%
2.1%
CAGRTon / ha
Source: SIACON
The gap in productivity reflected in Figure 4 is not attributable to irrigation alone, but is also due to
irrigated producers having larger landholdings and greater access to credit. Better-off farmers use more
technology and plant improved seeds that yield beans that command a higher market price, while poorer
producers with less technology and lower risk tolerance continue to grow traditional varieties of black
beans that are more resistant to pests and drought but fetch lower market prices. Therefore, producers in
the states of Zacatecas, Durango, Chihuahua, and San Luis Potosí are growing a lower-value black bean
crop while those in Sinaloa and Nayarit, where production is irrigated and more technified, grow light-
colored and pinto beans that fetch higher prices. This suggests that black bean producers are not
responding to market signals, which indeed appears to be the case. Black beans are grown mainly by
small producers who receive substantial public and private transfers, especially remittances. They also
tend to be older (the mean age is 54 and 60 percent are older than 64)24
and out of tradition, habit,
security, and lack of information and resources they continue to grow and sell the same crop they always
have, which is well adapted to surviving harsh climate conditions.
Currently, irrigated beans represent 27 percent of all bean production in Mexico (2006) and roughly 35
percent of total commercial production.25
This means that virtually all irrigation is for commercial
production. as seen in Figure 5, there are striking difference in the regional distribution of rainfed and
irrigated production, which corresponds to different types of beans as well (most black bean production is
from rainfed areas, while most light-colored beans are grown in irrigated areas). This, among other
reasons that will be explored in the next section, explains why bean productivity has been low in Mexico.
24
According to producer associations interviewed. 25
Considering that 20 percent of all bean production is for self-consumption. This estimate was provided by FIRA.

18
Figure 5. Irrigated and Rainfed Production in Principal Bean Producing States, 2006
0
100,000
200,000
300,000
400,000
500,000
Zaca
teca
s
Dura
ngo
Sin
alo
a
Chih
uahua
Chia
pas
Naya
rit
San L
uis
Poto
sí
oth
ers
Irrigated Rainfed
90%
99%
61% 99% 66% 80%
72%
Source: SIAP 2006
II.2. Why Has Growth in Bean Productivity been Slow?
There is clear evidence that the slow growth in Mexico’s bean production is due to lack of inputs
(technology, mechanization, and improved bean varieties), land fragmentation (particularly in ejidos), and
persistence of cultural practices that perpetuate inefficient production. However, the interesting question
is why these well-known factors have gone so long without being addressed
According to some experts, most beans growers use their crops for self-consumption (less than 25 percent
of growers are considered commercial producers.26
Most producers with very low yields continue to grow
beans for three main reasons:
Household consumption, because they have few other alternatives for producing food.
Cultural tradition and habit, because they have grown beans for many years (many are older
producers, with 60 percent above age 64).
Lack of economic incentives, because they receive public subsidies for continuing to plant beans
and their income is augmented by other monetary transfers such as remittances.
According to studies by SAGARPA, the PROCAMPO program contributes to this stagnation by paying
subsidies to low-yield growers as long as they keep cultivating beans.27
Resistance of inefficient, low-
income bean producers to reconverting their land to other crops is partly due to low tolerance for risk,
lack of alternatives, reliance on remittances for income, aging population (mean age of 54 years),28
and
lack of information. In most areas these factors have inhibited change and helped perpetuate low yields
for years. Lack of coordination among agricultural subsidies at the federal level has also given producers
26
Some sources indicate that there are more than 500,000 bean producers in the country (570,000 [FIRA 2007] or
even 650,000 [Anaya 2004] in newspaper articles), although only 110,000 are commercial producers (SAGARPA-
USDA 2007) 27
Galarza Juan Manuel, op cit 28
According to producer associations interviewed in Zacatecas.

19
incentives to continue growing beans, according to the Minister of Agriculture of Zacatecas and the
National Association of State-Level Ministers of Agriculture (AMSDA).29
According to principal bean
buyers, the fact that there is little or no crop rotation or availability of technology in some bean producing
areas, such as Zacatecas, has also contributed to persistent low yields. In addition, Mexico’s land tenure
problem has made land a nonliquid asset, which contributees to low productivity because it inhibits
producers from moving to other activities and selling their lands.
In contrast, commercial bean producers improve their efficiency by investing capital, scaling up
production, integrated with main markets, and using improved seeds. This is true for commercial
producers both in rainfed areas of Zacatecas, Hidalgo, Durango, and Chihuahua as well as in irrigated
areas of Sinaloa, Nayarit, Chihuahua, and Hidalgo.
The rise in productivity since the late 1990s, mainly among commercial producers, is largely due to
increased support from the federal government, through the introduction of technology, training and
technical assistance, mechanization, and improved seeds and fertilizers. More specifically, programs such
as technified irrigated lands, subsidies for commercialization (ASERCA), mechanization, and intense
programs of technology adoption by INIFAP, as well as the kilo por kilo program,30
have helped improve
yields in commercial areas.31
To understand how the future will look and the main challenges ahead for commercial producers in the
face of NAFTA in Mexico, it is important to understand how support policies have developed over time,
and how international bean prices have been changing recently, in large part due to the conversion of land
to corn production in the United States.
II.3. Public Policies Related to Bean Production in Mexico
From the mid-1930s until the 1990s the Mexican government played a vital role in agricultural marketing
through the National Popular Subsistence Company (CONASUPO), a public entity that controlled prices
and agricultural trade within the country. This entity was in charge of regulating agricultural markets by
purchasing crops from producers and transporting them to consumption centers.32
CONASUPO was also
in charge of setting both producer and consumer prices, and absorbing the losses generated by logistical
expenses. The result was a highly bureaucratic and inefficient marketing framework in which the high
costs of commercialization depended on the federal budget. Between the economic crisis of 1982 and the
29
Both interviewed by IMCO mention that the federal government’s reconversion program encourages producers to
move away from beans, while PROMAF encourages small producers to continue growing beans in order to receive
government support. 30
This is a program to encourage the use of improved varieties, replacing native varieties in areas were there is
potential. 31
Galarza Juan Manuel, Miramontes Ulises and Muñoz David in ―Situación Actual y Perspectivas del Maíz en
México 1990–2004‖ SAGARPA 2004 32
Yúnez-Naude Antonio. ―The Dismantling of CONASUPO, a Mexican State Trader in Agriculture‖. The World
Economy, Vol. 26, No. 1, 2003, pp. 97-122

20
liquidation of CONASUPO in the mid-1990s, CONASUPO’s role was limited to the distribution of beans
and corn. After CONASUPO closed, nearly 80 percent of its storage capacity was privatized.. 33
Some bean producers established agricultural associations with government support to commercialize
some of their production; today they control nearly 20 percent of all bean distribution. Such organizations
receive subsidies for storage, distribution, and transport, as well as for buying the crops of their member
producers. In some areas, such as Sinaloa, these organizations used federal support programs as well as
local resources to create a private Commercial Integrator (ICOSIN) that has successfully achieved greater
economies of scale by uniting different producer associations.
Producer associations negotiate subsidies directly with the government, while acting as mediators
between individual producers and authorities. They receive money from ASERCA and local governments
(only in some wealthier states such as Sinaloa) and are in charge of managing transport subsidies and
maintaining warehouses and processing plants.
Producers who are not members of associations also receive government support through both
commodity-specific and general support programs. Commodity-specific programs include:
Corn and Bean Productive Chain Support Subprogram (PROMAF)
Storage–Loan Collateral Program
Competitiveness Support
Bean producers receive additional aid through all of the general agricultural support programs. While this
study does not include the major general support programs such as Procampo (which are the subject of an
ongoing agricultural public expenditure review by the World Bank), it does include some that have
special relevance for beans producers (including water and electricity subsidies, insurance and export
subsidies).
PROMAF
The most recently approved federal support program focuses on improving the productivity of producers
with fewer than five hectares that are located in high potential areas as identified by INIFAP. The
program is limited to these specific areas so that the support only goes to growers who will be able to
achieve meaningful gains through the program’s credit opportunities. However, this program may
interfere with other policies such as reconverting land used for bean cultivation to other crops or
activities. In Zacatecas, the local Minister of Agriculture believes that this program is giving producers
incentives to grow beans, while the aim is actually reconversion.
33
12 million tons of grain stock were managed by Boruconsa, while only 23 million tons were privately managed
(Jurado, 2007).

21
Emergency and competitiveness support programs
Other programs to consider are the Competitiveness Support program (Apoyo a la Competitividad de las
Ramas Productivas) and the Emergency Risk Program (Fondo de Riesgo Compartido para el Fomento de
Agronegocios) implemented by SAGARPA’s Subsecretaría de Agricultura. These programs support diverse
investments to improve competitiveness throughout the bean production and marketing chain and also help
producers convert to other crops (such as fodder crops in Zacatecas). They do not provide price support.
Storage–loan collateral for beans
Another support scheme is the storage–loan collateral program (acopio-pignoración), in which a
warehouse (authorized by the National Banking and Securities Commission) receives the beans as a
security and gives the producer a certificate approved by the Banking Commission. These certificates are
used as collateral to secure credit from private banks for up to 80 percent of the crop’s value, which
producers can use to purchase inputs for the next harvest. The crop used as collateral is stored at the
warehouse until it is sold, at which time the producers receive the money to pay their credit.
Once a producer leaves their beans in a warehouse, they cannot renegotiate the terms of the credit and
thus must sell the beans within six months, the maximum allowable term of the credit. Stakeholder
consultations during preparation of this report indicated some concerns that distributors, aware of this
arrangement, wait until the end of the credit period and then negotiate a bean price that is lower than those
previously agreed by the producer associations. According to the producer associations, since some
middlemen know that producers receive a credit subsidy of 20 percent to store their crops and 1.5 pesos
per kilo when they sell the beans to the producer associations, and that producer associations receive
another 1.5 pesos per kilo for storage and transport,34
middlemen try to purchase the beans at 80 percent
of the producer association’s price after subtracting 3 pesos per kilo. This means that market prices can be
below the price paid by the producer associations, which effectively makes the middlemen the
beneficiaries of the producer subsidies. This occurs because only about 25 percent of all black bean
production receives this support (according to producers and agricultural authorities in Zacatecas) due to
lack of sufficient funds, but the growers who do not receive the support still must sell to middlemen under
the same conditions as those who do.
Smaller producers in areas that have a high specialization in growing dry beans, such as Zacatecas,35
usually have access to state-financed warehouses where they can leave their crops for a price previously
set by the government (in the state’s Official Gazette). Despite being limited only to small producers, the
state-subsidized storage programs in Zacatecas have been handling 120,000 tons of beans per year,36
which represents one-third of average annual production during the past five years.37
In some other states,
such as San Luis Potosí, access to subsidized warehouses is not limited to small producers.38
34
Paid by ASERCA 35
Producers in PROCAMPO with fewer than 20 ha. SAGARPA, oficio No. 070/04, March 9, 2004 36
Gobierno de Zacatecas, 2007 37
SIACON, 2005; SIAP, 2007 38
Diario Oficial del Estado de San Luis Potosí, March 13, 2005

22
Because a significant part of transport and marketing costs for black beans is absorbed by the
government, producers continue to grow black beans even if they are not consumed locally and must be
transported to more distant regional markets. However, the major reasons farmers continue to grow black
beans in Zacatecas is that this variety is:
More resistant to pests and drought.
Not stained by rain.
Already adapted to the region after many years of cultivation.
Thus, from the producer’s point of view there is a tradeoff between growing low-risk, low-value crops
like black beans and changing to a more valuable but more risky variety. If farmers do use other seed
varieties, they must also have better access to markets for those types of beans.
Export subsidies
Though not specific to beans, Mexico’s agricultural export subsidy program has provided support to bean
producers. According to producers in Sinaloa, the federal government bank supporting exports
(Bancomex) last season gave an extra 1,400 pesos per hectare to producers who exported beans.
However, this policy did not have a significant effect because Mexican exports to the United States have
been low in the past few years and are mostly from states such as Sinaloa where growers are producing
types of beans that already command higher prices.
Current price increases in the United States present an opportunity to export beans, especially pinto and
mayocoba beans for which there is increasing demand in the United States but little if any domestic
production. Even if Mexican black beans could be exported (currently half of Mexico’s imports from the
United States are black beans) there is little market for them in the United States (only 68,000 tons per
year, according to one of the principal bean traders)39
and the quality of the U.S. beans is higher.
For export programs to work best they need to be transparent and available to all producers. However,
traders claim that currently it is not clear who gets the export support and how much they receive.
The most important general programs received by bean producers are:
Insurance
Bean growing has an especially high risk in rainfed areas. Erratic climate may cause the loss of a large
part of the crop due to excess rain or drought. For example, in 2005 growers in the state of Zacatecas lost
43 percent of their bean crop to drought.40
Moreover, an estimated 10 percent of the crop is typically lost
in storage due to excessive moisture and heat. In 2006, AGROASEMEX insured 153,832 hectares of dry
beans, which represents about 15 percent of the total area planted in beans. Two-thirds of the insurance
was purchased by the government of Zacatecas, the state most at risk to drought. However, it can be
39
Interview with Almazan commercial director and CEO by IMCO 40
SIACON database, 2006

23
difficult to convince older growers to buy insurance (nearly 40 percent of producers in Zacatecas are older
than age 60), which implies that fostering cultural change is an important part of promoting insurance.
Transport
This is also an important support program for bean producers, especially in the State of Sinaloa. The final
destinations of most of the beans produced in this state are Mexico City, Monterrey, Guadalajara, Tijuana,
and Nogales. Since transport costs are relatively high, producer associations have received some support
for logistics through ASERCA’s Commercialization Support Program.
Electricity and water subsidies
Electricity rates are subsidized in agricultural areas, which is a substantial benefit for producers who use
electricity to pump water for irrigation. Moreover, the real cost of water is not reflected in the nearly
nonexistent water tariffs currently in place, which have no relationship to scarcity, demand, or economic
value in different areas. To evaluate the extent to which water prices are distorted, Section III.3.1 includes
an analysis of water and its real economic value in agricultural use.
According to producer associations, the main problems with current public policies on beans are:
There is no long-term perspective.
Programs are not coordinated and often have conflicting effects.
Programs are limited and only benefit about 25 percent of producers.
Programs for commercialization and reconversion need to be redefined.
This means that:
A significant portion of the benefits from subsidies end up going to middlemen and distributors
because they are able to buy from producer organizations at a price that discounts the subsidies
the producers receive, although only about 25 percent of producers even receive that support. The
structure of the market allows a high degree of concentration in buying and packing, whereas
producers are typically numerous and dispersed. This may explain the high differential between
consumer and producer prices.
The commercialization support given by ASERCA to some distributors or storage facilities has
also created market disruptions. Those that receive the subsidy are able to sell their stocks
cheaper, driving down the market price even for distributors that do not receive a subsidy. This
may be causing losses for all distributors in terms of price, storage, and financial expenses.
The role of state authorities with very limited resources, such as those in Zacatecas and Durango, is to
coordinate federal programs aimed at promoting reconversion. This is why they do not use all resources
in all programs. For example, in Zacatecas PROMAF support (to increase the productivity of small
producers) has been limited because one of the state government’s key policies is to reconvert bean
production to fodder crops.

24
II.4. Dry Bean Prices in the United States
Because of the continuing conversion of agricultural land to corn production for ethanol in the United
States, in recent months the U.S. domestic price for both black beans and pinto beans has been increasing,
which in the short-run also increases the price of imported beans in Mexico (Figure 6). This trend may
reverse some of the expected outcomes of phasing out tariffs in the U.S.–Mexico bean trade under
NAFTA.
Figure 6. Wholesale Price of Dry Beans in Mexico and the United States
2,000
5,000
8,000
11,000
14,000
2001
I
2001
IV
2002
III
2003
II
2004
I
2004
IV
2005
III
2006
II
2007
I
Black US Black MX Black imp
Pinto US Pinto MX Pinto imp
Pesos / ton
Source: SNIIM and USDA.41
Prices in the United States are expected to continue increasing during the next few years (as domestic
production declines slightly) and to then remain at the higher price as a result of lower U.S. bean stocks and
higher prices for competing crops. Production is not expected to fall as sharply as plantings (bean acreage
decreased 8 percent in 2007) because yields are expected to increase by about 5 percent. Nevertheless,
changes in prices have already been significant, with an average increase of more than 20 percent from 2006
to 2007 (more than 30 percent for pinto beans and 15 percent for black beans). This could offset the
elimination of Mexico’s tariff on U.S. beans (currently 11.8 percent) at the end of the 2007.
This will be analyzed in more detail in the next section because the net effect relates to consumption
trends in the principal consumption markets. Furthermore, in the opinion of principal bean buyers in
Mexico, bean prices could still increase in coming years because land is becoming more expensive in the
United States, where the cost of field rentals has increased 20 to 30 percent. In addition, droughts in
Eastern Europe, Australia, and parts of China will also raise the price of many crops in the short term.
41
The 2007 third-quarter prices for Mexico consider only July and August; the United States prices are USDA
estimates. U.S. prices consider the black bean wholesale price in Michigan (Black US) and the pinto wholesale price
in Colorado (Pinto US). Black MX are black bean prices in Mexico City’s wholesale Mmarket (considering
Veracruz and Zacatecas varieties), while Pinto MX considers pinto beans of any domestic origin. Imported prices
both for black and pinto beans are from the Central de Abastos DF.

25
The most surprising aspect of Figure 6 is the enormous difference between wholesale prices in the United
States and Mexico. This is mostly explained by logistical costs (transport, storage, and financing), which
are greater for beans than for corn and many other crops because beans are transported in 50 kilogram
sacks. Another reason for this difference is the profit margin of distributors and tariffs. According to
buyers, there currently is a natural difference of 3,000 peso per ton between U.S. and Mexican prices, yet
the data in Figure 6 reflects an average difference of 4,500 peso per ton between the U.S. and Mexican
wholesale prices of U.S.-grown beans, which is explained by the higher tariffs that were applied in
previous years as the rate gradually declined during the NAFTA transition period.
Finally, it is worth noting that in contrast with Mexico, support programs for dry beans in the United
States are limited. According to the current farm bill (Farm Security and Rural Investment Act of 2002),
dry beans are considered a specialty crop and are not eligible for direct price or income support programs.
The new farm bill, which is being discussed in Congress, is considering the alternative of including
specialty crops in these programs.42
. There are no other special programs intended for beans; they only
receive general agricultural support such as better credit terms and other indirect support. Nevertheless,
the U.S. government purchases dry beans through the USDA for school lunch, child nutrition, and other
food programs.43
II.5. Dry Bean Consumption in Mexico
There as been a slow but steady decrease in per capita consumption of dry beans in Mexico in recent
years (Figure 7), mainly because they are being replaced by products richer in calories or protein such as
bread, chicken, eggs, and meat. At the same time stocks of beans, particularly black beans, are reaching
record levels while prices are falling. This represents a challenge for producers and policymakers.
Figure 7. Per Capita Bean Consumption in Mexico
25
35
45
55
65
75
1992
1993
1994
1995
1996
1997
1998
1999
2000
2001
2002
2003
2004
2005
Grams consumed per day
Eggs
Beans
Chicken
Source: FAO
42
Rawson, Jean M. ―Specialty Crops: 2007 Farm Bill Issues.‖ CRS Report for Congress. Congressional Research
Service. July 23, 2007 43
USDA, http://www.ers.usda.gov/Briefing/DryBeans/Background.htm

26
Imports of black beans in Mexico have been increasing and now account for about half of dry bean
imports, although they still represent only a small share of black bean consumption (less than 10 percent
of all beans consumed in Mexico are imported). The reason there is higher demand to import black beans
is that they are also better quality than domestically produced beans and cook faster than other black
varieties (such as negro bola). Paradoxically, despite being more expensive, most imported beans are
consumed in the areas with the poorest populations.44
The explanation may be that poorer consumers get
more of their calories from beans relative to wealthier populations, they consume more beans per capita,
and therefore they choose varieties that require less fuel and time to clean and prepare.
Another problem is distribution: there are high transport costs for supplying beans to main consumption
markets, which are located far from the principal producing areas (Figure 8). Most bean consumption
markets are related to the size of the population. Thus, main cities can be used as a proxy for major
consumption markets. However, to be consistent with the information provided by ASERCA, the analysis
in the following section used the main transport routes between hubs that collect beans and main
consumption markets to determine these markets (see Appendix 2). Consequently, the study looks at six
main consumption markets: Mexico City, Guadalajara, Monterrey, Tijuana, Ciudad Obregón, and
Torreón,45
which together represent about 60 percent of total dry bean consumption in Mexico.
Figure 8. Main Consumption Centers and Producing States
Main consumption markets
Guadalajara
DF y Edo mex
Monterrey
CD Obregón
Tijuana
Torreón
Main producers (States)
Canned bean plants
San Luis Potosi
Puebla
Source: SIACON and FIRA
44
According to principal bean distributors interviewed at Central de Abasto office in el Alazan. 45
This information was also corroborated with principal dry bean producer organizations and obtained similar
results.

27
III. IMPLICATIONS OF 2008 TARIFF PHASEOUT FOR MEXICO’S DRY BEAN MARKET
In this section we analyze the effects that NAFTA’s 2008 phase-out could have on the Mexican dry bean
market. To explain the subject in detail, this chapter is divided into the following three sections.
The first section describes and evaluates the extent to which NAFTA has already integrated the dry bean
market in North America.
The second section describes the effect NAFTA has had on the Mexican economy by measuring the
effects that an interruption of NAFTA could have on the economy as whole. The analysis is carried out
using the General Equilibrium Model (GEM) explained in detail in Appendix 1.
The third section describes the competitive status of commercial dry bean producers in the six main
consumption markets mentioned in the previous section. Producers’ competitiveness is measured by
comparing producers’ average variable costs in the field, per municipality, plus the logistical costs of
taking this production to market. This analysis not only compares producer efficiencies in each market but
also allows comparisons between cost structures across areas, and helps to understand some of the key
strengths and weaknesses of producers in different areas.
III.1. Integration of the North American Dry Bean Market under NAFTA
As explained previously, in 1994 the Mexican Government negotiated to open the dry bean market
gradually over a 14-year period through a quota system, known as ―cupos.‖ This meant that dry beans
could be imported in assigned quantities that the government established with no tariff. At the beginning,
these quantities were assigned for each year from 1997 to 2007 (shown in gray bars in Figure 9). In
reality, these quantities have all been exceeded in the past ten years, except for the year 2004, meaning
that the prevailing tariff was paid for all imported beans, as indicated above the gray bars. Recent trends
in consumption of imported beans show that the 2008 tariff phase-out could benefit consumers in Mexico,
because the country is currently importing levels above the gray bar. However, this will also depend on
price changes in the United States, which have been rising recently.
The amount of beans imported or the gain in market share of imported beans will be estimated for each of
the six consumption markets analyzed below when we explain the construction of supply curves for each
of these markets. This analysis will be done for those imported beans that are assumed to compete with
Mexican beans in terms of variety and quality, except in this case imported beans will replace national
beans supplied in local markets.

28
Figure 9. Dry Bean Imports and Cupos (1997–2007)
0
20,000
40,000
60,000
80,000
100,000
120,000
140,000
1997
1998
1999
2000
2001
2002
2003
2004
2005
2006
2007
total imports quotas
tons
Source: IMCO, prepared with data from IQOM, Secretaría de Economía, FAO, and SIAP forecasts o.
Therefore, the overall effects of eliminating the remaining 11.8 percent tariff in 2008 could result in a
reduction of about 8.5 percent in the wholesale price of imported black and pinto beans, which is not
enough to match cheaper Mexican beans. However, according to principal bean traders, the market share
of imported beans will continue to increase at a consistent rate between 1 and 2 percent per year, since
they are preferred by a niche market because they are cleaner and faster to cook. This obviously worries
producers in Zacatecas and Durango because, according to state authorities, one of every three Zacatecans
makes his or her living one way or another other from beans.
This is nothing new: it has already been happening for the last four years, according to local producers’
organizations. Harvests of black beans from Zacatecas have been more difficult to sell at competitive prices,
even in years of scarcity. For example, in 2005 production losses were up to 70 percent in Zacatecas,
according to state authorities,46
and even then black beans could not fetch high prices. According to
authorities in Zacatecas and some producers’ organizations in this state, this has to do with high stocks and
producers selling their crops cheaply to middlemen who buy when producers need to pay their loans.
The three main reasons to believe imported beans could increase their market share in coming years are:
U.S. producers are more cost efficient and have been reducing costs over time. Although U.S.
black beans fetch higher prices in Mexico than national black beans, U.S. producers still have
room for improvement.
U.S. beans are high quality, although many argue that they are not as tasty as Mexican varieties.
Black bean producers in the United States have more favorable conditions for marketing their
crops because they can obtain money interest-free for up to six months.
46
IMCO interviewed the Minister of Agriculture of the State of Zacatecas, Daniel Fajardo Ortíz. According to the
SIACON database, 45 percent of planted bean area was not harvested the same year. These figures are less dramatic,
but they do reflect a major loss due to drought.

29
Since the price volatility of black and pinto beans in Mexico and the United States47
is almost the same
and the Ministry of Economy has administered cupos in the same way since 1994, it may be said that this
Ministry has not caused any delays or shortages of beans by not facilitating a cupo. Otherwise, price
volatility would be higher in Mexico. Therefore, it may be said that the 2008 tariff phase-out will only
impact prices by the tariff reduction because there is no sign that the government has been manipulating
quotas to protect domestic producers.
In the following section we analyze the effect on the dry bean market if NAFTA is interrupted. To
illustrate these effects on Mexican consumers and suppliers, we analyze this scenario by using the
General Equilibrium Model.
III.2. The Effect of NAFTA under a General Equilibrium Model
To understand the significance of North American dry bean market integration, we analyze the possibility
of interrupting NAFTA; in other words, reducing dry bean imports by 80,000 tons.48
We constructed this
scenario under a General Equilibrium Model (for further information on how the GEM is constructed,
refer to Appendix 1). The results were as follows:
Dry bean prices could rise in relation to other products by 25 percent.
Prices of other crops would barely rise, below 0.3 percent (see Figure 10).
The price escalation would result in a minimum change in welfare of 45 million pesos.
`Figure 10. Effect of Reduced Bean Imports on Relative Prices of Agricultural Products
25.00%
0.24% 0.23% 0.18% 0.16%0%
5%
10%
15%
20%
25%
30%
Beans
Wheat
Corn
Sorg
hum
S C
ane
Source: IMCO with information from SAGARPA, INEGI, USDA, and Secretaría de Economía.
Although Figure 10 shows that bean prices could increase significantly in relation to other crops, the
overall effect is very small because bean production is small in comparison to other products in the
model. This obviously translates into almost no effects on the GEM’s agroindustrial mode. In addition,
47
We estimated the price volatility for black and pinto beans by dividing the standard deviation by the mean price.
In both cases Mexican wholesale prices were less volatile because they were 0.15 and 0.11 for black and pinto,
respectively, while in the United States they were 0.22 for both types of beans. 48
Similar to the amount imported in 2006.

30
because beans are not used intensely in the feedstock market, the effect on relative prices of processed
foods such as meats, milk, sugar, and others is very small (Figure 11).
III.3. Average Variable Cash Cost Curves Analysis
In this section we construct average variable cash cost curves for each of the six principal dry bean
consumption centers described previously. This is carried out by estimating bean producers’ cash costs at
field level, considering prevalent technologies for each region and then adding transport, storage, and
financial costs to find the real average variable cost of supplying beans in each of these markets, using
information from SAGARPA’s information system and ASERCA. The analysis was based on six
assumptions:
1. Only information from the States of Zacatecas, San Luis Potosí, and Chihuahua was considered to
estimate differences between irrigated versus rainfed areas, because these were the only states
that allowed a true comparison of both areas with the same seeds and technological packages.
(These states represent close to 34 percent of all dry bean production in Mexico.)
2. All mechanized costs reported by SIAP (Ministry of Agriculture Information and Statistics
Office) were divided between labor and machinery costs, of which 60 percent were for labor and
40 percent for machinery.
3. No collection, insurance, and financial costs were considered, although these were reported by
FIRA (Fideicomisos Instituídos en Relación a la Agricultura) because they contrasted
significantly with those reported by SIAP.
4. No information from FIRA on production costs was considered because only two states were
reported.
5. The average yields used were those from the three states considered, i.e., 1.2 tons per hectare, 12
percent higher than the average yield of commercial producers.
6. The analysis does not consider subsidies and rent, due to lack of information.
Despite all the restrictions, the analysis is useful because it allows a detailed understanding of the cost
structure of bean producers in Mexico and a general comparison of the cost structure of U.S. producers.
Furthermore, it is the first step in the construction of a supply curve in each consumption center, which in
turn helps understand producers’ competitiveness, challenges, and weaknesses with current and future
prices in each consumption market.
The first step of the analysis compares the average cash cost of producing a ton of dry beans in Mexico
versus a ton in the United States. This was done by using information from the U.S. Department of
Agriculture (USDA) and the Ministry of Agriculture in Mexico (Secretaría de Agricultura). The result is
shown in Figure 12.

31
Figure 12. Average Field Cash Costs in Mexico and the United States (2006–07)
23%
18%
17%
16%
11%
10%
4%1%
US
Fertilizer
Machinery
Seeds
Fuel
Pesticides & Herbiscides
$2,134 pesos / ton
41%
11%
10%
9%
8%
7%
6%
4%
3%1%
Mexico
Seeds
Energy
Labour
Fertilizers
Financial Cost
Water
Machinery
Pesticides & Herbicides
$4,693 pesos /ton
x 2.2
Insurance
Labour 2%
Financial
Other 1%
Insurance
Other 1%
Source: IMCO with data from SAGARPA ,SIAP, and North Dakota State University
As Figure 12 shows, the difference in the average cost of producing a ton of beans in Mexico is more than
twice (2.2 times) that of producing the same ton in the United States (4,693 pesos per ton in Mexico
versus 2,134 pesos per ton average in the United States). Although these are average costs for all
producers in Mexico and the United States, the differences between both countries show that in general,
the money Mexican producers spend on labor and seeds covers all cash costs of U.S. producers. The costs
of each of the producers are for 2007, according to information from SIAP in SAGARPA. It is important
to remember that rent and collection costs were excluded for both due to lack of information, so these
costs may be lower than what they really are, especially in the United States, because rent is much higher
than in Mexico.49
There are other important differences to note with regard to the cost structure in both countries. For
example, the major differences in labor expenditures between both countries as well as the relatively low
expenditure on machinery in Mexico compared to the United States, suggest more technified bean
production in the United States.
Labor is the abundant factor for production in the Mexican economy, while in the United States the main
inputs are land and capital. Mechanized cropping in dry bean fields is a normal practice in North Dakota,
Michigan, and other U.S. states; thus labor accounts for only 2 percent of bean total production costs. In
Mexico production is more labor intensive, representing 41 percent of total variable costs. On the other
hand, the average landholding in North Dakota’s bean plantations is around 120 hectares, and in
49
The mean yields used for estimating the variable cash costs in Mexico and the United States were 1.2 tons per
hectare in Mexico and 1.9 tons per hectare in the United States.

32
Michigan 80 hectares,50
while in Zacatecas, the main producing state, the average landholding is
approximately 10 hectares.51
Also it is worth noting that in the United States water is not a major cost as it is close to 0 while in
Mexico there is some water cost in irrigated areas. As collection costs have not been included, fuel costs
in the United States only consider fuel for machinery used in production.
As mentioned above, these cost structures represent the average cash costs for an average producer with
2007 costs. Thus it is imperative to differentiate such cost structures by technology, especially since the
gap between producers in irrigated areas and those in rainfed areas are very significant.
Using the same information from SIAP, we calculated average cash costs at field level for bean producers
in both rainfed and irrigated areas. The results show a cost difference of close to 50 percent between
Mexican producers in irrigated areas and those in rainfed areas (see Figure 13).
Figure 13. Average Cash Cost of Bean Production in Mexico with Different Technologies, 2006
38%
14%
11%
11%
9%
8%
7%
Irrigated
$3,626 pesos /ton
Seeds
Energy (Electricity)
61%
15%
14%
9%
rainfed
$5,323 pesos/ ton
Seeds
Labour
Fertilizers
Machinery47%
Pesticides & Herbicides
Water
Other
Labour
Machinery
Fertilizers
The comparison of the same bean varieties and same technologies in rainfed and irrigated areas was only possible for the states of Zacatecas, Chihuahua, and San Luis Potosí. Therefore, this graph was constructed with this information, which is representative of 33 percent of total bean production.
Source: IMCO with information from SIAP and FIRA.
The results of Figure 13 match the information IMCO obtained in interviews. According to the Minister
of Agriculture of Zacatecas, a bean producer himself, the minimum price for producers to sell their beans
in the market is around 6 pesos per kilo.
50
USDA. ―North Dakota farm count by congressional district.‖ Available at:
http://www.nass.usda.gov/census/census97/congdist2/states/north_dakota/nd.htm 51
FIRA Boletín Informativo 316. 2001

33
Three of the most important insights that may be drawn from the above results in Figure 13 are:
Because beans in rainfed areas are more expensive to produce than in irrigated areas, beans from
the former are not competitive if they need to be transported over long distances.
Producers in rainfed areas spend on labor the equivalent of 90 percent of all producers’ expenses
in irrigated areas. This means that production in rainfed areas could improve significantly from
any technological packages that allow labor costs to be cut.
Water is a cost in irrigated areas but not in rainfed areas. Nevertheless, the 8 percent of total costs
it represents is low. This is because water in Mexico is not priced properly: it does not reflect
scarcity and agricultural producers are subsidized in their water pumping costs. However, if a
proper price were charged for water, this could change the cost structure of producers in irrigated
areas.
Although there are many different types of bean varieties and these are grown in different areas, bean
production costs depend more on scale and technology used than on the type of beans. The main
differences in the cost of growing different bean varieties on the same hectare of land are the cost of
seeds, because productivity is closely related to the technology used in production.
To understand the possible consequences of not including the cost of water on irrigated land, we
incorporate an estimated economic value of water for Sinaloa (the most representative of the irrigated
bean-producing areas). This helps to understand one of the major challenges these producers will face in
the future.
III.3.1. Calculating the Economic Value of Water for Irrigated Bean Production (Sinaloa)
Water pricing is a complicated task that has not been sufficiently studied and developed in Mexico.
Because is the greatest water predator in Mexico, consuming close to 75 percent of all national waters,
this is a topic of major importance for this sector. Moreover, water has not been properly priced for this
sector. Although the correct pricing of water is beyond the scope of this note, since we are already
describing production costs it is worthwhile to understand how water prices could affect bean producers’
cost structure in irrigated areas.
For this reason we carried out an exercise to determine how far water pricing could change producers’
costs in irrigated areas. We used a simple formula to calculate the economic value of water (EVW):
This formula has been widely used for various calculations of water pricing. We decided to use it for this
theoretical exercise because it was used in the recent World Bank water study ―Mexico–Assessment of
Policy Interventions in the Water Sector, Volume I: Policy Report,” published last year. Results can be
contrasted with some of the results found in the paper by comparing EVW.
EVW($ /m3 )
Value Added($)
Volume of Water(m3 )

34
For the purpose of this note we used the formula for the State of Sinaloa because it represents nearly 40
percent of all bean production in irrigated areas. Therefore, the first step is to find the amount of water
used for bean production per hectare, considering both surface and ground water. According to the
National Water Commission (CNA), the water intake for beans during the autumn season is 55 cm
(lámina)52
of water at the source. This means that approximately 5,500 cubic meters of water are used per
hectare, i.e., 2,866 cubic meters of water per ton. If we suppose that 20 percent of that water comes from a
source other than irrigation, we can assume that 2,290 cubic meters of water per ton are used for bean
growing in irrigated areas. This result assumes that:
80 percent of the water needed to grow beans comes from irrigation.
One hectare of irrigated beans produces approximately 2 tons in Sinaloa.
Current minimum producer prices are close to 5,500 pesos per ton, according to ASERCA.
Variable costs are around 3,630 pesos per ton.
Thus, the EVW of water for each ton produced would be 0.82 pesos per cubic meter. This figure is not the
price producers would be willing to pay for this water because the EVW does not consider transaction
costs (pumping, maintaining irrigation infrastructure, etc.) and other production costs.
If we were to estimate the EVW for the tourism sector or other sectors in the state, we would probably
find a higher EVW, meaning that a reallocation of water to these sectors could increase the value added of
the basin’s economy and therefore different stakeholders would be willing to pay more for the water.
Transaction costs especially those for pumping water, are heavily subsidized for agricultural producers:
the average fee of farmers is 63 percent lower than the cost of producing 1 KwH in the country. In a way,
this EVW is close to the value of each cubic meter used for agriculture, without considering other
production costs.53
The mean industrial tariff of Region III (where Sinaloa is located) is US$0.52 per cubic meter, with an
average water productivity (EVW) of US$52 per cubic meter as shown in the World Bank’s water study.54
This would mean that if the EVW-tariff ratio in the industrial sector were the same for the agricultural
sector, the water tariff for the agricultural sector would need to be around US$0.0007 per cubic meter for
beans. This means that for each ton of beans produced in the State of Sinaloa, producers could easily pay
close to 19 pesos for water. In other words, the price of water for agricultural use in Sinaloa could be 0.8
cents per cubic meter if it were to reflect the EVW in a similar proportion as it does in the industrial sector.
Although the above is one means of estimating a water price, there are many other ways to do this.
Another way is to suppose the maximum price producers would be willing to pay for water if they had to
buy it from a private source. For example, if we consider a 25 percent profit margin for bean producers,
an average variable cost of about 3,630 per ton and a bean price of 5,500 pesos/ton and we ignore the
52
CNA, Usos del Agua 2002. 53
Mexico-Assessment of Policy Interventions in the Water Sector, Volume I: Policy Report, World Bank, March
28, 2006. 54
Mexico–Assessment of Policy Interventions in the Water Sector, p. 65.

35
opportunity cost of producing something else, by using the same EVW formula we find that farmers
could be willing to pay up to 0.61 pesos per cubic meter in order to continue producing beans and earn a
25 percent profit margin55
(considering only variable costs).
This means that water prices in irrigated areas could oscillate from a minimum of 0.008 pesos per cubic
meter to a theoretical maximum of 0.61 pesos per cubic meter. Although this may not necessarily reflect
the real water scarcity in the region, it reflects an area in which prices could oscillate. Therefore, the
production costs of a ton of beans in irrigated areas could change, as shown in Figure 14.
Figure 14. Average Cash Cost of Bean Production, Considering Two Shadow Prices for Water, 2006
61%
15%
14%
9%
rainfed
$5,323 pesos/ ton
Seeds
Labour
Fertilizers
Machinery
irrigated
$5,033 pesos /ton
Other Cash costs
Water cost*
Water cost**$3,626 pesos /ton
6%
* The water cost is calculated as the maximum willingness to pay if the water rights belonged to someone else. This means that
producers could offer almost 40 percent of their variable costs (about 1,403 pesos per ton) to continue producing beans and obtain a profit margin of close to 25 percent in the medium term (based on the EVW for that region). The underlying price would be 0.61 pesos per cubic meter.
** The water cost of 0.8 cents per cubic meter is calculated by using contingent pricing. With current industrial tariffs in Region 3, this represents 1 percent of producers’ costs and an extra 19 pesos per ton.
Source: IMCO with information from World Bank and SIAP
Although the scenario shown in Figure 14 is theoretical, it is useful to show the need to price water in
irrigated areas, because it could change producers’ competitiveness and consequently the economically
viable activities in different bean producing regions.
To correctly price water in each of the irrigated areas, it would be necessary to consider water quality and
discharges, as well as water scarcity in each basin. However, this is beyond the scope of this paper. The
55
To obtain this value we subtracted the 3,630 of variable costs per ton from the 5,500 pesos per ton and then
multiplied it by 0.75 in order to subtract the 25 percent profit margin. This is the cost producers would be willing to
pay per ton. Finally, we divided this by the 2,293 cubic meters needed to produce one ton of beans. This gives a
price of 0.61 pesos per cubic meter.

36
sole purpose of including this analysis is to point to the need for further analysis by water and agricultural
authorities on this topic.
In the next section we integrate the above field cost analysis for each of the principal bean producing areas,
including logistical costs in order to measure producers’ competitiveness in key consumption markets.
III.3.2. Construction of Average Variable Cost Curves for Key Consumption Markets
To understand the current competitive status of commercial bean producers in Mexico, we constructed
average variable cost curves of supplying beans at each of the six key consumption centers previously
described: Mexico City, Guadalajara, Monterrey, Tijuana, Ciudad Obregón, and Torreón.
Considering the production field costs of all bean producing municipalities and adding transport costs
(both short- and long-distance freight charges) as well as storage and financial costs provided by
ASERCA (see Appendix 2), we constructed the average cost curves for each of these cities.
The curves not only consider the average variable costs of producing and transporting a ton of beans from
production areas but also the amount of beans transported to each consumption center. We estimated the
distribution of beans from production zones to markets, using the information found in Appendix 2, and
decided to distribute beans from producing areas to consumption centers by using two main assumptions:
1. In the northern part of Mexico light-colored beans are almost the only variety consumed, while
black beans are the variety most consumed in the south. In cities such as Mexico City and
Guadalajara there is a more diverse mix of bean consumption: 30 percent light beans, 30 percent
black beans, and 30 percent pinto beans.
2. We also minimized transport costs from producing areas to consumption areas by considering
that producers close to markets would have always a greater share of the market than those from
more distant states.
Thus, we obtained the final distribution table shown in Appendix 3. With this information we constructed
the average variable cost curves shown in Appendix 4, which help determine:
The most competitive producers for supplying beans to major local markets relative to the cost of
importing U.S. beans;
Where the most competitive producers are located; and
Which producers could be most affected by future price and where they are located.
To check the validity of these cost curves for different bean varieties, we consulted producers’
associations56
in Zacatecas and Sinaloa. According to them, there are no major cost differences in
growing different bean varieties on a given piece of land except for the cost of the seed. Thus, the results
are relevant for explaining the cost differential among dry bean producers because we differentiated the
technology used.
56
Fundaciones Produce are associations created at the state level, and are dedicated to promoting agricultural
research as well as transferring technology.

37
To illustrate one of the average variable cost curves, we show the cost curve for Mexico City, the
country’s most important consumption center. Figure 15 shows the results of this market, assuming that
70 percent of the beans consumed arrive from the five principal producing states considered where
ASERCA intervenes with logistical support.
Figure 15. Average Cost Curve of Supplying Beans in Mexico City, 2007
0
1,000
2,000
3,000
4,000
5,000
6,000
7,000
8,000
9,000
10,000
11,000
12,000
0.0% 20.0% 40.0% 60.0% 80.0% 100.0%
Market share
0
1,000
2,000
3,000
4,000
5,000
6,000
7,000
8,000
9,000
10,000
11,000
12,000
0.0% 20.0% 40.0% 60.0% 80.0% 100.0%
Pesos / ton
Sinaloa Chih
uahua
Zaca
teca
s
Dura
ngo
Nayarit
Black Mex
US black Mx
US black Mx2008
US Pinto Mx2008
Production Costs Total costs
producer price(black)
US Pinto Mx
Average price fall
8.6%
Wholesale US price black beansPinto Mex
The curve is constructed for nearly 300,000 tons of beans. Only 70 percent of supply is assumed to arrive from the five states shown whose information was provided by ASERCA.
The nearly 300,000 tons were obtained by assuming a per capita consumption and multiplying it by 19 million people living in the urban area of the DF as well as considering a 40 percent extra consumption because many of the beans bought in Mexico are distributed to other markets.
Storage costs include financial costs and vary according to the number of months beans are stored in each state. The dotted lines stand for:
Producer price (black) is the average price at which black bean producers sell their beans per ton. Black Mex is the wholesale price in Mexico City’s central de abasto of black beans. Pinto Mex is the wholesale price in Mexico City’s central de abasto of pinto beans. US Pinto Mx2008 is the wholesale price of imported pinto beans without tariff in Mexico City’s central de abasto. US Black Mx2008 is the wholesale price of imported black beans without tariff in Mexico City’s central de abasto. US Pinto Mx is the wholesale price of imported pinto beans in Mexico City’s central de abasto. US Black Mx is the wholesale price of imported black beans without tariff in Mexico City’s central de abasto.
Source: IMCO with information from ASERCA and SAGARPA.
Figure 15 shows the total and logistical costs of supplying beans in Mexico City, compared to the cost of
importing beans from the United States in 2007 with the prevailing tariff. The graph clearly shows that
producers in Sinaloa are the most competitive of all producers who supply beans to Mexico City, with
respect to average variable costs in the field. However, their high transport cost, close to 20 percent of
field production costs, makes Durango’s producers more competitive in this market. Therefore, if the
beans produced in Durango and Sinaloa were the same, we could compare both in terms of
competitiveness. However, since Sinaloa produces mostly light-colored beans that fetch higher prices,
ranging from 12,000 pesos/ton to 16,000 pesos/ton depending on the variety, while Durango produces
mostly black beans that fetch close to 8,000 pesos ton, the competitive status of producers in each state is

38
extremely different. This price difference occurs because of consumer preferences, marketing, and a
limited supply of these new bean varieties in Mexico and the United States. For example, peruano and
hidalguillo varieties are only grown in some areas of Sinaloa, which makes them scarcer and more
expensive. Furthermore, their characteristics and new packaging also allow them to fetch higher prices.
It is important to note that costs per hectare may vary enormously between Sinaloa and Zacatecas, for
example, yet costs per ton are similar because yields are also very different. Therefore, those who spend
little money on producing a ton of beans also produce a small quantity of beans per hectare compared to
irrigation producers who spend more money on variable costs.
There are many different prices for beans in Mexico, although Figure 15 shows only two major types (pinto
and blacks). However, as described previously, light-colored beans fetch even higher prices, between 14,000
and 16,000 pesos per ton. Price differences among varieties refer to quality, taste, trends, and availability of
these beans. This is why it is possible for more expensive U.S. black beans to gain market share in Mexico.
Both imported varieties, pinto and black beans, are more expensive than Mexican pinto and black varieties
because imported beans are considered to be better quality and cook faster.
In summary, in Mexico City, the largest bean consumption market, NAFTA’s tariff phase-out is unlikely
to have a large effect on bean producers because imported beans even with no tariff will not be cheaper
than Mexican beans and in any case the two compete largely on the basis of quality rather than price (ie,
they are quite imperfect substitutes). On the other hand, the nearly 8.5 percent price reduction due to
NAFTA’s phase-out may help the growth of U.S. beans in Mexico within its niche market, which
represents close to 10 percent of all bean consumption. This effect could be offset by rising U.S. bean
prices which have increased more than 15 percent for both varieties in 2007.
Producers in the States of Durango and Zacatecas (mostly black bean producers) are the ones who face
the greatest risk due to tariff elimination, since they compete more head to head with imports. Producers
in Nayarit, although facing high production costs, are not at such high risk because they produce more
pinto beans and improved quality black beans that fetch higher prices.
By analyzing the other five average variable cost curves in Appendix 4 for the main consumption
markets, we find that:
1. Logistical costs account for about 20 percent of the total variable cost of supplying beans to
principal markets.57
2. Sinaloa and Nayarit have the best profit margins for supplying beans in all markets. Although
they produce at costs per ton similar to those of other states, they fetch much higher prices
because they sell light-colored and pinto beans. They have been able to differentiate and arrive at
new markets with new and more expensive varieties.
3. Zacatecas and Chihuahua are the most vulnerable to price changes in the near future.
57
Estimated by calculating the weighted logistical cost in each center and then calculating the mean weighted
average of these costs by total consumption of the ten markets.

39
4. Price changes due to tariffs would make imported pinto and black beans cheaper only in Tijuana
(see Appendix 4). This would likely affect those producers of Chihuahua who supply black and
pinto beans to this city. However, because light-colored beans are preferred in this market and the
market is small (16,000 tons in total), the effect is minor. Only 15 percent of all beans consumed
in the State of Baja California are pinto beans, while black beans are nearly nonexistent.
Therefore, assuming that 10 percent of the pinto bean market already consumes imported beans
(to be consistent with the national average, although this percentage is certain to be higher on the
border), the market contraction would represent approximately 20 million pesos in sales.
The degree of vulnerability of black bean producers in the States of Durango, Zacatecas, and Chihuahua
to changes in bean prices varies significantly within municipalities, as shown in Figure 16 below. This
analysis helps to determine which areas need specific policies either to reconvert production or provide a
different technological package to foster their competitiveness.
Figure 16. Average Cost Curve of Supplying Black Beans to Mexico City (2007) at Municipal Level for Zacatecas, Durango, and Chihuahua
-
2,000
4,000
6,000
8,000
10,000
12,000
14,000
16,000
0.0% 20.0% 40.0% 60.0% 80.0% 100.0%
Market share
Pesos / ton
Black Mex
US black MexUS black Mx2008
Total costs
producer price(black)
Graph only considers the municipalities of Durango, Zacatecas, and Chihuahua, which are the principal black bean producers. It
only considers those municipalities that produce over 1,000 tons. Source: IMCO with information from SAGARPA.
The graph in Figure 16 was constructed using the main production costs for irrigated and rainfed areas.
Therefore, by using this information and average yields per municipality, we were able to construct the
production cost curve for each municipality. We then added the same transport cost from Chiapas to
Guadalajara because we had no information on different transport costs to main hubs in the State.
It is worth noting that although over 1,680 Mexican municipalities produce beans, only 160 produce more
than 1,000 tons each year. Thus, although beans are grown throughout the country only a few states
specialize in its production. This is why an analysis of these states can point to the challenges for the bean
sector in the future.

40
IV. POLICY OPTIONS TO IMPROVE MEXICO'S POSITION IN THE BEAN MARKET UNDER FULL INTEGRATION
Although Mexico’s production costs are higher than those than the United States, the recent growth in
Mexico’s canned bean industry proves that there is room for adding value in the bean industry and
gaining market share by packaging, cooking, and presenting beans in different ways.
Therefore, Mexico could tap into niche markets by using its long bean-cooking tradition to export canned
beans in different forms to the United States and other countries.
In order to maximize this opportunity and improve Mexico’s position in NAFTA, several major
constraints need to be addressed, chiefly:
Lack of managerial and entrepreneurial skills to tap into niche markets;
High transport costs;
Lack of competition and high costs of warehousing.
This chapter analyze these three constraints and proposes recommendations to minimize their effects, as
explained below.
IV.1. Access to Markets and Marketing
Most dry beans producers in Mexico sell dry beans with almost no added value. In some cases, the
cleaning and separation of different kinds of beans do not appear to meet a general standard. Therefore,
simple activities such as cleaning and packing beans in the location could add value to the crop. This
could help producers because they could fetch higher prices and also access other markets. However,
many measures are needed for this to take place. First, producers need to work together in associations
because investments for cleaning and packaging plants decrease with larger volumes of production.
Second, more capital is needed for these activities to take place in many of the bean producing areas.
Third, new and different skills need to be adopted in order to operate such businesses.
Some local governments have already started to take action in this regard. Two bean cleaning plants that
also polish and pack beans in small bags were built in Zacatecas in early 2007, both financed by the State
and Federal Governments. This has helped major producers’ associations because they have added value
to the crop and therefore sell it at higher prices. However, the real aggregated value lies in going one step
further in the production chain: producers could prepare canned, dehydrated, precooked, or vacuum-
packed beans which are preferred by consumers because they are faster to prepare and require less energy
to cook. Packaging and processing plants should be located in producer areas so that beans are packaged
and processed before they are transported to markets. This is lacking in places such as Zacatecas,
Durango, and Chihuahua.

41
The real problem of marketing opportunities lies in the lack of information to influence producers to look
into other markets. What is already happening in the country refers to this. In Zacatecas producers have
continued to grow black beans despite a scarcity of other legumes in the NAFTA area, especially when
light- colored beans are becoming popular and fetching higher prices. On the other hand, producers in
Sinaloa are only growing mayocoba or new varieties such as higuera yellow beans which are fetching
prices more than twice as high as those of black beans.
IV.1.1. Canned Dry Beans
The canned bean industry has been growing steadily for over ten years as consumers preferences have
also changed, due to a larger urban population with less time for cooking and facing higher energy costs.
Consequently, the market for precooked beans with traditional recipes is growing (see Figure 17 below).
Figure 17. Canned Bean Production in Mexico
1,000
11,000
21,000
31,000
41,000
51,000
61,000
71,000
81,000
91,000
1994
1995
1996
1997
1998
1999
2000
2001
2002
2003
2004
2005
2006
tons
CAGR 32%
Source: INEGI Encuesta Industrial Mensual
Figure 17 shows that the volume of canned beans manufactured in Mexico reached nearly 90,000 metric
tons, representing 7 percent of total bean production. Around 66 percent of canned beans are produced by
Sabormex, a firm owned by ―La Sierra‖ brand. This company buys and stocks the beans in Zacatecas, and
transports them to the plant in the State of Puebla for manufacturing. The main advantage for local
producers is that broken beans can be used for canned products such as refried beans, so they have a
market for products that would otherwise be much harder to sell.
There are also growth opportunities in the export sector. According to FIRA, 40 percent of canned beans
were exported to the United States in 2000, and this trend is increasing because per capita bean
consumption in the United States shows a positive growth rate (see Figure 18). This may be explained by
the fact that the fastest growing ethnic group in the United States is the Hispanic population, both due to
higher fertility rates and increasing migration. The increasing popularity of Mexican foods and snacks in
the United States and around the globe provides good opportunities for dry bean producers and canned
bean manufacturers to increase sales.

42
Figure 18. Apparent Consumption of Dry Beans in the United States
0
10,000
20,000
30,000
40,000
50,000
60,000
70,000
80,000
1991
1993
1995
1997
1999
2001
2003
2005
0
100,000
200,000
300,000
400,000
500,000
600,000
700,000
800,000
900,000
1,000,000
Total beans Black Beans
tons tons
Source: USDA
Therefore, a way to tap into these new markets and add value to dry bean production in Mexico is to
thoroughly understand the barriers to entry into U.S. markets, and to reduce transport costs to principal
consumption centers in the United States and Mexico. This would probably be useful for dry bean
producers prior to investing in plants for dehydrating, processing, or canning beans for new markets. Even
if there are also some opportunities to export varieties of dry pinto and light-colored beans, the future lies
in more innovative presentations that allow quicker preparation.
There are many other opportunities to produce alternative products from beans, some of which are being
explored by producers. The problem is that they lack access to markets and resources to be able to make
their products appealing to new consumers. Some of the products that were tested successfully in various
pilot programs are:
Feedstock mixes for cows and pigs (mixed with soybeans and corn);
Sweets made with beans;
Corn snacks similar to Frito’s corn chips;
Soups
Although some are very nutritious and tasty they have seldom been explored beyond laboratory tests.
Therefore, it is of utmost importance to build greater entrepreneurial, marketing, and managerial skills
among producers and to provide valuable information on accessing markets for such products, as elaborated
below.
IV.2. Marketing and Entrepreneurial Skills (Market Intelligence System)
In order to seize market opportunities described above, producers require more information about
consumer preferences and habits and how to improve production. This could help them know what to
produce and how to produce it to meet global consumer demands.

43
Besides information, certain skills are needed to seize a market opportunity and position a product in the
global market, such as marketing, entrepreneurial and managerial skills in order to manage resources,
minimize costs, maximize profits, and use new information technology to support efficient decision making.
Mexico has not provided the information nor has it built any of the abovementioned skills for the
agricultural sector. Thus, the creation of a market intelligence system to provide such information and
skills for agricultural producers and agribusinesses is of utmost importance.
While trying to document and find figures for processed bean niche markets, we found that there are no
data within the Ministry of Agriculture or FIRA either for Mexico or the United States. However, we did
find that some important Mexican agroindustrial firms are planning to open canned bean plants in the
United States. There are three basic reasons for this: the lack of quality of Mexican beans, cheaper beans,
and cheaper transport costs to serve the Hispanic population in the United States.
If Mexico had a market intelligence system similar to that of Chile (Fundación Chile), such decisions
could have been made with information and incentives to build part of this production in Mexico.
Fundación Chile works with both the private and public sectors to develop and expand foreign markets
for small-scale producers. The key to its success has been its highly trained and appropriately
compensated professional staff. Instead, Mexico’s Ministry of Agriculture has a small, inefficient
information system that lacks information on potential markets, consumption trends, marketing
technology, etc. It also a minimum staff capacity for producing useful information to foster agricultural
competitiveness. This goes beyond the bean sector but it could also be useful for some bean varieties only
grown in Mexico. It is time for Mexico to change and tap into its competitive advantages. Many
opportunities are waiting to be fully exploited within the bean market. Mexico’s future public policies
need to look into this.
In summary, there is great need for better bean marketing through packaging, production, and sale of the
crop. By not doing this, market opportunities are lost and there is no trust between buyers and sellers. The
quality of the sacks of beans being purchased is quite poor, because contain a high content of debris and
even stones for weight. This in turn has also inhibited other production processes such as forward
contracts between buyers and sellers in Mexico. This is why marketing is so important for producers. The
following section mentions the importance of marketing beans to consumers.
IV.3. Campaigning for Beans
Another possibility to explore is creating national and international campaigns to emphasize the health
benefits of beans, such as cancer reduction and high protein and fiber content. Such campaigns have already
increased U.S. demand for products such as almonds and flaxseed. The health benefits of beans appear to be
so promising that U.S. authorities are already considering a campaign. Dry beans are included in two food
groups in Mexico: high-protein and legumes. Mexican authorities should promote the inclusion of beans in
these two food groups in other countries, rather than only in the vegetables–legumes group. Thus, more
ways could be found to sell beans as a nutritious food and seek greater market opportunities. It may also be
worthwhile to organize a ―national branding‖ campaign in the U.S. market, taking advantage of the genuine
Mexican character of this product, for which the country already has a good reputation.

44
One issue that will need to be tackled to take full advantage of market access is weakness in Mexico’s
system of sanitary standards, and lack of coordination of the requirements among the three member
countries.58
Political coordination mechanisms, technology, and sanitary cooperation are needed to
institutionalize market integration. Trilateral working groups should be formed to work on the
standardization of sanitary norms that consider quality, improve sanitary infrastructure, and create
mechanisms to trace bean production and marketing.
IV.4. Minimizing Transport Costs
According to Barkema and Drabenstott (1996)59
the major infrastructure restriction to Mexico’s long-term
competitiveness in international agricultural markets is its transportation system. On the other hand, the
lower the transport costs, the more integrated markets are and the lower price differentials are between
U.S. and Mexican markets.
The cost analysis in the previous section clearly shows two types of transport costs in bean distribution:
transport to principal hubs and transport from principal hubs to markets. The latter basically depend upon
distance from market: ASERCA estimates them by multiplying the current average price of 25 cents per
km per ton by the distance between hubs and markets (see Appendix 2).
A comparison of ASERCA’s estimates of transport costs to hubs (short freight) shows considerable
differences in each state, caused mainly by distance from municip² € ies to hubs. Furthermore, the long
distances between these production zones and main consumption centers explains the overall high
transport costs (20 percent of total costs ) for the six consumption markets analyzed. Distance plus
expensive truck freight costs as well as limited entry points to main railways contribute to these costs.
According to principal beans brokers, the cost of transporting beans can be over 500 pesos per ton.
Trucks carry about 80 percent of Mexico’s food and agricultural shipments. Although 3,400 miles of
four-lane highways have been built between major cities since 1990, many more are needed, particularly
to handle the growing truck traffic.60
However, to avoid paying the tolls that are charged on many of the
new highways, trucks often resort to public roads, further deteriorating the already poor condition of those
roads.
A number of important actions must be taken into consideration in order to reduce freight costs in
Mexico. A lengthy, detailed agenda can be found on IMCO’s website61
which makes broad references to
the following recommendations:
58 These issues are examined in detail in a recent study by the Inter-American Development Bank, ―Assessment of
Mexico’s Sanitary, Phytosanitary, and Food Safety Policies and Programs and Their Implementation: Diagnosis and
Proposals for Reforms,‖ by R. D. Knutson. 59
Williams Gary and Málaga Jaime E. Mexico Competitiveness: Reaching Its Potential, Input Paper, Mexico
Agricultural Export Competitiveness, World Bank, 2006 p. 22. 60
Williams Gary, op cit p. 22. 61
For detailed recommendations on how to improve transport and logistical infrastructure, please refer to the
transport study on the IMCO webpage: http:www.imco.org.mx (Version available in Spanish only)

45
Increase investment in roads (access to roads and rail lines, improved highways, etc.);
Increase the number of entrances to railroad transport;
Optimize truck cargo capacity;
Create incentives for renovating cargo fleets;
Increase competition in the sector;
Modernize customs, bridges, ports, and infrastructure for export;
Create market information on demand, bottlenecks, location, and prices of freight transport.62
Even if part of these transport costs are subsidized by the government, the cost is being paid by taxpayers.
Therefore, an important case must still be made to reduce transport costs.
Another way of understanding areas of opportunity for reducing transport costs is by estimating consumer
price differentials between consumption centers in local wholesale markets. When price differentials are
higher than the cost of transporting beans from one market to another, there is room for arbitrage.
One possible explanation is that nothing is being transported on the way back. Thus, the transport cost of
bringing in beans pays for the trucks’ return trip. Another hypothesis is that price differences reflect not
only transport costs but also insufficient competition or lack of information. This could be the case of
Morelia where there is 72 percent difference between the highest and lowest wholesale price for the same
kind of beans in six markets over the last 4 months63
of 2006, as shown in Figure 19.
Figure 19. Differences in Pinto Bean Prices in Main Consumption Markets, 2006
5
6
7
8
9
10
11
12
13
Jan
Feb
Mar
Apr
May
Jun
Jul
Aug
Sep
Oct
Nov
Dec
DF Guadalajara Puebla
Torreón Morelia Monterrey
Pesos kilo
wholesale market
Source: Secretaría de Economía SNIM
62
A national index of consumer freight transport prices, published each month based on real charged tariffs, could
be disaggregated by freight, geographic zone, season, type of transport, etc. 63
SNIM Secretaría de Economía 2006

46
Therefore, for consumption centers such as Morelia with higher transports, we suggest policies to
improve railroad systems and competition within these markets. The main recommendations include:
Helping to make last-mile services available in order to consolidate cargo in the railroad system
as soon as possible;
Finding reciprocal mechanisms to avoid loss of cargo due to disagreements;
Establishing tariffs for different cargos and volumes;
Creating intermodal facilities throughout Mexico; and
Enabling tracks to handle the weight of standard U.S. rail cars, in order to reduce the cost of
smaller cars.
These steps are especially needed for dry beans in Mexico, most of which are transported by road instead
of rail, in contrast to beans imported from the United States. This makes them more expensive to transport
and less secure. Beans are like cash, because they can be easily sold anywhere. Therefore, trucking
companies that transport them need to invest in security measures such as satellite services for truck
monitoring. These costs could be dramatically reduced if more beans were transported by rail, because
theft would be unlikely.
Actions must also be taken at ports and borders to reduce the costs of exporting and importing beans and
to prevent smuggled Chinese beans to enter the southern border of Mexico. These actions include:
Reducing paperwork;
Providing adequate facilities and staff;
Improving inspection procedures;
Coordinating authorities;
Planning at traffic peak periods;64
Investing in more infrastructure such as bridges, access roads, and rail lines to cross the border,
additional commercial inspection facilities, as well as overland routes from Mexican ports to
inland distribution points
As indicated above, transport costs play a very important role in the attempt to maximize competitiveness
in different bean markets. In addition to transport costs, storage costs also represent a significant share of
the cost of beans in the principal consumption markets. The following section analyzes the key reasons
for these high costs.
It should be recognized that while reducing transport costs improves overall competitiveness, it could lead
to price reductions in grain-deficit areas, with potential adverse effects on producers in these areas. The
information on regional production costs in these notes may help to identify those areas that are both
high-cost and deficit areas, which may be targeted for attention. Potential losses would of course need to
be quantified to see if they are sufficient to justify intervention.
64
Williams Gary, op cit p. 22.

47
IV.5. Minimizing Storage Costs and Facilitating Access to Credit
Having a well-functioning storage market is important for beans, given their perishability. Although bean
stocks are not presently at their highest level (Figure 20), nearly three of every four tons stored are black
beans. This has important consequences under current market conditions because traditional buyers will
not buy at the price asked for black beans by producer organizations—4.30 pesos per kilogram of black
beans in Mexico City65
—when stocks are high.
Figure 20. Bean Stocks (thousand tons)
389
736
308340
417
210
0
100
200
300
400
500
600
700
800
2002
2003
2004
2005
2006
2007*
Source: IMCO with data from SIAP. This is a simple average of the monthly data of stocks reported in SIAP. Thus, in 2006 there were 70 percent more stocks than the spring stocks reported by ASERCA which totaled 122,000 for all beans.
On the other hand, pinto and light-colored beans are being marketed at a normal rate and do not represent
a problem to authorities trying to sell inventories, because producer prices in regional markets are well
above 6 pesos per kilo.
Lack of a well-functioning warehouse system in Mexico has serious consequences: producers and
intermediaries cannot manage their sales decisions efficiently and agents at all stages of the distribution
chain are deprived of an important source of liquidity. The main problems in this market today are the
lack of a clear deposit system because there is no credibility in warehouse receipts, no clear standards of
quality and warehouse certification, and insufficient competition due to entry barriers. (The raids to
supervise corn stocks during the tortilla crisis are clear evidence of this lack of competition and
transparency among those who control inventories and thus clearly signal the need for change.)
According to AMSDA, the Association of State-level Ministers of Agriculture, the competitiveness of
Mexican production vis a vis imports is reduced because of the availability of preferential financial
conditions offered to importers by sellers in the United States and Canada,.66
Improvement of the storage
market in Mexico could encourage the development of these financial instruments, which create
opportunities for buyers to defer payments instead of making an all-cash purchase.
65
Information provided by ASERCA. 66
This statement was made in two interviews with Octavio Jurado, president of AMSDA, who said he has spoken in
depth about this matter with the Mexican Chamber of Industrialized Corn Meal.

48
The warehouse problem has been discussed by various actors in recent years. As a result, SAGARPA in
2004 proposed a comprehensive reform of the system for licensing and regulating warehouses, and the
proposed options need to be explored with the objectives of removing barriers to market entry and
efficient operation, while preserving supervision that ensures the integrity of financial instruments issued
by warehouses. The current ―Ley General de Títulos y Operaciones de Crédito‖ must be modified to
allow rural warehouses to issue endorsable warehouse receipts.
A possible model for reforms in designing the new law is the ―reportos‖ system in the sugar sector, which
allows producers to repurchase the receipt of their inventory at a certain time, paying a premium to the
buyer for holding the receipt. Commodity reportos work as a special contract of sale of a warehouse
receipt (certificados de depósito). The buyer gives cash to the seller and the seller agrees to repurchase the
receipt at a given date, paying a premium to the buyer for holding the receipt during the agreed term. The
property of the warehouse receipt (and the commodity that goes with it) is transferred to the buyer, so
there is no default risk. The physical commodity is held in the warehouse during the term. In some cases,
the buyer may ask for additional (cash) collateral. Mexican law states that individual reporto contracts
may not be longer than 45 days and may not be renewed more than two times. At the end of the first 45
day period the seller notifies the buyer whether it intends to renew the instrument for another 45 days (by
paying the premium) or to repurchase the inventory (by paying the receipt price and the premium). To
control for price risk, reportos have margin call provisions. If during the term of the contract the price of
the commodity falls below a specified threshold, the seller has to deposit a larger amount of the
commodity in the warehouse. Likewise, if the price exceeds a specified threshold the buyer must return
some of the stored commodity to the seller.
This system allows producers to store their crops and then sell them at a later time when prices are higher.
Having these types of contracts requires certain conditions that currently are missing in the Mexican
system of storage facilities, but that could be addressed in the short term, including:
Adequate regulation of warehouses to avoid commodity deterioration and moral hazard.
Negotiable warehouse receipts.
Public, widely known, and correctly registered price information on the commodity deposited.
Other mechanisms that have proved successful in other countries could be considered, such as the Rural
Production Certificates (Cédula de Produto Rural, CPR) in Brazil. The CPR is a bond issued by rural
producers, farmers’ associations, and cooperatives in order to obtain financing for production. Although
there are different types of CPR, all operate like a forward contract, with the exception that payment for
the crops is made when the bond is issued, not at delivery. Producer receive cash (or inputs) upon the
issuance and sale of the bond for their physical product and have the obligation of delivering either an
agreed amount of cash or production at a determined location and future date. Premiums and discounts
are expected in case the product delivered is of different quality.
In this way, the CPR provides financing for the production of the crop and manages the producer price
risk by linking the debt to the product, transferring the price risk to the buyer. Traders and agroindustry

49
also benefit through the guarantee and better planning of the crop supply. When the contract is set against
cash, buyers leave the market price risk of the commodity with the supplier.
The most important feature of the CPR is by far the reduction of risks to the buyers. As stated in the law,
the CPR is a bond that provides for the out-of-court settlement of disputes; in other words, the bond
guarantees rapid execution in case of nonperformance or breach of contract on the part of the bond issuer,
and therefore avoids endless discussions in the courts. This feature is definitely a major incentive for
buyers of CPRs, because it reduces moral hazard risks and speeds loan recovery.
Two key elements that are needed for this to work are:
The judicial sector must be prepared to guarantee the success of lawsuits; and
Sustainable and accessible agricultural and credit insurance must be developed in order to
mitigate risks.
Instruments such as the reportos and CPR, of course, will be useful primarily to commercial producers.
Other instruments, for example, micro-credit schemes, will be more suited for small-scale producers.
IV. 6. Concluding Remarks
High transport and storage costs are certainly one of the main constraints for producers in adjusting to
NAFTA. These are the result of the lack of competition and of an adequate legal system that promotes
legal certainty among different actors. Therefore, there is an urgent need to promote further competition
and properly regulate these sectors. The possibility to do this has consequences both on the cost structure
of bean supply as well as on financial markets, because it could permit other means of financing bean
inventories. The possibility of greater trade among countries from 2008 onward makes it of utmost
importance to open competition in storage facilities, improve their regulation, and resolve conflicts
among railroad companies in order to serve bean producing areas.
On the other hand, the broader market integration of beans also creates market opportunities for Mexican
producers to export processed beans, either canned or in other packaging, to the growing Hispanic
populations in United States and Canada. Therefore, this is a good opportunity to foster entrepreneurial
and managerial skills to manage resources, minimize costs, maximize profits, and use new information
technology to support efficient decision making and seize market opportunities. In this sense, producer
associations could help create economies of scale for building bean packaging and cleaning plants, but an
intelligence system is needed to provide information on consumer habits, trends, and preferences as well
as on packaging, distribution, and production technologies. And improvements are needed in Mexico’s
sanitary and phytosanitary control system to promote the development of export markets.
The next section explores options to improve Mexican producers’ competitiveness in tapping into local
and U.S. markets, in order to minimize NAFTA’s effects on some bean producers and encourage them to
take full advantage of market integration.

50
V. POLICY OPTIONS TO MAXIMIZE MEXICAN PRODUCERS’ COMPETITIVENESS
In order to maximize bean producers’ competitiveness in Mexico and minimize the effects of NAFTA on
some of them, several public policies should be considered, the most important of which are:
Using certified and improved seeds and varieties that have already proven successful in
experimental fields;
Encouraging more producers’ associations to improve efficiency through economies of scale;
Reconverting land to higher value-added crops and other activities when possible;
Implementing more appropriate financial mechanisms in general, and especially for production.
The sections below explain all these policy recommendations in further detail.
V.1. Improving Production Technology
Many types of technology may be used: improved seeds, better use of water resources, biological
fertilizers, rotation or conservation tillage (labranza de conservación), mechanization of production
processes, and cutting edge technology such as genetically modified crops to improve yields.
Although many of these technologies have been explored in most productive bean growing areas, with the
exception of genetically modified seeds which are not yet in the market, the use of most of them has not
been widespread. For example, mechanization has been introduced in some of low-yield areas through the
use of remittances sent by producers’ relatives working in the United States.67
The technological package
has been limited except for the purchase of some tractors and machinery.
There are two ways to improve dry bean seeds: one is to use improved varieties and the other is to use
high-quality certified seeds. However, neither of these has been widespread. According to Jorge Acosta,68
about five percent of total bean production uses high-quality certified seeds. Even when considering
growers’ selection of the best beans for the next harvest, Acosta calculates that only 15 percent of total
bean production uses superior seeds. The main causes of the lack of technology adoption include:
No seeds are developed by the private sector because all research and funds are focused on public
research institutions.
Need for an adequate technological package to achieve the expected productivity of hybrids.
Producers use their own seeds.
67
The sons and daughters of most of the poorer bean producers in Zacatecas, Durango, and Chihuahua have already
left for the United States. They support their remaining family members who have not left by buying them tractors. 68
Personal interview. August, 2007.

51
Other general problems in the seed market that create obstacles for hybrid seed adoption include:
Lack of legal protection for creators of seed varieties.
Differences in criteria for certifying seeds.
Lack of a successful mechanism for distributing improved seeds.
Expense of buying hybrid seeds.
Lack of an adequate technological package to help achieve the potential productivity of hybrids.
Seeds not adapted to local conditions.
Most producers use their own seeds.
Most of these problems are being addressed by the new Law for Production, Certification, and
Commercialization of Seeds that was approved in April 2007. In this law, aspects of labeling,
standardized certification, and commercialization criteria have been adopted and more protection included
for seed producers.
There is also a need for marketing firms to provide more information so that seeds with access to the
market can be adopted. In recent years, the problem with some of these seeds, such as the smaller
Garbanzuelo supremo and manzano beans (which are easier to cook and consume less energy), was their
limited access to market because consumers were not accustomed to their color and size.
With the exception of Sinaloa, mechanization has arrived only accidentally in bean producing areas and is
mostly financed by farmers who receive remittances. Thus there is a clear need for an integrated
technological package in bean producing areas outside of Sinaloa, especially in those areas with high
yield potential. Furthermore, there is a need for new technologies such as greenhouses to reconvert land
and attract younger producers to this economic activity. The aging population is also a major risk in most
bean producing areas (the average age of producers in Zacatecas and Durango is about 54).
INIFAP, a research center that is an agency of SAGARPA, has developed better dry bean seeds that
provide higher yields in all productive areas. Institute sources claim that the use of improved seeds may
increase yields between 20 and30 percent, under a conservative estimate. Even more in areas with good
potential where native seeds are used, such as the rainfed areas of Guanajuato, the improvement of seeds
may double yields.69
. We used INIFAP’s conservative estimates on increased yields to construct Figure
21 below, assuming a 25 percent productivity increase in the principal bean growing states and reducing
overall costs by 10 percent while also increasing seed prices by 10 percent.
Figure 21 shows that production increases 18 percent while costs fall 14 percent over a two-year period,
according to current technology studied by INIFAP. Costs decrease mainly because of two effects: a
nearly 25 percent increase in productivity, and a 10 percent savings in terms of pesticides and time t.
Although the nearly 10 percent increase in the cost of seeds is included, because the overall benefits are
greater than the costs producers become more competitive.
69
INIFAP: http://www.inifap.gob.mx/logros/noviembre/ZAPATA.PDF

52
Figure 21. Changes in Cash Costs of Dry Bean Production with the Use of Technology for Mexico City, 2007
0
1,000
2,000
3,000
4,000
5,000
6,000
7,000
8,000
9,000
10,000
11,000
12,000
0.0% 20.0% 40.0% 60.0% 80.0% 100.0%
Market share
0
1,000
2,000
3,000
4,000
5,000
6,000
7,000
8,000
9,000
10,000
11,000
12,000
0.0% 20.0% 40.0% 60.0% 80.0% 100.0%
Pesos/ ton
Sinaloa Chih
uahua
Zaca
teca
s
Dura
ngo
Nayarit
Fall in costs 14%
Increaseproduction
18%
With certifiedseeds
Original curve
Mex Black
US blackMex
US black 2008
US Pinto 2008Pinto Mex
The assumptions underlying the graph are: productivity increases 25 percent, seed prices increase 10 percent, and cost
reductions from pesticides and others decrease 10 percent. Source: IMCO with information from INIFAP.
This estimate of the effect of yield improvement assumes that all commercial bean varieties can be
improved., and there is some reason to believe that this is true: INIFAP already has improved bean
varieties for pinto, black, and light-colored beans. Furthermore, this center’s scientists claim to have a
light-colored variety called Zapata that is more drought resistant and could even double yields.
Thus, improved but not genetically modified seeds are already available for most bean varieties.
Examples of the successful migration from native to improved seeds can be found in Durango, where an
estimated 80,000 hectares are being planted with improved varieties, as well as Sinaloa where most
producers use improved and certified seeds.
Drought-tolerant genetically modified black bean varieties are already being developed at the
Autonomous University of the State of Morelos (UAEM). However, even under optimistic scenarios, this
variety will not be ready for at least seven years. Although this is one of the first efforts to create a
genetically modified bean variety in the country, greater efforts by universities and INIFAP will be
needed to place such genetically modified varieties in the market.
Another way of evaluating the effect of technology on beans is through the General Equilibrium Model,
which we used to estimate the effects of technology on the overall economy. The model reallocates some
of the factors of production and agricultural inputs, such as fertilizers, pesticides, and transport, among
the different crops considered. Therefore, greater efficiency in bean production results in changes in
relative prices among competing crops. Thus, the overall 20 percent increase in bean yields from 0.83

53
tons/ha to 1 ton/ ha by using INIFAP’s improved seeds shows that benefits would increase by
approximately 4 percent.70
These results are explained by:
An increase in the production of beans, sugar, corn, and wheat (which account for over 80 percent
of cultivated land).
A nearly 36 percent decrease in bean prices relative to other crops, and minimum changes in
other prices.
A 34 percent increase in seed prices with respect to the baseline scenario as well as increases in
logistics, transport, fertilizer and land of 4, 3, 1.5, and 0.1 percent, respectively
A reduction in the use of pesticide, capital, and labor of 7, 10, and 17 percent, respectively.
V.1.1. Steps to Encourage Technology Adoption
It is particularly difficult for smaller-scale producers to have access to improved seeds, despite the
government’s efforts. One example of making producers aware of the benefits of improved seeds is the
introduction of improved pinto beans in northern Mexico conducted by the Bean/Cowpea Collaborative
Research Support Program together with INIFAP. The variety of Pinto Villa has proved to be more
plague and drought resistant, thus improving yields. Today, nearly 9 of 10 pinto beans grown in the
country are of this variety.71
The success of the introduction of this variety relies on the larger scale of
producers in northwestern Mexico, who are able to adopt new technologies. INIFAP should continue to
work closely with this organization and other international organizations to foster technology adoption in
lower-yield bean growing areas with potential.
Another program that proved efficient in the introduction of improved varieties was the federal kilo por
kilo program, implemented in the 1990s to give incentives to farmers to switch from native to improved
seeds. Other forms of encouraging improved seed use, including the import of foreign seeds such as
Michigan black beans (T39), have been tried with little success, according to PRODUCE organizations.72
It may be that more research on native species would trigger greater adoption of technology.
Although some groups are concerned with the possible effects of improved seeds on native varieties, this
has not proven to be a real threat to most hybrids or even to genetically modified crops. Germplasm banks
of all bean varieties can be created to store all genetic information on all species in order to reproduce
them later.
Several steps to promote the use of improved bean seed varieties in Mexico are:
70
The yield increase in the GEM model was introduced in the production function. This was estimated through
maximum entropy methods, considering certain weights for all inputs and production factors. The elasticity of
replacing the beans considered in the CES function was 0.4. For the change in technology we changed the weights
of seed and capital, thus making technology use intensive in both these inputs and using less labor, pesticide, and
logistics. We then ran a Monte Carlo simulation of this new CES function and with the 20 percent increase in yields.
The resulting probability functions were heavily skewed to the left. 71
Acta Horticulturae. Volume 637. ISHS: Leuven, 2006 72
Producers’ organizations are public private trust funds at State level to promote technological change.

54
Promoting public-private partnerships (for example, with INIFAP) to develop particular
technologies for Mexican bean varieties and regions, tapping into bean niche markets;
Encouraging producers associations to fund technology projects and distribute seeds. Motivating
these groups requires the full autonomy of public research institutions, with independent
governing boards that represent key stakeholders.
A strong campaign to inform and train producers of new bean varieties and distribute seeds. The
training of ejidatarios and agribusiness owners on the purpose and use of new technology as well
as the retraining of displaced agricultural laborers are crucial.
Making public research funds publicly available through competitive and contractual mechanisms
to encourage participation and accountability. This could foster more interaction between
academia and the private and the public sectors for technology dissemination and transfer.
Several current programs within the federal Alianza Contigo program need to be changed in order to
promote technology transfer:
Improve incentives for private providers of technical services who are the weakest link in the
implementation chain. They are recruited on short-term contracts, have no entitlement to secure
employment, and receive few economic or moral incentives to do a good job.
Change criteria for funding projects according to quality and cost-efficiency criteria rather than
on a first-come first-served basis and completeness-of-documentation criteria.
Promote decentralization of rural policy. This would solve the lack of program coordination and
harmonization of funding, and force state governments to interiorize all costs and benefits, thus
promoting efficiency and equity in resource use. For example, transferring to the states most of
the funds of production-oriented R&D programs in the form of block grants could facilitate the
application of a territorial approach to rural development. The national government would still
reserve funds to carry out any R&D considered strategic for national-level execution.
Non- GMO technology may have higher potential for improving the productivity of a wiser range of
Mexican producers than GMOs. But as noted above, many of the policy issues that in the past have
presented obstacles to development of this market have been resolved by the passage of the new seed law.
Policy-making attention needs now to be focused on policy towards GMOs. While acknowledging that in
the case of GMOs, it is necessary to first put in place a regulatory framework that includes appropriate
safeguards against the well-known risks, we argue that the very long lead times required to undertake
biosafety protocols for genetically modified varieties and to develop and distribute adapted transgenic
varieties to market, lends a degree or urgency to a number of actions that need to be taken:
Research to find a gene of a bean variety that adds market value;
Allowing access to adapted germplasm;
Creating a centralized, transparent, scientifically based regulatory process;
Improving the protection of intellectual property;
Developing the potential to finance biotechnology investments; and
Promoting institutional arrangements needed for public institutions to share intellectual property.

55
Developing the potential to finance biotechnology investments in Mexico is also a major constraint. There
is little public investment and public research facilities such as INIFAP lack sufficient resources for
negotiating and accessing protected intellectual property—an absolute necessity for any institution to act
as a developer or broker of useful biotechnology products.
As mentioned above, one of the key steps for the adoption of technology is to create producers’
associations that would benefit from technical assistance and economies of scale. The following section
analyzes measures to increase producers’ scale by encouraging associations, as detailed below.
V.2. Improving Efficiency through Economies of Scale
One of the main characteristics of bean production in Mexico is the high degree of land fragmentation.
There are 570,000 dry bean producers in Mexico, of whom only 110,000 are currently registered in the
PROCAMPO census as specializing in beans.73
Most bean producers, who use their crop to feed their
household, mix some dry beans among other crops such as corn and chili peppers. SAGARPA estimates
that 20 percent of the country’s total dry bean crop is consumed by growers and their families.
Of the 110,000 producers who specialize in bean production, half belong to the States of Zacatecas and
Durango. These two states alone account for over 40 percent of total dry bean production. Since most
producers have small landholdings, it is difficult for them to access credit and much government support
by themselves. Consequently, producers should seek to build local cooperatives that allow them to
produce and market the product together, thereby achieving economies of scale.
Because bean producers’ associations are relatively new and quite small, there is much to do in order to
promote them and improve them. Today many are more related to political groups than concerned with
efficiency rationale, according to association leaders interviewed in Zacatecas. However, organizing
producers in cooperatives or mercantile societies would make it more profitable to invest in infrastructure
and improve the quality of commercialized dry beans. To do so, public policies should foster change in
producers’ associations by:
1. Providing aid for producers to create agricultural contracts, so they are guaranteed access to
market at predictable prices;
2. Facilitating price hedging, insurance mechanisms, and financial guarantees to improve access to
credit;
3. Promoting the vertical integration of supply chains. Thus, changes to the Agricultural
Cooperatives and Associations Organization Law (Ley para la Organización de Cooperativas y
de Asociaciones Agrícolas) need to be reviewed with an eye toward reducing red tape and
loosening requirements that currently make it difficult for producers to create new associations;
4. Scaling up post-harvest activities is the way for producers associations to seize the opportunities
that economies of scale represent.
73
SAGARPA-USDA, 2007

56
Agricultural Contracts
One way to reduce uncertainty in prices and therefore increase producers’ well-being is the widespread
use of agricultural contracts. Large wholesale dealers and industries that purchase beans could establish
these contracts with producers’ associations based on expected prices, according to the country’s
forecasted supply. This would benefit both producers and wholesalers/industries, since greater certainty
permits better financial planning.
Insurance Mechanisms
Only a small portion of bean producers insure their crops. Insurance is crucial for dry bean producers,
since this crop in particular is usually vulnerable to changes in climate. Rainfed bean producers are the
most vulnerable, since drought or heavy rains may seriously damage their crops. In Zacatecas, for
example, 45 percent of the planted area was damaged in 2005,74
mainly due to weather conditions. These
unexpected situations dramatically affect uninsured producers.
Bean producers have faced the risk of losing their crop in the field, as well as in the warehouse. Beans are
highly sensitive to heat and moisture75
and cannot be stored for more than a year because they dry up and
are difficult to cook. Approximately 10 percent of stored beans are lost due to these conditions.76
A general policy to reorient compensation subsidies toward investment in insurance premiums or
guarantees could be a sensible approach to reduce risk and change the way in which agricultural policy is
used.
Law of Agricultural Organizations
Some reforms should be made in the Law of Agricultural Organizations, to make it easier for producers to
group together. This law, which dates back to 1932, determines which organizations are legally
recognized, as well as their role in agriculture. The main problem with the law is that there are too many
requirements and red tape for producers to create new associations.
A draft reform of this law, which was proposed in the upper house in 2002,77
seeks a democratization of
agricultural organizations and a more crucial role in agricultural policy and practices. It also considers an
integration of the supply chains to allow greater investment and reduce risk for individual producers. This
proposal was dismissed by the Senate’s Rural Development Commission without being discussed at the
plenary session, and no further reforms have been promoted since then.
74
SIACON, 2005 75
Berrelleza, 2007 76
Acosta, 2007 77
Becerra Rodríguez, 2002

57
Scaling Up Post-Harvest Activities
An approach to scaling up production can be seen in post-harvest activities, such as cleaning and packing
beans. This may have a greater impact than scale at the field level, and may also be achieved more easily
than by incorporating larger landholdings. But it requires investment in processing facilities, Effective
policies for encouraging such investments are primarily those that create a supportive general investment
climate in rural areas. Specific measures to facilitate formation and operation of producers’ associations
and cooperatives which are likely to make such investments (as discussed in the previous paragraph) can
be helpful. Producers’ associations can also receive credit (or guarantees) from the government to
purchase machinery for cleaning and packing beans. This substantially increases producers’ income,
adding value to the crops and providing greater opportunities to market beans. The State of Zacatecas
opened two bean-processing plants at the beginning of this year;78
these plants will benefit some of the
region’s bean producers. According to SAGARPA, this could be managed more efficiently and could also
be replicated in other areas, particularly those with high yield potential.
V.3. Reconverting Land to Other Uses
Although technology, integration of land and markets, and other measures can certainly improve bean
producers’ competitiveness, Mexico’s climate and geography make bean production unsustainable both
economically and environmentally in many areas where beans are currently being grown. This is why
governments are considering reconversion programs in many bean-growing areas throughout the country.
Reconverting land in the most inefficient bean growing areas (mainly subsistence agriculture) to crops or
activities other than beans is a complicated issue that requires consideration of many factors. While a full
discussion of this issue is beyond the scope of this policy note, two key points should be emphasized:
1. Reconverting many of the inefficient bean producing areas is of utmost importance.
2. Economic densities are a key criteria to consider, along with a range of other factors, when
analyzing options for reconversion.
Economic density refers to the return that can be obtained from production of a specific crop at a given
time. Although it is a useful tool, economic density does not address critical issues such as possible
changes in demand or market access. Considering these factors along with future market growth and
productivity trends for foreign and domestic producers could help better understand where opportunities
for reconversion exist.
This rationale helps to illustrate that investing in crops whose productivity and rate of growth in yields is
lower than foreign competitors is likely to be a poor choice, as is the case for beans in many parts of
Mexico. This explains why in 2001-05 legumes on average represented about 11 percent of the area
planted in Mexico’s main crops but generated only 5 percent of the total value of those crops. In the first
table, crops for which economic densities have fallen, such as fruits, have either lost revenue due to price
changes or lost production due to disasters, loss of market share, or other dynamics. The second table
78
García, 2007

58
shows the comparative economic densities for different crops. For example the economic density for
vegetables is 13.5 times higher than for cereals. It is important to stress that this is by no means the only
criteria to consider in deciding whether to reconvert, but it is a useful analytical tool to at least begin to
consider economic factors, rather than just agronomic factors as has sometimes been done in the past.
Table 3. Economic Density of Principal Crops
Average 1996-2000 vs. 2001-05 (a)Planted area % (b)Value of production % Economic density (b/a)
Avg. 96-00 Avg. 01-05 Avg. 96-00 Avg. 01-05 Avg. 96-00 Avg. 01-05
Cereals 43.8 47.8 21.5 24.3 0.5 0.5 ==
Forages 23.3 18.0 18.4 9.8 0.8 0.5
Fruits 5.7 5.6 18.1 17.1 3.2 3.1
Vegetables 2.5 3.0 16.8 20.6 6.6 6.9
Industrial 11.3 11.7 16 15.6 1.4 1.3
Legumes 11.0 11.3 4.7 5.5 0.4 0.5
Oil crops 1.8 1.9 0.9 0.8 0.5 0.4
Tubercles 0.3 0.4 3 4.6 9.1 11.5
Others 0.3 0.3 0.7 1.0 2.6 3.3
Total 100.0 100.0 100.0 100.0
Source: IMCO, using SIAP database
CCoommppaarriinngg ccrroopp eeccoonnoommiicc ddeennssiittyy (x = times)
VVeeggeettaabblleess FFrruuiittss TTuubbeerrcclleess
Avg. 96-00 Avg. 01-05 Avg. 96-00 Avg. 01-05 Avg. 96-00 Avg. 01-05
Cereals 13.5x 13.5x 6.5x 6.0x 18.6x 22.6x
Forages 8.4x 12.6x 4.0x 5.6x 11.5x 21.1x
Fruits 2.1x 2.2x 1.0x 1.0x 2.9x 3.8x
Vegetables 11..00xx 1.0x 0.5x 0.4x 1.4x 1.7x
Industrial 4.7x 5.2x 2.2x 2.3x 6.4x 8.6x
Legumes 15.8x 14.1x 7.5x 6.3x 21.7x 23.6x
Oil crops 13.5x 16.3x 6.5x 7.3x 18.6x 27.3x
Tubercles 0.7x 0.6x 0.3x 0.3x 1.0x 1.0x
Others 2.5x 2.1x 1.2x 0.9x 3.5x 3.5x
Source: IMCO, using SIAP database
Crop reconversion requires considerable amounts of investment and intense technical assistance, as well
as information that allows producers to know about alternative crops with greater demand. Thus, a
successful reconversion plan must be based on a cost-benefit analysis that includes a precise register of
arable land, its current use, access to market, and possible alternative uses of land, considering all
information such as soil, rainfall, geography, technology, land tenure, demographics, and prices.
Crop reconversion programs have been started in bean-growing areas for quite a while. Although there is
little information on their long-term results, some states such as Zacatecas are confident that some of their
recent reconversion policies are working. For example, in Zacatecas, the principal bean-producing state,
the local government has subsidized the purchase of seeds to grow feed crops as forage—corn, oats, and
grass—instead of growing beans. The program intends to subsidize only half of the feed crop seed in
2008 and half of machinery costs. The program aims to reconvert about 300,000 hectares in Zacatecas
alone, and has already reached 200,000 this year. The program appears to be quite successful, according

59
to state authorities, who claim that alfalfa, oats, corn, and wheat are being grown. However, this has only
taken place on some lands in the state and (according to producers) poor farmers continue to grow beans.
Thus, there is a need for machinery and equipment to be included widely in the program as well as for
market information so that change can be promoted in poor areas and to understand whether nopal, an
edible cactus which grows easily and abundantly in the poorest soils, could be a crop worth growing.
Without adequate information on access to markets, reconversion programs are bound to fail. In the
1970s, many corn producers in the state of Zacatecas converted to bean production, which ultimately was
of little help to their family incomes and left them with another marketing problem.
Technology has also played an important role in reconversion. The use of improved seeds and more
resistant crops have also been used in reconversion programs. Greenhouses have also helped to reconvert
areas with high and low levels of production. Some experiences in Mexico show that the productivities of
certain crops could double through the use of greenhouses; at the same time producers can fetch higher
prices by improving crop quality.79
Reconversion programs with the newest technologies are especially
needed in bean-growing areas, because these farmers are quite old and few young people are willing to
work in the fields.
Jorge Acosta, an INIFAP dry bean specialist, has been promoting a migration of rainfed bean production
from less productive areas, such as the northeastern parts of Zacatecas, to several parts of Guanajuato
with better soils. Although some producers are not willing to grow such varieties because they specialize
in vegetables, some small-scale producers are using beans as a rotational crop. This is efficient because
beans grow faster, giving producers more room for crop rotation and fetching high yields—up to two tons
on some of the best lands, more than twice the average yields in rainfed areas.80
Future research and government-sponsored programs should be directed toward reconverting land and
include a technological component. The next section mentions some of the major issues that inhibit
producers’ competitiveness, in order to add several recommendations concerning financial mechanisms
that could foster producers’ competitiveness.
V.4. Planning for climate change
Long-term policy-making in all agricultural markets will have to cope with many uncertainties, foremost
among them the specter of climate change. Mexico may suffer especially from reduction in water
availability, with serious consequences for its agricultural production overall81
. The implications of this
for competitiveness in the NAFTA market are not clear, however, since some of the most productive
areas of the United States are also expected to suffer, and the impact on global markets is just beginning
to be explored. Given the huge uncertainties involved in all of these forecasts, the most prudent path for
79
Invernaderos y Tecnología, Presentation by AMCI, Asociación Mexicana de Constructores de Invernaderos (SIAP
Conference 2007) 80
Acosta. Personal interview, August 2007. 81
Impacts on the Latin America and the Caribbean region will be investigated in depth in the next flagship study of
the Latin American and Caribbean Region of the World Bank,

60
the government is probably to establish early on a consultative process with stakeholders to monitor and
review the evidence on the impacts of climate change in order to stay abreast of the most recent
developments and start to build early consensus on necessary policy actions and investments.

REFERENCES
Acosta, Jorge. Personal Interview, INIFAP dry bean researcher, August 2007
Acquaye Albert K., Derek Byerlee, Matthew A. McMahon, Han Roseboom, Gustavo E. Sain, Greg
Traxler, and Johannes Woelcke. Productivity and innovation in the Latin America Agricultural
Sector, Flagship Study Background Paper World Bank, June 24, 2004.
Ayala, Alma. Problemática Pendiente, Comercialización del Frijol. Teorema Ambiental, no. 45. April 1,
2004. http://www.teorema.com.mx/articulos.php?id_sec=52&id_art=1148&id_ejemplar=64
Berrelleza, José María. Personal Inteview, dry bean producer in the state of Sinaloa. August, 2007.
Brookes Graham & Barfoot Peter, GM crops: the first ten years -global socio-economic and
environmental impacts, PG Economics Ltd, UK December 2006.
Caballero José María, Tanimichi Hoberg Yurie, de Dinechin Frederic and McMahon Matthew, Chapter
7: Agriculture, Rural Development and Land Policies, World Bank.
Cool, Thomas (2001): The Economics Pack User Guide: Applications of Mathematica.
http://www.dataweb.nl/~cool
Cámara de Diputados H Congreso de la Unión, Impacto de Las Importaciones de Maíz Blanco y de Frijol
Originarias de EUA en el Mercado Interno De México, CEFP/054/2004, 2004
CNA, Sembrando el Futuro: Un diez para el Campo Propuestas de Política, Mayo 2006.
Collins Keith, Prospects For The U.S. Farm Economy, Agricultural Outlook Forum 2007, USDA, March
1, 2007.
FIRA, El frijol en México, competitividad y oportunidades de desarrollo. Boletín Informativo No. 316,
Banco de Mexico, Mexico, 2001
FIRA, Proyecto de compactación de Tierras para la producción de Trigo en el valle del yaqui, Tetabiate
empresa social, s.p.r. de r.l, 2005.
Galarza Juan Manuel, Miramontes Ulises and Muñoz David, Situación Actual y Perspectivas del maíz en
México 1990-2004, SAGARPA 2004.
García, Amalia, Tercer Informe de Gobierno, Gobierno de Zacatecas, September 8, 2007.
Gobierno de Zacatecas, ―Solicita SEDAGRO más dinero para acopio de frijol.” Periódico El Campirano.
Available at: http://oeidrus.zacatecas.gob.mx/oeidrus_zac/zacatecas/periodico/CampiranoEnero/Solicita%20SEDAGRO
%20más.htm -
Gómez-Barbero Manuel and Rodríguez-Cerezo Emilio, Economic Impact of Dominant GM Crops
Worldwide: a Review, European Commission Sustainability in Agriculture, Food and Health
Unit, DG JRC-IPTS, December 2006.
Guasch José Luis and Fay Marianne, Actividad económica, conglomerados y logística en los estados del
sur de México, World Bank, 2004.
IMCO, Elementos para mejorar la competitividad del transporte de Carga, 2005.
INIFAP, Information on Zapata dry bean variety.
http://www.inifap.gob.mx/logros/noviembre/ZAPATA.PDF

62
INEGI - Encuesta Nacional de Ingreso Gasto de los Hogares 1998 and 2004.
Newell García Roberto and Chacón Villar Armando, TLCAN Agropecuario: Expectativas, Realidades y
Perspectivas, Working Paper, SAGARPA, 2003.
OECD, Agricultural and Fisheries Policy in Mexico, recent achievements continuing the Reform Agenda,
OECD, 2006.
Rawson, Jean M. ―Specialty Crops: 2007 Farm Bill Issues,‖ CRS Report for Congress, Congressional
Research Service. July 23, 2007
Ray Daryll E, Biofuels: Market Integration & Market Integration & Farm Policy Farm Policy, University
of Tennessee Agricultural Policy Analysis Center, Agricultural Outlook Conference March 1,
2007.
SAGARPA and USDA, Estudio de Maiz Blanco y Frijol Seco, México – Estados Unidos, Working Paper,
2007.
Tovar, Carolina; Frías, Mario. ―Sabormex.‖ Online article, available at:
http://www.industriaalimenticia.com/content.php?s=1A/2006/06&P=4
USDA. ERS/USDA Briefing Room - Dry Beans. Available at:
http://www.ers.usda.gov/Briefing/DryBeans
USDA, Farm Income and Costs: 2007 Farm Sector Income Forecast, 2007.
Williams Gary and Málaga Jaime E, Mexico Competitiveness: Reaching Its Potential Input Paper Mexico
Agriculture Export Competitiveness, World Bank, 2006.
World Bank, Mexico Assessment Of Policy Interventions In The Water Sector Volume I: Policy Report,
World Bank, March 28, 2006.
World Bank, La pobreza en México una evaluación de las condiciones las tendencias y la Estrategia del
Gobierno, World Bank, 2004.
World Bank, Rural Finance Innovations, Topics and Case Studies, Report No. 32726-GLB, The World
Bank, April 2005.
INTERVIEWS
Berrelleza, Jose Maria, bean producer in Sinaloa in charge of a commercialize plants of grains
Castañeda Muñoz Constantino leader of bean producer association in Zacatecas
Fajardo Ortiz Daniel Minister of Agriculture for the State of Zacatecas
Gracias Jesus and Cota Eleazar main bena buyers in Mexico (CEO and Head and Sales Manager of
Comercializadora el Alamazan)
Jurado, Octavio. General Manager of the State-Level Agricultural Secretaries Association, June 2007
Santos Jildardo ex president of bean producer associations in Mexico

63
WEBSITES CONSULTED
www.economia.gob.mx
faostat.fao.org
www.iqom.com.mx
www.oecd.org
www.sagarpa.gob.mx
SIACON (Dowloadable database).
www.siap.gob.mx
www.secofi-sniim.gob.mx
www.usda.gov
www.worldbank.org


APPENDIX 1. GENERAL EQUILIBRIUM MODEL
A.1. Background
In order to understand if NAFTA tariff phase-out for corn, beans and sugar outweighs the costs of
incurred by some producers a General Equilibrium Model (GEM) is a very useful tool as it measures the
overall benefits in the economy. However in the detailed workings of the model one can learn how to:
Measure the welfare impacts of market integration by maximizing a Samuelson-Bergson social
utility function, subject to production and imports of select inputs and food staples,
Understand the relationships between the various industries that will be affected by economic
integration,
Simulate the dynamics of exogenous shocks in agricultural industries,
Evaluate the impact of increased consumption of grains (corn, in particular) for livestock, coming
from additional domestic demand of poultry products and export demand of bovine meat.
Assess the impact of ethanol production in the United States that will affect corn-consuming
Mexican industries.
A.2 The Model
General equilibrium modeling is not a simple task. GE models usually have a costly learning curve.
Estimating parameter has usually a weak econometrical basis. Furthermore, models tend to be really
complex, so results are rarely comparable because of different specifications between researchers.
Therefore, we developed an in-house model that very closely follows the classical walrasian model of
general equilibrium, using Mathematica82
. Mathematica is a flexible tool that requires less programming
skills than most packages for GE modeling, as it relies heavily on pure mathematical expressions. The
original model was created for a closed economy; however, with the appropriate assumptions, the model
can simulate an open-economy.
The most common assumption in open-economy GE models is the immediate validity of the law of one
price between integrating economies. This is an unrealistic assumption, because there are real constraints
in the economy, such as logistics, physical infrastructure endowments, differing technologies and
economies of scale that will result in different prices of similar commodities across economies83
. In such a
82
The original model was created by Silvio Levy, whose programming was published by Noguchi, A. (1991), ―The
Two-Sector General Equilibrium Model: Numerical and Graphical Representations of an Economy‖, published in
The Mathematica Journal, Vol. 1, Issue 3, Winter, 1991: Page 96. This model was extended by Cool, T. (2001),
―The Economics Pack‖, Thomas Cool Consultancy & Econometrics, Scheveningen, Holland,
http://www.dataweb.nl/~cool. 83
In fact, a common criticism against free trade is that the law of one price does not necessarily hold. European
Union integration is an example.

66
context, the traditional walrasian model can still be useful in explaining these price differentials, because
every price in the model is endogenous. Although the initial model allows for the exogenous fixation of
prices,84
we chose not to do so, and tried to find prices through initial calibration that made sense with
reality.
The model maximizes a Bergson-Samuelson utility function that adds up the individual consumption of a
basket of goods. It includes domestic consumers and export consumers of these products, which is a
relevant aspect particularly in the livestock products sector.
Figure A.1. Bergson-Samuelson Utility Curve and Production Possibilities Frontier
The model allows for n commodities (sectors) and m factors of production. The standard production
function used is a Constant Elasticity of Substitution (CES), although the formulation allows for other
specifications to be used, even nesting of different types of production functions. It also allows for
intermediate inputs and stocks, although we chose to model inventory separately in every period,
assuming that the market clears in every period for the amount of the commodity that the supplier is
willing to sell in order to maximize her profit.
A.3. Full Specification
The Walrasian General Equilibrium Model has the underlying assumption of an auctioneer or clearing
house that produces the equilibrium between supply and demand of the goods. Our Walrasian auctioneer
needs to maximize the Samuelson-Bergson utility curve, which includes all the individuals in the society.
Different sectors compete for diverse inputs in order to produce the goods and services that the economy
needs. However, primary agricultural producers and agro-industries compete for different sets of inputs.
Equilibria for these sectors are calculated separately, as shown below:
84
Noguchi, A (1991), pp. 102.

67
Figure A.2. Grouping Together Primary Agricultural Producers and Agroindustries
A.3.1. First Module: Primary Agricultural Producer’s Definition of Baseline Scenario
The first module encompasses primary agriculture. Four sectors (corn, sugarcane, wheat and beans)
compete for nine inputs (capital, labor, transport, water, seed, fertilizer, pesticide, land, and storage-
logistics).
In this module, the Walrasian auctioneer faces the problem of maximizing the following Samuelson-
Bergson utility function:
(1)
FactorE[i] i= the revealed preference factor for each of the products that the sectors produce; Subs is the
elasticity of substitution in consumption; Sector[i] are the actual variables of quantities preferred. These
factors were attained through a trial and error process in model calibration, evaluating whether the module
generated a vector of quantities produced and a price vector similar to reality. The elasticity of
substitution used is 0.4, which is entirely arbitrary, but commonly used in GE modeling.85
85
See Cool (2001), 129-135 and 144-155. In general, this implies a middle case between Leontief and Cobb-
Douglas curves. The ad-hoc choice of parameter was made bearing in mind that the higher the substitution
coefficient, the more instability in the model.

68
Table. A.1. Preference Parameter Estimated for Each of the Products
Sector Product
Weight in the Samuelson-Bergson Utility function
(sum=1)
1 Corn 0.34587419
2 Sugarcane 0.64861203
3 Beans 0.00105333
4 Wheat 0.00446045
This maximization is constrained by the relative prices vector generated by production possibilities and
consumer preferences. The functional form of the production function faced by these four sectors is:
(2)
Where A[i] = the scale parameter in sector [i], a1 = the use of capital; a2 = the use of labor; a3 = the use
of transport; a4 = the use of water; a5 = the use of seed; a6 = the use of fertilizer; a7 = the use of
pesticide; a8 = the use of land; a9 = the use of logistics and storage, and S = the elasticity of substitution.
The production functions above were estimated by maximum entropy methods, using Monte-Carlo
simulations. The Agricultural and livestock Information Service in SAGARPA (SIAP) produces yield
data for the four agricultural products mentioned at the municipality level, which allows us to construct
probability curves for yields. Similarly, INEGI publishes data from the 1991 Agricultural Census at
municipality level, which provides us approximate information on dependent variables like number of
cargo vehicles per municipality, fertilizer and pesticide use, and the other independent variables.
We produced probability curves for each of the independent variables, and introduced them into type (2)
equations for each product, in municipalities where production of each of these products was present. We
assumed normality of the nine coefficients, arbitrarily assigning them a 10 percent standard deviation.
The trickiest part of this estimation is obtaining the elasticity of substitution for each input in the
production function. We used several elasticities of substitution in Monte-Carlo experiments that
produced an estimated probability distribution for yields. We then compared the estimated probability
distributions for yields with the actual probability distributions obtained from SIAP, and discarded
functional forms that produced probability curves dissimilar to the original.

69
The usefulness of using this method against using regressions is that a non-negativity constraint is
automatically considered in the estimation of the production functions. The resulting estimated coefficient
can be seen in Table A.2 below.
Table A.2. Estimated Coefficients for the Production Functions
Capital Labor Transport Water Seed Fertilizer Pesticide Land Logistics
and storage
Corn a1[1] -> 0.08993
a2[1] -> 0.09014
a3[1] -> 0.1781
a4[1] -> 0.09008
a5[1] -> 0.08971
a6[1] -> 0.0897
a7[1] -> 0.09399
a8[1] -> 0.09181
a9[1] -> 0.09243
Cane a1[2] -> 0.04611
a2[2] -> 0.01755
a3[2] -> 0.0058
a4[2] -> 0.0103
a5[2] -> 0.0059
a6[2] -> 0.01119
a7[2] -> 0.40368
a8[2] -> 0.08977
a9[2] -> 0.0058763
Beans a1[3] -> 0.1135
a2[3] -> 0.132788
a3[3] -> 1.*10^-7
a4[3] -> 0.1379
a5[3] -> 0.1386
a6[3] -> 0.13835
a7[3] -> 0.04149
a8[3] -> 0.13863
a9[3] -> 0.11713
Wheat a1[4] -> 0.0989
a2[4] -> 0.09782
a3[4] -> 0.1152
a4[4] -> 0.0977
a5[4] -> 0.09766
a6[4] -> 0.09767
a7[4] -> 0.09949
a8[4] -> 0.09766
a9[4] -> 0.0982565
Scale Elasticity of substitution
A[1] -> 1.024336 S[1] -> 0.525
A[2] -> 3.276076 S[2] -> 0.35
A[3] -> 0.4 S[3] -> 0.4
A[4] -> 1.002202 S[4] -> 0.5
A.3.2. Calibration, Resources, Allocation and Model Solution
The model is solved by Mathematica utilizing successive approximations. Therefore, it is important to
specify resources as a number in the same order of magnitude for every product, or else the resolution
algorithm will encounter itself trying to divide a very large number by a near-zero number in its task of
finding relative prices. In consequence, resources for each input are specified as 100, and once
equilibrium is computed, everything can be put in the real units.
Also, it is important to take note that this is not a comprehensive model of Mexican agriculture, so the
model may have some distortions regarding resource allocation. In Table A.3, the allocation of land for
the sugarcane sector is roughly 10 times what it really is, while the allocation of land to the wheat sector
is approximately double to reality. The interpretation that should be given to this odd result is that both
cane and wheat are sectors that are comparatively more profitable than corn or beans and in absence of
climatic or regulatory restrictions to the number of hectares allocated to each sector, the economy would
probably allocate more land to these sectors. In reality, the extra land allocated to sugarcane and wheat is
in sorghum or other products not considered by the model.

70
Table A.3. Allocation of Resources per Sector (% of total resource)
FactorX[1]
Capital FactorX[2]
Labor FactorX[3] Transport
FactorX[4] Water
FactorX[5] Seed
FactorX[6] Fertilizer
FactorX[7] Pesticide
FactorX[8] Land
FactorX[9] Logistics
and storage
Sector[1] Corn 51.5727 56.3252 75.2755 58.5675 60.6499 58.1741 38.3357 47.2573 61.5263
Sector[2] Sugarcane 28.4352 21.4911 13.9968 18.3127 15.4654 18.7876 49.0934 33.6251 15.4033
Sector[3] Beans 10.2658 11.6797 0.039426 12.2202 12.5963 12.1906 5.38 10.3191 11.7625
Sector[4] Wheat 9.72631 10.504 10.6883 10.8996 11.2884 10.8478 7.1909 8.79859 11.3078
Table A.4. Land Allocation at Scale and Real Numbers
% of land allocated by
model
Hectares allocated by the model, assuming 7,978
thousand hectares in corn
% sowed in real 2005 Mexico
(SIAP)86
Corn 47.2573 7,978 7,978
Sugarcane 33.6251 5,676.61 630
Beans 10.3191 1,742.1 1,746
Wheat 8.79859 1,485.38 654.2
Some of these allocations could appear meaningless, such as seed, because obviously the seed for each of
these products is physically a different thing. However, the seed input could be interpreted as a whole
subsector which makes allocation decisions for the production of determinate seeds for each productive
sector. The market would send the signal to that seed sector that 60.64 percent of the resources should be
devoted to producing seed for corn. In reality, the market for improved seeds and biotechnology seems to
orbit around corn and secondarily produce anything else, so that result seems to be consistent with reality.
The model attempts to replicate reality by giving us a quantity and price vector. In fact, successive
versions of the model are run and adjusted before arriving at a specification adequate for the baseline
scenario. Due to the specification of resources in 1-100 numbers, the quantity and price vector needs
conversion from model or ―scale‖ units to real unit as seen in Table A.5 below.
Table A.5. Price Vector for Primary Products
Corn Sugarcane Beans Wheat
Relative price (model scale) 1 0.21 2.37 1.04
Real peso price per ton assuming Corn Price = 1,900 / ton
1,900 399.92 4,516.28 1,978.95
86
www.siap.gob.mx/integracion/EstadisticaBasica/Agricola/SerieHistorica/hstagr.pdf
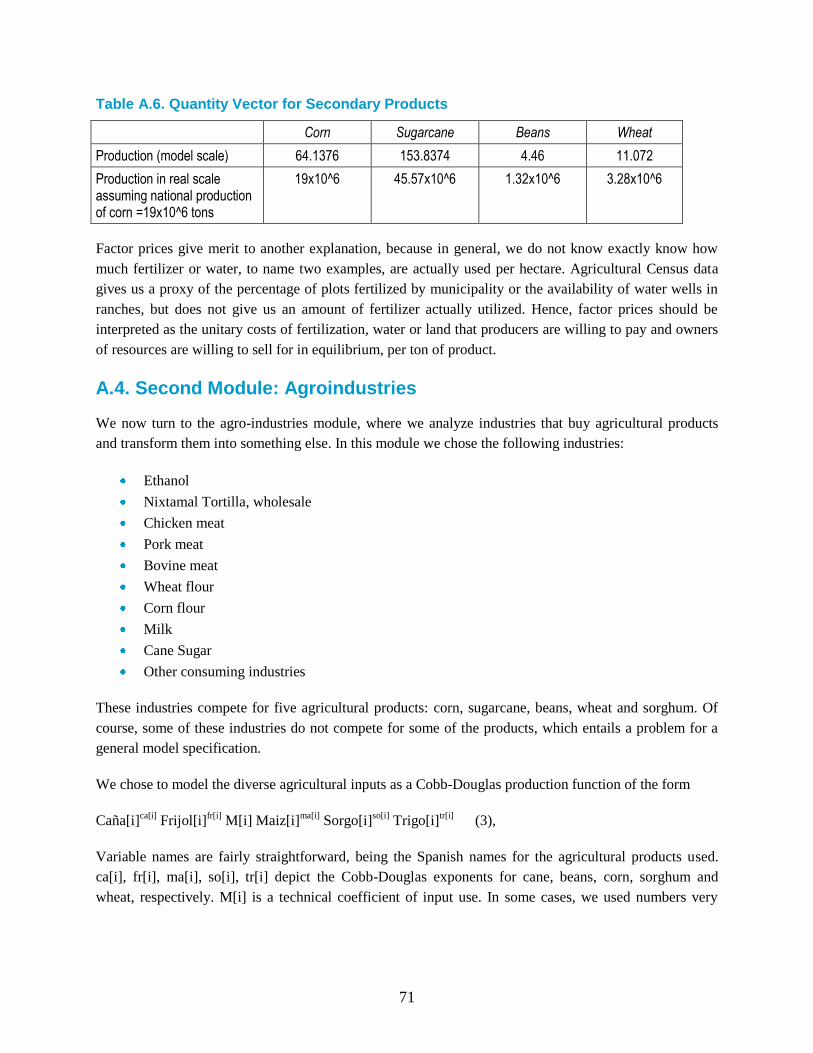
71
Table A.6. Quantity Vector for Secondary Products
Corn Sugarcane Beans Wheat
Production (model scale) 64.1376 153.8374 4.46 11.072
Production in real scale assuming national production of corn =19x10^6 tons
19x10^6 45.57x10^6 1.32x10^6 3.28x10^6
Factor prices give merit to another explanation, because in general, we do not know exactly know how
much fertilizer or water, to name two examples, are actually used per hectare. Agricultural Census data
gives us a proxy of the percentage of plots fertilized by municipality or the availability of water wells in
ranches, but does not give us an amount of fertilizer actually utilized. Hence, factor prices should be
interpreted as the unitary costs of fertilization, water or land that producers are willing to pay and owners
of resources are willing to sell for in equilibrium, per ton of product.
A.4. Second Module: Agroindustries
We now turn to the agro-industries module, where we analyze industries that buy agricultural products
and transform them into something else. In this module we chose the following industries:
Ethanol
Nixtamal Tortilla, wholesale
Chicken meat
Pork meat
Bovine meat
Wheat flour
Corn flour
Milk
Cane Sugar
Other consuming industries
These industries compete for five agricultural products: corn, sugarcane, beans, wheat and sorghum. Of
course, some of these industries do not compete for some of the products, which entails a problem for a
general model specification.
We chose to model the diverse agricultural inputs as a Cobb-Douglas production function of the form
Caña[i]ca[i]
Frijol[i]fr[i]
M[i] Maiz[i]ma[i]
Sorgo[i]so[i]
Trigo[i]tr[i]
(3),
Variable names are fairly straightforward, being the Spanish names for the agricultural products used.
ca[i], fr[i], ma[i], so[i], tr[i] depict the Cobb-Douglas exponents for cane, beans, corn, sorghum and
wheat, respectively. M[i] is a technical coefficient of input use. In some cases, we used numbers very

72
close to zero87
for the cobb-douglas exponent, which are common especially in the case of beans (because
very few of these industries actually consume beans). The table of coefficients used is shown below.
Table A.7. Coefficients Used for the Cobb-Douglas Input Function
M ma[i] ca[i] fr[i] tr[i] so[i]
Ethanol 1.231612 0.248 0.248 0.01 0.248 0.248
Tortillas Nixtamal 0.652315 0.957 0.011 0.011 0.011 0.011
Chicken Meat 68.28715 0.196 0.006 0.006 0.196 0.595
Pork meat 13.31295 0.248 0.01 0.248 0.248 0.248
Bovine meat 81.83752 0.247 0.012 0.247 0.247 0.247
Wheat flour 1.782 0.002 0.002 0.002 0.99 0.002
Corn flour 0.384955 0.957 0.011 0.011 0.011 0.011
Milk 5.996954 0.499 0.001 0.001 0.01 0.49
Sugar 2.360817 0.002 0.99 0.002 0.002 0.002
Other consuming industries 10.87812 0.017 0.018 0.92 0.01 0.012
The above equation (3) is embedded into a CES production function that combines the above inputs with
the factors of production, as follows:
(4)
Where f[i] is the use of production factors; b2[i] its associated CES coefficient for sector [i]; b1[i] is the
CES coefficient for inputs, Sb[i] is the elasticity of substitution in sector [i], and B[i] is the scale
parameter. The elasticity of substitution used in the production function (between factors and inputs) for
every Sb[i] was 0.37.
In the same fashion as the agricultural producing industries, the Walrasian auctioneer maximizes a social
Samuelson-Bergson utility curve which is CES in construction and includes the 10 agro-industrial
products mentioned before. Elasticity of substitution used in the utility curve was 0.4. 88
The weights of
each product in the social utility curve are as follows:
87
No actual zeros could be used, because the resolution algorithm breaks. 88
These low elasticities of substitution, both in the Utility CES and the production CES, take the CES curves in both
ambits closer to the Leontief case. Using higher elasticities of substitution, or even Cobb-Douglas functional forms
or even linear (to represent perfect substitutes) makes the general equilibrium model very unstable and almost
impossible to solve.

73
Table A.8. Weights of Each Product in the Social Utility Curve
Product Weight in the Samuelson-Bergson
utility curve
Ethanol 0.00000025
Tortillas Nixtamal 0.24253
Chicken Meat 0.000001162
Pork meat 0.00402
Bovine meat 0.0000004
Wheat flour 0.00001
Corn flour 0.06703
Milk 0.01055
Sugar 0.18580
Other consuming industries 0.49028
Ideally, the estimation for agro-industries coefficients should have been done by using maximum entropy
and Monte-Carlo experiments. However, the richness of geographically-disperse data available for the
agricultural primary sectors was not available for the agro-industries. Therefore, estimation relied on
point data of the INEGI 2004 Industrial Census and annual price information from Secretaría de
Economía (SE), as well as technical coefficient information from SAGARPA. The recovery of parameters
was done merely by a trial-and-error calibration: seven basic constructions of the model were tried, of
which we made an average of 40 to 50 experiments in each. The 36th experiment in the seventh
construction of the model gave us a price and quantity vector that could be similar to the Mexican
equilibrium as seen in Table A.9 below.
Table A.9. Calibrated versus Actually Produced Prices and Quantities
Calibrated price in pesos (assuming ethanol price=985.1$/ton)
Calibrated price/Real price
(2004) Calibrated
production (tons) Real
production
Calibrated production/real
production
Ethanol 985.101 1 40136 40136 1
Cane sugar 4812.44496 0.95657169 5246212.54 4842089 1.08346058
Tortillas nixtamal 6398.47727 1.17310696 34879.0118 36636 0.95204203
Chicken meat 12402.1261 0.99090165 697213.875 668750 1.0425628
Pork meat 16933.9847 0.99282402 15463.047 14934 1.03542567
Bovine meat 18911.1809 0.95721941 57370.024 55654 1.03083379
Wheat flour 3267.03821 1.16551029 3662091.25 3576609 1.02390036
Corn flour 4325.06624 1.25119729 1562628.11 1887041 0.82808382
Milk 8108.5929 1.16008324 3827610.78 4233540 0.90411589

74
A.5. Understanding the Agroindustrial GDP in the GEM
The GEM model of IMCO does not consider the value of production for any specific grouping of GDP
but does it in relation to the inputs for which they compete. Therefore the agro industrial GDP considers
all the products used in the agro industry, thus a useful guide to understand the relevance of this number
in relation to GDP is the following table:
Table A.10. Value of Production for Estimating Agroindustrial GDP (2003)
Product Good
Value of production
compared to agricultural GDP
Value in the agricultural
GDP
Value for part of GDP that considers
agroindustrial products; Rama I “Alimentos Bebidas y Tabaco”
Value of production (pesos)
Ethanol89 Intermediate good 0.0136% 0.0000% 0.0000% 39,538,000
Sugar Intermediate good 0.0050% 0.0000% 0.0041% 14,427,205
Tortillas Final consumption 0.0994% 0.0000% 0.0819% 287,945,000
Chicken Final consumption 2.8892% 0.0000% 2.3803% 8,370,076,000
Pork Final consumption 0.0879% 0.0000% 0.0724% 254,720,000
Beef Final consumption 0.3795% 0.0000% 0.3127% 1,099,521,000
Wheat flour Final consumption 3.4606% 0.0000% 2.8511% 10,025,582,000
Corn flour Final consumption 2.2516% 0.0000% 1.8551% 6,523,014,000
Milk90 Final consumption 13.7188% 6.8594% 5.6513% 39,744,000,000
Total 22.9057% 6.8594% 13.2090% 66,358,823,205
89
The value of ethanol production is considered in another part of national GDP, ―Sustancias químicas, derivados
del petróleo, productos de caucho y plástico‖. 90
For lack of relevant data, this assumes that 50 percent of production value is added in the primary sector and 50
percent as part of gross agroindustrial value.

75
APPENDIX 2. CONSUMPTION MARKETS AND TRANSPORT COSTS
Tables A.11. Freight Costs to Main Hub (information from ASERCA) Flete corto ($/Ton)
State Municipality Hub Flete
Cost of
manuevering VAT Total
Zacatecas
Miguel Auza Miguel Auza $60.00 $60.00 $18.00 $138.00
Fresnillo Fresnillo $60.00 $60.00 $18.00 $138.00
Sombrerete Sombrerete $60.00 $60.00 $18.00 $138.00
Miguel Auza Calera $130.00 $60.00 $28.50 $218.50
Rio Grande Calera $120.00 $60.00 $27.00 $207.00
Durango
V. Guerrero V. Guerrero $50.00 $60.00 $16.50 $126.50
Gpe. Victoria Gpe. Victoria $60.00 $60.00 $18.00 $138.00
V. Guerrero Gpe. Victoria $100.00 $60.00 $24.00 $184.00
Gpe. Victoria Durango $120.00 $60.00 $27.00 $207.00
Chihuahua
Cd. Cuauhtémoc Cd. Cuauhtémoc $60.00 $60.00 $18.00 $138.00
Namiquipa Namiquipa $60.00 $60.00 $18.00 $138.00
Riva Palacio Riva Palacio $60.00 $60.00 $18.00 $138.00
Guerrero Cusihuiriachi $150.00 $60.00 $31.50 $241.50
Cd. Cuauhtémoc Cusihuiriachi $120.00 $60.00 $27.00 $207.00
Sinaloa
Ahome Los Mochis, Sin. $100.00 $200.00 $130.00 $430.00
Guasave Guasave, Sin. $80.00 $200.00 $110.00 $390.00
Guamuchil Guamuchil, Sin. $60.00 $200.00 $90.00 $350.00
Nayarit Santiago, Ixcuintla Santiago, Ixcuintla $60.00 $60.00 $18.00 $138.00
Tuxpan Tuxpan $60.00 $60.00 $18.00 $138.00
San Blas San Blas $60.00 $60.00 $18.00 $138.00
Compostela Compostela $60.00 $60.00 $18.00 $138.00
Spring 2006

76
Tables A.12. Freight Costs from Hub to Market pesos/ton (includes storage, financial and transport costs provided by ASERCA)
State Hub D.F. MTY GUAD State Hub D.F. GUAD
Zacatecas Nayarit
Calera Santiago, Ixcuintla
Transport $430.00 $250.00 $280.00 Transport $218.00 $120.00
Storage* $207.00 $207.00 $207.00 Storage $207.00 $207.00
Financial** $234.00 $234.00 $234.00 Financial $234.00 $234.00
VAT $95.55 $68.55 $73.05 VAT $63.75 $49.05
Total $966.55 $759.55 $794.05 Total $722.75 $610.05
Sombrerete Tuxpan
Transport $430.00 $300.00 $320.00 Transport $218.00 $120.00
Storage* $207.00 $207.00 $207.00 Storage $207.00 $207.00
Financial** $234.00 $234.00 $234.00 Financial $234.00 $234.00
VAT $95.55 $76.05 $79.05 VAT $63.75 $49.05
Total $966.55 $817.05 $840.05 Total $722.75 $610.05
State Hub D.F. MTY TORREÓN San Blas
Durango Transport $250.00 $140.00
Vicente Guerrero Storage $207.00 $207.00
Transport $430.00 $250.00 $150.00 Financial $234.00 $234.00
Storage $207.00 $207.00 $207.00 VAT $68.55 $52.05
Financial $234.00 $234.00 $234.00 Total $759.55 $633.05
VAT $95.55 $68.55 $53.55 Compostela
Total $966.55 $759.55 $644.55 Transport $218.00 $120.00
Guadalupe Victoria Storage $207.00 $207.00
Transport $430.00 $230.00 $140.00 Financial $234.00 $234.00
Storage $207.00 $207.00 $207.00 VAT $63.75 $49.05
Financial $234.00 $234.00 $234.00 Total $722.75 $610.05
VAT $95.55 $65.55 $52.05
Total $966.55 $736.55 $633.05 State Hub D.F. GUAD
SinaloaState Hub D.F. MTY TORREÓN CD. OBREGON TIJUANA Los Mochis, Sin.
Chihuahua Transport $575.00 $345.00
Cd. Cuauhtémoc Storage $207.00 $207.00
Transport $500.00 $350.00 $275.00 $400.00 $500.00 Financial $287.27 $287.27
Storage $207.00 $207.00 $207.00 $207.00 $207.00 VAT $160.39 $125.89
Financial $234.00 $234.00 $234.00 $234.00 $234.00 Total $1,229.66 $965.16
VAT $106.05 $83.55 $72.30 $91.05 $106.05 Guasave, Sin.
Total $1,047.05 $874.55 $788.30 $932.05 $1,047.05 Transport $517.50 $322.00
Cusihuiriachi Storage $207.00 $207.00
Transport $500.00 $350.00 $275.00 $400.00 $500.00 Financial $266.14 $194.33
Storage $207.00 $207.00 $207.00 $207.00 $207.00 VAT $148.60 $108.50
Financial $234.00 $234.00 $234.00 $234.00 $234.00 Total $1,139.24 $831.83
VAT $106.05 $83.55 $72.30 $91.05 $106.05
Total $1,047.05 $874.55 $788.30 $932.05 $1,047.05 Guamuchil, Sin.
Transport $517.50 $322.00
* Storage was estimated fro 6 month, including months fee and insurance Storage $207.00 $207.00
** Financial cost was estimated fro 6 months also at an interest rate of TIE (7.70) + 4 Points over a bean value of $4,000 pesos ton. Financial $266.14 $194.33
VAT $148.60 $108.50
Total $1,139.24 $831.83

77
APPENDIX 3. DETERMINING BEANS SUPPLY AT EACH MAIN CONSUMPTION CENTERS
The two assumptions made for estimating Table A.13 below were:
1. Almost all consumption (90 percent) in Northern Cities of the country are light colored beans.
2. Mexico City and Guadalajara consume a mix of pinto, light colored and black beans each having
the same market share.
Table A.13. Final Allocation of Beans to Main Consumption Centers (2007)
Production DF Gdlj Monterrey Torreon Tijuana Cd Obregon
Durango 32% 9%
Sinaloa 55% 14% 18% 3% 8% 2%
Zacatecas 35% 6% 2%
Nayarit 40% 20%
Chihuahua 52% 8% 4% 5% 1% Based on assumptions listed above.
What the table above shows is that 32 percent of all commercial beans from Durango go to Mexico City
while only 9 percent end in Monterrey. The rest of Durango’s beans are consumed in other markets.
These destinations were given by ASERCA to finance part of the cost of transporting beans from
production areas to consumption markets.
The quantities consumed at each consumption center were also estimated as no data existed for this.
These were calculated by multiplying the population in each of the urban conurbation of the 6 cities by
the per capita consumption of beans published by FAO.
Only for Mexico City, Guadalajara, and Monterrey an extra 40 percent, 30 percent, and 20 percent
respectively of consumption was added to the per capita consumption because these centers also distribute
beans to other regional markets and some as the urban area of Mexico City have processing plants.
Finally we assumed that the States supplying beans to the main consumption markets provided by
ASERCA only supplied:
70 percent of all beans supplied to Mexico City and Guadalajara, while the rest were supplied
from other States and international markets.
80 percent of Monterrey’s and Tijuana’s total bean consumption
90 percent of Torreon’s and Cd Obregon total bean consumption.

78
APPENDIX 4. COST CURVES FOR MAIN CONSUMPTION CENTERS
Figure A.3. Average Variable Cost Curve for Guadalajara 2007
0
1,000
2,000
3,000
4,000
5,000
6,000
7,000
8,000
9,000
10,000
11,000
12,000
0.0% 20.0% 40.0% 60.0% 80.0% 100.0%
Market share
0
1,000
2,000
3,000
4,000
5,000
6,000
7,000
8,000
9,000
10,000
11,000
12,000
0.0% 20.0% 40.0% 60.0% 80.0% 100.0%
Pesos / ton
Sinaloa Zaca
teca
s
Nayarit
Black Mex
US black Mex
Producer costs Total costs
US Pinto
Average price fall
8.6%
Pinto Mex
Figure A.4. Average Variable Cost Curve for Monterrey 2007
0
1,000
2,000
3,000
4,000
5,000
6,000
7,000
8,000
9,000
10,000
11,000
12,000
0.0% 20.0% 40.0% 60.0% 80.0% 100.0%
Market share
0
1,000
2,000
3,000
4,000
5,000
6,000
7,000
8,000
9,000
10,000
11,000
12,000
0.0% 20.0% 40.0% 60.0% 80.0% 100.0%
Pesos / ton
Sinaloa Chih
uahua
Zaca
teca
s
Dura
ngo
Black Mex
US black Mex
Producer costs Total costs
US PintoAverage price fall8.6%
Pinto Mex

79
Figure A.5. Average Variable Cost Curve for Torreon 2007
0
1,000
2,000
3,000
4,000
5,000
6,000
7,000
8,000
9,000
10,000
11,000
12,000
0.0% 20.0% 40.0% 60.0% 80.0% 100.0%
Market share
0
1,000
2,000
3,000
4,000
5,000
6,000
7,000
8,000
9,000
10,000
11,000
12,000
0.0% 20.0% 40.0% 60.0% 80.0% 100.0%
Pesos / ton
Sinaloa Chihuahua
US Pinto 2008
Producer costs Total costs
US PintoAverage price fall 8.6%
Pinto Mex
Figure A.6. Average Variable Cost Curve for Ciudad Obregon 2007
0
1,000
2,000
3,000
4,000
5,000
6,000
7,000
8,000
9,000
10,000
11,000
12,000
0.0% 20.0% 40.0% 60.0% 80.0% 100.0%
Market share
0
1,000
2,000
3,000
4,000
5,000
6,000
7,000
8,000
9,000
10,000
11,000
12,000
0.0% 20.0% 40.0% 60.0% 80.0% 100.0%
Pesos / ton
Sinaloa
Chih
uahua
US Pinto 2008
Producer costs Total costs
US PintoAverage price fall 8.6%
Pinto Mex
Figure A.7. Average Variable Cost Curve for Tijuana 2007
0
1,000
2,000
3,000
4,000
5,000
6,000
7,000
8,000
9,000
10,000
11,000
12,000
0.0% 20.0% 40.0% 60.0% 80.0% 100.0%
Market share
0
1,000
2,000
3,000
4,000
5,000
6,000
7,000
8,000
9,000
10,000
11,000
12,000
0.0% 20.0% 40.0% 60.0% 80.0% 100.0%
Pesos / ton
Sinaloa
Chih
uahua
Black Mex
US black Mex
US Pinto 2008
Producer costs Total costs
US Pinto
Average price fall 9.3%
Pinto Mex
US Black 2008
Source: IMCO with information of ASERCA and SAGARPA