united kingdom enigma-b rossiter
TRANSCRIPT

Not Protectively Marked
Not Protectively Marked
IAEA FUMEX-III Co-ordinated Research Programme: NNL Final Report
NNL (12) 12172 MFTC/P(2012)467
Issue 2
This document has been prepared by NNL under Framework Agreement 4610001436. The document and the information it contains is the property of NDA. It may be used by Site Licence Companies and their sub–contractors to support M&O work in the Authority Field of Use (as defined by the 2004 Energy Act) and may be copied and distributed as required in support of such work.
Copies of this document may be retained by SLC’s and NNL and used to support M&O work as above. Copies held by other parties will be returned, destroyed or deleted when they are no longer needed to support such work. No other use of the document or the information may be made, nor may the document be copied or transmitted for any other purpose, without the prior written permission of Sellafield Ltd.
Copyright Nuclear Decommissioning Authority 2012

Not Protectively Marked
Page 3 of 82
NNL (12) 12172MFTC/P(2012)467
Issue 2
Not Protectively Marked
EXECUTIVE SUMMARY
This is the UK National Nuclear Laboratory’s (NNL’s) final report for its contribution to the IAEA FUMEX-III Co-ordinated Research Programme (CRP) on the improvement of computer codes used for fuel behaviour simulation. It describes the analysis of the FUMEX-III cases, or rod irradiations, that have so far been modelled using NNL’s ENIGMA fuel performance code, and provides a description of ENIGMA. The work was performed for Sellafield Ltd under the remit of the Nuclear Decommissioning Authority (NDA).
Twenty FUMEX-III cases (or rod irradiations) have been modelled using ENIGMA. These include irradiations of both UO2 and MOX fuel rods in both commercial light water reactor (LWR) and experimental reactor conditions. More specifically, the cases modelled are eight of the high priority cases (the PRIMO MOX rod BD8, Risø-3 rods GE7 and II5, OSIRIS rod J12-5, IFA-535.5 rod 809, the US PWR 16x16 LTAs rods TSQ002 and TSQ022, and the AREVA idealised case) in the areas of interest to NNL and Sellafield Ltd — that is MOX, pellet-cladding mechanical interaction (PCMI), transients, and normal operation, all for LWRs only — and twelve additional MOX rods, i.e. M501 rod D10 and the eleven rods from the IFA-591 MOX irradiation.
No significant problems were encountered in modelling any of the cases (due to lack of data or computational difficulties, for example), other than a lack of fuel grain size data for IFA-535.5 rod 809. The predictions have been compared with the measured data and the results of this have been described on a case by case basis. The phenomenological results have then been considered.
Fuel temperatures, fission gas release, clad diametral deformation (at the pellet waist and pellet end), fuel densification and swelling, rod free volume changes, rod internal pressure, fuel stack elongation, and clad corrosion (uniform, outer surface oxidation) were all in general judged to be satisfactorily predicted, although:
(a) there is a known underprediction of fuel temperatures for rods irradiated in the Risø-3 programme;
(b) the FGR (and hence also rod internal pressure) at high burnup may be underpredicted if and when a significant rim width develops, since ENIGMA does not model any FGR due to rim formation or to venting of rim porosity — the possible inclusion in ENIGMA of a rim release model should be investigated in any future development;
(c) the FGR (and hence also rod internal pressure) in transient conditions may be underpredicted, since ENIGMA does not have an explicit transient release model — the possible inclusion in ENIGMA of a transient release model should be investigated in any future development;
(d) as expected, the creepdown for lined cladding appears to be slightly less well predicted than for unlined cladding;
(e) there is a tendency for overprediction of clad ridge heights, although this is not a general trend (given the successful validation of ENIGMA’s clad ridging model).
End-of-life clad elongation was also generally well predicted, but prediction of at-power clad elongation proved difficult, since accurate predictions depend crucially on accurately predicting the timing of (hard) fuel-clad contact at each axial elevation, which is in turn a demanding problem. Clad inner surface corrosion and clad outer surface nodular corrosion are not modelled by ENIGMA and so the measurements of these phenomena were not relevant to assessing ENIGMA’s predictions.

Not Protectively Marked
Page 4 of 82
NNL (12) 12172MFTC/P(2012)467
Issue 2
Not Protectively Marked
VERIFICATION STATEMENT
This document has been verified and is fit for purpose. An auditable record has been made of the verification process. The scope of the verification was to confirm that : -
• The document meets the requirements as defined in the task specification/scope statement
• The constraints are valid
• The assumptions are reasonable
• The document demonstrates that the project is using the latest company approved data
• The document is internally self consistent
HISTORY SHEET
Issue Number
Date
Comments
Draft 1 23/03/12 Draft for verification
Issue 1 29/03/12 Verified and approved version for issue to customer
Issue 2 02/04/12 References amended
Not Protectively Marked
Page 5 of 82
NNL (12) 12172MFTC/P(2012)467
Issue 2
Not Protectively Marked
CONTENTS
Page
1. INTRODUCTION.............................................................................................9
2. DESCRIPTION OF ENIGMA FUEL PERFORMANCE CODE ................................10
2.1. Development History............................................................................... 11
2.2. System Modelled .................................................................................... 11
2.3. Key Assumptions .................................................................................... 12
2.4. Solution Scheme..................................................................................... 12
2.5. Fuel Models............................................................................................ 13
2.5.1. Thermal conductivity degradation ..................................................... 13
2.5.2. Formation of high burnup structure at pellet rim................................. 14
2.6. Clad Models ........................................................................................... 14
2.7. Gas Models ............................................................................................ 14
2.7.1. Integrated fission gas release and gas bubble swelling model ............... 15
2.8. Coolant Models....................................................................................... 16
3. SELECTED CASES AND THEIR ANALYSIS ......................................................17
3.1. Case 1: PRIMO Rod BD8 .......................................................................... 19
3.2. Case 2: Risø-3 Rod GE7........................................................................... 21
3.3. Case 3: IFA-535.5 Rod 809...................................................................... 29
3.4. Case 4: Risø-3 Rod II5 ............................................................................ 34
3.5. Cases 5 and 6: US PWR 16x16 LTAs Rods TSQ002 and TSQ022 ................... 40
3.6. Cases 7 to 17: IFA-591 Rods 1 to 11......................................................... 45
3.7. Case 18: OSIRIS Rod J12-5 ..................................................................... 54
3.8. Case 19: M501 Rod D10 .......................................................................... 58
3.9. Case 20: AREVA Idealised Case ................................................................ 64
4. REVIEW OF PHENOMENOLOGICAL RESULTS ................................................67
4.1. Fuel temperature .................................................................................... 67
4.2. Fission gas release.................................................................................. 67
4.3. Clad diametral deformation...................................................................... 71
4.4. Fuel densification and swelling.................................................................. 73
4.5. Rod free volume and rod internal pressure................................................. 74

Not Protectively Marked
Page 6 of 82
NNL (12) 12172MFTC/P(2012)467
Issue 2
Not Protectively Marked
4.6. Clad elongation ...................................................................................... 75
4.7. Fuel stack elongation .............................................................................. 75
4.8. Clad oxidation ........................................................................................ 75
5. CONCLUSIONS .............................................................................................77
6. ACKNOWLEDGEMENTS.................................................................................78
7. REFERENCES................................................................................................79

Not Protectively Marked
Page 7 of 82
NNL (12) 12172MFTC/P(2012)467
Issue 2
Not Protectively Marked
LIST OF TABLES
Page
Table 1: Summary of FUMEX-III cases modelled by NNL .................................18 Table 2: Results of Risø-3 rod GE7 sensitivity runs..........................................27 Table 3: Measured and predicted rod average clad diameter changes (in
microns) after base irradiation of IFA-591 rods...............................48 Table 4: Measurements and predictions of burnup, fission gas release, rod
internal pressure and rod free volume after ramping of IFA-591 rods........................................................................................................53
Table 5: Measured and predicted FGR values for FUMEX-III cases ..................68 Table 6: Summary of rod diameter measurements and predictions at pellet
waist elevations...............................................................................72 Table 7: Summary of rod free volume measurements and predictions for full
length rods ......................................................................................74
LIST OF FIGURES
Page
Figure 1: Example of ENIGMA's screen graphics output ..................................10 Figure 2: Fuel centreline temperature and fission gas release versus burnup for
the PRIMO rod BD8 base irradiation ................................................20 Figure 3: Fuel centreline temperature and fission gas release versus time for the
PRIMO rod BD8 power ramping .......................................................21 Figure 4: Fuel centreline temperature and fission gas release versus burnup for
the Risø-3 rod GE7 base irradiation .................................................23 Figure 5: Fuel centreline temperature and fission gas release versus time for the
Risø-3 rod GE7 power ramping ........................................................23 Figure 6: Measured and predicted unreleased xenon concentration versus radius
for Risø-3 rod GE7 ...........................................................................24 Figure 7: Measurements and predictions of pre- and post-ramp rod diameters
for Risø-3 rod GE7 ...........................................................................25 Figure 8: Measurements and predictions of pre- and post-ramp rod diameters
for Risø-3 rod GE7 when increased fuel thermal conductivity degradation is modelled ..................................................................29
Figure 9: Fuel centreline temperature and fission gas release versus burnup for the IFA-535.5 rod 809 base irradiation............................................30
Figure 10: Fuel centreline temperature and fission gas release versus time for the IFA-535.5 rod 809 power ramping.............................................31
Figure 11: Rod internal pressure versus time for the IFA-535.5 rod 809 power ramping ...........................................................................................32
Figure 12: Clad elongation versus time for the IFA-535.5 rod 809 power ramping ...........................................................................................33
Figure 13: Fuel centreline temperature and fission gas release versus burnup during base irradiation of Risø-3 rod II5 .........................................35

Not Protectively Marked
Page 8 of 82
NNL (12) 12172MFTC/P(2012)467
Issue 2
Not Protectively Marked
Figure 14: Thermocouple temperature and fission gas release versus time during power ramping of Risø-3 rod II5 ..........................................36
Figure 15: Measured and predicted intragranular xenon concentration versus radius for Risø-3 rod II5 ..................................................................37
Figure 16: Measured and predicted unreleased xenon concentration versus radius for Risø-3 rod II5 ..................................................................38
Figure 17: Measurements and predictions of pre- and post-ramp rod diameters for Risø-3 rod II5.............................................................................39
Figure 18: Measured and predicted oxide thicknesses for USPWR rod TSQ00242 Figure 19: Measured and predicted rod diameters for USPWR rod TSQ002 .....43 Figure 20: Fuel centreline temperature and fission gas release versus burnup
for USPWR rod TSQ002....................................................................44 Figure 21: Fuel centreline temperature and fission gas release versus burnup
for USPWR rod TSQ022....................................................................44 Figure 22: Predicted fuel centreline temperature and fission gas release versus
time during IFA-591 rod 5 staircase power ramp ............................49 Figure 23: Predicted fuel centreline temperature and fission gas release versus
time during IFA-591 rod 7 single step power ramp .........................50 Figure 24: Measured and predicted rod internal pressure versus time during
IFA-591 rod 5 staircase power ramp ...............................................51 Figure 25: Measured and predicted clad elongation versus time during IFA-591
rod 1 staircase power ramp .............................................................52 Figure 26: Fuel centreline temperature and fission gas release versus burnup
for the OSIRIS rod J12-5 base irradiation........................................55 Figure 27: Fuel centreline temperature and fission gas release versus time for
the OSIRIS rod J12-5 power ramping ..............................................56 Figure 28: Measurements and predictions of pre- and post-ramp rod diameters
for OSIRIS rod J12-5 .......................................................................57 Figure 29: Measured and predicted clad oxide thicknesses for M501 rod D10 .59 Figure 30: Measured and predicted rod diameters for M501 rod D10 ..............60 Figure 31: Fuel centreline temperature and fission gas release versus burnup
for M501 rod D10.............................................................................61 Figure 32: Xenon concentration versus radius for M501 rod D10 ....................62 Figure 33: Plutonium concentration versus radius for M501 rod D10 ..............63 Figure 34: Fuel centreline temperature and fission gas release versus burnup
for the AREVA idealised case ...........................................................65 Figure 35: P/M FGR versus burnup for FUMEX-III cases modelled and for all
rods in the ENIGMA validation database with measured FGR data...69 Figure 36: P/M FGR versus peak local rating for transient cases.....................70 Figure 37: P/M FGR versus peak local rating for transient cases where predicted
FGR during base irradiation < 25% of the total measured FGR........71

Not Protectively Marked
Page 9 of 82
NNL (12) 12172MFTC/P(2012)467
Issue 2
Not Protectively Marked
1. Introduction
This is the UK National Nuclear Laboratory’s (NNL’s) final report for its contribution to the IAEA FUMEX-III Co-ordinated Research Programme (CRP) on the improvement of computer codes used for fuel behaviour simulation. The work was performed for Sellafield Ltd under the remit of the Nuclear Decommissioning Authority (NDA).
NNL’s ENIGMA fuel performance code has been used to model twenty FUMEX-III cases — that is twenty fuel rod irradiations. These include irradiations of both UO2 and MOX fuel rods in both commercial light water reactor (LWR) and experimental reactor conditions.
A description of the ENIGMA code is given in Section 2. The selected cases and their analysis are described in Section 3. The phenomenological results, i.e. the combined results for fuel temperatures, fission gas release, etc, are considered in Section 4. Conclusions are provided in Section 5.

Not Protectively Marked
Page 10 of 82
NNL (12) 12172MFTC/P(2012)467
Issue 2
Not Protectively Marked
2. Description of ENIGMA Fuel Performance Code
ENIGMA [1-6] is the primary UK computer code for thermal reactor fuel performance analysis. It calculates the thermo-mechanical behaviour of a light water reactor (LWR) or advanced gas-cooled reactor (AGR) fuel rod in both steady-state and transient conditions. Further discussion below pertains to NNL’s version of the code for LWR applications (henceforward simply referred to as ENIGMA).
UO2, mixed oxide (MOX), (U,Gd)O2 and yttria-stabilised zirconia inert matrix fuel types, and Zircaloy-2, Zircaloy-4 and modern zirconium-based alloy clad types can all be modelled. Stainless steel cladding has also historically been simulated. ENIGMA is available under licence from NNL, or through Studsvik Scandpower, where it can be sub-licensed in conjunction with their Core Management System (CMS) code suite, which includes the CASMO [7] and SIMULATE [8] neutronics software.
ENIGMA is written in FORTRAN. The development version runs on a Windows PC platform, while end-user versions run on various Windows, Unix and Linux platforms. The development version includes a screen graphics capability whereby key calculated quantities (together with corresponding measured data where available) are plotted on the screen as the simulation proceeds, with results retained at the end of the run as Portable Network Graphics (PNG) files. An example of the screen graphics output is reproduced as Figure 1.
Figure 1: Example of ENIGMA's screen graphics output

Not Protectively Marked
Page 11 of 82
NNL (12) 12172MFTC/P(2012)467
Issue 2
Not Protectively Marked
ENIGMA is validated against a large database of LWR fuel rod irradiations in both commercial and test reactors. In total, over 500 rod irradiations with burnups up to 90 MWd/kgHM are included in the validation database. The validation system is highly automated, facilitating re-validation after any source code changes.
ENIGMA has been used for several design and licensing assessments for both UO2 and MOX fuel, including licensing UO2 and gadolinia-doped UO2 in the UK Sizewell B PWR and the Finnish Loviisa VVER-440 reactor, and mixed oxide (MOX) fuel in the Swiss Beznau-1 PWR. ENIGMA is also used for analysis of experimental and commercial irradiations [9-15], for assessment of fuel behaviour during interim storage [16], to perform feasibility studies for future irradiation scenarios [17], to support fuel manufacturing [11,14,15], and to investigate fuel failures or other fuel performance related problems [18].
2.1. Development History
The development of the ENIGMA code dates back to 1986, when work began at British Nuclear Fuels plc (BNFL) on the construction of a new modular code framework to act as a test bed for the development of sub-models. Around the same time, work was underway at the UK Central Electricity Generating Board (CEGB) on the creation of new models for a number of important properties and processes. The two strands came together in early 1988 when, with funding from the Sizewell B Project, a major programme of work was initiated to develop, document, verify and validate the code to a standard suitable for use in support of the Sizewell B PWR pre-operational safety report.
From this beginning, development of the code by both NNL (formerly the R&D division of BNFL) and EDF Energy (formerly CEGB) has continued, initially in collaboration, but since 1991 in parallel (BNFL ownership of ENIGMA transferred to NNL in 2005). While EDF Energy has developed the code for both LWR and AGR use, NNL’s developments have concentrated on LWR issues.
The most recent development version of ENIGMA is 7.8/A92 and it is this version that has been used to perform the FUMEX-III calculations*. It should be noted that this development version contains several models, including the fission gas release (FGR) model, which have not been validated for use in licensing and which are significantly different to those used in previous code versions.
2.2. System Modelled
The active stack length region of the fuel rod is represented by a series of axial zones. In each axial zone the fuel is divided into radial annuli of equal thickness. This is the so-called 1½-D representation. The free volumes associated with the fuel-clad gap, pellet dishes and chamfers, pellet cracks, the pellet bore, and upper and lower plena are also modelled.
An isolated thermal-hydraulic subchannel can be simulated to calculate rod surface temperature boundary conditions where appropriate.
* With the exception of the analysis of the IFA-591 rods (see Section 3.6) which was performed with version
7.8/A86. The analysis was not updated with version 7.8/A92 due to time pressures and since examination of the code changes from 7.8/A86 to 7.8/A92 revealed that none of the modifications would have an effect on the predictions for the IFA-591 rods.

Not Protectively Marked
Page 12 of 82
NNL (12) 12172MFTC/P(2012)467
Issue 2
Not Protectively Marked
Out-of-pile conditions, rod re-fabrication, irradiation in two or more different reactors and the presence of fuel thermocouples can all be simulated.
2.3. Key Assumptions
Only radial, i.e. no axial or circumferential, heat flow is assumed and the fuel annuli are all considered to be subject to the same axial strain (the so-called plane strain assumption). The latter, in conjunction with an assumption of axi-symmetry, allows shear stresses to be ignored, such that only the normal stresses along the principal radial, circumferential and axial directions are non-zero. However: (a) the effects of shear stresses are approximated using models for axial extrusion and for pellet wheatsheafing which feed back calculated strain increments into the main solution scheme [5]; (b) the azimuthal cladding stress concentration over radial fuel cracks is calculated using a parasitic model [2]. Thus, the key phenomena which cannot be modelled with the 1-D plane axial strain assumption employed in the code’s main solution scheme are instead modelled by other means.
Coupling between the axial zones is restricted to the coolant enthalpy, rod internal pressure and gas transport. Gas mixing in the free volume is assumed to be instantaneous.
Pellet cracking is approximately modelled by a directionally dependent fuel elastic modulus. The fuel radial elastic strains are calculated assuming the true elastic modulus. The fuel axial and circumferential elastic strains are calculated assuming the true elastic modulus if the corresponding stresses are compressive, but assuming a reduced elastic modulus if the stresses are tensile.
The cladding is treated as a membrane (or thin shell), i.e. thin wall equations are implemented.
2.4. Solution Scheme
The power history of each axial zone (heat generated, in kW/m, versus time) and thermal-hydraulic conditions at the bottom of the fuel stack are boundary conditions and are provided as input. Starting from the as-manufactured condition, ENIGMA then calculates the thermo-mechanical state of the fuel rod at the end of each timestep. A finite difference solution scheme is employed. The iteration strategy involves an inner loop to determine the temperature, stress and strain distributions for each axial zone using an iterative marching procedure, and an outer loop to feed in damped estimates of non-linear strain components (e.g. creep) and gas release. Both steady-state and transient heat transfer can be modelled.
If convergence fails during any particular timestep, the timestep length is halved and the step is automatically repeated. A stable solution is obtained, irrespective of timestep length, by calculating the stress and temperature distributions which, acting unchanged throughout the timestep, are compatible both with the imposed strains and with the fuel and clad stress-strain relationships.
The main calculations are performed at the pellet waist (or mid-pellet) elevation. The stresses and strains at the pellet end are then calculated parasitically.

Not Protectively Marked
Page 13 of 82
NNL (12) 12172MFTC/P(2012)467
Issue 2
Not Protectively Marked
2.5. Fuel Models
The models implemented for the fuel pellets include:
• thermal expansion
• elasticity
• heat capacity and enthalpy
• radial power profile evolution [19]
• thermal conductivity and its degradation with burnup
• formation of high burnup structure at pellet rim
• creep (both irradiation induced and thermal)
• densification (fuel temperature and grain size dependence)
• fuel matrix fission product swelling (including effects of solid, volatile and gaseous fission products — swelling is reduced when volatile and gaseous fission products accumulate in bubbles or are released from the fuel)
• axial extrusion and dish filling
• pellet wheatsheafing
• equi-axed grain growth (without grain boundary sweeping)
Important models at high burnup include those for thermal conductivity degradation with burnup and for formation of high burnup structure at the pellet rim. Hence, these are described in more detail in Sections 2.5.1 and 2.5.2, respectively.
2.5.1. Thermal conductivity degradation
For UO2 fuel, the basic fuel thermal conductivity, k, formulation in ENIGMA is of the form
( )B1aa;termelectronicbTa
1k 0 α+=++
=
where T is the absolute temperature, B is local burnup, a is the phonon scattering term caused by the scattering from lattice defects and impurities, b is a constant which describes the phonon-phonon scattering (which is a characteristic of the host material), α is the rate of thermal conductivity degradation with burnup, and a0 is a constant. Correction terms are then applied to account for the presence of as-fabricated and gas bubble porosity, for deviations from stoichiometry, for the loss of fission gas from the fuel matrix, and for the lack of irradiation damage annealing at low temperatures.
Values for a0 and b are derived from out-of-pile conductivity measurements on unirradiated fuel: a0 = 37.5 and b = 0.2165 when k is in units of kW/m/K. Burnup increases the impurity content — due to the formation of fission products — and hence leads to an increase in the value of the phonon scattering term, a. A number of experiments have been conducted in the Halden and Risø test reactors to assess the rate of thermal conductivity degradation with burnup. Data at over 80 MWd/kgHM have been collected and these have been used to determine a value of 0.08 per MWd/kgUO2. The same thermal conductivity degradation rate is applied for MOX and (U,Gd)O2 fuel.
Further details of ENIGMA's fuel thermal conductivity modelling can be found in Gates et al [5].

Not Protectively Marked
Page 14 of 82
NNL (12) 12172MFTC/P(2012)467
Issue 2
Not Protectively Marked
2.5.2. Formation of high burnup structure at pellet rim
The high burnup rim model is a simplistic empirical model. Only the thermal and dimensional effects of rim porosity formation are modelled — no fission gas release from the rim porosity is assumed. A rim region with a prescribed width and uniformly distributed rim porosity is simulated. There is no attempt to model a transition zone with a microstructure intermediate to that of standard and rim-like material.
Both the rim width and porosity volume fraction are calculated using empirical correlations fitted to commercial PWR data — the rim width is a function of pellet average burnup and the porosity volume fraction is a function of local burnup. No fuel stress, grain size or fuel temperature dependencies are included. Rim formation begins at a pellet average burnup of 40 MWd/kgHM.
The rim porosity is added to other porosity components (as-manufactured, intra-granular bubble and inter-granular bubble) to determine fuel swelling. The fuel thermal conductivity is reduced to take account of the presence of the rim porosity.
2.6. Clad Models
The models implemented for the cladding include:
• thermal expansion
• elasticity
• creep and instantaneous plasticity
• axial growth
• waterside corrosion and hydrogen pickup [20]
• clad ridging (including stress concentration over radial fuel cracks) [2]
• stress-corrosion crack growth
• fatigue damage and ratchetting
Pellet-cladding interaction (PCI) is simulated assuming no sliding (no relative movement between pellets and cladding) in the axial direction, while a stick/slip situation is modelled azimuthally [2].
It should be noted that, due to lack of Zircaloy-2 specific validation data, Zircaloy-2 is only modelled approximately — it is assumed to behave identically to standard Zircaloy-4. For all phenomena other than clad corrosion this is judged to be a reasonable assumption. In the case of clad corrosion, the predictions of Zircaloy-2 oxide thicknesses in BWR conditions are subject to a large uncertainty, since corrosion of Zircaloy-2 in BWR conditions is qualitatively different to corrosion of Zircaloy-4 in PWR conditions (in particular, nodular corrosion may occur).
2.7. Gas Models
The models implemented for the various gases in the fuel rod include:
• fission gas generation (including the isotopics) [19]
• (stable) fission gas release and gas bubble swelling [15]

Not Protectively Marked
Page 15 of 82
NNL (12) 12172MFTC/P(2012)467
Issue 2
Not Protectively Marked
• 131I generation and release
• helium generation and release
• helium adsorption and re-release
• release of chemically absorbed nitrogen
• instantaneous axial gas mixing
• fuel-clad gap conductance
o conduction, radiation and empirical components (empirical component takes account of pellet fragment relocation, pellet-clad eccentricity, cladding ovality and pellet wheatsheafing effects)
Calculation of fission gas release and gas bubble swelling is performed by an integrated model which is described in more detail in Section 2.7.1. An initial fuel nitrogen content of zero is modelled in all FUMEX-III calculations, so the model for the release of absorbed nitrogen has no effect on the predictions.
2.7.1. Integrated fission gas release and gas bubble swelling model
The integrated fission gas release and gas bubble swelling model is a highly mechanistic model. Both intra-granular and inter-granular bubbles are explicitly modelled. The bubble modelling has been validated against scanning electron microscopy (SEM) and transmission electron microscopy (TEM) images of irradiated fuel.
The following phenomena are simulated in both steady-state and transient conditions (no additional burst release is modelled during a transient):
• intra-granular diffusion of single fission gas atoms in solution in the fuel matrix
o to intra-granular bubbles
o to inter-granular bubbles on the grain faces
o directly to free surfaces (where release is instantaneous)
• irradiation induced re-solution of gas atoms in bubbles (no thermal re-solution)
• coalescence and morphological relaxation of grain face bubbles
• instantaneous venting to the rod free volume of inter-granular bubbles intersecting a grain edge
Intra-granular diffusion of vacancies to intra-granular bubbles and grain boundary diffusion of vacancies to inter-granular bubbles are also modelled. Morphological relaxation (by surface diffusion) and coalescence of inter-granular bubbles must both be considered in order to evaluate the evolution of the bubble morphology. It should be noted that: (a) no explicit burnup dependency of any of these phenomena are assumed; (b) the only mechanisms for release are diffusion of fission gas to free surfaces and venting of grain face bubbles which intersect a grain edge.
The intra-granular diffusion calculations employ a modified three-term Turnbull diffusion coefficient [21,22] (with no burnup dependent terms). Diffusion to intra-granular bubbles is first calculated (see later). Diffusion to inter-granular bubbles on the grain faces is then evaluated.
The calculation of diffusion to inter-granular bubbles employs the Speight formulation [23] of the Booth solution for a spherical grain [24], where an effective diffusion coefficient equal to the true diffusion coefficient multiplied by the fraction of intra-granular fission gas which is in solution is used, and where there is a non-zero gas

Not Protectively Marked
Page 16 of 82
NNL (12) 12172MFTC/P(2012)467
Issue 2
Not Protectively Marked
concentration at the grain boundary due to irradiation induced re-solution of gas in inter-granular bubbles. The fraction of intra-granular fission gas which is in solution is calculated explicitly from the intra-granular bubble modelling, rather than by a trapping probability.
The calculation of diffusion to free surfaces employs the Booth solution for diffusion in a sphere. The sphere radius is such that the surface area to volume ratio (S/V) of the sphere is equal to that of the entire fuel pellet. The fuel pellet S/V is determined empirically such that predicted FGR values for rods irradiated under pre-interlinkage conditions are in good agreement with the measured FGR values. Thus, although gas release due to recoil and knockout of fission gas atoms are not modelled explicitly, their contributions to gas release are, to some extent, implicitly included in the modelling of diffusion to free surfaces.
Intra-granular bubbles are assumed to be continuously nucleated in the wake of energetic fission fragments. The number of bubbles nucleated per fission fragment is considerably smaller than values commonly used, e.g. 24 [25], since only a small sub-population of the as-nucleated bubbles are observed to undergo growth [26]. This growth is assumed to be due to diffusion of both gas atoms and vacancies. Growth competes with irradiation induced re-solution, where size reduction or destruction of bubbles occurs due to ‘chipping away’ by energetic fission fragments. The number of intra-granular bubbles that each fission fragment interacts with is the same as in the commonly used Turnbull model [27]. However, instead of modelling total destruction of each intra-granular bubble that is interacted with, size reduction instead occurs if the bubble volume is greater than or equal to twice a temperature dependent empirical chip volume.
One-off nucleation of inter-granular bubbles is assumed to occur when intra-granular bubbles intersect grain boundaries. Growth of the inter-granular bubbles due to bulk diffusion of fission gas atoms to grain boundaries and grain boundary diffusion of vacancies is modelled. As in the case of intra-granular bubbles, growth competes with irradiation induced re-solution, where size reduction or destruction of bubbles occurs due to ‘chipping away’ by energetic fission fragments. However, in this case a constant, temperature independent, chip volume is assumed. It should be noted that the inter-granular bubble re-solution modelling is incompatible with the Speight model [23]. In the Speight model the flux of gas atoms leaving the grain boundary due to re-solution is directly proportional to the number of gas atoms per unit area of grain boundary (where the constant of proportionality is the re-solution probability). In contrast, in the chip model described above this is not the case.
2.8. Coolant Models
The models implemented for the isolated thermal-hydraulic subchannel around the fuel rod include:
• axial distribution of bulk coolant enthalpy
• bulk coolant temperature as a function of enthalpy
• film (rod surface to bulk coolant) temperature drop in both forced convection and nucleate or bulk boiling conditions
• crud formation and associated temperature drop

Not Protectively Marked
Page 17 of 82
NNL (12) 12172MFTC/P(2012)467
Issue 2
Not Protectively Marked
3. Selected Cases and Their Analysis
FUMEX-III cases are divided into four broad categories: (1) CANDU; (2) LWR; (3) VVER; (4) materials [28,29]. These broad categories are further divided into the following sub-categories: (a) MOX; (b) pellet-cladding mechanical interaction (PCMI); (c) pellet-cladding interaction (PCI), i.e. stress-corrosion cracking; (d) loss of coolant accident (LOCA); (e) reactivity initiated accident (RIA); (f) load follow transients; (g) transients; (h) doped fuels; (i) normal operation. FUMEX-II cases are also included in FUMEX-III for the benefit of those participants who were not involved in FUMEX-II. However, since NNL participated in FUMEX-II (as Nexia Solutions), the FUMEX-II cases are not considered further here. High priority cases in each of the areas (i.e. category/ sub-category combinations) were identified at the first and second research co-ordination meetings (RCMs).
Participants were asked at the 1st RCM to stipulate their areas of interest. In the case of NNL, these were 2a, 2b, 2g and 2i, i.e. MOX, PCMI, transients, and normal operation, all for LWRs only [28,29]. These areas of interest include the following ten high priority cases: two IFA-629.1 MOX rods, the PRIMO MOX rod BD8, Risø-3 rod GE7, OSIRIS rod J12-5†, IFA-535.5 rod 809, Risø-3 rod II5, the US PWR 16x16 LTAs rods TSQ002 and TSQ022, and the AREVA idealised case. The two IFA-629.1 MOX rods have previously been modelled by NNL outside of FUMEX-III, and so these were excluded from NNL’s FUMEX-III contribution. The remaining eight high priority cases have been modelled. Due to Sellafield Ltd’s interest in MOX fuel behaviour, twelve additional MOX rods have been analysed — that is M501 rod D10 and the eleven rods from the IFA-591 MOX irradiation. Thus, in total, twenty cases have been simulated. The twenty cases are summarised in Table 1.
The selected cases and their analysis are described in Sections 3.1 to 3.9. However, some general comments on the modelling of the cases are given below. Unless otherwise noted, all case parameters (including input parameters for ENIGMA, and measured data) are taken from the datafiles provided in the International Fuel Performance Experiments (IFPE) datasets listed in Table 1.
The nature of the as-manufactured grain sizes given in the FUMEX-III datasets for the real cases was often unclear. Since grain size is usually measured using a mean linear intercept (MLI) technique, it was assumed that all grain sizes provided for these cases are MLI values. This is an important assumption, since the FGR predictions are strongly dependent upon the as-manufactured grain size used. ENIGMA converts an MLI grain size into a spherical grain radius for use in the fission gas release and gas bubble swelling calculations by multiplying by 0.75.
In all cases, 15 fuel annuli were modelled. This is consistent with the approach taken in ENIGMA validation cases, where it is judged to give a suitably accurate discretisation of the fuel pellets.
In cases where a segment of a base irradiated parent rod is re-fabricated and re-irradiated, ENIGMA can model the change in the free volume gas composition and pressure and in the plenum free volume, but cannot model the change in fuel stack length. Thus, in these cases only the fuel stack length corresponding to the segment is modelled in both the base irradiation and re-irradiation. This simplification must be taken into account when comparing measurements and predictions. The plenum free volume
† OSIRIS rod H09 was an LWR PCMI high priority case at the time of the 1st RCM [28]. However, this rod was
not ramped, and so is not of interest with respect to PCMI. It was therefore decided at the 2nd RCM that this rod had been misidentified as an LWR PCMI case [30,31]. As a result, its high priority status was removed and instead OSIRIS rod J-12 was made a high priority case.

Not Protectively Marked
Page 18 of 82
NNL (12) 12172MFTC/P(2012)467
Issue 2
Not Protectively Marked
prior to the base irradiation is generally set to a value that gives the same rod free volume to fuel volume ratio as in the parent rod. This allows the effects of fission gas release on fuel temperatures and rod internal pressure to be simulated as accurately as possible.
Table 1: Summary of FUMEX-III cases modelled by NNL
Case number
Case name Category Sub-category IFPE dataset
1 PRIMO rod BD8 LWR MOX NEA-1776/01
2 Risø-3 rod GE7 LWR PCMI NEA-1493/17
3 IFA-535.5 rod 809 LWR Transients NEA-1548/02
4 Risø-3 rod II5 LWR Transients NEA-1493/17
5 USPWR rod TSQ002 LWR Normal operation NEA-1738/01
6 USPWR rod TSQ022 LWR Normal operation NEA-1738/01
7 IFA-591 rod 1 LWR MOX NEA-1773/01
8 IFA-591 rod 2 LWR MOX NEA-1773/01
9 IFA-591 rod 3 LWR MOX NEA-1773/01
10 IFA-591 rod 4 LWR MOX NEA-1773/01
11 IFA-591 rod 5 LWR MOX NEA-1773/01
12 IFA-591 rod 6 LWR MOX NEA-1773/01
13 IFA-591 rod 7 LWR MOX NEA-1773/01
14 IFA-591 rod 8 LWR MOX NEA-1773/01
15 IFA-591 rod 9 LWR MOX NEA-1773/01
16 IFA-591 rod 10 LWR MOX NEA-1773/01
17 IFA-591 rod 11 LWR MOX NEA-1773/01
18 OSIRIS rod J12-5 LWR PCMI NEA-1622/04
19 M501 rod D10 LWR MOX NEA-1863/01
20 AREVA idealised case LWR Normal operation N/A#
# Data for this case were transmitted in two IAEA emails [32,33]
ENIGMA cannot model the insertion of a fuel thermocouple part-way through a power history. Thus, in cases where a fuel thermocouple was inserted during re-fabrication, e.g. Risø-3 rod II5, the presence of the thermocouple is modelled during both the base irradiation and re-irradiation. The linear ratings input for the axial region containing the thermocouple hole are then adjusted during the base irradiation such that the mass ratings and burnups are consistent with those in the parent rod. This simplification must be taken into account when comparing measurements and predictions.
Where appropriate, timesteps of negligible duration were added to the supplied power histories to simulate PIE conditions at the end of any base irradiation and re-irradiation periods. This allows quantities measured during PIE to be directly compared to ENIGMA predictions. PIE conditions correspond to zero power, zero neutron flux, a coolant pressure equal to atmospheric pressure and a rod surface temperature equal to the

Not Protectively Marked
Page 19 of 82
NNL (12) 12172MFTC/P(2012)467
Issue 2
Not Protectively Marked
temperature at which the PIE data are provided (which is assumed to be 20°C if not given).
3.1. Case 1: PRIMO Rod BD8
Overview of case
PRIMO rod BD8 contained MIMAS MOX fuel in Zircaloy-4 cladding. It was irradiated as part of the PWR Reference Irradiation of MOX Fuels (PRIMO) research programme. The fuel was manufactured by Belgonucleaire in the Dessel plant. The rod was base irradiated for two cycles in the BR3 reactor from July 1984 until June 1987. It was then subjected to a power ramp in the ISABELLE 1 loop of the OSIRIS reactor (without any re-fabrication). The rod was un-instrumented during both the base irradiation and the re-irradiation. Non-destructive PIE was performed after both base irradiation and re-irradiation. Destructive PIE was also performed after the re-irradiation.
Measured data
Measured data were provided from two sources: (a) the post-base irradiation PIE; (b) the post-re-irradiation PIE.
With respect to (a), the data consist of clad diameter change, rod and fuel stack length change (from neutron radiography), and fuel burnup.
With respect to (b), the data consist of clad ridge height, volumes of helium, krypton and xenon, FGR (calculated from volume of fission gas measured during puncturing and an estimate for the amount of fission gas generated) and fuel grain size.
All data were taken from the IFPE dataset NEA-1776/01 report [34].
Modelling considerations
Twelve axial zones (with zone lengths as documented) were modelled for consistency with the provided power histories.
Results
The predicted rod average and peak pellet burnups at the end of the base irradiation are 31.2 and 39.5 MWd/kgHM, respectively. These are in good agreement with the measured values of 30.1 and 39.7 MWd/kgHM.
The predicted clad diameter change at the peak flux level (axial zone 6) at the time of the post-base irradiation PIE is -49 µm (based on a post-base irradiation diameter outside of the clad oxide layer). This corresponds to a measured value of -0.32%, or -30 µm (assuming that the measured clad diameters were not adjusted to remove the contribution from the oxide thickness). Thus, the clad creepdown is somewhat overpredicted. However, this is perhaps not surprising given that data for Mannesman Röhrenwerke cladding, as used for the PRIMO rod BD8, are not included in the validation database for the ENIGMA clad creep model.
The predicted rod length change and fuel stack length change at the time of the post-base irradiation PIE are +3.2 and +1.2 mm, respectively. These compare to measured values of +0.21% and -0.13%, or +2.1 and -1.3 mm. Thus, the rod length change is reasonably well predicted, while there is a predicted increase in fuel stack length, but a

Not Protectively Marked
Page 20 of 82
NNL (12) 12172MFTC/P(2012)467
Issue 2
Not Protectively Marked
measured decrease. This reflects the relatively large densification, and hence also the relatively large uncertainty on the corresponding fuel stack length reduction, for the small grain size (5 µm) fuel, and the generic nature of the ENIGMA fuel densification model (fuel grain size, fuel temperature and burnup dependence only).
The predicted clad diametral ridge height at the peak power elevation (axial zone 6) is 10 µm, in good agreement with the measured value of 10 to 17 µm, despite the overprediction of clad creepdown during the base irradiation.
The predicted fuel centreline temperature at the peak power elevation and the predicted (rod average) fission gas release during the base irradiation are plotted versus burnup in Figure 2. The behaviour versus time during the power ramp is illustrated in Figure 3. Also included in Figure 3 is the measured fission gas release value from the post-re-irradiation PIE.
0
200
400
600
800
1000
1200
1400
1600
1800
0 5 10 15 20 25 30 35
Rod average burnup (MWd/kgHM)
Tem
pera
ture
(°C
)
0
10
20
30
40
50
60
70
80
90
Rat
ing
(kW
/m),
FGR
(%)
Predicted fuel centreline temperatureHalden thresholdRod average ratingPredicted fission gas release
Figure 2: Fuel centreline temperature and fission gas release versus burnup for the PRIMO rod BD8 base irradiation
The predicted FGR of 0.6% at the end of the base irradiation is in good agreement with the 0.5% value inferred from the puncture measurement of a sibling rod, and is consistent with the predicted fuel centreline temperature remaining below the Halden threshold for significant (~ 1%) fission gas release [35] at all times. The predicted end-of-life FGR of 6.4% is noticeably less than the measured value of 11.2%. However, the predicted value is within ×/÷ 2 of the measured value, which is an acceptable result (given the ‘rule of thumb’ of +/- 5% on through-life power giving ×/÷ 2 on end-of-life FGR). The predicted gas composition at end-of-life is 81 mole% helium, 18 mole% xenon and 1 mole% krypton. This compares to a measured composition of 72.6 mole% helium, 25.7 mole% xenon and 1.7 mole% krypton. The discrepancy is predominantly due to the differences in the measured and predicted fission gas release.

Not Protectively Marked
Page 21 of 82
NNL (12) 12172MFTC/P(2012)467
Issue 2
Not Protectively Marked
0
200
400
600
800
1000
1200
1400
1600
1800
0 10 20 30 40 50 60 70 80
Time since start of ramp (hrs)
Tem
pera
ture
(°C
)
0
10
20
30
40
50
60
70
80
90
Rat
ing
(kW
/m),
FGR
(%)
Predicted fuel centreline temperatureRod average ratingPredicted fission gas releaseMeasured fission gas release
Figure 3: Fuel centreline temperature and fission gas release versus time for the PRIMO rod BD8 power ramping
ENIGMA predicts some grain growth — the maximum grain size, which occurs in the pellet centre at the peak power elevation, is 6.3 µm — but not as much as measured (up to ~ 10 µm). This reflects the difficulty in accurately predicting grain growth, especially given the period of operation early in life close to the threshold temperature for grain growth of ~ 1400°C and the relatively short transient hold time of 20 hours (ENIGMA predicts 1.1 µm of the increase in grain size to occur during the base irradiation, and the remaining 0.2 µm to occur during the end-of-life power ramp).
3.2. Case 2: Risø-3 Rod GE7
Overview of case
Risø-3 rod GE7 was part of a segmented rod base irradiated in the Quad Cities 1 BWR for four cycles from February 1979 until January 1986. The segment was then bump tested, i.e. subjected to a short hold power ramp, in the Risø DR3 reactor in March 1989 — with no prior re-fabrication — as part of the Risø-3 fission gas project. The cladding consisted of Zircaloy-2 with a bonded Zr liner of 76 µm thickness. There was no rod instrumentation during either the base irradiation or the subsequent ramp testing. Non-destructive PIE was performed after the base irradiation, and both non-destructive and destructive PIE were performed after the re-irradiation.
Measured data
The measured data from the post-base irradiation non-destructive PIE include rod diameter and rod length change.

Not Protectively Marked
Page 22 of 82
NNL (12) 12172MFTC/P(2012)467
Issue 2
Not Protectively Marked
The measured data from the post-ramp PIE include FGR, rod free volume, and rod internal pressure (all from rod puncturing), rod diameter, clad ridging, inner and outer clad oxide thicknesses and radial profiles of porosity, grain size, Xe concentration (from electron probe microanalysis and X-ray fluorescence) and 137Cs concentration (from micro-gamma scanning).
Modelling considerations
ENIGMA requires the initial plenum free volume as an input parameter. This could be calculated from the initial rod free volume of 12 cm3 documented in the pre-characterisation datafile. However, this rod free volume is inconsistent with the mean value of 12.37 cm3 measured during the post-base irradiation puncture of the segments immediately above and below the GE7 segment. Thus, an initial plenum free volume of 10.45 cm3 was instead modelled that gives a rod free volume at the end of the base irradiation which is equal to the 12.37 cm3 value.
Since ENIGMA has no specific models for liner cladding, it was instead modelled as Zircaloy-2 with a thickness equal to the combined base material plus liner thicknesses.
Ten equal length axial zones were modelled for consistency with the provided re-irradiation power histories. Given the very flat axial burnup profile after the base irradiation for the (short length) rod, the base irradiation powers in all axial zones were set equal to the provided rod average values.
Results
The predicted fuel centreline temperature at the peak power elevation and the predicted (rod average) fission gas release during the base irradiation are plotted versus burnup in Figure 4. The behaviour versus time during the power ramp is illustrated in Figure 5. Also included in Figure 4 and Figure 5 are the measured fission gas release value from the post-base irradiation and post-re-irradiation PIE, respectively (the post-base irradiation measurement is estimated from puncturing of sibling segments [37]).
The predicted FGR of 0.24% at the end of the base irradiation is in good agreement with the measured value of 0.3%, and is consistent with the predicted fuel centreline temperature remaining below the Halden threshold for significant fission gas release at all times. The predicted end-of-life FGR of 7.0% is significantly (i.e. greater than a factor of two) less than the measured value of 14.4%. The underprediction of gas release cannot be ascribed to the lack of modelling of columnar grain growth, since the PIE showed that significant grain growth did not occur, despite the high fuel temperatures at the bump terminal level (due to the short hold time of 4 hours).

Not Protectively Marked
Page 23 of 82
NNL (12) 12172MFTC/P(2012)467
Issue 2
Not Protectively Marked
200
400
600
800
1000
1200
1400
1600
1800
0 5 10 15 20 25 30 35 40 45
Rod average burnup (MWd/kgHM)
Tem
pera
ture
(°C
)
0
10
20
30
40
50
60
70
80
Rat
ing
(kW
/m),
FGR
(%)
Predicted fuel centreline temperatureHalden thresholdRod average ratingPredicted fission gas releaseMeasured fission gas release
Figure 4: Fuel centreline temperature and fission gas release versus burnup for the Risø-3 rod GE7 base irradiation
200
400
600
800
1000
1200
1400
1600
1800
2000
2200
0 1 2 3 4 5 6 7 8 9 10 11 12 13 14 15 16
Time since start of ramp (hrs)
Tem
pera
ture
(°C
)
0
10
20
30
40
50
60
70
80
90
100
Rat
ing
(kW
/m),
FGR
(%)
Predicted fuel centreline temperatureRod average ratingPredicted fission gas releaseMeasured fission gas release
Figure 5: Fuel centreline temperature and fission gas release versus time for the Risø-3 rod GE7 power ramping

Not Protectively Marked
Page 24 of 82
NNL (12) 12172MFTC/P(2012)467
Issue 2
Not Protectively Marked
In order to investigate further the underprediction of FGR, the xenon concentration versus radius data measured by X-ray fluorescence (XRF) were compared to the corresponding predictions at the same axial location (390-393 mm from the bottom of the active fuel stack [37], corresponding to axial zone 6 in the ENIGMA modelling). The measured electron probe microanalysis (EPMA) xenon concentration versus radius data were ignored, since ITU have shown that these data were artificially biased towards low fission gas release [38]‡. The results are illustrated in Figure 6. The XRF data were provided as relative xenon concentrations: a multiplier has been applied to the data to give absolute results consistent with the predicted concentration of generated xenon. The predictions for comparison to the measurements are unreleased xenon concentration (the xenon concentration in the matrix or in gas bubbles) [39]. Also included in the figure is the predicted concentration versus radius profile of generated xenon. Measurements were obtained from a diametral trace of the XRF sample: the data are therefore plotted as ‘radius 1’ and ‘radius 2’ in the figure.
0
0.1
0.2
0.3
0.4
0.5
0.6
0.7
0.8
0 10 20 30 40 50 60 70 80 90 100
Radius (%age of pellet radius)
Xeco
ncen
trat
ion
(wt%
fuel
)
Measured (XRF): radius 1Measured (XRF): radius 2Predicted: unreleased XePredicted: generated Xe
Figure 6: Measured and predicted unreleased xenon concentration versus radius for Risø-3 rod GE7
Figure 6 indicates that the fission gas release is underpredicted at the axial location of the XRF sample. This is consistent with Figure 5, which shows that fission gas release is also underpredicted for the rod as a whole. The discrepancy in measured and predicted fission gas release is related to the inner 50% of the pellet radius, implying that diffusional release, and therefore probably also fuel temperatures, are underpredicted. The lack of modelling of grain boundary sweeping is unimportant: due to the short transient hold time of 4 hours, ENIGMA predicts minimal grain growth — the maximum
‡ The data were obtained systematically from (low release) grains where grain boundary bubbles were absent,
despite the presence of a significant population of (higher release) grains which were populated with such bubbles. Thus, the overall intragranular gas concentration is overestimated, and the implied fission gas release is underestimated.

Not Protectively Marked
Page 25 of 82
NNL (12) 12172MFTC/P(2012)467
Issue 2
Not Protectively Marked
grain size, which occurs in the pellet centre at the peak power elevation (axial zone 2) is 12.6 µm, compared to an as-manufactured value of 12 µm — in agreement with the measurements. The potential for underprediction of fuel temperatures is investigated further below in the discussion on measured and predicted rod diameters.
The measured and predicted pre- and post-ramp rod diameters are plotted in Figure 7. Also included in Figure 7 is the as-manufactured rod diameter of 12.26 mm. The predicted values are outside of the clad oxide layer, since it is assumed that the measured diameters have not been adjusted to remove the contribution from the oxide thickness. The lower post-ramp predicted curve is the pellet waist prediction, while the upper curve is the pellet end prediction (including the effects of clad ridging). There was no clad ridging predicted during the base irradiation, so the pre-ramp pellet waist and pellet end predictions are identical. The measured datapoints were digitised from Figure 6-3 of the rod GE7 bump test report [37].
12.2
12.22
12.24
12.26
12.28
12.3
12.32
12.34
12.36
0 100 200 300 400 500 600 700 800
Distance from bottom of active fuel stack (mm)
Rod
diam
eter
(mm
)
As-manufacturedPre-ramp: measuredPre-ramp: predictedPost-ramp: measuredPost-ramp: predicted
Figure 7: Measurements and predictions of pre- and post-ramp rod diameters for Risø-3 rod GE7
The clad creepdown during the base irradiation is somewhat overpredicted, but the agreement between measurements and prediction is still reasonable (given typical clad creep strain modelling uncertainties of x/÷2). Although the measured axial profile of the post-ramp rod diameter at the pellet waist (the lower limit of the measured data) is qualitatively reproduced, the magnitudes of the measured diameters are underpredicted. This is partly due to the overprediction of clad creepdown during the base irradiation, but the impact of this will be relatively small. The measured ridge heights (the difference between the upper and lower limits of the measured data) of ~ 20 µm near the peak deformation location (~ 200 mm from the bottom of the active fuel stack) are well predicted, despite the underprediction in the post-ramp rod diameters. There is some discrepancy, however, between the predictions and measurements of the variations in ridge height with axial location (the ridge height attenuation with distance from the peak deformation location is more pronounced than is predicted).

Not Protectively Marked
Page 26 of 82
NNL (12) 12172MFTC/P(2012)467
Issue 2
Not Protectively Marked
The predicted rod length change at the time of the post-base irradiation PIE is +4.8 mm. This compares to a measured value of +3.0 mm [36]. Thus, the rod length change is overpredicted, but not excessively so. The overprediction may, at least in part, be due to the fact that the ENIGMA clad growth model is not validated for Zircaloy-2 cladding, or for cladding with a liner.
The predicted rod free volume and rod internal pressure at end of life are 12.28 cm3 and 0.78 MPa, respectively. These compare to measured values of 12.76 cm3 and 1.218 MPa (where the latter is the value at 20°C, not at 0°C as tabulated). The as-manufactured values were 13.35 cm3 (based on the calculated plenum, fuel-clad gap and chamfer volumes) and 0.29 MPa. Thus, the measured rod free volume reduction is approximately 4.4%, compared to a predicted value of 8.0%. Given the uncertainties in the measured values (especially in the as-manufactured free volume) the prediction is judged to be reasonable. The predicted pressure increase is only 53% of the measured increase. This discrepancy is predominantly due to the underprediction of fission gas release discussed above.
The measured inner and outer cladding oxide thicknesses were 0-11 µm and 4 µm, respectively. ENIGMA does not calculate clad oxidation at the clad inner wall and therefore there is no corresponding prediction of inner oxide thickness. The predicted outer oxide thickness is 6 µm, in good agreement with the measurement.
Further discussion on post-ramp rod diameters
In order to investigate further the significant underprediction of post-ramp clad diameters, various additional ENIGMA runs were performed to look at the sensitivity of the end-of-life clad diameter predictions to various material properties, including the effects of the zirconium liner. All increases/decreases in material properties were in a direction expected to give increased clad diameters. Two different approaches were taken to crudely model the effects of the liner. In the first approach, the approximate upper bound effects of the liner on clad creep and plasticity were simulated by reducing the as-manufactured clad outer diameter by twice the liner thickness while keeping the clad inner diameter unchanged (assuming the liner has no creep resistance, while still calculating the fuel-clad contact pressure on the basis of the inner diameter of the liner). In the second approach, a multiplier was applied to the clad creep rate that reflects the volume-averaged behaviour of the zirconium liner and the Zircaloy-2 base material. More specifically, it was assumed that the presence of the liner will lead to a multiplicative factor on clad creep rate, fliner, given by
baseliner
baseZrlinerliner tt
tftf
++
≈
where tliner is the liner thickness, tbase is the base material thickness, and fZr is the creep rate of Zr as a multiple of the creep rate of Zircaloy-2. For simplicity, fliner was assumed to apply equally to primary thermal, secondary thermal, and irradiation creep. It was also assumed to apply to the clad plasticity strain. In the absence of any known usable data on the creep rate of pure zirconium, fZr values of 2, 5, 10 and 100, and corresponding fliner values of 1.093, 1.373, 1.839 and 10.23, were investigated.
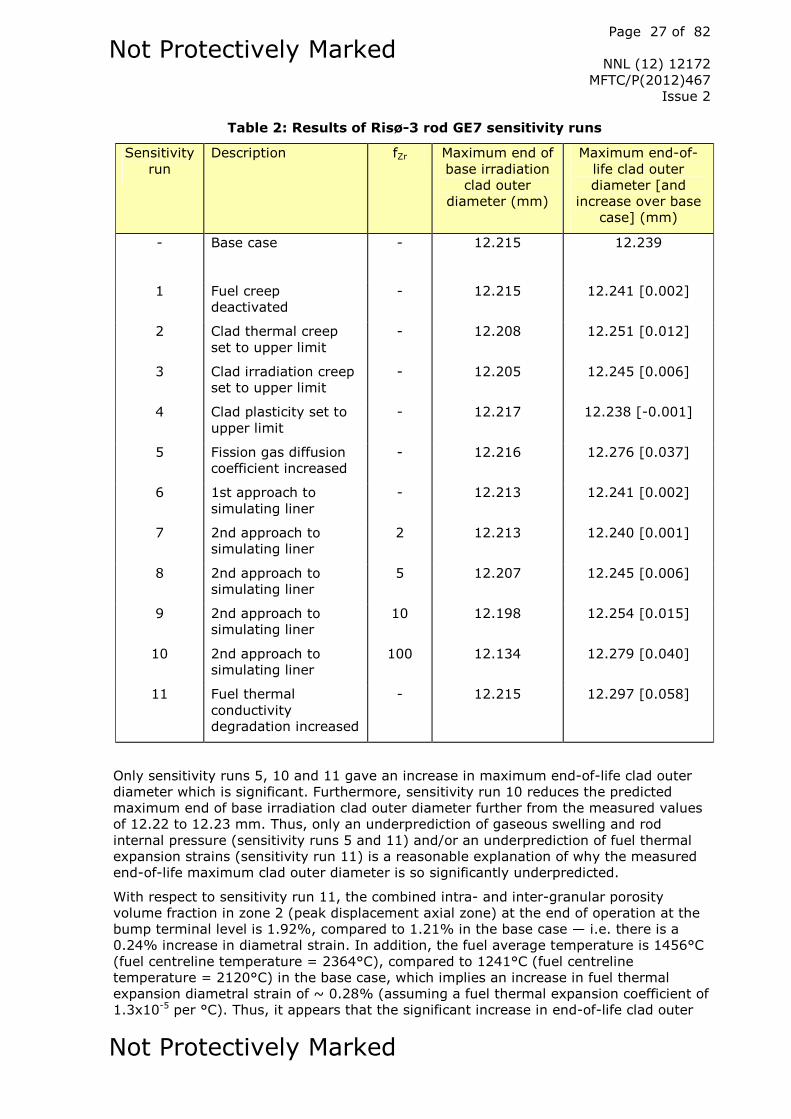
The results of the key sensitivity runs are reproduced in Table 2. ‘Maximum’ in the sense used in the table means with respect to axial variations (not time). All clad diameters are pellet waist values. In the case of sensitivity runs 5 and 11, the fission gas diffusion coefficient/fuel thermal conductivity degradation increases were of a magnitude that gave a predicted end-of-life fission gas release value equal to the measured value of 14.4%.
Not Protectively Marked
Page 27 of 82
NNL (12) 12172MFTC/P(2012)467
Issue 2
Not Protectively Marked
Table 2: Results of Risø-3 rod GE7 sensitivity runs
Sensitivity run
Description fZr Maximum end of base irradiation
clad outer diameter (mm)
Maximum end-of-life clad outer diameter [and
increase over base case] (mm)
- Base case - 12.215 12.239
1 Fuel creep deactivated
- 12.215 12.241 [0.002]
2 Clad thermal creep set to upper limit
- 12.208 12.251 [0.012]
3 Clad irradiation creep set to upper limit
- 12.205 12.245 [0.006]
4 Clad plasticity set to upper limit
- 12.217 12.238 [-0.001]
5 Fission gas diffusion coefficient increased
- 12.216 12.276 [0.037]
6 1st approach to simulating liner
- 12.213 12.241 [0.002]
7 2nd approach to simulating liner
2 12.213 12.240 [0.001]
8 2nd approach to simulating liner
5 12.207 12.245 [0.006]
9 2nd approach to simulating liner
10 12.198 12.254 [0.015]
10 2nd approach to simulating liner
100 12.134 12.279 [0.040]
11 Fuel thermal conductivity degradation increased
- 12.215 12.297 [0.058]
Only sensitivity runs 5, 10 and 11 gave an increase in maximum end-of-life clad outer diameter which is significant. Furthermore, sensitivity run 10 reduces the predicted maximum end of base irradiation clad outer diameter further from the measured values of 12.22 to 12.23 mm. Thus, only an underprediction of gaseous swelling and rod internal pressure (sensitivity runs 5 and 11) and/or an underprediction of fuel thermal expansion strains (sensitivity run 11) is a reasonable explanation of why the measured end-of-life maximum clad outer diameter is so significantly underpredicted.
With respect to sensitivity run 11, the combined intra- and inter-granular porosity volume fraction in zone 2 (peak displacement axial zone) at the end of operation at the bump terminal level is 1.92%, compared to 1.21% in the base case — i.e. there is a 0.24% increase in diametral strain. In addition, the fuel average temperature is 1456°C (fuel centreline temperature = 2364°C), compared to 1241°C (fuel centreline temperature = 2120°C) in the base case, which implies an increase in fuel thermal expansion diametral strain of ~ 0.28% (assuming a fuel thermal expansion coefficient of 1.3x10⁻⁵ per °C). Thus, it appears that the significant increase in end-of-life clad outer
Not Protectively Marked
Page 28 of 82
NNL (12) 12172MFTC/P(2012)467
Issue 2
Not Protectively Marked
diameter for sensitivity run 11 is due to comparable effects of increased gaseous swelling and increased fuel thermal expansion.
There remains the question of whether the base case underprediction of the clad outer diameter is due to an underprediction of fuel temperatures, to an underprediction of gaseous swelling (other than indirectly via an underprediction of fuel temperature), or to both. The former cannot be checked by comparing to measured data for rod GE7 because this rod was not equipped with a fuel thermocouple. It is highly likely that an underprediction of fuel temperatures is involved, since the default fuel thermal conductivity degradation rate in ENIGMA is derived from a combined Halden and Risø temperature measurement database (but biased towards Halden data due to its preponderance) where, on average, the Risø measurements imply a higher degradation rate than the Halden measurements. The predictions for Risø-3 rod II5 (case 4) support this, since predicted fuel thermocouple temperatures during the ramp were ~ 100°C less than the measurements. It can be concluded that sensitivity run 11 is the best approximation to the true situation — the predicted post-ramp rod diameters are illustrated in Figure 8 (which has the same format as Figure 7) and show good agreement with the measured data.
That an ~ 240°C increase in fuel centreline temperature was required to match the measured and predicted end-of-life fission gas release values for sensitivity run 11 further suggests that an underprediction of gaseous swelling is also contributing to the clad diameter underprediction. In reality there was probably burst release of fission gas during the ramp, which, if modelled together with a thermal conductivity degradation rate derived from Risø temperature measurements, would likely give a predicted end-of-life fission gas release comparable to the measured value with predicted fuel centreline temperatures at the bump terminal level only ~ 100°C above the base case values. An increase in the amount of gaseous swelling (by, for example, an increased fission gas diffusion coefficient) would then be required to generate clad diameter predictions comparable to those in sensitivity run 11.

Not Protectively Marked
Page 29 of 82
NNL (12) 12172MFTC/P(2012)467
Issue 2
Not Protectively Marked
12.2
12.22
12.24
12.26
12.28
12.3
12.32
12.34
12.36
0 100 200 300 400 500 600 700 800
Distance from bottom of active fuel stack (mm)
Rod
diam
eter
(mm
)As-manufacturedPre-ramp: measuredPre-ramp: predictedPost-ramp: measuredPost-ramp: predicted
Figure 8: Measurements and predictions of pre- and post-ramp rod diameters for Risø-3 rod GE7 when increased fuel thermal conductivity
degradation is modelled
3.3. Case 3: IFA-535.5 Rod 809
Overview of case
IFA-535.5 rod 809 was base irradiated in the Halden test reactor from May 1973 to June 1985 as part of the upper cluster of the IFA-409 assembly (with no rod instrumentation). It was then equipped with a pressure transducer and a clad extensometer and subjected to a slow power ramp, also in the Halden reactor, as part of the IFA-535.5 experiment. The re-irradiation, in which the rig was mounted in a high pressure loop simulating PWR coolant conditions, was performed from November 1985 to February 1986. This was followed by post-irradiation examination (PIE).
The cladding consisted of Zircaloy-2 with a niobium foil liner of 13 µm thickness.
The post-base irradiation instrumentation was such as to retain the rod free volume gas inventory. This was achieved by welding a sealed, evacuated instrumented head containing a micro-drill onto the fuel rod, and driving the micro-drill by a pair of external rotating magnets to merge the gas plenum and the instrumented head.
Measured data
FGR was measured after the instrumentation. Rod internal pressure and clad elongation were measured on-line during the ramp test. Through-ramp measured FGR values have also been calculated from the pressure transducer measurements. Rod free volume and FGR were measured during the post-ramping PIE.

Not Protectively Marked
Page 30 of 82
NNL (12) 12172MFTC/P(2012)467
Issue 2
Not Protectively Marked
Modelling considerations
Since ENIGMA has no specific models for liner cladding, it was instead modelled as Zircaloy-2 with a thickness equal to the combined base material plus liner thicknesses.
The fuel grain size is unknown. A typical MLI value of 12 µm was therefore assumed.
The powers during both the base irradiation and the re-irradiation were provided as point values at the bottom of the active fuel stack and at the top of the first, second, third and final quarters of the active stack length. The active fuel stack was therefore modelled as four axial zones, with axial zone powers calculated by linearly interpolating the pointwise ratings supplied in the IFPE dataset.
The base irradiation powers were provided as average values over each time period, whereas the re-irradiation powers were provided as point values at given time intervals. The base irradiation powers were therefore converted into point values by assuming that over each time period the powers changed to their average values at a nominal ramp rate (in terms of rod average power) of 10 kW/m per hour, and then remained at their average values for the remainder of the time period. This allowed the combined power history to be treated as point values, with linear interpolation performed internally by ENIGMA.
Results
The predicted fuel centreline temperature at the peak power elevation and the predicted (rod average) fission gas release during the base irradiation are plotted versus burnup in Figure 9. Also included in Figure 9 is the fission gas release value measured after the instrumentation.
400
600
800
1000
1200
1400
1600
1800
2000
2200
0 10 20 30 40 50 60
Rod average burnup (MWd/kgHM)
Tem
pera
ture
(°C
)
0
10
20
30
40
50
60
70
80
90
Rat
ing
(kW
/m),
FGR
(%)
Predicted fuel centreline temperatureHalden thresholdRod average ratingPredicted fission gas releaseMeasured fission gas release
Figure 9: Fuel centreline temperature and fission gas release versus burnup for the IFA-535.5 rod 809 base irradiation
Not Protectively Marked
Page 31 of 82
NNL (12) 12172MFTC/P(2012)467
Issue 2
Not Protectively Marked
The predicted FGR of 24.6% at the end of the base irradiation is in good agreement with the measured value of 20.9%. This suggests that the fuel grain size modelled of 12 µm is reasonable. The large measured and predicted FGR values are consistent with predicted fuel centreline temperatures above the Halden threshold for significant fission gas release for a large proportion of the base irradiation.
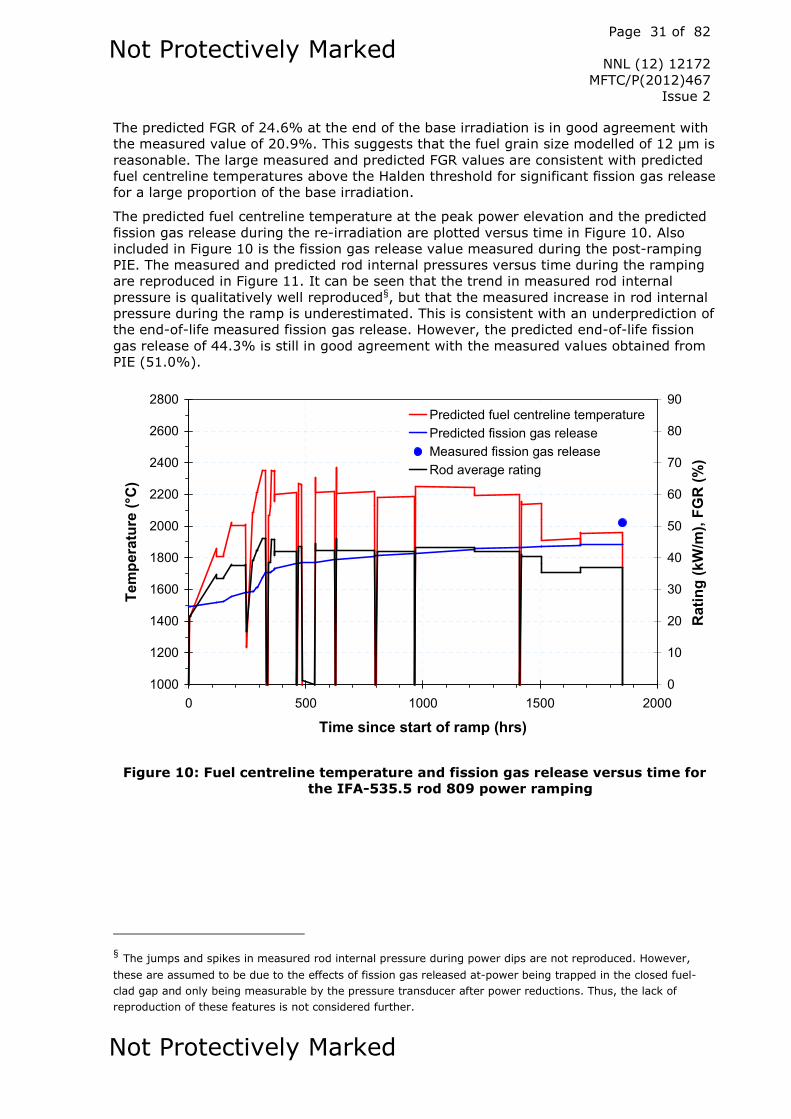
The predicted fuel centreline temperature at the peak power elevation and the predicted fission gas release during the re-irradiation are plotted versus time in Figure 10. Also included in Figure 10 is the fission gas release value measured during the post-ramping PIE. The measured and predicted rod internal pressures versus time during the ramping are reproduced in Figure 11. It can be seen that the trend in measured rod internal pressure is qualitatively well reproduced§, but that the measured increase in rod internal pressure during the ramp is underestimated. This is consistent with an underprediction of the end-of-life measured fission gas release. However, the predicted end-of-life fission gas release of 44.3% is still in good agreement with the measured values obtained from PIE (51.0%).
1000
1200
1400
1600
1800
2000
2200
2400
2600
2800
0 500 1000 1500 2000
Time since start of ramp (hrs)
Tem
pera
ture
(°C
)
0
10
20
30
40
50
60
70
80
90
Rat
ing
(kW
/m),
FGR
(%)
Predicted fuel centreline temperaturePredicted fission gas releaseMeasured fission gas releaseRod average rating
Figure 10: Fuel centreline temperature and fission gas release versus time for the IFA-535.5 rod 809 power ramping
§ The jumps and spikes in measured rod internal pressure during power dips are not reproduced. However,
these are assumed to be due to the effects of fission gas released at-power being trapped in the closed fuel-clad gap and only being measurable by the pressure transducer after power reductions. Thus, the lack of reproduction of these features is not considered further.

Not Protectively Marked
Page 32 of 82
NNL (12) 12172MFTC/P(2012)467
Issue 2
Not Protectively Marked
0.5
1
1.5
2
2.5
3
3.5
4
4.5
0 500 1000 1500 2000
Time since start of ramp (hrs)
Pres
sure
(MPa
)
0
20
40
60
80
100
120
140
160
Rat
ing
(kW
/m)
Predicted rod internal pressureMeasured rod internal pressureRod average rating
Figure 11: Rod internal pressure versus time for the IFA-535.5 rod 809 power ramping
The predicted and measured clad elongation versus time since the start of the ramping period are plotted in Figure 12. The nominal predictions (solid line) are plotted together with the predictions for a sensitivity case (dashed line) where the liner is ignored, i.e. where the clad outer diameter is reduced by twice the liner thickness (conservatively assuming that the liner has no mechanical strength, while still calculating the fuel-clad contact pressure on the basis of the inner diameter of the liner). It can be seen that there is negligible deviation between the two curves, suggesting that the liner is having an insignificant effect on the clad elongation behaviour.
The conditions at the start of the ramp were zero power and a clad surface temperature of 176°C. The measured increase in clad elongation of ~ 0.3 mm over the initial rise to power — when clad surface temperature also increases to 291°C — is well predicted. However, a clad temperature increase of 115°C gives a clad thermal expansion induced increase in clad elongation of approximately 0.3 mm which is reflected in the predictions, but is not reproduced by the measurements. This is because a clad extensometer measures clad elongation relative to the rig support structure (which is maintained at the coolant temperature)**. Thus, the predicted elongation increase is purely due to clad thermal expansion, with no PCMI predicted to occur (the predicted fuel-clad gap size remains greater than zero in all axial zones), while the measurements indicate significant PCMI-induced elongation. This discrepancy is not surprising given that the exact time of
** A clad extensometer consists of a magnetic core inside a primary coil which is surrounded by two secondary
coils. An AC current is applied to the primary coil and the voltage difference induced in the secondary coils is linearly related to the position of the core along the axis of the coils. The magnetic core is fixed to the free-moving end of the fuel rod, whereas the coils are supported by Zircaloy stringers fixed parallel to the fuel rod. Elongation of the cladding relative to the stringers displaces the core relative to the coils. This generates a voltage in the secondary coils, which is converted into a clad elongation.

Not Protectively Marked
Page 33 of 82
NNL (12) 12172MFTC/P(2012)467
Issue 2
Not Protectively Marked
gap closure (in a given axial zone) is difficult to predict, especially for a base irradiation in Halden BWR conditions such as this one where there is negligible clad creepdown due to the low coolant pressure and low clad temperatures.
The predicted clad elongation decreases during the excursions to zero power, when the clad surface temperature generally decreases from ~ 290°C to ~ 190°C (the notable exception being the first such excursion at ~ 340 hrs, for which the clad surface temperature drops to 94°C) are considerably larger than the measured decreases. This is because clad thermal expansion (or contraction in this case) induced elongation changes are not reproduced in the measurements, as noted above; the predicted elongation decreases are entirely reasonable and are consistent with reductions in thermal expansion strain together with a small component due to relaxation of PCMI stresses.
Following the initial rise to power, the behaviour of the measured elongation is broadly reproduced, except for the general trend of decreasing elongation during the first 500 hours (although more pronounced changes in elongation after power changes are predicted than are measured). Since the measured decrease in elongation during the first 500 hours is difficult to explain (it occurs over a much larger timescale than would be expected based on fuel creep) it is not surprising that it is not predicted — it may be an experimental anomaly. The predictions above a rod average rating of ~ 25 kW/m include a PCMI-induced component due to the fuel-clad gap being closed in at least one of the axial zones.
-0.6
-0.4
-0.2
0
0.2
0.4
0.6
0.8
1
0 500 1000 1500 2000
Time since start of ramp (hrs)
Cla
del
onga
tion
(mm
)
0
20
40
60
80
100
120
140
160
Rat
ing
(kW
/m)
Predicted clad elongationMeasured clad elongationRod average rating
Figure 12: Clad elongation versus time for the IFA-535.5 rod 809 power ramping
The predicted rod free volume at end of life is 18.1 cm3. The corresponding measured value is 17.2 cm3. The combined as-manufactured plenum free volume, instrumented head free volume and fuel-clad gap volume is 19.0 cm3, so the measured and predicted reductions in rod free volume are 9% and 5% respectively. Given the uncertainties in the measured values (especially in the as-manufactured rod free volume components) the prediction is judged to be reasonable.

Not Protectively Marked
Page 34 of 82
NNL (12) 12172MFTC/P(2012)467
Issue 2
Not Protectively Marked
3.4. Case 4: Risø-3 Rod II5
Overview of case
Risø-3 rod II5 is a short re-fabricated segment of a Zircaloy-2 clad rod, M72-2, base irradiated in the Halden test reactor from July 1968 until October 1981 as part of the IFA-161 experiment. The re-fabricated segment contained a 288 mm length of the fuel from the 1644 mm M72-2 active stack length [40]. The II5 rod was re-fabricated with a helium fill gas, a fuel centreline thermocouple and a pressure transducer. It was then ramp tested in the Risø DR3 reactor in March/April 1989 as part of the third Risø fission gas project. PIE was performed after both the base irradiation and the re-irradiation.
Measured data
Measured data were provided from three sources: (a) the post-base irradiation PIE of the parent rod; (b) signals from the rodlet instrumentation during the DR3 irradiation; (c) the rodlet post-DR3 irradiation PIE.
With respect to (a), the data include FGR (calculated from volume of fission gas measured during puncturing and an estimate for the amount of fission gas generated), rod free volume, rod internal pressure, clad ridging and fuel stack length change.
With respect to (b), the data consist of: (i) thermocouple temperature vs. local rating during the ramp up to the ramp test hold power; (ii) thermocouple temperature vs. local rating during a power dip part-way through the ramp test hold; (iii) thermocouple temperature vs. local rating during the power dip at the end of the ramp test; (iv) thermocouple temperature vs. elapsed time during the ramp test; (v) FGR vs. elapsed time during the ramp test (derived from pressure transducer measurements); (vi) rod internal pressure vs. elapsed time during the ramp test.
With respect to (c), the data include FGR, rod free volume, and rod internal pressure (all from rod puncturing), fuel stack length change (from gamma-scanning), rod diameter and clad ridging (from profilometry), inner and outer clad oxide thicknesses (from ceramography) and radial profiles of porosity (from quantitative image analysis), Xe concentration (from EPMA and X-ray fluorescence) and 137Cs concentration (from micro-gamma scanning).
Modelling considerations
Only the segment of the M72-2 parent rod present in rod II5 was modelled during the base irradiation. The plenum free volume was set to a notional value that gives the same rod free volume to active fuel volume ratio as in the parent rod.
Base irradiation powers were provided for five zones over the II5 segment length. Assuming that each zone is of equal length gives a zone length of 57.6 mm. Given that the hollow pellet region present after rod re-fabrication must be modelled in both the base irradiation and the re-irradiation, ENIGMA modelling was performed with six axial zones, the bottom four with a zone length of 57.6 mm, the uppermost with a zone length equal to the length of the hollow pellet region, i.e. 41.5 mm, and the second uppermost with a zone length equal to the remaining active stack length of 16.1 mm. The provided base irradiation linear ratings for zones 1 to 5 (numbered from the bottom of the active fuel stack upwards) were then used directly in zones 1 to 5 as modelled, while the base irradiation ratings in zone 6 were set to the provided zone 5 values, but adjusted to give the same burnup accumulation as in zone 5.
Re-irradiation rod average powers were provided, together with a note that the ‘powers at the T/C’ (assumed to be the powers in the hollow pellet region) are 93% of the rod
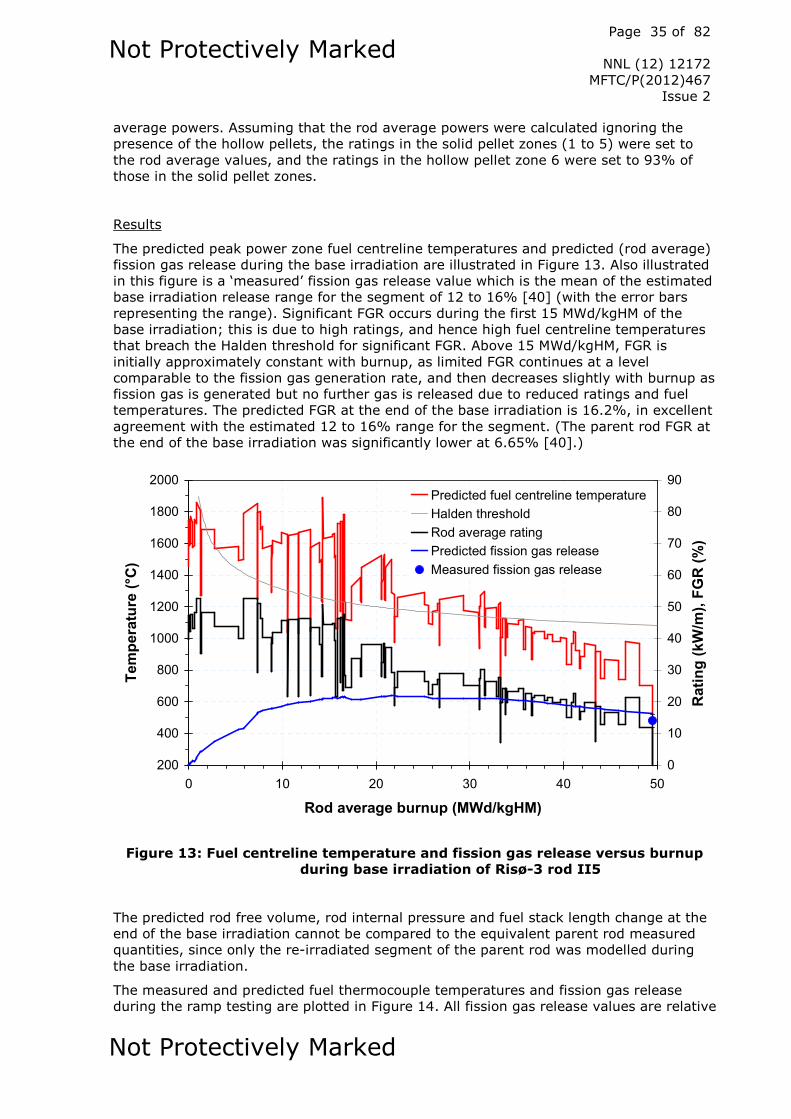
Not Protectively Marked
Page 35 of 82
NNL (12) 12172MFTC/P(2012)467
Issue 2
Not Protectively Marked
average powers. Assuming that the rod average powers were calculated ignoring the presence of the hollow pellets, the ratings in the solid pellet zones (1 to 5) were set to the rod average values, and the ratings in the hollow pellet zone 6 were set to 93% of those in the solid pellet zones.
Results
The predicted peak power zone fuel centreline temperatures and predicted (rod average) fission gas release during the base irradiation are illustrated in Figure 13. Also illustrated in this figure is a ‘measured’ fission gas release value which is the mean of the estimated base irradiation release range for the segment of 12 to 16% [40] (with the error bars representing the range). Significant FGR occurs during the first 15 MWd/kgHM of the base irradiation; this is due to high ratings, and hence high fuel centreline temperatures that breach the Halden threshold for significant FGR. Above 15 MWd/kgHM, FGR is initially approximately constant with burnup, as limited FGR continues at a level comparable to the fission gas generation rate, and then decreases slightly with burnup as fission gas is generated but no further gas is released due to reduced ratings and fuel temperatures. The predicted FGR at the end of the base irradiation is 16.2%, in excellent agreement with the estimated 12 to 16% range for the segment. (The parent rod FGR at the end of the base irradiation was significantly lower at 6.65% [40].)
200
400
600
800
1000
1200
1400
1600
1800
2000
0 10 20 30 40 50
Rod average burnup (MWd/kgHM)
Tem
pera
ture
(°C
)
0
10
20
30
40
50
60
70
80
90
Rat
ing
(kW
/m),
FGR
(%)
Predicted fuel centreline temperatureHalden thresholdRod average ratingPredicted fission gas releaseMeasured fission gas release
Figure 13: Fuel centreline temperature and fission gas release versus burnup during base irradiation of Risø-3 rod II5
The predicted rod free volume, rod internal pressure and fuel stack length change at the end of the base irradiation cannot be compared to the equivalent parent rod measured quantities, since only the re-irradiated segment of the parent rod was modelled during the base irradiation.
The measured and predicted fuel thermocouple temperatures and fission gas release during the ramp testing are plotted in Figure 14. All fission gas release values are relative

Not Protectively Marked
Page 36 of 82
NNL (12) 12172MFTC/P(2012)467
Issue 2
Not Protectively Marked
to the start of the ramping, i.e. they do not include the contributions from the base irradiation. The measured fission gas release is the total FGR during the ramp as measured by rod puncture during PIE. The times of the measured thermocouple temperature and measured fission gas release values (provided as elapsed time since 08:00 on 31 March 1989) have been offset by 1.3 hours for best consistency with the times in the provided power history (as reflected in the plotted rod average rating evolution).
200
400
600
800
1000
1200
1400
1600
1800
2000
0 10 20 30 40 50 60 70 80
Time since start of ramp (hrs)
Tem
pera
ture
(°C
)
0
10
20
30
40
50
60
70
80
90
Rat
ing
(kW
/m),
FGR
(%)
Predicted thermocouple temperatureMeasured thermocouple temperatureRod average ratingPredicted fission gas releaseMeasured fission gas release
Figure 14: Thermocouple temperature and fission gas release versus time during power ramping of Risø-3 rod II5
The measured thermocouple temperatures are underpredicted by ~ 100°C at all power levels. Since the fuel-clad gap is predicted to be closed above ~ 20 kW/m at all elevations, this suggests that the fuel thermal conductivity degradation rate is higher than predicted. This is consistent with ENIGMA’s degradation rate being biased towards Halden data, as described in Section 3.2. (It may be expected that this would not apply to this rod, since it was base irradiated in the Halden reactor; however, validation of ENIGMA has shown that fuel temperatures for Risø-3 rods are systematically underpredicted, regardless of the base irradiation reactor (which included commercial PWRs, commercial BWRs and the Halden reactor). The reasons for this are unclear.) The discrepancy is not of undue concern, since an underprediction of ~ 100°C is typical of the scatter in predicted minus measured fuel temperatures in the ENIGMA validation database.
The predicted FGR during the power ramp is 2.2%. This is significantly less than the measured value from PIE of 10.6%, in part due to the underprediction of fuel temperatures during the ramp. However, the total predicted FGR during base irradiation and power ramping of 18.4% is still in reasonable agreement with the estimate of 23 to 27% obtained by combining the measured FGR during the ramp with the estimated FGR during the base irradiation. The measured rod internal pressure increases during the

Not Protectively Marked
Page 37 of 82
NNL (12) 12172MFTC/P(2012)467
Issue 2
Not Protectively Marked
ramp (not plotted) are significantly underpredicted due to the significant underprediction of FGR.
In order to investigate further the underprediction of FGR, the EPMA and XRF xenon concentration versus radius measurements were compared to the corresponding predictions at the same axial location (88-114 mm from the bottom of the active fuel stack for the EPMA data, and 115-129 mm for the XRF data [40], both of which correspond to axial zone 2 in the ENIGMA modelling). The results are illustrated in Figure 15 (EPMA) and Figure 16 (XRF). The XRF data were provided as relative xenon concentrations: a multiplier has been applied to the data to give absolute results consistent with the predicted concentration of generated xenon. The predictions are of intragranular (matrix plus intragranular bubbles) xenon concentration for comparison to the EPMA data, and of unreleased (matrix plus all gas bubbles) xenon concentration for comparison to the XRF data [39]. Also included in the figures is the predicted concentration versus radius profile of generated xenon. XRF measurements were obtained from a diametral trace of the sample: the data are therefore plotted as ‘radius 1’ and ‘radius 2’ in Figure 16.
0
0.1
0.2
0.3
0.4
0.5
0.6
0.7
0.8
0.9
1
0 10 20 30 40 50 60 70 80 90 100
Radius (%age of pellet radius)
Xeco
ncen
trat
ion
(wt%
fuel
)
Measured (EPMA)Predicted: intragranular XePredicted: generated Xe
Figure 15: Measured and predicted intragranular xenon concentration versus radius for Risø-3 rod II5
Since (excluding the hollow pellets) the axial power profile during the re-irradiation was approximately uniform, the measured and predicted xenon concentrations at the EPMA sample location are representative of the rod as a whole (other than in the hollow pellet section).
The measured intragranular and unreleased xenon concentrations are well predicted over the inner 50% of the pellet radius, but are overpredicted between 50 and 80% of the pellet radius. The intragranular xenon concentration is also overpredicted at the pellet rim. The relatively small discrepancy between measurements and predictions from 80% of the pellet radius to the pellet rim is due to the mismatch between the absolute values of predicted xenon generation and the measured values implicit in the magnitudes of the datapoints. Since this is likely to be due to measurement uncertainty it is not discussed further.
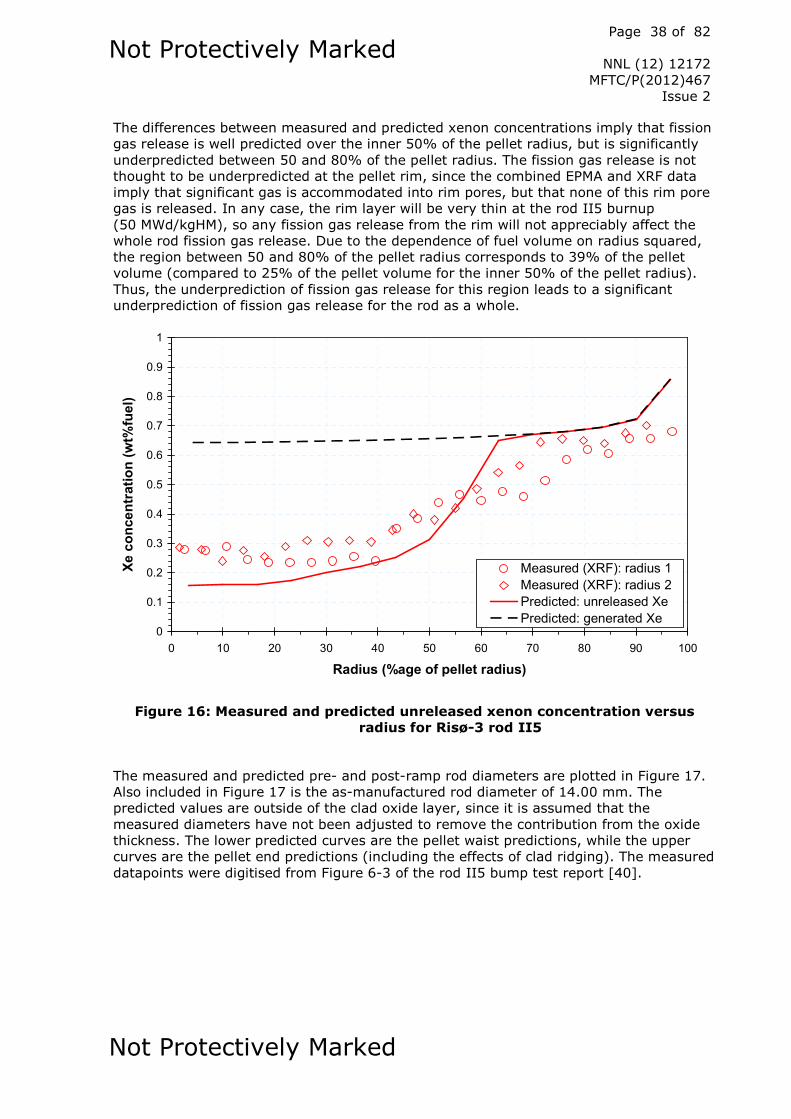
Not Protectively Marked
Page 38 of 82
NNL (12) 12172MFTC/P(2012)467
Issue 2
Not Protectively Marked
The differences between measured and predicted xenon concentrations imply that fission gas release is well predicted over the inner 50% of the pellet radius, but is significantly underpredicted between 50 and 80% of the pellet radius. The fission gas release is not thought to be underpredicted at the pellet rim, since the combined EPMA and XRF data imply that significant gas is accommodated into rim pores, but that none of this rim pore gas is released. In any case, the rim layer will be very thin at the rod II5 burnup (50 MWd/kgHM), so any fission gas release from the rim will not appreciably affect the whole rod fission gas release. Due to the dependence of fuel volume on radius squared, the region between 50 and 80% of the pellet radius corresponds to 39% of the pellet volume (compared to 25% of the pellet volume for the inner 50% of the pellet radius). Thus, the underprediction of fission gas release for this region leads to a significant underprediction of fission gas release for the rod as a whole.
0
0.1
0.2
0.3
0.4
0.5
0.6
0.7
0.8
0.9
1
0 10 20 30 40 50 60 70 80 90 100
Radius (%age of pellet radius)
Xeco
ncen
trat
ion
(wt%
fuel
)
Measured (XRF): radius 1Measured (XRF): radius 2Predicted: unreleased XePredicted: generated Xe
Figure 16: Measured and predicted unreleased xenon concentration versus radius for Risø-3 rod II5
The measured and predicted pre- and post-ramp rod diameters are plotted in Figure 17. Also included in Figure 17 is the as-manufactured rod diameter of 14.00 mm. The predicted values are outside of the clad oxide layer, since it is assumed that the measured diameters have not been adjusted to remove the contribution from the oxide thickness. The lower predicted curves are the pellet waist predictions, while the upper curves are the pellet end predictions (including the effects of clad ridging). The measured datapoints were digitised from Figure 6-3 of the rod II5 bump test report [40].
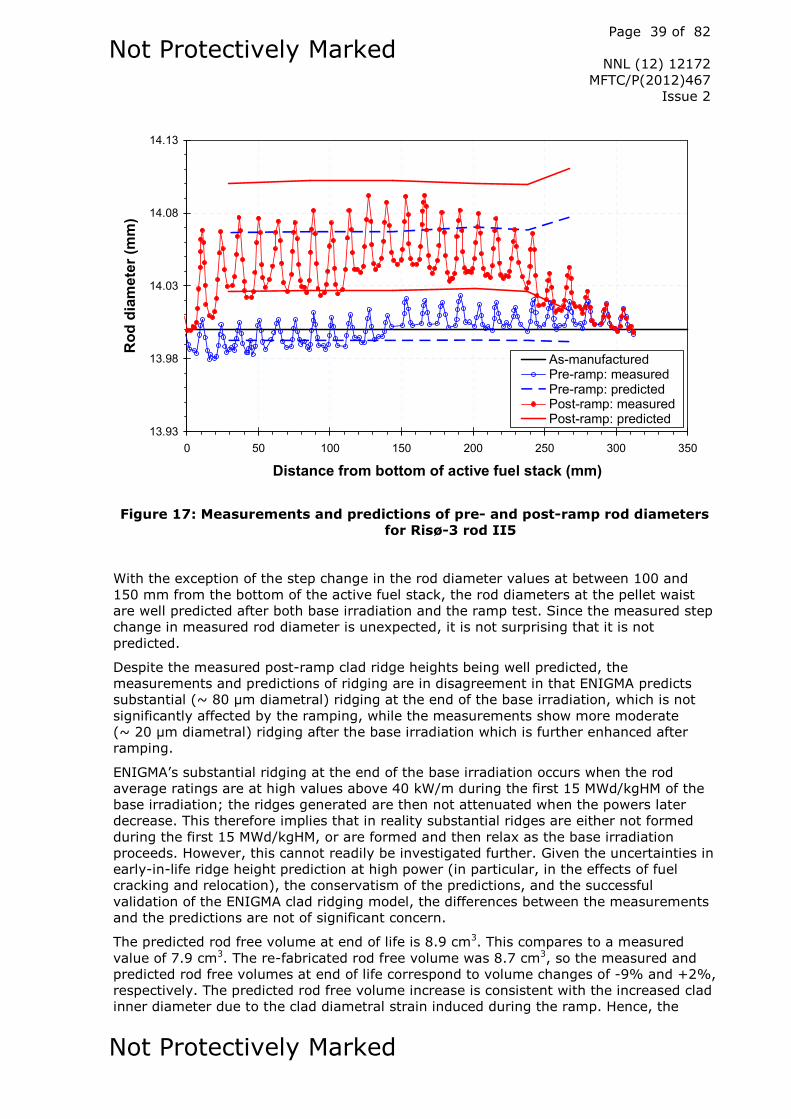
Not Protectively Marked
Page 39 of 82
NNL (12) 12172MFTC/P(2012)467
Issue 2
Not Protectively Marked
13.93
13.98
14.03
14.08
14.13
0 50 100 150 200 250 300 350
Distance from bottom of active fuel stack (mm)
Rod
diam
eter
(mm
)
As-manufacturedPre-ramp: measuredPre-ramp: predictedPost-ramp: measuredPost-ramp: predicted
Figure 17: Measurements and predictions of pre- and post-ramp rod diameters for Risø-3 rod II5
With the exception of the step change in the rod diameter values at between 100 and 150 mm from the bottom of the active fuel stack, the rod diameters at the pellet waist are well predicted after both base irradiation and the ramp test. Since the measured step change in measured rod diameter is unexpected, it is not surprising that it is not predicted.
Despite the measured post-ramp clad ridge heights being well predicted, the measurements and predictions of ridging are in disagreement in that ENIGMA predicts substantial (~ 80 µm diametral) ridging at the end of the base irradiation, which is not significantly affected by the ramping, while the measurements show more moderate (~ 20 µm diametral) ridging after the base irradiation which is further enhanced after ramping.
ENIGMA’s substantial ridging at the end of the base irradiation occurs when the rod average ratings are at high values above 40 kW/m during the first 15 MWd/kgHM of the base irradiation; the ridges generated are then not attenuated when the powers later decrease. This therefore implies that in reality substantial ridges are either not formed during the first 15 MWd/kgHM, or are formed and then relax as the base irradiation proceeds. However, this cannot readily be investigated further. Given the uncertainties in early-in-life ridge height prediction at high power (in particular, in the effects of fuel cracking and relocation), the conservatism of the predictions, and the successful validation of the ENIGMA clad ridging model, the differences between the measurements and the predictions are not of significant concern.
The predicted rod free volume at end of life is 8.9 cm3. This compares to a measured value of 7.9 cm3. The re-fabricated rod free volume was 8.7 cm3, so the measured and predicted rod free volumes at end of life correspond to volume changes of -9% and +2%, respectively. The predicted rod free volume increase is consistent with the increased clad inner diameter due to the clad diametral strain induced during the ramp. Hence, the

Not Protectively Marked
Page 40 of 82
NNL (12) 12172MFTC/P(2012)467
Issue 2
Not Protectively Marked
substantial decrease in the measured rod free volume is difficult to understand; the discrepancy between measurement and prediction is therefore not considered further.
No change in the fuel stack length from that measured post-base irradiation was measured in the post-ramp PIE. This was also predicted by ENIGMA.
The measured inner and outer cladding oxide thicknesses were 2-13 µm and 21 µm, respectively. ENIGMA does not calculate clad oxidation at the clad inner wall and therefore there is no corresponding prediction of inner oxide thickness. The predicted outer oxide thickness is 1 µm, i.e. significantly less than the measured value. The low predicted oxide thickness is consistent with expectation given the base irradiation in the Halden reactor, where clad surface temperatures are low at ~ 250°C. Thus, the relatively large measured value (which pertains to uniform, not nodular, corrosion) is unexpected. The discrepancy between measurement and prediction is therefore not considered further.
3.5. Cases 5 and 6: US PWR 16x16 LTAs Rods TSQ002 and TSQ022
Overview of cases
Cases 5 and 6 are two rods — TSQ002 and TSQ022 — irradiated as part of a 16x16 lead test assembly (LTA) extended burnup demonstration programme in a US commercial PWR. Both rods were irradiated in the same assembly for five cycles. Rod TSQ002 contained standard UO2 fuel (solid pellets) in Zircaloy-4 cladding, while rod TSQ022 contained annular UO2 fuel, also in Zircaloy-4 cladding. Both rods were subjected to an extensive PIE programme.
Measured data
The measured data available for both rods TSQ002 and TSQ022 are [41]: rod free volume (from puncturing), clad diameter axial profile; clad oxide thickness axial profile; fuel density; fuel burnup; fuel grain size radial profile; clad hydrogen content. All data were obtained as part of the PIE programme.
Modelling considerations
The IFPE documentation quotes the fuel grain size as in the range 7 to 12 microns. On the basis of the PIE results (for the cold outer regions of the pellet where there will be negligible grain growth) a value of 11 microns is most appropriate within this range, and this is therefore the value assumed.
The plenum free volume for each of the two rods is calculated by subtracting the calculated fuel-clad gap, pellet bore, and pellet dish and chamfer volumes from the provided rod void volumes (25.42 cm3 for TSQ002 and 37.22 cm3 for TSQ022). The result is 9.40 cm3 for rod TSQ002 and 6.18 cm3 for rod TSQ022.
The documentation indicates that the fast flux values supplied are for neutron energies above 0.821 MeV. Based on 2-D neutronics calculations for typical PWR assemblies, the fast flux values above 1 MeV, as required by ENIGMA, are taken to be 91% of the values above 0.821 MeV.
25 axial zones of equal length are modelled for consistency with the supplied power histories.

Not Protectively Marked
Page 41 of 82
NNL (12) 12172MFTC/P(2012)467
Issue 2
Not Protectively Marked
Results
Chemical burnup measurements were performed on fuel samples from 0.372 and 1.926 m above the bottom of rod TSQ002, and on a fuel sample from 1.930 m above the bottom of rod TSQ022. The predicted pellet average burnups at these locations (obtained by linearly interpolating the predicted axial zone burnup versus zone mid-height values) are 53.7, 57.8 and 63.5 MWd/kgHM, respectively††. These are all within 6% of the measured values of 53.6, 58.5 and 60.2 MWd/kgHM, which is considered reasonable given the uncertainties in the power history construction and in the chemical burnup measurements.
Fuel density measurements were performed on samples from 0.389, 1.915 and 1.938 m above the bottom of rod TSQ002, and on samples from 0.394 and 1.940 m above the bottom of rod TSQ022. The predicted pellet average densities at these locations (obtained by linearly interpolating the predicted axial zone density versus zone mid-height values) are 10.180, 10.153, 10.153, 10.119 and 10.079 g/cm3, respectively. The average measured sample densities (measurements were performed five times on each fuel sample) are 10.180, 10.164, 10.225, 10.155 and 10.148 g/cm3. The nominal as-manufactured density was 10.412 g/cm3 in all cases. The measured decreases in fuel density (or measured increases in fuel volume) are 2.2, 2.4, 1.8, 2.5 and 2.5%. The corresponding predicted decreases in fuel density are 2.2, 2.5, 2.5, 2.8 and 3.2%. Assuming that the measured and predicted fuel densities can be compared on a like-by-like basis, i.e. assuming that the fuel samples are representative of the pellets as a whole at the same elevation, there is generally a good agreement between measurements and predictions. This implies that the combined effects of fuel densification and fuel swelling are generally well predicted.
The measured and predicted end-of-life clad oxide thicknesses for rod TSQ002 are plotted as a function of axial elevation in Figure 18. There is a good agreement between measurements and predictions in terms of both magnitude and axial trend. The maximum measured oxide thickness is 50 µm, while the maximum predicted oxide thickness is 70 µm. The measured oxide thicknesses for rod TSQ022 are slightly lower, with a peak value of 44 µm, but the predicted oxide thicknesses are very similar to those for rod TSQ002 (the maximum value is 68 µm). This is not of great concern, since it is probably just a result of uncertainties in the provided rod surface temperatures.
†† For each of the two rods there was a lack of information on the distance from the bottom of the rod to the
bottom of the fuel stack. The distances from the bottom of the fuel rod were therefore assumed to be equal to the distances from the bottom of the fuel stack, which should be a reasonable approximation. This same assumption was made for the clad diameter, clad oxide thickness, fuel density and fuel grain size measurements.
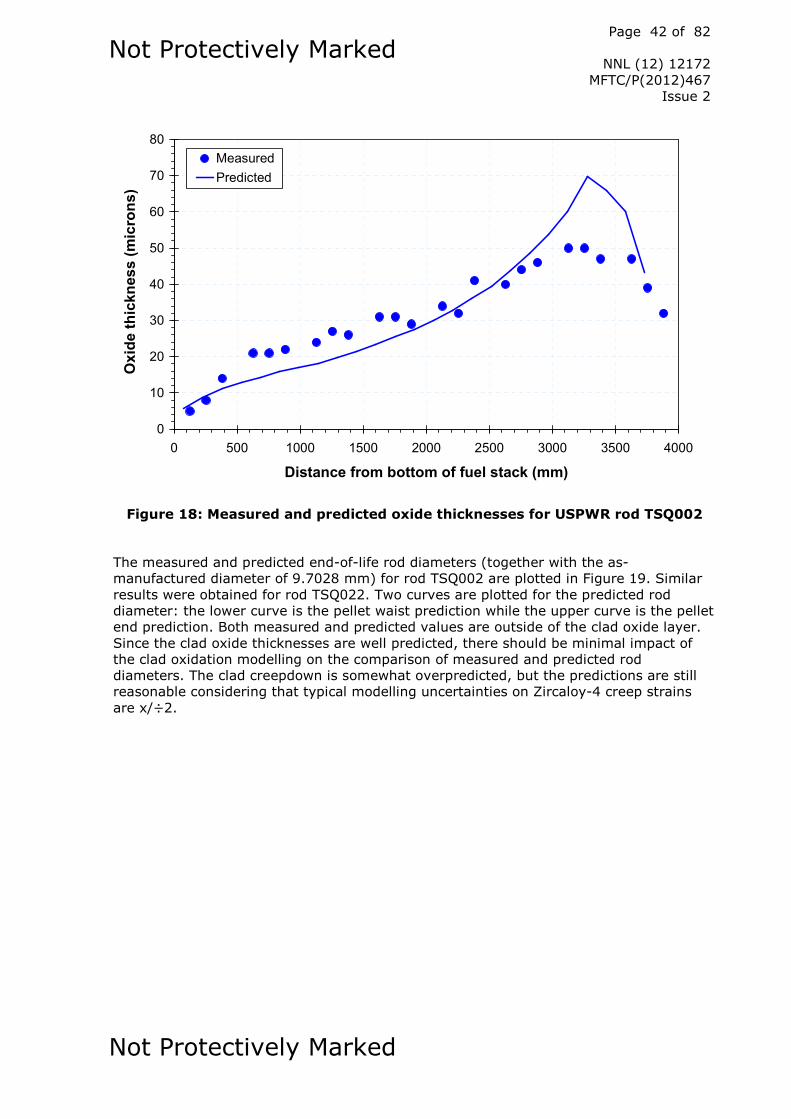
Not Protectively Marked
Page 42 of 82
NNL (12) 12172MFTC/P(2012)467
Issue 2
Not Protectively Marked
0
10
20
30
40
50
60
70
80
0 500 1000 1500 2000 2500 3000 3500 4000
Distance from bottom of fuel stack (mm)
Oxi
deth
ickn
ess
(mic
rons
)
MeasuredPredicted
Figure 18: Measured and predicted oxide thicknesses for USPWR rod TSQ002
The measured and predicted end-of-life rod diameters (together with the as-manufactured diameter of 9.7028 mm) for rod TSQ002 are plotted in Figure 19. Similar results were obtained for rod TSQ022. Two curves are plotted for the predicted rod diameter: the lower curve is the pellet waist prediction while the upper curve is the pellet end prediction. Both measured and predicted values are outside of the clad oxide layer. Since the clad oxide thicknesses are well predicted, there should be minimal impact of the clad oxidation modelling on the comparison of measured and predicted rod diameters. The clad creepdown is somewhat overpredicted, but the predictions are still reasonable considering that typical modelling uncertainties on Zircaloy-4 creep strains are x/÷2.

Not Protectively Marked
Page 43 of 82
NNL (12) 12172MFTC/P(2012)467
Issue 2
Not Protectively Marked
9.61
9.62
9.63
9.64
9.65
9.66
9.67
9.68
9.69
9.70
9.71
0 500 1000 1500 2000 2500 3000 3500 4000 4500
Distance from bottom of fuel stack (mm)
Rod
diam
eter
(mm
)
As-manufacturedMeasuredPredicted
Figure 19: Measured and predicted rod diameters for USPWR rod TSQ002
The predicted rod free volume at end of life is 18.4 cm3 for rod TSQ002 and 29.8 cm3 for rod TSQ022. These are to be compared to measured values of 17.8 and 31.0 cm3,respectively. The as-fabricated values are 25.4 and 37.2 cm3. The rod TSQ022 values are considerably larger than those for rod TSQ002; this is due to the annular nature of the fuel pellets in rod TSQ022. The measured and predicted reductions in rod free volume are 30% and 28% for rod TSQ002, and 17% and 20% for rod TSQ022. Thus, the measured reductions — due to the combined effect of fuel densification, fuel swelling, clad creepdown, rod growth, and other less important phenomena — are well predicted.
The predicted fuel centreline temperature (at stack mid-height) and predicted (rod average) fission gas release are plotted versus burnup in Figure 20 (rod TSQ002) and Figure 21 (rod TSQ022). Also included in the figures are the rod average rating histories. During each of the five cycles of irradiation, the rod average ratings are very similar for both rods. However, the predicted fuel centreline temperatures are significantly lower for rod TSQ022 than for rod TSQ002 (the difference is ~ 150°C at the highest ratings); this is due to the annular fuel pellets in rod TSQ022.

Not Protectively Marked
Page 44 of 82
NNL (12) 12172MFTC/P(2012)467
Issue 2
Not Protectively Marked
0
200
400
600
800
1000
1200
1400
1600
0 10 20 30 40 50 60
Rod average burnup (MWd/kgHM)
Tem
pera
ture
(°C
)
0
10
20
30
40
50
60
70
80
Rat
ing
(kW
/m),
FGR
(%)
Predicted fuel centreline temperatureHalden thresholdRod average ratingPredicted fission gas release
Figure 20: Fuel centreline temperature and fission gas release versus burnup for USPWR rod TSQ002
0
200
400
600
800
1000
1200
1400
1600
0 10 20 30 40 50 60 70
Rod average burnup (MWd/kgHM)
Tem
pera
ture
(°C
)
0
10
20
30
40
50
60
70
80
Rat
ing
(kW
/m),
FGR
(%)
Predicted fuel centreline temperatureHalden thresholdRod average ratingPredicted fission gas release
Figure 21: Fuel centreline temperature and fission gas release versus burnup for USPWR rod TSQ022
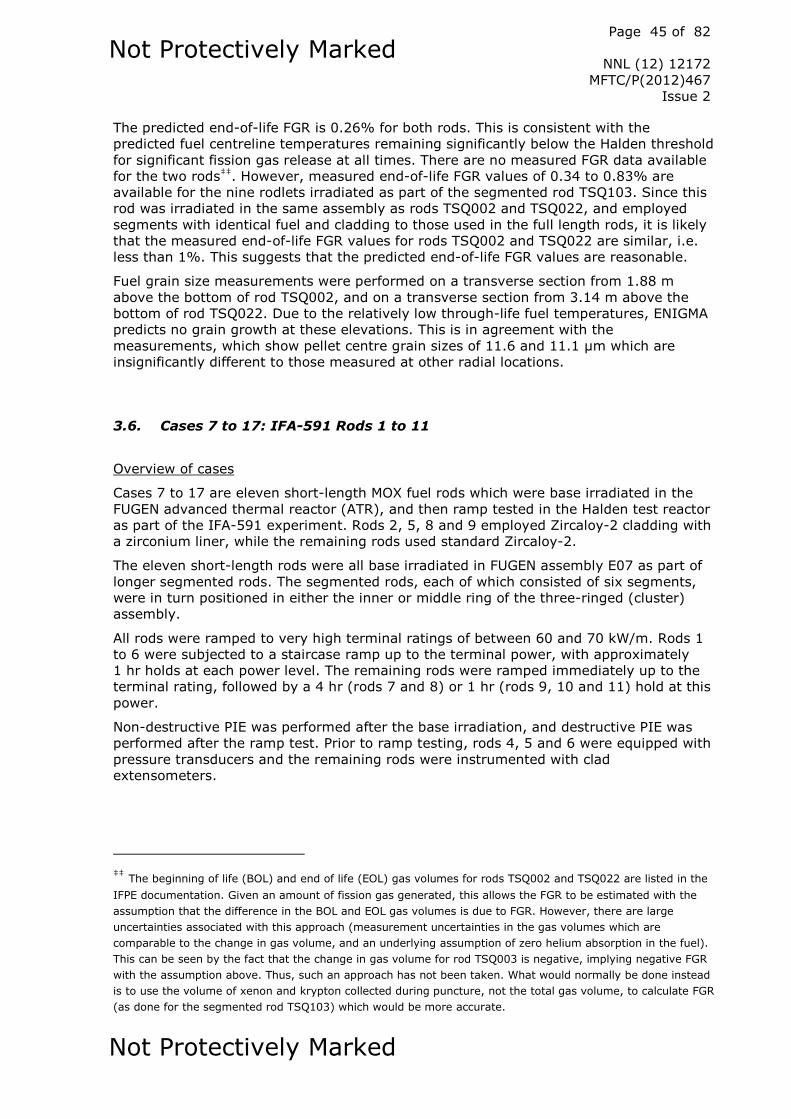
Not Protectively Marked
Page 45 of 82
NNL (12) 12172MFTC/P(2012)467
Issue 2
Not Protectively Marked
The predicted end-of-life FGR is 0.26% for both rods. This is consistent with the predicted fuel centreline temperatures remaining significantly below the Halden threshold for significant fission gas release at all times. There are no measured FGR data available for the two rods‡‡. However, measured end-of-life FGR values of 0.34 to 0.83% are available for the nine rodlets irradiated as part of the segmented rod TSQ103. Since this rod was irradiated in the same assembly as rods TSQ002 and TSQ022, and employed segments with identical fuel and cladding to those used in the full length rods, it is likely that the measured end-of-life FGR values for rods TSQ002 and TSQ022 are similar, i.e. less than 1%. This suggests that the predicted end-of-life FGR values are reasonable.
Fuel grain size measurements were performed on a transverse section from 1.88 m above the bottom of rod TSQ002, and on a transverse section from 3.14 m above the bottom of rod TSQ022. Due to the relatively low through-life fuel temperatures, ENIGMA predicts no grain growth at these elevations. This is in agreement with the measurements, which show pellet centre grain sizes of 11.6 and 11.1 µm which are insignificantly different to those measured at other radial locations.
3.6. Cases 7 to 17: IFA-591 Rods 1 to 11
Overview of cases
Cases 7 to 17 are eleven short-length MOX fuel rods which were base irradiated in the FUGEN advanced thermal reactor (ATR), and then ramp tested in the Halden test reactor as part of the IFA-591 experiment. Rods 2, 5, 8 and 9 employed Zircaloy-2 cladding with a zirconium liner, while the remaining rods used standard Zircaloy-2.
The eleven short-length rods were all base irradiated in FUGEN assembly E07 as part of longer segmented rods. The segmented rods, each of which consisted of six segments, were in turn positioned in either the inner or middle ring of the three-ringed (cluster) assembly.
All rods were ramped to very high terminal ratings of between 60 and 70 kW/m. Rods 1 to 6 were subjected to a staircase ramp up to the terminal power, with approximately 1 hr holds at each power level. The remaining rods were ramped immediately up to the terminal rating, followed by a 4 hr (rods 7 and 8) or 1 hr (rods 9, 10 and 11) hold at this power.
Non-destructive PIE was performed after the base irradiation, and destructive PIE was performed after the ramp test. Prior to ramp testing, rods 4, 5 and 6 were equipped with pressure transducers and the remaining rods were instrumented with clad extensometers.
‡‡ The beginning of life (BOL) and end of life (EOL) gas volumes for rods TSQ002 and TSQ022 are listed in the
IFPE documentation. Given an amount of fission gas generated, this allows the FGR to be estimated with the assumption that the difference in the BOL and EOL gas volumes is due to FGR. However, there are large uncertainties associated with this approach (measurement uncertainties in the gas volumes which are comparable to the change in gas volume, and an underlying assumption of zero helium absorption in the fuel). This can be seen by the fact that the change in gas volume for rod TSQ003 is negative, implying negative FGR with the assumption above. Thus, such an approach has not been taken. What would normally be done instead is to use the volume of xenon and krypton collected during puncture, not the total gas volume, to calculate FGR (as done for the segmented rod TSQ103) which would be more accurate.

Not Protectively Marked
Page 46 of 82
NNL (12) 12172MFTC/P(2012)467
Issue 2
Not Protectively Marked
Measured data
Measured data are available from three sources: (a) the post-base irradiation PIE; (b) the rod instrumentation (during the Halden irradiation only); (c) the post-Halden irradiation PIE.
With respect to (a), the data include fuel stack length change (from gamma scanning) and clad diameter change (from profilometry) for all eleven rods. However, the segment numbering for the fuel stack length change data is inconsistent with that documented elsewhere, meaning that assigning the length change measurements to specific rods is problematic. The fuel stack length change data are therefore ignored. The clad diameter change measurements cover the whole length of the segments, including end fittings, but with no indication of where the fuelled regions of each of the rods lie. To calculate appropriate rod average clad diameter change values, the following procedure was followed: (i) the change in diameter from the initial value (14.5 mm) is determined at each axial position; (ii) values that lie outside the range 0 to -100 µm are ignored; (iii) the average of the remaining values is determined. This procedure is clearly not rigorous, but hopefully provides a reasonable estimate of the average diameter change against which ENIGMA’s predictions can be compared.
With respect to (b), the data consist of rod internal pressure for rods 4, 5 and 6 (from pressure transducer measurements), and rod length change for the remaining rods (from clad elongation measurements).
With respect to (c), the data include: chemical burnup measurements (on transverse cross-sections, giving pellet average values); rod free volume, rod internal pressure, and fission gas release (from rod puncture); retained gas measurements (on a number of micro-drilled samples); and clad oxide thickness. All data are for the subset of rods subjected to destructive PIE, that is rods 1, 2, 3, 7, 8, 9 and 10. Given the fission gas release results from rod puncture, the retained gas measurements are not considered further.
Each measured percentage fission gas release value is calculated by dividing the measured mass of xenon and krypton (obtained from mass spectrometry of the rod free volume gas inventory) by the estimated mass of xenon and krypton generated [42]. However, inspection of Table 9-2 in the JAEA report [42] shows that there are significant errors in the estimated masses of xenon and krypton generated; in particular, the estimated masses for the higher burnup rods 3 and 10 are almost identical to those for the remaining lower burnup rods, when they should be significantly higher. Thus, the measured volumes (at 0°C and atmospheric pressure) of xenon and krypton from the mass spectrometry were instead compared to volumes (at 0°C and atmospheric pressure) of xenon and krypton generated as calculated by ENIGMA to determine corrected measured percentage fission gas release values. Since ENIGMA has a sophisticated fission gas generation model (which calculates through-life fission yields of 135Xe and of each of the stable fission gas isotopes from each of the fissile heavy metal isotope parents, together with neutron capture of radioactive 135Xe to form stable 136Xe) this should give accurate results.

Not Protectively Marked
Page 47 of 82
NNL (12) 12172MFTC/P(2012)467
Issue 2
Not Protectively Marked
Modelling considerations
The supplied power histories for each rod, both for the base irradiation in FUGEN and the ramp testing in Halden, are specified in terms of the average rating and the peak rating for each timestep. Therefore, for representation in ENIGMA, one long axial zone is used to model the average condition, with a short second zone used to model the peak condition. With the rods being of short length — the active stack length is 365 mm [42] — a finer level of axial zoning is not required. In order to avoid significantly altering the rod average powers, the short axial zone is modelled as 5 mm in length, with the long axial zone length set to the remaining active stack length of 360 mm.
The radial power profile and helium generation modelling in ENIGMA uses microscopic cross-sections and other parameters calculated for commercial PWRs, commercial BWRs, or the Halden test reactor. Since FUGEN was a heavy water moderated, light water cooled, pressure tube boiling water reactor, it does not fit into any of these three categories. However, the neutronics characteristics are most strongly influenced by the moderator material. The radial power profile and helium generation modelling were therefore performed assuming a Halden test reactor neutron spectrum.
The cladding for rods 2, 5, 8 and 9 consisted of Zircaloy-2 with a zirconium liner. Since ENIGMA has no specific models for liner cladding, it was instead modelled as Zircaloy-2 with a thickness equal to the combined base material plus liner thicknesses.
The as-manufactured grain size is not given in the IFPE documentation. However, etched ceramography images from the post-Halden irradiation PIE are provided [42]. Taking the pellet rim section (c1) from Figure 9-11.67 of the JAEA report [42] — where there should have been negligible grain growth — and drawing three lines through the clearly defined grains in the bottom left quadrant, gave linear intercept grain sizes of 6.8, 6.7 and 5.1 µm. Taking the initial two values as typical, an as-manufactured mean linear intercept (MLI) grain size of 7 µm was assumed.
Three source powders — namely a 50:50 UO2-PuO2 mix, raw UO2, and recycled scrap MOX — were blended and milled to create the press-feed powder for the MOX fuel. Three different lots of the 50:50 powder were used. Since the scrap made up only ~ 14 wt% of the finished material [42], and taking lot 85AM0033 as representative of the 50:50 powder, the plutonium and americium isotopics were taken as those of the lot 85AM0033 powder. The isotopics were then adjusted to take account of aging (i.e. decay of 241Pu to 241Am) prior to irradiation. The total plutonium content of the fuel is not documented. However, a value of 4 wt% can be derived from the fissile content of 3.71% [42].
Typical ATR coolant temperatures are 279-286°C [42]. In the absence of further information, the bulk coolant temperature was set to 286°C for all axial zones of all rods, and the rod surface temperatures were calculated from the bulk coolant temperatures and the Jens-Lottes heat transfer correlation [43].
A Halden pre-conditioning period of five days at 25 kW/m was planned prior to each ramp test [42]. Details of this pre-conditioning phase do not appear in the supplied irradiation histories. However, there is no indication that the conditioning phase was not carried out as planned, and therefore an additional step is added to each case; in the absence of more specific information, 120 hours at rod average and peak axial ratings of 25 kW/m is assumed.

Not Protectively Marked
Page 48 of 82
NNL (12) 12172MFTC/P(2012)467
Issue 2
Not Protectively Marked
Results
The predicted rod average fuel centreline temperatures during the base irradiation are ~ 1000°C for rods 3, 6, 10 and 11, which were base irradiated in the middle ring of FUGEN assembly E07 at ~ 20 kW/m, and ~ 800°C for the remaining rods, which were base irradiated in the inner ring of E07 at ~ 15 kW/m. Since the maximum base irradiation burnup was 22 MWd/kgU, the temperatures remain significantly below the Halden threshold for significant fission gas release for all rods. The predicted fission gas release during the base irradiation is therefore negligible in all cases.
The measurements (M) and predictions (P) of rod average clad diameter change (in microns) at the time of the post-base irradiation PIE are listed in Table 3.
Table 3: Measured and predicted rod average clad diameter changes (in microns) after base irradiation of IFA-591 rods
Rod 1 2 3 4 5 6 7 8 9 10 11
M -59.9 -65.8 -57.5 -56.6 -67.2 -56.0 -52.7 -68.7 -63.8 -59.5 -53.9
P -35.3 -35.3 -36.6 -37.2 -37.2 -38.6 -37.2 -33.7 -37.8 -36.6 -38.6
The extent of clad creepdown is underpredicted by a similar amount for all rods. In addition, since the liner in rods 2, 5, 8 and 9 is not modelled, the measured enhancement in clad creepdown for these rods is not reproduced. With respect to the rods that employed standard Zircaloy-2 cladding, the predicted diameter changes are within x/÷2 of the measured values, and are therefore within the envelope of typical clad strain modelling uncertainties, which is of this same magnitude.
The predicted rod average fuel centreline temperature and (rod average) fission gas release versus time during the IFA-591 ramping of rod 5 are plotted in Figure 22 (there was no fission gas release measurement for this rod). The rod was subjected to a staircase power ramp, as illustrated in Figure 22. The results for the other five rods experiencing a staircase power ramp (1, 2, 3, 4 and 6) were similar.
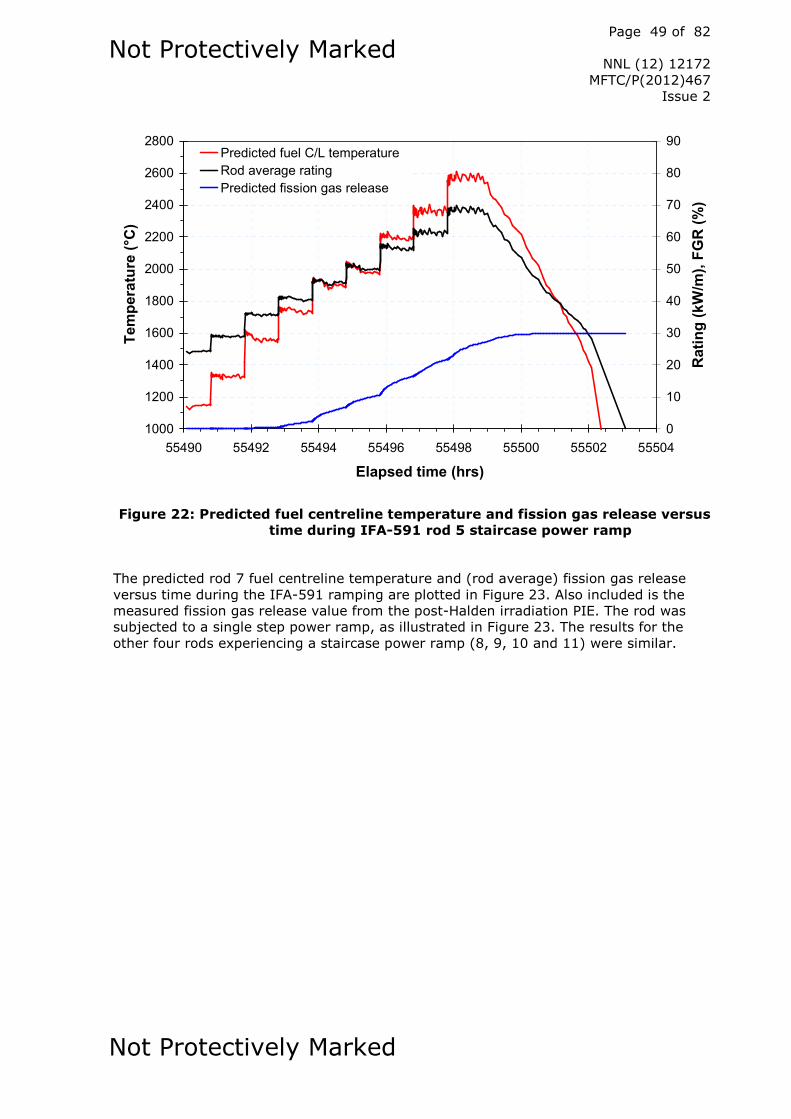
Not Protectively Marked
Page 49 of 82
NNL (12) 12172MFTC/P(2012)467
Issue 2
Not Protectively Marked
1000
1200
1400
1600
1800
2000
2200
2400
2600
2800
55490 55492 55494 55496 55498 55500 55502 55504
Elapsed time (hrs)
Tem
pera
ture
(°C
)
0
10
20
30
40
50
60
70
80
90
Rat
ing
(kW
/m),
FGR
(%)
Predicted fuel C/L temperatureRod average ratingPredicted fission gas release
Figure 22: Predicted fuel centreline temperature and fission gas release versus time during IFA-591 rod 5 staircase power ramp
The predicted rod 7 fuel centreline temperature and (rod average) fission gas release versus time during the IFA-591 ramping are plotted in Figure 23. Also included is the measured fission gas release value from the post-Halden irradiation PIE. The rod was subjected to a single step power ramp, as illustrated in Figure 23. The results for the other four rods experiencing a staircase power ramp (8, 9, 10 and 11) were similar.

Not Protectively Marked
Page 50 of 82
NNL (12) 12172MFTC/P(2012)467
Issue 2
Not Protectively Marked
1000
1200
1400
1600
1800
2000
2200
2400
2600
2800
55490 55492 55494 55496 55498 55500
Elapsed time (hrs)
Tem
pera
ture
(°C
)
0
10
20
30
40
50
60
70
80
90
Rat
ing
(kW
/m),
FGR
(%)
Predicted fuel C/L temperatureRod average ratingPredicted fission gas releaseMeasured fission gas release
Figure 23: Predicted fuel centreline temperature and fission gas release versus time during IFA-591 rod 7 single step power ramp
It can be seen that for both staircase and single step power ramps the maximum predicted fuel centreline temperatures are very high; the range for all eleven rods is approximately 2350 to 2600°C.
Of the three rods (4, 5 and 6) equipped with pressure transducers during the IFA-591 re-irradiation, the measured and predicted evolution of rod internal pressure with time for rod 5 is illustrated in Figure 24. The results for the other two rods were similar. It can be seen that the pressure evolution is generally well predicted, with good agreement between measurements and predictions of start of ramp and end of ramp pressures. The increases in diffusional gas release after each power step are evident in both the measured and predicted trends. The predicted increases in pressure over the last three power levels are only wholly measured once the rating decreases after the final power level. This suggests that fission gas was released from the fuel during the final three power levels, but that it was trapped in fuel cracks and/or the fuel-clad gap due to the high hydrostatic stresses at the high powers, and was therefore not available to be registered by the pressure transducer.
Not Protectively Marked
Page 51 of 82
NNL (12) 12172MFTC/P(2012)467
Issue 2
Not Protectively Marked
0.4
0.6
0.8
1
1.2
1.4
1.6
1.8
2
55490 55492 55494 55496 55498 55500 55502 55504
Elapsed time (hrs)
Pres
sure
(MPa
)
0
10
20
30
40
50
60
70
80
Rat
ing
(kW
/m)
Predicted rod internal pressureMeasured rod internal pressureRod average rating
Figure 24: Measured and predicted rod internal pressure versus time during IFA-591 rod 5 staircase power ramp
Of the remaining eight rods which were equipped with clad extensometers during the IFA-591 re-irradiation, the measured and predicted evolution of clad elongation with time for rod 1 is illustrated in Figure 25. This rod was subjected to a staircase power ramp. The results for the other two clad extensometer equipped rods experiencing a staircase power ramp (2 and 3) were similar. Measured clad elongations for rod 9 are unreliable [42]. Of the remaining four rods subjected to a single step power ramp (7, 8, 10 and 11), measured clad elongations are only available at the terminal rating levels. Furthermore, the initial measurements at the terminal rating level are of the order of -1.3 to -2 mm, indicating that the absolute clad elongation values are unrealistic. Hence, the clad elongation of the five rods subjected to a single step ramp is not considered further here.

Not Protectively Marked
Page 52 of 82
NNL (12) 12172MFTC/P(2012)467
Issue 2
Not Protectively Marked
-0.1
0
0.1
0.2
0.3
0.4
0.5
0.6
0.7
55490 55492 55494 55496 55498 55500 55502 55504 55506
Elapsed time (hrs)
Cla
del
onga
tion
(mm
)
0
10
20
30
40
50
60
70
80
Rat
ing
(kW
/m),
Gap
(µm
)
Predicted clad elongationMeasured clad elongationRod average ratingPredicted diametral gap size
Figure 25: Measured and predicted clad elongation versus time during IFA-591 rod 1 staircase power ramp
ENIGMA significantly underpredicts the extent of clad elongation during the staircase power ramps. The main reason for this is that the code predicts the fuel-clad gap to remain open until fairly high powers are reached in the ramp, as illustrated in Figure 25, whereas the measured data suggest that the gap is closed from the first power step onwards (the increases in clad elongation during each power step due to clad thermal expansion are small, as can be seen by the small increases in predicted elongation during the first five power steps in Figure 25). Part of the reason for the overprediction of the gap closure power is the underprediction of clad creepdown during the base irradiation, as shown above. It should also be noted that ENIGMA is not currently validated against in-pile clad length change data, so the predictions of at-power clad length change are not well qualified.
The measurements and predictions of post-ramping rod average burnup, fission gas release (FGR), rod internal pressure (RIP) and rod free volume (Vfree) for all rods subjected to PIE are summarised in Table 4. The as-manufactured rod internal pressure was 0.3 MPa in all cases. The measured FGR values are the corrected values described above under ‘Measured data’.

Not Protectively Marked
Page 53 of 82
NNL (12) 12172MFTC/P(2012)467
Issue 2
Not Protectively Marked
Table 4: Measurements and predictions of burnup, fission gas release, rod internal pressure and rod free volume after ramping of IFA-591 rods
Rod 1 2 3 7 8 9 10
M burnup (MWd/kgHM) 16.5 16.5 21.8 16.4 16.1 18.8 23.8
P burnup (MWd/kgHM) 15.7 15.7 21.3 16.5 15.0 16.7 21.3
M FGR (%) 41.0 39.1 34.2 46.6 37.3 37.1 28.6
P FGR (%) 26.1 27.2 27.2 30.9 27.0 22.0 21.9
M RIP (MPa) 0.93 0.93 1.09 0.98 0.87 0.91 0.93
P RIP (MPa) 0.74 0.75 0.93 0.85 0.74 0.69 0.81
M Vfree (cm3) 11.59 11.38 11.40 10.48 11.18 11.87 11.46
P Vfree (cm3) 12.52 12.52 12.46 12.51 12.51 12.71 12.46
The predicted burnups are in good agreement with the measured values (within 5%) for rods 1, 2, 3 and 7. The discrepancies are larger for rod 8 (7%) and for rods 9 and 10 (11%); this is assumed to be due to a combination of uncertainties in the base irradiation rod average powers, the lack of modelling of an axial power profile, and uncertainties in the chemical burnup measurements.
The FGR is underpredicted for all seven rods. However, all predictions are within a factor of two of the corresponding measurements, and are therefore reasonable (since x/÷2 is a typical modelling uncertainty on FGR). The measured end-of-life rod internal pressures are similarly underpredicted, and the end-of-life rod free volumes are overpredicted. However, the degree of overprediction of the rod free volumes is not uncommon given the uncertainties in the initial values assumed, and the degree of underprediction of the rod internal pressures is approximately consistent with the degree of underprediction of FGR and of overprediction of rod free volume.
The underprediction of FGR for all seven rods is somewhat surprising given the good agreement between measured and predicted in-pile rod internal pressures for rods 4, 5 and 6 (which were not subjected to PIE). However, the prediction of at-power rod internal pressure depends on the calculation of at-power rod free volume components and their corresponding gas temperatures in addition to the calculation of FGR, so the accuracy of the at-power rod internal pressure predictions would not necessarily be expected to be the same as the accuracy of the fission gas release predictions.
For each of the rods subjected to post-ramp PIE, the clad oxide thickness was measured at four angular orientations for each of two axial locations [42]. Uniform oxide layer thicknesses were small, with typical values of 2 µm and a maximum value of 6 µm. This is as predicted by ENIGMA, where the predicted oxide thickness is 1.9 µm for all rods. Nodular corrosion was also observed, with oxide thicknesses over 30 µm in some cases, but, since ENIGMA has no model for nodular corrosion, these measurements cannot be used to validate the code.

Not Protectively Marked
Page 54 of 82
NNL (12) 12172MFTC/P(2012)467
Issue 2
Not Protectively Marked
3.7. Case 18: OSIRIS Rod J12-5
Overview of case
This is a section of a segmented parent rod (J12) irradiated for two cycles in the Gravelines-5 PWR (August 1988 to June 1990) and then ramp tested in the ISABELLE 1 loop of the OSIRIS test reactor (February 1996). There was no rod instrumentation during either the base irradiation or the re-irradiation. Non-destructive PIE was performed after the base irradiation, while both non-destructive and destructive PIE were carried out after the re-irradiation. The cladding material was Zircaloy-4 (which was assumed to be standard, i.e. non-optimised).
Measured data
The measured data from the post-re-irradiation PIE are as follows: rod free volume, volumes of helium, xenon and krypton, fission gas release, Xe/Kr ratio and fission gas isotopics (from rod puncture); external and internal clad oxide thicknesses (from metallography); rod diameter as a function of height (from profilometry); fuel grain size and radial fuel-clad gap (from ceramography). The pre-ramp rod diameter as a function of height is also provided.
Due to the as-modelled plenum volume setting (see below under ‘Modelling considerations’) the measured rod free volume cannot be used to validate the ENIGMA modelling.
Modelling considerations
Nine axial zones (with zone lengths as documented) were modelled for consistency with the provided power history.
The as-manufactured fuel grain size ranges from 10 to 11 µm in the fuel periphery, from 8.4 to 9.2 µm in the mid-pellet region, and from 8.5 to 9.2 µm in the pellet centre. These are assumed to be MLI values. The mean of the upper and lower bounds of all three ranges, i.e. 9.4 µm, is used as the (MLI) grain size input to ENIGMA (where radial variations in initial fuel grain size cannot be modelled).
In the absence of further information, the fast flux per unit rating during the base irradiation is taken to be the provided ‘fourth cycle’ value of 4.8x10¹¹ n/cm2/s per W/cm in a 900 MWe French PWR. The fast flux per unit rating during the OSIRIS irradiation is assumed to be 4.2x10¹⁰ n/cm2/s per W/cm, based on the 8.9x10¹² n/cm2/s fast flux value at the bottom of the active fuel stack at a local power of 210 W/cm [44].
The as-manufactured (upper) plenum volume was not defined, and could not be reliably estimated from the rod drawing [45] given the presence of the plenum spring and what appears to be a getter tube. This parameter was therefore set to the value of 2.74 cm3
which gives a predicted end-of-life rod free volume equal to the measured value of 3.38 cm3.
No data were provided for the geometry of the pellet chamfers. The pellets were therefore modelled as chamferless.

Not Protectively Marked
Page 55 of 82
NNL (12) 12172MFTC/P(2012)467
Issue 2
Not Protectively Marked
Results
The predicted fuel centreline temperature and the predicted (rod average) fission gas release during the base irradiation are plotted versus burnup in Figure 26. The behaviour versus time during the power ramp — with temperatures plotted at the peak power location — is illustrated in Figure 27. Also included in Figure 27 is the measured fission gas release value from the post-re-irradiation PIE.
The predicted FGR of 0.22% at the end of the base irradiation is consistent with the predicted fuel centreline temperature remaining below the Halden threshold for significant fission gas release at all times. The predicted end-of-life FGR of 1.43% is in good agreement (i.e. within a factor of two) of the measured value of 0.74%. The end-of-life Xe/Kr ratio is also well predicted: the measured value is 8.0, while 8.3 is predicted.
0
200
400
600
800
1000
1200
1400
1600
1800
0 5 10 15 20 25 30
Rod average burnup (MWd/kgHM)
Tem
pera
ture
(°C
)
0
10
20
30
40
50
60
70
80
90
Rat
ing
(kW
/m),
FGR
(%)
Predicted fuel centreline temperatureHalden thresholdRod average ratingPredicted fission gas release
Figure 26: Fuel centreline temperature and fission gas release versus burnup for the OSIRIS rod J12-5 base irradiation

Not Protectively Marked
Page 56 of 82
NNL (12) 12172MFTC/P(2012)467
Issue 2
Not Protectively Marked
0
200
400
600
800
1000
1200
1400
1600
1800
2000
0 5 10 15 20 25 30
Time since start of ramp (hrs)
Tem
pera
ture
(°C
)
0
10
20
30
40
50
60
70
80
90
100
Rat
ing
(kW
/m),
FGR
(%)
Predicted fuel centreline temperatureRod average ratingPredicted fission gas releaseMeasured fission gas release
Figure 27: Fuel centreline temperature and fission gas release versus time for the OSIRIS rod J12-5 power ramping
The measured and predicted pre- and post-ramp rod diameters are plotted in Figure 28. Also included in Figure 28 is the as-manufactured rod diameter of 9.5 mm. The predicted values are outside of the clad oxide layer, since it is assumed that the measured diameters have not been adjusted to remove the contribution from the oxide thickness. The lower post-ramp predicted curve is the pellet waist prediction, while the upper curve is the pellet end prediction (including the effects of clad ridging).

Not Protectively Marked
Page 57 of 82
NNL (12) 12172MFTC/P(2012)467
Issue 2
Not Protectively Marked
9.36
9.38
9.40
9.42
9.44
9.46
9.48
9.50
9.52
0 100 200 300 400 500
Distance from bottom of fuel stack (mm)
Rod
diam
eter
(mm
)
As-manufacturedPre-ramp: measuredPre-ramp: predictedPost-ramp: measuredPost-ramp: predicted
Figure 28: Measurements and predictions of pre- and post-ramp rod diameters for OSIRIS rod J12-5
The clad creepdown during the base irradiation is somewhat overpredicted, but the agreement between measurements and prediction is still reasonable (given typical clad creep strain modelling uncertainties of x/÷2). Although the measured axial profile of the post-ramp rod diameter at the pellet waist (the lower limit of the measured data) is qualitatively reproduced, the magnitudes of the measured diameters are underpredicted. However, this is mainly due to the underprediction of the post-base irradiation diameters (such that a significant fraction of the hold time during the ramp is taken up with creepout from the predicted post-base irradiation diameters to the measured post-base irradiation diameters) — the increase in diameter from pre-ramp to post-ramp conditions is well predicted. The measured ridge heights (the difference between the upper and lower limits of the measured data) are somewhat overpredicted, but the measured trend of an increase of ridge height from pre-ramp to post-ramp conditions is reproduced.
The measured post-ramp radial fuel-clad gap of 16 µm (at 234 to 244 mm from the bottom of the fuel stack) [46] compares to a predicted value of 27 µm. This is a relatively good agreement given the as-manufactured radial fuel-clad gap of 84 µm(although the cladding outer radius underprediction of ~ 10 µm implies that the net result of fuel densification and swelling is an underprediction of pellet radius of ~ 20 µm).
Given a non-physical decrease of measured fuel grain size at the pellet periphery of 2-3 µm (from the as-manufactured to post-ramp states), which can be interpreted as measurement uncertainty, the measured fuel grain sizes can be said to be unchanged at all radial locations during the fuel irradiation. This is supported by ENIGMA, which predicts no grain growth.
The measured inner and outer cladding oxide thicknesses were 3-9 µm and 11 µm, respectively. ENIGMA does not calculate clad oxidation at the clad inner wall and therefore there is no corresponding prediction of inner oxide thickness. The predicted outer oxide thickness is 7 µm, in good agreement with the measurement.

Not Protectively Marked
Page 58 of 82
NNL (12) 12172MFTC/P(2012)467
Issue 2
Not Protectively Marked
In conclusion, a small and entirely reasonable adjustment of the irradiation creep rate of the cladding to match measured and predicted pre-ramp rod diameters would mean that all measurements are very well predicted.
3.8. Case 19: M501 Rod D10
Overview of case
Case 19 is a full length commercial MOX rod irradiated in the Beznau-1 PWR for three cycles from August 1994 to September 1997. The rod, D10, was part of the M501 assembly, and was subjected to extensive pre-irradiation characterisation and post-irradiation PIE. Due to the commercial nature of the irradiation, there was no rod instrumentation. The cladding was low-tin Zircaloy-4.
Measured data
Measured data available in the IFPE dataset, all from the post-irradiation PIE, include: clad oxide thickness versus height (from eddy current testing); rod diameter versus height (from profilometry); gross gamma intensity versus height (from gamma scanning); fuel and cladding length change (from gamma scanning and mensuration, respectively); FGR, rod internal pressure, rod free volume, and fission gas isotopics (from rod puncture); fuel density (from an immersion technique); fuel burnup (from a chemical technique); and fuel grain size (from ceramography). Radial profiles of xenon and plutonium concentration (from EPMA) are also available from the open literature [47].
Modelling considerations
32 equal length axial zones were modelled for consistency with the provided power history.
Results
Chemical burnup measurements were performed on a fuel sample from 179-184 cm above the bottom of the rod. The predicted pellet average burnup at this location (obtained by linearly interpolating the predicted axial zone burnup versus zone mid-height values) is 38.9 MWd/kgHM§§. This is within 1% of the mean measured value of 38.5 MWd/kgHM, which is a good agreement given the uncertainties in the power history construction and in the chemical burnup measurements.
The measured and predicted end-of-life clad oxide thicknesses are plotted as a function of axial elevation in Figure 29. There is a good agreement between measurements and predictions in terms of both magnitude and axial trend. The maximum measured oxide thickness is 27 µm, while the maximum predicted oxide thickness is 31 µm.
§§ The rod length is 3202 mm and the length of empty cladding tube (prior to loading of the fuel pellets) is
3182 mm. Thus, assuming the top and bottom end plugs are of approximately equal length, the bottom end plug length is ~ (3202-3182)/2 = 10 mm. The chemical burnup sample is therefore at ~ 178-183 cm from the bottom of the fuel stack. The same reasoning was used to convert distances from the bottom of the fuel rod to distances from the bottom of the fuel stack for all further analysis.

Not Protectively Marked
Page 59 of 82
NNL (12) 12172MFTC/P(2012)467
Issue 2
Not Protectively Marked
0
5
10
15
20
25
30
35
0 500 1000 1500 2000 2500 3000 3500
Distance from bottom of fuel stack (mm)
Oxi
deth
ickn
ess
(mic
rons
)
MeasuredPredicted
Figure 29: Measured and predicted clad oxide thicknesses for M501 rod D10
The measured and predicted end-of-life rod diameters (together with the as-manufactured diameter of 10.724 mm) are plotted in Figure 30. Two curves are plotted for the predicted rod diameter: the lower curve is the pellet waist prediction while the upper curve is the pellet end prediction. Both measured and predicted values are outside of the clad oxide layer. Since the clad oxide thicknesses are well predicted, there should be minimal impact of the clad oxidation modelling on the comparison of measured and predicted rod diameters. The clad creepdown is well predicted, albeit with a slight tendency for overprediction in the central 2 m of the fuel stack.

Not Protectively Marked
Page 60 of 82
NNL (12) 12172MFTC/P(2012)467
Issue 2
Not Protectively Marked
10.60
10.62
10.64
10.66
10.68
10.70
10.72
10.74
0 500 1000 1500 2000 2500 3000 3500
Distance from bottom of fuel stack (mm)
Rod
diam
eter
(mm
)
As-manufacturedMeasuredPredicted
Figure 30: Measured and predicted rod diameters for M501 rod D10
The predicted rod free volume at end of life is 13.3 cm3. This is to be compared to a measured value of 12.1 cm3. The as-fabricated value is 19.5 cm3. The measured and predicted reductions in rod free volume are therefore 38% and 32% respectively. Thus, the measured reduction — due to the combined effect of fuel densification, fuel swelling, clad creepdown, rod growth, and other less important phenomena — is well predicted.
The predicted fuel centreline temperature (at stack mid-height) and predicted (rod average) fission gas release are plotted versus burnup in Figure 31. Also included in the figure are the rod average rating history and the measured FGR value from PIE.

Not Protectively Marked
Page 61 of 82
NNL (12) 12172MFTC/P(2012)467
Issue 2
Not Protectively Marked
0
200
400
600
800
1000
1200
1400
1600
1800
0 5 10 15 20 25 30 35 40
Rod average burnup (MWd/kgHM)
Tem
pera
ture
(°C
)
0
10
20
30
40
50
60
70
80
90
Rat
ing
(kW
/m),
FGR
(%)
Predicted fuel centreline temperatureHalden thresholdRod average ratingPredicted fission gas releaseMeasured fission gas release
Figure 31: Fuel centreline temperature and fission gas release versus burnup for M501 rod D10
The predicted end-of-life FGR is 0.8%. This is consistent with both the measured value of 1.1% and the fact that the predicted fuel centreline temperatures remained below the Halden threshold for significant fission gas release at all times. The predicted Xe/Kr ratio is 15.8, in good agreement with the measured value of 16.2.
The measured and predicted radial distributions of xenon concentration at 258-260 cm above the bottom of the fuel rod (specimen CT12) are plotted in Figure 32. The measurements are from EPMA [47] and represent matrix xenon concentrations [48]. The predictions are for matrix xenon (which can be compared directly to the measurements), unreleased (matrix plus gas bubble) xenon, and generated xenon. ENIGMA predicts negligible intragranular bubble swelling at the axial location of interest, so all xenon in gas bubbles is predicted to be in intergranular bubbles. Although the matrix xenon concentration towards the pellet centre is underpredicted, most of the fission gas released from the matrix is predicted to be accommodated in intergranular bubbles such that the local pellet average fission gas release is relatively low (0.9%). Thus, despite an apparent overprediction of the amount of fission gas in intergranular bubbles (at least at the axial elevation of the EPMA measurement), the local fission gas release appears to be well predicted, in agreement with the good prediction of the rod average fission gas release.

Not Protectively Marked
Page 62 of 82
NNL (12) 12172MFTC/P(2012)467
Issue 2
Not Protectively Marked
0
0.1
0.2
0.3
0.4
0.5
0.6
0.7
0.8
0 10 20 30 40 50 60 70 80 90 100
Radius (%age of pellet radius)
Xeco
ncen
trat
ion
(wt%
fuel
)
MeasuredPredicted: matrix XePredicted: generated XePredicted: unreleased Xe
Figure 32: Xenon concentration versus radius for M501 rod D10
The radial distribution of plutonium concentration was also measured by EPMA at the same axial location as the xenon concentration measurement. The measurements are compared to the corresponding predictions in Figure 33. Also included in Figure 33 is the initial plutonium content of 4.86 wt%fuel. The nett plutonium loss during irradiation (plutonium fissioned plus plutonium decayed minus plutonium generated) is slightly underpredicted, but the agreement between measurements and predictions is still good. The discretisation of the fuel pellets in ENIGMA into 15 equal thickness annuli is not sufficiently fine to allow a meaningful comparison of the measurements and predictions of the plutonium concentration peak (due to generation of 239Pu by epithermal neutron capture in 238U) close to the pellet surface.

Not Protectively Marked
Page 63 of 82
NNL (12) 12172MFTC/P(2012)467
Issue 2
Not Protectively Marked
0
1
2
3
4
5
6
0 10 20 30 40 50 60 70 80 90 100
Radius (%age of pellet radius)
Puco
ncen
trat
ion
(wt%
fuel
)
MeasuredPredictedAs-manufactured
Figure 33: Plutonium concentration versus radius for M501 rod D10
The predicted end-of-life rod internal pressure is 3.1 MPa. This compares to a measured value of 3.4 MPa and a rod fill pressure of 2.0 MPa. The good prediction of the pressure increase from beginning of life to end of life is consistent with the good prediction of FGR and rod free volume.
Fuel grain size measurements were performed on a transverse section from 170-172 cm above the bottom of the rod. Due to the relatively low through-life fuel temperatures, ENIGMA predicts no grain growth at this elevation (or at any other elevation). This is in agreement with the measurements, which show a pellet centre MLI grain size of 7.7 µmwhich is insignificantly different to those measured at the mid-radius and the fuel surface (7.5 and 6.6 µm, respectively).
The predicted end-of-life rod length change and fuel stack length change are +17.7 and +18.7 mm, respectively. These compare to measured values of +15.8 and +16.4 mm, respectively. Thus, both the rod length change and the fuel stack length change are well predicted.
Fuel density measurements were performed on samples from 172-175 cm and from 255-258 cm above the bottom of the rod. The predicted pellet average densities at these locations (obtained by linearly interpolating the predicted axial zone density versus zone mid-height values) are 10.378 and 10.397 g/cm3, respectively. The average measured sample densities (measurements were performed four times on each fuel sample) are 10.226 and 10.308 g/cm3. The as-manufactured density was 10.489 g/cm3. The measured decreases in fuel density (or measured increases in fuel volume) are 2.5 and 1.7%. The corresponding predicted decreases in fuel density are 1.1 and 0.9%. The measurements and predictions should be comparable on a like-by-like basis, since fuel fragments representative of whole pellets were used in the measurements.
The fuel density data indicate that there is an overprediction of fuel densification and/or an underprediction of fuel swelling. However, this is contradicted by the good agreement
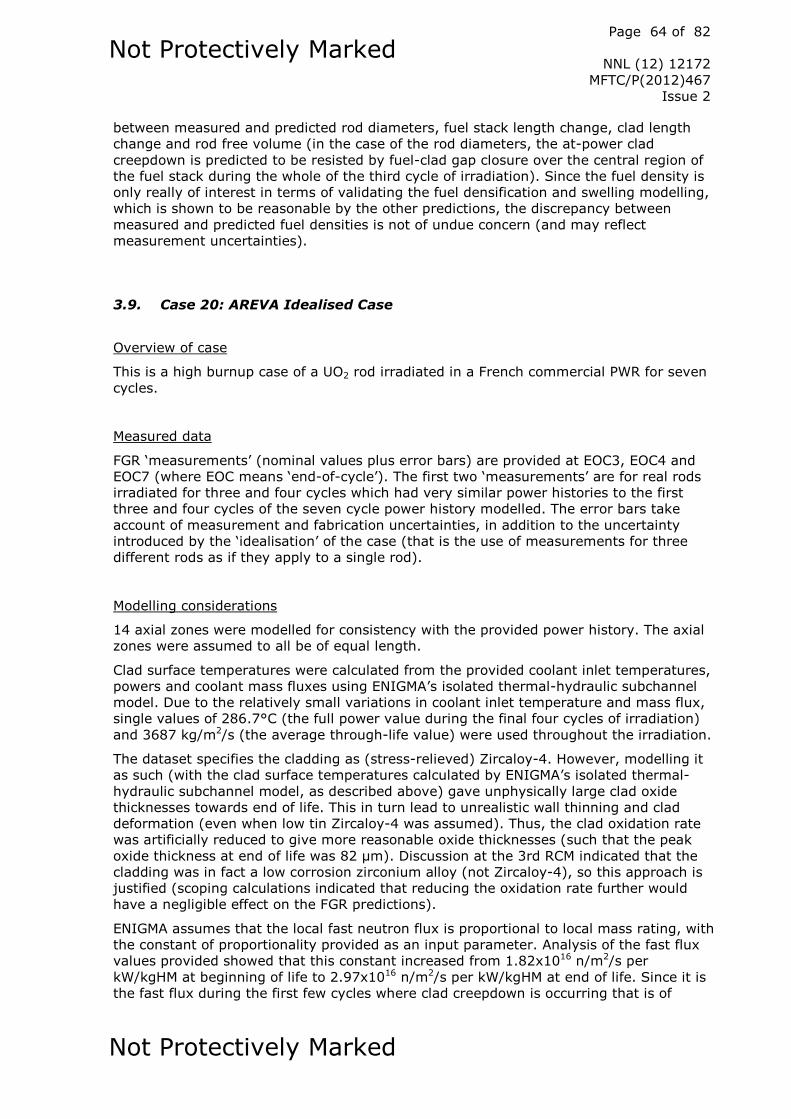
Not Protectively Marked
Page 64 of 82
NNL (12) 12172MFTC/P(2012)467
Issue 2
Not Protectively Marked
between measured and predicted rod diameters, fuel stack length change, clad length change and rod free volume (in the case of the rod diameters, the at-power clad creepdown is predicted to be resisted by fuel-clad gap closure over the central region of the fuel stack during the whole of the third cycle of irradiation). Since the fuel density is only really of interest in terms of validating the fuel densification and swelling modelling, which is shown to be reasonable by the other predictions, the discrepancy between measured and predicted fuel densities is not of undue concern (and may reflect measurement uncertainties).
3.9. Case 20: AREVA Idealised Case
Overview of case
This is a high burnup case of a UO2 rod irradiated in a French commercial PWR for seven cycles.
Measured data
FGR ‘measurements’ (nominal values plus error bars) are provided at EOC3, EOC4 and EOC7 (where EOC means ‘end-of-cycle’). The first two ‘measurements’ are for real rods irradiated for three and four cycles which had very similar power histories to the first three and four cycles of the seven cycle power history modelled. The error bars take account of measurement and fabrication uncertainties, in addition to the uncertainty introduced by the ‘idealisation’ of the case (that is the use of measurements for three different rods as if they apply to a single rod).
Modelling considerations
14 axial zones were modelled for consistency with the provided power history. The axial zones were assumed to all be of equal length.
Clad surface temperatures were calculated from the provided coolant inlet temperatures, powers and coolant mass fluxes using ENIGMA’s isolated thermal-hydraulic subchannel model. Due to the relatively small variations in coolant inlet temperature and mass flux, single values of 286.7°C (the full power value during the final four cycles of irradiation) and 3687 kg/m2/s (the average through-life value) were used throughout the irradiation.
The dataset specifies the cladding as (stress-relieved) Zircaloy-4. However, modelling it as such (with the clad surface temperatures calculated by ENIGMA’s isolated thermal-hydraulic subchannel model, as described above) gave unphysically large clad oxide thicknesses towards end of life. This in turn lead to unrealistic wall thinning and clad deformation (even when low tin Zircaloy-4 was assumed). Thus, the clad oxidation rate was artificially reduced to give more reasonable oxide thicknesses (such that the peak oxide thickness at end of life was 82 µm). Discussion at the 3rd RCM indicated that the cladding was in fact a low corrosion zirconium alloy (not Zircaloy-4), so this approach is justified (scoping calculations indicated that reducing the oxidation rate further would have a negligible effect on the FGR predictions).
ENIGMA assumes that the local fast neutron flux is proportional to local mass rating, with the constant of proportionality provided as an input parameter. Analysis of the fast flux values provided showed that this constant increased from 1.82x10¹⁶ n/m2/s per kW/kgHM at beginning of life to 2.97x10¹⁶ n/m2/s per kW/kgHM at end of life. Since it is the fast flux during the first few cycles where clad creepdown is occurring that is of
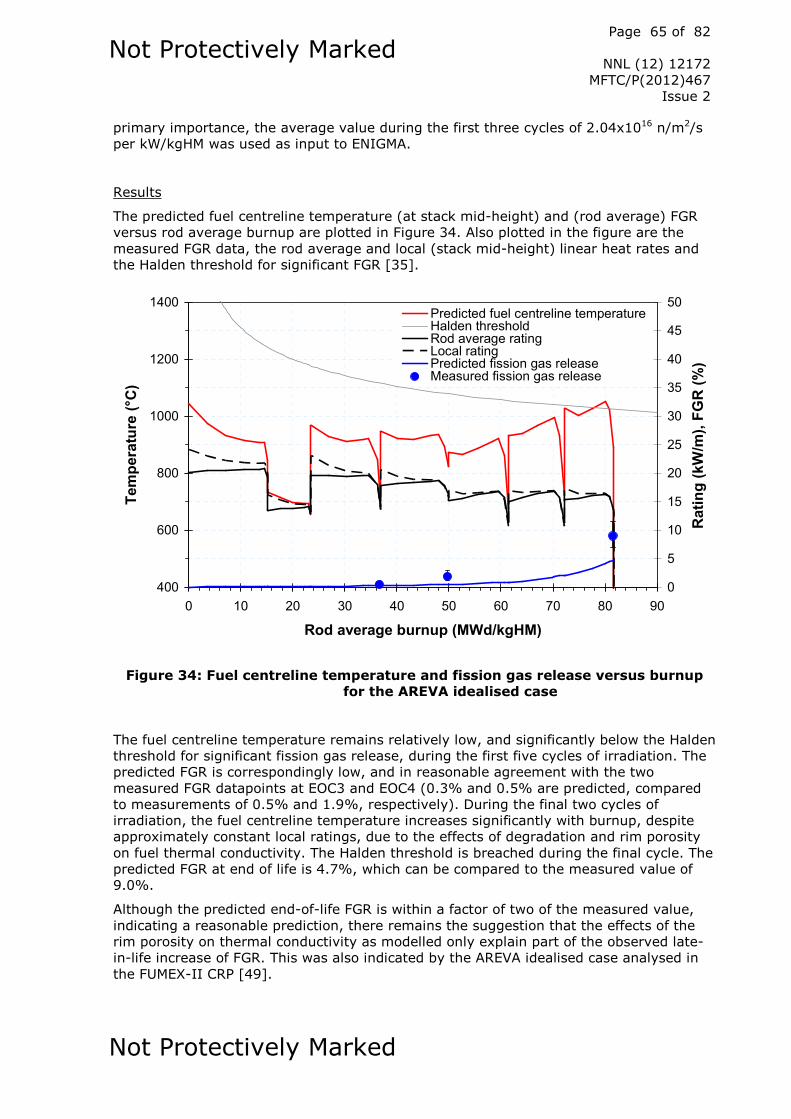
Not Protectively Marked
Page 65 of 82
NNL (12) 12172MFTC/P(2012)467
Issue 2
Not Protectively Marked
primary importance, the average value during the first three cycles of 2.04x10¹⁶ n/m2/s per kW/kgHM was used as input to ENIGMA.
Results
The predicted fuel centreline temperature (at stack mid-height) and (rod average) FGR versus rod average burnup are plotted in Figure 34. Also plotted in the figure are the measured FGR data, the rod average and local (stack mid-height) linear heat rates and the Halden threshold for significant FGR [35].
400
600
800
1000
1200
1400
0 10 20 30 40 50 60 70 80 90
Rod average burnup (MWd/kgHM)
Tem
pera
ture
(°C
)
0
5
10
15
20
25
30
35
40
45
50
Rat
ing
(kW
/m),
FGR
(%)
Predicted fuel centreline temperatureHalden thresholdRod average ratingLocal ratingPredicted fission gas releaseMeasured fission gas release
Figure 34: Fuel centreline temperature and fission gas release versus burnup for the AREVA idealised case
The fuel centreline temperature remains relatively low, and significantly below the Halden threshold for significant fission gas release, during the first five cycles of irradiation. The predicted FGR is correspondingly low, and in reasonable agreement with the two measured FGR datapoints at EOC3 and EOC4 (0.3% and 0.5% are predicted, compared to measurements of 0.5% and 1.9%, respectively). During the final two cycles of irradiation, the fuel centreline temperature increases significantly with burnup, despite approximately constant local ratings, due to the effects of degradation and rim porosity on fuel thermal conductivity. The Halden threshold is breached during the final cycle. The predicted FGR at end of life is 4.7%, which can be compared to the measured value of 9.0%.
Although the predicted end-of-life FGR is within a factor of two of the measured value, indicating a reasonable prediction, there remains the suggestion that the effects of the rim porosity on thermal conductivity as modelled only explain part of the observed late-in-life increase of FGR. This was also indicated by the AREVA idealised case analysed in the FUMEX-II CRP [49].

Not Protectively Marked
Page 66 of 82
NNL (12) 12172MFTC/P(2012)467
Issue 2
Not Protectively Marked
The predicted pellet rim thickness at end of life varies from 130 to 659 µm along the fuel stack length due to the axial burnup profile. The mean rim width is 554 µm. As for the FUMEX-II AREVA idealised case [49], the predicted rim widths, pellet edge burnups and rod average burnup at end of life were used to estimate the total amount of gas in the rim (in both the fuel matrix and rim porosity). The result is 38.5% of the total fission gas generated in the rod. This will be a maximum value, since the average burnup in the rim region will decrease further and further from the pellet edge burnup as the rim region increases in thickness. Nevertheless, it appears that modelling rim release could significantly improve the FGR underprediction at end of life. Assuming only 11% of the gas in the rim (as calculated above) is released would bring the predicted FGR into agreement with the measured value.

Not Protectively Marked
Page 67 of 82
NNL (12) 12172MFTC/P(2012)467
Issue 2
Not Protectively Marked
4. Review of phenomenological results
In this section the results of the FUMEX-III modelling are discussed on a phenomenological, rather than a case by case, basis. For the twenty FUMEX-III cases analysed, the majority of the measured data are for fission gas release and rod diameter. The discussion therefore focuses on fission gas release and clad diametral deformation (Sections 4.2 and 4.3); the former considers also the effects of grain growth. Since FGR is very sensitive to fuel temperature, measured and predicted fuel temperatures are first compared (Section 4.1). Brief discussion on the predictions for other phenomena is also included (Sections 4.4 to 4.8).
4.1. Fuel temperature
Fuel temperature was measured (using thermocouples) for only one case — Risø-3 rod II5 (Case 4) — and only during the re-irradiation after rod re-fabrication had occurred; the temperatures during the base irradiation were not measured. The measured thermocouple temperatures are underpredicted by ~ 100°C at all power levels. A similar underprediction of fuel temperatures for the Risø-3 rods AN3 and AN4 was observed in the FUMEX-II CRP [49], and the rod diameter and FGR predictions for Risø-3 rod GE7 also suggest that the temperatures are underpredicted for this rod. The measured and predicted thermocouple temperatures for the Risø rods could be brought into better agreement with an increase in the modelled fuel thermal conductivity degradation rate. However, the default rate is fixed to give a mean predicted minus measured fuel temperature of close to zero for all rods used in the degradation rate calibration exercise (which were exclusively rods irradiated in either the Risø or Halden test reactors). Thus, if the degradation rate was increased for every rod in the ENIGMA validation database, the net result would be a significant mean overprediction of measured temperature. Increasing the degradation rate cannot therefore be seen as a holistic solution to improving temperature predictions.
From above, it is expected that temperatures for Risø rods tend to be underpredicted, while temperatures for Halden rods tend to be well predicted. The accuracy of prediction of temperatures for other rods is necessarily subject to some uncertainty (since there are no temperature measurements to compare against the predictions) but is expected to be somewhere between that of the Halden and Risø rods.
4.2. Fission gas release
The measured FGR data from puncturing and the corresponding ENIGMA predictions are summarised in Table 5 (together with the predicted over measured, or P/M, FGR values). The measured FGR values are taken from Sections 3.1 to 3.9; other than the IFA-591 values, these are identical to those in the FUMEX-III datasets.

Not Protectively Marked
Page 68 of 82
NNL (12) 12172MFTC/P(2012)467
Issue 2
Not Protectively Marked
Table 5: Measured and predicted FGR values for FUMEX-III cases
Case Description Measured FGR (%)
Measurement corresponds to
Predicted FGR (%)
P/M FGR
1 PRIMO rod BD8 0.5 Base irradiation only* 0.6 1.2
11.2 Entire irradiation 6.4 0.57
2 Risø-3 rod GE7 0.3 Base irradiation only* 0.24 0.8
14.4 Entire irradiation 7.0 0.49
3 IFA-535.5 rod 809 20.9 Base irradiation only 24.6 1.18
51.0 Entire irradiation 44.3 0.87
4 Risø-3 rod II5 14 Base irradiation only# 16.2 1.16
24.6 Entire irradiation# 18.4 0.75
7 IFA-591 rod 1 41.0 Entire irradiation 26.1 0.64
8 IFA-591 rod 2 39.1 Entire irradiation 27.2 0.70
9 IFA-591 rod 3 34.2 Entire irradiation 27.2 0.80
13 IFA-591 rod 7 46.6 Entire irradiation 30.9 0.66
14 IFA-591 rod 8 37.3 Entire irradiation 27.0 0.72
15 IFA-591 rod 9 37.1 Entire irradiation 22.0 0.59
16 IFA-591 rod 10 28.6 Entire irradiation 21.9 0.77
18 OSIRIS rod J12-5 0.74 Entire irradiation 1.43 1.93
19 M501 rod D10 1.1 Entire irradiation 0.8 0.73
20 AREVA idealised 0.5 Cycles 1 to 3 0.3 0.6
1.9 Cycles 1 to 4 0.5 0.26
9.0 Entire irradiation 4.7 0.52
* For sibling rod(s)
# Base irradiation value or component is a mean estimated value
The general ‘rule of thumb’ is that a +/- 5% change in through-life powers gives a ×/÷ 2 change in end-of-life FGR. Since 5% is a typical uncertainty on power, a P/M FGR value between 0.5 and 2 can therefore be said to correspond to a satisfactory prediction. On this basis, the predictions as a whole (as summarised in Table 5) are satisfactory, with all but two P/M values within the 0.5 to 2 range. In particular, the steady-state (base irradiation only plus M501 rod D10 and AREVA idealised case) predictions are good with no clear tendency for under- or over-prediction. This is supported by Figure 35, which plots the entire irradiation P/M FGR versus rod average burnup values for the cases in Table 5 together with equivalent datapoints for all rods in the ENIGMA FGR validation database (with datapoints for rods included in FUMEX-III — that is PRIMO rod BD8, Risø-3 rods GE7 and II5, and M501 rod D10 — omitted). The figure shows that — despite a tendency for underprediction — the FUMEX-III datapoints are well within the scatter of the validation data; in fact, all are within one standard deviation of the combined FUMEX-III plus validation data.

Not Protectively Marked
Page 69 of 82
NNL (12) 12172MFTC/P(2012)467
Issue 2
Not Protectively Marked
0.01
0.1
1
10
100
0 10 20 30 40 50 60 70 80 90 100
Rod average burnup (MWd/kgHM)
Pred
icte
d/m
easu
red
FGR
Validation dataIFA-535.5 rod 809IFA-591AREVA idealised caseOSIRIS rod J12-5M501 rod D10PRIMO rod BD8Risø-3 rod GE7Risø-3 rod II5
Figure 35: P/M FGR versus burnup for FUMEX-III cases modelled and for all rods in the ENIGMA validation database with measured FGR data
The general conclusion in the previous paragraph is subject to two caveats: (i) as indicated by the AREVA idealised case, the FGR at high burnup may be underpredicted if and when a significant rim width develops, since ENIGMA does not model any FGR due to rim formation or to venting of rim porosity; (ii) as suggested by the ramped cases, the FGR in transient conditions may be underpredicted, since ENIGMA does not have an explicit transient release model (notwithstanding the underprediction of fuel temperatures for the Risø-3 cases noted in Section 4.1). There is no evidence from FUMEX-III that (ii) is due to the lack of modelling of grain boundary sweeping, since in all cases other than PRIMO rod BD8 where post-irradiation grain size was measured there was no significant grain growth either measured or predicted. In order to investigate (ii) further, the subset of P/M FGR data from Figure 35 which correspond to transient cases was plotted versus peak local rating. The result is Figure 36. The transient cases were those identified using the same criteria as in a previous analysis [50], namely cases where the rod was subjected to a definite end-of-life ramp test, but excluding ‘marginal’ cases where: (a) only small upratings were involved; (b) the uprating was followed by a substantial period of continuing irradiation (includes IFA-535.5 rod 809); (c) the peak local rating during the end-of-life ramp test is exceeded by the peak local rating during the base irradiation (includes Risø-3 rod II5); (d) there were two or more separate ramps of similar magnitude; (e) fuel was subjected to an extended period of high power operation during the later stages of life, but without a specific, short duration ramp test being performed.
Not Protectively Marked
Page 70 of 82
NNL (12) 12172MFTC/P(2012)467
Issue 2
Not Protectively Marked
0.1
1
10
0 10 20 30 40 50 60 70 80
Peak rating (kW/m)
Pred
icte
d/m
easu
red
FGR
Validation dataIFA-591OSIRIS rod J12-5PRIMO rod BD8Risø-3 rod GE7
Figure 36: P/M FGR versus peak local rating for transient cases
Figure 36 does not indicate any clear trend for an underprediction of FGR for transient cases; nor does it indicate any trend in P/M FGR with peak local rating. However, the underlying mean P/M FGR of 0.83 does suggest some underprediction of FGR, albeit a reasonably small one. Replotting the data versus rod average burnup, transient duration, and peak rating in ramp minus peak rating in base irradiation also did not reveal any obvious trends in the data. Despite excluding cases where the peak local rating during the end-of-life ramp test is exceeded by the peak local rating during the base irradiation, there still remain a significant number of cases for which the base irradiation FGR would be expected to be a significant proportion of the total FGR, thereby masking any underprediction in transient FGR. Thus, a further ‘filter’ was applied to the P/M FGR datapoints plotted to exclude points where the predicted FGR in the base irradiation is greater than a fixed fraction, f, of the total measured FGR. (A better filter would be to exclude points where the measured FGR in the base irradiation is greater than a fixed fraction of the total measured FGR, but this is not possible because in many cases the base irradiation FGR is either not measured or is not available.) In a compromise between not excluding too many datapoints and not allowing too high a value of f, the fixed fraction was set to 25% (which excludes the OSIRIS rod J12-5 point). The resulting plot is reproduced in Figure 37. Unlike Figure 36, this plot does seem to indicate that FGR is generally underpredicted during transients (although there is still no clear trend with peak local rating); the underlying mean P/M FGR is 0.71, compared to 0.83 before application of the filter.

Not Protectively Marked
Page 71 of 82
NNL (12) 12172MFTC/P(2012)467
Issue 2
Not Protectively Marked
0.1
1
10
0 10 20 30 40 50 60 70 80
Peak rating (kW/m)
Pred
icte
d/m
easu
red
FGR
Validation dataIFA-591PRIMO rod BD8Risø-3 rod GE7
Figure 37: P/M FGR versus peak local rating for transient cases where predicted FGR during base irradiation < 25% of the total measured FGR
It can be concluded that the possible inclusion in ENIGMA of a transient (or burst) release model and a rim release model is investigated in any future development. With respect to the former, the EPMA and XRF data for Risø-3 rod II5 imply that it is release from the mid-regions of the pellets which is underpredicted, while the XRF data for Risø-3 rod GE7 suggest that there may also be an underprediction of gas release from the central regions of the pellets over and above that due to the inferred underprediction of fuel temperatures.
4.3. Clad diametral deformation
Clad diametral deformation at pellet waist elevations is due to clad creepdown at low burnups prior to fuel-clad contact and clad creepout (including any effects of instantaneous plasticity) at higher burnups once fuel-clad contact has occurred. Additional deformation, i.e. clad ridging, occurs at pellet end elevations due to pellet wheatsheafing.
For the FUMEX-III cases modelled, rod diameter data are available for all cases except IFA-535.5 rod 809 and the AREVA idealised case. In the case of Risø-3 rods GE7 and II5 and OSIRIS rod J12-5 both pre-ramp and post-ramp data are available. The pellet waist results are summarised in Table 6. All burnups are as predicted by ENIGMA. All diameter change values are relative to the as-manufactured rod diameter.

Not Protectively Marked
Page 72 of 82
NNL (12) 12172MFTC/P(2012)467
Issue 2
Not Protectively Marked
Table 6: Summary of rod diameter measurements and predictions at pellet waist elevations
Case Description Clad type
Rod average burnup
(MWd/kgHM)
Measured diameter
change (µm)
Measurement description
Predicted diameter
change (µm)
P/M
1 PRIMO rod BD8 Zry-4 31.3 -30 Pre-ramp, peak flux elevation
-49 1.63
2 Risø-3 rod GE7 Lined Zry-2
41.1 ~ -35 Pre-ramp, average value
-45 1.29
41.1 +39 Post-ramp, peak power elevation
-21 (+37*) -0.54 (0.95*)
4 Risø-3 rod II5 Zry-2 49.5 ~ -5 Pre-ramp, average value
-8 1.6
49.6 ~ +30 Post-ramp, average value
+25 0.83
5 USPWR rod TSQ002 Zry-4 54.6 -38 Average value -65 1.71
6 USPWR rod TSQ022 Zry-4 60.0 -38 " -59 1.55
7 IFA-591 rod 1 Zry-2 15.5 -60 Pre-ramp, average value
-35 0.58
8 IFA-591 rod 2 Lined Zry-2
15.5 -66 " -35 0.53
9 IFA-591 rod 3 Zry-2 21.2 -58 " -37 0.64
10 IFA-591 rod 4 Zry-2 16.3 -57 " -37 0.65
11 IFA-591 rod 5 Lined Zry-2
16.3 -67 " -37 0.55
12 IFA-591 rod 6 Zry-2 22.2 -56 " -39 0.70
13 IFA-591 rod 7 Zry-2 16.3 -53 " -37 0.70
14 IFA-591 rod 8 Lined Zry-2
14.9 -69 " -34 0.49
15 IFA-591 rod 9 Lined Zry-2
16.6 -64 " -38 0.59
16 IFA-591 rod 10 Zry-2 21.2 -60 " -37 0.62
17 IFA-591 rod 11 Zry-2 22.2 -54 " -39 0.72
18 OSIRIS rod J12-5 Zry-4 25.8 ~ -80 " -118 1.48
25.9 ~ -60 Post-ramp, peak power elevation
-80 1.33
19 M501 rod D10 Zry-4 35.3 ~ -90 Average value -105 1.17
* With fuel thermal conductivity degradation increased to match measured and predicted end-of-life FGR values

Not Protectively Marked
Page 73 of 82
NNL (12) 12172MFTC/P(2012)467
Issue 2
Not Protectively Marked
With the exception of the IFA-591 rod 8 and nominal Risø-3 rod GE7 post-ramp measurements, all predicted diameter changes are in the same direction (negative or positive) as measured and are within a factor of two of the measured values. There is also no clear trend with clad type, although the IFA-591 results do indicate that the creepdown for lined cladding is slightly less well predicted than for unlined cladding (which is to be expected given that the presence of the liner is not taken into account in the modelling). Given typical clad creep rate uncertainties of x/÷ 2, this is entirely satisfactory, although it is acknowledged that it is only the predictions for the low burnup, unramped conditions where the clad diameter changes are dominated by clad creep — for the high burnup or ramped conditions, fuel thermal expansion, fuel densification, and fuel swelling (both solid and gaseous) are also important. The adequacy of the clad diametral deformation modelling is more soundly supported by the validation of ENIGMA, which includes satisfactory predictions of measured rod diameters for a relatively large number of rods.
As noted in Table 6, and described in detail in Section 3.2, the Risø-3 rod GE7 post-ramp predicted rod diameters can be brought into good agreement with the measurements by increasing the fuel thermal conductivity degradation such that the predicted end-of-life FGR matches the measured value. Thus, the underprediction of fuel temperatures for Risø-3 cases (see Section 4.1) is at least partly to blame for the poor nominal prediction of post-ramp diameters for this rod. In the case of the other measurements in post-ramp conditions — that is those for Risø-3 rod II5 and OSIRIS rod J12-5 — the predicted increases in rod diameter due to the ramp (including the axial variation) are well predicted; the main source of discrepancy between measured and predicted rod diameters is due to the ‘legacy’ mismatch from the base irradiation, which is in turn due to the uncertainty on clad creep rate.
Clad ridging data are available for PRIMO rod BD8, Risø-3 rods GE7 and II5, and OSIRIS rod J12-5. Clad ridge height prediction is generally good, but with a tendency for overprediction. In the specific instance of Risø-3 rod II5, measured post-ramp ridge heights are well predicted, but ENIGMA predicts substantial (~ 80 µm diametral) ridging at the end of the base irradiation — due to high power operation early in life — which is not significantly affected by the ramping, while the measurements show more moderate (~ 20 µm diametral) ridging after the base irradiation which is further enhanced after ramping. Given the uncertainties in early-in-life ridge height prediction at high power (in particular, in the effects of fuel cracking and relocation), the conservatism of the predictions, and the successful validation of the ENIGMA clad ridging model, the differences between the measurements and the predictions are not of significant concern.
4.4. Fuel densification and swelling
End-of-life fuel density data are available for USPWR rods TSQ002 and TSQ022 and for M501 rod D10.
With respect to the USPWR rods, there is generally a good agreement between measurements and predictions. This implies that the combined effects of fuel densification and fuel swelling are generally well predicted.
With respect to M501 rod D10, the fuel density data indicate that there is an overprediction of fuel densification and/or an underprediction of fuel swelling. However, this is contradicted by the good agreement between measured and predicted rod diameters, fuel stack length change, clad length change and rod free volume. Since the fuel density is only really of interest in terms of validating the fuel densification and swelling modelling, which is shown to be reasonable by the other predictions, the

Not Protectively Marked
Page 74 of 82
NNL (12) 12172MFTC/P(2012)467
Issue 2
Not Protectively Marked
discrepancy between measured and predicted fuel densities is not of undue concern (and may reflect measurement uncertainties).
4.5. Rod free volume and rod internal pressure
End-of-life (EOL) rod free volume was measured for Risø-3 rods GE7 and II5, IFA-535.5 rod 809, USPWR rods TSQ002 and TSQ022, OSIRIS rod J12-5, M501 rod D10, and seven of the IFA-591 rods.
Other than the USPWR rods and M501 rod D10, the rods are all short length, free volume changes are therefore generally relatively small, and discrepancies between measured and predicted end-of-life rod free volumes are dominated by uncertainties, in particular the uncertainty in the initial free volume in the plenum or plena. Given that, the predictions for the short length rods are all reasonable.
With respect to the full length rods, the measurements and predictions are summarised in Table 7.
Table 7: Summary of rod free volume measurements and predictions for full length rods
Case Description Measured EOL free volume, VM (cm3)
Predicted EOL free volume, VP (cm3)
As-manufactured free volume, VI (cm3)
VM/VI VP/VI
5 USPWR rod TSQ002 17.8 18.4 25.4 0.70 0.72
6 USPWR rod TSQ022 31.0 29.8 37.2 0.83 0.80
19 M501 rod D10 12.1 13.3 19.5 0.62 0.68
It can be seen that significant decreases in rod free volume were measured due to the combined effects of fuel densification, fuel swelling, clad creepdown, rod growth, and other less important phenomena. The magnitude of the measured rod free volume reductions is in all cases well predicted, with no tendency for over- or under-prediction.
Overall, the end-of-life rod free volume predictions are considered good. This is supported by the validation of ENIGMA, where end-of-life rod free volume is one of the quantities validated against.
End-of-life rod internal pressure is primarily determined by the fill gas pressure, the end-of-life rod free volume and the end-of-life FGR. Thus, given the relatively small uncertainty on the fill gas pressure, the accuracy of the end-of-life rod internal pressure predictions is effectively fixed by the accuracy of the end-of-life rod free volume and end-of-life FGR predictions. Further discussion on the accuracy of end-of-life rod internal pressures is therefore unnecessary.
Through-life (at-power) rod internal pressure was measured via pressure transducers in IFA-535.5 rod 809, Risø-3 rod II5, and three of the IFA-591 rods. The kinetics of the rod internal pressure increases are generally well predicted, but the accuracy of the magnitudes of the predicted increases are dependent upon the accuracy of the underlying fission gas release predictions (and to some extent also the rod free volume and gas temperature predictions). In several cases the predicted increases in pressure at high power are only wholly measured once the rating decreases (in a power dip or at end of life). This is a commonly observed phenomenon, and suggests that fission gas is released from the fuel at high power, but is trapped in fuel cracks and/or the fuel-clad
Not Protectively Marked
Page 75 of 82
NNL (12) 12172MFTC/P(2012)467
Issue 2
Not Protectively Marked
gap due to the high hydrostatic stresses at the high powers, and is therefore not available to be registered by the pressure transducer.
4.6. Clad elongation
Clad elongation was measured on-line for the ramping of IFA-535.5 rod 809 and eight of the IFA-591 rods. End-of-life clad elongation (or rod length change) was also measured during PIE for PRIMO rod BD8, Risø-3 rod GE7 and M501 rod D10.
Prediction of on-line clad elongation proved difficult, since accurate predictions depend crucially on accurately predicting the timing of (hard) fuel-clad contact at each axial elevation, which is in turn a demanding problem. This is partly why on-line clad elongation data are not currently used to validate ENIGMA. The IFA-535.5 rod 809 measurements exhibited a trend of decreasing elongation during the first 500 hours of the re-irradiation which is difficult to explain (it occurs over a much larger timescale than would be expected based on fuel creep) and was not reproduced by the predictions — it may be an experimental anomaly.
In contrast, end-of-life clad elongation was generally well predicted. This implies that the residual axial strains from the at-power elongation (including rod growth strains) are satisfactorily reproduced by ENIGMA. This is to be expected given that ENIGMA is validated against end-of-life clad elongation data.
4.7. Fuel stack elongation
End-of-life fuel stack elongation was measured for PRIMO rod BD8, Risø-3 rod II5, and M501 rod D10.
In the case of the Risø rod, both post-base irradiation and post-ramp measurements were performed. However, the post-base irradiation measurement pertains to the parent rod, which was not modelled, and so this measurement can be ignored. The post-ramp measurement is a null result: a zero fuel stack length change relative to the pre-ramp condition is both measured and predicted.
Of the remaining rods, the results for the M501 rod are of primary interest, because they pertain to a full length rod (unlike the PRIMO rod results). The measured and predicted fuel stack elongation for this rod are +16.4 mm and +18.7 mm, respectively, which are in good agreement.
Thus, overall there is no evidence that fuel stack elongation is not well predicted. This is to be expected given that ENIGMA is validated against end-of-life fuel stack elongation data.
4.8. Clad oxidation
End-of-life clad oxide thickness was measured for Risø-3 rods GE7 and II5, USPWR rods TSQ002 and TSQ022, OSIRIS rod J12-5, M501 rod D10, and seven of the IFA-591 rods. Thin inner oxide layers were observed for some rods, but clad inner surface oxidation is not modelled by ENIGMA, so these data are not pertinent to ENIGMA validation. The observed uniform outer surface oxide thicknesses (including their axial variation) were

Not Protectively Marked
Page 76 of 82
NNL (12) 12172MFTC/P(2012)467
Issue 2
Not Protectively Marked
well predicted for all rods, despite a relatively large range of measured values from a few microns to 50 µm. This is to be expected given that ENIGMA is validated against such corrosion data. Nodular corrosion was also observed for the IFA-591 rods, but this is not modelled by ENIGMA and so is not relevant when discussing the accuracy of ENIGMA predictions.

Not Protectively Marked
Page 77 of 82
NNL (12) 12172MFTC/P(2012)467
Issue 2
Not Protectively Marked
5. Conclusions
Twenty FUMEX-III cases have been modelled using NNL’s ENIGMA fuel performance code. These include the following eight high priority cases: the PRIMO MOX rod BD8, Risø-3 rod GE7, OSIRIS rod J12-5 , IFA-535.5 rod 809, Risø-3 rod II5, the US PWR 16x16 LTAs rods TSQ002 and TSQ022, and the AREVA idealised case. Due to Sellafield Ltd’s interest in MOX fuel behaviour, twelve additional MOX rods have been analysed — that is M501 rod D10 and the eleven rods from the IFA-591 MOX irradiation. A description of the ENIGMA code has also been provided.
No significant problems were encountered in modelling any of the cases, other than a lack of fuel grain size data for IFA-535.5 rod 809. The predictions were compared with the measured data and the results of this have been described on a case by case basis. The phenomenological results, i.e. the combined results for fuel temperature, fission gas release, clad diametral deformation et al, have also been considered.
Fuel temperatures, fission gas release, clad diametral deformation (at the pellet waist and pellet end), fuel densification and swelling, rod free volume changes, rod internal pressure, fuel stack elongation, and clad corrosion (uniform, outer surface oxidation) were all in general judged to be satisfactorily predicted, although:
(a) there is a known underprediction of fuel temperatures for rods irradiated in the Risø-3 programme;
(b) the FGR (and hence also rod internal pressure) at high burnup may be underpredicted if and when a significant rim width develops, since ENIGMA does not model any FGR due to rim formation or to venting of rim porosity — the possible inclusion in ENIGMA of a rim release model should be investigated in any future development;
(c) the FGR (and hence also rod internal pressure) in transient conditions may be underpredicted, since ENIGMA does not have an explicit transient release model — the possible inclusion in ENIGMA of a transient release model should be investigated in any future development;
(d) as expected, the creepdown for lined cladding appears to be slightly less well predicted than for unlined cladding;
(e) there is a tendency for overprediction of clad ridge heights, although this is not a general trend (given the successful validation of ENIGMA’s clad ridging model).
End-of-life clad elongation was also generally well predicted, but prediction of at-power clad elongation proved difficult, since accurate predictions depend crucially on accurately predicting the timing of (hard) fuel-clad contact at each axial elevation, which is in turn a demanding problem. Clad inner surface corrosion and clad outer surface nodular corrosion are not modelled by ENIGMA and so the measurements of these phenomena were not relevant to assessing ENIGMA’s predictions.

Not Protectively Marked
Page 78 of 82
NNL (12) 12172MFTC/P(2012)467
Issue 2
Not Protectively Marked
6. Acknowledgements
This work was performed for Sellafield Ltd under the remit of the Nuclear Decommissioning Authority (NDA).
The ENIGMA calculations and their verification were performed by Chris Chatwin, Matthew Fountain, Christopher Grove, Ian Palmer and Glyn Rossiter.

Not Protectively Marked
Page 79 of 82
NNL (12) 12172MFTC/P(2012)467
Issue 2
Not Protectively Marked
7. References
[1] P A Jackson, J A Turnbull and R J White, “A Description of the ENIGMA Fuel Performance Code”, IAEA Technical Committee Meeting on Water Reactor Fuel Element Computer Modelling in Steady-State, Transient and Accident Conditions, Preston, UK, 19-22 September 1988.
[2] P A Jackson, J A Turnbull and R J White, “ENIGMA Fuel Performance Code”, Nuclear Energy, Vol. 29, No. 2, 107-114, 1990.
[3] W J Kilgour, J A Turnbull, R J White, A J Bull, P A Jackson and I D Palmer, “Capabilities and Validation of the ENIGMA Fuel Performance Code”, ANS/ENS International Topical Meeting on LWR Fuel Performance, Avignon, France, 21-24 April 1991.
[4] J C Killeen, “Comparison of the ENIGMA Code with Experimental Data on Thermal Performance, Stable Fission Gas and Iodine Release at High Burn-Up”, IAEA Technical Committee Meeting on Water Reactor Fuel Element Modelling at High Burnup and Its Experimental Support, Windermere, UK, 19-23 September 1994.
[5] G A Gates, P M A Cook, P de Klerk, P Morris and I D Palmer, “Thermal Performance Modelling with the ENIGMA Code”, NEA/CEA Seminar on Thermal Performance of High Burn-Up LWR Fuel, Cadarache, France, 3-6 March 1998.
[6] I Palmer, G Rossiter and R White, “Development and Validation of the ENIGMA Code for MOX Fuel Performance Modelling”, IAEA International Symposium on MOX Fuel Cycle Technologies for Medium and Long Term Deployment: Experience, Advances, Trends, Vienna, Austria, 17-21 May 1999.
[7] J Rhodes, K Smith and D Lee, “CASMO-5 Development and Applications”, ANS Topical Meeting on Reactor Physics (PHYSOR-2006), Vancouver, Canada, 10-14 September 2006.
[8] T Bahadir and S-Ö Lindahl, “Studsvik’s Next Generation Nodal Code SIMULATE-5”, Advances in Nuclear Fuel Management IV (ANFM 2009), Hilton Head Island, South Carolina, USA, 12-15 April 2009.
[9] J Mullen, C Brown, I D Palmer and P Morris, “Performance of SBR MOX Fuel in the Callisto Experiment”, TopFuel‘97, Manchester, UK, 9-11 June 1997.
[10] R J White, S B Fisher, P M A Cook, R Stratton, C T Walker and I D Palmer, “Measurement and Analysis of Fission Gas Release from BNFL’s SBR MOX fuel”, Journal of Nuclear Materials 288 (2001) 43-56.
[11] R Weston, I D Palmer, J M Wright, G D Rossiter, R C Corcoran, T C Gilmour, C T Walker and S Bremier, “Progress on SBR MOX Fuel Development”, TopFuel 2001, Stockholm, Sweden, 27-30 May 2001.
[12] S B Fisher, R J White, P M A Cook, S Bremier, R C Corcoran, R Stratton, C T Walker, P K Ivison and I D Palmer, “Microstructure of Irradiated SBR MOX Fuel and its Relationship to Fission Gas Release”, Journal of Nuclear Materials 306 (2002) 153-172.
[13] M Barker, P Cook, R Weston, G Dassel, C Ott, R Stratton, D Papaioannou and C Walker, “Ramp Testing of SBR MOX Fuel”, NEA Seminar on Pellet-Clad Interaction in Water Reactor Fuels, Aix-en-Provence, France, 9-11 March 2004.
[14] M A Barker, K Stephenson and R Weston. “The Manufacture and Performance of Homogeneous-Microstructure SBR MOX Fuel”, 2007 International LWR Fuel Performance Meeting, San Francisco, California, USA, 30 September - 3 October 2007.

Not Protectively Marked
Page 80 of 82
NNL (12) 12172MFTC/P(2012)467
Issue 2
Not Protectively Marked
[15] M A Barker and C P Chatwin, “Fuel Performance Activities at Sellafield Ltd and the UK’s National Nuclear Laboratory”, 2008 Water Reactor Fuel Performance Meeting, Seoul, Korea, 19-23 October 2008.
[16] G Rossiter, “Development of the ENIGMA Fuel Performance Code for Whole Core Analysis and Dry Storage Assessments”, Nuclear Engineering and Technology, Vol. 43, No. 6, 489-498, December 2011.
[17] A Worrall, T J Abram, R W H Gregg, K W Hesketh, I D Palmer, G D Rossiter and G M Thomas, “Plutonium Utilization Options in Future UK PWRs Using MOX and Inert Matrix Fuels”, Global 2007, Boise, Idaho, USA, 9-13 September 2007.
[18] A Alapour, R M Joyce, A S DiGiovine, S Tarves, N Patino, A Worrall, R Gregg and G Rossiter, “Robust PCI Monitoring During PWR Operation at Southern Nuclear”, 2010 LWR Fuel Performance/TopFuel/WRFPM, Orlando, Florida, USA, 26-29 September 2010.
[19] G D Rossiter, P M A Cook and R Weston, “Isotopic Modelling Using the ENIGMA-B Fuel Performance Code”, IAEA Technical Committee Meeting on Nuclear Fuel Behaviour Modelling at High Burnup and Its Experimental Support, Windermere, UK, 19-23 June 2000.
[20] T J Abram, “Modelling the Waterside Corrosion of PWR Fuel Rods”, IAEA Technical Committee Meeting on Water Reactor Fuel Element Modelling at High Burnup and Its Experimental Support, Windermere, UK, 19-23 September 1994.
[21] J A Turnbull, C A Friskney, J R Findlay, F A Johnson and A J Walter, “The Diffusion Coefficients of Gaseous and Volatile Species During the Irradiation of Uranium Dioxide”, Journal of Nuclear Materials 107 (1982) 168-184.
[22] J A Turnbull, R J White and C Wise, “The Diffusion Coefficient for Fission Gas Atoms in Uranium Dioxide”, IAEA Technical Committee Meeting on Water Reactor Fuel Element Computer Modelling in Steady-State, Transient and Accident Conditions, Preston, UK, 19-22 September 1988.
[23] M V Speight, “A Calculation on the Migration of Fission Gas in Material Exhibiting Precipitation and Re-solution of Gas Atoms Under Irradiation”, Nuclear Science and Engineering, Vol. 37, pp. 180, 1969.
[24] A H Booth, “A Method of Calculating Fission Gas Diffusion from UO2 Fuel and Its Application to the X-2-f Loop Test”, AECL Report 496, September 1957.
[25] R J White and M O Tucker, “A New Fission-Gas Release Model”, Journal of Nuclear Materials 118 (1983) 1-38.
[26] R J White, “The Growth of Intra-Granular Bubbles in Post-irradiation Annealed UO2
Fuel”, IAEA Technical Committee Meeting on Nuclear Fuel Behaviour Modelling at High Burnup and Its Experimental Support, Windermere, UK, 19-23 June 2000.
[27] J A Turnbull, “The Distribution of Intragranular Fission Gas Bubbles in UO2 During Irradiation”, Journal of Nuclear Materials 38 (1971) 203-212.
[28] J Killeen, IAEA minutes from first research co-ordination meeting, March 2009 (NNL reference MO05995/06/26/01).
[29] G Rossiter, “FUMEX-III: Status After 1st Research Co-ordination Meeting”, National Nuclear Laboratory report NNL (09) 10058, MFTC/N(2009)341, January 2009.
[30] J Killeen, IAEA minutes from second research co-ordination meeting, August 2010 (NNL reference MO05995/06/26/02).
Not Protectively Marked
Page 81 of 82
NNL (12) 12172MFTC/P(2012)467
Issue 2
Not Protectively Marked
[31] G Rossiter, “FUMEX-III: Status After 2nd Research Co-ordination Meeting”, National Nuclear Laboratory report NNL (10) 11155, MFTC/P(2010)402, Issue 2, December 2010.
[32] J Killeen, “FUMEX-III: AREVA Idealized Case No. II”, Email to FUMEX-III participants, 9 May 2011 (NNL reference MO05995/06/26/03).
[33] J Killeen, “Re: FUMEX-III: AREVA Idealized Case No. II”, Email to FUMEX-III participants, 9 June 2011 (NNL reference MO05995/06/26/04).
[34] P van Uffelen and L J Ott, “PRIMO (PWR Reference Irradiation of MOX Fuels): Data on a Ramped MOX Fuel Rod”, IFPE dataset NEA-1776/01 report, January 2004.
[35] C Vitanza, E Kolstad and U Graziani, “Fission Gas Release From UO2 Pellet Fuel at High Burn-up”, ANS meeting, Portland, Oregon, April 1979.
[36] T G Rowland, H C Brassfield, C T Durham and E V Hoshi, “The Third Risø Fission Gas Project: GE Fuel (GE-Data)”, RISØ-FGP3-GE Pt.1, April 1990.
[37] C Bagger and H Toftegaard, “The Third Risø Fission Gas Project: Bump Test GE7 (ZX115)”, RISØ-FGP3-GE7, September 1990.
[38] C T Walker, B Cremer, W Ziehl, M Murray, M Coquerelle and F Lebrun, “The Third Risø Fission Gas Project: TU Final Report (1/3)”, RISØ-FGP3-TU, Pt.1, April 1992.
[39] C Bagger, P Knudsen, M Mogensen, H Toftegaard and L Jørgensen, “The Third Risø Fission Gas Project: Final Report: The Project”, RISØ-FGP3-FINAL, Pt.1, March 1991.
[40] C Bagger and H Toftegaard, “The Third Risø Fission Gas Project: Bump Test II5 (M72-2-7R)”, RISØ-FGP3-II5, September 1990.
[41] W F Lyon (Ed.), “US-PWR 16x16 LTA Extended Burnup Demonstration Program Summary File”, IFPE dataset NEA-1738/01 document, Revision 1, March 2005.
[42] T Ozawa and T Abe, “Power Ramp Tests of MOX Fuel Rods: HBWR Irradiation with Instrument Rig IFA-591”, JAEA Technology report 2006-026, October 2006.
[43] W H Jens and P A Lottes, “Analysis of Heat Transfer, Burnout, Pressure Drop and Density Data for High Pressure Water”, ANL-4627, May 1951.
[44] P Couffin, “Compte Rendu d’Irradiation Crayon J12-5: Cycle F128”, CEA report CRi No. 525, March 1996.
[45] D Gouaillardou, “Rampe sur Crayon J12.5, 2 Cycles à OSIRIS”, CEA report DMT No. 95-591, November 1995.
[46] M Menard, “Examens Metallographiques du Crayon Fabrice J12 - 5”, CEA report DMT No. 96/588, November 1996.
[47] P M A Cook, R Stratton and C T Walker, “Post-Irradiation Examination of BNFL MOX Fuel”, ANS International Topical Meeting on LWR Fuel Performance, Park City, Utah, USA, 10-13 April 2000.
[48] P Cook, “M501 : Electron-Optic Examination Report”, BNFL report MFTC/P(99)44, May 2001.
[49] G Rossiter, “IAEA FUMEX-II Co-ordinated Research Programme: Final Report”, Nexia Solutions report 6927, January 2006.
[50] I Palmer and G Rossiter, “Status of the ENIGMA Fuel Performance Code”, Nexia Solutions report MFTC/P(2006)271, March 2006.

Not Protectively Marked
Page 82 of 82
NNL (12) 12172MFTC/P(2012)467
Issue 2
Not Protectively Marked
DISTRIBUTION
Name Location
Mark Greaves Sellafield Ltd
Rob Stephen Sellafield Ltd
MFTC secretary Sellafield Ltd
John Killeen IAEA
Matthew Fountain NNL Preston
Christopher Grove NNL Preston
Peter Morris NNL Preston
Ian Palmer NNL Preston
NNL Document Controller NNL Risley