united bank for africa plc interim consolidated and
TRANSCRIPT

UNITED BANK FOR AFRICA PLC
Interim Consolidated and Separate Financial
Statements for the period ended 30 June 2019
Consolidated and Separate Financial Statements for the period ended 30 June, 2019

United Bank for Africa Plc
Notes to the Financial Statements
Note Page Note Page
i Directors' Report 2 6 Fair value measurement 91
ii Customer Complaints and Feedback Report 8 7 Offsetting of financial instruments 99
iii Corporate Governance Report 10 8 Critical accounting estimates and judgements 101
iv Statement of Directors' Responsibilities 15 9 Operating segments 103
v Report of the Statutory Audit Committee 16
vi Independent Auditor's Report 17 10 Interest income 106
vii
Interim Consolidated and Separate Statements of
Comprehensive Income 23 11 Interest expense 106
viii
Interim Consolidated and Separate Statements of
Financial Position 24 12 Allowance for credit losses on financial assets 106
ix
Interim Consolidated and Separate Statements of
Changes in Equity 25 13 Fees and commission income 106
x
Interim Consolidated and Separate Statements of
Cash Flows 27 14 Fees and commission expense 107
15 Net trading and foreign exchange income 107
xi Notes to the Interim Consolidated and Separate
Financial Statements 27 16 Other operating income 107
1 General Information 28 17 Employee benefit expenses 107
2 Basis of preparation 28 18 Depreciation and amortisation 107
3 Significant accounting policies 28 19 Other operating expenses 108
3.1 Basis of measurement 28 20 Taxation 108
3.2 Functional and presentation currency 28 21 Earnings per share 110
3.3 Use of estimates and judgements 28 22 Cash and bank balances 110
3.4 Basis of consolidation 28 23 Financial assets at fair value through profit or loss 110
3.5 Foreign currency 30 24 Loans and advances to banks 111
3.6 Interest income and interest expense 30 25 Loans and advances to customers 112
3.7 Fees and commission income and expenses 30 26 Investment securities 115
3.8 Net trading and foreign exchange income 31 27 Other assets 117
3.9 Dividend income 31 28 Investment in equity-accounted investee 117
3.10 Income tax 31 29 Investment in subsidiaries 119
3.11 Cash and bank balances 31 30 Property and Equipment 124
3.12 Trading assets 31 31 Intangible assets 128
3.13 Derivative financial instruments 32 32 Deferred tax assets and liabilities 131
3.14 Property and Equipment 32 33 Derivative financial instruments 134
3.15 Intangible assets 33 34 Deposits from banks 135
3.16 Impairment of non-financial assets 33 35 Deposits from customers 135
3.17 Repossessed collateral 34 36 Other liabilities 135
3.18 Deposits and debt securities issued 34 37 Borrowings 136
3.19 Provisions 34 38 Subordinated liabilities 138
3.20 Financial guarantee contracts 34 39 Capital and reserves 139
3.21 Employee benefits 34 40 Dividends 140
3.22 Share capital and reserves 35 41 Contingencies 140
3.23 Earnings per share 35 42 Related parties 141
3.24 Fiduciary activities 35 43 Compensation to employees and directors 145
3.25 Stock of consumables 35 44 Transactions requiring regulatory approval 146
3.26 Segment reporting 36 45 Non-audit services 146
3.27 Changes in accounting policies 36 46 Compliance with banking regulations 146
3.28 New standards and interpretations not yet adopted 43 47 Events after the reporting date 146
4 Financial risk management 46 48 Condensed results of consolidated subsidiaries 147
5 Capital 89 Additional Disclosures 152
49 Statement of value added 153
50 Five-year financial summary 154
Consolidated and Separate Financial Statements for the period ended 30 June, 2019

Directors’ Report
1 Results at a Glance
2019 June 2018 June 2019 June 2018 June
(N'Million) (N'Million) (N'Million) (N'Million)
Profit before tax 70,274 58,140 43,630 34,176
Taxation (13,535) (14,348) (7,164) (12,529)
Profit after tax 56,739 43,792 36,466 21,647
Other comprehensive income 5,341 (13,311) 16,604 1,635
Total comprehensive income 62,080 30,481 53,070 23,282
Total comprehensive income attributable to:
− Equity holders of the Bank 62,511 30,748 53,070 23,282
− Non-controlling interest (431) (267) -
Total comprehensive income 62,080 30,481 53,070 23,282
2 Dividend
3 Legal form
4
5 Directors
NAME
Mr. Tony O. Elumelu, CON
Ambassador Joe Keshi, OON
Mr. Kennedy Uzoka
Mr. Victor Osadolor
Mr. Dan Okeke
Mr. Emeke Iweriebor
Mr. Oliver Alawuba
Mr. Ayoku Liadi
Mr. Ibrahim Puri
Mr. Uche Ike
Mr. Chukwuma Nweke
Mrs. Foluke Abdulrazaq Non-Executive Director
Mrs. Owanari Duke Non-Executive Director
High Chief Samuel Oni, FCA Non-Executive Director
Ms. Angela Aneke Non-Executive Director
Erelu Angela Adebayo
Mr. Abdulqadir J. Bello Non-Executive Director
Mr. Kayode Fasola Non-Executive Director
Mr. Abdoul Aziz Dia*
*Mr. Abdoul-Aziz Dia was appointed on August 1, 2019
Executive Director (GMD/CEO)
The Directors present their report together with the audited financial statements of the Group for the year ended June 30, 2019.
Group Bank
The Board of Directors, pursuant to the powers vested in it by the provisions of Section 379 of the Companies and Allied Matters
Act, 1990 (CAMA) of Nigeria, declared a dividend of N0.20k per share from the retained earnings account as at June 30, 2019.
This will be presented to shareholders for approval at the next Annual General Meeting. Payment of Dividend is subject to
applicable witholding tax.
United Bank for Africa (UBA) Plc was incorporated in Nigeria as a limited liability company on February 23, 1961, under the
Companies Ordinance [Cap 37] 1922. It took over the assets and liabilities of the British and French Bank Limited, which had
carried on banking business in Nigeria since 1949. UBA merged with Standard Trust Bank Plc on August 01, 2005 and acquired
Continental Trust Bank Limited on December 31, 2005.
Major activities & business review
UBA Plc is engaged in the business of banking and cater for the banking needs of Institutions, Corporate, Commercial and
Consumer customer segments, providing trade services, remittance, treasury management, custody/investor services, digital
and general banking services. Pension custody services are offered through its subsidiary, UBA Pension Custodian Limited. UBA
Plc carries out banking activities in accordance with its Memorandum and Articles of Association.
DESIGNATION
Non-Executive Director (Chairman)
Non-Executive Director (Vice-Chairman)
Executive Director (DMD)
Executive Director
Executive Director
Executive Director
Executive Director
Executive Director
Executive Director
Executive Director
Non-Executive Director
Non-Executive Director
Page 3 of 155 Consolidated and Separate Financial Statements for the period ended 30 June, 2019

Directors’ Report - Continued
6 Directors’ interests
Name of DirectorsDirect
holding
Indirect
holding
Direct holding Indirect holding
Mr. Tony O. Elumelu, CON 189,851,584 2,114,110,884 189,851,584 2,114,110,884
Ambassador Joe Keshi, OON 433,499 433,499 -
Mr. Kennedy Uzoka 37,173,909 37,173,909 -
Mr. Victor Osadolor 16,583,126 16,583,126 -
Mr. Dan Okeke 31,297,918 31,297,918 -
Mr. Emeke Iweriebor 7,034,071 7,034,071 -
Mr. Oliver Alawuba 593,248 593,248 -
Mr. Ayoku Liadi 1,080,000 1,080,000 -
Mr. Ibrahim Puri 981,118 981,118 -
Mr. Uche Ike 10,936,395 10,936,395 -
Mr. Chukwuma Nweke 1,059,860 1,059,860 -
Mrs. Foluke Abdulrazaq 10,000,000 11,120,000 10,000,000 11,120,000
Mrs. Owanari Duke 86,062 86062 -
High Chief Samuel Oni, FCA 2,065 2,065 -
Ms. Angela Aneke - - -
Erelu Angela Adebayo 163,803 163,803 -
Mr. Abdulqadir J. Bello 130,000 - -
Mr. Kayode Fasola - - -
Details of indirect holdings
Name of Director Indirect Total indirect Mr. Tony O. Elumelu, CON 140,843,816 -
1,742,180,600 -
231,086,468 2,114,110,884
Mrs. Foluke Abdulrazaq 11,120,000 11,120,000
7 Analysis of shareholding
Directors’ Report - Continued
The interest of directors in the issued share capital of the Bank as recorded in the register of directors’ shareholding and/or as
notified by the directors for the purpose of Sections 275 and 276 of the Companies and Allied Matters Act and the listing
requirements of the Nigerian Stock Exchange is as follows:
30-Jun-19 31-Dec-18
CompanyHH Capital Limited
Heirs Holdings Limited
Heirs Alliance Limited
Bridge House College
The details of shareholding of the Bank as at June 30, 2019 is as stated below;
Headline
Range Count
Cummulative
count Count (%)
Aggregate
Holdings
Cummulative
Holdings
Aggregate
Holdings (%)
1-1000 30,450 30,450 11.18% 14,216,096 14,216,096 0.04%
1,001-5,000 120,246 150,696 44.14% 300,596,253 314,812,349 0.88%
5,001-10,000 45,039 195,735 16.53% 308,153,818 622,966,167 0.90%
10,001-50,000 54,610 250,345 20.04% 1,138,101,236 1,761,067,403 3.33%
50,001-100,000 10,796 261,141 3.96% 727,585,147 2,488,652,550 2.13%
100,001-500,000 8,711 269,852 3.20% 1,762,521,955 4,251,174,505 5.15%
500,001-1,000,000 1,243 271,095 0.46% 865,100,699 5,116,275,204 2.53%
1,000,001-5,000,000 1,007 272,102 0.37% 1,974,762,591 7,091,037,795 5.77%
5,000,001-10,000,000 134 272,236 0.05% 953,542,964 8,044,580,759 2.79%
10,000,001-50,000,000 134 272,370 0.05% 2,810,340,818 10,854,921,577 8.22%
50,000,001-100,000,000 23 272,393 0.01% 1,601,155,250 12,456,076,827 4.68%
100,000,001-500,000,000 36 272,429 0.01% 10,814,790,112 23,270,866,939 31.62%
500,000,001-1,000,000,000 10 272,439 0.00% 6,587,435,886 29,858,302,825 19.26%
1,000,000,001 and abov e 3 272,442 0.00% 4,341,118,541 34,199,421,366 12.69%
272,442 100% 34,199,421,366 100%
Shareholders Holdings
Page 4 of 155 Consolidated and Separate Financial Statements for the period ended 30 June, 2019

8 Substantial interest in shares: shareholding of 5% and above
Shareholders Holding Holding (%)
Stanbic IBTC Nominees 3,629,856,144 10.6%
Heirs Holdings 1,742,180,600 5.1%
9 Acquisition of own shares
10 Donations
SCHEDULE OF DONATIONS FOR THE PERIOD
Beneficiary/Project Amount (NGN)
Nigeria
Ambrose Ali University, Edo State 17,816,589
National Youth Service Corps 6,600,000
Obafemi Awolowo University 4,139,058
Adamawa State University, Mubi 1,625,000
St. Saviours School 1,500,000
Bowen University, Osun State 416,667
Corona Schools Trust Council 100,000
Total 32,197,314
Rest of Africa
Damango KVIP Project, Ghana 6,236,765
ASSOCIATION AEESCM (Association of Students from
Cameroon) 62,016
Cyclone Idai victims in Beria, Mozambique 1,171,820
169,463
313,687
156,844
156,844
Sub-Total 8,267,439
Total Donations Across the Group 40,464,753
11 Employment of Physically Challenged Persons
Muhimbili Twins, Tanzania
According to the Register of Shareholders as at June 30, 2019, the following shareholders hold more than 5% of the Bank's shares
outstanding:
The Bank did not purchase its own shares during the period. Also, the Group has a Board approved Global Personal Investment
Policy, which covers directors, staff, and related parties. The policy prohibits employees, directors and related
individuals/companies from insider dealings on the shares of UBA Plc and related parties. The essence of the policy is to prevent
the abuse of confidential non-public information that may be gained during the execution of UBA’s business. In addition, the
policy serves to ensure compliance with the local laws and/or regulatory requirements. In accordance with the NSE Rule Book
and Amendments to the Listing Rules, UBA observes closed periods, within which affected persons/corporates are restricted from
trading on the shares of the Bank. There was no case of violation within the period under review.
As a part of our commitment to the development of host communities, the environment and broader economy within which we
operate, across the Group, a total of N40,464,753 (Forty Million, Four Hundred and Sixty-Four Thousand, Seven Hundred and Fifty
Three Naira Only) was given out as donations and charitable contributions during the period (Bank: N32,197,314). The
beneficiaries of the donations are as follows:
Eid Celebrations, Tanzania
Temeke Hospital, Tanzania
Namthamini Campaign, Tanzania
The Bank operates a non-discriminatory policy in the consideration of applicants for employment, including those received from
physically challenged persons. The Bank’s policy is that the most qualified persons are recruited for the appropriate job levels,
irrespective of an applicant’s state of origin, ethnicity, religion or physical condition.
Page 5 of 155 Consolidated and Separate Financial Statements for the period ended 30 June, 2019

Directors’ Report - Continued
Employment and employees- Continued
Health, Safety at Work and Welfare of Employees
Employee Involvement and Training
Research and Development
Demographics of our workforce
Staff distribution by gender as at June 30, 2019
Description Gender Head Count % of Total
Male 7,218 55%
Female 5,906 45%
Total 13,124 100%
Male 5,236 54%
Female 4,439 46%
Total 9,675 100%
Description Gender Head Count % of Total
Male 14 78%
Female 4 22%
Total 18 100%
Male 78 78%
Female 22 22%
Total 100 100%
Bank
The Bank maintains business premises designed with a view to guaranteeing the safety and healthy working conditions of its
employees and customers alike. Employees are adequately insured against occupational and other hazards. The Bank has a
comprehensive health insurance scheme for staff, through which medical needs of staff and their immediate family members
are met. In addition, the Bank provides first aid in all business offices and has a medical facility at the Head Office. As a part of
the investment in the welfare of staff, the Bank maintains an ultra-modern gym facility at the head-office and organizes a
quarterly fitness session (tagged “jogging to bond”), held at different stadia across all its countries of operation, thereby
providing access to various sporting facilities and professional instructors.
Fire prevention and firefighting equipment are installed in strategic locations at all business offices, in addition to hosting a full
fire service operation at the Head Office.
The Bank encourages participation of its employees in arriving at decisions in respect of matters affecting their well-being. To this
end, the Bank provides formal and informal opportunities where employees deliberate on issues affecting the Bank and
employees’ interest, with a view to making inputs to decision thereon. The Bank places premium on the development of its
manpower. In addition to the routine online Executive Chat, wherein employees interact with the Management to discuss issues
of customer and employee satisfaction, the GMD/CEO operates an open-door policy and encourages employees to channel
suggestions and complaints to him as may be required. The Human Capital Management Division also holds monthly “HR
Clinic”, a personalized avenue to address relevant employee welfare and career satisfaction issues.
As a part of its daily business, the Bank carries out research into new banking products and services to anticipate and meet
customers’ needs and to ensure excellent service is delivered at all times.
During the period under review, the Group employed staff across the different businesses and geographies where it operates.
Below are the details of the employee demographics:
Group**
** The Group count includes UBA New York,UBA UK, UBA Pensions and all other 19 African countries.
Average gender analysis of the Bank’s Board of Directors and Top Management Staff as at June 30, 2019:
Board of Directors
Top Management
Page 6 of 155 Consolidated and Separate Financial Statements for the period ended 30 June, 2019

Directors’ Report - Continued
Employment and employees - continued
11 Staff distribution by gender as at June 30 2019
12 Post balance sheet events
13 Audit Committee
Mr. Feyi Ogoji Chairman/Shareholder
Mr. Matthew Esonanjor Shareholder
Alhaji AlKassim Umar Shareholder
Ms. Angela Aneke Non-Executive Director
Mr. Abdulqadir J. Bello Non-Executive Director
Mr. Kayode Fasola Non-Executive Director
The functions of the Audit Committee are as laid down in Section 359(6) of the Companies and Allied Matters Act.
By the Order of the Board
BILI A. ODUM
GROUP COMPANY SECRETARY
57 Marina, Lagos
August 22, 2019
FRC/2013/NBA/00000001954
Pursuant to Section 359(3) of the Companies and Allied Matters Act, the Bank has an Audit Committee comprising three Non-
Executive Directors and three Shareholders as follows:
Detailed average gender analysis of Board of Directors and Top Management Staff as at 30 June 2019:
There is no event that has any material impact on the bank's balance sheet, post June 30, 2019.
Head Count % of Total Head Count % of Total
Non-Executive Directors 5 56% 4 44% 9
Executive Directors 9 100% - - 9
General Managers 25 78% 7 22% 32
Deputy General Managers 13 57% 10 43% 23
Assistant General Managers 31 86% 5 14% 36
Total 83 76% 26 24% 109
DescriptionMale Female
Total
Page 7 of 155 Consolidated and Separate Financial Statements for the period ended 30 June, 2019

Introduction
Complaints Channels
COMPLAINTS AND FEEDBACK
United Bank for Africa Plc is a customer-focused Pan-African financial services Group. Our aim is to deliver excellent
customer service and provide high quality financial solutions to our over 18 million customers in the 23 countries where we
operate. At each of our multiple contact points with customers, we aim to proactively exceed their expectations. Customer
feedback is thus an effective tool in our relentless effort to delight our customers at all points of interaction with the Bank.
To achieve excellent customer service delivery in line with the Bank’s focus, UBA Staff worldwide are continuously trained to
have a strong customer service orientation and be customer-centric in every aspect of the Bank’s operations, thereby
fulfilling the Bank’s promise to Customers, as contained in its customer service charter. The Bank’s customer service charter
requires all staff to;
• Be respectful - We know the ‘The Customer is King’ and is the purpose of our business;
• Be courteous and friendly in all our interactions with the customer;
• Process transactions without delay and attend to enquiries promptly;
• Investigate and resolve complaints promptly;
• Listen attentively to our Customers verbal and non - verbal cues and take requisite actions to fulfil and surpass their
expectations;
• Communicate honestly and proactively;
• Leverage our technical knowledge to fully support the customer’s needs;
• Show appreciation at all times.
• Exemplify UBA’s core values –Enterprise, Excellence, Execution in all customer interactions
To ensure an effective feedback process, UBA has established different channels through which customers can reach the
Bank on all issues – be it an enquiry/complaint/request or a feedback. The channels include;
• Customer Fulfilment Centre (CFC)
• UBA Website
• Post
• Business Offices
(1) Customer Fulfillment Center (CFC)
Within the confines of the CFC, there are various interactive touch points via which our customers can connect with the
Bank; • A 24/7 Multi-Lingual Customer Interactive Centre, where our customers can call in to lodge complaints, make requests
or enquiries about our products and services.
• Designated Hotlines in the branches – Branded toll-free lines dubbed ‘UBA Hotline’ have been placed across our
Business Offices, ostensibly to enable customers call the Customer Fulfilment Centre to relay their complaints, requests and
enquiries with utmost ease and convenience. Calls received through this channel are handled by designated Customer
Experience Experts (CEEs). All calls through this medium are prioritised, to reassure our customers of the Bank’s total
commitment to serve them.
• Dedicated Customer Support e-mail address – A dedicated e-mail address- [email protected] is available to
customers 24/7, to send in their complaints/requests/enquiries. This e-mail channel is manned by our highly skilled and
efficient CEEs that accurately deliver high quality service to our UBA customers and prospects alike.
• 24/7 Live Chat Customer Support- Customers can “Live Chat with us” from various touch points located on the website
and e-channels such as Mobile Banking, Internet Banking, LEO WhatsApp and UBA Video Banking
• UBA LEO Chat Bot- Our Artificial Intelligence Chat Bot-LEO, situated on Facebook, is enhanced to render virtual support
round the clock to customers wherein their respective complaints/requests and enquiries are lodged and handled by the
Chat Bot
• Our UBA Social Media handles on Twitter (@UBACares), Facebook and Instagram (@ubagroup) are socially engaging
digital platforms via which existing and potential customers can reach out to the bank
Page 8 of 155 Consolidated and Separate Financial Statements for the period ended 30 June, 2019

Complaints and Feedback - Continued
Complaints Channels - Continued
Resolution Structure
Jun-19 Dec-18 Jun-19 Dec-18 Jun-19 Dec-18
Pending Complaints B/F 26,549 15,566 7,944 11,577
Received Complaints 552,759 599,956 1,487 403,490
Resolved Complaints 551,380 588,965 7,633 406,887 136 356
Complaints Escalated to CBN 14 8 1,797 235
Complaints Pending with the Bank C/F 27,914 26,549 7,944
% of Complaint/Transaction Volume 0.20% 0.15%
Feedback on customers’ complaints to the Bank – Monthly Complaints Dash Board
The process flow of customer complaint and resolution is as follows:
(i) The Bank’s touch points (Business offices, Website and CFC (Calls, Telemarketing, E-mail, Social media, e.g. Twitter,
Facebook & Instagram) that receive the customers' complaints acknowledge and register them on the Group Response
Portal (GRP), the bank’s automated complaints management system.
(2) UBA Website
On the UBA website www.ubagroup.com, customers can also log in and register their complaints through the link “Do You
Have Feedback?” Such Complaints are automatically routed to the CFC for resolution. Customers also have the option of
chatting online real time with our highly skilled CEEs through the ’Live Chat’ Facebook Messenger Icon hosted on the
website (3) Post
A dedicated Post Office Box number - 5551 is also available exclusively for receiving customer complaints by post.
(4) Business Offices
Our business offices strategically located nationwide and in 20 African Countries are manned by well trained, enthusiastic
and adept Customer Service officers who tend to our esteemed customers, providing excellent and exceptional service,
which is best in class.
To ensure that Customers' complaints, enquiries and requests are promptly resolved, the Bank has put in place a dedicated
Complaints’ Management Team supervised by a Senior Officer of the Bank, who is responsible for prompt investigation and
resolution of customers’ complaints within the approved framework and timelines. The unit is manned by highly skilled
personnel with rich and diverse banking experience to promptly resolve customer complaints. The Bank maintains a robust
Customer Complaints Management system called - Group Response Portal (GRP), which is managed by well trained staff of
the Customer Fulfilment Centre (CFC) and reports generated are periodically reviewed by Executive Management to see
where processes can be improved to enhance overall customer experience.
The GRP ensures that customers’ issues are promptly treated as specified within the established framework and turnaround
time.
(ii) The complaint is reviewed and it is determined if could be resolved at first level.
(iii) Where the complaint can be resolved at the first level, an immediate resolution is provided to the customer.
(iv) If such complaint cannot be resolved at the first level, the handling Officer forwards the complaint to the responsible unit
to resolve
(v) Upon resolution, the required feedback is provided to the customer.
(vi) The complaint is then closed in the system.
(vii) Where customer is not satisfied with the resolution outcome and a rejoinder is sent, more attention is given to it by the
Unit to further analyze and resolve the issues raised and the final outcome communicated to the customer.
Disclosure of Customer Complaints for the Period Ended June 30, 2019
DescriptionNumber Amount Claimed Amount Refunded
A Monthly Performance Feedback dash board on customers’ complaints is provided to Management and relevant
Departments within the Bank to address the root causes of complaints and issues raised by our customers variously.
The feedback dash board ensures that:
(i) Improvement opportunities are quickly identified and brought to bear
(ii) The quality of customer service is improved and standardized across all the customer touch points of the Bank
(iii) Customer retention is improved through increased customer satisfaction
(iv) Training and re-training is also done on a regular basis to keep abreast the developments in the industry.
Page 9 of 155 Consolidated and Separate Financial Statements for the period ended 30 June, 2019

Investor Complaint Channels
UBA Plc has a Complaint Framework for Investors and the Investing Public. This policy is published on the Bank’s website;
www.ubagroup.com/investor-relations/ , together with the Complaint Help Channels, which are stated below. Email: [email protected]
Telephone: +234-1-2808349
Mailing Address: Head, Investor Relations, UBA House, 57, Marina, Lagos.
Shareholders who have any complaint are enjoined to kindly contact the investor relations unit of the Bank for prompt
resolution. Shareholders can also request copies (electronic or hard copies) of the complaint framework, which can also
be downloaded on our website in the address stated above.
Page 10 of 155 Consolidated and Separate Financial Statements for the period ended 30 June, 2019

1. Board of Directors
2. Board Committees
3. Executive Management Committees
(a) The Board
United Bank for Africa Plc (UBA Plc) holds good governance as one of its core values and confirms its commitment to the
implementation of effective corporate governance principles in its business operations. The Directors endorse the
principles of best practice Corporate Governance as stated in the “Code of Corporate Governance for Banks and
Discount Houses in Nigeria 2014” issued by the Central Bank of Nigeria (CBN) and the Securities and Exchange
Commission’s (SE C) “Code of Corporate Governance”.
CORPORATE GOVERNANCE
The Board of Directors of UBA Plc has the overall responsibility for ensuring that the highest standards of corporate
governance are maintained and adhered to by the Bank. In order to promote effective governance of the UBA Group,
the following structures have been put in place for the execution of UBA Plc’s Corporate Governance strategy:
As at June 30, 2019, the Board comprised a Non-Executive Chairman, a Non-Executive Vice Chairman, seven (7) other
Non-Executive Directors, which includes, two (2) Independent Non-Executive Directors and nine (9) Executive Directors
(which include the GMD/CEO and the Deputy Managing Director), all of whom bring a wide range of skills and
experience to the Board.
The Board of Directors carries out its responsibility through its standing Committees. These are the Board Audit and
Governance Committee, the Board Risk Management Committee, the Finance and General Purpose Committee, the
Board Credit Committee and the Statutory Audit Committee. Through the workings of these committees, the Board sets
broad policy guidelines and ensures the proper management and direction of the Bank.
In addition to the Board Committees, there are a number of Management Committees which ensure effective and good
corporate governance at the managerial level.
The Board presently consists of nineteen members, nine of whom, are Executive Directors and 10 Non-Executive Directors.
The Non-Executive Directors have the requisite integrity, skills and experience to bring independent judgment to bear on
Board deliberations and discussions.
Responsibility:
The roles of Chairman and Chief Executive Officer are separated and clearly defined. The Chairman is primarily responsible
for the working of the Board whilst the Chief Executive Officer is responsible for the running of the business and
implementation of Board strategy and policy. The Chief Executive Officer is assisted in managing the business of the Bank on
a day-to-day basis by the Executive Management Committee, which he chairs and comprises all Executive Directors and
other critical functional heads. The Board’s primary responsibility is to increase shareholder wealth. The Board is accountable
to shareholders and is responsible for the management of the relationships with its various stakeholders.
Executive Management is accountable to the Board for the development and implementation of strategy and policies.
The Board regularly reviews group performance, matters of strategic concern and any other matters it regards as material.
The Board meets quarterly and additional meetings are convened as the need arises. In the first half of 2019, the Board
met two (2) times.
The Board is also responsible for the Bank’s structure and areas of operation, financial reporting, ensuring there is an
effective system of internal control and risk management and appointments to the Board. The Board has the authority to
delegate matters to Directors, Board Committees and the Executive Management Committee.
Professional Independent Advice:
All Directors are aware that they may take independent professional advice at the expense of the Bank, in the furtherance
of their duties. They all have access to the advice and services of the Company Secretary, who is responsible to the Board
for ensuring that all governance matters are complied with and assists with professional development as required.
Page 11 of 155 Consolidated and Separate Financial Statements for the period ended 30 June, 2019

Corporate Governance - Continued
(b) Accountability and audit
(c ) Control environment
(d) Shareholder rights
(e ) Board Committees
(1) Board Audit and Governance Committee
The Board has continued to place emphasis on risk management as an essential tool for achieving the Group’s objectives.
Towards this end, it has ensured that the Group has in place, robust risk management policies and mechanisms to ensure
identification of risk and effective control.
Financial Reporting
The Board has presented a balanced assessment of the Company’s position and prospects. The Board is mindful of its
responsibilities and is satisfied that in the preparation of its Financial Report, it has met its obligation under the Group’s
Code of Corporate Governance.
The Directors make themselves accountable to the shareholders through regular publication of the Group’s financial
performance and Annual Reports. The Board has ensured that the Group’s reporting procedure is conveyed on the most
recent infrastructure to ensure accuracy. This procedure involves the monitoring of performance throughout the financial
year, in addition to monthly reporting of key performance indicators.
PricewaterhouseCoopers acted as external auditors to the Group during the half year ending June 30, 2019. Their report is
contained in this Annual Report.
Internal Controls
The Group has consistently improved its internal control system to ensure effective management of risks. The Directors review
the effectiveness of the system of internal control through regular reports and reviews at Board and Risk Management
Committee meetings.
The Board approves the annual budget for the Group and ensures that a robust budgetary process is operated with
adequate authorization levels put in place to regulate capital and operating expenses.
The Board of UBA Plc has always placed considerable emphasis on effective communication with its shareholders. It ensures
that the rights of shareholders are always protected. Notice of meetings and all other statutory notices and information are
communicated to the shareholders regularly. The Bank ensures the protection of statutory and general rights of shareholders
at all times, particularly their right to vote at General Meetings. All shareholders are treated equally regardless of their equity
interest or social status.
The General Meeting of Shareholders is the highest decision-making body of the Bank and meetings are conducted in a fair
and transparent manner that gives shareholders the opportunity to express their opinion. The Group publishes quarterly, half-
yearly and annual reports on its website as well as national newspapers. The Group also provides investor presentations and
other relevant communications that provide requisite information to shareholders and the general public, especially as
regards the performance, strategy and developments in the Group.
Besides, the Group maintains an Investor Relations unit which routinely attends to shareholders’ enquiries and ensures that
shareholders’ views are appropriately escalated to the Management and Board on a continuous basis. In addition,
shareholders are encouraged to continuously communicate their opinions and recommendations whenever they see the
need to do so, to either the Head of Investor Relations or the Company Secretary. Their contact details are available on the
Bank’s website.
The Board of UBA Plc has the following Committees, namely:
1. Board Audit & Governance Committee
2. Board Credit Committee
3. Board Risk Management Committee
4. Finance and General Purpose Committee
The Board Audit and Governance Committee which is a merger of the Board Audit Committee and the Nominations and
Governance Committee is comprised as follows:
1. Ms. Angela Aneke - Chairman
2. Mr. Abdulqadir J. Bello - Member
3. Mrs. Foluke Abdulrazaq - Member
4. Mrs. Owanari Duke - Member
5. Erelu Angela Adebayo - Member
The Board Audit and Governance Committee combines the roles and responsibilities of the Board Audit and Nominations
& Governance Committees.
Page 12 of 155 Consolidated and Separate Financial Statements for the period ended 30 June, 2019
Corporate Governance - Continued
Board Committees - continued
(2) Board Credit Committee
(3) Board Risk Management Committee
The Statutory Board Audit Committee was set up in accordance with the provisions of the Companies and Allied Matters
Act, CAP20, 2004. It comprises of a mixture of Non-Executive Directors and ordinary shareholders elected at the Annual
General Meeting.
Its terms of reference include the monitoring of processes designed to ensure compliance by the Group in all respects
with legal and regulatory requirements, including disclosure, controls and procedures and the impact (or potential
impact) of developments related thereto. It evaluates annually, the independence and performance of the External
Auditors. The Committee also reviews with Management and the External Auditors the annual audited financial statement
before its submission to the Board. The Members of the Statutory Audit Committee are as follows:
1. Mr. Feyi Ogoji - Chairman/Shareholder
2. Mr. Matthew Esonanjor - Shareholder
3. Alhaji Umar Al-Kassim - Shareholder
4. Ms. Angela Aneke - Non-Executive Director
5. Mr. Abdulqadir J. Bello - Non-Executive Director
6. Mr Isaac Olukayode Fasola - Non-Executive Director
The Board Credit Committee is made up of five (5) Non-Executive Directors. It reviews all credits granted by the Bank and
meetings are held at least once a quarter. Members of the Board Credit Committee are:
1. Mr. Abdulqadir J. Bello - Chairman
2. Mrs. Foluke Abdulrazaq - Member
3. Ms. Angela Aneke - Member
4. Mrs. Owanari Duke - Member
5. Mr. Kayode Fasola - Member
The Board Credit Committee was set up to assist the Board of Directors to discharge its responsibility to exercise due care,
diligence and skill to oversee, direct and review the management of the credit portfolio of the Group. Its terms of reference
include determining and setting the parameters for credit risk and asset concentration and reviewing compliance within
such limits; determining and setting the lending limits, reviewing and approving the Group’s credit strategy and the credit
risk tolerance. The Committee reviews the Loan portfolio of the Bank and reviews and approves country risks exposure limits.
During the Half Year ending June 30, 2019, the Board Risk Management Committee comprised of the following Directors:
1. High Chief Samuel Oni, FCA - Chairman
2. Mr. Kayode Fasola - Member
3. Erelu Angela Adebayo - Member
4. Mr. Kennedy Uzoka - Member
5. Mr. Victor Osadolor - Member
6. Mr. Chukwuma Nweke - Member
7. Mr. Uche Ike - Member
(4) Finance and General Purpose Committee
Meetings are held at least once a quarter and the responsibilities of the Committee include to review and recommend risk
management strategies, policies and risk tolerance for the Board’s approval; to review management’s periodic reports on
risk exposure, risk portfolio composition and risk management activities; and to consider and examine such other matters as
the Board requires, the Committee considers appropriate, or which are brought to its attention, and make
recommendations or reports to the Board accordingly. During the Half Year ended June 30, 2019, the Members of the
Finance & General Committee were as follows:
1. Mr. Kayode Fasola - Chairman
2. Mr. Abdulqadir J. Bello - Member
3. Erelu Angela Adebayo - Member
4. Ms. Angela Aneke - Member
5. Mr. Kennedy Uzoka - Member
6. Mr. Victor Osadolor - Member
7. Mr. Chukwuma Nweke - Member
8. Mr. Uche Ike - Member
(5) Statutory Audit Committee
Page 13 of 155 Consolidated and Separate Financial Statements for the period ended 30 June, 2019

Corporate Governance - Continued
Board Committees - continued
Members
Mr. Tony O. Elumelu, CON
Ambassador Joe Keshi, OON
Mr. Kennedy Uzoka
Mr. Victor Osadolor
Mr. Dan Okeke
Mr. Emeke Iweriebor
Mr. Oliver Alawuba
Mr. Ayoku Liadi
Mr. Ibrahim Puri
Mr. Uche Ike
Mr. Chukwuma Nweke
Mrs. Foluke Abdulrazaq
Mrs. Owanari Duke
High Chief Samuel Oni, FCA
Ms. Angela Aneke
Erelu Angela Adebayo
Mr. Abdulqadir J. Bello
Mr. Kayode Fasola
Chief Kola Jamodu CFR*
*Retired January 28, 2019
The Statutory Board Audit Committee was set up in accordance with the provisions of the Companies and Allied Matters
Act, CAP20, 2004. It comprises of a mixture of Non-Executive Directors and ordinary shareholders elected at the Annual
General Meeting.
Its terms of reference include the monitoring of processes designed to ensure compliance by the Group in all respects
with legal and regulatory requirements, including disclosure, controls and procedures and the impact (or potential
impact) of developments related thereto. It evaluates annually, the independence and performance of the External
Auditors. The Committee also reviews with Management and the External Auditors the annual audited financial statement
before its submission to the Board. The Members of the Statutory Audit Committee are as follows:
1. Mr. Feyi Ogoji - Chairman/Shareholder
2. Mr. Matthew Esonanjor - Shareholder
3. Alhaji Umar Al-Kassim - Shareholder
4. Ms. Angela Aneke - Non-Executive Director
5. Mr. Abdulqadir J. Bello - Non-Executive Director
6. Mr Isaac Olukayode Fasola - Non-Executive Director
Attendance at Board Meetings
Membership and attendance at Board Meetings during the half year ended June 30, 2019 are set out below:
Number of meetings heldNumber of meetings
attended by members
2 2
2 2
2 2
2 2
2 1
2 2
2 2
2 2
2 2
2 2
2 2
2 1
2 2
2 2
2 2
2 2
2 2
2 2
2 1
(6) Executive Management Committees
These are Committees comprising of senior management of the Bank. The committees are also risk-driven, as they are
basically set up to identify, analyze, synthesize and make recommendations on risks arising from day to day activities of
the Bank. They also ensure that risk limits as contained in the Board and Regulatory policies are complied with at all times.
They provide inputs for the respective Board Committees and also ensure that recommendations of the Board
Committees are effectively and efficiently implemented. They meet as frequently as risk issues occur to immediately take
actions and decisions within the confines of their powers. Some of these Executive Management Committees include the
Group Asset and Liabilities Committee (GALCO), the Executive Credit Committee (ECC), the Operational Efficiency
Committee (OEC) / IT Risk Committee, the Group Risk Management Committee (GRMC) and the Executive Management
Committee (EMC).
Page 14 of 155 Consolidated and Separate Financial Statements for the period ended 30 June, 2019

Corporate Governance - Continued
Signed on behalf of the Directors:
KENNEDY UZOKA
GROUP MANAGING DIRECTOR/CEO
FRC/2013/IODN/00000015087
The Directors believe that the half year ended June 30, 2019 financial statements represents the state of the financial
affairs of the Bank and Group. The Directors accept responsibility for the maintenance of accounting records that may be
relied upon in the preparation of the financial statements as well as adequate systems of financial control. Nothing has
come to the attention of the Directors to indicate that the Group will not remain a going concern for at least twelve
months from the date of this statement.
STATEMENT OF DIRECTORS’ RESPONSIBILITIES IN RELATION TO THE FINANCIAL
STATEMENTS FOR THE HALF YEAR ENDED JUNE 30, 2019
In accordance with the provisions of Sections 334 and 335 of the Companies and Allied Matters Act and Sections 24 and
28 of the Banks and Other Financial Institutions Act, the Directors are responsible for the preparation of the financial
statements which give a true and fair view of the state of affairs of the Bank and of the profit or loss for the half year
ended June 30, 2019 and in so doing they ensure that:
(i) Proper accounting records are maintained;
(ii) Applicable accounting standards are followed;
(iii) Suitable accounting policies are adopted and consistently applied;
(iv) Judgments and estimates made are reasonable and prudent;
(v) The going concern basis is used, unless it is inappropriate to presume that the Bank will continue in business; and
(vi) Internal control procedures are instituted which as far as reasonably possible, safeguard the assets of the Bank and
prevent and detect fraud and other irregularities.
The Directors accept responsibility for the preparation of the financial statements that are in accordance with the
International Financial Reporting standards (IFRS) and in the manner required by the Companies and Allied Matters Act,
the Financial Reporting Council of Nigeria Act 2011, the Banks and Other Financial Institutions Act, the Central Bank of
Nigeria Prudential guidelines and other relevant regulations issued by the Central Bank of Nigeria.
Page 15 of 155 Consolidated and Separate Financial Statements for the period ended 30 June, 2019

Page 16 of 155 Consolidated and Separate Financial Statements for the period ended 30 June, 2019


United Bank for Africa Plc
Interim Consolidated and Separate Statements of Comprehensive IncomeFor the period ended 30 June
Notes
In millions of Nigerian Naira 2019 2018 2019 2018
Interest income 10 204,885 187,294 155,027 128,137
Interest income on amortised cost and FVOCI securities 204,781 184,960 154,923 125,803
Interest income on FVTPL securities 104 2,334 104 2,334
Interest expense 11 (94,762) (76,218) (81,702) (61,169)
Net interest income 110,123 111,076 73,325 66,968
Allowance for credit losses on financial assets 12 (3,120) (6,732) (3,071) (1,648)
Net interest income after impairment on loans and receivables 107,003 104,344 70,254 65,320
Fees and commission income 13 52,344 45,845 30,587 28,345
Fees and commission expense 14 (16,289) (13,248) (11,547) (10,218)
Net fee and commission income 36,055 32,597 19,040 18,127
Net trading and foreign exchange income 15 32,746 20,456 20,546 18,216
Other operating income 16 3,715 4,323 8,235 5,426
Employee benefit expenses 17 (37,178) (35,214) (20,775) (20,449)
Depreciation and amortisation 18 (8,812) (5,659) (5,930) (4,026)
Other operating expenses 19 (63,597) (62,831) (47,740) (48,438)
Share of gain of equity-accounted investee 28(a) 342 124 - -
Profit before income tax 70,274 58,140 43,630 34,176
Income tax expense 20 (13,535) (14,348) (7,164) (12,529)
Profit for the year from continuing operations 56,739 43,792 36,466 21,647
Profit for the year from discontinued operations - - - -
Profit for the period 56,739 43,792 36,466 21,647
Other comprehensive income
Items that may be reclassified to the income statement:
Exchange differences on translation of foreign operations (11,350) (14,946) - -
Fair value changes on investments in debt securities at fair
value through other comprehensive income(FVOCI):
Net change in fair value during the period 12,634 (1,030) 12,547 (1,030)
Net amount transferred to the income statement 1,758 (807) 1,758 (807)
3,042 (16,783) 14,305 (1,837)
Items that will not be reclassified to the income statement:
Fair value changes on equity investments designated at
FVOCI 2,299 3,472 2,299 3,472
2,299 3,472 2,299 3,472
Other comprehensive income for the period, net of tax 5,341 (13,311) 16,604 1,635
Total comprehensive income for the period 62,080 30,481 53,070 23,282
Profit for the period attributable to:
Owners of Parent 55,295 42,192 36,466 21,647 Non-controlling interest 1,444 1,600 - - Profit for the period 56,739 43,792 36,466 21,647
Total comprehensive income attributable to:
Owners of Parent 62,511 30,748 53,070 23,282 Non-controlling interest (431) (267) - -
Total comprehensive income for the period 62,080 30,481 53,070 23,282
Earnings per share attributable to owners of the parent
Basic and diluted earnings per share (Naira) 21 1.62 1.23 1.07 0.63
The accompanying notes are an integral part of these consolidated and separate financial statements.
Group Bank
Page 23 of 155 Consolidated and Separate Financial Statements for the period ended 30 June, 2019

United Bank for Africa Plc
Interim Consolidated and Separate Statements of Financial Position
Notes
Jun. 2019 Dec. 2018 Jun. 2019 Dec. 2018
In millions of Nigerian Naira
ASSETS
Cash and bank balances 22 1,416,170 1,220,596 1,205,804 1,015,199
Financial assets at fair value through profit or loss 23 89,419 19,439 72,783 19,439
Derivative assets 33(a) 41,948 34,784 41,948 34,784
Loans and advances to banks 24 81,257 15,797 59,078 15,516
Loans and advances to customers 25 1,687,506 1,715,285 1,192,564 1,213,801
Investment securities: 26
- Fair value through other comprehensive income 26 924,415 1,036,653 851,720 925,892
- Held at amortised cost 26 616,411 600,479 83,165 84,265
Other assets 27 81,318 63,012 65,751 49,642
Investment in equity-accounted investee 28 3,889 4,610 2,715 2,715
Investment in subsidiaries 29 - - 103,275 103,777
Property and equipment 30 118,571 115,973 100,138 97,502
Intangible assets 31 17,969 18,168 7,056 6,911
Deferred tax asset 32 23,250 24,942 21,862 21,862
TOTAL ASSETS 5,102,123 4,869,738 3,807,859 3,591,305
LIABILITIES
Derivative liabilities 33(b) 1,285 99 1,285 99
Deposits from banks 34 171,191 174,836 25,608 30,502
Deposits from customers 35 3,510,237 3,349,120 2,557,366 2,424,108
Other liabilities 36 150,885 120,764 102,256 84,299
Current tax liability 20 6,317 8,892 6,293 706
Borrowings 37 689,637 683,532 689,637 657,134
Subordinated liabilities 38 29,976 29,859 29,976 29,859
Deferred tax liability 32 137 28 - -
TOTAL LIABILITIES 4,559,665 4,367,130 3,412,421 3,226,707
EQUITY
Share capital 39 17,100 17,100 17,100 17,100
Share premium 39 98,715 98,715 98,715 98,715
Retained earnings 39 195,065 168,073 89,153 89,217
Other reserves 39 212,870 199,581 190,470 159,566
EQUITY ATTRIBUTABLE TO OWNERS 523,750 483,469 395,438 364,598
OF THE PARENT
Non-controlling interests 29 18,708 19,139 - -
TOTAL EQUITY 542,458 502,608 395,438 364,598
TOTAL LIABILITIES AND EQUITY 5,102,123 4,869,738 3,807,859 3,591,305
The accompanying notes are an integral part of these consolidated and separate financial statements.
The financial statements were approved by the directors on August 22, 2019.
Ugo A. Nwaghodoh
Group Chief Finance Officer
FRC/2012/ICAN/00000000272
Kennedy Uzoka
Group Managing Director/CEO
FRC/2013/IODN/00000015087
Tony O. Elumelu , CON
Chairman, Board of Directors
FRC/2013/CIBN/00000002590
Group Bank
As at
Page 24 of 155 Consolidated and Separate Financial Statements for the period ended 30 June, 2019

United Bank for Africa Plc
Interim Consolidated and Separate Statements of Changes in Equity
For the period ended
(a) 30 June 2019
(i) Group
In millions of Nigerian naira Regulatory Fair Non-
Share Share Translation credit risk value Treasury Statutory Retained Controlling Total
Capital premium reserve reserve reserve shares reserve earnings Total interest equity
At 31 December 2017 (IAS 39) 17,100 98,715 37,102 45,236 73,897 - 84,626 152,872 509,548 18,231 527,779
Fair value change in assets reclassified from HTM to FVOCI 7,211 7,211 0 7,211
Increase in impairment provision due to adoption of IFRS 9 (48,644) (48,644) 0 (48,644)
Transfer between reserves (44,304) 44,304 0 0 0
Balance at 1 January 2018 (IFRS 9) 17,100 98,715 37,102 932 81,108 - 84,626 148,532 468,115 18,231 486,346
Profit for the period - - - - - - - 42,192 42,192 1,600 43,792
Exchange differences on translation of foreign
operations
- - (13,079) - - - - - (13,079) (1,867) (14,946)
Fair value change in available-for-sale financial assets - - - - 2,442 - - - 2,442 - 2,442
Net amount transferred to income statement - - - - (807) - - - (807) - (807)
Total comprehensive income for the period - - (13,079) - 1,635 - - 42,192 30,748 (267) 30,481
Transfer between reserves - - - - - - 5,369 (5,369) - - -
Transactions with owners
Dividends paid - - - - - - - (22,230) (22,230) - (22,230)
Balance at 30 June 2018 17,100 98,715 24,023 932 82,743 - 89,995 163,125 476,633 17,964 494,597
At 31 December 2018 17,100 98,715 18,178 21,521 69,099 - 90,783 168,073 483,469 19,139 502,608
At 1 January 2019 17,100 98,715 18,178 21,521 69,099 - 90,783 168,073 483,469 19,139 502,608
Profit for the period - - - - - - - 55,295 55,295 1,444 56,739
Exchange differences on translation of foreign
operations
- - (9,475) - - - - - (9,475) (1,875) (11,350)
Fair value change in financial assets classified as FVOCI - - - - 14,933 - - - 14,933 - 14,933
Net amount transferred to income statement - - - - 1,758 - - - 1,758 - 1,758
Total comprehensive income for the period - - (9,475) - 16,691 - - 55,295 62,511 (431) 62,080
Transfer between reserves - - - 6,073 - - - (6,073) - - -
Transactions with owners
Dividends paid - - - - - - - (22,230) (22,230) - (22,230)
Balance at 30 June 2019 17,100 98,715 8,703 27,594 85,790 - 90,783 195,065 523,750 18,708 542,458
Attributable to equity holders of the parent
Page 25 of 155 Consolidated and Separate Financial Statements for the period ended 30 June, 2019

United Bank for Africa Plc
(ii) Bank
In millions of Nigerian naira Regulatory Fair
Share Share credit risk value Statutory Retained
Capital premium reserve reserve reserve earnings Total
At 31 December 2017 (IAS 39) 17,100 98,715 44,373 74,549 68,446 97,677 400,860
Fair value change in assets reclassified from HTM to FVOCI - - - 7,211 - 7,211
Increase in impairment provision due to adoption of IFRS 9 - - - - - (43,441) ( 43,441)
Transfer between reserves - - (43,441) - - 43,441 -
Balance at 1 January 2018 (IFRS 9) 17,100 98,715 932 81,760 68,446 97,677 364,630
Profit for the period - - - - - 21,647 21,647
Fair value change in available-for-sale financial assets - - - 2,442 - - 2,442
Net amount transferred to income statement - - - (807) - - (807)
Total comprehensive income for the period - - - 1,635 - 21,647 23,282
Transfer between reserves - - - - 5,369 (5,369) -
Transactions with owners
Dividends paid - - - - - (22,230) (22,230)
Balance at 30 June 2018 17,100 98,715 932 83,395 73,815 91,725 365,682
At 31 December 2018 17,100 98,715 15,212 69,751 74,603 89,217 364,598
At 1 January 2019 17,100 98,715 15,212 69,751 74,603 89,217 364,598
Profit for the period - - - - - 36,466 36,466
Fair value change in financial assets classified as FVOCI - - - 14,846 - - 14,846
Net amount transferred to income statement - - - 1,758 - - 1,758
Total comprehensive income for the period - - - 16,604 - 36,466 53,070
Transfer between reserves - - 14,300 - (14,300) -
Transactions with owners
Dividends paid - - - - - (22,230) (22,230)
Balance at 30 June 2019 17,100 98,715 29,512 86,355 74,603 89,153 395,438
Page 26 of 155 Consolidated and Separate Financial Statements for the period ended 30 June, 2019

United Bank for Africa Plc
Interim Consolidated and Separate Statements of Cash Flows
For the period ended 30 June Notes 2019 2018 2019 2018
In millions of Nigerian Naira
Cash flows from operating activities
Profit before income tax 70,274 58,140 43,630 34,176
Adjustments for:
Depreciation of property and equipment 18 6,015 4,883 4,451 3,401
Amortisation of intangible assets 18 838 776 693 625
Allowance for credit loss/(write back) on loans to customers 12 (232) 6,989 89 1,187
Allowance for credit loss on loans to banks 12 1,764 76 1,764 49
Write-off of loans and advances 12 553 1,308 461 785
Impairment charge on other assets 12 370 201 91 -
Net fair value gain on derivatives 15 (5,979) (12,611) (5,979) (12,927)
Foreign currency revaluation loss/(gain) 15 (1,111) 2,354 (10) 4,410
Dividend income 16 (3,105) (2,956) (7,731) (4,628)
Loss on disposal of property and equipment 19 14 - 14 -
Write-off of property and equipment 30 13 12 13 12
Net amount transferred to the income statement 1,758 (807) 1,758 (807)
Origination and reversal of temporary differences 371 174 - -
Net interest income (110,123) (111,076) (73,325) (66,968)
Share of (gain) of equity-accounted investee 28 (342) (124) - -
(38,922) (52,661) (34,081) (40,685)
Changes in operating assets and liabilities
Change in financial assets measure at FVTPL (66,000) (94,725) (49,364) (3,300)
Change in cash reserve balance (18,509) (39,920) (15,051) (58,133)
Change in loans and advances to banks (67,224) 10,453 (45,326) 10,031
Change in loans and advances to customers 27,458 98,729 20,687 (26,061)
Change in money market placements 81,552 (5,219) 31,193 7,434
Change in other assets (26,836) 3,737 (16,190) 45,363
Change in deposits from banks (3,645) 167,856 (4,894) 121,233
Change in deposits from customers 201,259 (60,609) 133,258 (5,107)
Change in other liabilities and provisions 30,121 6,335 17,958 9,953
Interest received 204,885 187,294 155,027 128,137
Interest paid on deposits from banks and customers (73,712) (74,500) (60,984) (59,683)
Income tax paid 20(c) (14,680) (21,822) (1,577) (9,389)
Net cash generated from/(used in) operating activities 235,747 124,948 130,656 119,793
Cash flows from investing activities
Proceeds from sale/redemption of investment securities 39,166 30,748 8,512 7,211
Purchase of investment securities (95,954) (95,559) (67,848) (142,362)
Purchase of property and equipment 30 (9,553) (8,106) (7,208) (5,420)
Purchase of intangible assets 31 (1,023) (912) (850) (663)
Liquidation of / (additional investment) in associates/subsidiaries (179) (945) 502 (945)
Proceeds from disposal of property and equipment intangibles 461 441 108 119
Dividend received 3,105 2,956 7,731 4,628
Net cash used in investing activities (63,977) (71,378) (59,053) (137,432)
Cash flows from financing activities
Proceeds from borrowings 37 49,451 24,335 49,783 48,274
Repayment of borrowings 37 (36,851) (18,258) (10,453) (18,258)
Interest paid on borrowings and subordinated liabilities (27,428) - (27,428) -
Dividend paid to owners of the parent (22,230) (22,230) (22,230) (22,230)
Net cash (used in)/generated from financing activities (37,058) (16,153) (10,328) 7,786
Net decrease in cash and cash equivalents 134,712 37,417 61,275 (9,853)
Effects of exchange rate changes on cash and cash equivalents (22,244) (12,905) 7,212 5,535
Cash and cash equivalents at beginning of period 22 662,245 428,428 450,063 273,125 Effect of exchange rate fluctuations on cash held
Cash and cash equivalents at end of period 22 774,713 452,940 518,550 268,807
Group Bank
The accompanying notes to the financial statements are an integral part of these consolidated and separate financial
statements.
Page 27 of 155 Consolidated and Separate Financial Statements for the period ended 30 June, 2019

United Bank for Africa Plc
Notes to the financial statements
1 General Information
2 Basis of preparation
3 Significant accounting policies
3.1 Basis of measurement
3.2 Functional and presentation currency
3.3 Use of estimates and judgements
3.4 Basis of consolidation
(a) Subsidiaries
United Bank for Africa Plc (the "Group") is a Nigerian registered company with address at 57 Marina, Lagos, Nigeria. The consolidated
financial statements of the Group for the period ended 30 June 2019 comprise the Bank (Parent) and its subsidiaries (together referred to
as the "Group" and individually referred to as "Group entities"). The Bank and its subsidiaries are primarily involved in corporate,
commercial and retail banking, trade services, cash management, treasury and custodial services.
The financial statements for the period ended 30 June 2019 were authorised for issue by the Board of Directors on August 22 2019.
These interim financial statements have been prepared in accordance with IAS 34 "Interim Financial Reporting" as issued by the
International Accounting Standards Board (IASB).
The interim consolidated financial statements do not include all the information and disclosures required in the annual financial
statements, and should be read in conjunction with the Group’s annual financial statements as at 31 December 2018.
The same accounting policies and methods of computation were followed in preparation of these interim financial statements as
compared with the most recent annual financial statements. Details of changes in accounting policies, where applicable during the
period are disclosed in note 3.27.
These financial statements have been prepared on a historical cost basis, except for the following:
- Derivative financial instruments which are measured at fair value.
- Financial assets measured at fair value through profit or loss.
The estimates and underlying assumptions are reviewed on an on-going basis. Revisions to accounting estimates are recognised in the
period in which the estimate is revised, if the revision affects only that period, or in the period of the revision and future periods, if the
revision affects both current and future periods. There were no material changes in management's estimates during the period.
Subsidiaries (including structured entities) are entities controlled by the Group. Control exists when the Group has rights to variable returns
from its involvement in an entity and has the ability to affect those returns through its power over the entity. The Group also assesses
existence of control where it does not have more than 50% of the voting power but is able to govern the financial and operating policies
by virtue of de-facto control. Subsidiaries are fully consolidated from the date in which control is transferred to the Group. They are
deconsolidated from the date control ceases.
The accounting policies of subsidiaries have been changed, where necessary, to align with the policies adopted by the Group. Losses
applicable to the non-controlling interests in a subsidiary are allocated to the non-controlling interests.
In the separate financial statements, investments in subsidiaries are carried at cost less impairment.
- Financial instruments measured at fair value through other comprehensive income.
Items included in the financial statements of each of the Group's entities are measured using the currency of the primary economic
environment in which the entity operates ("the functional currency"). The financial statements are presented in Nigerian Naira (N) which is
the Bank's functional currency and the Group's presentation currency.
The preparation of financial statements requires the directors to make judgments, estimates and assumptions that affect the application
of policies and reported amounts of assets and liabilities, incomes and expenses. The estimates and associated assumptions are based
on historical experience and various other factors that are believed to be reasonable under the circumstances, the results of which form
the basis of making the judgments about carrying values of assets and liabilities that are not readily apparent from other sources. Actual
results may differ from these estimates.
Page 28 of 155 Consolidated and Separate Financial Statements for the period ended 30 June, 2019

United Bank for Africa Plc
Notes to the financial statements
3.4 Basis of consolidation - continued
(b) Business combinations
(c) Disposal of subsidiaries
(d) Transactions eliminated on consolidation
(f) Associates
Business combinations are accounted for using the acquisition method.
The Group measures goodwill at the acquisition date as the total of:
If the business combination is achieved in stages, the acquisition date carrying value of any previously held equity interest in the
acquiree is re-measured to fair value at the acquisition date and any gains or losses arising from such re-measurement are recognised in
profit or loss.
Any contingent consideration payable is recognised at fair value at the acquisition date. If the contingent consideration is classified as
equity, it is not remeasured and settlement is accounted for within equity. Otherwise, subsequent changes to the fair value of the
contingent consideration are recognised in profit or loss.
When the Group ceases to have control, any retained interest in the entity is remeasured to its fair value at the date when control is lost,
with the change in carrying amount recognised in profit or loss. The fair value is the initial carrying amount for the purposes of
subsequently accounting for the retained interest as an associate, joint venture or financial asset. In addition, any amounts previously
recognised in other comprehensive income in respect of that entity are accounted for as if the group had directly disposed of the
related assets or liabilities. This may mean that amounts previously recognised in other comprehensive income are reclassified to profit or
loss.
Intra-group balances and any unrealised gains or losses or incomes and expenses arising from intra-group transactions, are eliminated in
preparing the consolidated financial statements. Unrealised gains arising from transactions with associates are eliminated to the extent of
the Group’s interest in the entity. Unrealised losses are eliminated in the same way as unrealised gains, but only to the extent that there is
no evidence of impairment.
(e) Changes in ownership interests in subsidiaries without change of control
Transactions with non-controlling interests that do not result in loss of control are accounted for as equity transactions. The difference
between fair value of any consideration paid and the relevant share acquired of the carrying value of net assets of the subsidiary is
recorded in equity. Gains or losses on disposals of non-controlling interests are also recorded in equity.
· the fair value of the consideration transferred; plus
· the amount of any non-controlling interest in the acquiree; plus if the business combination is achieved in stages, the fair value of the
existing equity interest in the acquiree;
· less the net amount (generally fair value) of the identifiable assets acquired and liabilities assumed.
When this total is negative, a bargain purchase gain is recognised in the income statement.
Non-controlling interests are measured at their proportionate share of the acquiree's identifiable net assets at the acquisition date.
Changes in the Group's interest in a subsidiary that do not result in a loss of control are accounted for as equity transactions.
Costs related to the acquisition, other than those associated with the issue of debt or equity securities that the Group incurs in connection
with a business combination are expensed as incurred.
Associates are all entities over which the group has significant influence but not control, generally accompanying a shareholding of
between 20% and 50% of the voting rights. Investments in associates are accounted for using the equity method of accounting. Under
the equity method, the investment is initially recognised at cost, and the carrying amount is increased or decreased to recognise the
investor’s share of the profit or loss of the investee after the date of acquisition. The group’s investment in associates includes goodwill
identified on acquisition. In the separate financial statements, investments in associates are carried at cost less impairment.
If the ownership interest in an associate is reduced but significant influence is retained, only a proportionate share of the amounts
previously recognised in other comprehensive income is reclassified to the income statement where appropriate.
Page 29 of 155 Consolidated and Separate Financial Statements for the period ended 30 June, 2019

United Bank for Africa Plc
Notes to the financial statements
3.5 Foreign currency
(a) Foreign currency transactions
(b) Foreign operations
3.6 Interest income and interest expense
3.7
Foreign currency transactions are recorded at the rate of exchange on the date of the transaction. At the reporting date, monetary
assets and liabilities denominated in foreign currencies are reported using the closing exchange rate. Exchange differences arising on the
settlement of transactions at rates different from those at the date of the transaction, as well as unrealized foreign exchange differences
on unsettled foreign currency monetary assets and liabilities, are recognized in the income statement.
Unrealized exchange differences on non-monetary financial assets are a component of the change in their entire fair value. For non-
monetary financial assets measured at fair value through profit or loss, unrealized exchange differences are recognized in profit or loss.
For non-monetary financial assets measured at fair value through other comprehensive income, unrealized exchange differences are
recorded in other comprehensive income until the asset is sold or becomes impaired.
The assets and liabilities of foreign operations, including goodwill and fair value adjustments arising on acquisition, are translated to
Nigerian Naira at exchange rates at each reporting date. The incomes and expenses of foreign operations are translated to Nigerian
Naira at average rates.
Foreign currency differences are recognised in other comprehensive income, and presented in the foreign currency translation reserve in
equity. However, if the operation is a non-wholly-owned subsidiary, then the relevant proportionate share of the translation difference is
allocated to the non-controlling interest. When a foreign operation is disposed of such that control, significant influence or joint control is
lost, the cumulative amount in the translation reserve related to that foreign operation is re-classified to profit or loss as part of the gain or
loss on disposal.
Interest income and expense for all interest bearing financial instruments, except for those classified at fair value through profit or loss, are
recognised within ‘interest income’ and ‘interest expense’ in the statement of comprehensive income using the effective interest
method. The effective interest rate is the rate that exactly discounts the estimated future cash payments and receipts through the
expected life of the financial asset or liability (or, where appropriate, a shorter period) to the net carrying amount of the financial asset or
liability.
The calculation of the effective interest rate includes all transaction costs and fees paid or received that are an integral part of the
effective interest rate. Transaction costs include incremental costs that are directly attributable to the acquisition or issue of a financial
asset or liability.
The Group’s share of post-acquisition profit or loss is recognised in the income statement and its share of post-acquisition movements in
other comprehensive income is recognised in other comprehensive income with a corresponding adjustment to the carrying amount of
the investment. When the group’s share of losses in an associate equals or exceeds its interest in the associate, including any other
unsecured receivables, the group does not recognise further losses unless it has incurred legal or constructive obligations or made
payments on behalf of the associate.
The Group determines at each reporting date whether there is any objective evidence that the investment in the associate is impaired. If
this is the case, the group calculates the amount of impairment as the difference between the recoverable amount of the associate and
its carrying value and recognises the amount adjacent to ‘share of profit/(loss)' of associates in the income statement.
Profits and losses resulting from transactions between the Group and its associate are recognised in the Group’s financial statements only
to the extent of unrelated investor’s interests in the associates. Unrealised losses are eliminated unless the transaction provides evidence
of an impairment of the asset transferred. Accounting policies of associates have been changed where necessary to ensure consistency
with the policies adopted by the group.
Dilution gains and losses arising on investments in associates are recognised in the income statement.
Fees and commissions income and expenses
Fees and commission income and expenses that are integral to the effective interest rate on a financial asset or liability are included in
the measurement of the effective interest rate. Other fees and commission income, including account servicing fees, investment
management and other fiduciary activity fees, sales commission, placement fees and syndication fees, are recognised as the related
services are performed.
Page 30 of 155 Consolidated and Separate Financial Statements for the period ended 30 June, 2019
United Bank for Africa Plc
Notes to the financial statements
3.8 Net trading and foreign exchange income
3.9 Dividend income
3.10 Income tax
3.11 Cash and bank balances
3.12 Trading assets
Current tax liability is the expected tax payable on taxable income for the year, using tax rates enacted or substantively enacted at the
reporting date, and any adjustment to tax payable in respect of previous years.
Deferred tax is recognised in respect of temporary differences between the carrying amounts of assets and liabilities for financial
reporting purposes and the amounts used for taxation purposes. Deferred tax is not recognised for the following temporary differences:
the initial recognition of goodwill, the initial recognition of assets or liabilities in a transaction that is not a business combination and that
affects neither accounting nor taxable profit, and differences relating to investments in subsidiaries to the extent that they probably will
not reverse in the foreseeable future. Deferred tax is measured at the tax rates that are expected to be applied to the temporary
differences when they reverse, based on laws that have been enacted or substantively enacted by the reporting date.
Deferred income tax liabilities are provided on taxable temporary differences arising from investments in subsidiaries, associates and joint
arrangements, except for deferred income tax liability where the timing of the reversal of the temporary difference is controlled by the
Group and it is probable that the temporary difference will not reverse in the foreseeable future.
Deferred income tax assets are recognised on deductible temporary differences arising from investments in subsidiaries, associates and
joint arrangements only to the extent that it is probable the temporary difference will reverse in the future and there is sufficient taxable
profit available against which the temporary difference can be utilised.
A deferred tax asset is recognised only to the extent that it is probable that future taxable profits will be available against which the asset
can be utilised. Deferred tax assets are reviewed at each reporting date and are reduced to the extent that it is no longer probable that
the related tax benefit will be realised.
Deferred tax assets and liabilities are offset if there is a legally enforceable right to offset current tax liabilities against current tax assets,
and they relate to taxes levied by the same tax authority on the same taxable entity, or on different tax entities, but they intend to settle
current tax liabilities and assets on a net basis or their tax assets and liabilities will be realised simultaneously.
Cash and bank balances include notes and coins on hand, current balances with other banks, balances held with central banks and
placements with banks which are used by the Group in the management of its short-term commitments.
Other fees and commission expenses relate mainly to transaction and service fees, which are expensed as the services are received.
Net trading income and foreign exchange income comprises gains less losses related to trading assets and liabilities, and includes all
realised and unrealised fair value changes and foreign exchange differences. Net gains or losses on derivative financial instruments
measured at fair value through profit or loss are also included in net trading income.
Dividend income is recognised when the right to receive income is established. Dividends are reflected as a component of other
operating income and recognised gross of the associated withholding tax. The withholding tax expense is included as a component of
taxation charge for the relevant period.
Income tax expense comprises current and deferred tax. Income tax expense is recognised in the income statement except to the extent
that it relates to items recognised directly in equity, in which case it is recognised in equity.
Cash and cash equivalents as referred to in the cash flow statement comprises cash on hand, non-restricted current accounts with
central banks and amounts due from banks on demand or with an original maturity of three months or less.
Cash and bank balances are carried at amortised cost in the statement of financial position.
Trading assets are those assets that the Group acquires principally for the purpose of selling in the near term, or holds as part of a portfolio
that is managed together for short-term profit or position taking.
Page 31 of 155 Consolidated and Separate Financial Statements for the period ended 30 June, 2019

United Bank for Africa Plc
Notes to the financial statements
3.13 Derivative financial instruments
3.14 Property and equipment
(a) Recognition and measurement
(b) Subsequent costs
(c) Depreciation
Land Not depreciated
Buildings 50 years
Leasehold improvements Over the shorter of the useful life of item or the lease period
Aircraft Between 16 and 20 years
Motor vehicles 5 years
Furniture and Fittings 5 years
Computer hardware 5 years
Equipment 5 years
Work in progress Not depreciated
Lifts* 10 years
Items of property and equipment are carried at cost less accumulated depreciation and impairment losses. Cost includes expenditures
that are directly attributable to the acquisition of the asset. When parts of an item of property and equipment have different useful lives,
they are accounted for as separate items (major components) of property and equipment.
The cost of replacing part of an item of property and equipment is recognised in the carrying amount of the item if it is probable that the
future economic benefits embodied within the part will flow to the Group and its cost can be measured reliably. The costs of the day-to-
day servicing of property and equipment are recognised in profit or loss as incurred.
Depreciation is recognised in profit or loss on a straight-line basis over the estimated useful lives of each part of an item of property and
equipment since this most closely reflects the expected pattern of consumption of the future economic benefits embodied in the asset.
Leased assets are depreciated over the shorter of the lease term and their useful lives. Depreciation begins when an asset is available for
use and ceases at the earlier of the date that the asset is derecognised or classified as held for sale in accordance with IFRS 5 Non-
current Assets Held for Sale and Discontinued Operations .
The estimated useful lives for the current and comparative period are as follows:
*In the financial statements, lifts are not treated as a separate class of property and equipment. They are included as part of Buildings.
Work in progress represents costs incurred on assets that are not available for use. On becoming available for use, the related amounts
are transferred to the appropriate category of property and equipment.
Trading assets are measured at fair value with changes in fair value recognised as part of net trading and foreign exchange income in
profit or loss.
Derivatives are initially recognised at fair value on the date on which a derivative contract is entered into and are subsequently
remeasured at their fair value. Fair values are obtained from quoted market prices in active markets, including recent market
transactions, and valuation techniques. All derivatives are carried as assets when fair value is positive and as liabilities when fair value is
negative.
Depreciation methods, useful lives and residual values are reassessed at each reporting date and adjusted if appropriate. Changes in the
expected useful life are accounted for by changing the amortisation period or methodology, as appropriate, and treated as changes in
accounting estimates.
Page 32 of 155 Consolidated and Separate Financial Statements for the period ended 30 June, 2019

United Bank for Africa Plc
Notes to the financial statements
(d) De-recognition
3.15 Intangible assets
(a) Goodwill
Subsequent measurement
(b) Software
3.16
Subsequent expenditure on software assets is capitalised only when it increases the future economic benefits embodied in the specific
asset to which it relates. All other expenditure is expensed as incurred.
Amortisation is recognised in profit or loss on a straight-line basis over the estimated useful life not exceeding five years, from the date
that it is available for use. The amortisation period and the amortisation method for an intangible asset with a finite useful life are
reviewed at each reporting date. Changes in the expected useful life, or the expected pattern of consumption of future economic
benefits embodied in the asset, are accounted for by changing the amortisation period or methodology, as appropriate, which are then
treated as changes in accounting estimates.
Impairment of non-financial assets
The Group assesses at each reporting date whether there is an indication that an asset may be impaired. If any indication exists, or when
annual impairment testing for an asset is required, the Group estimates the asset’s recoverable amount. An asset’s recoverable amount is
the higher of an asset’s or CGU’s fair value less costs to sell and its value in use. Where the carrying amount of an asset or CGU exceeds its
recoverable amount, the asset is considered impaired and is written down to its recoverable amount.
In assessing value in use, the estimated future cash flows are discounted to their present value using a pre–tax discount rate that reflects
current market assessments of the time value of money and the risks specific to the asset. In determining fair value less costs to sell, an
appropriate valuation model is used. These calculations are corroborated by valuation multiples, quoted share prices for publicly traded
subsidiaries or other available fair value indicators.
For assets excluding goodwill, an assessment is made at each reporting date as to whether there is any indication that previously
recognised impairment losses may no longer exist or may have decreased. If such indication exists, the Group estimates the asset’s or
CGU’s recoverable amount. A previously recognised impairment loss is reversed only if there has been a change in the assumptions used
to determine the asset’s recoverable amount since the last impairment loss was recognised. The reversal is limited so that the carrying
amount of the asset does not exceed its recoverable amount, nor exceeds the carrying amount that would have been determined, net
of depreciation, had no impairment loss been recognised for the asset in prior years. Such reversal is recognised in the income statement.
Impairment losses relating to goodwill are not reversed in future periods.
An item of property and equipment is derecognised on disposal or when no future economic benefits are expected from its use or
disposal. Any gain or loss arising on de-recognition of the asset (calculated as the difference between the net disposal proceeds and the
carrying amount of the asset) is included in profit or loss in the year the asset is derecognised.
Goodwill represents the excess of consideration over the Group's interest in net fair value of net identifiable assets, liabilities and
contingent liabilities of the acquired subsidiaries at the date of acquisition. When the excess is negative, it is recognised immediately in
profit or loss. Goodwill is measured at cost less accumulated impairment losses.
Goodwill is allocated to cash-generating units or groups of cash-generating units for the purpose of impairment testing. The allocation is
made to those cash-generating units or groups of cash-generating units that are expected to benefit from the business combination in
which the goodwill arose. Goodwill is tested annually as well as whenever a trigger event has been observed for impairment by
comparing the present value of the expected future cashflows from a cash generating unit with the carrying value of its net assets,
including attributable goodwill. Impairment losses on goodwill are not reversed.
Software acquired by the Group is stated at cost less accumulated amortisation and accumulated impairment losses.
Expenditure on internally developed software is recognised as an asset when the Group is able to demonstrate its intention and ability to
complete the development and use the software in a manner that will generate future economic benefits, and can reliably measure the
costs to complete the development. The capitalised costs of internally developed software include all costs directly attributable to
developing the software, and are amortised over its useful life. Internally developed software is stated at capitalised cost less
accumulated amortisation and impairment.
Page 33 of 155 Consolidated and Separate Financial Statements for the period ended 30 June, 2019

United Bank for Africa Plc
Notes to the financial statements
3.17 Repossessed collateral
3.18 Deposits and debt securities issued
3.19 Provisions
3.20 Financial guarantee contracts
3.21 Employee benefits
Post-employment benefits
Defined contribution plans
Financial guarantee contracts are contracts that require the Group (issuer) to make specified payments to reimburse the holder for a loss
it incurs because a specified debtor fails to make payment when due in accordance with the original or modified terms of a debt
instrument.
Financial guarantee liabilities are initially recognised at their fair value, which is the premium received, and then amortised over the life of
the financial guarantee. Subsequent to initial recognition, the financial guarantee liability is measured at the higher of the expected
credit loss provision and the unamortised premium. Financial guarantees are included within other liabilities.
The Group operates defined contribution pension scheme. A defined contribution plan is a pension plan under which the Group makes
fixed contributions on contractual basis. The group has no legal or constructive obligations to pay further contributions if the fund does
not hold sufficient assets to pay all employees the benefits relating to employee service in the current and prior periods.
Obligations for contributions to defined contribution plans are recognised as an expense in profit or loss when they are due.
Repossessed collateral represents financial and non-financial assets acquired by the Group in settlement of overdue loans. The assets are
initially recognised at fair value when acquired and included in the relevant assets depending on the nature and the Group's intention in
respect of recovery of these assets; and are subsequently remeasured and accounted for in accordance with the accounting policies for
these categories of assets. Where repossessed collateral results in acquiring control over a business, the business combination is
accounted for using the acquisition method of accounting with fair value of the settled loan representing the cost of acquisition (refer to
the accounting policy for consolidation). Accounting policy for associates is applied to repossessed shares where the Group obtains
significant influence, but not control. The cost of the associate is the fair value of the loan settled by repossessing the pledged shares.
The Group classifies capital instruments as financial liabilities or equity instruments in accordance with the substance of the contractual
terms of the instrument.
Debt securities issued are initially measured at fair value plus transaction costs, and subsequently measured at their amortised cost using
the effective interest method, except where the Group chooses to carry the liabilities at fair value through profit or loss.
A provision is recognised if, as a result of a past event, the Group has a present legal or constructive obligation that can be estimated
reliably, and it is probable that an outflow of economic benefits will be required to settle the obligation. Provisions are determined by
discounting the expected future cash flows at a pre-tax rate that reflects current market assessments of the time value of money and,
where appropriate, the risks specific to the liability.
A provision for restructuring is recognised when the Group has approved a detailed and formal restructuring plan, and the restructuring
either has commenced or has been announced publicly. Future operating costs are not provided for.
A provision for onerous contracts is recognised when the expected benefits to be derived by the Group from a contract are lower than
the unavoidable cost of meeting its obligations under the contract. The provision is measured at the present value of the lower of the
expected cost of terminating the contract and the expected net cost of continuing with the contract. Before a provision is established,
the Group recognises any impairment loss on the assets associated with that contract.
Page 34 of 155 Consolidated and Separate Financial Statements for the period ended 30 June, 2019

United Bank for Africa Plc
Notes to the financial statements
Termination benefits
Short term employee benefits
3.22 Share capital and reserves
(a) Share issue costs
(b) Dividend on ordinary shares
(c) Treasury shares
3.23 Earnings per share
3.24 Fiduciary activities
3.25 Stock of consumables
The Group recognises termination benefits as an expense when the Group is demonstrably committed, without realistic possibility of
withdrawal, to a formal detailed plan to either terminate employment before the normal retirement date, or to provide termination
benefits as a result of an offer made to encourage voluntary redundancy. The Group settles termination benefits within twelve months
and are accounted for as short-term benefits.
Short-term employee benefit obligations are measured on an undiscounted basis and are expensed as the related service is provided.
A liability is recognised for the amount expected to be paid under short-term employee benefits if the Group has a present legal or
constructive obligation to pay this amount as a result of past service provided by the employee and the obligation can be estimated
reliably.
Stock of consumables comprise materials to be consumed in the process of rendering of services as well as banking accessories held for
subsequent issuance to customers. They are measured at the lower of cost and net realisable value. Cost comprises costs of purchase
and other costs incurred in bringing the items of stock to their present location and condition. Net realisable value is the estimated
issuance price. When items of stock are issued to customers, their carrying amount is recognised as an expense in the period in which the
related revenue is recognised.
Incremental costs directly attributable to the issue of an equity instrument are deducted from the initial measurement of the equity
instruments.
Dividends on the Group’s ordinary shares are recognised in equity in the period in which they are paid or, if earlier, approved by the
Group’s shareholders.
Where the Group or any member of the Group purchases the Group’s shares, the consideration paid is deducted from the shareholders’
equity as treasury shares until they are cancelled. Where such shares are subsequently sold or reissued, any consideration received is
included in shareholders’ equity.
The Group presents basic earnings per share (EPS) for its ordinary shares. Basic EPS is calculated by dividing the profit or loss attributable
to ordinary shareholders of the Group by the weighted average number of ordinary shares outstanding during the period.
Diluted EPS is determined by adjusting the profit or loss attributable to ordinary shareholders and the weighted average number of
ordinary shares outstanding for the effects of all dilutive potential ordinary shares.
The Group commonly acts as trustees in other fiduciary capacities that result in the holding or placing of assets on behalf of individuals,
trusts, retirement benefit plans and other institutions. These assets and incomes arising thereon are excluded from these financial
statements, as they are not assets of the Group.
Page 35 of 155 Consolidated and Separate Financial Statements for the period ended 30 June, 2019

United Bank for Africa Plc
Notes to the financial statements
3.26 Segment reporting
3.27 Revenue from contracts with customers
3.28 Financial instruments
a.
An operating segment is a component of the Group that engages in business activities from which it may earn revenues and incur
expenses, including revenues and expenses that relate to transactions with any of the Group's other components, whose operating results
are reviewed regularly by the Chief Executive Officer of the Group, being the chief operating decision maker, to make decisions about
resources allocated to each segment and assess its performance, and for which discrete financial information is available. All costs that
are directly traceable to the operating segments are allocated to the segment concerned, while indirect costs are allocated based on
the benefits derived from such cost.
IFRS 15 defines principles for recognising revenue and will be applicable to all contracts with customers. However, interest and fee
income integral to financial instruments and leases will continue to fall outside the scope of IFRS 15 and will be regulated by the other
applicable standards (e.g., IFRS 9, and IFRS 16 Leases).
Revenue under IFRS 15 is recognised as goods and services are transferred, to the extent that the transferor anticipates entitlement to
goods and services. The standard also specifies a comprehensive set of disclosure requirements regarding the nature, extent and timing
as well as any uncertainty of revenue and the corresponding cash flows with customers.
Classification and measurement of financial assets
Financial assets, which include both debt and equity securities are measured at initial recognition at fair value, and are classified and
subsequently measured at fair value through profit or loss (FVTPL), fair value through other comprehensive income (FVOCI) or amortised
cost. Subsequent classification and measurement for debt securities is based on our business model for managing the financial
instruments and the contractual cash flow characteristics of the instruments.
Debt instruments are measured at amortised cost if both of the following conditions are met and the asset is not designated as FVTPL: (a)
the asset is held within a business model that is Held-to-Collect (HTC) as described below, and (b) the contractual terms of the instrument
give rise to cash flows that are solely payments of principal and interest on the principal amount outstanding (SPPI).
Debt instruments are measured at FVOCI if both of the following conditions are met and the asset is not designated as FVTPL: (a) the asset
is held within a business model that is Held-to-Collect-and-Sell (HTC&S) as described below, and (b) the contractual terms of the
instrument give rise, on specified dates, to cash flows that are SPPI.
All other debt instruments are measured at FVTPL.
The Group has irrevocably elected to measure equity instruments at FVOCI as no equity instrument is held for trading purposes.
Page 36 of 155 Consolidated and Separate Financial Statements for the period ended 30 June, 2019

United Bank for Africa Plc
Notes to the financial statements
b. Business model assessment
c. SPPI assessment
d. Investment securities
• Hold-to-Collect (HTC): The objective of this business model is to hold loans and securities to collect contractual principal and interest
cash flows. Sales are incidental to this objective and are expected to be insignificant or infrequent.
• Hold-to-Collect-and-Sell (HTC&S): Both collecting contractual cash flows and sales are integral to achieving the objective of the
business model.
• Other fair value business models: These business models are neither HTC nor HTC&S, and primarily represent business models where
assets are held-for-trading or managed on a fair value basis.
Instruments held within a HTC or HTC&S business model are assessed to evaluate if their contractual cash flows are comprised of solely
payments of principal and interest. SPPI payments are those which would typically be expected from basic lending arrangements.
Principal amounts include par repayments from lending and financing arrangements, and interest primarily relates to basic lending
returns, including compensation for credit risk and the time value of money associated with the principal amount outstanding over a
period of time. Interest can also include other basic lending risks and costs (for example, liquidity risk, servicing or administrative costs)
associated with holding the financial asset for a period of time, and a profit margin.
Where the contractual terms introduce exposure to risk or variability of cash flows that are inconsistent with a basic lending arrangement,
the related financial asset is classified and measured at FVTPL.
Investment securities include all securities classified as FVOCI and amortised cost. All investment securities are initially recorded at fair
value and subsequently measured according to the respective classification. Prior to our adoption of IFRS 9, Investment securities were
comprised of available-for-sale securities and held-to-maturity securities.
The Group determines the business models at the level that best reflects how portfolios of financial assets are managed to achieve the
Group's business objectives. Judgment is used in determining the business models, which is supported by relevant, objective evidence
including:
• How the economic activities of our businesses generate benefits, for example through trading revenue, enhancing yields or other costs
and how such economic activities are evaluated and reported to key management personnel;
• The significant risks affecting the performance of our businesses, for example, market risk, credit risk, or other risks and the activities
undertaken to manage those risks; and
• Historical and future expectations of sales of the loans or securities portfolios managed as part of a business model.
The Group's business models fall into three categories, which are indicative of the key strategies used to generate returns:
Investment securities carried at amortised cost are measured using the effective interest method, and are presented net of any
allowance for credit losses, calculated in accordance with our policy for allowance for credit losses, as described below. Interest income,
including the amortization of premiums and discounts on securities measured at amortised cost are recorded in interest income.
Impairment gains or losses recognized on amortised cost securities are recorded in Allowance for credit losses. When a debt instrument
measured at amortised cost is sold, the difference between the sale proceeds and the amortised cost of the security at the time of the
sale is recorded as a net gain/(loss) on Investment securities in Net trading and foreign exchange income.
Debt securities carried at FVOCI are measured at fair value with unrealized gains and losses arising from changes in fair value included in
fair value reserve. Impairment gains and losses are included in allowance for credit losses and correspondingly reduce the accumulated
changes in fair value included in fair value reserve. When a debt instrument measured at FVOCI is sold, the cumulative gain or loss is
reclassified from fair value reserve to net gain/(loss) on Investment securities in net trading and foreign exchange income.
Equity securities carried at FVOCI are measured at fair value. Unrealized gains and losses arising from changes in fair value are recorded
in fair value reserve and not subsequently reclassified to profit or loss when realized. Dividends from FVOCI equity securities are
recognized in other operating income.
The Group accounts for all securities using settlement date accounting and changes in fair value between the trade date and settlement
date are reflected in income for securities measured at FVTPL, and changes in the fair value of securities measured at FVOCI between the
trade and settlement dates are recorded in OCI except for changes in foreign exchange rates on debt securities, which are recorded in
net trading and foreign exchange income.
Page 37 of 155 Consolidated and Separate Financial Statements for the period ended 30 June, 2019

United Bank for Africa Plc
Notes to the financial statements
e. Fair value option
f. Loans
A financial instrument with a reliably measurable fair value can be designated as FVTPL (the fair value option) on its initial recognition
even if the financial instrument was not acquired or incurred principally for the purpose of selling or repurchasing. The fair value option
can be used for financial assets if it eliminates or significantly reduces a measurement or recognition inconsistency that would otherwise
arise from measuring assets or liabilities, or recognizing related gains and losses on a different basis (an “accounting mismatch”). The fair
value option can be elected for financial liabilities if: (i) the election eliminates an accounting mismatch; (ii) the financial liability is part of
a portfolio that is managed on a fair value basis, in accordance with a documented risk management or investment strategy; or (iii) there
is an embedded derivative in the financial or non-financial host contract and the derivative is not closely related to the host contract.
These instruments cannot be reclassified out of the FVTPL category while they are held or issued.
Financial assets designated as FVTPL are recorded at fair value and any unrealized gains or losses arising due to changes in fair value are
included in net trading and foreign exchange income, depending on our business purpose for holding the financial asset.
Financial liabilities designated as FVTPL are recorded at fair value and fair value changes attributable to changes in our own credit risk
are recorded in OCI. Own credit risk amounts recognized in OCI are not reclassified subsequently to net income. The remaining fair value
changes not attributable to changes in our own credit risk are recorded in Other operating income, depending on our business purpose
for holding the financial liability. Upon initial recognition, if we determine that presenting the effects of own credit risk changes in OCI
would create or enlarge an accounting mismatch in net income, the full fair value change in our debt designated as at FVTPL is
recognized in net income. To make that determination, we assess whether we expect that the effects of changes in the liability’s credit
risk will be offset in profit or loss by a change in the fair value of another financial instrument measured at FVTPL. Such an expectation is
based on an economic relationship between the characteristics of the liability and the characteristics of the other financial instrument.
The determination is made at initial recognition and is not reassessed. To determine the fair value adjustments on our debt instruments
designated as at FVTPL, we calculate the present value of the instruments based on the contractual cash flows over the term of the
arrangement by using our effective funding rate at the beginning and end of the period.
Financial assets are reclassified when and only when the business model for managing those assets changes. The reclassification takes
place from the start of the first reporting period following the change. Such changes are expected to be very infrequent and none
occurred during the period.
Loans are debt instruments recognized initially at fair value and are subsequently measured in accordance with the classification of
financial assets policy provided above. Loans are carried at amortised cost using the effective interest method, which represents the
gross carrying amount less allowance for credit losses.
Interest on loans is recognized in interest income using the effective interest method. The estimated future cash flows used in this
calculation include those determined by the contractual term of the asset and all fees that are considered to be integral to the effective
interest rate. Also included in this amount are transaction costs and all other premiums or discounts. Fees that relate to activities such as
originating, restructuring or renegotiating loans are deferred and recognized as Interest income over the expected term of such loans
using the effective interest method. Where there is a reasonable expectation that a loan will be originated, commitment and standby
fees are also recognized as interest income over the expected term of the resulting loans using the effective interest method. Otherwise,
such fees are recorded as other liabilities and amortised into Other operating income over the commitment or standby period.
Impairment losses on loans are recognized at each balance sheet date in accordance with the three-stage impairment model outlined
below.
Page 38 of 155 Consolidated and Separate Financial Statements for the period ended 30 June, 2019

United Bank for Africa Plc
Notes to the financial statements
g. Allowance for credit losses
h. Measurement of expected credit losses
• Stage 2 – Following a significant increase in credit risk relative to the initial recognition of the financial asset, a loss allowance is
recognized equal to the credit losses expected over the remaining lifetime of the asset. Interest income is calculated on the gross
carrying amount of these financial assets.
2) Impaired financial assets
• Stage 3 – When a financial asset is considered to be credit-impaired, a loss allowance is recognized equal to credit losses expected
over the remaining lifetime of the asset. The Stage 3 expected credit loss impairment model is based on changes in credit quality since
initial recognition. Interest revenue is calculated based on the carrying amount of the asset, net of the loss allowance, rather than on its
gross carrying amount.
The ACL is a discounted probability-weighted estimate of the cash shortfalls expected to result from defaults over the relevant time
horizon. For loan commitments, credit loss estimates consider the portion of the commitment that is expected to be drawn over the
relevant time period. For financial guarantees, credit loss estimates are based on the expected payments required under the guarantee
contract.
Increases or decreases in the required ACL attributable to purchases and new originations, derecognitions or maturities, and
remeasurements due to changes in loss expectations or stage migrations are recorded in Provision for credit losses. Write-offs and
recoveries of amounts previously written off are recorded against ACL.
The ACL represents an unbiased estimate of expected credit losses on our financial assets as at the balance sheet date. Judgment is
required in making assumptions and estimations when calculating the ACL, including movements between the three stages and the
application of forward looking information. The underlying assumptions and estimates may result in changes to the provisions from period
to period that significantly affect our results of operations.
Expected credit losses are based on a range of possible outcomes and consider all available reasonable and supportable information
including internal and external ratings, historical credit loss experience, and expectations about future cash flows. The measurement of
expected credit losses is based primarily on the product of the instrument’s probability of default (PD), loss given default (LGD) and
exposure at default (EAD) discounted to the reporting date. Stage 1 estimates project PD, LGD and EAD over a maximum period of 12
months while Stage 2 estimates project PD, LGD and EAD over the remaining lifetime of the instrument.
An expected credit loss estimate is produced for each individual exposure. Relevant parameters are modelled on a collective basis using
portfolio segmentation that allows for appropriate incorporation of forward looking information.
Expected credit losses are discounted to the reporting period date using the effective interest rate.
An allowance for credit losses (ACL) is established for all financial assets, except for financial assets classified or designated as FVTPL and
equity securities designated as FVOCI, which are not subject to impairment assessment. Assets subject to impairment assessment include
loans, overdrafts, debt securities and accrued interest receivable. These are carried at amortised cost and presented net of ACL on the
Consolidated Statement of Financial Position. ACL on loans is presented in Allowance for credit losses - loans and advances. ACL on debt
securities measured at FVOCI is presented in Fair value reserve in equity.
Off-balance sheet items subject to impairment assessment include financial guarantees and undrawn loan commitments. For all other off-
balance sheet products subject to impairment assessment, ACL is separately calculated and included in Other Liabilities – Provisions.
We measure the ACL at each reporting date according to a three-stage expected credit loss impairment model which is based on
changes in credit risk of financial assets since initial recognition:
1) Performing financial assets:
• Stage 1 – From initial recognition of a financial asset to the reporting date, where the asset has not experienced a significant increase in
credit risk relative to its initial recognition, a loss allowance is recognized equal to the credit losses expected to result from defaults
occurring over the 12 months following the reporting date. Interest income is calculated on the gross carrying amount of these financial
assets.
Page 39 of 155 Consolidated and Separate Financial Statements for the period ended 30 June, 2019

United Bank for Africa Plc
Notes to the financial statements
i. Expected life
j.
k. Use of forward-looking information
For instruments in Stage 2 or Stage 3, loss allowances reflect expected credit losses over the expected remaining lifetime of the
instrument. For most instruments, the expected life is limited to the remaining contractual life.
An exemption is provided for certain instruments with the following characteristics: (a) the instrument includes both a loan and undrawn
commitment component; (b) we have the contractual ability to demand repayment and cancel the undrawn commitment; and (c) our
exposure to credit losses is not limited to the contractual notice period. For products in scope of this exemption, the expected life may
exceed the remaining contractual life and is the period over which our exposure to credit losses is not mitigated by our normal credit risk
management actions. This period varies by product and risk category and is estimated based on our historical experience with similar
exposures and consideration of credit risk management actions taken as part of our regular credit review cycle. Products in scope of this
exemption include credit cards, overdraft balances and certain revolving lines of credit. Determining the instruments in scope for this
exemption and estimating the appropriate remaining life based on our historical experience and credit risk mitigation practices requires
significant judgment.
Assessment of significant increase in credit risk
The assessment of significant increase in credit risk requires significant judgment. The Bank’s process to assess changes in credit risk is
based on the use 'backstop' indicators. Instruments which are more than 30 days past due may be credit-impaired. There is a rebuttable
presumption that the credit risk has increased significantly if contractual payments are more than 30 days past due; this presumption is
applied unless the bank has reasonable and supportable information demonstrating that the credit risk has not increased significantly
since initial recognition.
The following are considered as exception:
1. Outstanding obligation is a result of an amount being disputed between the bank and obligor where the dispute is not more than 90
days.
2. Outstanding obligation is an insignificant amount compared to the total amount due. Any amount not more than 10% is considered
insignificant. Only applicable where there is no significant increase in credit risk and analysed on a case by case basis.
The assessment is generally performed at the instrument level and it is performed at least on quarterly basis. If any of the factors above
indicate that a significant increase in credit risk has occurred, the instrument is moved from Stage 1 to Stage 2. The assessments for
significant increases in credit risk since initial recognition and credit-impairment are performed independently as at each reporting
period. Assets can move in both directions through the stages of the impairment model. After a financial asset has migrated to Stage 2, if
it is no longer considered that credit risk has significantly increased relative to initial recognition in a subsequent reporting period, it will
move back to Stage 1 after 90 days. Similarly, an asset that is in Stage 3 will move back to Stage 2 if it is no longer considered to be credit-
impaired after 90 days. An asset will not move back from stage 3 to stage 1 until after a minimum of 180 days, if it is no longer considered
to be credit impaired. This is in line with Central Bank of Nigeria (CBN) IFRS 9 guidelines.
For certain instruments with low credit risk as at the reporting date, it is presumed that credit risk has not increased significantly relative to
initial recognition. Credit risk is considered to be low if the instrument has a low risk of default, and the borrower has the ability to fulfill their
contractual obligations both in the near term and in the longer term, including periods of adverse changes in the economic or business
environment.
The measurement of expected credit losses for each stage and the assessment of significant increase in credit risk considers information
about past events and current conditions as well as reasonable and supportable projections of future events and economic conditions.
The estimation and application of forward-looking information requires significant judgment.
The PD, LGD and EAD inputs used to estimate Stage 1 and Stage 2 credit loss allowances are modelled based on the
macroeconomic variables (or changes in macroeconomic variables) that are most closely correlated with credit losses in the relevant
portfolio. Each macroeconomic scenario used in our expected credit loss calculation includes a projection of all relevant
macroeconomic variables applying scenario weights. Macroeconomic variables used in our expected credit loss models include GDP
growth rate, interbank FX rates, inflation rate, crude oil prices and population growth rate.
Our estimation of expected credit losses in Stage 1 and Stage 2 is a discounted probability-weighted estimate that considers a minimum
of three future macroeconomic scenarios. Our base case scenario is based on macroeconomic forecasts published by relevant
government agencies. Upside and downside scenarios vary relative to our base case scenario based on reasonably possible alternative
macroeconomic conditions. Additional and more severe downside scenarios are designed to capture material non-linearity of potential
credit losses in portfolios. Scenario design, including the identification of additional downside scenarios, occurs at least on an annual
basis and more frequently if conditions warrant.
Page 40 of 155 Consolidated and Separate Financial Statements for the period ended 30 June, 2019
United Bank for Africa Plc
Notes to the financial statements
k. Use of forward-looking information(continued)
l. Definition of default
m.
Scenarios are designed to capture a wide range of possible outcomes and weighted according to our best estimate of the relative
likelihood of the range of outcomes that each scenario represents. Scenario weights take into account historical frequency, current
trends, and forward-looking conditions and are updated on a quarterly basis. All scenarios considered are applied to all portfolios subject
to expected credit losses with the same probabilities.
Our assessment of significant increases in credit risk is based on changes in probability-weighted forward-looking lifetime PD as at the
reporting date, using the same macroeconomic scenarios as the calculation of expected credit losses.
A default is considered to have occurred with regard to a particular obligor when either or both of the following events have taken place.
• The bank considers that the obligor is unlikely to pay its credit obligations in full, without recourse by the bank to actions such as realising
security (if held).
• The obligor is past due more than 90 days on any material credit obligation to the bank (principal or interest). Overdrafts will be
considered as being past due once the customer has breached an advised limit or been advised of a limit smaller than current
outstanding.
• Interest payments equal to 90 days or more have been capitalized, rescheduled, rolled over into a new loan (except where facilities
have been reclassified)
The elements to be taken as indications of unlikeliness to pay include:
- The bank sells the credit obligation at a material credit-related economic loss.
- The bank consents to a distressed restructuring of the credit obligation where this is likely to result in a diminished financial obligation
caused by the material forgiveness, or postponement, of principal, interest or (where relevant) fees.
- The bank has filed for the obligor’s bankruptcy or a similar order in respect of the obligor’s credit obligation to the banking group.
The following are considered as exceptions:
a. Outstanding obligation is a result of an amount being disputed between the bank and obligor where the dispute is not more than 150
days;
b. In the case of specialized loans, default is defined as where the obligor is past due more than 180 days on any material credit
obligation to the bank (principal or interest). This is consistent with CBN guidelines on IFRS 9. In addition, it is consistent with the Bank’s
historical default pattern on this category of loans. The specialized loans to which this is applicable are Project Financing, Object
Financing, Income Producing Real Estate, Commercial Real Estate and Mortgage Loans;
c. Outstanding obligation is an insignificant amount compared to the total amount due. Any amount not more than 10% of amount due
is considered insignificant. Only applicable where there is no significant increase in credit risk and analysed on a case by case basis.
d. Exposure is still in default due to a new debit when the initial debit has been cleared. Usually occurs when the debit that initiated the
initial days past due has been paid but the days past due continues to reflect a debit.
Credit-impaired financial assets (Stage 3)
Financial assets are assessed for credit-impairment at each balance sheet date and more frequently when circumstances warrant further
assessment. Evidence of credit-impairment may include indications that the borrower is experiencing significant financial difficulty,
probability of bankruptcy or other financial reorganization, as well as a measurable decrease in the estimated future cash flows
evidenced by the adverse changes in the payments status of the borrower or economic conditions that correlate with defaults.
A loan is considered for transfer from stage 2 to stage 1 where there is significant improvement in credit risk and from stage 3 to stage 2
(declassified) where the facility is no longer in default. Factors that are considered in such backward transitioning include the following:
i) Declassification of the exposure by all the licensed private credit bureaux or the credit risk management system;
ii) Improvement of relevant credit risk drivers for an individual obligor (or pool of obligors);
iii) Evidence of full repayment of principal or interest.
Generally, the above are to represent an improvement in credit risk to warrant consideration for a backward transition of loans. Where
there is evidence of significant reduction in credit risk, the following probationary periods should apply before a loan may be moved to a
lower stage (indicating lower risk):
Transfer from Stage 2 to 1:- 90 days
Transfer from Stage 3 to 2:- 90 days
Transfer from Stage 3 to Stage 1:- 180 days
Page 41 of 155 Consolidated and Separate Financial Statements for the period ended 30 June, 2019

United Bank for Africa Plc
Notes to the financial statements
n. Write-off of loans
o. Modifications
p.
Loans and the related ACL are written off, either partially or in full, when there is no realistic prospect of recovery. Where loans are
secured, they are generally written off after receipt of any proceeds from the realization of collateral. In circumstances where the net
realizable value of any collateral has been determined and there is no reasonable expectation of further recovery, write off may be
earlier.
The credit risk of a financial asset will not necessarily decrease merely as a result of a modification of the contractual cash flows. If the
contractual cash flows on a financial asset have been renegotiated or modified and the financial asset was not derecognised, the Bank
assesses whether there has been a significant increase in the credit risk of the financial by comparing:
(1) the risk of a default occurring at the reporting date (based on the modified contractual terms); and
(2) the risk of a default occurring at initial recognition (based on the original, unmodified contractual terms).
A modification will however lead to derecognition of existing loan and recognition of a new loan i.e. substantial modification if:
• the discounted present value of the cash flows under the new terms, including any fees received net of any fees paid and discounted
using the original effective interest rate, is at least 10 per cent different from the discounted present value of the remaining cash flows of
the original financial asset.
The following will be applicable to modified financial assets:
• The modification of a distressed asset is treated as an originated credit-impaired asset requiring recognition of life-time ECL after
modification.
• The cumulative changes in lifetime expected credit losses since initial recognition is recognized as a loss allowance for purchase or
originated credit-impaired financial asset at the reporting date.
• The general impairment model does not apply to purchased or originated credit-impaired assets.
The following situations (qualitative) may however not lead to a derecognition of the loan:
• Change in interest rate arising from a change in MPR which is the benchmark rate that drives borrowing rates in Nigeria;
• Change in financial asset’s tenor (increase or decrease);
• Change in installment amount to higher or lower amount;
• Change in the annuity repayment pattern, for example, from monthly to quarterly, half-yearly or yearly
• Change in the applicable financial asset fee
Modification gain or loss is included as part of allowance for credit loss for each financial year.
Classification and measurement of financial liabilities
The Group recognizes financial liabilities when it first becomes a party to the contractual rights and obligations in the relevant contracts.
Financial assets are assessed for credit-impairment at each balance sheet date and more frequently when circumstances warrant further
assessment. Evidence of credit-impairment may include indications that the borrower is experiencing significant financial difficulty,
probability of bankruptcy or other financial reorganization, as well as a measurable decrease in the estimated future cash flows
evidenced by the adverse changes in the payments status of the borrower or economic conditions that correlate with defaults.
A loan is considered for transfer from stage 2 to stage 1 where there is significant improvement in credit risk and from stage 3 to stage 2
(declassified) where the facility is no longer in default. Factors that are considered in such backward transitioning include the following:
i) Declassification of the exposure by all the licensed private credit bureaux or the credit risk management system;
ii) Improvement of relevant credit risk drivers for an individual obligor (or pool of obligors);
iii) Evidence of full repayment of principal or interest.
Generally, the above are to represent an improvement in credit risk to warrant consideration for a backward transition of loans. Where
there is evidence of significant reduction in credit risk, the following probationary periods should apply before a loan may be moved to a
lower stage (indicating lower risk):
Transfer from Stage 2 to 1:- 90 days
Transfer from Stage 3 to 2:- 90 days
Transfer from Stage 3 to Stage 1:- 180 days
When a financial asset has been identified as credit-impaired, expected credit losses are measured as the difference between the asset’s
gross carrying amount and the present value of estimated future cash flows discounted at the instrument’s original effective interest rate.
For impaired financial assets with drawn and undrawn components, expected credit losses also reflect any credit losses related to the
portion of the loan commitment that is expected to be drawn down over the remaining life of the instrument.
When a financial asset is credit-impaired, interest ceases to be recognised on the regular accrual basis, which accrues income based on
the gross carrying amount of the asset. Rather, interest income is calculated by applying the original effective interest rate to the
amortised cost of the asset, which is the gross carrying amount less the related ACL.
Following impairment, interest income is recognized on the unwinding of the discount from the initial recognition of impairment.
Under IFRS 9, financial liabilities are either classified as financial liabilities at amortised cost or financial liabilities at FVTPL.
The Group classifies its financial liabilities as measured at amortised cost, except for:
i. Financial liabilities at FVTPL: this classification is applied to derivatives, financial liabilities held for trading (e.g. short positions in the
trading booking) and other financial liabilities designated as such at initial recognition. Gains or losses from financial liabilities designated
at fair value through profit or loss are presented partially in other comprehensive income (the amount of change in the fair value of the
financial liability that is attributable to changes in the Group’s own credit risk, which is determined as the amount that is not attributable
to changes in market conditions that give rise to market risk) and partially profit or loss (the remaining amount of change in the fair value
of the liability). This is unless such a presentation would create, or enlarge, an accounting mismatch, in which case the gains and losses
attributable to changes in the Group’s credit risk are also presented in profit or loss;
ii. Financial guarantee contracts and commitments.
Borrowings and subordinated liabilities are included as part of financial liabilities measured at amortised cost.
Page 42 of 155 Consolidated and Separate Financial Statements for the period ended 30 June, 2019
United Bank for Africa Plc
Notes to the financial statements
Changes in accounting policies
3.29
a) IFRS 16 Leases
The group has adopted IFRS 16 retrospectively from 1 January 2019, but has not restated comparatives for the 2018 reporting period, as
permitted under the specific transitional provisions in the standard. The reclassifications and the adjustments arising from the new leasing
rules are therefore recognised in the opening balance sheet on 1 January 2019.
The Group has consequently reclassified the existing operating leases as of January 1,2019 to Right-of-Use Assets without consideration of
corresponding lease liabilities; because those leases had been prepaid. However, in discounting operating leases with renewal options in
the Group's books, the transition date to the next renewal dates were identified as lease terms in determining the lease liability.
Meanwhile, associated amortisation of the ROU assets would commence for those period for which the Group has the right to use an
underlying asset.
Impact of adoption of this standard is as shown on note 3.30.
Except for the following new standards, the Group has consistently applied the accounting policies as set out in Notes 3.1 - 3.28 to all
periods presented in these consolidated and separate financial statements.The Group has adopted this new standard with initial date of
application of January 1, 2019.
The Group has adopted the use of IFRS 16 as a new standard with effective date of application January 1, 2019.
The IASB issued the new standard for accounting for leases - IFRS 16 Leases in January 2017. The new standard does not significantly
change the accounting for leases for lessors. However it requires lessees to recognise most leases on their balance sheets as lease
liabilities, with the corresponding right-of-use assets. Lessees are expected to apply a single model for all recognised leases, but will also
have the option not to recognise ‘short-term’ leases and leases of ‘low-value’ assets. Generally, the profit or loss recognition pattern for
recognised leases will be similar to today’s finance lease accounting, with interest and depreciation expense recognised separately in
the statement of profit or loss.
Page 43 of 155 Consolidated and Separate Financial Statements for the period ended 30 June, 2019

United Bank for Africa Plc
Notes to the financial statements
Parent
3.30 Impact of adoption of IFRS 16
Adjustments recognised on adoption of IFRS 16
Group
For the period ended 30 June,2019
In millions of Nigerian Naira
Total Operating Leases: Existing Leases
Leases with
extention
options
Operating lease commitments disclosed as at 31 December 2018 3,098 -
Reclassification from operating lease as at 1 January 2019 3,098 -
Book value of leases probable of renewal/extention 1
- 1,808
Additions/Renewal during the period 4,401 -
Matured leases during the period (64) -
Amortisation during the period (1,075) -
Right-of-use assets as at June 30,2019 6,360 1,808
Total Right of Use assets
Operating Leases highly probable of renewal:
Discounted using FG Bond yields of similar maturity at the date of initial application
Total current lease liabilities as at 30 June 2019
Bank
For the period ended 30 June,2019
In millions of Nigerian Naira
Total Operating Leases: Existing Leases
Leases with
Renewal
options
Operating lease commitments disclosed as at 31 December 2018 2,868 -
Reclassification from operating lease as at 1 January 2019 2,868 - Book value of leases probable of renewal/extention
1- 1,689
Additions/Renewal during the period 3,048 -
Matured leases during the period (44) -
Amortisation during the period (741) -
Right-of-use assets as at June 30,2019 5,131 1,689
Total Right of Use assets
Operating Leases highly probable of renewal:
Discounted using FGN Bond yields of similar maturity at the date of initial application
Total Current lease liabilities as at 30 June 2019
IFRS 16
On adoption of IFRS 16, the group recognised right-of-use assets in relation to leases which had previously been classified
as operating leases’ under the principles of IAS 17 Leases. On transition date January 1,2019, no lease liabilities were
recognised with respect to existing operating leases as they had been prepaid.
However, for leases for which the group was reasonable certain to exercise renewal or extension options, those lease
liabilities were measured as the present value of the payments made at next respective renewal dates, discounted using
the corresponding FGN Bond/Bill yields of similar maturity (risk premium inclusive) with their respective lease terms as of 1
January 2019. The weighted average discount rates applied to the lease liabilities on 1 January 2019 was 16.17%.
The group has adopted IFRS 16 retrospectively from 1 January 2019, but has not restated comparatives for the 2018 reporting
period, as permitted under the simplified approach in the standard.
IFRS 16
8,168
1,808
6,820
1,689
Page 44 of 155 Consolidated and Separate Financial Statements for the period ended 30 June, 2019

United Bank for Africa Plc
Notes to the financial statements
-Right-of -use assets rose by ₦3.95bn
-Prepaid rent decreased by ₦2.9bn
-Lease liability increased by ₦1.7bn
1The associated right-of-use assets for operating leases were measured on a retrospective basis as if the new rules had
The change in accounting policy affected the following items in the balance sheet of the bank on 30 June 2019:
always been applied.They were measured at the amount equal to the lease liability discounted to present value; relating to that
lease recognised in the balance sheet as at 31 December 2018.There were no onerous lease contracts that would have required an
adjustment to the right-of-use assets at the date of initial application.
Other assumptions used for assessing Renewable Leases
(i)The Group measured its right-of-use asset on lease by lease basis, as an amount equal to the lease liability, adjusted
by the amount of any prepaid or accrued lease payments relating to that lease recognized .
(ii)Existing leases for which had been prepaid were not discounted but reclassed from other assets to right of use assets.
(iii)The Group also considered the impact of inflation growth on possible and payable lease contract sum at renewal date in
discounting.
(iv) Right of use assets amortisation is computed over the relevant lease terms.
(v)Implicit borrowing rate (IBR) used for discounting was determined using the corresponding FGN Bond/Bill yields of similar
maturity (risk premium inclusive) with their respective lease terms(16.45% +1%).
(vi)For the purpose of discounting, the lease liability only exists on leases for which the Group was reasonably certain to be
renewed and only those of which with maturity of not more than 12 months.
Page 45 of 155 Consolidated and Separate Financial Statements for the period ended 30 June, 2019
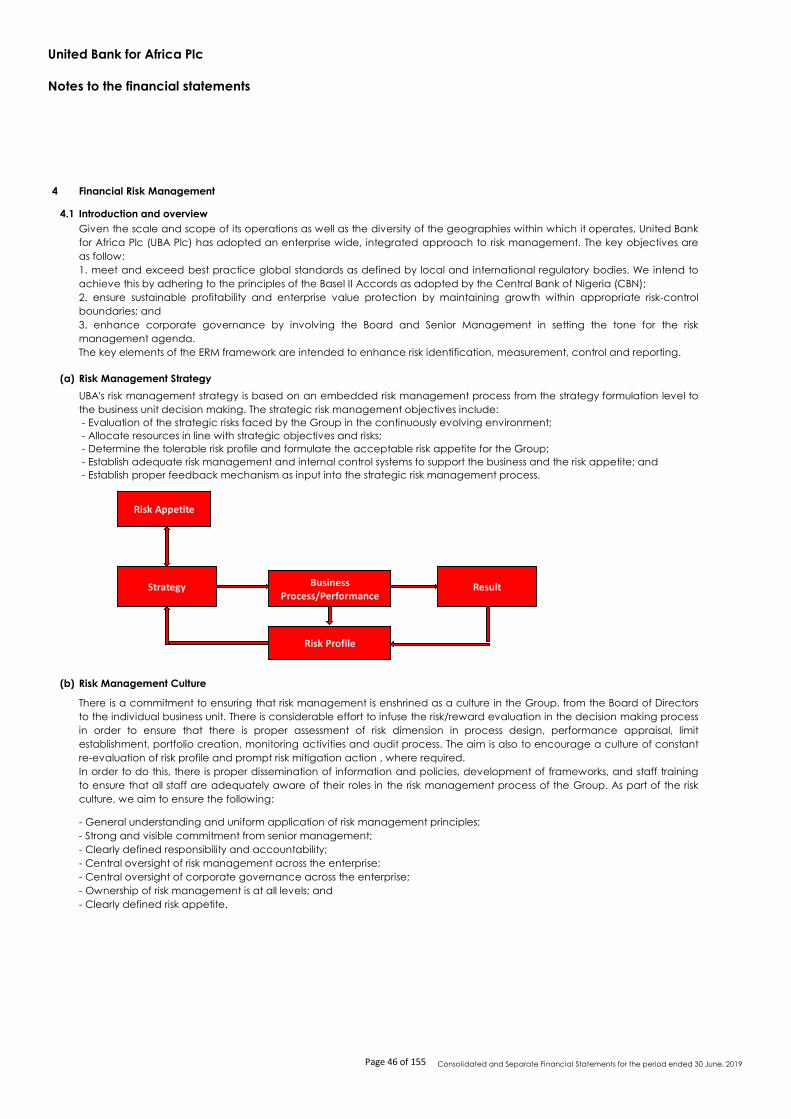
United Bank for Africa Plc
Notes to the financial statements
4 Financial Risk Management
4.1 Introduction and overview
(a) Risk Management Strategy
(b) Risk Management Culture
- Establish proper feedback mechanism as input into the strategic risk management process.
There is a commitment to ensuring that risk management is enshrined as a culture in the Group, from the Board of Directors
to the individual business unit. There is considerable effort to infuse the risk/reward evaluation in the decision making process
in order to ensure that there is proper assessment of risk dimension in process design, performance appraisal, limit
establishment, portfolio creation, monitoring activities and audit process. The aim is also to encourage a culture of constant
re-evaluation of risk profile and prompt risk mitigation action , where required.
In order to do this, there is proper dissemination of information and policies, development of frameworks, and staff training
to ensure that all staff are adequately aware of their roles in the risk management process of the Group. As part of the risk
culture, we aim to ensure the following:
- General understanding and uniform application of risk management principles;
- Strong and visible commitment from senior management;
- Clearly defined responsibility and accountability;
- Central oversight of risk management across the enterprise;
- Central oversight of corporate governance across the enterprise;
- Ownership of risk management is at all levels; and
- Clearly defined risk appetite.
Given the scale and scope of its operations as well as the diversity of the geographies within which it operates, United Bank
for Africa Plc (UBA Plc) has adopted an enterprise wide, integrated approach to risk management. The key objectives are
as follow:
1. meet and exceed best practice global standards as defined by local and international regulatory bodies. We intend to
achieve this by adhering to the principles of the Basel II Accords as adopted by the Central Bank of Nigeria (CBN);
2. ensure sustainable profitability and enterprise value protection by maintaining growth within appropriate risk-control
boundaries; and
3. enhance corporate governance by involving the Board and Senior Management in setting the tone for the risk
management agenda.
The key elements of the ERM framework are intended to enhance risk identification, measurement, control and reporting.
UBA's risk management strategy is based on an embedded risk management process from the strategy formulation level to
the business unit decision making. The strategic risk management objectives include:
- Evaluation of the strategic risks faced by the Group in the continuously evolving environment;
- Allocate resources in line with strategic objectives and risks;
- Determine the tolerable risk profile and formulate the acceptable risk appetite for the Group;
- Establish adequate risk management and internal control systems to support the business and the risk appetite; and
Risk Appetite
Strategy
Risk Profile
Business Process/Performance
Result
Page 46 of 155 Consolidated and Separate Financial Statements for the period ended 30 June, 2019

United Bank for Africa Plc
Notes to the financial statements
4 Financial Risk Management
4.1 Introduction and risk profile (continued)
(c) Role and responsibilities
The key players in the risk management framework and their responsibilities are as follows:
Board of Directors
The ultimate responsibility for risk management in UBA lies with the Board of Directors. The responsibilities of the Board with respect to
risk management include, but are not limited to:
· Ensuring an appropriate corporate governance framework is developed and operated;
· Providing guidelines regarding the management of risk elements in the Group;
· Approving Group risk management policies;
· Determination of the Group’s risk appetite;
· Ensuring that management controls and reporting procedures are satisfactory and reliable;
· Approving large credit exposures beyond the limit of the Board Credit Committee; and
· Approving capital demand plans based on risk budgets.
Board Committees
The Board of Directors has established various Board-level risk committees, to support its risk oversight roles and responsibilities. These
committees review and advise on numerous risk matters requiring Board approvals.
The Board Risk Management Committee has direct oversight for the Bank’s overall risk management framework. The Board Credit
Committee considers and approves large exposure underwriting decisions within its authority and recommends those above its limit
to the Board for consideration. The Board Audit Committee assists the Board with regard to internal controls, audit assessments and
compliance matters.
Management Committees
Key Management Committees include:
(i) Executive Management Committee (EMC)
The EMC is responsible for the following, among others, and is accountable to the Board:
· Executing strategy once approved by the Board;
· Overall performance of the Group;
· Managing the Group’s risks; and
· Day-to-day oversight for the Group.
All non-credit product approvals must go to the EMC which shall review and approve or recommend for approval to the appropriate
Board Committees in line with the Bank’s advised Approval Limits. Above the EMC approval limits, Non-Credit products are
approved by the Board’s Finance and General Purpose Committee (F&GPC).
All new business activity irrespective of capital commitment must be approved by the F & GPC through the EMC.
(ii) Executive Credit Committee (ECC)
The Committee’s main objective is to develop and maintain a sound credit risk portfolio for the Group and to oversee the
development and deployment of credit risk practices across the Group. They also:
· Set frameworks and guidelines for credit risk management for the Group
· Review and recommend all Credit related policies for the Group to the BCC for approval
· Monitor implementation and compliance with credit policy paying particular attention to the following:
· Credit concentration
· Credit portfolio quality
· Review credit requests and recommend those above its limit to BCC for approval
· Ensure the Group’s Non Performing Loans portfolio is within the acceptable ratio
· Review all major credit audit issues with a view to adopting learning points for enhancement to the credit process
(iii) Group Asset and Liability Committee
The Group Asset and Liability Committee (GALCO), is a sub-committee of the EMC that has responsibility for managing UBA Group’s
balance sheet. This committee manages traded and non-traded market risks.
Page 47 of 155 Consolidated and Separate Financial Statements for the period ended 30 June, 2019

United Bank for Africa Plc
Notes to the financial statements
4 Financial Risk Management
4.1 Introduction and risk profile (continued)
In playing this role, GALCO does the following:-
· Recommend balance sheet management policies, frameworks and procedures to the Board Risk Management
Committee through EMC for approval
· Recommend Treasury policies, frameworks and procedures to the Finance and General Purpose Committee (F & GPC) through
EMC for approval
· Manage the Group’s balance sheet and ensure compliance with regulatory and statutory ratios and requirements
· Develop an optimal structure of the Group’s balance sheet to optimize risk-reward through a review of:
· Liquidity Gap Analysis
· Maximum Cumulative Outflow (MCO)
· Stress Test
· Wholesale Borrowing Guidelines
· Contingency Liquidity Plan
· Review Liquidity, Interest Rate and Currency Risks and approve risk mitigation proposals subject to ratification
by EMC
· Set pricing strategies for the Group on assets and liabilities (pool rate, asset and/or liability composition)
subject to ratification by EMC
(iv) Criticized Assets Committee
The Criticized Assets Committee is a management committee which reviews Past Due Obligations (PDOs) and
· Develops the framework to reduce the Group’s portfolio of risk assets on watch-list as well as delinquent
accounts
· Monitor implementation of strategies developed for recoveries and reduction of loan delinquencies
· Ratifies proposed classification of accounts and provisioning levels
· Recommends write-offs for approval through the EMC to the Board
(v) Group Risk Management Committee
The responsibilities of the Group Risk Management Committee are as follows:
(a) To support the EMC in the discharge of its risk management responsibilities which includes but is not limited to the management of
risk, determining risk tolerance levels, risk appetite, risk monitoring, risk assurance and risk disclosures for the Group.
(b) To review, assess and make recommendations on the integrity and adequacy of the overall risk management function of the Group.
(c) To review, assess and make recommendations to the Executive Management Committee regarding policies relating to risk
management.
(d) To review risk limits and periodic risk and compliance reports and make recommendations to the Executive Management
Committee.
(e) Recommend risk approval limits to Executive Management Committee.
(f) To review and recommend on an annual basis the update of the risk management policies, frameworks and procedures of the
Group.
(g) Advise Executive Management Committee on any emerging risks that the Group is or could be exposed to and recommend
mitigation actions.
(h)
Monitor overall risk management framework to ensure that the framework is uniformly applied in all the entities in the Group.
(i) Review IT Risk Management and make recommendations in accordance with the risk appetite of the Group.
(j) Monitor the Basel II Accord Capital Framework implementation and compliance program in the Group.
(k) Periodic review of the Risk Assets Portfolio and Limits in line with internal and regulatory benchmarks.
(l) Review and recommend yearly Risk Management staffing model and manpower development programs.
Page 48 of 155 Consolidated and Separate Financial Statements for the period ended 30 June, 2019

United Bank for Africa Plc
Notes to the financial statements
Group Chief Risk Officer
The Group Chief Risk Officer has oversight for the effective and efficient governance of all risk functions in the Group. He is
responsible for development and implementation of Group’s risk management frameworks, policies and processes across the entire
risk spectrum.
(d) Central Risk Management Functions
Each risk function including Credit, Market, Operational and IT Risk has direct responsibility for the development and management of
risk management activities. The responsibilities of divisional functions with respect to risk include:
· Develop and maintain policies, frameworks and risk management methodologies
· Provide guidance on the management of risks and ensure implementation of risk policies and strategies
· Provide recommendations for improvement of risk management
· Provide consolidated risk reports to the various Board and management committees such as EMC, ECC and/or
Board of Directors
· Provide assurance that risk management policies and strategies are operating effectively to achieve the
Group’s business objectives.
At a strategic level, our risk management objectives are as follows:
· To identify, assess, control, report and manage the Group’s material risks and optimize risk/return decisions
· To ensure business growth plans are properly supported by effective risk infrastructure
· To manage the risk profile to ensure that specific financial deliverables remain possible under a range of
adverse business conditions
Page 49 of 155 Consolidated and Separate Financial Statements for the period ended 30 June, 2019

United Bank for Africa Plc
Notes to the financial statements
4 Financial Risk Management
4.1 Introduction and risk profile (continued)
(e) Risk Management Structure
The Group has in place an independent Risk Management Directorate which is essential to UBA's growth and earnings sustainability.
In response to the dynamic risk environment, the risk management structure has been flattened to ensure increased oversight and
improved responsiveness.
(f) Risk Management Policies
The principal risk policies cover the Group’s main risk types, assigning responsibility for the management of specific risks and setting
out requirements for control frameworks for all risk types. Fundamental to the delivery of the Group’s risk management objectives are
a series of methodologies that allow it to measure, model, price, stress-test, mitigate and report the risks that arise from its activities.
(i) Risk Appetite
A key responsibility of the Board is the determination of the organization’s risk appetite. This is codified in a Risk Appetite framework
which considers the level of risk that the Group is willing to take in pursuit of its business objectives. This is expressed as the Group’s
appetite for earnings volatility across all businesses from a credit, marketing and liquidity risk perspective.
Risk appetite is institutionalized by establishing scale of activities through clearly defined target market criteria, product risk
acceptance criteria, portfolio limits as well as risk-return requirements.
(ii) Approval Authority
The Board of Directors also set internal approval limits which are reviewed from time to time as the circumstances of the Group
demands. These are at all times guided by maximum regulatory limit as applicable.
(iii) Risk concentration
Concentrations arise when a number of counterparties are engaged in similar business activities, or activities in the same
geographical region, or have similar economic features that would cause their ability to meet contractual obligations to be similarly
affected by changes in economic, political or other conditions. Concentrations indicate the relative sensitivity of the Group’s
performance to developments affecting a particular industry or geographical location.
In order to avoid excessive concentrations of risk, the Group’s policies and procedures include specific guidelines to focus on
maintaining a diversified portfolio. Identified concentrations of credit risks are controlled and managed accordingly. The Group
applies a concentration risk management framework that sets exposure limits as a function of capital across all dimensions of its
asset portfolio including geography, sector, obligor, product etc. This is closely monitored to ensure diversification of risk.
CEO
Executive Director, Risk Management
Risk Measurement
Portfolio
Analytics
Risk
Modelling
Capital Measurement
Credit Risk Management
Credit Policy
& Strategy
Credit Product
Programs
Credit Control
Credit
Administration
Credit Monitoring
Individually Assess Credit
Product Programs
Collateral Management
Subsidiary
Monitoring
Credit Support Office
Credit Recoveries
Group Recoveries
Nigeria
Group
Recoveries Africa
Remedial Mgt & Retail Collections
Fraud & Forgeries
Market Risk
Traded Market Risk
Non-Traded Market Risk
Page 50 of 155 Consolidated and Separate Financial Statements for the period ended 30 June, 2019

United Bank for Africa Plc
Notes to the financial statements
4.2 Credit Risk
(a) Overview
Credit risk is the potential for financial loss resulting from the failure of a borrower or counterparty to honor its financial or contractual
obligations. Credit represent a significant part of the overall risk exposure of the Group and is largely represented by the loans and
advances on the books of the Group. The Group has several policies and frameworks in place for managing credit risk across the
Group.
4 Financial Risk Management
4.1 Introduction and risk profile (continued)
(i) Credit Risk Management (CRM)
The Credit Risk Management division acts as the custodian of Group credit policies and recommends reviews based on regulatory
changes and other developments in the operating environment. It develops and implements the Group credit risk management
framework, as well as a portfolio management strategy towards achieving a diversified, high quality asset mix to minimize
delinquencies.
In addition, CRM ensures appropriate control measures are taken in the documentation and administration of approved loans.
(ii) Credit Risk Governance
The Board through Board Credit Committee (BCC) is responsible for the overall governance of credit risk and the management of
the credit portfolio of the Group. It reviews and recommends credit policies to the Board. The Executive Credit Committee (ECC) sets
frameworks and guidelines for credit risk management for the Group and reviews and recommends for approval to the BCC all
credit related policies for the Group. ECC monitors implementation and compliance with credit policy paying particular attention to
the following:
a. Credit concentration
b. Credit portfolio performance
c. Credit quality
With regards to approval of credit facilities, the ECC approves facilities that are above the limit of the GMD, while the BCC approves
credit facilities that are above the limit of the ECC. The Board of Directors is the overall approving authority, approving credit
facilities that are above the limit of the BCC.
(iii) Credit Monitoring
Credit monitoring runs as a separate group of risk management to improve oversight of loan performance. Its primary function is to
continuously monitor the bank’s loan portfolio to ensure ongoing portfolio performance and achievement of portfolio quality
targets. Credit Monitoring ensures all loans are booked in line with the Group’s policy. They also identify exceptions which may
prevent the loan from being paid in a timely manner. Observed Credit exceptions are escalated for possible resolution, sanction
implementation and management attention. The group takes proactive steps to ensure follow up on accounts showing signs of
delinquency.
(iv) Credit Concentration Management
The Group has a Credit Concentration Risk Management policy which provides a framework within which lending decisions can be
made so as to ensure an adequate level of diversification of the Group’s credit portfolio. The policy provides risk-based limits that
restrict lending activities to within the Group’s desired risk appetite and tolerance.
The Group ensures that:
· It manages its portfolio by ensuring adequate diversification across industries, segments and jurisdictions to maintain high portfolio
quality and liquidity
· Provides risk based concentration limits to ensure that exposures to single obligors, sectors and countries are contained within
acceptable risk appetite.
(v) Credit Risk Measurement
In measuring credit risk of loans and advances to various counterparties, the Group considers the credit worthiness and financial
capacity of the obligor to pay or meet contractual obligations, current exposures to the counter party/obligor and its likely future
developments, credit history of the counterparty/obligor; and the likely recovery ratio in case of default obligations-value of
collateral and other ways out. Our credit exposure comprises wholesale and retail loans and advances and debt securities. The
Group's policy is to lend principally on the basis of our customers' repayment capacity through quantitative and qualitative
evaluation. However we strive to ensure that our loans are backed by collateral to reflect the risk of the obligors and the nature of the
facility.
In the estimation of credit risk, the Group estimates the following parameters:
- Probability of Default (PD)
- Loss Given Default(LGD)
- Exposure at Default
Probability of Default
This is the probability that an obligor or counterparty will default over a given period, usually one year. To measure expected credit
loss, we develop a 12-month PD or equivalent (used in Stage 1 provisioning) and a lifetime PD or equivalent (used for Stages 2 and 3
provisioning). The PDs are used to reflect the current expectation of default.
Page 51 of 155 Consolidated and Separate Financial Statements for the period ended 30 June, 2019

United Bank for Africa Plc
Notes to the financial statements
4 Financial Risk Management
4.2 Credit risk (continued)
Loss Given Default
Exposure at default
(vi) Remedial Management Process
(vii)
Steps Activities
1. Identification
2. Assessment & Implementation Accurate review and professional assessment of credit records
Implementation of identified strategies
Update the database
3. Management & Monitoring Proffer professional work-out situations to aid prompt settlement
Proffer solutions that will aid the credit decision making process
4. Controlling
5. Reporting
Work out and recovery
LGD is defined as the portion of the loan determined to be irrecoverable at the time of loan default (1 – recovery rate). Our
methods for estimating LGD includes both quantitative and qualitative factorsm which are adjusted for forward looking
information to measure lifetime expected credit losses.
This represents the amount that is outstanding at the point of default. Its estimation includes the drawn amount and expected
utilization of the undrawn commitment at default.
This process is managed by the Group Remedial & Recovery Division (GRRD). Depending on the severity of classification, the Group
undertakes remedial corrective action geared towards ensuring performance of weak credits. Early attention, including
substantive discussions with borrowers, is required to correct deficiencies.
Remedial process covers the evaluation, analysis or restructuring of credit facilities for existing PDOs. It may include new extensions
of credit and/or restructuring of terms. Some of the possible actions are summarised as follows:
· Rate/Payment modification or longer-term payment relief - adjusting interest rates or payment frequency;
· Ageing/Extension: Modifying the length of the loan;
· Cash Out: Refinancing a loan at a higher principal amount in order to get additional funds for other uses;
· Short Sale – Loan is discounted to prevent imminent foreclosure; and
· Deed in lieu – Voluntary conveyance of interest in property to the Bank
The process calls for full information gathering, together with financial and risk analysis leading up to the approval decision. Analysis
and standards vary according to business product, market, transaction characteristics and environmental issues. In all cases, we
strive to achieve good judgment, in ensuring that all relevant issues have been addressed in each situation.
Establish key control processes, practices and reporting requirements on a
case-by-case basis.
The Remedial Management & Credit Recovery Division (“RMCRD”) is the collections arm of Credit Risk Management that
evaluates, monitors and supervises the re-structuring, repayments and collections of all past due obligations that have been
prudential classified and show early warning signs of default. The division has a three level governance structure:
Level 1 is an oversight and supervisory function performed by the Divisional Head through the Regional Heads;
Level 2 is a supervisory and management function performed by the Regional Heads through the Zonal Heads; and
Level 3 is an operational function performed by the Zonal Head in conjunction with the Recovery/Remedial officers from the
regional bank offices.
RMCRD maintains effective governance and control over its entire process and adopts a standard methodology consisting of five
steps.
Risk Management and Credit Recovery Division methodology
Identification of past due obligations due for recovery, collections and
remedial action
Identification of strategies to be adopted
Identification of the least cost alternative of achieving timely collections
within resource constraints
Review identified strategies for adequacy in managing past due obligations
Ensure work-out situations align with UBA’s strategic framework
Proffer solutions that will aid the credit decision making process
Communicate learning points from case profiles on past due obligations in
order to improve the quality of lending practices
Report cases of imminent crystallisation of default
Present remedial actions to reduce and/or mitigate default
Page 52 of 155 Consolidated and Separate Financial Statements for the period ended 30 June, 2019
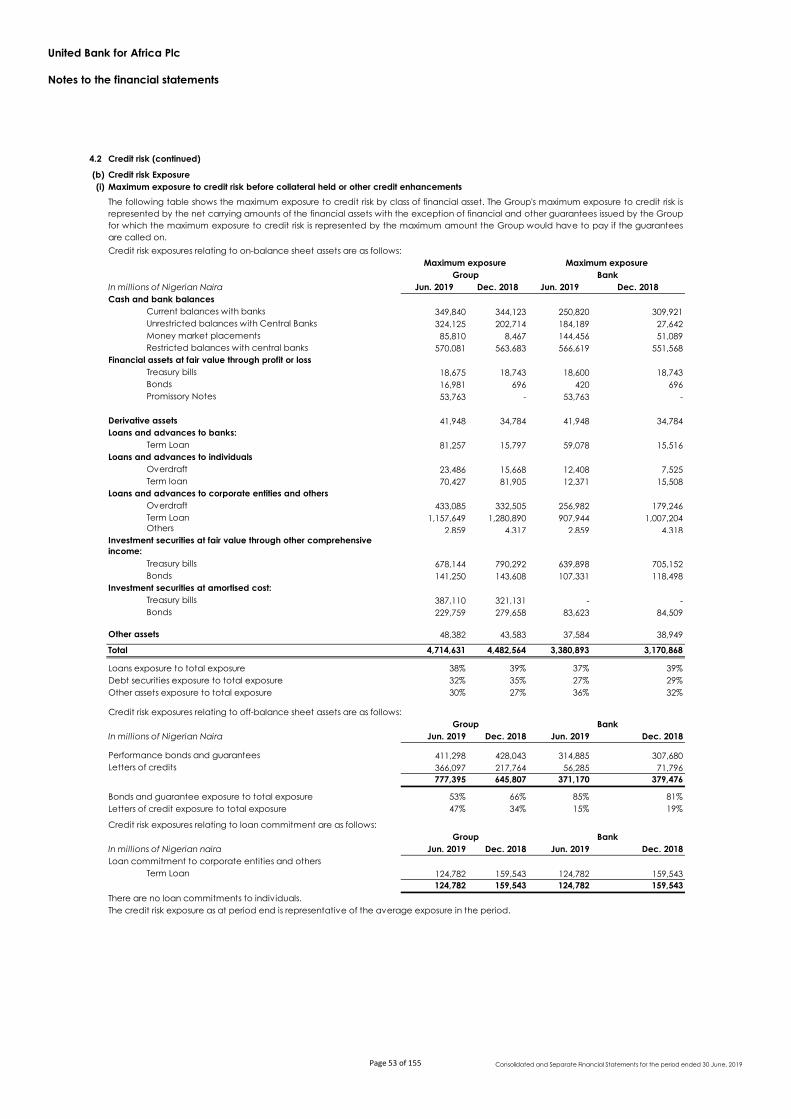
United Bank for Africa Plc
Notes to the financial statements
4.2 Credit risk (continued)
(b) Credit risk Exposure
(i) Maximum exposure to credit risk before collateral held or other credit enhancements
Credit risk exposures relating to on-balance sheet assets are as follows:
In millions of Nigerian Naira Jun. 2019 Dec. 2018 Jun. 2019 Dec. 2018
Cash and bank balances
Current balances with banks 349,840 344,123 250,820 309,921
Unrestricted balances with Central Banks 324,125 202,714 184,189 27,642
Money market placements 85,810 8,467 144,456 51,089
Restricted balances with central banks 570,081 563,683 566,619 551,568
Financial assets at fair value through profit or loss
Treasury bills 18,675 18,743 18,600 18,743
Bonds 16,981 696 420 696
Promissory Notes 53,763 - 53,763 -
Derivative assets 41,948 34,784 41,948 34,784
Loans and advances to banks:
Term Loan 81,257 15,797 59,078 15,516
Loans and advances to individuals
Overdraft 23,486 15,668 12,408 7,525
Term loan 70,427 81,905 12,371 15,508
Loans and advances to corporate entities and others
Overdraft 433,085 332,505 256,982 179,246
Term Loan 1,157,649 1,280,890 907,944 1,007,204 Others 2,859 4,317 2,859 4,318
Treasury bills 678,144 790,292 639,898 705,152
Bonds 141,250 143,608 107,331 118,498
Investment securities at amortised cost:
Treasury bills 387,110 321,131 - -
Bonds 229,759 279,658 83,623 84,509
Other assets 48,382 43,583 37,584 38,949
Total 4,714,631 4,482,564 3,380,893 3,170,868
Loans exposure to total exposure 38% 39% 37% 39%
Debt securities exposure to total exposure 32% 35% 27% 29%
Other assets exposure to total exposure 30% 27% 36% 32%
Credit risk exposures relating to off-balance sheet assets are as follows:
In millions of Nigerian Naira Jun. 2019 Dec. 2018 Jun. 2019 Dec. 2018
Performance bonds and guarantees 411,298 428,043 314,885 307,680
Letters of credits 366,097 217,764 56,285 71,796
777,395 645,807 371,170 379,476
Bonds and guarantee exposure to total exposure 53% 66% 85% 81%
Letters of credit exposure to total exposure 47% 34% 15% 19%
Credit risk exposures relating to loan commitment are as follows:
In millions of Nigerian naira Jun. 2019 Dec. 2018 Jun. 2019 Dec. 2018
Loan commitment to corporate entities and others
Term Loan 124,782 159,543 124,782 159,543
124,782 159,543 124,782 159,543
There are no loan commitments to individuals.
The following table shows the maximum exposure to credit risk by class of financial asset. The Group's maximum exposure to credit risk is
represented by the net carrying amounts of the financial assets with the exception of financial and other guarantees issued by the Group
for which the maximum exposure to credit risk is represented by the maximum amount the Group would have to pay if the guarantees
are called on.
Maximum exposure Maximum exposure
Group Bank
Investment securities at fair value through other comprehensive
income:
Group Bank
Group Bank
The credit risk exposure as at period end is representative of the average exposure in the period.
Page 53 of 155 Consolidated and Separate Financial Statements for the period ended 30 June, 2019

United Bank for Africa Plc
Notes to the financial statements
4.2 Credit risk (continued)
(b) Credit risk Exposure(continued)
(ii) Credit concentration - location
30 June 2019
In millions of Nigerian Naira
Nigeria
Rest of
Africa
Rest of the
world Total Nigeria
Rest of
Africa
Rest of the
world Total
Financial assets
Cash and bank balances:
- Current balances with banks - 243,602 106,238 349,840 - 521 250,299 250,820
184,189 139,936 - 324,125 184,189 - - 184,189
- Money market placements 85,810 85,810 134,900 9,556 - 144,456
566,619 3,462 - 570,081 566,619 - - 566,619
Financial assets at FVTPL:
- Treasury bills 18,600 75 - 18,675 18,600 - - 18,600
- Government bonds 420 16,561 - 16,981 420 - - 420
- Promissory Notes 53,763 - - 53,763 53,763 - - 53,763
Derivative assets 41,796 - 152 41,948 41,796 - 152 41,948
Loans and advances to banks
- Corporates 9,286 - 71,971 81,257 9,286 - 49,792 59,078
Loans and advances to customers:
Individuals:
- Overdrafts 12,408 11,078 - 23,486 12,408 - - 12,408
- Term loans 12,371 58,056 - 70,427 12,371 - - 12,371
Corporates:
- Overdrafts 252,283 180,802 - 433,085 252,283 4,700 - 256,982
- Term loans 856,715 300,934 - 1,157,649 856,715 51,229 - 907,944
- Others 2,859 - - 2,859 2,859 - - 2,859
Investment securities:
At amortised cost
- Treasury bills - 387,110 - 387,110 - - - -
- Bonds 71,615 137,796 20,348 229,759 71,615 - 12,008 83,623
At FVOCI
- Treasury bills 639,898 38,246 - 678,144 639,898 - - 639,898
- Bonds 107,331 33,919 - 141,250 107,331 - - 107,331
Other assets 22,524 22,934 2,924 48,382 22,524 15,060 - 37,584
Total financial assets 2,852,677 1,574,511 287,443 4,714,631 2,987,577 81,066 312,251 3,380,893
Commitments and guarantees
- Performance bonds and guarantees 314,885 96,413 - 411,298 314,885 - - 314,885
- Letters of credits 56,285 309,812 - 366,097 56,285 - - 56,285
- Loan commitments 124,782 - - 124,782 124,782 - - 124,782
Total commitments and guarantees 495,952 406,225 0 902,177 495,952 - 0 495,952
- Unrestricted balances with Central
Banks
The Group monitors concentrations of credit risk by sector, geographic location and industry. Concentration by location for loans and
advances is measured based on the location of the Group entity holding the asset, which has a high correlation with the location of
the borrower. Concentration by location for investment securities is measured based on the location of the issuer of the security. The
amounts stated are net of impairment allowances.
An analysis of concentrations of credit risk at the reporting date is shown below:
Group Bank
- Restricted balances with central banks
Page 54 of 155 Consolidated and Separate Financial Statements for the period ended 30 June, 2019
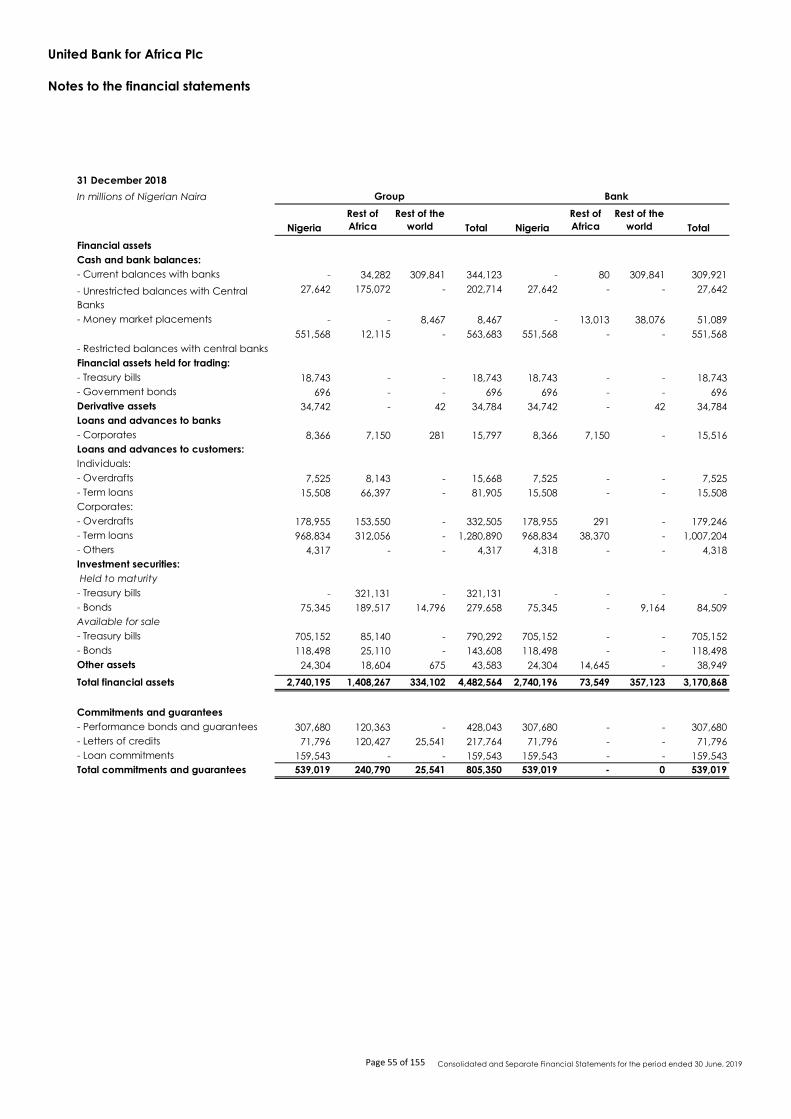
United Bank for Africa Plc
Notes to the financial statements
31 December 2018
In millions of Nigerian Naira
Nigeria
Rest of
Africa
Rest of the
world Total Nigeria
Rest of
Africa
Rest of the
world Total
Financial assets
Cash and bank balances:
- Current balances with banks - 34,282 309,841 344,123 - 80 309,841 309,921
27,642 175,072 - 202,714 27,642 - - 27,642
- Money market placements - - 8,467 8,467 - 13,013 38,076 51,089
551,568 12,115 - 563,683 551,568 - - 551,568
Financial assets held for trading:
- Treasury bills 18,743 - - 18,743 18,743 - - 18,743
- Government bonds 696 - - 696 696 - - 696
Derivative assets 34,742 - 42 34,784 34,742 - 42 34,784
Loans and advances to banks
- Corporates 8,366 7,150 281 15,797 8,366 7,150 - 15,516
Loans and advances to customers:
Individuals:
- Overdrafts 7,525 8,143 - 15,668 7,525 - - 7,525
- Term loans 15,508 66,397 - 81,905 15,508 - - 15,508
Corporates:
- Overdrafts 178,955 153,550 - 332,505 178,955 291 - 179,246
- Term loans 968,834 312,056 - 1,280,890 968,834 38,370 - 1,007,204
- Others 4,317 - - 4,317 4,318 - - 4,318
Investment securities:
Held to maturity
- Treasury bills - 321,131 - 321,131 - - - -
- Bonds 75,345 189,517 14,796 279,658 75,345 - 9,164 84,509
Available for sale
- Treasury bills 705,152 85,140 - 790,292 705,152 - - 705,152
- Bonds 118,498 25,110 - 143,608 118,498 - - 118,498
Other assets 24,304 18,604 675 43,583 24,304 14,645 - 38,949
Total financial assets 2,740,195 1,408,267 334,102 4,482,564 2,740,196 73,549 357,123 3,170,868
Commitments and guarantees
- Performance bonds and guarantees 307,680 120,363 - 428,043 307,680 - - 307,680
- Letters of credits 71,796 120,427 25,541 217,764 71,796 - - 71,796
- Loan commitments 159,543 - - 159,543 159,543 - - 159,543
Total commitments and guarantees 539,019 240,790 25,541 805,350 539,019 - 0 539,019
Group Bank
- Unrestricted balances with Central
Banks
- Restricted balances with central banks
Page 55 of 155 Consolidated and Separate Financial Statements for the period ended 30 June, 2019

United Bank for Africa Plc
Notes to the financial statements
4.2 Credit risk (continued)
(iii) Credit concentration - Industry
Group Agriculture
Constructio
n and Real
Estate Education
Finance
and
Insurance General
General
Commerce
Governmen
ts
Informatio
n and
Communi
cation
Manufact
uring
Oil and
Gas
Power
and
Energy
Transportati
on and
Storage Total
30 June 2019
In millions of Nigerian Naira
Cash and bank balances:
- Current balances with banks - - - 349,840 - - - - - - - - 349,840
- - - 324,125 - - - - - - - - 324,125
- Money market placements - - - 85,810 - - - - - - - - 85,810
- - - 570,081 - - - - - - - - 570,081
Financial assets at FVTPL:
- Treasury bills - - - - - - 18,675 - - - - - 18,675
- Government bonds - - - - - - 16,981 - - - - - 16,981
- Promissory Notes - - - - - - 53,763 - - - - - 53,763
Derivative assets - - - 41,948 - - - - - - - - 41,948
Loans and advances to banks - - - 81,257 - - - - - - - - 81,257 Loans and advances to customers:
Individuals
- Overdrafts - - - - 23,486 - - - - - - - 23,486
- Term loans - - - - 70,427 - - - - - - - 70,427
Corporates
- Overdrafts 46,782 9,675 2,694 7,557 13,018 57,239 56,999 4,919 90,730 105,529 36,121 1,820 433,085
- Term loans 9,119 34,219 12,947 103,288 42,799 132,373 141,870 90,444 208,649 254,036 127,627 279 1,157,649
- Others - - - - - - - - 2,859 - - - 2,859
Investment securities:
At Amortised cost
- Treasury bills - - - - - - 387,110 - - - - - 387,110
- Bonds - - - 1,103 12,597 - 216,059 - - - - - 229,759
At FVOCI -
- Treasury bills - - - - - - 678,144 - - - - - 678,144
- Bonds - - - - - - 141,250 - - - - - 141,250
Other assets - - - 3,721 44,661 - - - - - - - 48,382
Total financial assets 55,901 43,894 15,641 1,568,730 206,988 189,611 1,710,852 95,363 302,238 359,565 163,749 2,100 4,714,631
Commitments and guarantees
- Performance bonds and
guarantees 1,466 197,358 14 20,198 5,945 83,018 819 1,227 12,566 52,954 35,323 410 411,298
- Letters of credits 4,662 242,660 - 123 - 24,305 - 3,609 69,689 19,072 1,542 435 366,097
- Loan Commitments - - - - - - - - - 124,782 - - 124,782
Total commitments and guarantees 6,128 440,018 14 20,321 5,945 107,323 819 4,836 82,255 196,808 36,865 845 902,177
The following table analyses the Group’s credit exposure at carrying amounts (without taking into account any collateral held or other credit support), as categorised by the industry sectors of
the Group’s counterparties. The amounts stated are net of impairment allowances.
- Unrestricted balances with
Central Banks
- Restricted balances with central
banks
Page 56 of 155 Consolidated and Separate Financial Statements for the period ended 30 June, 2019

United Bank for Africa Plc
Notes to the financial statements
Credit concentration - Industry (continued)
Bank Agriculture
Constructio
n and Real
Estate Education
Finance
and
Insurance General
General
Commerce
Governmen
ts
Informatio
n and
Communi
cation
Manufact
uring
Oil and
Gas
Power
and
Energy
Transportati
on and
Storage Total
30 June 2019
Financial assets
In millions of Nigerian Naira
Cash and bank balances:
- Current balances with banks - - - 250,820 - - - - - - - - 250,820
- - - 184,189 - - - - - - - - 184,189
- Money market placements - - - 144,456 - - - - - - - - 144,456
- - - 566,619 - - - - - - - - 566,619
Financial assets at FVTPL: - - - - - - - - - - -
- Treasury bills - - - - - - 18,600 - - - - - 18,600
- Government bonds - - - - - - 420 - - - - - 420
- Promissory Notes - - - - - - 53,763 - - - - - 53,763
Derivative assets - - - 41,948 - - - - - - - - 41,948
Loans and advances to banks - - - 59,078 - - - - - - - - 59,078
Loans and advances to customers:
Individuals
- Overdrafts - - - - 12,408 - - - - - - - 12,408
- Term loans - - - - 12,371 - - - - - - - 12,371
Corporates
- Overdrafts 29,361 8,245 2,373 5,540 13,018 22,040 41,000 855 65,624 35,722 32,795 408 256,982
- Term loans 9,119 33,055 12,468 86,784 42,799 97,212 69,831 71,643 153,722 205,316 125,521 476 907,944
- Others - - - - - 2,519 - - 340 - - - 2,859
Investment securities:
At amortised cost
- Treasury bills - - - - - - - - - - - - -
- Bonds - - - 1,103 - - 82,520 - - - - - 83,623
At FVOCI
- Treasury bills - - - - - - 639,898 - - - - - 639,898
- Bonds - - - - - - 107,331 - - - - - 107,331
Other assets - - - 27,489 10,095 - - - - - - 37,584
Total financial assets 38,480 41,299 14,841 1,368,026 90,691 121,771 1,013,363 72,498 219,686 241,038 158,316 884 3,380,893
Commitments and guarantees
- Performance bonds and
guarantees 1,400 200,294 - 37,577 - 24,679 14,944 767 4,756 7,477 21,887 1,105 314,885
- Letters of credits 4,642 5,881 - 123 - 8,278 - 3,609 24,468 8,381 468 435 56,285
- Loan Commitments - - - - - - - - - 124,782 - - 124,782
Total commitments and guarantees 6,042 206,175 - 37,700 - 32,957 14,944 4,376 29,224 140,639 22,355 1,540 495,952
- Restricted balances with central
banks
- Unrestricted balances with
Central Banks
Page 57 of 155 Consolidated and Separate Financial Statements for the period ended 30 June, 2019
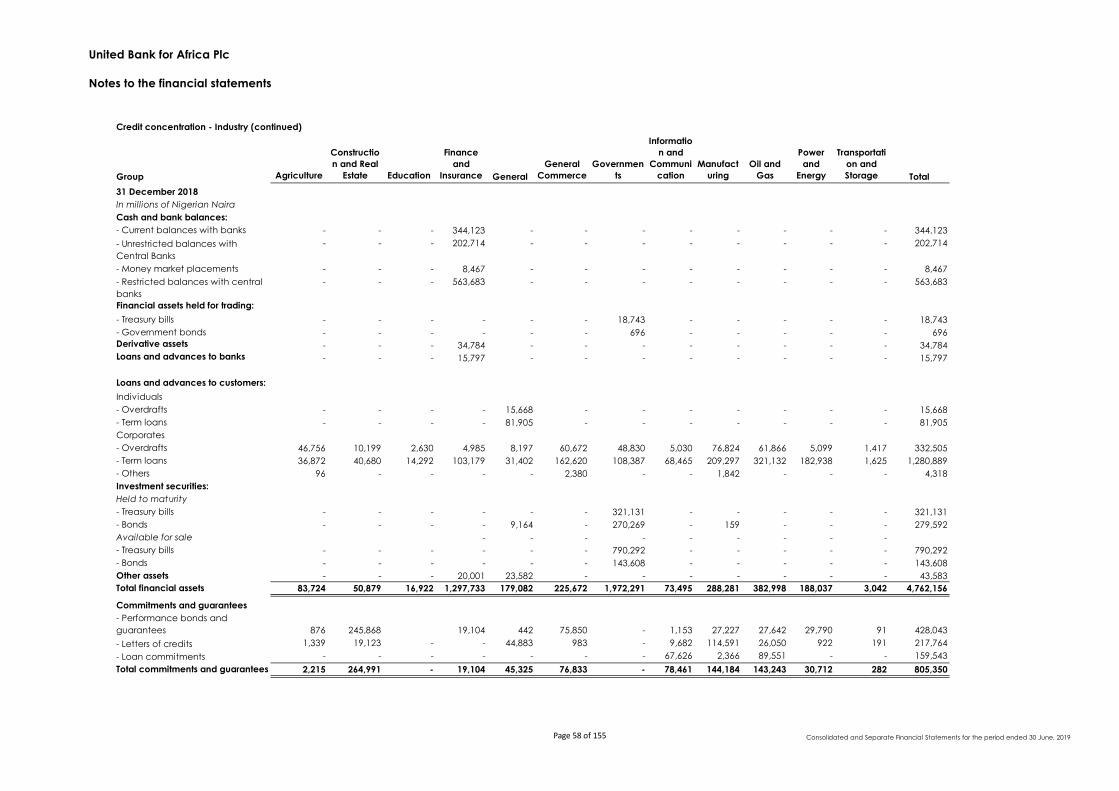
United Bank for Africa Plc
Notes to the financial statements
Credit concentration - Industry (continued)
Group Agriculture
Constructio
n and Real
Estate Education
Finance
and
Insurance General
General
Commerce
Governmen
ts
Informatio
n and
Communi
cation
Manufact
uring
Oil and
Gas
Power
and
Energy
Transportati
on and
Storage Total
31 December 2018
In millions of Nigerian Naira
Cash and bank balances:
- Current balances with banks - - - 344,123 - - - - - - - - 344,123
- - - 202,714 - - - - - - - - 202,714
- Money market placements - - - 8,467 - - - - - - - - 8,467
- - - 563,683 - - - - - - - - 563,683
Financial assets held for trading:
- Treasury bills - - - - - - 18,743 - - - - - 18,743
- Government bonds - - - - - - 696 - - - - - 696
Derivative assets - - - 34,784 - - - - - - - - 34,784
Loans and advances to banks - - - 15,797 - - - - - - - - 15,797
Loans and advances to customers:
Individuals
- Overdrafts - - - - 15,668 - - - - - - - 15,668
- Term loans - - - - 81,905 - - - - - - - 81,905
Corporates
- Overdrafts 46,756 10,199 2,630 4,985 8,197 60,672 48,830 5,030 76,824 61,866 5,099 1,417 332,505
- Term loans 36,872 40,680 14,292 103,179 31,402 162,620 108,387 68,465 209,297 321,132 182,938 1,625 1,280,889
- Others 96 - - - - 2,380 - - 1,842 - - - 4,318
Investment securities:
Held to maturity
- Treasury bills - - - - - - 321,131 - - - - - 321,131
- Bonds - - - - 9,164 - 270,269 - 159 - - - 279,592
Available for sale - - - - - - - - -
- Treasury bills - - - - - - 790,292 - - - - - 790,292
- Bonds - - - - - - 143,608 - - - - - 143,608
Other assets - - - 20,001 23,582 - - - - - - - 43,583
Total financial assets 83,724 50,879 16,922 1,297,733 179,082 225,672 1,972,291 73,495 288,281 382,998 188,037 3,042 4,762,156
Commitments and guarantees
- Performance bonds and
guarantees 876 245,868 19,104 442 75,850 - 1,153 27,227 27,642 29,790 91 428,043
- Letters of credits 1,339 19,123 - - 44,883 983 - 9,682 114,591 26,050 922 191 217,764
- Loan commitments - - - - - - - 67,626 2,366 89,551 - - 159,543
Total commitments and guarantees 2,215 264,991 - 19,104 45,325 76,833 - 78,461 144,184 143,243 30,712 282 805,350
- Unrestricted balances with
Central Banks
- Restricted balances with central
banks
Page 58 of 155 Consolidated and Separate Financial Statements for the period ended 30 June, 2019

United Bank for Africa Plc
Notes to the financial statements
Credit concentration - Industry (continued)
Bank Agriculture
Constructio
n and Real
Estate Education
Finance
and
Insurance General
General
Commerce
Governmen
ts
Informatio
n and
Communi
cation
Manufact
uring
Oil and
Gas
Power
and
Energy
Transportati
on and
Storage Total
31 December 2018
Financial assets
In millions of Nigerian Naira
Cash and bank balances:
- Current balances with banks - - - 309,921 - - - - - - - - 309,921
- - - 27,642 - - - - - - - - 27,642
- Money market placements - - - 51,089 - - - - - - - - 51,089
- - - 551,568 - - - - - - - - 551,568
Financial assets held for trading: - - - - - - - - - - -
- Treasury bills - - - - - - 18,743 - - - - - 18,743
- Government bonds - - - - - - 696 - - - - - 696
Derivative assets - - - 34,784 - - - - - - - - 34,784
Loans and advances to banks - - - 15,516 - - - - - - - - 15,516
Loans and advances to customers:
Individuals
- Overdrafts - - - - 7,525 - - - - - - - 7,525
- Term loans - - - - 15,508 - - - - - - - 15,508
Corporates
- Overdrafts 31,383 8,716 1,919 795 8,077 35,681 34,683 267 35,752 19,771 2,046 156 179,246
- Term loans 17,468 39,529 13,629 87,969 30,168 139,116 60,161 56,368 177,908 231,736 152,913 239 1,007,204
- Others 96 - - - - 2,380 - - 1,842 - - - 4,318
Investment securities:
Held to maturity
- Treasury bills - - - - - - - - - - - - -
- Bonds - - - - 9,164 - 75,186 - 159 - - 84,509
Available for sale
- Treasury bills - - - - - - 705,152 - - - - - 705,152
- Bonds - - - - - - 118,498 - - - - - 118,498
-
Other assets - - - 31,513 7,436 - - - - - - 38,949
Total financial assets 48,947 48,245 15,548 1,110,797 87,042 177,177 1,013,119 56,635 215,820 251,507 154,959 395 3,170,868
Commitments and guarantees
- Performance bonds and
guarantees 683 184,397 - 19,041 440 43,439 - 814 13,151 26,164 19,478 73 307,680
- Letters of credits 360 4,016 - - 32,950 96 - 9,682 552 23,883 101 156 71,796
- Loan commitments - - - - - - - 67,625 2,367 89,551 - - 159,543
Total commitments and guarantees 1,043 188,413 - 19,041 33,390 43,535 - 78,121 16,070 139,598 19,579 229 539,019
Restricted balances with central
- Unrestricted balances with
Central Banks
- Restricted balances with central
banks
Page 59 of 155 Consolidated and Separate Financial Statements for the period ended 30 June, 2019

United Bank for Africa Plc
Notes to the financial statements
4.2 Credit risk (continued)
(c) Credit Quality
The credit quality of the Group's loans and advances are categorized as follows:
Stage 1 Loans and Advances:
Stage 2 Loans and Advances:
Stage 3 Loans and Advances:
0
The Group manages the credit quality of its financial assets using internal credit ratings. It is the Group’s policy to maintain accurate and
consistent risk ratings across the credit portfolio. This facilitates focused management of the applicable risks and the comparison of credit
exposures across all lines of business, geographic regions and products. The rating system is supported by a variety of financial analytics,
combined with processed market information to provide the main inputs for the measurement of counterparty risk. All internal risk ratings
are tailored to the various categories and are derived in accordance with the Group’s rating policy. The attributable risk ratings are
assessed and updated regularly.
These are loans and advances that have not deteriorated significantly in credit quality since initial recognition or that have low credit risk
(where the optional simplification is applied) at the reporting date.
These are loans and advances that have deteriorated significantly in credit quality since initial recognition but do not have objective
evidence of a credit loss event.
These are loans and advances that have objective evidence of a credit loss event. Stage 3 allocation is driven by either the identification
of credit impairment or an exposure being classified as defaulted.
Loans with renegotiated terms
The contractual terms of a loan may be amended for a number of reasons including changing market conditions, customer retention and
other factors not related to a current or potential credit deterioration of the customer. The Group renegotiates loans to customers to
maximise collection opportunities and minimise the risk of default. The revised terms of renegotiated facilities usually include extended
maturity, changing timing of interest payments and amendments to the terms of the loan agreement. As at 30 June 2019, the carrying
amount of loans with renegotiated terms was N9.69billion (December 2018 : N89.87 billion). There are no other financial assets with
renegotiated terms as at 30 June 2019 (December 2018: nil) and these renogotiated assets do not qualify to be termed modified assets as
defined by IFRS 9 and IFRS 7.
Impairment assessment under IFRS
The Group assesses its impairment for the purpose of IFRS reporting using the 'forward-looking' Expected Credit Loss (ECL) model in line with
provisions of IFRS 9 - Financial Instrument .
The Group records an allowance for expected losses for all loans and other debt financial assets not held at FVPL, together with loan
commitments and financial guarantee contracts. The allowance is based on the expected credit losses associated with the probability of
default in the next twelve months unless there has been a significant increase in credit risk since origination, in which case, the allowance is
based on the probability of default over the life of the asset.
The measurement of expected credit losses is based on the product of the instrument’s probability of default (PD), loss given default (LGD),
and exposure at default (EAD), discounted to the reporting date using the effective interest rate.
The ECL model has three stages. The Group recognises a 12-month expected loss allowance on initial recognition (stage 1) and a lifetime
expected loss allowance when there has been a significant increase in credit risk since initial recognition (stage 2). Stage 3 requires
objective evidence that an asset is credit-impaired and then a lifetime expected loss allowance is recognised.
Page 60 of 155 Consolidated and Separate Financial Statements for the period ended 30 June, 2019

United Bank for Africa Plc
Notes to the financial statements
Credit Quality (continued)
(i)
30 June 2019
Stage 1 -
12-month
ECL
Stage 2 -
Lifetime
ECL
Stage 3 -
Lifetime ECL
Total Stage 1 - 12-
month ECL
Stage 2 -
Lifetime
ECL
Stage 3 -
Lifetime
ECL Total
In millions of Nigerian Naira
Cash and bank balances:
- Current balances with banks 349,840 - - 349,840 250,820 - - 250,820
324,125 - - 324,125 184,189 - - 184,189
- Money market placements 85,810 - - 85,810 144,456 - - 144,456
570,081 - - 570,081 566,619 - - 566,619
Financial assets at FVTPL:
- Treasury bills 18,675 - - 18,675 18,600 - - 18,600
- Government bonds 16,981 - - 16,981 420 - - 420
- Promissory Notes 53,763 - - 53,763 53,763 - - 53,763
Derivative assets 41,948 - - 41,948 41,948 - - 41,948
Loans and advances to banks 81,891 - - 81,891 59,685 - - 59,685
Loans and advances to customers
Individuals
- Overdrafts 7,741 2,218 15,586 25,545 4,242 36 9,563 13,841
- Term loans 75,438 1,916 2,046 79,400 17,039 - 1,012 18,051
Corporates
- Overdrafts 299,879 84,851 74,310 459,040 182,834 69,249 20,918 273,001
- Term loans 839,294 346,830 6,877 1,193,001 607,943 321,695 2,182 931,820
- Others 2,875 - - 2,875 2,875 - - 2,875
Investment securities:
At Amortised Cost
- Treasury bills 387,110 - - 387,110 - - - -
- Bonds 229,759 - - 229,759 83,623 - - 83,623
At FVOCI
- Treasury bills 678,144 - - 678,144 639,898 - - 639,898
- Bonds 141,250 - - 141,250 107,331 - - 107,331
Other assets 48,382 - 6,751 55,133 37,584 - 2,056 39,640
Gross financial assets 4,252,987 435,815 105,570 4,794,372 3,003,869 390,980 35,731 3,430,580
Allowance for impairment on financial assets is as follows:
Allowance for credit losses
Loans and advances to
customers
- Individuals 4,384 220 6,428 11,032 1,061 1 6,050 7,113
- Corporates 31,281 14,738 15,304 61,324 15,142 12,564 12,205 39,911
Loans and advances to banks 634 - - 634 607 - - 607
36,299 14,959 21,732 72,990 16,810 12,566 18,255 47,631
Allowance for impairment
Other assets 708 - 6,043 6,751 - 177 1,879 2,056
Investment Securities 458 - - 458 458 - - 458
1,166 - 6,043 7,209 458 177 1,879 2,514
Total impairment allowance
on financial assets 37,465 14,959 27,775 80,199 17,268 12,743 20,134 50,145
Net amount 4,215,522 420,856 77,795 4,714,172 2,986,601 378,237 15,597 3,380,435
The table below shows the credit quality by class of asset for all financial assets exposed to credit risk.
Group Bank
- Unrestricted balances with
Central Banks
- Restricted balances with
central banks
Page 61 of 155 Consolidated and Separate Financial Statements for the period ended 30 June, 2019

United Bank for Africa Plc
Notes to the financial statements
Credit Quality (continued)
31 December 2018
Stage 1 -
12-month
ECL
Stage 2 -
Lifetime
ECL
Stage 3 -
Lifetime ECL Total
Stage 1 - 12-
month ECL
Stage 2 -
Lifetime
ECL
Stage 3 -
Lifetime
ECL
Total
In millions of Nigerian Naira
Cash and bank balances:
- Current balances with banks 344,123 - - 344,123 309,921 - - 309,921
202,714 - - 202,714 27,642 - - 27,642
- Money market placements 8,467 - - 8,467 51,089 - - 51,089
563,683 - - 563,683 551,568 - - 551,568
Financial assets held for trading:
- Treasury bills 18,743 - - 18,743 18,743 - - 18,743
- Government bonds 696 - - 696 696 - - 696
Derivative assets 34,784 - - 34,784 34,784 - - 34,784
Loans and advances to banks 16,147 - - 16,147 15,859 - - 15,859
Loans and advances to
customers
Individuals
- Overdrafts 8,318 2,874 13,386 24,578 6,203 82 7,020 13,305
- Term loans 80,158 1,759 2,431 84,348 15,499 - 997 16,496
Corporates
- Overdrafts 263,588 46,302 73,525 383,414 167,171 20,929 20,144 208,244
- Term loans 1,131,083 152,318 27,318 1,310,720 874,473 131,431 25,831 1,031,734
- Others 4,333 - - 4,333 4,333 - - 4,333
Investment securities:
- Held-to-maturity
- Treasury bills 321,131 - - 321,131 - - - -
- Bonds 279,658 - - 279,658 84,509 - - 84,509
- Promissory notes - - - - - - - -
- Available-for-sale
- Treasury bills 790,292 - - 790,292 705,152 - - 705,152
- Bonds 143,608 - - 143,608 118,498 - - 118,498
Other assets 43,583 - 5,310 48,893 38,949 - 1,965 40,914
Gross financial assets 4,255,109 203,253 121,970 4,580,332 3,025,089 152,442 55,956 3,233,487
Allowance for impairment on financial assets is as follows:
Allowance for credit losses
Loans and advances to
customers
- Individuals 1,091 60 10,202 11,353 201 1 6,566 6,768
- Corporates 23,856 5,950 50,949 80,755 17,760 5,398 30,385 53,543
Loans and advances to banks 350 - - 350 343 - - 343
25,297 6,010 61,151 92,458 18,304 5,399 36,951 60,654
Allowance for impairment
Other assets * 878 - 4,432 5,310 251 - 1,714 1,965
878 - 4,432 5,310 251 - 1,714 1,965
Total impairment allowance
on financial assets 26,175 6,010 65,583 97,768 18,555 5,399 38,665 62,619
Net amount 4,228,934 197,243 56,387 4,482,564 3,006,534 147,043 17,291 3,170,868
Group Bank
- Unrestricted balances with
Central Banks
- Restricted balances with
central banks
Page 62 of 155 Consolidated and Separate Financial Statements for the period ended 30 June, 2019

United Bank for Africa Plc
Notes to the financial statements
Credit Quality (continued)
(ii)
Very Acceptable Moderately Gross Carrying
Low risk Low risk risk High risk Unrated Amount amount
Group
30 June 2019
In millions of Nigerian Naira
Cash and bank balances:
- Current balances with banks - 349,840 - - - 349,840 - 349,840
324,125 - - - - 324,125 - 324,125
- Money market placements - 85,810 - - - 85,810 - 85,810
570,081 - - - - 570,081 - 570,081
Financial assets at FVTPL:
- Treasury bills 18,675 - - - - 18,675 - 18,675
- Government bonds 16,981 - - - - 16,981 - 16,981
- Promissory Notes 53,763 - - - - 53,763 - 53,763
Derivative assets 41,948 - - - - 41,948 - 41,948
Loans and advances to banks 1,601 80,290 - - - 81,891 (634) 81,257
Loans and advances to customers
Individuals
- Overdrafts - - 7,777 2,182 15,586 25,545 (2,059) 23,486
- Term loans - - 75,438 1,916 2,046 79,400 (8,973) 70,427
Corporates
- Overdrafts 318 43,969 340,443 - 74,310 459,040 (25,956) 433,085
- Term loans 54,239 343,699 778,499 9,687 6,877 1,193,001 (35,353) 1,157,648
- Others 0 - 2,875 - - 2,875 (16) 2,859
Investment securities:
At Amortised Cost
- Treasury bills 387,110 - - - - 387,110 (458) 386,652
- Bonds 218,089 10,301 1,369 - - 229,759 - 229,759
At FVOCI - -
- Treasury bills 678,144 - - - - 678,144 - 678,144
- Bonds 141,250 - - - - 141,250 - 141,250
Other assets - - - - 55,133 55,133 (6,751) 48,382
2,506,324 913,909 1,206,401 13,785 153,952 4,794,372 (80,200) 4,714,172
Commitments and guarantees:
- Bonds and guarantees - 85 411,213 - - 411,298 (4,119) 407,179
- Letters of credits - 369 365,728 - - 366,097 (603) 365,494
- Loan Commitments - 82,652 42,130 - - 124,782 - 124,782
- 83,106 819,071 - - 902,177 (4,722) 897,455
The internal credit rating of total financial assets across risk buckets at the reporting date is as follows:
Allowance
for credit
losses
- Unrestricted balances with
Central Banks
- Restricted balances with
central banks
Page 63 of 155 Consolidated and Separate Financial Statements for the period ended 30 June, 2019

United Bank for Africa Plc
Notes to the financial statements
Credit Quality (continued)
Very Acceptable Moderately Gross Portfolio Carrying
Low risk Low risk risk High risk Unrated Amount Allowance amount
Group
31 December 2018
In millions of Nigerian Naira
Cash and bank balances:
- Current balances with banks - 344,123 - - - 344,123 - 344,123
202,714 - - - - 202,714 - 202,714
- Money market placements - 8,467 - - - 8,467 - 8,467
563,683 - - - - 563,683 - 563,683
Financial assets held for trading:
- Treasury bills 18,743 - - - - 18,743 - 18,743
- Government bonds 696 - - - - 696 - 696
Derivative asset 34,784 - - - - 34,784 - 34,784
Loans and advances to banks - 16,147 - - - 16,147 (350) 15,797
Loans and advances to customers
Individuals
- Overdrafts - - 24,303 275 - 24,578 (8,910) 15,668
- Term loans - - 80,119 4,229 84,348 (2,443) 81,905
Corporates -
- Overdrafts 973 27,048 346,247 9,147 - 383,414 (50,909) 332,505
- Term loans 58,571 276,358 975,102 690 - 1,310,720 (29,830) 1,280,890
- Others - - 4,333 - - 4,333 (16) 4,317
Investment securities:
Held to maturity
- Treasury bills 321,131 - - - - 321,131 - 321,131
- Bonds 257,959 20,398 1,301 - - 279,658 - 279,658
Available for sale
- Treasury bills 790,292 - - - - 790,292 - 790,292
- Bonds 143,608 - - - - 143,608 - 143,608
Other assets - - - - 43,583 43,583 - 43,583
2,393,154 692,540 1,431,404 14,341 43,583 4,575,022 (92,458) 4,482,564
- Unrestricted balances with
Central Banks
- Restricted balances with
central banks
Page 64 of 155 Consolidated and Separate Financial Statements for the period ended 30 June, 2019

United Bank for Africa Plc
Notes to the financial statements
Credit Quality (continued)
Very Acceptable Moderately Gross Carrying
Low risk Low risk risk High risk Unrated Amount amount
Bank
30 June 2019
In millions of Nigerian Naira
Cash and bank balances:
- Current balances with banks - 250,820 - - - 250,820 - 250,820
184,189 - - - - 184,189 - 184,189
- Money market placements - 144,456 - - - 144,456 - 144,456
566,619 - - - - 566,619 - 566,619
Financial assets at FVTPL: -
- Treasury bills 18,600 - - - - 18,600 - 18,600
- Government bonds 420 - - - - 420 - 420
- Promissory Notes 53,763 - - - - 53,763 - 53,763
Derivative assets 41,948 - - - - 41,948 - 41,948
Loans and advances to banks 1,601 58,084 - - - 59,685 (607) 59,078
Loans and advances to customers
Individuals
- Overdrafts - - 4,278 - 9,563 13,841 (1,433) 12,408
- Term loans - - 17,039 - 1,012 18,051 (5,679) 12,371
Corporates -
- Overdrafts 159 35,687 216,237 - 20,918 273,001 (16,019) 256,982
- Term loans 54,239 237,062 638,337 - 2,182 931,820 (23,875) 907,944
- Others - - 2,875 - - 2,875 (16) 2,859
Investment securities: -
At Amortised Cost -
- Treasury bills - - - - - - - -
- Bonds 71,953 10,301 1,369 - - 83,623 (458) 83,165
At FVOCI -
- Treasury bills 639,898 - - - - 639,898 - 639,898
- Bonds 107,331 - - - - 107,331 - 107,331
Other assets - - - - 39,640 39,640 (2,056) 37,584
1,740,720 736,410 880,135 - 73,315 3,430,580 (50,145) 3,380,435
Commitments and guarantees:
- Bonds and guarantees - 85 314,800 - - 314,885 (3,850) 311,035
- Letters of credits - 369 55,916 - - 56,285 (593) 55,692
- Loan Commitments - 82,652 42,130 - - 124,782 - 124,782
- 83,106 412,846 - - 495,952 (4,443) 491,509
Allowance
for credit
losses
- Unrestricted balances with
Central Banks
- Restricted balances with
central banks
Page 65 of 155 Consolidated and Separate Financial Statements for the period ended 30 June, 2019

United Bank for Africa Plc
Notes to the financial statements
Credit Quality (continued)
Very Acceptable Moderately Gross Portfolio Carrying
Low risk Low risk risk High risk Unrated Amount Allowance amount
Bank
31 December 2018
In millions of Nigerian Naira
Cash and bank balances:
- Current balances with banks - 309,921 - - - 309,921 - 309,921
27,642 - - - - 27,642 - 27,642
- Money market placements - 51,089 - - - 51,089 - 51,089
551,568 - - - - 551,568 - 551,568
Financial assets held for trading:
- Treasury bills 18,743 - - - - 18,743 - 18,743
- Government bonds 696 - - - - 696 - 696
Derivative Asset 34,784 - - - - 34,784 - 34,784
Loans and advances to banks - 15,859 - - - 15,859 (343) 15,516
Loans and advances to customers
Individuals
- Overdrafts - - 13,305 - - 13,305 (5,780) 7,525
- Term loans - - 16,496 - - 16,496 (988) 15,508
Corporates
- Overdrafts 973 24,298 182,974 - - 208,244 (28,998) 179,246
- Term loans 58,571 273,304 699,859 - - 1,031,734 (24,530) 1,007,204
- Others - - 4,333 - - 4,333 (15) 4,318
Investment securities:
Held to maturity
- Bonds 62,810 20,398 1,301 - - 84,509 - 84,509
Available for sale
- Treasury bills 705,152 - - - - 705,152 - 705,152
- Bonds 118,498 - - - - 118,498 - 118,498
Other assets - - - - 38,949 38,949 - 38,949
1,579,437 694,869 918,267 - 38,949 3,231,522 (60,654) 3,170,868
- Unrestricted balances with
Central Banks
- Restricted balances with
central banks
Page 66 of 155 Consolidated and Separate Financial Statements for the period ended 30 June, 2019

United Bank for Africa Plc
Notes to the financial statements
(d) Statement of Prudential Adjustments
Group Group Bank Bank
In millions of Nigerian Naira Jun. 2019 Dec. 2018 Jun. 2019 Dec. 2018
Total impairment based on IFRS 59,589 100,757 54,588 65,542
Total impairment based on Prudential Guidelines 87,183 122,212 84,100 80,754
(27,594) (21,455) (29,512) (15,212)
Regulatory credit risk reserve (27,594) (21,521) (29,512) (15,212)
Provisions under prudential guidelines are determined using the time based provisioning prescribed by the Revised Central Bank of Nigeria
(CBN) Prudential Guidelines and the Central Banks of the foreign subsidiaries' regulations. This is at variance with the expected credit loss
model required by IFRS under IFRS 9. As a result of the differences in the methodology/provision, there will be variances in the impairments
allowances required under the two methodologies.
Paragraph 12.4 of the revised Prudential Guidelines for Deposit Money Banks in Nigeria stipulates that Banks would be required to make
provisions for loans as prescribed in the relevant IFRS Standards when IFRS is adopted.
However, Banks would be required to comply with the following:
Provisions for loans recognized in the profit and loss account should be determined based on the requirements of IFRS. However, the IFRS
provision should be compared with provisions determined under prudential guidelines and the expected impact/changes in general
reserves should be treated as follows:
• Prudential Provisions is greater than IFRS provisions; the excess provision resulting therefrom should be transferred from the general reserve
account to a "regulatory risk reserve".
• Prudential Provisions is less than IFRS provisions; IFRS determined provision is charged to the statement of comprehensive income. The
cumulative balance in the regulatory risk reserve is thereafter reversed to the general reserve account.
As at 30 June 2019, the difference between the Prudential provision and IFRS impairment was N27.594 billion for the Group (December
2018: N21.521 billion) and N29.5 billion for the Bank (December 2018: N15.212 billion). This requires transfer of N14.3billion from retained
earnings to regulatory risk reserves for Bank but a transfer of N6.07 billion at group level (December 2018: a transfer of N20,589 billion from
retained earnings to regulatory risk reserve for the Group and a transfer of N14,280 billion from retained earnings to regulatory risk reserve
for the Bank) as disclosed in the statement of changes in equity. These amounts represent the difference between provisions for credit and
other known losses as determined under the prudential guidelines issued by the Central Bank of Nigeria (CBN) and the Central Banks of
foreign subsidiaries, and impairment reserve as determined in line with IFRS 9 as at period end.
Page 67 of 155 Consolidated and Separate Financial Statements for the period ended 30 June, 2019

United Bank for Africa Plc
Notes to the financial statements
4.2 Credit risk (continued)
(e) Credit Collateral
The Group holds collateral against loans and advances and off balance sheet engagements to customers (except clean
transactions) in the form of mortgage interests over property, other registered securities over assets, and guarantees. Estimates
of fair value are based on the value of collateral assessed at the time of borrowing and updated periodically. Collateral
generally is not held over loans and advances to banks except when securities are held as part of reverse repurchase and
securities borrowing activity. Collateral is usually also not held against investment securities.
Irrespective of how well a credit proposal is structured, a second way out in form of adequate collateral coverage for all loans is
a major requirement in order to protect the bank from incurring loan losses due to unforeseen events resulting from deterioration
of the quality of a loan.
Consequently, the Group issues appropriate guidelines for acceptability of loan collateral from time to time and undertaking a
performance guarantees and commitments.These articulate acceptable collateral in respect of each credit product including
description, required documentation for perfection of collateral and minimum realizable value.
All items pledged as security for loan facilities are insured with the Bank noted as the first loss payee.
Some of the collaterals acceptable to the Bank under appropriate documentations are briefly described as follows:
1. Cash
Cash is the most liquid and readily realizable form of security and the most acceptable to the Bank. Furthermore, cash pledged
must be in the same currency as the credit and also in the possession of the Bank either in savings or a deposit account.
2. Treasury bills/certificates
Treasury bills/certificates are acceptable as bank security provided the instruments are purchased through the Bank and have
been properly assigned to the bank. Since payments are channeled through the Bank on due dates, realization of the security is
relatively easy.
3. Stock and shares
Stocks and shares of reputable quoted companies are acceptable collateral securities. Unquoted shares are usually not
acceptable as collaterals.
4. Legal Mortgage
The Bank takes and perfects its interest in acceptable property that are transferred by the obligor as collateral for loan, such that
in case of any default by the obligor, the Bank would not require a court order before realizing the security. Location restrictions
are however specified in respect of landed property.
5. Debenture
The Bank accepts to take a charge on both current and non-current assets of a borrower by a debenture which is a written
acknowledgement of indebtedness by a company usually given under its seal and also sets out the terms for repayment of
interest and principal of the credit. A debenture is executed by an obligor in favour of the Bank and it gives a specific or
general charge on the company’s assets, both present and future.
6. Life Insurance Policies
Generally, life policy with a reputable insurance company approved by the Bank and free of restrictions adverse to the Bank’s
interest is an acceptable security for loan. This could be an endowment policy or whole life policy though the Bank prefers the
endowment policy.
7. Guarantees
The Bank accepts guarantees from well rated banks as well as acceptable parties (guarantors) as additional comfort and
security for her credits. A guarantee is a written promise by one person called the guarantor or surety to be answerable for the
debt, default or miscarriage of another person called principal debtor.
UBA also accepts unconditional insurance credit and performance bonds of first class insurance companies and also the
guarantee of the Federal and State Governments. Other guarantees must however be supported by tangible assets for them to
become valid for lending.
Page 68 of 155 Consolidated and Separate Financial Statements for the period ended 30 June, 2019

United Bank for Africa Plc
Notes to the financial statements
4.2 Credit risk (continued)
(e) Credit Collateral (continued)
Loans to individuals
In millions of Nigerian Naira
Jun. 2019 Dec. 2018 Jun. 2019 Dec. 2018
Against Stage 3 loans
Property 244 1,223 2,560 903
Others 10,143 14,243 8,607 6,800
10,387 15,466 11,167 7,703
Against Stage 2 loans
Property - 284 - -
Others 5,882 4,398 36 82
5,882 4,682 36 82
Against Stage 1 loans
Property 5,445 4,812 4,697 4,651
Others 79,883 85,892 19,232 19,257
85,328 90,704 23,929 23,908
Total for loans to individuals 101,597 110,852 35,132 31,693
Loans to corporates
In millions of Nigerian Naira
Jun. 2019 Dec. 2018 Jun. 2019 Dec. 2018
Against Stage 3 loans
Property 16,919 64,332 16,574 64,188
Others 103,689 63,232 12,825 8,522
120,608 127,564 29,400 72,710
Against Stage 2 loans
Property 51,111 43,633 51,111 40,097
Others 189,567 155,174 160,234 109,353
240,678 198,807 211,345 149,450
Against Stage 1 loans
Property 192,543 292,788 183,431 286,776
Others 839,403 1,062,567 580,683 713,749
1,031,946 1,355,355 764,114 1,000,526
Total for loans to corporates 1,393,232 1,681,726 1,004,859 1,222,686
Total for loans and advances to customers 1,494,829 1,792,578 1,039,991 1,254,379
An estimate of the fair value of collateral and other security enhancements held against loans and advances to customers is
shown below:
Group Bank
Group Bank
Page 69 of 155 Consolidated and Separate Financial Statements for the period ended 30 June, 2019

United Bank for Africa Plc
Notes to the financial statements
4.2 Credit risk (continued)
(e) Credit Collateral (continued)
Total Value of Total Value of
30 June 2019 Exposure Collateral Exposure Collateral
In millions of Nigerian Naira
Loans and advances to banks
Unsecured 81,891 - 59,685 -
Loans and advances to customers
Secured against real estate 261,212 258,375 252,869 258,375
Secured against cash 8,317 8,026 8,317 8,026
Secured against other collateral* 1,348,512 773,592 874,494 773,592
Unsecured 69,465 - 56,885 -
1,687,506 1,039,993 1,192,564 1,039,993
Total Value of Total Value of
31 December 2018 Exposure Collateral Exposure Collateral
In millions of Nigerian Naira
Loans and advances to banks
Unsecured 16,147 - 15,859 -
Loans and advances to customers
Secured against real estate 325,238 407,072 319,222 396,616
Secured against cash 3,000 5,050 3,000 5,050
Secured against other collateral* 1,343,979 1,378,715 848,511 850,973
Unsecured 43,068 - 43,068 -
1,715,285 1,790,837 1,213,801 1,252,639
Repossessed collateral
In millions of Nigerian Naira
Jun. 2019 Dec. 2018 Jun. 2019 Dec. 2018
Property 62 115 62 115
Equities - 2 - 2
62 117 62 117
* Other collateral are mainly domiciliation of payments (sales, invoices, salaries, allowances and terminal benefits), lien on
shipping documents, corporate guarantees and similar collaterals.
Details of collateral held against loans and advances and their carrying amounts are shown below. The Group manages
collaterals for loans and advances based on the nature of those collaterals.
Group Bank
Group Bank
Other financial assets comprising cash and bank balances (including balances with central banks), financial assets held for
trading, investment securities and accounts receivable are not secured. The Group's investment in government securities and its
cash and balances with central banks are not considered to require collaterals given their sovereign nature.
During the period, the Group took possession of property amounting to N342 million (2018: N115 million) held as collateral against
certain loans. These collaterals have been realised and used in offsetting the affected customers' outstanding obligations.
Details of collaterals realised during the period is as shown below:
Loans and advances to customers
Group Bank
Page 70 of 155 Consolidated and Separate Financial Statements for the period ended 30 June, 2019

United Bank for Africa Plc
Notes to the financial statements
4 Liquidity risk
(a) Overview
(i)
(ii)
(iii)
(b) Liquidity ratios
Liquidity risk is the risk that the Group does not have sufficient financial resources to meet maturing obligations or can only access
these financial resources at excessive cost. Liquidity risk arises because of the possibility that the Group might be unable to meet its
payment obligations when they fall due as a result of mismatches in the timing of cash flows under normal and stress circumstances.
To limit this risk, management has arranged for diversified funding sources in addition to its core deposit base, and adopted a policy
of managing assets with liquidity in mind and monitoring future cash flows and liquidity on a daily basis. The Group met all its
financial commitments and obligations without any liquidity risk issues during the period.
Liquidity Risk Management
The Group manages its liquidity prudently in all geographical locations and for all currencies. The principal uncertainties for liquidity
risk are that customers withdraw their deposits at a substantially faster rate than expected, or that asset repayments are not received
on the expected maturity date. To mitigate these uncertainties, our funding base is diverse and largely customer-driven, while
customer assets are of short tenor. In addition we have contingency funding plans including a portfolio of liquid assets that can be
realised if a liquidity stress occurs, as well as ready access to wholesale funds under normal market conditions. We have significant
levels of marketable securities, including government securities that can be monetised or pledged as collateral in the event of a
liquidity stress.
Contingency funding plans are reviewed and approved annually. They provide a broad set of Early Warning Indicators, an
escalation framework and a set of management actions that could be effectively implemented by the appropriate level of senior
management in the event of a liquidity stress. A similar plan is maintained within each country.
Liquidity Risk Governance
The Group Asset and Liability Committee (GALCO) is the responsible governing management body that monitors liquidity
management metrics. Liquidity in each country is managed by the country ALCO within pre-defined liquidity limits and in
compliance with Group liquidity policies and practices, as well as local regulatory requirements. Group Market Risk and Group
Treasury propose and oversee the implementation of policies and other controls relating to the above risks.
Liquidity Risk Measurement
There are two measures used across the Group for managing liquidity risk namely: liquidity ratio mechanism which is a statutory
requirement from most Central Banks in order to protect third party deposits, and funding gap analysis of assets and liabilities. The
funding gap analysis is applied through the use of a maturity ladder by assessing all the bank’s cash inflows against outflows to
identify the potential for net shortfalls or net funding requirements (i.e. a cumulative net excess or deficit of funds) at selected
maturity dates. The maturity ladder is monitored on a day -to-day basis and stress testing is undertaken on a quarterly basis by
applying different scenarios to the maturity ladder and assessing the bank’s funding requirements under each scenario. All UBA
businesses and subsidiaries also construct their maturity ladder and compile reports based on agreed assumptions which is
consolidated into a global report for Group ALCO review. The country treasurer for each subsidiary/Group Head Balance Sheet
Management also documents the appropriate actions and includes the same into the Contingency Funding Plan (CFP) for
implementation.
Liquidity stress testing is also performed for each of UBA Group’s major entities and operating subsidiaries. Stress testing and scenario
analyses are intended to quantify the potential impact of a liquidity event on the balance sheet and liquidity position, and to
identify viable funding alternatives that can be utilized. These scenarios include assumptions about significant changes in key
funding sources, market triggers (such as credit ratings), potential uses of funding and political and economic conditions in certain
countries. These conditions include expected and stressed market conditions as well as Company-specific events.
The key measure used by the Group for managing liquidity risk is the ratio of net liquid assets to deposits from customers. For this
purpose, net liquid assets are considered as including cash and cash equivalents and investment grade debt securities for which
there is an active and liquid market less any deposits from banks, debt securities issued, other borrowings and commitment maturing
within one month.
Page 71 of 155 Consolidated and Separate Financial Statements for the period ended 30 June, 2019

United Bank for Africa Plc
Notes to the financial statements
4 Liquidity risk (continued)
Bank
Jun. 2019
Bank
Dec. 2018
62.99% 55.84%
58.23% 50.28%
64.26% 57.03%
50.65% 43.37%
(c)
The liquidity position of the Group remained strong in the course of the period and materially above the minimum liquidity ratio
requirement of 30% prescribed by the Central Bank of Nigeria which is UBA Plc's lead regulator. Details of the Bank's ratio of net liquid
assets to deposits and customers at the reporting date and during the reporting period were as follows:
The Group's expected cash flows on some financial assets and financial liabilities vary significantly from the contractual cash flows.
Demand and savings deposits are expected to remain stable or increase, while unrecognised loan commitments are not expected
to be drawn down immediately.
At period end
Average for the period
Maximum for the period
Minimum for the period
Analysis of financial assets and liabilities by remaining contractual maturities
The tables below show the undiscounted cash flow on the Group's financial liabilities and on the basis of the earliest possible
contractual maturity. The Gross nominal inflow/outflow disclosed in the table is the contractual, undiscounted cash flows on the
financial liabilities or commitments, except for derivatives assets and liabilities which are stated at their fair values.
Page 72 of 155 Consolidated and Separate Financial Statements for the period ended 30 June, 2019

United Bank for Africa Plc
Notes to the financial statements
4.3 Liquidity risk (continued)
Maturity analysis for financial liabilities
30 June 2019 Gross Less More
Group Carrying nominal than 1 - 3 3 - 6 6 - 12 than
Note amount amount 1 month Months Months Months 1 year
In millions of Nigerian Naira
Non-derivative financial liabilities
Deposits from banks 171,191 180,565 111,227 - 58,002 11,336 -
Deposits from customers
Retail Customers:
Term deposits 478,199 507,823 289,098 210,110 4,147 4,446 22
Current deposits 608,252 608,252 608,252 - - - -
Savings deposits 752,214 758,165 758,165 - - - -
Domiciliary deposits - - - - - - -
Corporate Customers:
Term deposits 438,239 479,774 295,810 176,734 6,959 268 3
Current deposits 1,233,333 1,263,838 1,263,838 - - - -
Domiciliary deposits - - - - - - -
Other liabilities 132,257 132,257 132,257
Borrowings 689,637 758,486 165 216,749 101,765 73,195 366,612
Subordinated liabilities 34 29,976 43,064 - - 2,529 2,495 38,040
Total financial liabilities 4,533,298 4,732,224 3,458,813 603,593 173,402 91,740 404,677
Derivative liabilities: 8650
Cross Currency Swap 1,285 1,285 684 11 - 590 -
Contingents and loan commitments
Performance bonds and guarantees 411,298 411,298 173,423 154,370 75,389 1,129 6,988
Letters of credit 366,097 367,990 155,162 138,115 67,451 1,010 6,252
Loan commitments 124,782 124,782 - 5,066 - 34,231 85,485
Assets used to manage liquidity
Cash and bank balances 1,416,170 1,593,623 763,319 25,294 31,644 25,927 747,440
Financial assets at FVTPL
Treasury bills 18,675 18,675 18,675 - - - -
Promissory notes 53,763 53,763 53,763
Bonds 16,981 16,981 16,981 - - - -
Loans and advances to banks 81,257 107,294 107,294 - - - -
Loans and advances to customers
Individual
Term loans 70,427 86,828 36,044 1,218 1,239 1,040 47,287
Overdrafts 23,486 23,486 23,486 - - - -
Corporates
Term loans 1,157,649 1,289,276 547,933 18,423 18,660 15,475 688,785
Overdrafts 433,085 437,965 437,965 - - - -
Others 2,859 3,222 1,369 46 47 39 1,721
Investment securities
At FVOCI
Treasury bills 678,144 767,913 330 218,726 214,758 334,099 -
Bonds 141,250 476,309 6,509 2,779 1,579 16,593 448,849
At amortised cost
Treasury bills 387,110 387,110 - - - - 387,110
Bonds 229,759 229,759 386 2,609 23,677 30,585 172,502
Other assets 48,382 54,019 54,019 - - - -
Derivative assets 41,948 41,948 143 9,584 - 32,222 -
Total financial assets 4,800,945 5,588,171 2,068,216 278,679 291,604 455,980 2,493,694
Gap (635,815) (49,408) (1,719,867) (622,475) (24,638) 327,281 1,990,292
Restricted balances with central
Page 73 of 155 Consolidated and Separate Financial Statements for the period ended 30 June, 2019

United Bank for Africa Plc
Notes to the financial statements
4.3 Risk management report (continued)Liquidity risk (continued)
Maturity analysis for financial liabilities
30 June 2019 Gross Less More
Bank Carrying nominal than 1 - 3 3 - 6 6 - 12 than
amount amount 1 month Months Months Months 1 year
In millions of Nigerian Naira
Non-derivative liabilities
Deposits from banks #REF! 25,608 26,658 14,540 - 10,137 1,981 -
Deposits from customers #REF!
Retail Customers:
Term deposits 403,868 408,763 210,067 190,866 3,746 4,062 22
Current deposits 465,473 465,473 465,473 - - - -
Savings deposits 623,772 625,851 625,851 - - - -
Domiciliary deposits - - - - - - -
Corporate Customers:
Term deposits 324,252 327,665 202,492 120,282 4,710 178 3
Current deposits 740,001 751,038 751,038 - - - -
Domiciliary deposits - - - - - - -
Other liabilities 94,030 94,030 94,030 - - - -
Borrowings 689,637 758,486 165 216,749 101,765 73,195 366,612
Subordinated liabilities 29,976 43,064 - - 2,529 2,495 38,040
Total financial liabilities 3,396,617 3,501,028 2,363,656 527,897 122,887 81,911 404,677
Derivative liabilities
Cross Currency Swap and forwards 1,285 1,285 684 11 - 590 -
Contingents and loan commitments
Performance bonds and guarantees 314,885 314,885 34,555 138,110 58,504 64,785 18,931
Letters of credit 56,285 56,285 23,733 21,125 10,317 154 956
Loan commitments 124,782 124,782 - 5,066 - 34,231 85,485
Assets used to manage liquidity
Cash and bank balances 1,205,804 1,207,778 494,729 146,430 - - 566,619
Financial assets at FVTPL
Treasury bills 18,600 18,600 18,600 - - - -
Promissory notes 53,763 53,763 53,763 - - - -
Bonds 420 420 420 - - - -
Loans and advances to banks 59,078 59,685 59,685 - - - -
Loans and advances to customers
Individual :
Term loans 12,371 17,673 3,114 1,205 1,717 1,705 9,932
Overdrafts 12,408 13,841 13,841 - - - -
Corporates :
Term loans 907,944 936,592 52,374 74,009 74,724 66,471 669,015
Overdrafts 256,982 277,055 219,387 2,112 3,169 16,027 36,360
Others 2,859 2,958 1,813 1,145 - - -
Investment securities
At FVOCI
Treasury bills 639,898 679,687 292 193,596 190,084 295,714 -
Bonds 107,331 283,031 3,868 1,652 938 9,860 266,714
At amortised cost
Treasury bills - - - - - - -
Bonds 83,623 94,207 168 1,132 9,838 12,834 70,235
Other assets 37,584 37,584 37,584 - - - -
Derivative asset 41,948 41,948 143 9,584 - 32,222 -
Total financial assets 3,440,613 3,724,822 959,781 430,865 280,470 434,833 1,618,875
Gap (453,241) (273,443) (1,462,847) (261,344) 88,762 253,161 1,108,826
Page 74 of 155 Consolidated and Separate Financial Statements for the period ended 30 June, 2019

United Bank for Africa Plc
Notes to the financial statements
4.3 Risk management report (continued)Liquidity risk (continued)
Maturity analysis for financial liabilities
31 December 2018 Gross Less More
Group Carrying nominal than 1 - 3 3 - 6 6 - 12 than
Note amount amount 1 month Months Months Months 1 year
In millions of Nigerian Naira
Non-derivative financial liabilities
Deposits from banks #REF! 174,836 176,747 150,341 26,406 - - -
Deposits from customers #REF!
Retail Customers:
Term deposits 353,247 357,559 204,202 146,507 5,518 738 594
Current deposits 663,514 663,514 663,514 - - - -
Savings deposits 701,980 704,320 704,320 - - - -
- - - - - - - Corporate Customers:
Term deposits 419,230 424,130 262,234 148,835 13,053 - 8
Current deposits 1,211,149 1,211,620 1,211,620 - - - -
Domiciliary deposits - - - - - - -
Other liabilities 101,864 101,864 101,864 - - - -
Borrowings 683,532 802,505 - 36,587 81,058 226,892 457,969
Subordinated liabilities 34 29,859 45,552 - - 2,509 2,509 40,535
Total financial liabilities 4,339,211 4,487,811 3,298,095 358,335 102,138 230,138 499,106
Derivative liabilities: 0
Cross Currency Swap 99 99 99 - - - -
Contingents and loan commitments
Performance bonds and guarantees 428,043 428,043 27,233 41,988 140,900 153,710 64,212
Letters of credit 217,764 217,764 27,878 32,484 103,513 37,788 16,101
Loan commitments 159,543 159,543 - 6,477 - 43,767 109,299
Assets used to manage liquidity
Cash and bank balances 1,220,596 1,248,096 681,632 - 9,230 5,664 551,571
Financial assets held for trading
Treasury bills 18,743 18,743 18,743 - - - -
Bonds 696 696 696 - - - -
Loans and advances to banks 15,797 16,762 1,602 - - 1,129 14,031
Loans and advances to customers
Individual
Term loans 81,905 94,727 39,323 1,328 1,352 1,135 51,589
Overdrafts 15,668 15,851 15,851 - - - -
Corporates
Term loans 1,280,890 1,439,920 611,956 20,575 20,840 17,283 769,266
Overdrafts 332,505 336,384 336,384 - - - -
Others 4,317 4,852 2,062 69 70 58 2,593
Investment securities
Available for sale
Treasury bills 790,292 846,855 56,725 218,289 213,210 358,631 -
Bonds 143,608 418,589 - - - 915 417,674
Held to maturity
Treasury bills 321,131 344,115 23,050 88,701 86,637 145,728 -
Bonds 279,658 436,402 - - - 28,620 407,781
- - - - - - -
Other assets 43,583 43,600 43,600 - - - -
Derivative assets 34,784 34,784 598 9,034 - 25,152 -
Total financial assets 4,584,173 5,300,376 1,832,221 337,996 331,339 584,314 2,214,505
Gap (560,487) 7,116 (1,521,084) (101,288) (15,212) 118,911 1,525,787
Promissory notes
Page 75 of 155 Consolidated and Separate Financial Statements for the period ended 30 June, 2019

United Bank for Africa Plc
Notes to the financial statements
4.3 Risk management report (continued)Liquidity risk (continued)
Maturity analysis for financial liabilities
31 December 2018 Gross Less More
Bank Carrying nominal than 1 - 3 3 - 6 6 - 12 than
amount amount 1 month Months Months Months 1 year
In millions of Nigerian Naira
Non-derivative liabilities
Deposits from banks #REF! 30,502 31,005 26,229 4,776 - - -
Deposits from customers #REF!
Retail Customers:
Term deposits 270,968 274,276 156,639 112,382 4,233 566 456
Current deposits 512,468 512,468 512,468 - - - -
Savings deposits 578,963 580,893 580,893 - - - -
Corporate Customers:
Term deposits 308,871 312,479 193,199 109,655 9,619 - 6
Current deposits 752,838 753,131 753,131 - - - -
Other liabilities 76,949 76,949 76,949 - - - -
Borrowings 657,134 773,799 - 36,587 81,058 198,185 457,969
Subordinated liabilities 29,859 45,552 - - 2,509 2,509 40,535
Total financial liabilities 3,218,552 3,360,552 2,299,508 263,400 97,419 201,260 498,966
Derivative liabilities
Cross Currency Swap 99 99 99 - - - -
Contingents and loan commitments
Performance bonds and guarantees 307,680 307,680 33,764 134,950 57,165 63,303 18,498
Letters of credit 71,796 71,797 30,273 26,947 13,160 197 1,220
Loan commitments 159,543 159,543 - 6,477 - 43,767 109,299
Assets used to manage liquidity
Cash and bank balances 1,015,199 1,016,587 440,229 - 15,358 9,433 551,568
Financial assets held for trading
Treasury bills 18,743 18,743 18,743 - - - -
Bonds 696 696 696 - - - -
Loans and advances to banks 15,516 16,498 1,561 - - 1,157 13,780
Loans and advances to customers
Individual :
Term loans 15,508 18,459 5,505 316 344 304 11,990
Overdrafts 7,525 7,528 7,528 - - - -
Corporates :
Term loans 1,007,204 1,156,376 355,809 20,346 20,608 17,090 742,523
Overdrafts 179,246 179,316 179,316 - - - -
Others 4,318 4,423 1,533 86 86 67 2,651
Investment securities
Available for sale
Treasury bills 705,152 755,621 50,614 194,772 190,240 319,994 -
Bonds 118,498 345,398 - - - 755 344,643
Held to maturity
Treasury bills - - - - - - -
Bonds 84,509 131,875 - - - 8,649 123,226
- - - - - - -
Other assets 38,949 38,964 38,964 - - - -
Derivative asset 34,784 34,784 51 - 19,455 15,278 -
Total financial assets 3,245,847 3,725,268 1,100,548 215,520 246,091 372,727 1,790,381
Gap (511,823) (174,403) (1,263,096) (216,254) 78,347 64,200 1,162,399
Promissory notes
Page 76 of 155 Consolidated and Separate Financial Statements for the period ended 30 June, 2019

United Bank for Africa Plc
Notes to the financial statements
4 Financial Risk Management - Continued
4.4 Market risk
(a) Overview
(i)
Market data collection and statistical analysis
Limit determination based on market volatility
Stop loss limit utilization monitoring
Position monitoring
New trading products risk assessment
P&L attribution analysis
Pricing model validation and sign off
Trading portfolio stress testing
Regulatory limit monitoring
Position data extraction and Internal limit monitoring
Contingency funding plan maintenance and testing
Risk profile reporting to GALCO.
(ii)
(iii)
(iv)
Market risk is the risk that the fair value or future cash flows of financial instruments will fluctuate due to changes in market
variables such as interest rates, foreign exchange rates and equity prices. The Group classifies exposures to market risk into either
trading or non-trading portfolios and manages each of these portfolios separately. The trading portfolios comprise positions arising
from market-making and warehousing of customer derived positions while non-trading portfolios comprise positions that primarily
arise from the interest rate management of our retail and commercial banking assets and liabilities as well as financial instruments
designated as FVOCI and amortised cost.
Market Risk Management
The objective of market risk management in UBA is to ensure that all significant market risks are identified, measured, and
managed in a consistent and effective manner across the Group in order to stabilize earnings and capital and also to ensure that
the Group carries out its affairs within acceptable parameters and in line with the market risk appetite.
Market risk achieves the above stated objective, through a mix of quantitative and statistical controls which covers the
underlisted activities:
The universal market risk factors in UBA Group are interest rates, foreign exchange rates and equity prices. The associated market
risks are:
· Foreign currency risk; arising from changes in exchange rates
The Group uses limits, triggers, value at risk, earnings-at-risk, gap analyses and scenario analyses to measure and control the
market risk exposures within its trading and banking books. The Group also performs regular stress tests on its banking and trading
books.
Approach to Managing Market Risk in the Trading Book
The techniques used to ensure and control trading book market risk include limit monitoring, daily valuation of positions, Value at
Risk (VaR), Backtesting, stop loss triggers, stress testing/sensitivity analysis etc.
· Interest rate risk; arising from changes in yield curves and credit spreads
· Equity risk; arising from changes in in the prices of equities, equity indices and equity baskets.
Market Risk Governance
The Board of Directors is responsible for determining UBA Group's risk appetite and tolerance limits for all its market risk exposures.
Senior management is responsible for supporting the Board in determining market risk appetite and tolerance limits as well as
putting in place all requisite processes, procedures and tools to ensure proper implementation of a robust system for managing,
monitoring and reporting market risk appetite. The Board through Board Risk Management Committee (BRMC) is responsible for
the overall governance of market risk as well as defining the terms of reference and delegating responsibilities to both the Group
Risk Management Committee (GRMC) and Group Asset & Liability Management Committee (GALCO). GALCO has Group
oversight and is charged with ensuring that market risks are managed homogeneously in all areas of operation. Further to the
above, oversight of market risk is vested in BRMC, GALCO and the Finance & General Purpose Committee (FGPC) while the day
to day management rests with the Executive Director, Risk Management, Corporate Governance & Compliance. The Group
Market Risk Division is not only responsible for the development of detailed risk management policies but is also involved in the
day to day review of their implementation. The market risk management policies are usually validated / approved by the Board
in accordance with the approval guidelines. Trading limits are approved by GALCO and F&GPC and ratified by the Board while
exposures against these limits are monitored by market risk management team.
Market Risk Measurement
The Group's policy is that all trading activities are undertaken within the context of the approved Market Risk Management
appetite and limits. Market Risk Management team is responsible for identifying, measuring, managing, monitoring and reporting
market risk as outlined in market risk management policy and other related policies.
Page 77 of 155 Consolidated and Separate Financial Statements for the period ended 30 June, 2019

United Bank for Africa Plc
Notes to the financial statements
4 Financial Risk Management - Continued
4.4 Market risk - continued
(v)
Market Risk Limits: The Bank has put in place specific market risk limits and triggers (regulatory and in-house) to prevent undue risk
exposure to the Group. Market risk limits are based on recommendations by GALCO and approved by the Board. Position limits,
transaction size and portfolio volume limits are in place for each trading portfolio. UBA Group sets various limits for total market risk
and specific foreign exchange, interest rate, equity and other price risks. All limits are reviewed at least annually, and more
frequently if required, to ensure that they remain relevant given market conditions and business strategy. Compliance with limits is
monitored independently on a daily basis by Group Market Risk and Internal Control. Limit excesses are escalated and approved
under a delegated authority structure and reported to the GALCO. Excesses are also reported monthly to Group Risk
Management Committee (GRMC) and quarterly to Board Risk Management Committee (BRMC).
Stop loss Triggers: Stop loss triggers are used to protect the profitability of the trading desk. They establish decision points to
confirm the Group's tolerance for accepting trading risk losses on a cumulative basis. The triggers are monitored on a daily basis
by market risk management team.
Daily Valuation Of Market Risk Positions: Mark to Market (MTM) for relevant products/positions is done in line with International
Financial Reporting Standard (IFRS). All market risk financial instruments are categorized into:
1) Fair value through profit or loss(FVTPL) – valued on fair value accounting methodology and MTM daily.
2) Fair value through other comprehensive income(FVOCI) – valued on fair value accounting methodology and MTM monthly.
3) Amortised cost – This portfolio is not MTM because positions are held until maturity.
Marking-to-market is at least the daily valuation of positions at readily available close out prices that are sourced independently.
Where marking-to-market is not possible, marking-to-model technique is employed. Marking-to-model is defined as any valuation
which has to be benchmarked, extrapolated or otherwise calculated from a market input. Assets that must be marked-to-model
either don't have a regular market that provides accurate pricing, or valuations rely on a complex set of reference variables and
time frames. E.g. complex financial instruments and derivatives.
Stress Testing: Market risk management complements the VaR measurement by regular stress testing of market risk exposures to
highlight the potential risk that may arise from extreme market events that are rare but plausible. Stress testing provides an
indication of the potential losses that could occur under extreme but plausible market conditions including when longer holding
periods may be required to exit positions. Consistent stress-testing methodology is applied to trading and non trading books. Stress
testing methodology considers both historical market events and forward-looking scenarios. The stress testing scenarios include
market and credit scenarios, portfolio specific scenarios and macro economic scenarios. Stress scenarios are regularly updated to
reflect changes in risk profile and economic events.
Factor Sensitivities: Factor sensitivities are expressed as the change in the value of a position for a defined change in a market risk
factor, such as a change in the value of Nigerian Government Treasury bill for a one hundred basis point change in interest rates.
UBA Group’s Market Risk Management, within the Risk organization, works to ensure that factor sensitivities are calculated and
monitored for all material risks taken in the trading portfolios.
Approach to Managing Market Risk in the Non-trading Portfolio
Market risk from non-trading portfolios stems from the potential impact of changes in interest rates and foreign exchange rates on
UBA’s net interest revenues, the changes in accumulated other comprehensive income (loss) from its investment portfolios and
capital invested in foreign currencies.
The management of banking book related market risk exposures involves managing the potential adverse effect of interest rate
movements on banking book earnings (net interest income and banking book MTM profit or loss) and economic value of equity.
Market risk in the banking book arises as a result of the mismatch between the future yield on assets and their funding cost and
also the different repricing characteristics of banking book assets and liabilities. UBA Group uses a variety of tools to track and
manage this risk. These tools include;
• Re-pricing gap analysis
• Liquidity gap analysis
• Earnings-at-Risk (EAR)
• Sensitivity Analysis
Page 78 of 155 Consolidated and Separate Financial Statements for the period ended 30 June, 2019

United Bank for Africa Plc
Notes to the financial statements
4 Financial Risk Management - Continued
4.4 Market risk - continued
(vi)
(b) Interest rate risk
Interest rate risk is managed principally through monitoring interest rate gaps and having pre-approved limits for re-pricing bands.
There will always be a mis-match between maturing assets and maturing liabilities, and changes in interest rates means that the
Net Interest Margin (NIM) is affected on a daily basis by maturing and re-pricing activities. This change is measured through
calculation of Earnings at Risk or EaR on a portfolio over the life of its assets and liabilities. EaR is usually calculated at various
levels of change to simulate the likely change in the course of normal business or the expected risk where there is an unusual
market event.
GALCO has oversight for compliance with these limits and execution of gapping strategy is carried out by Group Treasury.
The management of interest rate risk against interest rate gap limits is supplemented by monitoring the sensitivity of the Group's
financial assets and liabilities to various standard and non-standard interest rate scenarios.
In order to manage changes in interest rates effectively, the Group may modify pricing on new customer loans and deposits,
purchase fixed rate securities, issue debt that is either fixed or floating or enter into derivative transactions that have the opposite
risk exposures. UBA regularly assesses the viability of these and other strategies to reduce its interest rate risks and implements such
strategies when it believes those actions are prudent.
Interest rate risk arises from the possibility that changes in interest rates will affect future cash flows or the fair value of financial
instruments.
Exposure to interest rate risk- non-trading portfolio
UBA Group’s principal measure of risk to net interest revenue is interest rate exposure (IRE). This is the risk that changes in interest
rates could have a negative impact on the Bank’s margins, earnings and capital. The objective of the Bank’s interest rate risk
management is to ensure that earnings are stable and predictable over time. The Bank is exposed to interest rate risk through the
interest-bearing assets and liabilities in its trading and banking books. Non-traded interest rate risk arises in the banking book from
the provision of retail and wholesale (non-traded) banking products and services, as well as from certain structural exposures
within the Group balance sheet, mainly due to different repricing characteristics of banking book assets and liabilities.
The table below is a summary of the group's interest rate gap position at the reporting date. All assets, liabilities and derivatives
instruments are allocated to gap intervals based on either their repricing or maturity characteristics. The Group's assets and
liabilities are included at carrying amount and categorised by the earlier of their contractual re-pricing or maturity dates. Assets
and liabilities for which no identifiable contractual repricing or maturity dates exist are allocated to gap intervals based on
behavioural profiling. Overall non-trading interest rate risk positions are managed by Group Treasury which uses investment
securities, advances to other financial institutions (banks and discount houses) to manage the overall position arising from the
Group’s non-trading activities.
Page 79 of 155 Consolidated and Separate Financial Statements for the period ended 30 June, 2019

United Bank for Africa Plc
Notes to the financial statements
30 June 2019
Group
In millions of Nigerian Naira Carrying
amount
< 1 month 1-3 months 3-6 months 6-12
months
More than
1 year
Non-interest
bearing
Cash and bank balances 1,416,170 61,494 5,122 16,056 3,138 - 1,330,360
Financial assets at FVTPL
Treasury bills 18,675 18,675 - - - - -
Promissory notes 53,763 53,763 - - - - -
Bonds 16,981 16,981 - - - - -
Loans and advances to banks 81,257 81,257 - - - - -
Loans and advances to customers:
Individual
Term loans 70,427 798 1,518 687 1,770 65,654 -
Overdrafts 23,486 23,486 - - - - -
Corporates
Term loans 1,157,649 44,001 83,670 37,831 97,545 894,602 -
Overdrafts 433,085 433,085 - - - - -
Others 2,859 1,366 546 954 (6) - -
Investment securities:
At FVOCI:
Treasury bills 678,144 311 205,922 202,186 269,726 - -
Bonds 141,250 2,406 1,027 584 6,134 131,099 -
Equity 105,021 - - - - - 105,021
At amortised cost:
Treasury bills 387,110 - - - - 387,110
Bonds 229,759 386 2,609 22,677 29,585 174,501
Promissory notes - - - - - - -
Derivative assets 41,948 - - - - - 41,948
Other assets 48,382 - - - - - 48,382
4,905,966 738,009 300,414 280,975 407,892 1,652,966 1,525,711
Derivative liability 1,285 - - - - - 1,285
Deposits from banks 171,191 160,493 10,698 - - - -
Deposits from customers 3,510,237 1,326,506 225,500 33,532 57,491 25,623 1,841,585
Other liabilities 132,257 - - - - - 132,257
Subordinated liabilities 29,976 - - 2,529 2,495 24,952 -
Borrowings 689,637 165 216,749 101,765 73,195 297,763 -
4,534,583 1,487,164 452,947 137,826 133,181 348,338 1,975,127
Gaps 371,383 (749,155) (152,533) 143,149 274,711 1,304,628 (449,416)
Re-pricing period
Page 80 of 155 Consolidated and Separate Financial Statements for the period ended 30 June, 2019
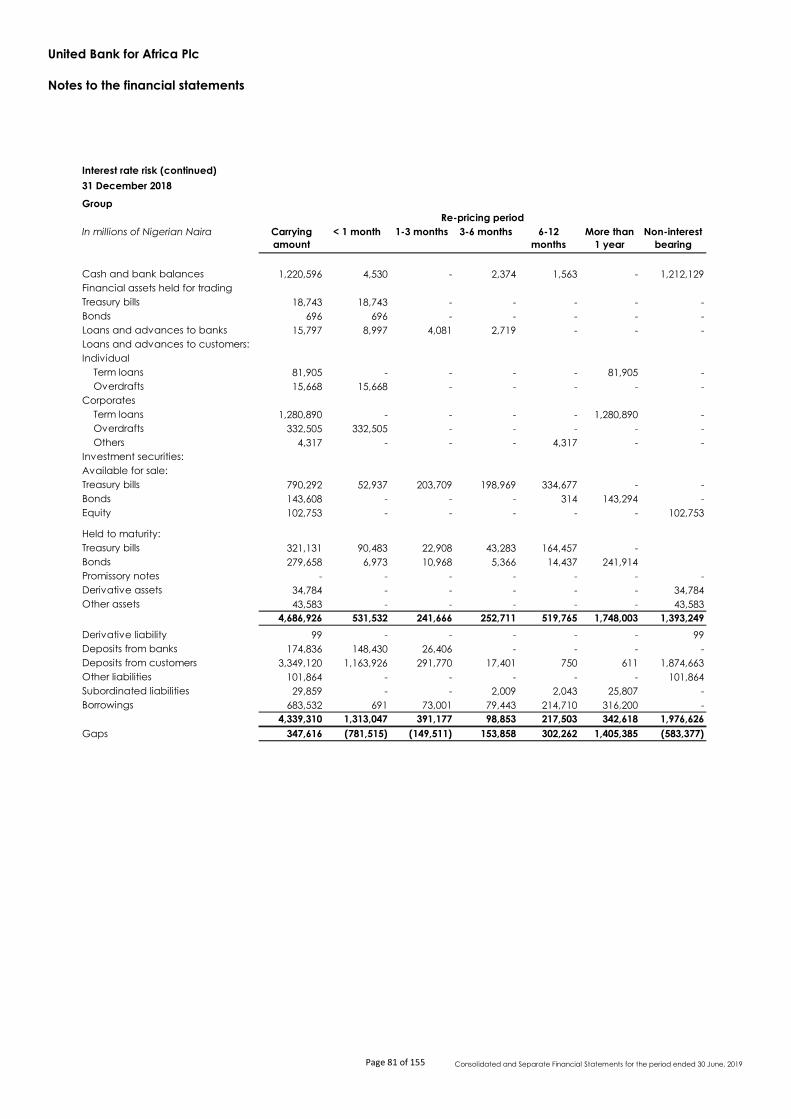
United Bank for Africa Plc
Notes to the financial statements
Interest rate risk (continued)
31 December 2018
Group
In millions of Nigerian Naira Carrying
amount
< 1 month 1-3 months 3-6 months 6-12
months
More than
1 year
Non-interest
bearing
Cash and bank balances 1,220,596 4,530 - 2,374 1,563 - 1,212,129
Financial assets held for trading
Treasury bills 18,743 18,743 - - - - -
Bonds 696 696 - - - - -
Loans and advances to banks 15,797 8,997 4,081 2,719 - - -
Loans and advances to customers:
Individual
Term loans 81,905 - - - - 81,905 -
Overdrafts 15,668 15,668 - - - - -
Corporates
Term loans 1,280,890 - - - - 1,280,890 -
Overdrafts 332,505 332,505 - - - - -
Others 4,317 - - - 4,317 - -
Investment securities:
Available for sale:
Treasury bills 790,292 52,937 203,709 198,969 334,677 - -
Bonds 143,608 - - - 314 143,294 -
Equity 102,753 - - - - - 102,753
Held to maturity:
Treasury bills 321,131 90,483 22,908 43,283 164,457 -
Bonds 279,658 6,973 10,968 5,366 14,437 241,914
Promissory notes - - - - - - -
Derivative assets 34,784 - - - - - 34,784
Other assets 43,583 - - - - - 43,583
4,686,926 531,532 241,666 252,711 519,765 1,748,003 1,393,249
Derivative liability 99 - - - - - 99
Deposits from banks 174,836 148,430 26,406 - - - -
Deposits from customers 3,349,120 1,163,926 291,770 17,401 750 611 1,874,663
Other liabilities 101,864 - - - - - 101,864
Subordinated liabilities 29,859 - - 2,009 2,043 25,807 -
Borrowings 683,532 691 73,001 79,443 214,710 316,200 -
4,339,310 1,313,047 391,177 98,853 217,503 342,618 1,976,626
Gaps 347,616 (781,515) (149,511) 153,858 302,262 1,405,385 (583,377)
Re-pricing period
Page 81 of 155 Consolidated and Separate Financial Statements for the period ended 30 June, 2019

United Bank for Africa Plc
Notes to the financial statements
0 Interest rate risk - continued
30 June 2019 Carrying < 1 1-3 3-6 6-12 More than Non-interest
Bank amount month months months months 1 year bearing
In millions of Nigerian Naira
Cash and bank balances 1,205,804 129,947 14,509 - - - 1,061,348
Financial assets at FVTPL
Treasury bills 18,600 18,600 - - - - -
Promissory notes 53,763 53,763 - - - - -
Bonds 420 420 - - - - -
Loans and advances to banks 59,078 59,078 - - - - -
Loans and advances to customers:
Individual
Term loans 12,371 572 1,087 492 1,267 8,953 -
Overdrafts 12,408 12,408 - - - - -
Corporates
Term loans 907,944 59,944 94,560 50,577 78,361 624,502 -
Overdrafts 256,982 256,982 - - - - -
Others 2,859 1,791 391 683 - 6 -
Investment securities:
At FVOCI:
Treasury bills 639,898 3,866 58,944 80,641 496,447 - -
Bonds 107,331 3,415 1,204 4,987 16,971 80,754 -
Equity 104,491 - - - - - 104,491
At amortised cost:
Treasury bills - - - - - - -
Bonds 83,623 2,661 938 3,886 13,223 62,915
Promissory notes - - - - - - -
Derivative assets 41,948 - - - - - 41,948
Other assets 37,584 - - - - - 37,584
3,545,104 603,447 171,633 141,266 606,263 777,124 1,245,371
Derivative liability 1,285 - - - - - 1,285
Deposits from banks 25,608 23,008 2,600 - - - -
Deposits from customers 2,557,366 1,030,492 308,776 8,392 4,208 25 1,205,474
Other liabilities 94,030 - - - - - 94,030
Subordinated liabilities 29,976 - - 2,529 2,495 24,952 -
Borrowings 689,637 165 216,749 101,765 73,195 297,763 -
3,397,902 1,053,665 528,125 112,687 79,898 322,741 1,300,789
Gaps 147,202 (450,218) (356,492) 28,579 526,366 454,383 (55,418)
Re-pricing period
Page 82 of 155 Consolidated and Separate Financial Statements for the period ended 30 June, 2019

United Bank for Africa Plc
Notes to the financial statements
Interest rate risk - continued
31 December 2018
Bank Carrying < 1 1-3 3-6 6-12 More than Non-interest
amount month months months months 1 year bearing
In millions of Nigerian Naira
Cash and bank balances 1,015,199 27,335 - 14,322 9,433 - 964,110
Financial assets held for trading
Treasury bills 18,743 18,743 - - - - -
Bonds 696 696 - - - - -
Loans and advances to banks 15,516 - - - - 15,516 -
Loans and advances to customers:
Individual
Term loans 15,508 - - - - 15,508 -
Overdrafts 7,525 7,525 - - - - -
Corporates
Term loans 1,007,204 - - - - 1,007,204 -
Overdrafts 179,246 179,246 - - - - -
Others 4,318 - - - 4,318 -
Investment securities:
Available for sale:
Treasury bills 705,152 47,234 181,763 177,534 298,622 - -
Bonds 118,498 - - - 259 118,239 -
Equity 102,242 - - - - - 102,242
Held to maturity:
Bonds 84,509 - - - 5,542 78,967
Promissory notes - - - - - - -
Derivative assets 34,784 - - - - - 34,784
Other assets 38,949 - - - - - 38,949
3,348,089 280,779 181,763 191,856 318,174 1,235,434 1,140,085
Derivative liability 99 - - - - - 99
Deposits from banks 30,502 25,895 4,607 - - - -
Deposits from customers 2,424,108 925,710 219,009 13,061 563 458 1,263,742
Other liabilities 76,949 - - - - - 76,949
Subordinated liabilities 29,859 - - 2,009 2,043 25,807 -
Borrowings 657,134 664 70,129 76,317 206,263 303,761 -
3,218,651 952,269 293,746 91,388 208,868 330,026 1,340,790
Gaps 129,438 (671,490) (111,983) 100,468 109,305 905,408 (200,705)
Re-pricing period
Page 83 of 155 Consolidated and Separate Financial Statements for the period ended 30 June, 2019

United Bank for Africa Plc
Notes to the financial statements
Interest rate sensitivity analysis of floating rate financial instruments
Borrowings Jun. 2019 Dec. 2018 Jun. 2019 Dec. 2018
In millions of Nigerian Naira
- European Investment Bank (EIB) (note 37.4) 23,378 23,539 23,378 23,539
- Africa Trade Finance Limited (note 37.5) 25,742 43,359 25,742 25,419
- African Development Bank (note 37.6) 50,569 54,842 50,569 54,842
- Credit Suisse (note 37.7) 108,490 108,065 108,490 108,065
- Eurobond debt security (note 37.8) 178,734 177,634 178,734 177,634
- JP Morgan Securities Limited (note 37.9) 72,373 72,062 72,373 72,062
-Societe Generale Bank (note 37.11) 36,124 35,967 36,124 35,967
-Mashreqbank psc (note 37.12) 18,054 17,969 18,054 17,969
-Rand Merchant Bank (note 37.13) 27,160 27,015 27,160 27,015
-ABSA Bank Limited (note 37.14) 27,061 21,534 27,061 21,534
-International Finance Corporation (IFC) (note 37.15) - 8,458 - -
-Sumitomo Mitsui Banking Corporation (SMBC) (note 37.16) 36,008 - 36,008 -
603,693 590,444 603,693 564,046
Jun. 2019 Dec. 2018 Jun. 2019 Dec. 2018
Impact on income statement:
Favourable change @ 0.5% increase in rates (3,018) (2,952) (3,018) (2,820)
Unfavourable change @ 0.5% reduction in rates 3,018 2,952 3,018 2,820
(c) Price risk
Price sensitivity analysis for financial instruments measured at FVTPL
In millions of Nigerian Naira
Jun. 2019 Dec. 2018 Jun. 2019 Dec. 2018
Financial assets at FVTPL
Treasury bills 18,675 18,743 18,600 18,743
Government bonds 16,981 696 420 696
35,656 19,439 19,020 19,439
Impact on income statement:
Favourable change @ 2% increase in prices (713) (389) (380) (389)
Unfavourable change @ 2% reduction in prices 713 389 380 389
Derivative assets 41,948 34,784 41,948 34,784
Impact on income statement:
Favourable change @ 2% increase in rates (1,050) (696) (1,050) (696)
Unfavourable change @ 2% reduction in rates 1,050 696 1,050 696
Derivative liabilities 1,285 99 1,285 99
Impact on income statement:
Favourable change @ 2% increase in rates 26 2 26 2
Unfavourable change @ 2% reduction in rates (26) (2) (26) (2)
The tables below shows the impact of interest rate changes (increase / decrease) on the Group's floating-rate financial instrument
portfolios and the effect on income statement. The sensitivity analysis is based on a conservative assumption of 50 basis point
change on the instrument with other variables remaining constant and also assuming there is no asymmetrical movement in yield
curve.
Group Bank
Group Bank
The Group is exposed to the impact of price changes on its financial assets measured at FVTPL, FVTOCI and its equity instruments.
The table below shows the impact of price changes (increase / decrease) on the Group's financial assets measured at fair value
and the effect on profit & loss. For the purpose of sensitivity analysis, a conservative assumption of 2% change in prices with other
variables remaining constant was made.
Group Bank
Page 84 of 155 Consolidated and Separate Financial Statements for the period ended 30 June, 2019

United Bank for Africa Plc
Notes to the financial statements
Price sensitivity analysis for financial instruments measured at FVOCI:
In millions of Nigerian Naira Jun. 2019 Dec. 2018 Jun. 2019 Dec. 2018
Debt securities
Investment securities at FVOCI:
Treasury bills 678,144 790,292 639,898 705,152
Government bonds 141,250 143,608 107,331 118,498
Total 819,394 933,900 747,229 823,650
Impact on other comprehensive income statement:
Favourable change @ 2% increase in prices 16,388 18,678 14,945 16,473
Unfavourable change @ 2% reduction in prices (16,388) (18,678) (14,945) (16,473)
4 Financial Risk Management - Continued
4.4 Market risk - continued
(iii) Equity price risk
Jun. 2019 Dec. 2018 Jun. 2019 Dec. 2018
Total Equity Positions
105,021 102,753 104,491 102,242
105,021 102,753 104,491 102,242
6,018 6,621 6,018 6,621
(5,702) (5,789) (5,702) (5,789)
The table below shows the impact of price changes (increase / decrease) on the Group's financial instruments at FVOCI and the
effect on other comprehensive income. For debt securities which are categorised under level 1 in the fair value hierarchy, a 2%
change in prices has been assumed with other variables remaining constant.
Group Bank
Equity price risk is the risk that the fair value of equities decreases as a result of changes in the level of equity indices and
individual stocks. The non-trading equity price risk exposure arises from equity securities classified as FVOCI. Sensitivity analysis for
the Group's equity securities is shown below.
Group Bank
Favourable change @ 5% decrease in unobservable inputs
Favourable change @ 5% increase in unobservable inputs
In million of Nigerian Naira
Investment securities at FVOCI
Total
Impact on Other comprehensive income:
Page 85 of 155 Consolidated and Separate Financial Statements for the period ended 30 June, 2019
United Bank for Africa Plc
Notes to the financial statements
4.4 Market risk
(c) Exchange rate exposure limits
FCY sensitivity analysis on foreign exchange rate
Foreign exchange risk is the risk that the value of a financial instrument will fluctuate due to changes in foreign exchange
rates. Foreign exchange risk is primarily controlled via policies around trading limits. The Board and Group ALCO set limits on
the level of exposure by currency and in aggregate for both overnight and intra day positions. These limits must be in line
with regulatory Open Position Limit (OPL). Compliance with both internal limits and regulatory limits are monitored daily with
zero tolerance for limit breaches. These limits include OPL, dealers' limit, overnight/intraday limits, maturity gap limits,
management action trigger, product limits, counterparty limits and cross border limits.
The tables below show foreign currencies to which the Group had exposure at the end of the reporting period and the
sensitivity of the Group's profit before tax and equity to changes in exchange rates. The analysis calculates the effect of
reasonably possible movement of the foreign exchange rates against the Nigerian Naira (all other variables being
constant) on the income statement due to changes to the carrying amounts of the Group's foreign currency sensitive
financial assets and liabilities. A negative amount in the table reflects a potential net reduction in the income statement or
equity, while a positive amount reflects a net potential increase. An equivalent decrease in each of the currencies below
against the Nigerian Naira would have resulted in an equivalent but opposite impact.
For the purpose of disclosing the sensitivity analysis for foreign currency risk, the Group's foreign currency risk arising from the
translation of its foreign operations are not taken into account even though they may have an impact on equity. This is
because foreign currency risk can only arise on financial instruments denominated in a currency other than the functional
currency in which they are measured and translation exposures arise from financial and non-financial items held by an
entity with a functional currency different from the group's presentation currency.
The information disclosed on the net foreign currency (FCY) exposure is representative of the average exposure in the
period. The Bank believes that for each foreign currency exposure, it is reasonable to assume 15% depreciation of the Naira
holding all other variables constant.
Page 86 of 155 Consolidated and Separate Financial Statements for the period ended 30 June, 2019

United Bank for Africa Plc
Notes to the financial statements
Group
In millions of Nigerian Naira Note Naira US Dollar Euro Pound Others Total
30 June 2019
Cash and bank balances 750,808 337,528 188,449 7,352 132,032 1,416,170
Financial assets at FVTPL 89,419 - - - - 89,419
Derivative assets - 41,865 80 3 0 41,948
Loans and advances to banks - 80,248 1,009 - - 81,257
Loans and advances to customers 652,236 612,461 10,645 45 412,120 1,687,506
Investment securities 922,967 39,110 - - 578,749 1,540,826
Other assets 24,580 20,433 14 4 3,351 48,382
Total financial assets 2,440,010 1,131,644 200,197 7,404 1,126,252 4,905,508
Derivative liability 590 695 - - - 1,285
Deposits from banks 482 138,037 - 179 32,493 171,191
Deposits from customers 1,896,828 682,113 28,180 7,452 895,663 3,510,237
Other liabilities 77,547 36,418 3,823 436 14,032 132,257
Borrowings 85,944 603,693 - - - 689,637
Subordinated liabilities 29,976 - - - - 29,976
Total financial liabilities 2,091,367 1,460,956 32,003 8,067 942,188 4,534,583
Swap and forward contracts (360,560) 360,560
Net FCY Exposure 31,248 168,194 (663) 184,064
Effect of naira depreciation by 15% on profit before tax 4,687 25,229 (99) 27,610 57,426
Effect of naira appreciation by 15% on profit before tax (4,687) (25,229) 99 (27,610) (57,426)
Group
In millions of Nigerian Naira
31 December 2018 Naira US Dollar Euro Pound Others Total
Cash and bank balances 545,005 247,198 185,849 8,779 233,765 1,220,596
Financial assets held for trading 19,439 - - - - 19,439
Derivative assets - 34,784 - - - 34,784
Loans and advances to banks - 12,960 2,769 68 - 15,797
Loans and advances to customers 625,496 637,905 4,026 82 447,776 1,715,285
Investment securities 1,051,567 65,702 - - 519,863 1,637,132
Other assets 10,409 24,491 - 73 8,610 43,583
Total financial assets 2,251,916 1,023,040 192,644 9,002 1,210,014 4,686,616
Derivative liability 99 - - - 99
Deposits from banks 655 130,380 6,505 66 37,230 174,836
Deposits from customers 1,793,193 491,391 137,741 7,482 919,313 3,349,120
Other liabilities 25,449 29,917 6,401 397 39,700 101,864
Borrowings 93,088 590,444 - - - 683,532
Subordinated liabilities 29,859 - - - - 29,859
Total financial liabilities 1,942,244 1,242,231 150,647 7,945 996,243 4,339,310
Swap and forward contracts (287,032) 287,032 - - - -
Net FCY Exposure 67,841 41,997 1,057 213,771
Effect of naira depreciation by 15% on profit before tax 10,176 6,300 159 32,066 48,700
Effect of naira appreciation by 15% on profit before tax (10,176) (6,300) (159) (32,066) (48,700)
Page 87 of 155 Consolidated and Separate Financial Statements for the period ended 30 June, 2019

United Bank for Africa Plc
Notes to the financial statements
4.4 Market risk
(c) Exchange rate exposure limits - continued
In millions of Nigerian Naira
Bank Naira US Dollar Euro Pound Others Total
30 June 2019
Cash and bank balances 750,808 355,662 90,010 8,024 1,300 1,205,804
Financial assets at FVTPL 72,783 - - - - 72,783
Derivative assets - 41,865 80 3 0 41,948
Loans and advances to banks - 59,078 - - - 59,078
Loans and advances to customers 632,887 553,550 6,094 33 - 1,192,564
Investment securities 922,967 11,918 - - - 934,885
Other assets 20,057 17,509 14 4 - 37,584
Total financial assets 2,399,502 1,039,582 96,198 8,064 1,300 3,544,646
Derivative liability 590 695 - - - 1,285
Deposits from banks 482 25,126 - - - 25,608
Deposits from customers 1,896,828 632,627 21,000 6,877 34 2,557,366
Other liabilities 65,807 24,853 2,055 190 1,124 94,030
Borrowings 91,113 598,524 - - - 689,637
Subordinated liabilities 29,976 - - - - 29,976
Total financial liabilities 2,084,796 1,281,825 23,055 7,067 1,158 3,397,902
Swap and forward contracts (360,560) 360,560
Net FCY Exposure 118,317 73,143 997 142
Effect of naira depreciation by 15% on profit before tax 17,748 10,971 150 21 28,890
Effect of naira appreciation by 15% on profit before tax (17,748) (10,971) (150) (21) (28,890)
31 December 2018 Naira US Dollar Euro Pound Others Total
Cash and bank balances 604,279 168,107 231,585 8,151 3,077 1,015,199
Financial assets held for trading 19,439 - - - - 19,439
Derivative assets - 34,784 - - - 34,784
Loans and advances to banks - 10,274 5,242 - - 15,516
Loans and advances to customers 628,609 575,606 9,494 92 - 1,213,801
Investment securities 995,680 14,477 - - - 1,010,157
Other assets 34,947 3,984 14 4 - 38,949
Total financial assets 2,282,954 807,232 246,335 8,247 3,077 3,347,845
Derivative liability - 99 - - - 99
Deposits from banks 6,181 22,982 1,288 51 - 30,502
Deposits from customers 1,807,402 410,798 198,708 7,189 11 2,424,108
Other liabilities 47,921 24,077 3,058 226 1,667 76,949
Borrowings 92,209 564,925 - - - 657,134
Subordinated liabilities 29,859 - - - - 29,859
Total financial liabilities 1,983,572 1,022,881 203,054 7,466 1,678 3,218,651
Swap and forward contracts (287,032) 287,032 - - - -
Net FCY Exposure 71,383 43,281 781 1,399
Effect of naira depreciation by 15% on profit before tax 10,707 6,492 117 210 17,527
Effect of naira appreciation by 15% on profit before tax (10,707) (6,492) (117) (210) (17,527)
Page 88 of 155 Consolidated and Separate Financial Statements for the period ended 30 June, 2019
United Bank for Africa Plc
Notes to the financial statements
5 Capital
5.1 Capital management
· Capital planning
· Prudent portfolio management
· Capital adequacy stress testing
· Contingency Planning
The objective of the capital management process is to:
· Adequately assess impairment losses and impact on capital impairment;
· Meet CBN’s capital adequacy requirements
· Optimise the use and allocation of capital resources and align our target capital with our optimum capital structure
5.2
During the year, the Group's strategy, which was unchanged, was to maintain a strong capital base so as to retain investor, creditor and
market confidence and to sustain future development of the business. The impact of the level of capital on shareholders’ return is also
recognised and the Group recognises the need to maintain a balance between the higher returns that might be possible with greater
gearing and the advantages and security afforded by a sound capital position.
The Bank maintains an actively managed capital base to cover risks inherent in the business and is meeting the capital adequacy
requirements of local banking supervisors. The Group’s lead regulator, the Central Bank of Nigeria (CBN) sets and monitors capital
requirements for the Bank. The parent company and individual banking operations are directly supervised by the Central Bank
of Nigeria (CBN) and the respective regulatory authorities in the countries in which the subsidiary banking operations are domiciled.
The primary objectives of the Group's capital management policy are to ensure that the Group complies with externally imposed capital
requirements and maintains strong credit ratings and healthy capital ratios in order to support its business and to maximise shareholder
value. The Group manages its capital structure and makes adjustments to it according to changes in economic conditions and the risk
of its activities. In order to maintain or adjust its capital structure, the Bank may adjust the amount of dividend payment to shareholders,
return capital to shareholders or issue capital securities. Capital management is overseen by the Board of Directors who have overall
responsibility for ensuring adequate capital is maintained for the Group.
The Group has a process of ensuring adequate capital is maintained and this process includes:
Regulatory capital
The Group's objectives when managing capital are to safeguard the Group's ability to continue as a going concern in order to provide
returns for shareholders and benefits for other stakeholders.
The group monitors regulatory capital using the capital adequacy ratio. This ratio is calculated as total regulatory capital divided by risk
weighted assets. Total regulatory capital and risk weighted assets are calculated as shown in the table below.
The Central Bank of Nigeria sets and monitors capital requirements for the Bank. The parent company and individual banking operations
are directly supervised by the Central Bank of Nigeria and the respective regulatory authorities in the countries in which the subsidiary
banking operations are domiciled.
The Central Bank of Nigeria requires the Bank to maintain a prescribed ratio of total capital to total risk-weighted assets.
The Group’s regulatory capital is split into two tiers:
Tier 1 capital includes ordinary share capital, share premium, retained earnings, translation reserve and non-controlling interests after
deductions for goodwill and intangible assets, and other regulatory adjustments relating to items that are included in equity but are
treated differently for capital adequacy purposes.
Tier 2 capital includes qualifying subordinated liabilities and the element of the fair value reserve relating to unrealised gains on financial
instruments classified as FVOCI.
Various limits are applied to elements of the capital base. Elements of Tier 2 capital are limited to a maximum of one-third of Tier 1
capital, after making deductions of goodwill, deferred tax asset and other intangible assets but before deductions of investments.
Banking operations are categorised mainly as trading book or banking book, and risk-weighted assets are determined according to
specified requirements that seek to reflect the varying levels of risk attached to assets and off-balance sheet exposures.
Capital adequacy ratio is the quotient of the capital base of the Bank and the Bank’s risk weighted asset base. UBA Plc operates under
an international banking authorization with a minimum regulatory capital of N50 billion and a minimum capital adequacy ratio of 16%.
During the year, the Group complied with all external capital requirements.
Page 89 of 155 Consolidated and Separate Financial Statements for the period ended 30 June, 2019

United Bank for Africa Plc
Notes to the financial statements
5 Capital
(f) Capital management
In millions of Nigeria naira Group Group Bank Bank
Jun. 2019 Dec. 2018 Jun. 2019 Dec. 2018
Tier 1 capital
Ordinary share capital 17,100 17,100 17,100 17,100
Share premium 98,715 98,715 98,715 98,715
Retained earnings 195,065 168,073 89,153 99,332
Other reserves 39 90,783 90,783 74,603 74,603
Gross Tier 1 capital 401,663 374,671 279,571 289,750
Less:
Deferred tax on accumulated losses 39 - 10,779 125 10,779
Intangible assets 17,969 18,168 7,056 6,911
Tier 1 Capital After Regulatory Deduction 383,694 345,724 272,390 272,060
Investment in subsidiaries 27, 28 - - (51,638) (51,889)
Eligible Tier 1 Capital 383,694 345,724 220,752 220,171
5 Risk management report (continued)Tier 2 capital
Fair value reserve for securities measured at FVOCI 39 85,790 69,099 86,355 69,751
Subordinated liabilities 38 12,200 29,859 12,200 29,859
Less: limit of tier 2 to tier 1 capital - (12,295) (7,758) (12,295)
Qualifying Tier 2 Capital Before Deductions 97,990 86,663 90,797 87,315
Less: Investment in subsidiaries - - (51,638) (51,889)
Net Tier 2 Capital 97,990 86,663 39,159 35,426
Qualifying capital
Net Tier I regulatory capital 383,694 345,724 220,752 210,056
Net Tier II regulatory capital 97,990 86,663 39,159 35,426
Total qualifying capital 481,684 432,387 259,911 245,482
Composition of risk-weighted assets:
Risk-weighted amount for credit risk 1,067,603 1,234,765 885,152 873,808
Risk-weighted amount for operational risk 569,966 569,966 369,284 348,242
Risk-weighted amount for market risk 24,141 26,921 12,428 26,460
Total Basel II Risk-weighted assets 1,661,710 1,831,652 1,266,864 1,248,510
Basel II Capital ratios
29.0% 23.6% 20.5% 19.7%
5.3 Capital allocation
Risk Weighted Capital Adequacy Ratio
The above capital adequacy computation is based on full impact of IFRS 9. The CAR, based on adjusted impact is Bank: 24.3%;
Group: 31.1%, taking in relief granted by CBN Circular (BSD/DIR/GEN/LAB/11/027) dated October 18, 2018 on adoption of IFRS 9.
The allocation of capital between specific operations and activities is to a large extent, driven by optimisation of the return achieved on
the capital allocated. The amount of capital allocated to each operation or activity is based primarily upon the regulatory capital but in
some cases the regulatory requirements do not reflect fully the varying degree of risk associated with different activities. In such cases
the capital requirements may be flexed to reflect differing risk profiles, subject to the overall level of capital to support a particular
operation or activity not falling below the minimum required for regulatory purposes.
Although maximisation of the return on risk-adjusted capital is the principal basis used in determining how capital is allocated within the
Group to particular operations or activities, it is not the sole basis used for decision making. Account also is taken of synergies with other
operations and activities, the availability of management and other resources, and the fit of the activity with the Group’s longer term
strategic objectives.
Page 90 of 155 Consolidated and Separate Financial Statements for the period ended 30 June, 2019

United Bank for Africa Plc
Notes to the financial statements
6 Fair value measurement
Fair values of financial instruments
6.1 Valuation models
The fair values of financial assets and financial liabilities that are traded in active markets are based on quoted market prices or dealer
price quotations. For all other financial instruments, the Group determines fair values using other valuation techniques.
For financial instruments that trade infrequently and have little price transparency, fair value is less objective and requires varying
degrees of judgment depending on liquidity, concentration, uncertainty of market factors, pricing assumptions and other risks affecting
the specific instrument.
The Group measures fair values using the following fair value hierarchy, which reflects the significance of the inputs used in making the
measurements.
• Level 1: inputs that are quoted market prices (unadjusted) in active markets for identical instruments. The fair value of financial
instruments traded in active markets is based on quoted market prices at the balance sheet date. A market is regarded as active if
quoted prices are readily and regularly available from an exchange, dealer, broker, industry group, pricing service, or regulatory
agency, and those prices represent actual and regularly occurring market transactions on an arm’s length basis. The quoted market
price used for financial assets held by the Group is the current bid price. These instruments are included in Level 1. Instruments included in
Level 1 comprise primarily quoted equity and debt investments classified as trading securities or available for sale.
• Level 2: inputs other than quoted prices included within Level 1 that are observable either directly (i.e as prices) or indirectly (i.e.
derived from prices). This category includes instruments valued using: quoted market prices in active markets for similar instruments;
quoted prices for identical or similar instruments in markets that are considered less than active; or other valuation techniques in which all
significant inputs are directly or indirectly observable from market data. The fair value of financial instruments that are not traded in an
active market (for example, over-the-counter derivatives) is determined by using valuation techniques. These valuation techniques
maximize the use of observable market data where it is available and rely as little as possible on entity specific estimates. If all significant
inputs required to fair value an instrument are observable, the instrument is included in level 2. If one or more of the significant inputs is
not based on observable market data, the instrument is included in Level 3.
Specific valuation techniques used to value financial instruments include:
• Quoted market prices or dealer quotes for similar instruments;
• The fair value of interest rate swaps is calculated as the present value of the estimated future cash flows based on observable yield
curves;
• The fair value of forward foreign exchange contracts is determined using forward exchange rates at the balance sheet date, with
the resulting value discounted back to present value;
• Other techniques, such as discounted cash flow analysis, are used to determine fair value for the remaining financial instruments.
• Level 3: inputs that are unobservable. This category includes all instruments for which the valuation technique includes inputs not
based on observable data and the unobservable inputs have a significant effect on the instrument’s valuation. This category includes
instruments that are valued based on quoted prices for similar instruments for which significant unobservable adjustments or assumptions
are required to reflect differences between the instruments.
Valuation techniques include net present value and discounted cashflow models, comparison with similar instruments for which market
observable prices exist, Black-Scholes and polynomial option pricing models and other valuation models. Assumptions and inputs used
in valuation techniques include risk-free and benchmark interest rates, credit spreads and other premia used in estimating discount rate,
bond and equity prices, foreign currency exchange rates, equity and equity index prices and expected price volatilities and
correlations.
The objective of valuation techniques is to arrive at a fair value measurement that reflects the price that would be received to sell the
asset or paid to transfer the liability in an orderly transaction between market participants at the measurement date.
The Group uses widely recognized valuation models for determining the fair value of common and more simple financial instruments,
such as interest rate and currency swaps that use only observable market data and require little management judgment and estimation.
Observable prices or model inputs are usually available in the market for listed debt and equity securities, exchange-traded derivatives
and simple over-the-counter derivatives such as interest rate swaps. Availability of observable market prices and model inputs reduces
the need for management judgment and estimation and also reduces the uncertainty associated with determining fair values.
Availability of observable market prices and inputs varies depending on the products and markets and is prone to changes based on
specific events and general conditions in the financial markets. The Group’s valuation methodology for securities uses a discounted
cash flow methodology and dividend discount methodology. The methodologies are often used by market participants to price similar
securities.
Page 91 of 155 Consolidated and Separate Financial Statements for the period ended 30 June, 2019

United Bank for Africa Plc
Notes to the financial statements
6.2 Valuation framework
The Group has an established control framework with respect to the measurement of fair values. This framework includes an Investor
Relations and Portfolio Investments Management Unit which is independent of front office management and reports to the Group Chief
Financial Officer, and which has overall responsibility for valuations. There is also the Risk Measurement unit responsible for independent
independently verifying the results of third party valuation. Specific controls include:
For more complex instruments, the Group uses proprietary valuation models, which are usually developed from recognized valuation
models. Some or all of the significant inputs into these models may not be observable in the market, and are derived from market prices
or rates or are estimated based on assumptions. Valuation models that employ significant unobservable inputs require a higher degree
of management judgment and estimation in the determination of fair value. Management judgment and estimation are usually
required for selection of the appropriate valuation model to be used, determination of expected future cash flows on the financial
instrument being valued, determination of the probability of counterparty default and prepayments and selection of appropriate
discount rates.
Fair value estimates obtained from models are adjusted for any other factors such as liquidity risk or model uncertainties, to the extent
that the Group believes that a third party market participant would take them into account in pricing a transaction. Fair values reflect
the credit risk of the instrument and include adjustments to take account of the credit risk of the Group entity and the counterparty
where appropriate. For measuring derivatives that might change classification from being an asset to a liability or vice versa such as
interest rate swaps, fair values take into account both credit valuation adjustment (CVA) and debit valuation adjustment (DVA) when
market participants take this into consideration in pricing the derivatives.
Model inputs and values are calibrated against historical data and published forecasts and where possible, against current or recent
observed transactions in different instruments and against broker quotes. This calibration process is inherently subjective and it yields
ranges of possible inputs and estimates of fair value, and management judgment is required to select the most appropriate point in the
range.
If the Group measures portfolios of financial assets and financial liabilities on the basis of net exposures to market risks, then it applies
judgment in determining appropriate portfolio-level adjustments such as bid-ask spreads and relevant risk premiums.
• Verification of observable pricing;
• Re-performance of model valuations;
• A review and approval process for new models and changes to models involving both Product Control and Group Market Risk;
• periodic calibration and back-testing of models against observed market transactions;
• Analysis and investigation of significant daily valuation movements; and
• Review of significant unobservable inputs, valuation adjustments and significant changes to the fair value measurement of level 3
instruments compared with the previous month, by a committee of senior Product Control and Group Market Risk personnel.
When third party information, such as broker quotes or pricing services, is used to measure fair value, the risk measurement unit assesses
and documents the evidence obtained from the third parties to support the conclusion that such valuations meet the requirements of
IFRS. This includes:
• Verifying that the broker or pricing service is approved by the Group for use in pricing the relevant type of financial instrument;
• Understanding how the fair value has been arrived at and the extent to which it represents actual market transactions;
• When prices for similar instruments are used to measure fair value, how these prices have been adjusted to reflect the characteristics of
the instrument subject to measurement; and
• If a number of quotes for the same financial instrument have been obtained, then how fair value has been determined using those
quotes.
Page 92 of 155 Consolidated and Separate Financial Statements for the period ended 30 June, 2019

United Bank for Africa Plc
Notes to the financial statements
5 Risk management report
6 Fair value measurement - continued
6.3 Financial instruments measured at fair value
Group:
30 June 2019
In millions of Nigerian Naira
Assets Note Level 1 Level 2 Level 3 Total
Financial assets at FVTPL 23
Government bonds 16,981 - - 16,981
Promissory Notes 53,763 53,763
Treasury bills 18,675 - - 18,675
Derivative assets measured at fair value
through profit and loss:
33(a) - 41,948 - 41,948
Investment securities at FVOCI 26
Treasury bills 678,144 - - 678,144
Bonds 141,250 - - 141,250
Equity investments - 6,007 99,014 105,021
Total assets 908,813 47,955 99,014 1,055,782
Liabilities
Financial liabilities at fair value through
profit or loss
Derivative liability 33(b) - 1,285 - 1,285
Bank:
30 June 2019
In millions of Nigerian Naira
Assets Note Level 1 Level 2 Level 3 Total
Financial assets at FVTPL 23
Government bonds 420 - - 420
Promissory Notes 53,763 53,763
Treasury bills 18,600 - - 18,600
Equities -
-
Derivative assets measured at fair value
through profit and loss:
33(a) - 41,948 - 41,948
-
Investment securities at FVOCI 26 -
Treasury bills 639,898 - - 639,898
Bonds 107,331 - - 107,331
Equity investments - 6,007 98,484 104,491
820,012 47,955 98,484 966,451
Liabilities
Financial liabilities at fair value through
profit or loss
Derivative liability 33(b) - 1,285 - 1,285
The table below analyses financial instruments measured at fair value at the end of the reporting period, by the level in the fair value
hierarchy into which the fair value measurement is categorised. The amounts are based on the values recognised in the statement of
financial position. All fair value measurements are recurring.
Page 93 of 155 Consolidated and Separate Financial Statements for the period ended 30 June, 2019

United Bank for Africa Plc
Notes to the financial statements
6 Fair value measurement - continued
6.3 Financial instruments measured at fair value
Group:
31 December 2018
In millions of Nigerian Naira
Assets Note Level 1 Level 2 Level 3 Total
Financial assets held for trading 23
Government bonds 696 - - 696
Treasury bills 18,743 - - 18,743
Derivative assets measured at fair value
through profit and loss:
33(a) - 34,784 - 34,784
Available for sale investment securities 26
Treasury bills 790,292 - - 790,292
Bonds 143,608 - - 143,608
Equity investments - 4,755 97,998 102,753
Total assets 953,339 39,539 97,998 1,090,876
Liabilities
Financial liabilities
Derivative liability 33(b) - 123 - 14
Bank:
31 December 2018
In millions of Nigerian Naira
Assets Note Level 1 Level 2 Level 3 Total
Financial assets held for trading 23
Government bonds 696 - - 696
Treasury bills 18,743 - - 18,743
Equities -
Derivative assets measured at fair value
through profit and loss:
33(a) - 34,784 - 34,784
Available for sale investment securities 26
Treasury bills 705,152 - - 705,152
Bonds 118,498 - - 118,498
Equity investments - 4,755 97,487 102,242
843,089 39,539 97,487 980,115
Liabilities
Financial liabilities
Derivative liability 33(b) - 123 - 123
Group Group Bank Bank
Jun. 2019 Dec. 2018 Jun. 2019 Dec. 2018
In millions of Nigerian Naira
Balance, beginning of year 97,998 90,530 97,487 89,870
Addition during the year - 76 - 76
2,249 6,412 2,249 6,412
Translation differences (1,234) 980 (1,252) 1,129
Balance, end of year 99,014 97,998 98,484 97,487
The following table presents the changes in level 3 instruments during the year. Level 3 instruments are all investment securities (unquoted
equities).
Gain recognised in other comprehensive income (under fair
value gain on FVOCI)
Page 94 of 155 Consolidated and Separate Financial Statements for the period ended 30 June, 2019

United Bank for Africa Plc
Notes to the financial statements
Fair value measurement (continued)
(i)
(ii) Level 2 fair value measurements
(iii) Level 3 fair value measurements - Unobservable inputs used in measuring fair value
Type of financial
instrument
Fair value
as at
30 June
2019
N'million
Fair value
as at
31
December
2018
N'million
Valuation
technique
Unobservable
input
Range of
estimates for
unobservable
inputs (30 June
2019)
Range of
estimates for
unobservable
inputs (31
December
2018)
Cost of equity 16.3% - 23.3% 9.12% - 23.9%
Terminal
growth rate
1.4%-2.0% 1.5%-3%
Cost of equity 12.0% - 29.9% 12.75% - 32.00%
Terminal
growth rate
9.3% - 22.3% 9.4% - 24.3%
Unquoted equity
securities
91,629 90,706
Income
Approach
(Discounte
d cashflow
method)
Significant increases in
cost of equity, in
isolation, would result in
lower fair values.
Significant reduction
would result in higher fair
values
The fair value of the Group's equity investment in CSCS Limited was previously categorised as level 3 in the fair value hierarchy. This
was because the shares were not listed on an exchange and there were no recent observable arm's length transactions in the
shares. In 2015 however, CSCS shares became available for over-the-counter (OTC trades). The fair value measurement was
therefore transferred from level 3 to level 2. There were no transfers from level 2 to level 3 in 2019.
These prices are a reflection of the actual fair value of the investments, as transactions consummated under the OTC trades were
arms length transactions. The Group's Level 2 derivative contracts were valued using interest rate parity method discounted for
passage of time. Inputs to the valuation models are all based on market conditions existing at the end of each reporting period.
These derivative contracts are not traded in active markets.
All valuation processes and techniques are subject to review and approval by the Finance and General Purpose Committee of
the Board of Directors. There was no change in the Group's valuation technique during the period.
The table below sets out information about significant unobservable inputs used as at 30 June 2019 in measuring financial
instruments categorised as Level 3 in the fair value hierarchy:
Relationship of
unobservable inputs to
fair value
Significant increases in
terminal growth rate, in
isolation, would result in
higher fair values.
Significant reduction
would result in lower fair
values
1,940 1,671
Income
Approach
(Dividend
discount
model)
Significant increases in
cost of equity, in
isolation, would result in
lower fair values.
Significant reduction
would result in higher fair
valuesSignificant increases in
terminal growth rate, in
isolation, would result in
higher fair values.
Significant reduction
would result in lower fair
values.
Page 95 of 155 Consolidated and Separate Financial Statements for the period ended 30 June, 2019

United Bank for Africa Plc
Notes to the financial statements
(iv) Level 3 fair value measurements - Unobservable inputs used in measuring fair value (continued)
Significant unobservable inputs are developed as follows:
Discounted cashflow
Dividend discount model
(v) Level 3 fair value measurements - Effect of unobservable inputs on fair value measurement
In millions of Nigerian Naira
Key Assumption
5%
Increase
5%
Decrease
5%
Increase 5% Decrease
Cost of Equity (6,266) 6,648 (7,217) 7,953
Terminal Growth Rate 865 (930) 1,666 (1,570)
Jun. 2019 Dec. 2018
Fair value measurement (continued)
• The Group used the Capital Asset Pricing Model to determine the cost of equities for its various unquoted equities which were fair
valued at year end.
• The risk free rate was determined using the yield on 30-year US treasury bond (for unquoted securities denominated in USD) and
longest tenored Federal Government of Nigeria bond (for unquoted securities denominated in Nigerian naira).
• Equity risk premium was determined using market returns obtained from PricewaterhouseCoopers and KPMG industry surveys.
• Beta estimates were obtained from Damodaran Online.
• The Group used the build-up approach to determine cost of equities for its various unquoted equities which were fair valued
using dividend discount model at year end.
• The risk free rate was determined using the yield on the longest tenored sovereign bonds.
• The dividend growth rate was determined using the historical five years weighted average growth rate of dividends paid by the
respective entities
• Equity risk premium were obtained from Damodaran Online (with specific focus on emerging markets data), adjusted for size
premium.
The Group believes that its estimates of fair values are appropriate. However, the use of different methodologies or assumptions
could lead to different measurements of fair value. For fair value measurements in Level 3, changing the cost of equity or terminal
growth rate by a reasonable possible value, in isolation, would have the following effects on other comprehensive income for the
period:
Effect on other comprehensive income (OCI)
Page 96 of 155 Consolidated and Separate Financial Statements for the period ended 30 June, 2019

United Bank for Africa Plc
Notes to the financial statements
Fair value measurement - continued
6.4 Financial instruments not measured at fair value
Group Level 1 Level 2 Level 3 Total fair
value
Carrying
amount
In millions of Nigerian Naira
30 June 2019
Assets
Cash and bank balances - 1,416,170 - 1,416,170 1,416,170
Loans and advances to banks - - 82,176 82,176 81,257
Loans and advances to customers
-Individual
Term loans - - 84,181 84,181 81,905
Overdrafts - - 17,470 17,470 15,668
-Corporate
Term loans - - 1,293,107 1,293,107 1,280,890
Overdrafts - - 342,212 342,212 332,505
Others - 4,364 4,364 4,317
Investment Securities - Amortised cost
Treasury bills 405,519 - - 405,519 387,110
Bonds 383,155 - - 383,155 229,759
Other assets - 48,382 48,382 48,382
Liabilities
Deposits from banks - 171,191 171,191 171,191
Deposits from customers - - 3,557,357 3,557,357 3,510,237
Subordinated liabilities - 81,470 - 81,470 29,976
Other liabilities - 132,257 132,257 132,257
Borrowings - - 443,357 443,357 689,637
Group Level 1 Level 2 Level 3 Total fair
value
Carrying
amount
In millions of Nigerian Naira
31 December 2018
Assets
Cash and bank balances - 1,220,596 - 1,220,596 1,220,596
Loans and advances to banks - - 15,976 15,976 15,797
Loans and advances to customers
-Individual
Term loans - - 84,181 84,181 81,905
Overdrafts - - 17,470 17,470 15,668
-Corporate
Term loans - - 1,293,107 1,293,107 1,280,890
Overdrafts - - 342,212 342,212 332,505
Others - 4,364 4,364 4,317
Investment Securities - Held to maturity
Treasury bills 321,131 - - 321,131 321,131
Bonds 195,149 - - 195,149 279,658
Other assets - 43,583 43,583 43,583
Liabilities
Deposits from banks - 174,836 174,836 174,836
Deposits from customers - - 3,392,507 3,392,507 3,349,120
Subordinated liabilities - 30,969 - 30,969 29,859
Other liabilities - 101,864 101,864 101,864
Borrowings - - 802,505 802,505 683,532
The table below sets out the fair values of financial instruments not carried at fair value and analyses them by the level
in the fair value hierarchy into which each fair value measurement is categorised.
Page 97 of 155 Consolidated and Separate Financial Statements for the period ended 30 June, 2019
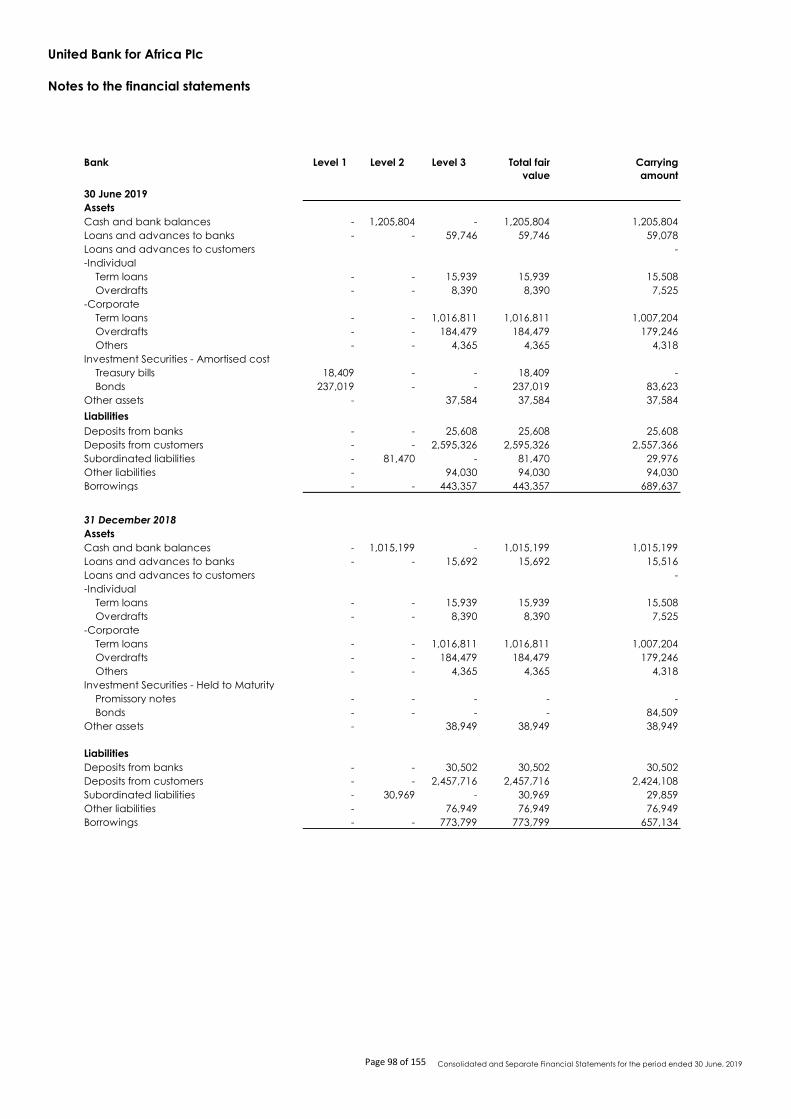
United Bank for Africa Plc
Notes to the financial statements
Bank Level 1 Level 2 Level 3 Total fair
value
Carrying
amount
30 June 2019
Assets
Cash and bank balances - 1,205,804 - 1,205,804 1,205,804
Loans and advances to banks - - 59,746 59,746 59,078
Loans and advances to customers -
-Individual
Term loans - - 15,939 15,939 15,508
Overdrafts - - 8,390 8,390 7,525
-Corporate
Term loans - - 1,016,811 1,016,811 1,007,204
Overdrafts - - 184,479 184,479 179,246
Others - - 4,365 4,365 4,318
Investment Securities - Amortised cost
Treasury bills 18,409 - - 18,409 -
Bonds 237,019 - - 237,019 83,623
Other assets - 37,584 37,584 37,584
Liabilities
Deposits from banks - - 25,608 25,608 25,608
Deposits from customers - - 2,595,326 2,595,326 2,557,366
Subordinated liabilities - 81,470 - 81,470 29,976
Other liabilities - 94,030 94,030 94,030
Borrowings - - 443,357 443,357 689,637
31 December 2018
Assets
Cash and bank balances - 1,015,199 - 1,015,199 1,015,199
Loans and advances to banks - - 15,692 15,692 15,516
Loans and advances to customers -
-Individual
Term loans - - 15,939 15,939 15,508
Overdrafts - - 8,390 8,390 7,525
-Corporate
Term loans - - 1,016,811 1,016,811 1,007,204
Overdrafts - - 184,479 184,479 179,246
Others - - 4,365 4,365 4,318
Investment Securities - Held to Maturity
Promissory notes - - - - -
Bonds - - - - 84,509
Other assets - 38,949 38,949 38,949
Liabilities
Deposits from banks - - 30,502 30,502 30,502
Deposits from customers - - 2,457,716 2,457,716 2,424,108
Subordinated liabilities - 30,969 - 30,969 29,859
Other liabilities - 76,949 76,949 76,949
Borrowings - - 773,799 773,799 657,134
Page 98 of 155 Consolidated and Separate Financial Statements for the period ended 30 June, 2019

United Bank for Africa Plc
Notes to the financial statements
i) Cash and bank balances
ii) Loans and advances
iii) Investment securities
iv) Other assets
vi) Other liabilities
7 Offsetting of financial instruments
Group
30 June 2019
In millions of Nigerian Naira Gross
amounts
Gross
amounts
offset
Net amounts
presented
Financial assets
- Electronic payments receivable (note 27) (a) 45,310 (30,394) 14,916
Loans and advances are net of charges for impairment. To improve the accuracy of the valuation estimate for loans,
homogenous loans are grouped into portfolios with similar characteristics. The estimated fair value of loans and
advances represents the discounted amount of estimated future cash flows expected to be received. Expected cash
flows are discounted at current market rates to determine fair value.
Below are the methodologies and assumptions used to determine fair values for the above financial instruments which
are not recorded and measured at fair value in the Group’s financial statements. These fair values were calculated for
disclosure purposes only.
The carrying amount of cash and cash equivalents is a reasonable approximation of fair value.
The following table presents the recognized financial instruments that are offset, or subject to enforceable master
netting arrangements or other similar agreements but not offset, as at the reporting date, and shows in the "Net"
column what the impact would be on the Group's statement of financial position if all set off rights were exercised.
The fair value for investment securities is based on market prices from financial market dealer price quotations. Where
this information is not available, fair value is estimated using quoted market prices for securities with similar credit,
maturity and yield characteristics.
The bulk of these financial assets have short (less than 3months) maturities and their amounts are a reasonable
approximation of fair value.
v) Deposits from banks and customers
The estimated fair value of deposits with no stated maturity, which includes non-interest bearing deposits, is the amount
repayable on demand. The estimated fair value of fixed interest-bearing deposits not quoted in an active market is
based on discounted cash flows using interest rates for new debts with similar remaining maturity.
The carrying amount of financial liabilities in other liabilities is a reasonable approximation of fair value.
vii) Interest bearing loans and borrowings
The estimated fair value of fixed interest-bearing borrowings not quoted in an active market is based on discounted
cash flows using the contractual interest rates for these debts over their remaining maturity.
viii) Subordinated liabilities
The fair value of subordinated liabilities is based on market prices from financial market dealer price quotations.
Financial assets and liabilities are offset and the net amount reported in the statement of financial position where the
Group currently has a legally enforceable right to set-off the recognized amounts and there is an intention to settle on a
net basis or realize the asset and settle the liability simultaneously. In the normal course of business, the Group may enter
into various master netting agreements or other similar arrangements that do not meet the criteria for offsetting in the
statement of financial position but still allow for the related amounts to be set off in certain circumstances.
Amounts offset
Page 99 of 155 Consolidated and Separate Financial Statements for the period ended 30 June, 2019

United Bank for Africa Plc
Notes to the financial statements
Financial liabilities
- Creditors and payables (note 36) (a) 127,448 (30,394) 97,054
Group
31 December 2018
In millions of Nigerian Naira Gross
amounts
Gross
amounts
offset
Net amounts
presented
Financial assets
- Electronic payments receivable (note 27) (a) 86,060 (66,059) 20,001
Financial liabilities
- Creditors (note 36) (a) 127,821 (66,059) 61,762
Bank
30 June 2019
In millions of Nigerian Naira Gross
amounts
Gross
amounts
offset
Net amounts
presented
Financial assets
- Electronic payments receivable (note 27) (a) 42,823 (30,394) 12,429
Financial liabilities
- Creditors (note 36) (a) 94,160 (30,394) 63,766
Bank
31 December 2018
In millions of Nigerian Naira Gross
amounts
Gross
amounts
offset
Net amounts
presented
Financial assets
- Electronic payments receivable (note 27) (a) 82,927 (66,059) 16,868
Financial liabilities
- Creditors (note 36) (a) 107,794 (66,059) 41,735
(a)
Amounts offset
Standard terms of electronic banking and similar payment transactions allow for net settlement of payments in the
normal course of business.
Amounts offset
Amounts offset
Page 100 of 155 Consolidated and Separate Financial Statements for the period ended 30 June, 2019

United Bank for Africa Plc
Notes to the financial statements
8
(a)
5% decrease 5% increase 15% decrease 15% increase
In millions of Nigerian Naira
Derivative assets (719) 710 (5,517) 5,517
Derivative liabilities (261) 258 (193) 193
(i) Measurement of the expected credit loss allowance
Critical accounting estimates and judgments
The preparation of the Group’s financial statements requires management to make judgements, estimates and assumptions
that affect the reported amount of revenues, expenses, assets and liabilities, and the accompanying disclosures, as well as the
disclosure of contingent liabilities. Uncertainty about these assumptions and estimates could result in outcomes that require a
material adjustment to the carrying amount of assets or liabilities affected in future periods. In the process of applying the
Group’s accounting policies, management has made the following judgements and assumptions concerning the future and
other key sources of estimation uncertainty at the reporting date, that have a significant risk of causing a material adjustment
to the carrying amounts of assets and liabilities. Existing circumstances and assumptions about future developments may
change due to circumstances beyond the Group’s control and are reflected in the assumptions if and when they occur. Items
with the most significant effect on the amounts recognised in the financial statements with substantial management judgement
and/or estimates are collated below.
These disclosures supplement the commentary on financial risk management (see note 4).
Key sources of estimation uncertainty
The fair value of the Group's derivatives is determined by using valuation techniques. Inputs to the valuation models are all
based on market conditions existing at the end of each reporting period. The Group has used interest rate parity method
discounted for passage of time in the valuation of its foreign exchange derivative contracts. These derivative contracts are not
traded in active markets.
The table below shows the fair value of the Group's derivatives if there is 5% change in interest rates or a 15% change in foreign
currency exchange rates.
The measurement of the expected credit loss(ECL) allowance for financial assets measured at amortised cost and FVOCI is an
area that requires the use of complex models and significant assumptions about future economic conditions and credit
behaviour (e.g. the likelihood of customers defaulting and the resulting losses). Details of the inputs, assumptions and estimation
methodologies used in measuring ECL are described in note 3.27.
A number of significant judgements are also required in applying the accounting requirements for measuring ECL, such as:
- Determining criteria for significant increase in credit risk;
- Choosing appropriate models and assumptions for the measurement of ECL;
- Establishing the number and relative weightings of forward-looking scenarios for each type of product/market and
associated ECL; and
- Establishing groups of financial assets for the purposes of measuring ECL.
Detailed information about the judgements and estimates made by the Group in the above areas is set out in note 3.27.
(ii) Determining fair values
The determination of fair value for financial assets and liabilities for which there is no observable market price requires the use
of techniques as described in accounting policy 3.11. Further disclosures on the Group's valuation methodology have been
made on note 6.1. For financial instruments that trade infrequently and have little price transparency, fair value is less objective,
and requires varying degrees of judgment depending on liquidity, concentration, uncertainty of market factors, pricing
assumptions and other risks affecting the specific instrument.
(iii) Deferred tax assets
Deferred tax assets are recognised for deductible temporary differences, unused tax losses and unused tax credits to the extent
that it is probable that taxable profit will be available against which the losses can be utilised. Management judgement is
required to determine the amount of deferred tax assets that can be recognised, based on the likely timing and level of future
taxable profits, together with future tax planning strategies. In determining the timing and level of future taxable profits
together with future tax planning strategies, the Group assessed the probability of expected future taxable profits based on
expected revenues for the next five years. Details of the Group's recognised and unrecognised deferred tax assets and
liabilities are as disclosed in note 32.
(iv) Valuation of derivative contracts
Interest rates Exchange rates
Page 101 of 155 Consolidated and Separate Financial Statements for the period ended 30 June, 2019

United Bank for Africa Plc
Notes to the financial statements
(b)
(iii) Impairment testing for cash-generating units containing goodwill
Critical accounting judgments in applying the Group’s accounting policies
Critical accounting judgments made in applying the Group’s accounting policies include:
(i) Fair value of equity instruments
The fair value of financial instruments is the price that would be received to sell an asset or paid to transfer a liability in an
orderly transaction in the principal (or most advantageous) market at the measurement date under current market conditions
(i.e., an exit price) regardless of whether that price is directly observable or estimated using another valuation technique. When
the fair values of financial assets and financial liabilities recorded in the statement of financial position cannot be derived from
active markets, they are determined using a variety of valuation techniques that include the use of valuation models. The
inputs to these models are taken from observable markets where possible, but where this is not feasible, estimation is required in
establishing fair values. Judgements and estimates include considerations of liquidity and model inputs related to items such as
credit risk (both own and counterparty), funding value adjustments, correlation and volatility. For further details about
determination of fair value please see the Group’s accounting policy on valuation of financial instruments in note 6.
(ii) Allowance for credit losses
In estimating credit losses, the Group considers the credit worthiness and financial capacity of the obligor, the probability that
an obligor or counterparty will default over a given period (probability of default -PD) , the portion of the loan expected to be
irrecoverable at the time of loan default (loss given default - LGD) and Exposure at Default (EAD). The table below shows the
sensitivities of the impairment loss provision for 1% increase or decrease in the LGD and PD.
On an annual basis, the Group carries out impairment assessments of its cash generating units containing goodwill. The
recoverable amounts of the cash-generating units (CGU) are determined based on value-in-use calculations which require the
use of estimates including discount rates and terminal growth rates. Management's estimates of the recoverable amounts of
these CGU's is sensitive to these estimates. The key assumptions underlying the recoverable amounts as well as sensitivity
analysis of these key assumptions are disclosed in note 31.
(iv) Impairment of equity insturments measured at FVOCI
The Group determines that equity investments measured at FVOCI are impaired when there has been a significant or
prolonged decline in the fair value below cost. The determination of what is significant or prolonged requires judgement. In
making this judgement, the Group evaluates among other factors, the volatility in share price. In addition, objective evidence
of impairment may be deterioration in the financial health of the investee, industry and sector performance, changes in
technology, and operational and financial cashflows. The sensitivity analysis of level 3 equity instruments and its impact on
other comprehensive income are shown in note 6.3(v).
(v) Determination of exchange rate used for translation
The Group translates and records its foreign currency transactions and balances based on the exchange rate at which the
future cash flows represented by the transactions or balances could have been settled, if those cash flows had occurred at the
reporting date. USD transactions and balances have been translated using rates quoted on on Importers and Exporters (I&E)
window of FMDQ whilst rates used for other countries were sourced from the Bloomberg.
Page 102 of 155 Consolidated and Separate Financial Statements for the period ended 30 June, 2019

United Bank for Africa Plc
Notes to the financial statements
9 Operating segments
Geographical segments
Business segments
(a) Geographical segments
(i) 30 June 2019
In millions of Nigerian Naira Nigeria
Rest of
Africa
Rest of the
World Eliminations Total
External revenues 211,285 81,241 11,566 (10,402) 293,690
Derived from other geographic segments - - - - -
Total revenue 211,285 81,241 11,566 (10,402) 293,690
Profit before tax 42,853 26,496 5,985 (5,060) 70,274 -
Interest income 150,022 47,471 10,746 (3,354) 204,885
Interest expenses (80,657) (15,369) (2,119) 3,383 (94,762)
Share of loss in equity-accounted investee - 342 - - 342
Impairment loss recognised in income statement (3,071) (50) - 1 (3,120)
Income tax expenses (7,164) (4,553) - (1,818) (13,535)
Profit for the period 35,689 21,943 5,985 (6,878) 56,739
30 June 2019
Total segment assets* 3,741,145 1,509,555 155,311 (303,888) 5,102,123
Total segment liabilities 3,341,389 1,293,123 133,387 (208,234) 4,559,665
The revenue from external parties reported to the Chief Operating Decision Maker is measured in a manner consistent with
that in the income statement.
Segment information is presented in respect of the Group’s geographic segments which represents the primary segment
reporting format and is based on the Group’s management and reporting structure. The Chief Operating Decision Maker
(Board of Directors), reviews the Group's performance along these business segments and resources are allocated
accordingly.
The Group operates in the following geographical regions:
· Nigeria: This comprises UBA Plc (excluding the branch in New York), UBA Pensions Custodian Limited and FX Mart Limited.
· Rest of Africa: This comprises all subsidiaries in Africa, excluding Nigeria. The African subsidiaries have been aggregated
into one reportable segment as they are deemed to have similar economic characteristics.
· Rest of the world: This comprises UBA UK Limited and UBA New York branch. Although this part of the business is not large
enough to be presented as a separate reporting segment, it has been included here as it is seen as a potential growth
segment which is expected to materially contribute to group revenue in the future. The entities within this reporting segment
have been aggregated into one reportable segment as they have similar economic characteristics.
The Group operates in the following business segments:
Corporate Banking - This business segment provides a broad range of financial solutions to multinationals, regional
companies, state-owned companies, non-governmental organisations, international and multinational organisations and
financial institutions.
Retail/ Commercial banking – This business segment has presence in all major cities in Nigeria and in nineteen other
countries across Africa where the Group has operations . It provides commercial banking products and services to the
middle and retail segments of the market.
Treasury and Financial Markets – This segment provides innovative financing and risk management solutions and advisory
services to the Group’s corporate and institutional customers. The segment is also responsible for formulation and
implementation of financial market products for the Group’s customers.
No single external customer or group amounts to 10% or more of the Group's revenues.
Inter-segment transactions, balances, income and expenses on transactions between group companies are eliminated.
Profits and losses resulting from inter-segment transactions that are recognised in assets are also eliminated. Transfer prices
between operating segments are based on the Group's internal pricing framework.
Page 103 of 155 Consolidated and Separate Financial Statements for the period ended 30 June, 2019

United Bank for Africa Plc
Notes to the financial statements
*Includes:
- 3,889 - - 3,889
Expenditure for reportable segment:
Depreciation 4,340 1,501 174 - 6,015
Amortisation 708 68 62 - 838
(ii) 30 June 2018
In millions of Nigerian Naira Nigeria
Rest of
Africa
Rest of the
World Eliminations Total
External revenues 178,662 78,233 6,620 (5,597) 257,918
Derived from other geographic segments - - - - -
Total revenue 178,662 78,233 6,620 (5,597) 257,918
Profit before tax 34,445 21,512 2,200 (17) 58,140
Interest income 124,623 50,660 13,757 (1,746) 187,294
Interest expenses (60,374) (16,079) (1,563) 1,798 (76,218)
- 124 - - 124
Impairment loss recognised in income statement (1,928) (5,075) 266 5 (6,732)
Income tax expenses (13,201) (1,147) - - (14,348)
Profit for the period 21,244 20,365 2,200 (17) 43,792
31 December 2018
Total segment assets** 3,651,853 1,528,634 130,699 (441,448) 4,869,738
Total segment liabilities 3,286,846 1,323,847 108,754 (352,317) 4,367,130
**Includes:
- 4,610 - - 4,610
Expenditure for reportable segment:
Depreciation 3,309 1,425 149 - 4,883
Amortisation 644 81 51 - 776
Investments in associate and accounted for by using
the equity method
Share of loss in equity-accounted investee
Investments in associate and joint venture accounted
for by using the equity method
Page 104 of 155 Consolidated and Separate Financial Statements for the period ended 30 June, 2019

United Bank for Africa Plc
Notes to the financial statements
9 Operating segments
(b) Business reporting
(i) 30 June 2019
In millions of Nigerian Naira Corporate Retail and
commercial
Treasury and
financial
markets
Total
Revenue:
Derived from external customers 100,068 103,206 90,416 293,690
Derived from other business segments (11,856) 53,723 (41,868) -
Total revenue 88,212 156,929 48,548 293,690
Interest expenses (29,786) (40,649) (24,327) (94,762)
Fee and commission expense (40) (16,249) (0) (16,289)
Net impairment loss on financial assets 556 (3,378) (299) (3,120)
Operating expenses (16,721) (73,158) (10,896) (100,775)
Depreciation and amortisation (60) (8,749) (4) (8,812)
Share of profit of equity-accounted investee 5 310 27 342
Profit before income tax 42,166 15,058 13,050 70,274
Taxation (8,857) (1,897) (2,781) (13,535)
Profit for the period 33,309 13,161 10,269 56,739
30 June 2019
Loans and advances 1,161,874 411,419 195,471 1,768,763
Deposits from customers and banks 828,394 2,324,074 528,960 3,681,428
Total segment assets 3,288,731 1,260,104 553,288 5,102,123
Total segment liabilities 1,034,362 2,864,826 660,478 4,559,665
(ii) 30 June 2018
In millions of Nigerian Naira Corporate Retail and
commercial
Treasury and
financial
markets
Total
Revenue:
Derived from external customers 90,687 90,884 76,347 257,918
Derived from other business segments (15,622) 61,443 (45,821) -
Total revenue 75,065 152,327 30,526 257,918
Interest expenses (32,990) (42,843) (385) (76,218)
Fee and commission expense (28) (13,218) (2) (13,248)
- Net impairment loss on financial assets (4,743) (1,977) (12) (6,732)
Operating expenses (15,296) (73,043) (9,706) (98,045)
Depreciation and amortisation (56) (5,603) - (5,659)
Share of loss of equity-accounted investee 90 34 - 124
Profit before income tax 22,042 15,677 20,421 58,140
Taxation (5,382) (3,979) (4,987) (14,348)
Profit for the period 16,660 11,698 15,434 43,792
31 December 2018
Loans and advances 1,135,826 397,674 197,583 1,731,082
Deposits from customers and banks 842,308 2,258,976 422,672 3,523,956
Total segment assets 3,200,002 1,113,080 556,656 4,869,738
Total segment liabilities 1,049,803 2,790,533 526,794 4,367,130
The following table presents income and profit and certain asset and liability information for the Group’s business segments:
Page 105 of 155 Consolidated and Separate Financial Statements for the period ended 30 June, 2019

United Bank for Africa Plc
Notes to the financial statements
Group Group Bank Bank
Jun. 2019 Jun. 2018 Jun. 2019 Jun. 2018
10 Interest income
In millions of Nigerian Naira
Interest income on amortised cost and FVOCI securities
Cash and bank balances 8,272 4,669 8,861 3,709
Loans and advances to banks 1,225 1,567 599 475
Loans and advances to customers
- To individuals
Term loans 2,846 2,654 1,068 1,659
Overdrafts 1,211 1,101 896 722
- To corporates
Term loans 82,982 71,116 69,010 55,594
Overdrafts 16,283 24,820 11,850 18,183
Others 321 123 321 123
Investment securities
- Treasury bills 63,103 43,729 46,764 27,303
- Bonds 24,621 35,181 11,637 18,035
- Promissory notes 3,917 - 3,917 -
204,781 184,960 154,923 125,803
Interest income on financial assets at fair value through profit or loss
- Bonds 104 2,334 104 2,334
204,885 187,294 155,027 128,137
11 Interest expense Group Group Bank Bank
In millions of Nigerian Naira Jun. 2019 Jun. 2018 Jun. 2019 Jun. 2018
Deposits from banks 7,122 4,183 4,731 1,785
Deposits from customers 66,629 48,460 56,291 36,040
Borrowings 18,445 18,420 18,113 18,189
Subordinated liabilities 2,566 5,155 2,567 5,155
94,762 76,218 81,702 61,169
12 Allowance for credit losses on financial assets Group Group Bank Bank
In millions of Nigerian Naira Jun. 2019 Jun. 2018 Jun. 2019 Jun. 2018
Allowance for credit losses on loans and advances to customers:
- allowance for credit losses (Note 25) 2,000 6,989 167 1,187
Allowance for credit losses on loans and advances to banks:
- allowance for credit losses ((Note 24) 451 76 452 49
Allowance for credit losses on off-balance sheet items 1,764 1,764
Allowance for credit losses on investment securities 214 - 214 -
Write-off on loans and receivables * 553 1,308 461 785
Recoveries on loans written-off (2,232) (1,842) (78) (373)
Impairment loss on other assets (Note 27(a)) 370 201 91 -
3,120 6,732 3,071 1,648
13 Fees and commission income Group Group Bank Bank
In millions of Nigerian Naira Jun. 2019 Jun. 2018 Jun. 2019 Jun. 2018
Credit-related fees and commissions 4,553 5,503 3,049 3,505
Commission on turnover 616 517 - -
Account maintenance fee 3,388 2,913 3,388 2,913
Electronic banking income 16,862 12,146 11,698 8,612
Funds transfer fee 5,040 3,303 168 343
Trade transactions income 7,520 10,214 3,676 6,890
Remittance fee 4,183 2,468 3,269 1,816
Commissions on transactional services 7,709 5,981 3,305 2,110
Pension funds custody fees 2,473 2,800 - -
Internal transfer pricing charges - - 2,034 2,156
52,344 45,845 30,587 28,345
*Loans with a contractual amount of N3.41bn written off during the period are still subject to enforcement activity/recovery.
Page 106 of 155 Consolidated and Separate Financial Statements for the period ended 30 June, 2019

United Bank for Africa Plc
Notes to the financial statements
14 Fees and commission expense Group Group Bank Bank
In millions of Nigerian Naira Jun. 2019 Jun. 2018 Jun. 2019 Jun. 2018
E-Banking expense 13,192 10,709 10,757 7,818
Trade related expenses 763 2,423 710 2,363
Funds transfer expense 2,334 116 80 37
16,289 13,248 11,547 10,218
15 Net trading and foreign exchange income Group Group Bank Bank
Jun. 2019 Jun. 2018 Jun. 2019 Jun. 2018
In millions of Nigerian Naira
Fixed income securities1 11,230 3,857 11,108 3,653
Foreign exchange trading income 14,426 6,334 3,449 6,047
Foreign currency revaluation gain/(loss) 1,111 (2,346) 10 (4,410)
Net Fair value gain on derivatives (see note 33 (c)) 5,979 12,611 5,979 12,926
32,746 20,456 20,546 18,216
16 Other operating income Group Group Bank Bank
In millions of Nigerian Naira Jun. 2019 Jun. 2018 Jun. 2019 Jun. 2018
Dividend income 3,105 2,956 7,731 4,628
Rental income 212 215 209 191
Income on cash handling and other income 1 398 1,152 295 607
Gain/(loss) on disposal of property and equipment - - - 3,715 4,323 8,235 5,426
Mart Ltd.
17 Employee benefit expenses Group Group Bank Bank
Jun. 2019 Jun. 2018 Jun. 2019 Jun. 2018
In millions of Nigerian Naira
Wages and salaries 35,867 33,984 20,160 19,812
Defined contribution plans 1,311 1,230 615 637
37,178 35,214 20,775 20,449
Foreign exchange income comprises trading income on foreign currencies as well as gains and losses from revaluation of trading
position.
1This includes gains and losses arising from sales and purchase of fair value through profit and loss securities, as well as changes in
their fair value.
1Included in other income was ₦175.6m excess cash received over the cost of investment ,resulting from a liquidation of FX
Page 107 of 155 Consolidated and Separate Financial Statements for the period ended 30 June, 2019

United Bank for Africa Plc
Notes to the financial statements
18
Depreciation and amortisation Group Group Bank Bank
In millions of Nigerian Naira Jun. 2019 Jun. 2018 Jun. 2019 Jun. 2018
Depreciation of property and equipment (note 30) 6,015 4,883 4,451 3,401
Amortisation of intangible assets (note 31) 838 776 693 625
Right-of-use assets amortisation (note 3.3) 1,959 786
8,812 5,659 5,930 4,026
Group Group Bank Bank
19 Other operating expenses Jun. 2019 Jun. 2018 Jun. 2019 Jun. 2018
In millions of Nigerian Naira
Directors' fees 18 13 18 13
Banking sector resolution cost 19,992 14,659 19,991 14,659
Deposit insurance premium 4,975 3,819 4,734 3,593
Non-deposit insurance costs 818 1,061 307 536
Auditors' remuneration 275 271 166 150
Occupancy and premises maintenance costs 1 4,331 6,788 537 2,244
Business travels 2,757 4,110 2,095 3,174
Advertising, promotions and branding 3,092 3,796 2,381 3,336
Contract services 4,811 6,575 3,438 5,212
Communication 4,568 2,723 3,085 1,360
IT support and related expenses 319 600 141 462
Printing, stationery and subscriptions 2,299 3,422 1,766 2,966
Security and cash handling expenses 1,933 2,887 1,259 1,088
Fuel, repairs and maintenance 10,685 9,392 5,616 7,335
Bank charges 1,280 336 965 218
Donations 40 522 32 342
Training and human capital development 1,315 558 1,121 451
Penalties 9 2 8 2
Loan recovery expenses 66 1,297 66 1,297
Loss on disposal of property and equipment 14 - 14 -
63,597 62,831 47,740 48,438
20 Taxation Group Group Bank Bank
Recognised in the statement of comprehensive income Jun. 2019 Jun. 2018 Jun. 2019 Jun. 2018
In millions of Nigerian Naira
(a) Current tax expense
Current period 12,105 13,226 7,164 7,213
(b) Deferred tax expense/(credit)
Origination and reversal of temporary differences (Note 32) 1,430 1,122 - 5,316
Total income tax expense/(credit) 13,535 14,348 7,164 12,529
1Included in occupancy and premises maintenance costs for H1-2018 was operating lease expense of ₦990m for Bank and
₦1.7Bn for the Group. These costs were separately disclosed as part of depreciation and amortisation costs in H1-2019.
Page 108 of 155 Consolidated and Separate Financial Statements for the period ended 30 June, 2019

United Bank for Africa Plc
Notes to the financial statements
(c) Current tax liabilities Group Group Bank Bank
Jun. 2019 Dec. 2018 Jun. 2019 Dec. 2018
Balance, beginning of period 8,892 7,668 706 1,108
Tax paid (14,680) (21,822) (1,577) (9,389)
Income tax charge 12,105 23,046 7,164 8,987
Balance, end of period 6,317 8,892 6,293 706
(d) Reconciliation of effective tax rate
Group Group Bank Bank
In millions of Nigerian Naira Jun. 2019 Jun. 2018 Jun. 2019 Jun. 2018
Domestic corporation tax rate 30% 30% 30% 30%
Profit before income tax 70,274 58,140 43,630 34,176
Income tax using the domestic corporation tax rate 21,082 17,442 13,089 10,253
Tax effects of :
Withholding tax on dividend - 323 - 323
Information Technology Levy 468 778 468 341
Education tax - 41 - -
Minimum tax/excess dividend tax adjustment 2,048 5,377 2,210 5,377
Prior year under Provision of current tax 4,486 4,486
Interim dividend tax adjustment - current year
Effect of permanent differences - income not subject to tax (20,190) (9,617) (19,084) (3,769)
Effect of permanent differences - expenses not deductible 11 4 11 4
Effect of temporary differences not recognised in Deferred Tax (9,741) (9,387)
Losses/(Relief) not recognised in Deferred Tax 15,371 15,371
Total income tax expense in comprehensive income 13,535 14,348 7,164 12,529
Effective tax rate 19% 25% 16% 37%
The tax on the Group’s profit before tax differs from the theoretical amount that would arise using the tax rate applicable to profits
of the Bank (Parent). The reconciliation of amount reported as tax expense in the statement of comprehensive income to the
income tax using the domestic corporation tax rate is presented below:
Income tax payable for parent is based on the minimum tax provisions in the Nigerian tax law, which is applicable to companies
that do not have taxable profits.
Page 109 of 155 Consolidated and Separate Financial Statements for the period ended 30 June, 2019

United Bank for Africa Plc
Notes to the financial statements
21 Earnings per share
Group Group Bank Bank
Jun. 2019 Jun. 2018 Jun. 2019 Jun. 2018
In millions of Nigerian Naira
Profit from continuing operations attributable to owners of the parent 56,739 43,792 36,466 21,647
Profit from discontinued operations attributable to owners of the parent - - - -
Profit attributable to equity holders of the parent 55,295 42,192 36,466 21,647
Weighted average number of ordinary shares outstanding (in millions) 34,199 34,199 34,199 34,199
From continuing operations 1.62 1.23 1.07 0.63
From discontinued operations - - - -
Basic and diluted earnings per share
(Naira) 1.62 1.23 1.07 0.63
22 Cash and bank balances Group Group Bank Bank
In millions of Nigerian Naira Jun. 2019 Dec. 2018 Jun. 2019 Dec. 2018
Cash 86,314 101,609 59,720 74,979
Current balances with banks 349,840 344,123 250,820 309,921
Unrestricted balances with central banks 324,125 202,714 184,189 27,642
Money market placements 85,810 8,467 144,456 51,089
Restricted balances with central banks (note (i) below) 570,081 563,683 566,619 551,568
1,416,170 1,220,596 1,205,804 1,015,199
(i)
In millions of Nigerian Naira
Mandatory reserve deposits with central banks (note (a) below) 515,363 508,965 511,901 496,850
Special Intervention Reserve (note (b) below) 54,718 54,718 54,718 54,718
570,081 563,683 566,619 551,568
(a)
(b)
(ii)
Group Group Bank Bank
Jun. 2019 Dec. 2018 Jun. 2019 Dec. 2018
Cash and current balances with banks 436,154 445,732 310,540 384,900
Unrestricted balances with central banks 324,125 202,714 184,189 27,642
Money market placements (less than 90 days) 5,122 8,467 14,509 32,189
Financial assets at FVTPL (less than 90 days) 9,312 5,332 9,312 5,332
Cash and cash equivalents 774,713 662,245 518,550 450,063
23 Financial assets at fair value through profit or loss Group Group Bank Bank
In millions of Nigerian Naira Jun. 2019 Dec. 2018 Jun. 2019 Dec. 2018
Government bonds 16,981 696 420 696
Promissory notes 53,763 - 53,763 -
Treasury bills (less than 90 days maturity) (note (i) below) 9,312 5,332 9,312 5,332
Treasury bills (above 90 days maturity) 9,363 13,411 9,288 13,411
89,419 19,439 72,783 19,439
Current 89,419 19,439 72,783 19,439
Non-current - - - -
89,419 19,439 72,783 19,439
Cash and cash equivalents for the purposes of the statements of cash flows include the following :
The calculation of basic earnings per share as at 30 June 2019 was based on the profit attributable to ordinary shareholders of
N42.192 billion (Bank: N21.647 billion) and the weighted average number of ordinary shares outstanding of 34.199 billion (Bank:
34.199 billion). The Bank had no dilutive instruments as at period end (June 2018 : nil). Hence the basic and diluted earnings per
share are equal.
Restricted balances with central banks comprise:
This represents amounts held as cash reserve requirement with central banks of the countries in which the Bank and its subsidiaries
operate, and is not available for use in the Group's day-to-day operations.
This represents the Bank's contribution to the Central Bank of Nigeria's (CBN) Real Sector Support Facility (RSSF), warehoused in the
Special Intervention Reserve held with the CBN. The Real Sector Support Facility is to be channeled towards providing credit to
priority sectors of the Nigerian economy. As stipulated by the CBN, the Bank's contribution is 5% of its total naira deposits.
Page 110 of 155 Consolidated and Separate Financial Statements for the period ended 30 June, 2019

United Bank for Africa Plc
Notes to the financial statements
Note 23 continued
Fixed income trading activities are restricted to the parent alone.
(i)
24 Loans and advances to banks Group Group Bank Bank
In millions of Nigerian Naira Jun. 2019 Dec. 2018 Jun. 2019 Dec. 2018
Loans:
Gross amount 81,891 16,147 59,685 15,859
Less: Allowance for credit losses
Stage 1 loans (634) (350) (607) (343)
Stage 2 loans - - - -
Stage 3 loans - - - -
81,257 15,797 59,078 15,516
Current 81,257 15,797 59,078 15,516
Non-current - - - -
81,257 15,797 59,078 15,516
(a) Allowance for credit losses on loans and advances to banks
30 June 2019
Group
Allowance for credit loss
In millions of Nigerian Naira Stage 1 Stage 2 Stage 3 Total
Balance, beginning of the period 350 350
Impairment (reversal)/ charge in the period 451 - - 451
Exchange difference (167) - - (167)
Balance, end of period 634 - - 634
Bank
Allowance for credit loss
In millions of Nigerian Naira Stage 1 -
12-month
Stage 2 -
Lifetime
Stage 3 -
Lifetime
Total
Balance, beginning of the period 343 - - 343
Impairment (reversal)/ charge in the period 452 - - 452
Exchange difference (188) (188)
Balance, end of period 607 - - 607
31 December 2018
Group
(b) Allowance for credit loss
In millions of Nigerian Naira Stage 1 -
12-month
ECL
Stage 2 -
Lifetime
ECL
Stage 3 -
Lifetime
ECL
Total
Balance, beginning of the period 188 188
Impairment (reversal)/ charge in the period (213) - (213)
Exchange difference 375 - 375
Balance, end of period 350 - - 350
31 December 2018
Bank
Allowance for credit loss
In millions of Nigerian Naira Stage 1 -
12-month
ECL
Stage 2 -
Lifetime
ECL
Stage 3 -
Lifetime
ECL
Total
Balance, beginning of the period 200 - 200
Impairment (reversal)/ charge in the period (213) - (213)
Exchange difference 356 - 356
Balance, end of period 343 - - 343
This represents treasury bills measured at fair value through profit or loss, with maturity within three months from the date of
purchase. They are highly liquid, readily convertible to known amounts of cash and subject to insignificant risk of changes in value.
They are included as cash and cash equivalents for the purpose of the statement of cash flows.
Page 111 of 155 Consolidated and Separate Financial Statements for the period ended 30 June, 2019

United Bank for Africa Plc
Notes to the financial statements
25 Loans and advances to customers Group Group Bank Bank
In millions of Nigerian Naira Jun. 2019 Dec. 2018 Jun. 2019 Dec. 2018
Loans:
Gross amount 1,759,862 1,807,393 1,239,588 1,274,112
Allowance for credit losses (72,356) (92,108) (47,024) (60,311)
1,687,506 1,715,285 1,192,564 1,213,801
Further analysis of loans to customers
Current 926,742 970,376 595,601 580,011
Non-current 760,764 744,909 596,963 633,790
1,687,506 1,715,285 1,192,564 1,213,801
(a) 30 June 2019
Loans and advances to customers Group Group Bank Bank
In millions of Nigerian Naira Jun. 2019 Dec. 2018 Jun. 2019 Dec. 2018
Gross amount 1,759,862 1,807,393 1,239,588 1,274,112
Allowance for credit losses:
- Impairment loss on Stage 1 loans (35,664) (24,947) (16,202) (17,961)
- Impairment loss on Stage 2 loans (14,958) (6,010) (12,566) (5,399)
- Impairment loss on Stage 3 loans (21,734) (61,151) (18,256) (36,951)
Total provision for credit losses (72,356) (92,108) (47,024) (60,311)
Carrying amount 1,687,506 1,715,285 1,192,564 1,213,801
Loans and advances to individuals Group Group Bank Bank
In millions of Nigerian Naira Jun. 2019 Dec. 2018 Jun. 2019 Dec. 2018
Gross amount 104,945 108,926 31,892 29,801
Allowance for credit losses:
- Impairment loss on Stage 1 loans (4,384) (1,091) (1,061) (201)
- Impairment loss on Stage 2 loans (220) (60) (1) (1)
- Impairment loss on Stage 3 loans (6,428) (10,202) (6,051) (6,566)
Total provision for credit losses (11,032) (11,353) (7,113) (6,768)
Carrying amount 93,913 97,573 24,779 23,033
Loans and advances to corporate entities and other organizations Group Group Bank Bank
In millions of Nigerian Naira Jun. 2019 Dec. 2018 Jun. 2019 Dec. 2018
Gross amount 1,654,917 1,698,467 1,207,696 1,244,311
Provision for credit losses:
- Impairment loss on Stage 1 loans (31,281) (23,856) (15,142) (17,760)
- Impairment loss on Stage 2 loans (14,738) (5,950) (12,564) (5,398)
- Impairment loss on Stage 3 loans (15,305) (50,949) (12,205) (30,385)
Total provision for credit losses (61,324) (80,755) (39,911) (53,543)
Carrying amount 1,593,593 1,617,712 1,167,785 1,190,768
Group
Loans and advances to individuals Gross
amount
Stage 1 -
12-month
ECL
Stage 2 -
Lifetime ECL
Stage 3 -
Lifetime
ECL
Total
allowances
Carrying
amount
Overdrafts 25,545 (1,084) (116) (858) (2,059) 23,486
Term loans 79,400 (3,300) (104) (5,570) (8,973) 70,427
104,945 (4,384) (220) (6,428) (11,032) 93,913
Loans and advances to corporate entities and other organizations
Overdrafts 459,040 (9,194) (1,833) (14,928) (25,956) 433,085
Term loans 1,193,001 (22,071) (12,905) (377) (35,353) 1,157,649
Others 2,875 (16) - - (16) 2,859
1,654,917 (31,281) (14,738) (15,305) (61,325) 1,593,593
Page 112 of 155 Consolidated and Separate Financial Statements for the period ended 30 June, 2019

United Bank for Africa Plc
Notes to the financial statements
Loans and advances to customers - continued
Bank
Loans and advances to individualsGross
amount
Stage 1 -
12-month
ECL
Stage 2 -
Lifetime ECL
Stage 3 -
Lifetime
ECL
Total
allowances
Carrying
amount
Overdrafts 13,841 (898) - (537) (1,433) 12,408
Term loans 18,051 (163) (1) (5,515) (5,679) 12,371
31,892 (1,061) (1) (6,051) (7,113) 24,779
Loans and advances to corporate entities and other organizations
Overdrafts 273,001 (2,940) (1,001) (12,079) (16,019) 256,982
Term loans 931,820 (12,185) (11,564) (126) (23,875) 907,944
Others 2,875 (16) - - (16) 2,859
1,207,696 (15,142) (12,564) (12,205) (39,911) 1,167,785
(b) 31 December 2018
(i) Group
Loans and advances to individualsGross
amount
Stage 1 -
12-month
ECL
Stage 2 -
Lifetime ECL
Stage 3 -
Lifetime
ECL
Total
allowances
Carrying
amount
Overdrafts 24,578 (66) (38) (8,806) (8,910) 15,668
Term loans 84,348 (1,026) (21) (1,396) (2,443) 81,905
108,926 (1,092) (59) (10,202) (11,353) 97,573
Loans and advances to corporate entities and other organizations
Overdrafts 383,414 (3,220) (457) (47,232) (50,909) 332,505
Term loans 1,310,720 (20,620) (5,493) (3,717) (29,830) 1,280,890
Others 4,333 (16) - - (16) 4,317
1,698,467 (23,856) (5,950) (50,949) (80,755) 1,617,712
Loans and advances to customers - continued
(ii) Bank
Loans and advances to individuals
Gross
amount
Stage 1 -
12-month
ECL
Stage 2 -
Lifetime ECL
Stage 3 -
Lifetime
ECL
Total
allowances
Carrying
amount
Overdraft 13,305 (37) (1) (5,742) (5,780) 7,525
Term Loans 16,496 (164) - (824) (988) 15,508
29,801 (201) (1) (6,566) (6,768) 23,033
Bank
Loans and advances to corporate entities and other organizations
Gross
amount
Stage 1 -
12-month
ECL
Stage 2 -
Lifetime ECL
Stage 3 -
Lifetime
ECL
Total
allowances
Carrying
amount
Overdrafts 208,244 (1,922) (115) (26,961) (28,998) 179,246
Term loans 1,031,734 (15,824) (5,283) (3,423) (24,530) 1,007,204
Others 4,333 (15) - - (15) 4,318
1,244,311 (17,761) (5,398) (30,384) (53,543) 1,190,768
(c) Allowance for credit losses on loans and advances to customers
30 June 2019
(i) Group
In millions of Nigerian Naira Stage 1-
12-month
ECL
Stage 2 -
Lifetime
ECL
Stage 3 -
Lifetime
ECL
Total
Balance, beginning of period 24,947 6,010 61,151 92,108
Impairment charge/(write back) in the period (5,077) 7,118 (2,273) (232)
Transfer between stages 15,795 1,830 (17,625) -
Write offs - - (19,520) (19,519)
Balance, end of period 35,664 14,958 21,733 72,357
Page 113 of 155 Consolidated and Separate Financial Statements for the period ended 30 June, 2019

United Bank for Africa Plc
Notes to the financial statements
Loans and advances to individuals
In millions of Nigerian Naira Stage 1-
12-month
Stage 2 -
Lifetime
Stage 3 -
Lifetime
Total
Balance, beginning of period 1,091 60 10,202 11,353
Impairment charge/(write back) in the period 2,924 (245) 3,062 5,740
Transfer between stages 369 405 (774) -
Write offs - - (6,061) (6,061)
Balance, end of period 4,384 220 6,428 11,032
Loans and advances to corporate entities and other organizations
In millions of Nigerian Naira Stage 1-
12-month
ECL
Stage 2 -
Lifetime
ECL
Stage 3 -
Lifetime
ECL
Total
Balance, beginning of period 23,856 5,950 50,949 80,755
Impairment charge/(write back) in the period (8,001) 7,363 (5,334) (5,972)
Transfer between stages 15,425 1,425 (16,851) -
Write offs - - (13,459) (13,459)
Balance, end of period 31,280 14,738 15,305 61,324
(ii) Bank
In millions of Nigerian Naira Stage 1-
12-month
ECL
Stage 2 -
Lifetime
ECL
Stage 3 -
Lifetime
ECL
Total
Balance, beginning of period 17,961 5,399 36,951 60,311
Impairment charge/(write back) in the period (17,811) 6,137 11,763 89
Transfer between stages 16,052 1,030 (17,082) -
Write offs - - (13,376) (13,376)
Balance, end of period 16,202 12,566 18,256 47,024
Loans and advances to individuals
In millions of Nigerian Naira Stage 1 Stage 2 Stage 3 Total
Balance, beginning of period 201 1 6,566 6,768
Impairment charge/(write back) in the period 556 0 (3,248) (2,692)
Transfer between stages 303 - (303) -
Write offs 3,036 3,036
Balance, end of period 1,060 1 6,051 7,112
Loans to corporate entities and other organizations
In millions of Nigerian Naira Stage 1 Stage 2 Stage 3 Total
Balance, beginning of period 17,760 5,398 30,385 53,543
Impairment charge/(write back) in the period (18,367) 6,136 15,011 2,780
Transfer between stages 15,749 1,030 (16,779) -
Write offs (16,412) (16,412)
Balance, end of period 15,142 12,564 12,205 39,911
31 December 2018
(iii) Allowance for credit losses on loans and advances to customers
Group
In millions of Nigerian Naira Stage 1-
12-month
ECL
Stage 2 -
Lifetime
ECL
Stage 3 -
Lifetime
ECL
Total
Balance, beginning of period 31,416 7,087 66,004 104,507
Impairment charge/(write back) in the period (6,469) (1,077) 4,835 (2,711)
Write offs - - (9,688) (9,688)
Balance, end of period 24,947 6,010 61,151 92,108
Page 114 of 155 Consolidated and Separate Financial Statements for the period ended 30 June, 2019

United Bank for Africa Plc
Notes to the financial statements
Loans and advances to individuals
In millions of Nigerian Naira Stage 1 -
12-month
ECL
Stage 2 -
Lifetime
ECL
Stage 3 -
Lifetime
ECL
Total
Balance, beginning of period 1,634 189 5,594 7,417
Impairment charge/(write back) in the period (543) (129) 4,609 3,937
Write offs - - (1) (1)
Balance, end of period 1,091 60 10,202 11,353
(iv) Loans and advances to corporate entities and other organizations
In millions of Nigerian Naira Stage 1 -
12-month
Stage 2 -
Lifetime
Stage 3 -
Lifetime
Total
Balance, beginning of period 29,782 6,898 60,410 97,090
Impairment charge/(write back) in the period (5,926) (948) 226 (6,648)
Write offs - - (9,687) (9,687)
Balance, end of period 23,856 5,950 50,949 80,755
Bank
In millions of Nigerian Naira Stage 1 -
12-month
ECL
Stage 2 -
Lifetime
ECL
Stage 3 -
Lifetime
ECL
Total
Balance, beginning of period 23,933 5,446 43,123 72,502
Impairment charge/(write back) in the period (5,972) (47) 4,911 (1,108)
Write offs - - (11,083) (11,083)
Balance, end of period 17,961 5,399 36,951 60,311
Loans and advances to individuals
In millions of Nigerian Naira Stage 1 -
12-month
ECL
Stage 2 -
Lifetime
ECL
Stage 3 -
Lifetime
ECL
Total
Balance, beginning of period 201 1 3,724 3,926
Impairment charge/(write back) in the period - - 2,844 2,844
Write offs - - (2) (2)
Balance, end of period 201 1 6,566 6,768
Loans and advances to corporate entities and other organizations
In millions of Nigerian Naira Stage 1 -
12-month
ECL
Stage 2 -
Lifetime
ECL
Stage 3 -
Lifetime
ECL
Total
Balance, beginning of period 23,732 5,445 39,399 68,576
Impairment charge/(write back) in the period (5,972) (47) 2,067 (3,952)
Write offs - (11,081) (11,081)
Balance, end of period 17,760 5,398 30,385 53,543
26 Investment securities Group Group Bank Bank
In millions of Nigerian Naira June 2019 Dec 2018 June 2019 Dec 2018
(a) At fair value through other comprehensive income (see note (i)):
Treasury bills 678,144 790,292 639,898 705,152
Bonds 141,250 143,608 107,331 118,498
Equity investments (see note (ii)) 105,021 102,753 104,491 102,242
924,415 1,036,653 851,720 925,892
Page 115 of 155 Consolidated and Separate Financial Statements for the period ended 30 June, 2019

United Bank for Africa Plc
Notes to the financial statements
Group Group Bank Bank
(b) At amortised cost (see note (i)): June 2019 Dec 2018 June 2019 Dec 2018
Treasury bills 387,110 321,131 - -
Bonds 229,759 279,658 83,623 84,509
Gross amount 616,869 600,789 83,623 84,509
Allowance for credit losses (458) (310) (458) (244)
Net carrying amount 616,411 600,479 83,165 84,265
Carrying amount 1,540,826 1,637,132 934,885 1,010,157
Current 532,365 1,251,924 597,936 812,951
Non-current 1,008,461 385,208 336,949 197,206
1,540,826 1,637,132 934,885 1,010,157
(i)
Group Group Bank Bank
Jun. 2019 Dec. 2018 Jun. 2019 Dec. 2018
In millions of Nigerian Naira
Bonds (at FVOCI) 12,554 9,166 12,554 9,166
Treasury bills (at FVOCI) 66,873 353,994 66,873 353,994
Bonds (at amortised cost) 178,371 39,814 178,371 39,814
257,798 402,974 257,798 402,974
(ii) (ii) Unquoted equity securities at FVOCI are analysed below:
In millions of Nigerian Naira Group Group Bank Bank
Jun. 2019 Dec. 2018 Jun. 2019 Dec. 2018
Africa finance corporation 87,709 87113 87,709 87113
SMEEIS investment 4,640 4,640 4,640 4,640
Unified payment services limited 3,921 3,593 3,921 3,593
MTN Nigeria 3,211 2,499 3,211 2,499
Central securities clearing system
limited
2,797 2,255 2,797 2,255
Nigeria interbank settlement system plc. 1,535 1,482 1,535 1,482
African export-import bank 405 388 405 388
FMDQ OTC Plc 124 124 124 124
Credit reference company 98 98 98 98
NG Clearing Limited 50 50 50 50
Others1 530 511 - -
105,021 102,753 104,491 102,242
(ii)
Included in investment securities at FVOCI and amortised cost are pledged financial assets which cannot be re-pledged or resold
by counterparties, and these securities are stated as follows:
1These relate to other unquoted equity investments (in enties such as GIM UEMOA, The Insurance and Reinsurance Company of the
Gulf of Guinea (ARGG) and others) held across the Group by different subsidiaries.
Upon transition to IFRS 9, the Group elected to measure equity investment at fair value through other comprehensive income.
Page 116 of 155 Consolidated and Separate Financial Statements for the period ended 30 June, 2019

United Bank for Africa Plc
Notes to the financial statements
27 Other assets
Group Group Bank Bank
In millions of Nigerian Naira Jun. 2019 Dec. 2018 Jun. 2019 Dec. 2018
Financial assets
Electronic payments receivables 14,916 20,001 12,429 16,868
Accounts receivable 39,285 28,148 12,151 9,401
Intercompany receivables - - 8,969 8,896
Dividends receivable 385 - 6,091 5,749
Pension custody fees receivable 547 744 - -
55,133 48,893 39,640 40,914
Group Group Bank Bank
Jun. 2019 Dec. 2018 Jun. 2019 Dec. 2018
Non-financial assets
Prepayments 18,406 14,387 11,411 7,565
Recoverable taxes 1,762 1,565 465 128
Stock of consumables 4,600 3,477 9,471 3,000
24,768 19,429 21,347 10,693
Right-of-use assets 8,168 6,820
Allowance for impairment on accounts receivable (6,751) (5,310) (2,056) (1,965)
81,318 63,012 65,751 49,642
(a) Movement in impairment for other assets
At start of period 5,310 3,328 1,965 2,216
Charge for the period (Note 12) 370 4,162 91 3,105
Reversal/Balances written off - (3,356) - (3,356)
Exchange difference 1,071 1,176 - -
6,751 5,310 2,056 1,965
(b) Current 76,802 59,441 62,262 47,268
Non-current 4,516 3,571 3,489 2,374
81,318 63,012 65,751 49,642
28 Investment in equity-accounted investee
(a) Movement in investment in equity-accounted investee
Group Group Bank Bank
In millions of Nigerian Naira Jun. 2019 Dec. 2018 Jun. 2019 Dec. 2018
Balance, beginning of the period 4,610 2,860 2,715 1,770
Additional investment 179 945 - 945
Share of current period's result 342 419 - -
Share of foreign currency translation differences (1,242) 386 - -
Balance, end of the period 3,889 4,610 2,715 2,715
Set out below, is information on the Group's investment in equity accounted investee as at 30 June 2019. The Associate Company
(UBA Zambia Limited) has share capital consisting solely of ordinary shares, which are held directly by the Group. The proportion of
the Group's ownership interest is the same as the proportion of voting rights held.
There are no published price quotations for the Group's investment in the Associate Company. There are no restrictions on the
ability of the Associate Company to transfer funds to the Group in the form of cash dividends or repayment of loans and advances
neither are there any contingent liabilities relating to the Group’s interest in the Associate Company.
Page 117 of 155 Consolidated and Separate Financial Statements for the period ended 30 June, 2019

United Bank for Africa Plc
Notes to the financial statements
(i) Reconciliation of summarised financial information
In millions of Nigerian Naira Jun. 2019 Dec. 2018
Opening net assets 5,063 3,420
Profit for the period 698 856
Foreign currency translation differences (610) 787
Closing net assets 5,151 5,063
Group's interest in associate (49%) 2,703 3,424
Notional goodwill 1,186 1,186
Carrying amount 3,889 4,610
(b) Nature of investment in associates
Name of entity Country
of
incorporat
ion
Place of
business
Nature of
business
% of
ownership
interest
Measurement
method
UBA Zambia Bank Limited Zambia Zambia Banking 49* Equity
method
*'The Group's interest in UBA Zambia did not change during the period.
(c) Summarised financial information for associate
(i) Summarised Statement of Financial Position
In millions of Nigerian Naira Jun. 2019 Dec. 2018
Assets
Cash and cash equivalents 1,876 6,314
Other current assets 32,084 22,550
Non-current assets 414 518
Total assets 34,374 29,382
Financial liabilities 27,478 21,168
Other current liabilities 1,745 3,151
Other non-current liabilities - -
Total liabiliities 29,223 24,319
Net assets 5,151 5,063
-
(ii) Summarised statement of comprehensive income
Jun. 2019 Jun. 2018
Operating income 2,522 2,525
Operating expense (1,821) (1,847)
Net impairment loss on financial assets (3) (424)
Profit/(Loss) before tax 698 254
Income tax expense - -
Profit/(Loss) for the period 698 254
Other comprehensive income - -
Total comprehensive income/(loss) 698 254
Reconciliation of the summarised financial information presented, to the carrying amount of the interest in associates is shown
The information above reflects the amounts presented in the financial statements of the Associate Company (and not UBA Group's
share of those amounts). There are no differences in the accounting policies of the Associate Company and the Group's
accounting policies.
Page 118 of 155 Consolidated and Separate Financial Statements for the period ended 30 June, 2019

United Bank for Africa Plc
Notes to the financial statements
29 Investment in subsidiaries
(a) Holding in subsidiaries
Bank In millions of Nigerian Naira Bank Bank
Jun. 2019 Dec. 2018
Bank subsidiaries (see note (i)
below):
Year of
acquisition/
Commence
ment
Holding Non-
controlling
interest
Country Industry
UBA Ghana Limited 2004 91% 9% Ghana Banking 8,048 8,048
UBA Cameroun (SA) 2007 100% 0% Cameroun Banking 1,845 1,845
UBA Cote d'Ivoire 2008 100% 0% Cote d'Ivoire Banking 12,295 12,295
UBA Liberia Limited 2008 100% 0% Liberia Banking 2,330 2,330
UBA (SL) Limited 2008 100% 0% Sierra Leone Banking 1,269 1,269
UBA Uganda Limited 2008 69% 31% Uganda Banking 3,705 3,705
UBA Burkina Faso 2008 64% 36% Burkina Faso Banking 5,352 5,352
UBA Benin 2008 84% 16% Benin
Republic
Banking 11,451 11,451
UBA Kenya Bank Limited 2009 81% 19% Kenya Banking 3,744 3,744
UBA Chad (SA) 2009 89% 11% Chad Banking 2,440 2,440
UBA Senegal (SA) 2009 86% 14% Senegal Banking 2,400 2,400
UBA Tanzania Limited 2010 82% 18% Tanzania Banking 4,332 4,332
UBA Gabon 2010 100% 0% Gabon Banking 2,760 2,760
UBA Guinea (SA) 2010 100% 0% Guinea Banking 1,475 1,475
UBA Congo DRC (SA) 2011 100% 0% Congo DRC Banking 10,375 10,375
UBA Congo Brazzaville (SA) 2011 100% 0% Congo
Brazzaville
Banking 3,024 3,024
UBA Mozambique (SA) 2011 96% 4% Mozambique Banking 8,156 8,156
UBA Mali 2017 100% - Mali Banking 6,300 6,300
Non-Bank Subsidiaries:
UBA Pensions Custodian Limited
(see (ii) below)
2004 100% - Nigeria Pension
custody
2,000 2,000
UBA FX Mart Limited (see (iii)
below)
2008 100% - Nigeria Banking - 502
UBA UK Limited (see (iv) below) 2012 100% - United
Kingdom
Investment
banking
9,974 9,974
- 103,275 103,777
Bank Bank
Jun. 2019 Dec. 2018
103,777 103,777
(502) -
103,275 103,777
N'Million
Net assets of FX Marts as at Liquidation date 677.6
Cost of investment in subsidiary (502.0)
Net gains from Liquidation 175.6
The proportion of the voting rights in the subsidiary undertakings held directly by the parent company do not differ from the
proportion of ordinary shares held. The parent company does not have any shareholdings in the preference shares of subsidiary
undertakings included in the Group.
The movement in investment in subsidiaries during the period is as follows:
In millions of Nigerian Naira
The movement in the investment in subsidiaries during the period is as follows:
Balance, beginning of the period
Disposal of investments during the period
Balance, end of the period
During the period, the gain recorded from liquidation of FX Mart by the Bank was determined as follows:
Page 119 of 155 Consolidated and Separate Financial Statements for the period ended 30 June, 2019

United Bank for Africa Plc
Notes to the financial statements
(i)
(ii)
(iii)
(iv)
(v)
(b) Non-controlling interests
(i)
Jun. 2019 Dec. 2018
UBA Ghana Limited 4,000 3,897
UBA Burkina Faso 5,881 6,439
UBA Benin 1,982 1,947
UBA Uganda Limited 1,267 1,235
UBA Kenya Bank Limited 1,480 1,444
UBA Senegal (SA) 2,114 2,360
UBA Mozambique (SA) 363 364
UBA Chad (SA) 1,165 1,018
UBA Tanzania Limited 454 435
18,706 19,139
During the year, the Bank did not make any additional investments or capital injection into the existing subsidiaries.
The total non-controlling interest at the end of the period is N18.706 billion (2018: N19.139 billion) is attributed to the following non-
fully owned subsidiaries:
UBA Ghana, UBA Cameroon SA, UBA Cote d'ivoire, UBA Liberia, UBA Uganda, UBA Burkina Faso, UBA Chad SA, UBA Senegal SA,
UBA Benin, UBA Kenya, UBA Tanzania, UBA Gabon, UBA Guinea, UBA Sierra Leone, UBA Mozambique, UBA Congo DRC and UBA
Congo Brazzaville are engaged in the business of banking and provide corporate, commercial, consumer and international
banking, trade services, cash management and treasury services.
UBA Pension Custodian Limited obtained an operating license on 20 February 2006 and commenced operations in Nigeria on 3
May 2006. It principally operates as a custodian of pension assets, to hold and deal in such assets as directed by the Pension Fund
Administrators and in line with regulations of the National Pension Commission in conformity with the Pensions Reforms Act 2004
and as amended in 2014.
UBA FX Mart was incorporated on January 30, 2008 and commenced operations on May 22, 2008. It operates as a licensed bureau
de change, dealing in foreign currency and traveller's cheques. In January 2015, Management made a decision to suspend the
Company's operations. As at the reporting date, the Company has been liquidated.
UBA UK Limited is a London-based investment banking company which was incorporated on September 25, 1995. It is primarily
engaged in brokerage, trade finance and wealth management businesses.
UBA Retail Financial Services Limited was established in 2008 to provide a wide range of financial services targeting non-bank
customers through non-branch channels such as direct sales agents, telemarketing, internet, consumer outlets, dealers and
microfinance banks. The Company ceased operations in 2012 and is currently undergoing liquidation.
Significant restrictions:
There are no significant restrictions on the Group’s ability to access or use the assets and settle the liabilities of any member of the
Group to the extent that regulation does not inhibit the Group from having access, and in liquidation scenario, this restriction is
limited to its level of investment in the entity .
Page 120 of 155 Consolidated and Separate Financial Statements for the period ended 30 June, 2019
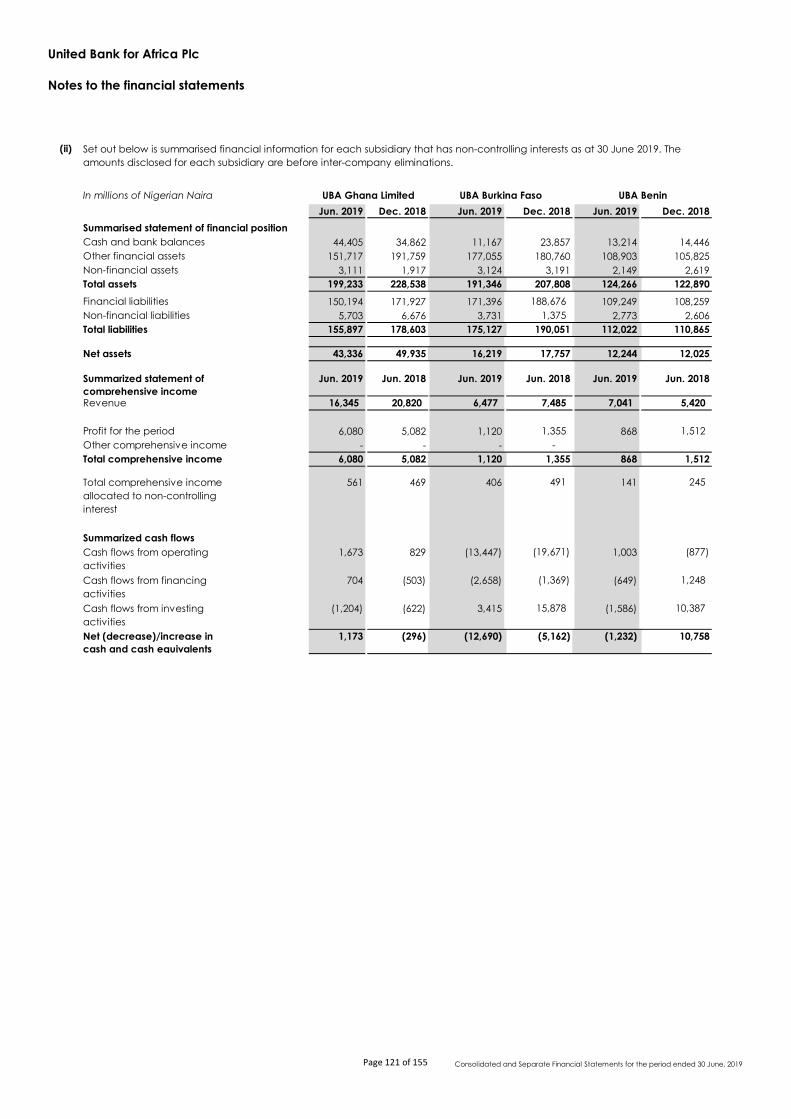
United Bank for Africa Plc
Notes to the financial statements
(ii)
In millions of Nigerian Naira
Jun. 2019 Dec. 2018 Jun. 2019 Dec. 2018 Jun. 2019 Dec. 2018
Summarised statement of financial position
Cash and bank balances 44,405 34,862 11,167 23,857 13,214 14,446
Other financial assets 151,717 191,759 177,055 180,760 108,903 105,825
Non-financial assets 3,111 1,917 3,124 3,191 2,149 2,619
Total assets 199,233 228,538 191,346 207,808 124,266 122,890
Financial liabilities 150,194 171,927 171,396 188,676 109,249 108,259
Non-financial liabilities 5,703 6,676 3,731 1,375 2,773 2,606
Total liabilities 155,897 178,603 175,127 190,051 112,022 110,865
Net assets 43,336 49,935 16,219 17,757 12,244 12,025
Summarized statement of
comprehensive income
Jun. 2019 Jun. 2018 Jun. 2019 Jun. 2018 Jun. 2019 Jun. 2018
Revenue 16,345 20,820 6,477 7,485 7,041 5,420
Profit for the period 6,080 5,082 1,120 1,355 868 1,512
Other comprehensive income - - - -
Total comprehensive income 6,080 5,082 1,120 1,355 868 1,512
Total comprehensive income
allocated to non-controlling
interest
561 469 406 491 141 245
Summarized cash flows
Cash flows from operating
activities
1,673 829 (13,447) (19,671) 1,003 (877)
Cash flows from financing
activities
704 (503) (2,658) (1,369) (649) 1,248
Cash flows from investing
activities
(1,204) (622) 3,415 15,878 (1,586) 10,387
Net (decrease)/increase in
cash and cash equivalents
1,173 (296) (12,690) (5,162) (1,232) 10,758
Set out below is summarised financial information for each subsidiary that has non-controlling interests as at 30 June 2019. The
amounts disclosed for each subsidiary are before inter-company eliminations.
UBA Ghana Limited UBA Burkina Faso UBA Benin
Page 121 of 155 Consolidated and Separate Financial Statements for the period ended 30 June, 2019

United Bank for Africa Plc
Notes to the financial statements
Summarised financial information of subsidiaries with non-controlling interest (continued)
In millions of Nigerian Naira
Jun. 2019 Dec. 2018 Jun. 2019 Dec. 2018 Jun. 2019 Dec. 2018
Summarised statement of financial position
Cash and bank balances 10,360 10,639 13,199 12,071 71,759 64,492
Other financial assets 20,650 13,252 40,296 40,671 122,115 122,093
Non-financial assets 466 416 1,585 1,472 1,063 1,119
Total assets 31,476 24,307 55,080 54,214 194,937 187,704
Financial liabilities 24,348 20,307 46,498 27,901 173,903 164,781
Non-financial liabilities 3,024 - 790 18,714 5,387 5,460
Total liabilities 27,372 20,307 47,288 46,615 179,290 170,241
Net assets 4,104 4,000 7,792 7,599 15,647 17,463
Summarized statement of
comprehensive income
Jun. 2019 Jun. 2018 Jun. 2019 Jun. 2018 Jun. 2019 Jun. 2018
Revenue 1,975 1,283 2,881 1,282 5,204 5,186
Profit/(loss) for the period 179 148 99 110 671 1,949
Other comprehensive income - - - -
Total comprehensive income 179 148 99 110 671 1,949
Total comprehensive income
allocated to non-controlling
interest
55 46 19 21 91 263
Summarized cash flows
Cash flows from operating
activities
7,301 7,151 18,217 7,846 9,097 7,958
Cash flows from financing
activities
(78) (952) (17,845) 18,082 (2,487) (3,442)
Cash flows from investing
activities
(7,502) (4,837) 756 (20,963) 657 2,718
Net increase/(decrease) in
cash and cash equivalents
(279) 1,362 1,128 4,965 7,267 7,234
UBA Uganda Limited UBA Kenya Bank Limited UBA Senegal (SA)
Page 122 of 155 Consolidated and Separate Financial Statements for the period ended 30 June, 2019

United Bank for Africa Plc
Notes to the financial statements
Summarised financial information of subsidiaries with non-controlling interest (continued)
In millions of Nigerian Naira Jun. 2019 Dec. 2018 Jun. 2019 Dec. 2018 Jun. 2019 Dec. 2018
Summarised statement of financial position
Cash and bank balances 5,290 4,335 10,380 6,280 27,488 6,423
Other financial assets 10,424 15,190 34,337 34,399 11,010 10,224
Non-financial assets 249 233 681 1,199 191 160
Total assets 15,963 19,758 45,398 41,878 38,689 16,807
Financial liabilities 7,324 11,037 32,971 31,377 35,795 14,090
Non-financial assets 190 260 1,837 1,245 356 281
Total liabilities 7,514 11,297 34,808 32,622 36,151 14,371
Net assets 8,449 8,461 10,590 9,256 2,538 2,436
Summarized statement of
comprehensive income
Jun. 2019 Jun. 2018 Jun. 2019 Jun. 2018 Jun. 2019 Jun. 2018
Revenue 1,107 401 3,461 2,669 1,179 742
(Loss)/Profit for the period (12) 270 1,407 922 92 (266)
Other comprehensive income - - - - - -
Total comprehensive income (12) 270 1,407 922 92 (266)
Total comprehensive income
allocated to non-controlling
interest
(1) 12 155 101 16 (48)
Summarized cash flows
Cash flows from operating
activities
(3,726) 3,744 8,968 2,033 21,946 7,689
Cash flows from financing
activities
2 (496) (73) (2,644) 11 (767)
Cash flows from investing
activities
4,679 (435) (4,795) (4,444) (892) (196)
Net increase/(decrease) in
cash and cash equivalents
955 2,813 4,100 (5,055) 21,065 6,726
UBA Mozambique (SA) UBA Chad UBA Tanzania
Page 123 of 155 Consolidated and Separate Financial Statements for the period ended 30 June, 2019

United Bank for Africa Plc
Notes to the financial statements
30 Property and equipment
(a) As at 30 June 2019
Group
In millions of Nigerian Naira Land Buildings Leasehold
improvem
ents
Aircraft Motor
vehicles
Furniture
and fittings
Computer
hardware
Equipment Work in
progress
Total
Cost
Balance at 1 January 2019 34,390 36,956 13,259 8,564 14,367 11,640 41,936 44,910 11,453 217,475
Additions 171 52 180 - 319 414 764 2,171 5,295 9,366
Reclassifications (406) 265 446 - 61 51 841 1,901 (3,158) -
Disposals - (45) (403) - (235) (242) (325) (388) (100) (1,738)
Transfers - - - - - - - - 187 187
Write-off - (8) - - (42) (0) (1) (7) - (59)
Exchange difference (note i) (68) (107) (118) - (108) (123) (77) (108) (145) (853)
Balance at 30 June 2019 34,087 37,113 13,364 8,564 14,362 11,740 43,138 48,478 13,532 224,378
Accumulated depreciation
Balance at 1 January 2019 - 14,461 7,542 1,666 11,567 9,201 28,783 28,282 - 101,502
Charge for the period - 585 246 204 373 382 1,955 2,270 - 6,015
Reclassifications - (10) 30 - 19 (44) (24) 29 - -
Disposals - (23) (396) - (131) (237) (231) (253) - (1,271)
Write-off - (1) - - (38) (0) (1) (6) - (46)
Exchange difference (note i) - (34) (116) - (22) (156) (35) (28) - (390)
Balance at 30 June 2019 - 14,977 7,307 1,870 11,769 9,146 30,447 30,293 - 105,810
Carrying amounts
Balance at 30 June 2019 34,087 22,136 6,057 6,694 2,593 2,594 12,691 18,185 13,532 118,571
(i)
(ii)
Exchange differences arise from the translation of the property and equipment in the Group's foreign operations.
There were no capitalised borrowing costs related to the acquisition of property and equipment during the period (December 2018: nil)
Page 124 of 155 Consolidated and Separate Financial Statements for the period ended 30 June, 2019

United Bank for Africa Plc
Notes to the financial statementsGroup
(b) As at 31 December 2018
In millions of Nigerian Naira Land Buildings Leasehold
improvem
ents
Aircraft Motor
vehicles
Furniture
and fittings
Computer
hardware
Equipment Work in
progress
Total
Cost
Balance at 1 January 2018 34,380 36,533 13,305 8,564 14,071 11,049 33,389 38,430 12,702 202,423
Additions 63 580 574 - 779 728 1,832 5,779 8,709 19,044
Reclassifications (22) 928 277 - 23 136 7,182 1,417 (9,941) -
Disposals (3) (573) (558) - (342) (135) (276) (446) (99) (2,432)
Transfers - - - - - - - - 233 233
Write-off - (6) - - (1) - - - - (7)
Exchange difference (28) (506) (339) - (163) (138) (191) (270) (151) (1,786)
Balance at 31 December 2018 34,390 36,956 13,259 8,564 14,367 11,640 41,936 44,910 11,453 217,475
Accumulated depreciation
Balance at 1 January 2018 - 14,595 7,319 1,258 11,035 8,268 27,400 24,910 - 94,785
Charge for the year - 514 868 408 907 1,207 2,329 3,966 - 10,199
Reclassifications - (7) 7 - - (1) (5) 6 - -
Disposals - (399) (382) - (219) (97) (707) (345) - (2,149)
Transfers - - - - - - - - - -
Write-off - - - - (1) - - - - (1)
Exchange difference - (242) (270) - (155) (176) (234) (255) - (1,332)
Balance at 31 December 2018 - 14,461 7,542 1,666 11,567 9,201 28,783 28,282 - 101,502
Carrying amounts
Balance at 31 December 2018 34,390 22,495 5,717 6,898 2,800 2,439 13,153 16,628 11,453 115,973
Page 125 of 155 Consolidated and Separate Financial Statements for the period ended 30 June, 2019

United Bank for Africa Plc
Notes to the financial statements
Bank
(c) As at 30 June 2019
In millions of Nigerian Naira Land Buildings Leasehold
improvem
ents
Aircraft Motor
vehicles
Furniture
and fittings
Computer
hardware
Equipment Work in
progress
Total
Cost
Balance at 1 January 2019 33,372 26,316 4,034 8,564 10,227 7,815 35,336 37,776 7,706 171,146
Additions 171 41 - - 170 219 573 982 4,867 7,022
Reclassifications (406) 242 341 - 41 47 821 1,866 (2,952) -
Disposals - (0) (2) - (75) (22) (169) (138) (100) (506)
Transfers - - - - - - - 187 187
Write-off (8) - - (42) (0) (1) (7) - (59)
Exchange difference (note i) 2 - 0 1 5 0 8
Balance at 30 June 2019 33,137 26,591 4,375 8,564 10,322 8,059 36,564 40,478 9,709 177,798
Accumulated depreciation
Balance at 1 January 2019 - 9,082 1,626 1,666 8,364 5,733 24,096 23,077 - 73,644
Charge for the period - 210 53 204 267 286 1,367 2,063 - 4,451
Reclassifications - (13) 13 - - 2 (44) 42 - -
Disposals - (0) (1) - (72) (22) (166) (133) - (394)
Write-off - (1) - - (38) (0) (1) (6) - (46)
Exchange difference (note i) - 1 - 0 1 2 0 - 5
Balance at 30 June 2019 - 9,277 1,693 1,870 8,522 6,000 25,255 25,043 - 77,660
Carrying amounts
Balance at 30 June 2019 33,137 17,314 2,682 6,694 1,800 2,059 11,309 15,435 9,709 100,138
(i)
(ii)
Exchange differences arise from the translation of the property and equipment of the UBA New York branch.
There were no capitalised borrowing costs related to the acquisition of property and equipment during the period (December 2018: nil)
Page 126 of 155 Consolidated and Separate Financial Statements for the period ended 30 June, 2019

United Bank for Africa Plc
Notes to the financial statements(d) As at 31 December 2018
Bank
In millions of Nigerian Naira Land Buildings Leasehold
improvem
ents
Aircraft Motor
vehicles
Furniture
and fittings
Computer
hardware
Equipment Work in
progress
Total
Cost
Balance at 1 January 2018 33,334 25,499 3,673 8,564 10,041 7,270 27,115 31,483 9,083 156,062
Additions 63 318 77 - 319 422 1,142 5,137 8,014 15,492
Reclassifications (22) 512 277 - 23 136 7,182 1,417 (9,525) -
Disposals (3) (7) (20) - (158) (27) (150) (275) (99) (739)
Transfers - - - - - - - - 233 233
Write-off - (6) - - (1) - - - - (7)
Exchange difference - - 27 - 3 14 47 14 - 105
Balance at 31 December 2018 33,372 26,316 4,034 8,564 10,227 7,815 35,336 37,776 7,706 171,146
Accumulated depreciation
Balance at 1 January 2018 - 8,691 1,520 1,258 7,888 5,185 22,240 19,995 - 66,777
Charge for the year - 400 93 408 603 561 1,985 3,318 - 7,368
Reclassifications - (7) 7 - - (1) (5) 6 - -
Disposals - (2) (14) - (128) (25) (142) (258) - (569)
Transfers - - - - - - - - - -
Write-off - - - - (1) - - - - (1)
Exchange difference - - 20 - 2 13 18 16 - 69
Balance at 31 December 2018 - 9,082 1,626 1,666 8,364 5,733 24,096 23,077 - 73,644
Carrying amounts
Balance at 31 December 2018 33,372 17,234 2,408 6,898 1,863 2,082 11,240 14,699 7,706 97,502
- -
Page 127 of 155 Consolidated and Separate Financial Statements for the period ended 30 June, 2019

United Bank for Africa Plc
Notes to the financial statements
31 Intangible assets
(a) (i) As at 30 June 2019
Group
In millions of Nigerian Naira Goodwill Purchased Work in
software progress Total
Cost
Balance at 1 January 2019 9,735 20,092 3,710 33,537
Additions - 174 1,037 1,211
Reclassifications - 123 (123) -
Disposal - - (11) (11)
Transfers* - - (188) (188)
Exchange difference (170) (254) 0 (424)
Balance at 30 June 2019 9,565 20,135 4,425 34,126
Amortization
Balance at 1 January 2019 - 15,369 - 15,369
Amortisation for the period - 838 - 838
Exchange difference - (50) - (50)
Balance at 30 June 2019 - 16,157 - 16,157
Carrying amounts
Balance at 30 June 2019 9,565 3,978 4,425 17,969
(ii) As at 31 December 2018
Group
In millions of Nigerian Naira Goodwill Purchased Work in
software progress Total
Cost
Balance at 1 January 2018 9,792 18,506 2,533 30,831
Additions - 994 2,370 3,364
Reclassifications - 926 (926) -
Disposal - - (33) (33)
Transfers* - - (234) (234)
Exchange difference (57) (334) - (391)
Balance at 31 December 2018 9,735 20,092 3,710 33,536
Amortization
Balance at 1 January 2018 - 13,940 - 13,940
Amortisation for the year - 1,602 - 1,602
Exchange difference - (172) - (172)
Balance at 31 December 2018 - 15,369 - 15,369
Carrying amounts
Balance at 31 December 2018 9,735 4,723 3,710 18,168
(b) (i) Bank
Cost
Balance at 1 January 2019 14,885 3,698 18,582
Additions 1 1,035 1,036
Reclassifications 123 (123) -
Disposal - (11) (11)
Transfers* - (187) (187)
Exchange difference 3 - 3
Balance at 30 June 2019 15,013 4,412 19,424
Amortization
Balance at 1 January 2019 11,672 - 11,672
Amortisation for the period 693 - 693
Exchange difference 3 - 3
Balance at 30 June 2019 12,368 - 12,368
Carrying amounts
Balance at 30 June 2019 2,645 4,412 7,056
Page 128 of 155 Consolidated and Separate Financial Statements for the period ended 30 June, 2019

United Bank for Africa Plc
Notes to the financial statements
(ii) Bank Purchased Work in
Cost software progress Total
In millions of Nigerian Naira
Balance at 1 January 2018 13,683 2,533 16,216
Additions 274 2,346 2,621
Reclassifications 926 (926) -
Disposal - (33) (33)
Transfers* 2 (233) (231)
Exchange difference - 11 11
Balance at 31 December 2018 14,885 3,698 18,583
Amortization
Balance at 1 January 2018 10,370 - 10,370
Amortisation for the year 1,302 - 1,302
Balance at 31 December 2018 11,672 - 11,672
Carrying amounts
Balance at 31 December 2018 3,213 3,698 6,911
Impairment testing for cash-generating units containing Goodwill
UBA Benin UBA UK
Limited
Jun. 2019 Jun. 2019 Jun. 2019 Jun. 2019
11.0 11.0 12.0 12.0
15.0 5.0 10.0 10.0
15.0 10.0 12.0 12.0
10.0 5.0 7.0 7.0
Terminal growth rate (%) 1.5 2.0 2.0 2.0
Discount rate (pre-tax) (%) 18.5 6.6 5.0 5.0
Assumption
Gross earnings
Deposits
* Transfers represents reclassification of items from property and equipment (work in progress) to intangible assets - purchased
software (work in progress) during the period as disclosed in Note 30.
There were no capitalised borrowing costs related to the internal development of software during the period (December 2018: nil).
Computer software has a definite useful life of not more than five years while goodwill has an indefinite useful life and is annually
assessed for impairment.
This is the average annual growth rate over the five-year period. Deposits have
been determined to be the key value driver for the CGUs. Projected deposits
growth is based on past performance of the CGUs as well as management's plans
to expand the businesses and deepen customer base.
For the purpose of impairment testing, goodwill acquired through business combinations is allocated to cash generating units
(CGUs) as the goodwill is monitored at the level of the individual cash generating units. UBA Benin and UBA UK Limited have been
identified as individual cash generating units. UBA Benin and UBA UK Limited operate under Rest of Africa and Rest of the World
geographic segments respectively. The recoverable amounts of the CGUs have been determined based on value-in-use
calculations; using cash flow projections based on financial forecasts covering a period of five years. Cash flows beyond the five-
year period are extrapolated using estimated economic growth rates for the respective CGUs. These growth rates are consistent
with forecasts included in industry reports specific to the economic environment in which each of the CGU's operates.
The following table sets out the key assumptions used in the value-in-use calculations:
UBA UK Limited
Gross earnings ( % annual growth rate)
Deposits (% annual growth rate)
Loans and advances (% annual growth rate)
Operating expenses (% annual growth rate)
The values assigned to each of the above key assumptions were determined as follows:
Approach used in determining values
This is the average annual growth rate over the five-year period. Based on past
performance, expectations of market development and the expected positive
impact of deposits and loan growth in the forecast period.
Page 129 of 155 Consolidated and Separate Financial Statements for the period ended 30 June, 2019

United Bank for Africa Plc
Notes to the financial statements
Loans and advances
Operating expenses
Terminal growth rate
Discount rate
Jun. 2019 Dec. 2018 Jun. 2019 Dec. 2018
In millions of Nigerian Naira
Recoverable amount 33,788 33,788 48,818 48,818
Less: Carrying amount
Goodwill (5,589) (5,779) (3,976) (3,956)
Net assets (12,244) (12,025) (18,674) (16,497)
Total carrying amount (17,833) (17,804) (22,650) (20,453)
15,955 15,984 26,168 28,365
% % % %
UBA Benin From To From To
Deposit growth rate 15.0 8.1 15.0 8.1
Discount rate 18.5 36.9 18.5 36.9
UBA UK Limited
Deposit growth rate 5.0 1.1 5.0 1.1
Discount rate 6.6 16.0 6.6 16.0
Management have considered and assessed reasonably possible changes for other key assumptions and have not identified any
instances that could cause the carrying amount of the respective CGUs to exceed their recoverable amounts.
This is the average annual growth rate over the five year period. It is based partly
on past performance but largely on the expected positive impact of the
forecasted growth in deposits.This is the average annual growth rate over the five year period. It is based on the
current structure of business of the respective CGUs, adjusting for expected
inflationary increases but not reflecting any future restructurings or cost saving
This is the average growth rate used to extrapolate cash flows beyond the five-year
period. Based on estimated economic growth rates for the respective CGUs.
The discount rate was a pre-tax measure based on the longest tenured
government bond issued by the governments in Benin and United Kingdom
respectively adjusted for a risk premium to reflect both the increased risk of
investing in equities and generally and the systematic risk of the specific CGU.
Below is the result of the impairment test:
UBA Benin UBA UK Limited
Excess of recoverable amount over carrying amount
The key assumptions described above may change as economic and market conditions change. The results of the value-in-use
calculations are most sensitive to changes in the deposit growth rates, terminal growth rates and discount rates applied. The
recoverable amounts of the respective CGUs would equal their carrying amounts if these key assumptions were to change as
follows:
Jun. 2019 Dec. 2018
Page 130 of 155 Consolidated and Separate Financial Statements for the period ended 30 June, 2019

United Bank for Africa Plc
Notes to the financial statements
32 Deferred tax assets and liabilities
Recognised deferred tax assets and liabilities
Deferred tax assets and liabilities are attributable to the following:
In millions of Nigerian Naira
(a) 30 June 2019 Assets Liabilities Net Assets Liabilities Net
Property, equipment, and software 17,840 137 17,703 14,626 - 14,626
Allowances for loan losses 7,117 - 7,117 7,111 - 7,111
Account receivable/tax on financial assets at
FVOCI
695 - 695 695 - 695
Tax losses carried forward 10,795 - 10,795 10,779 - 10,779
Prior year DTA written-off in FY2018 247 5,316 (5,069) - 5,316 (5,316)
Current Year DTA in SOCIE Not Recognised - 1,440 (1,440) - 1,440 (1,440)
Current Year DTA in SOCI Not Recognised - 7,625 (7,625) - 7,625 (7,625)
Exchange difference on monetary items - - - - - -
Fair value gain on derivatives - 8,069 (8,069) - 8,069 (8,069)
Loss on revaluation of investment securities - (1,440) 1,440 - (1,440) 1,440
Foreign currency revaluation Loss - (7,410) 7,410 - (9,368) 9,368
Others 293 - 293 293 - 293
Net deferred tax assets /liabilities 36,987 13,737 23,250 33,504 11,642 21,862
In millions of Nigerian Naira
31 December 2018 Assets Liabilities Net Assets Liabilities Net
Property, equipment, and software 17,734 28 17,706 14,626 - 14,626
Allowances for loan losses 7,111 - 7,111 7,111 - 7,111
Account receivable/tax on financial assets at FVOCI 695 - 695 695 - 695
Tax losses carried forward 10,779 - 10,779 10,779 - 10,779
Prior year DTA written-off in FY2018 - 5,316 (5,316) - 5,316 (5,316)
Current Year DTA in SOCIE Not Recognised - 1,440 (1,440) - 1,440 (1,440)
Current Year DTA in SOCI Not Recognised - 7,625 (7,625) - 7,625 (7,625)
Exchange difference on monetary items - - - - - -
Fair value gain on derivatives - 8,069 (8,069) - 8,069 (8,069)
Loss on revaluation of investment securities - (1,440) 1,440 - (1,440) 1,440
Foreign currency revaluation Loss - (9,368) 9,368 - (9,368) 9,368
Others 293 - 293 293 - 293
Net deferred tax assets /liabilities 36,612 11,670 24,942 33,504 11,642 21,862
Group Bank
Group Bank
Page 131 of 155 Consolidated and Separate Financial Statements for the period ended 30 June, 2019

United Bank for Africa Plc
Notes to the financial statements
(b) Reconciliation of recognised deferred tax assets and liabilities to the amounts disclosed in the statement of financial position
(i) Deferred tax assets
Group Group Bank Bank
In millions of Nigerian Naira Jun. 2019 Dec. 2018 Jun. 2019 Dec. 2018
Recognised deferred tax assets 36,987 36,612 33,504 33,504
Amounts offset*:
- Fair value gain on derivatives (8,069) (8,097) (8,069) (8,069)
- Unwound fair value gain - - - -
Property, equipment, and software (137)
Prior year DTA written-off in FY2018 (5,316) (5,316) (5,316) (5,316)
Current Year DTA in SOCIE Not Recognised (1,440) (1,440) (1,440) (1,440)
Current Year DTA in SOCI Not Recognised (7,625) (7,625) (7,625) (7,625)
Loss on revaluation of investment securities 1,440 1,440 1,440 1,440
Foreign currency revaluation Loss 7,410 9,368 9,368 9,368
Deferred tax assets in the statement of financial position 23,250 24,942 21,862 21,862
(ii) Deferred tax liabilities Group Group Bank Bank
Jun. 2019 Dec. 2018 Jun. 2019 Dec. 2018
In millions of Nigerian Naira
Recognised deferred tax liabilities 13,737 11,670 11,642 11,642
Amounts offset*:
Loss on revaluation of investment securities 1,440 1,440 1,440 1,440
Foreign currency revaluation Loss 7,410 9,368 9,368 9,368
- Fair value gain on derivatives (8,069) (8,069) (8,069) (8,069)
Prior year DTA written-off in FY2018 (5,316) (5,316) (5,316) (5,316)
Current Year DTA in SOCIE Not Recognised (1,440) (1,440) (1,440) (1,440)
Current Year DTA in SOCI Not Recognised (7,625) (7,625) (7,625) (7,625)
Deferred tax liabilities in the statement of financial position 137 28 - -
Movements in temporary differences during the period
30 June 2019
Group
In millions of Nigerian Naira Opening Recognised Recognised Closing
in profit or loss in equity balance
Property, equipment, and software 17,706 (3) - 17,703
Allowances for loan losses 7,111 6 - 7,117
Account receivable/tax on financial assets at FVOCI 695 - 695
Tax losses carried forward 10,779 16 - 10,795
Prior year DTA written-off in FY2018 (5,316) 247 - (5,069)
Current Year DTA in SOCIE Not Recognised (1,440) - (1,440)
Current Year DTA in SOCI Not Recognised (7,625) - (7,625)
Exchange difference on monetary items - - -
Fair value gain on derivatives (8,069) - (8,069)
Loss on revaluation of investment securities 1,178 262 - 1,440
Foreign currency revaluation Loss 9,368 (1,958) - 7,410
Others 293 - 293
24,680 (1,430) - 23,250
*The amounts offset relate to deferred tax liabilities attributable to the parent only. The amounts have been offset as the Bank has
the legal right to settle current tax amounts on a net basis and the deferred tax amounts are levied by the same tax authority.
Page 132 of 155 Consolidated and Separate Financial Statements for the period ended 30 June, 2019

United Bank for Africa Plc
Notes to the financial statements
Bank Recognised
In millions of Nigerian Naira Opening in profit or loss Recognised Closing
balance in equity balance
Property, equipment, and software 14,626 - - 14,626
Allowances for loan losses 7,111 - - 7,111
Account receivable/tax on financial assets at FVOCI 695 - - 695
Tax losses carried forward 10,779 - - 10,779
Prior year DTA written-off in FY2018 (5,316) - - (5,316)
Current Year DTA in SOCIE Not Recognised (1,440) - - (1,440)
Current Year DTA in SOCI Not Recognised (7,625) - - (7,625)
Exchange difference on monetary items - - - -
Fair value gain on derivatives (8,069) - - (8,069)
Loss on revaluation of investment securities 9,368 - - 1,440
Foreign currency revaluation Loss 1,440 - 9,368
Others 293 - - 293
21,862 - - 21,862
31 December 2018 Recognised
Group Opening in profit or loss Recognised Closing
In millions of Nigerian Naira balance in equity balance
Property, equipment, and software 15,203 2,528 (25) 17,706
Allowances for loan losses 3,783 3,328 - 7,111
Account receivable 672 23 - 695
Tax losses carried forward 8,643 2,136 - 10,779
Prior year DTA written-off in FY2018 - (5,316) - (5,316)
Current Year DTA in SOCIE Not Recognised - (1,440) - (1,440)
Current Year DTA in SOCI Not Recognised - (7,625) - (7,625)
Exchange difference on monetary items 436 (436) - -
Tax losses on fair value gain on derivatives (63) (8,006) - (8,069)
Foreign currency revaluation Loss - 9,368 - 9,368
Loss on revaluation of investment securities 852 326 - 1,178
Others - 293 - 293
29,526 (4,820) (25) 24,680
Bank Recognised
In millions of Nigerian Naira Opening in profit or loss Recognised Closing
balance in equity balance
Property, equipment, and software 12,855 1,771 - 14,626
Allowances for loan losses 3,783 3,328 - 7,111
Account receivable 672 23 - 695
Tax losses carried forward 8,643 2,136 - 10,779
Prior year DTA written-off in FY2018 - (5,316) - (5,316)
Current Year DTA in SOCIE Not Recognised - (1,440) - (1,440)
Current Year DTA in SOCI Not Recognised - (7,625) - (7,625)
Exchange difference on monetary items 436 (436) - -
Tax losses on fair value gain on derivatives (63) (8,006) - (8,069)
Foreign currency revaluation Loss - 9,368 - 9,368
Loss on revaluation of investment securities 852 588 - 1,440
Others - 293 - 293
27,178 (5,316) - 21,862
Page 133 of 155 Consolidated and Separate Financial Statements for the period ended 30 June, 2019

United Bank for Africa Plc
Notes to the financial statements
33 Derivative financial instruments
In millions of Nigerian Naira
Group Group Bank Bank
Derivative assets Jun. 2019 Dec. 2018 Jun. 2019 Dec. 2018
Carrying value 41,948 34,784 41,948 34,784
Notional amount 422,012 318,172 422,012 318,172
Derivative liabilities
Carrying value 1,285 99 1,285 99
Notional amount 193,058 18,815 193,058 18,815
(a) Derivative assets
In millions of Nigerian Naira
Instrument type:
Cross-currency swaps 36,960 34,776 36,960 34,776
Foreign exchange forward contracts 4,988 8 4,988 8
41,948 34,784 41,948 34,784
The movement in derivative assets is as follows:
Balance, beginning of period 34,784 8,227 34,784 7,911
Fair value of derivatives derecognised/remeasured in the period (34,784) (8,227) (34,784) (7,911)
Fair value of derivatives acquired/remeasured in the period 41,948 34,784 41,948 34,784
Balance, end of period 41,948 34,784 41,948 34,784
Derivative assets are current in nature
(b) Derivative liabilities Group Group Bank Bank
In millions of Nigerian Naira Jun. 2019 Dec. 2018 Jun. 2019 Dec. 2018
Instrument type:
Cross-currency swap 978 34 978 34
Foreign exchange forward contracts 307 65 307 65
1,285 99 1,285 99
The movement in derivative liability is as follows:
Balance, beginning of period 99 123 99 123
Fair value of derivatives derecognised/remeasured in the period (99) (123) (99) (123)
Fair value of derivatives acquired/remeasured in the period 1,285 99 1,285 99
Balance, end of period 1,285 99 1,285 99
Derivative liabilities are current in nature
Group Group Bank Bank
(c ) Fair value gain on derivatives Jun. 2019 Jun. 2018 Jun. 2019 Jun. 2018
Derivative assets :
Fair value gain on additions in the period 41,948 20,759 41,948 21,074
Fair value loss on maturities in the period (34,784) (8,227) (34,784) (8,227)
Net fair value gain on derivative assets 7,164 12,532 7,164 12,847
Derivative liabilities:
Fair value loss on additions in the period (1,285) (44) (1,285) (44)
Fair value gain on maturities in the period 99 123 99 123
Net fair value gain on derivative liabilities (1,186) 79 (1,186) 79
5,979 12,611 5,979 12,926
The table below shows the fair values of derivative financial instruments recorded as assets or liabilities together with their notional
amounts. The notional amount which is recorded gross, is the amount of a derivative's underlying asset, reference rate or index and
is the basis upon which changes in the value of derivatives are measured. The notional amounts indicate the volume of transactions
outstanding at period end and are indicative of neither the market risk nor the credit risk.
Net fair value gain/(loss) on derivative assets and liabilities (note 15)
Page 134 of 155 Consolidated and Separate Financial Statements for the period ended 30 June, 2019

United Bank for Africa Plc
Notes to the financial statements
34 Deposits from banks Group Group Group Group Bank Bank
In millions of Nigerian Naira Dec. 2013 Dec. 2012 Jun. 2019 Dec. 2018 Jun. 2019 Dec. 2018
Money market deposits 119,407 153,419 482 11,610
Due to other banks 51,784 21,417 25,126 18,892
171,191 174,836 25,608 30,502
Current 171,191 174,836 25,608 30,502
35 Deposits from customers Group Group Bank Bank
In millions of Nigerian Naira Dec. 2013 Dec. 2012 Jun. 2019 Dec. 2018 Jun. 2019 Dec. 2018
Retail customers:
Term deposits 478,199 353,247 403,868 270,968
Current deposits 608,252 663,514 465,473 512,468
Savings deposits 752,214 701,980 623,772 578,963
Corporate customers:
Term deposits 438,239 419,230 324,252 308,871
Current deposits 1,233,333 1,211,149 740,001 752,838
3,510,237 3,349,120 2,557,366 2,424,108
Current 3,510,212 3,348,658 2,557,341 2,423,646
Non-current 25 462 25 462
3,510,237 3,349,120 2,557,366 2,424,108
36 Other liabilities Group Group Bank Bank
Jun. 2019 Dec. 2018 Jun. 2019 Dec. 2018
In millions of Nigerian Naira Dec. 2014 Dec. 2014
Financial liabilities
Creditors and payables 97,054 61,762 63,766 41,735
Managers cheques 4,278 5,233 3,051 3,728
Unclaimed dividends (note (i)) 7,508 7,076 7,508 7,076
Customers' deposit for foreign trade (note (ii)) 21,609 27,793 18,016 24,410
Lease Liabilities 1,808 - 1,689 -
132,257 101,864 94,030 76,949
Non-financial liabilities
Provisions (note (iii)) 255 252 147 147
Allowance for credit losses on off-balance sheet items (note (iv)) 4,722 3,264 4,443 2,679
Deferred income 332 319 332 319
Accrued expenses 13,319 15,065 3,304 4,205
18,628 18,900 8,226 7,350
Total other liabilities 150,885 120,764 102,256 84,299
Current 150,885 120,764 102,256 84,299
(i)
(ii)
(iii)
The amount represents unclaimed dividends due to UBA Plc's shareholders which have been returned by the Bank's Registrar.
Customers' deposit for foreign trade represents the naira value of foreign currencies held to cover letter of credit transactions. The
corresponding balance is included in current balances with banks in note 22.
The amount represents a provision for certain legal claims. The provision charge is recognised in income statement within ‘other
operating expenses’. In the directors’ opinion, after taking appropriate legal advice, the outcome of these legal claims will not give
rise to any significant loss beyond the amounts provided at 30 June 2019. The expected timing of the cashflows arising from the legal
claim provision is within 1 year.
Page 135 of 155 Consolidated and Separate Financial Statements for the period ended 30 June, 2019

United Bank for Africa Plc
Notes to the financial statements
The movement in provision during the period is as follows:
Group Group Bank Bank
In millions of Nigerian Naira Jun. 2019 Dec. 2018 Jun. 2019 Dec. 2018
At 1 January (legal claims provisions) 252 252 147 147
At 1 January (Off balance sheet provisions) 3,264 - 2,679
Additional provisions (legal claims provisions) 3 3,264 - 2,679
Additional provisions (off balance sheet provisions) 1,458 - 1,764 -
At 30 June 4,977 3,516 4,590 2,826
Analysis of total provisions:
Current 4,977 3,516 2,826 2,826
(iv)
37 Borrowings Group Group Bank Bank
In millions of Nigerian Naira Jun. 2019 Dec. 2018 Jun. 2019 Dec. 2018
- Central Bank of Nigeria (note 37.1) 78,944 85,380 78,944 85,380
- Bank of Industry (BoI) (note 37.2) 7,000 7,708 7,000 7,708
- European Investment Bank (EIB) (note 37.4) 23,378 23,539 23,378 23,539
- Africa Trade Finance Limited (note 37.5) 25,742 43,359 25,742 25,419
- African Development Bank (note 37.6) 50,569 54,842 50,569 54,842
- Credit Suisse (note 37.7) 108,490 108,065 108,490 108,065
- Eurobond debt security (note 37.8) 178,734 177,634 178,734 177,634
- JP Morgan Securities Limited (note 37.9) 72,373 72,062 72,373 72,062
-Societe Generale Bank (note 37.11) 36,124 35,967 36,124 35,967
-Mashreqbank psc (note 37.12) 18,054 17,969 18,054 17,969
-Rand Merchant Bank (note 37.13) 27,160 27,015 27,160 27,015
-ABSA Bank Limited (note 37.14) 27,061 21,534 27,061 21,534
-International Finance Corporation (IFC) (note 37.15) - 8,458 - -
-Sumitomo Mitsui Banking Corporation (SMBCE) (note 37.16) 36,008 - 36,008 -
689,637 683,532 689,637 657,134
Current 233,911 202,180 233,911 202,180
Non-current 455,726 481,352 455,726 454,954
689,637 683,532 689,637 657,134
Movement in borrowings during the period:
Group Group Bank Bank In millions of Nigerian Naira Dec. 2015 Dec. 2014 Dec. 2015 Dec. 2014
Opening balance 683,532 502,209 657,134 502,209
Additions 46,508 235,128 46,508 235,128
Interest expense 18,445 35,151 18,113 33,509
Interest paid (24,940) (37,167) (24,940) (36,842)
Repayments (principal) (36,851) (116,117) (10,453) (116,117)
Exchange difference 2,943 64,328 3,275 39,247
689,637 683,532 689,637 657,134
2 37.1
2 (a)
2 (b)
This represents allowance for credit loss for off-balance sheet engagements such as loan commitments and financial guarantees
recognised upon adoption of IFRS 9.
This represents on-lending facilities provided by the Central Bank of Nigeria (CBN):
N30.138 billion of this facility represents the outstanding balance on the Commercial Agriculture Credit Scheme granted to the Bank
for the sole purpose of granting loans, at subsidised rates, to the agricultural sector. Interest on the facility cannot exceed 9% per
annum inclusive of all charges and is to be shared between the Bank and CBN at 7% and 2% respectively. The facility will terminate
on 30 September 2025. The Bank is the primary obligor to CBN and assumes the risk of default.
N24.912 billion of this facility represents the outstanding balance on the concessionary loans granted by the Central Bank of Nigeria
to some State Governments. The facility attracts an interest rate of 2% and the Bank is under obligation to lend to participating states
at a maximum rate of 9% per annum (inclusive of all charges). The principal is repayable monthly and the tenor of the facility is 20
years.
Page 136 of 155 Consolidated and Separate Financial Statements for the period ended 30 June, 2019
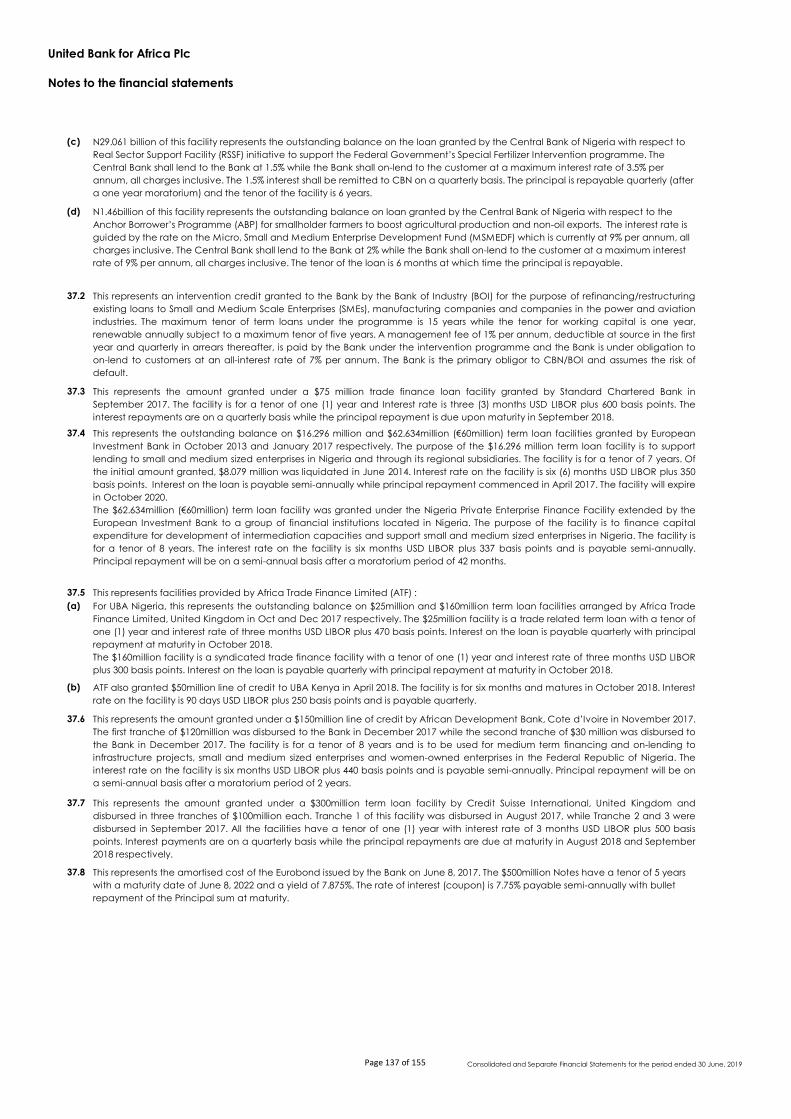
United Bank for Africa Plc
Notes to the financial statements
(c)
(d)
3 37.2
5 37.3
7 37.4
37.5
(a)
(b)
37.6
37.7
37.8
This represents the amount granted under a $75 million trade finance loan facility granted by Standard Chartered Bank in
September 2017. The facility is for a tenor of one (1) year and Interest rate is three (3) months USD LIBOR plus 600 basis points. The
interest repayments are on a quarterly basis while the principal repayment is due upon maturity in September 2018.
N29.061 billion of this facility represents the outstanding balance on the loan granted by the Central Bank of Nigeria with respect to
Real Sector Support Facility (RSSF) initiative to support the Federal Government’s Special Fertilizer Intervention programme. The
Central Bank shall lend to the Bank at 1.5% while the Bank shall on-lend to the customer at a maximum interest rate of 3.5% per
annum, all charges inclusive. The 1.5% interest shall be remitted to CBN on a quarterly basis. The principal is repayable quarterly (after
a one year moratorium) and the tenor of the facility is 6 years.
N1.46billion of this facility represents the outstanding balance on loan granted by the Central Bank of Nigeria with respect to the
Anchor Borrower’s Programme (ABP) for smallholder farmers to boost agricultural production and non-oil exports. The interest rate is
guided by the rate on the Micro, Small and Medium Enterprise Development Fund (MSMEDF) which is currently at 9% per annum, all
charges inclusive. The Central Bank shall lend to the Bank at 2% while the Bank shall on-lend to the customer at a maximum interest
rate of 9% per annum, all charges inclusive. The tenor of the loan is 6 months at which time the principal is repayable.
This represents an intervention credit granted to the Bank by the Bank of Industry (BOI) for the purpose of refinancing/restructuring
existing loans to Small and Medium Scale Enterprises (SMEs), manufacturing companies and companies in the power and aviation
industries. The maximum tenor of term loans under the programme is 15 years while the tenor for working capital is one year,
renewable annually subject to a maximum tenor of five years. A management fee of 1% per annum, deductible at source in the first
year and quarterly in arrears thereafter, is paid by the Bank under the intervention programme and the Bank is under obligation to
on-lend to customers at an all-interest rate of 7% per annum. The Bank is the primary obligor to CBN/BOI and assumes the risk of
default.
This represents the outstanding balance on $16.296 million and $62.634million (€60million) term loan facilities granted by European
Investment Bank in October 2013 and January 2017 respectively. The purpose of the $16.296 million term loan facility is to support
lending to small and medium sized enterprises in Nigeria and through its regional subsidiaries. The facility is for a tenor of 7 years. Of
the initial amount granted, $8.079 million was liquidated in June 2014. Interest rate on the facility is six (6) months USD LIBOR plus 350
basis points. Interest on the loan is payable semi-annually while principal repayment commenced in April 2017. The facility will expire
in October 2020.
The $62.634million (€60million) term loan facility was granted under the Nigeria Private Enterprise Finance Facility extended by the
European Investment Bank to a group of financial institutions located in Nigeria. The purpose of the facility is to finance capital
expenditure for development of intermediation capacities and support small and medium sized enterprises in Nigeria. The facility is
for a tenor of 8 years. The interest rate on the facility is six months USD LIBOR plus 337 basis points and is payable semi-annually.
Principal repayment will be on a semi-annual basis after a moratorium period of 42 months.
This represents facilities provided by Africa Trade Finance Limited (ATF) :
For UBA Nigeria, this represents the outstanding balance on $25million and $160million term loan facilities arranged by Africa Trade
Finance Limited, United Kingdom in Oct and Dec 2017 respectively. The $25million facility is a trade related term loan with a tenor of
one (1) year and interest rate of three months USD LIBOR plus 470 basis points. Interest on the loan is payable quarterly with principal
repayment at maturity in October 2018.
The $160million facility is a syndicated trade finance facility with a tenor of one (1) year and interest rate of three months USD LIBOR
plus 300 basis points. Interest on the loan is payable quarterly with principal repayment at maturity in October 2018.
ATF also granted $50million line of credit to UBA Kenya in April 2018. The facility is for six months and matures in October 2018. Interest
rate on the facility is 90 days USD LIBOR plus 250 basis points and is payable quarterly.
This represents the amount granted under a $150million line of credit by African Development Bank, Cote d’Ivoire in November 2017.
The first tranche of $120million was disbursed to the Bank in December 2017 while the second tranche of $30 million was disbursed to
the Bank in December 2017. The facility is for a tenor of 8 years and is to be used for medium term financing and on-lending to
infrastructure projects, small and medium sized enterprises and women-owned enterprises in the Federal Republic of Nigeria. The
interest rate on the facility is six months USD LIBOR plus 440 basis points and is payable semi-annually. Principal repayment will be on
a semi-annual basis after a moratorium period of 2 years.
This represents the amount granted under a $300million term loan facility by Credit Suisse International, United Kingdom and
disbursed in three tranches of $100million each. Tranche 1 of this facility was disbursed in August 2017, while Tranche 2 and 3 were
disbursed in September 2017. All the facilities have a tenor of one (1) year with interest rate of 3 months USD LIBOR plus 500 basis
points. Interest payments are on a quarterly basis while the principal repayments are due at maturity in August 2018 and September
2018 respectively.
This represents the amortised cost of the Eurobond issued by the Bank on June 8, 2017. The $500million Notes have a tenor of 5 years
with a maturity date of June 8, 2022 and a yield of 7.875%. The rate of interest (coupon) is 7.75% payable semi-annually with bullet
repayment of the Principal sum at maturity.
Page 137 of 155 Consolidated and Separate Financial Statements for the period ended 30 June, 2019

United Bank for Africa Plc
Notes to the financial statements
37.9
37.10
37.11
37.1
37.1
37.1
37.2
(a)
(b)
37.2
Group Group Bank Bank
38 Subordinated liabilities Jun. 2019 Dec. 2018 Jun. 2019 Dec. 2018
In millions of Nigerian Naira
Medium term notes - series 3 29,976 29,859 29,976 29,859
29,976 29,859 29,976 29,859
Current - 5,017 - 5,017
Non-current 29,976 24,842 29,976 24,842
29,976 29,859 29,976 29,859
Movement in subordinated liabilities:
Group Group Bank Bank
In millions of Nigerian Naira Jun. 2019 Dec. 2018 Jun. 2019 Dec. 2018
Opening balance 29,859 65,741 29,859 65,741
Interest accrued 2,605 9,032 2,605 9,032
Interest paid (2,488) (9,897) (2,488) (9,897)
Repayments - (35,017) - (35,017)
29,976 29,859 29,976 29,859
This represents the amount granted under a $75 million trade finance loan facility granted by Rand Merchant Bank in December
2018. The facility is for a tenor of six (6) months and Interest rate is six (6) months USD LIBOR plus 300 basis points. The interest and
principal repayments are due upon maturity in June 2019.
This represents the outstanding balance on $100million and $100million trade finance loan facilities granted by JP Morgan in August
and December 2018. The facilities are for a tenor of one year and Interest rate is three (3) months USD LIBOR plus 222 basis points. The
interest payments are on a quarterly basis while principal repayments are due upon maturity in August and December 2019
respectively.
This represents the amount granted under a $50 million trade finance loan facility granted by Standard Bank of South Africa Ltd in
September 2017. The facility is for a tenor of nine (9) months and Interest rate is three (3) months USD LIBOR plus 565 basis points. The
interest repayments were serviced on a quarterly basis while the principal repayment was due upon maturity in June 2018.
This represents the amount granted under a $100 million trade finance loan facility granted by Societe Generale Bank in September
2018. The facility is for one year and Interest rate is three (3) months USD LIBOR plus 220 basis points. The interest and principal
repayments are due upon maturity in September 2019.
This represents the amount granted under a $50 million trade finance loan facility granted by Mashreqbank psc in December 2018.
The facility is for a tenor of six (6) months and Interest rate is six (6) months USD LIBOR plus 300 basis points. The interest and principal
repayments are due upon maturity in June 2019.
This represents the amount granted under a $60 million trade finance loan facility granted by ABSA Bank Ltd in December 2018. The
facility is for a tenor of six (6) months and Interest rate is six (6) months USD LIBOR plus 300 basis points. The interest and principal
repayments are due upon maturity in June 2019.
This represents facilities provided by International FInance Corporation (IFC):
This represents the amount granted to UBA Ghana under a $25 million term loan facility granted by International FInance
Corporation (IFC) in February 2018. The facility is for a tenor of five (5) years and Interest rate is six (6) months USD LIBOR plus 525 basis
points paid quarterly. The principal repayment will be on a semi-annual basis after a two-year moratorium period.
This represents the amount granted to UBA Liberia under a $2 million term loan facility granted by International FInance Corporation
(IFC). The facility is for a tenor of two (2) years and Interest rate is 8.25% paid semi-annually while the principal repayment is due upon
maturity
This represents the amount granted under a $100 million trade finance loan facility granted by Sumitomo Mitsui Banking Corporation
Europe Limited (SMBCE) in May 2019. The facility is for a tenor of twelve (12) months and Interest rate is three (3) months USD ICE
LIBOR of 2.60%. The interest is payable quarterly in arrears while the principal repayment is due upon maturity in May 2020.
Subordinated liabilities represent medium-term bonds issued by the Bank. In September 2011, the Bank offered N35billion fixed rate
subordinated unsecured notes, maturing in 2018 with a coupon of 14%. In December 2014, the Bank also offered N30.5 billion fixed
rate unsecured notes maturing in 2021 with a coupon of 16.45%. Coupon on the notes are payable semi-annually while principal is
payable on maturity.
Page 138 of 155 Consolidated and Separate Financial Statements for the period ended 30 June, 2019

United Bank for Africa Plc
Notes to the financial statements
39 Capital and reserves
(a) Share capital
Share capital comprises: Group Group Bank Bank
Jun. 2019 Dec. 2018 Jun. 2019 Dec. 2018
(i) Authorised -
45,000,000,000 Ordinary
shares of 50k each 22,500 22,500 22,500 22,500
(ii) Issued and fully paid -
34,199,421,366 Ordinary
shares of 50k each 17,100 17,100 17,100 17,100
The movement in the share capital account during the period is as follows:
In millions
Number of shares in issue at start of the period 34,200 34,200 34,200 34,200
Number of shares in issue at end of the period 34,200 34,200 34,200 34,200
(b) Share premium
Share premium is the excess paid by shareholders over the nominal value for their shares.
(c) Retained earnings
(d) Other Reserves
Other reserves include the following: Group Group Bank Bank
Jun. 2019 Dec. 2018 Jun. 2019 Dec. 2018
In millions of Nigerian Naira
Translation reserve (note (i)) 8,703 18,178 - -
Statutory reserve (note (ii)) 90,783 90,783 74,603 74,603
Fair value reserve (note (iii)) 85,790 69,099 86,355 69,751
Regulatory (Credit) risk reserve (note (iv)) 27,594 21,521 29,512 15,212
Treasury shares (note (v)) - - -
212,870 199,581 190,470 159,566
(i) Translation reserve
(ii) Statutory reserve
Statutory reserve includes:
(iii) Fair value reserve
(iv) Regulatory (Credit) risk reserve
The regulatory (credit) risk reserve represents the difference between the impairment on loans and advances determined using the
prudential guidelines issued by the various Central Banks of the various operating jurisdictions compared with the expected credit loss
model used in determining the impairment loss under IFRSs.
Where the loan loss impairment determined using the prudential guidelines is greater than the loan loss impairment determined using the
expected credit loss model under IFRSs, the difference is transferred to regulatory credit risk reserve and it is non-distributable to owners of
the parent. When the prudential provisions is less than IFRS provisions, the excess charges resulting is transferred from the regulatory
reserve to retained earnings to the extent of the non-distributable reserve previously recognised.
Retained earnings is the carried forward recognised income net of expenses plus current period profit attributable to shareholders.
Translation reserve comprises all foreign exchange differences arising from translation of the financial statements of foreign operations.
- Statutory reserve: this represents the cumulative appropriation from earnings in accordance with existing legislation that require the
Bank to make an annual appropriation, In the current period, the Bank transferred NN6,157 billion billion representing 15% (2018: 15%) of
its profit after taxation to statutory reserves.
- Small and Medium Enterprises Equity Investment Scheme (SMEEIS) reserves of N2.635 billion as at 30 June 2019(December 2018: N2.635
billion) . The Bank has since suspended further appropriation to SMEEIS reserve in line with the directives of the Central Bank of Nigeria.
- Agriculture/Small and Medium Enterprises Equity Investment Scheme (AGSMEEIS) reserves of N4.499 billion as at 30 June 2019
(December 2018: N4.499). The reserve was set aside in compliance with Central Bank of Nigeria's directive of April 2017.
The fair value reserve includes the net cumulative change in the fair value of investments at fair value through other comprehensive
income. Such fair value changes are maintained until the investment is derecognised or impaired.
Page 139 of 155 Consolidated and Separate Financial Statements for the period ended 30 June, 2019

United Bank for Africa Plc
Notes to the financial statements
40 Dividends
41 Contingencies
(i) Litigation and claims
(ii) Contingent liabilities
Nature of instruments
Group Group Bank Bank
In millions of Nigerian naira Jun. 2019 Dec. 2018 Jun. 2019 Dec. 2018
Performance bonds and guarantees 411,298 428,043 314,885 307,680
Allowance for credit losses (4,119) (2,075) (3,850) (2,075)
Net carrying amount 407,179 425,968 311,035 305,605
Letters of credits 366,097 217,764 56,285 71,796
Allowance for credit losses (603) (604) (593) (604)
Net carrying amount 365,494 217,160 55,692 71,192
Gross amount 777,395 645,807 371,170 379,476
Total allowance for credit losses (4,722) (2,679) (4,443) (2,679)
Total carrying amount for performance bonds and guarantees 772,673 643,128 366,727 376,797
(iii) Loan commitments
The Board of Directors have proposed an interim dividend of N0.20 per share (30 June 2018: N0.20 per share) from the retained earnings
account as at 30 June 2019.
The number of shares in issue and ranking for dividend represents the outstanding number of shares as at 30 June 2019 and 31 December
2018 respectively.
Payment of dividend to shareholders is subject to withholding tax at a rate of 10%.
The Bank, in the ordinary course of business is currently involved in 834 legal cases (2018: 714). The total amount claimed in the cases
against the Bank is estimated at N618.3billion (2018: N745.45billion). The directors having sought the advice of professional legal counsel,
are of the opinion that no significant liability will crystalise from these cases beyond the provision made in the financial statements.
In the normal course of business, the Group conducts business involving acceptances, performance bonds and indemnities. Contingent
liabilities and commitments comprise acceptances, endorsements, guarantees and letters of credit.
An acceptance is an undertaking by a bank to pay a bill of exchange drawn on a customer. The Group expects most acceptances to
be presented, but reimbursement by the customer is normally immediate. Endorsements are residual liabilities of the Group in respect of
bills of exchange, which have been paid and subsequently rediscounted.
Guarantees and letters of credit are given to third parties as security to support the performance of a customer to third parties. As the
Group will only be required to meet these obligations in the event of the customer’s default, the cash requirements of these instruments
are expected to be considerably below their nominal amounts.
Other contingent liabilities include performance bonds and are, generally, short-term commitments to third parties which are not directly
dependent on the customers’ credit worthiness.
Documentary credits commit the Group to make payments to third parties, on production of documents, which are usually reimbursed
immediately by customers.
The following tables summarise the nominal principal amount of contingent liabilities and commitments with off-balance sheet risk. There
are no guarantees, commitments or other contingent liabilities arising from related party transactions.
Loan commitments are irrevocable commitments to provide credits under pre-specified terms and conditions. The Group's loan
commitments are usually conditioned on the maintenance of a satisfactory financial standing by the customer and absence of defaults
on other covenants. At the balance sheet date, the Group had loan commitments amounting to N124 billion (December 2018: N159
billion) in respect of various loan contracts.
Page 140 of 155 Consolidated and Separate Financial Statements for the period ended 30 June, 2019

United Bank for Africa Plc
Notes to the financial statements
(iii) Capital commitments
Group Group
Jun. 2019 Dec. 2018
In millions of Nigerian naira
Property and equipment 973 6,118
Intangible assets 2,314 2,012
3,287 8,130
42 Related parties and insider related credits
(a) Subsidiaries
(i) Cash and cash equivalents with the following subsidiaries are:
Name of Subsidiary Nature of Balance Jun. 2019 Dec. 2018
In millions of Nigerian naira
UBA Senegal Money market placement 61,225 206
UBA Tanzania Money market placement 852 436
UBA Kenya Money market placement 1,991 1,977
UBA Ghana Money market placement 9,088 9,712
UBA UK Limited Money market placement 34,572 32,595
107,727 44,926
(ii) Loan and advances
Name of Subsidiary Type of Loan Jun. 2019 Dec. 2018
In millions of Nigerian naira
UBA Tanzania Term Loans 1,082 1,652
UBA Cameroun Overdraft 2,799 255
UBA Senegal Overdraft - 54
UBA Gabon Overdraft 1,696 251
UBA Chad Overdraft 41 -
UBA Cote D'Ivoire Overdraft 45 120
UBA Congo Brazzaville Overdraft 197 1,512
UBA Benin Overdraft 3,268 1,968
UBA Burkina Faso Overdraft 3,217 3,324
12,344 9,136
Term loans to subsidiaries are unsecured.
Capital commitments are irrevocable contractual commitments for the acquisition of items of property and equipment or intangible
assets. At the balance sheet date, the Group had capital commitments amounting to N3.287 billion (December 2018: N8.130 billion) in
respect of authorised and contracted capital projects.
United Bank for Africa Plc (UBA Plc) is the ultimate parent/controlling party of the Group. The shares of UBA Plc are listed on the Nigerian
Stock Exchange and held by widely varied investors.
Parties are considered to be related if one party has the ability to control the other party or exercise influence over the other party in
making financial and operational decisions, or one other party controls both. The definition includes subsidiaries, associates, joint ventures
as well as key management personnel.
Transactions between United Bank for Africa Plc and the subsidiaries also meet the definition of related party transactions. Where these
are eliminated on consolidation, they are not disclosed in the consolidated financial statements but are disclosed in the books of the
Bank. The Bank's transactions and balances with its subsidiaries during the period and at period end are as follows:
Page 141 of 155 Consolidated and Separate Financial Statements for the period ended 30 June, 2019

United Bank for Africa Plc
Notes to the financial statements
(iii) Deposits
Name of Subsidiary Type of Deposit Jun. 2019 Dec. 2018
In millions of Nigerian naira
UBA Benin Current 5 -
UBA Mali Current 1 -
UBA Chad Current 0 2
UBA Congo DRC Current 8 -
UBA Cote D'Ivoire Current 4 25
UBA Congo Brazzaville Current 11 17
Burkina Faso Current 6 -
UBA Ghana Current 5 14
UBA Mozambique Current 1 3
UBA Pension Custodian Current 9 6
UBA Kenya Current 175 1,117
UBA Guinea Current 4 3
UBA Senegal Current 1 3
UBA Tanzania Current 2 18
UBA Uganda Current 23 167
UBA Gabon Current 3 6
UBA Liberia Current 11 22
UBA Sierra Leone Current - 47
UBA Cameroon Current 7 9
UBA Burkina Faso Domiciliary 291 -
UBA Cote D'Ivoire Domiciliary 67 90,252
UBA Gabon Domiciliary 2 127
UBA Cameroon Domiciliary 1 40
UBA Benin Domiciliary 7 7
UBA Ghana Domiciliary 96 703
UBA Senegal Domiciliary 273 44
UBA Guinea Domiciliary 64 45
UBA Sierra Leone Domiciliary 1 6
UBA Tanzania Domiciliary 36 34
UBA Uganda Domiciliary 58 103
UBA Kenya Domiciliary 21 39
UBA Liberia Domiciliary 1,384 4,261
UBA Congo Brazzaville Domiciliary 86 38
UBA Mozambique Domiciliary 23 21
UBA Chad Domiciliary - 23
UBA Congo DRC Domiciliary 1,976 1,554
UBA Mali Domiciliary 303 -
UBA UK Limited Term deposit 25,742 26,428
UBA Ghana Money market deposit - 915
UBA Uganda Money market deposit - 915
UBA Burkina Faso Money market deposit 1,641 1,643
UBA UK Limited Money market deposit - 3,598
UBA Kenya Money market deposit 620 -
UBA Pension Custodian Money market deposit 95 451
33,063 132,706
Page 142 of 155 Consolidated and Separate Financial Statements for the period ended 30 June, 2019

United Bank for Africa Plc
Notes to the financial statements
Jun. 2019 Dec. 2018
(iv) Accounts receivable from the following subsidiaries are:
UBA Ghana Accounts receivable 2,791 2,578
UBA Congo Brazzaville Accounts receivable 251 1,078
UBA Gabon Accounts receivable 205 340
UBA Guinea Accounts receivable 492 380
UBA Senegal Accounts receivable 490 1,209
UBA Chad Accounts receivable 192 134
UBA Retail Financial ServicesAccounts receivable - 131
UBA Sierra Leone Accounts receivable 72 55
UBA Liberia Accounts receivable 115 119
UBA Benin Accounts receivable 672 558
UBA Cameroon Accounts receivable 95 281
UBA Burkina Faso Accounts receivable 1,215 957
UBA Uganda Accounts receivable 275 217
UBA Tanzania Accounts receivable 121 102
UBA Cote D'Ivoire Accounts receivable 868 710
UBA DRC Congo Accounts receivable 204 145
UBA Kenya Accounts receivable 40 24
UBA Mozambique Accounts receivable 34 11
UBA Mali Accounts receivable 222
8,353 9,029
In millions of Nigerian naira Jun. 2019 Dec. 2018
(v) Dividend receivable from the following subsidiaries are:
UBA Cameroon 2,209 1,005
UBA Liberia 335 335
UBA Sierra Leone 762 762
UBA Senegal 1,353 642
UBA Chad 791 -
UBA Gabon 963 -
UBA Pension Custodian - 3,006
6,413 5,750
Jun. 2019 June. 2018
(vi) Internal transfer pricing charges from the following subsidiaries are:
UBA Ghana 207 182
UBA Burkina Faso 320 338
UBA Congo Brazaville 91 120
UBA Senegal 212 291
UBA Chad 70 105
UBA Benin 136 195
UBA Cameroun 119 145
UBA Cote d' Ivoire 200 172
UBA Gabon 96 103
UBA Liberia 87 56
UBA Guinea Conakry 63 59
UBA Sierra Leone 81 63
UBA Tanzania 23 65
UBA Congo DRC 70 84
UBA Kenya 18 3
UBA Mozambique 28 1
UBA Mali 11 -
UBA Uganda 69 -
UBA Pension 64 174
1,964 2,156
Page 143 of 155 Consolidated and Separate Financial Statements for the period ended 30 June, 2019

United Bank for Africa Plc
Notes to the financial statements
(c.) Key management personnel
Loans and advances to key management personnel Jun. 2019 Dec. 2018
In millions of Nigerian Naira
Loans and advances as at period end 364 310
(ii)
Jun. 2019 June. 2018
Interest income earned during the period 21 24
42 Related parties - continued
In millions of Nigerian naira
Name of company/
individual
Name of Director Facility Type Security Status Rate Currency Jun. 2019 Dec. 2018
Bridge House College Mrs. Foluke
Abdulrazaq
Term loan
(Under CBN
MSMEDF)
Real
Estate
Performing 9.0% NGN 10 15
Heirs Holdings Mr. Tony O. Elumelu Term Loan Real
Estate
Performing 14.0% NGN 1,002 6,324
Heirs Holdings Mr. Tony O. Elumelu Term Loan Real
Estate
Performing 16.0% NGN 21,131 18,637
Aneke Angela Nkiruka Aneke Angela
Nkiruka
Overdraft Real
Estate
Performing 19.0% NGN 39
Abdulqadir J. Bello Abdulqadir J. Bello Term Loan Real
Estate
Performing 18.0% NGN 10 15
22,154 25,030
Jun. 2019 June. 2018
Interest income earned during the period 1,408 352
Deposit liabilities
Deposit liabilities relating to key management personnel and their related persons and entities as at end of the period is as follows:
In millions of Nigerian Naira Jun. 2019 Dec. 2018
Deposits as at period end 1,483 2,535
Jun. 2019 June. 2018
Interest expense during the period 2 8
Key management personnel are those persons having authority and responsibility for planning, directing and controlling the activities of
UBA Plc, directly or indirectly, including any director (whether executive or otherwise) of the Bank, and their close family members. Close
family members are those family who may be expected to influence, or be influenced by that individual in their dealings with UBA Plc
and its subsidiaries.
Key management personnel and their close family members engaged in the following transactions with the Bank during the period:
Loans to key management personnel are granted on the same terms and conditions as loans to other employees. Related party loans
are secured over real estate, equity and other assets of the respective borrowers. No impairment losses (2018: Nil) have been recorded
against related party loans.
Loans and advances to key management personnel's related persons and entities as at June 2019:
Page 144 of 155 Consolidated and Separate Financial Statements for the period ended 30 June, 2019

United Bank for Africa Plc
Notes to the financial statements
Compensation
Aggregate remuneration to key management staff during the period is as follows: Jun. 2019 June. 2018
In millions of Nigerian Naira
Executive compensation 404 404
Defined contribution plan 12 12
Total benefits cost 416 416
43 Compensation to Employees and Directors
(i) The number of persons in the employment of the Group and the Bank as at period end is as follows:
(In absolute units) Group Group Bank Bank
Jun. 2019 Dec. 2018 Jun. 2019 Dec. 2018
Group executive directors 9 9 9 9
Management 100 90 80 68
Non-management 13,015 12,790 9,586 9,505
13,124 12,889 9,675 9,582
Compensation for the above personnel (including executive directors): Jun. 2019 June. 2018 Jun. 2019 June. 2018
In millions of Nigerian Naira
Salaries and wages 35,867 33,984 20,160 19,812
Defined contribution plans 1,311 1,230 615 637
37,178 35,214 20,775 20,449
(ii)
(In absolute units)
Group Group Bank Bank
Jun. 2019 Dec. 2018 Jun. 2019 Dec. 2018
N300,001 - N2,000,000 7,281 6,496 5,005 4,988
N2,000,001 - N2,800,000 2,265 2,310 1,918 1,910
N2,800,001 - N3,500,000 304 257 1 -
N3,500,001 - N4,000,000 751 882 688 716
N4,000,001 - N5,500,000 547 625 316 304
N5,500,001 - N6,500,000 57 190 - -
N6,500,001 - N7,800,000 590 642 517 500
N7,800,001 - N9,000,000 402 454 372 359
N9,000,001 - above 918 1,024 849 796
13,115 12,880 9,666 9,573
(iii) Directors
In millions of Nigerian naira Jun. 2019 June. 2018 Jun. 2019 June. 2018
Remuneration paid to the Group's Directors was:
Fees and sitting allowances 18 13 18 13
Executive compensation 404 404 404 404
Defined contribution plan 12 12 12 12
434 429 434 429
Fees and other emoluments disclosed above includes amounts paid to:
The Chairman 1 1 1 1
The highest paid Director 70 70 70 70
(In absolute units)
N1,000,001 - N3,000,000 9 10 9 10
N3,000,001 - N5,000,000 - - - -
N5,000,001 and above 9 9 9 9
18 19 18 19
The number of Directors who received fees and other emoluments (excluding pension contributions) in the following ranges was:
The number of employees of the Group and the Bank, other than Directors, who received emoluments in the following ranges (excluding
pension contributions) were:
Page 145 of 155 Consolidated and Separate Financial Statements for the period ended 30 June, 2019

United Bank for Africa Plc
Notes to the financial statements
44
.45 Non-audit services
(i)
46 Compliance with banking regulations
In millions of Nigerian Naira
Description Amount
1 2
2 6
Total 8
47 Events after the reporting date
Transactions requiring regulatory approval
The estwhile rules of the Financial Reporting Council of Nigeria titled "Transactions requiring registration from statutory
bodies such as the National Office for Technology Acquisition and Promotion " which required that transactions or
agreements requiring registration by regulatory bodies in Nigeria be recognised in the financial statements to the
extent that approval is obtained had been revoked . Hence, all those events and transactions which were hitherto
required to be disclosed by way of note in the financial statetements are by this revocation non-required.
During the period, the Bank's external auditors (PricewaterhouseCoopers) rendered the following non-audit service to
the Bank:
Training of selected UBA Plc employees on Fundamentals of Bank Financial Analysis. The total amount paid by UBA Plc
for this service was N500,000. This amount is included as part of training and human capital development expense in
"other operating expenses" in note 19.
During the period, the Bank paid the following penalties:
Late resolution of customer complaint
Deficiency in account documentation/late records retrieval
There were no significant events that have post-balance sheet adjustment effect, after the period ended 30 June,
2019.
Page 146 of 155 Consolidated and Separate Financial Statements for the period ended 30 June, 2019

United Bank for Africa Plc
Notes to the financial statements
48 Condensed result of consolidated subsidiaries
For the period ended 30 June 2019
UBA
Ghana
UBA
Liberia
UBA Cote
D' Ivoire
UBA
Senegal
UBA
Kenya
UBA
Guinea
UBA Gabon UBA Benin
In millions of Nigerian Naira
Condensed statements of comprehensive income
Operating income 16,345 1,780 6,117 5,165 2,881 1,574 3,531 5,425
Total operating expenses (7,418) (1,415) (3,743) (3,841) (2,733) (1,625) (1,955) (6,173)
Net impairment (loss)/gain on financial
assets
(416) (51) (255) (316) (50) (41) 56 1,616
Profit/(loss) before income tax 8,511 314 2,119 1,008 98 (92) 1,632 868
Income tax expense (2,431) - - (337) - - - -
Profit for the period 6,080 314 2,119 671 98 (92) 1,632 868
Condensed statements of financial position
Assets
Cash and bank balances 44,405 18,579 9,911 71,759 13,199 (2,902) 3,736 13,214
Financial assets at FVTPL 75 - - 916 - 15,645 - -
Loans and Advances to Banks 9,160 - - - - - - -
Loans and advances to customers 42,413 8,838 90,740 72,592 10,367 17,789 18,397 35,339
Investment securities 98,077 4,834 33,324 47,336 27,295 8,370 22,718 71,516
Other assets 1,992 1,829 - 1,271 2,634 2,287 2,572 2,048
Investments in Subsidiaries - - - - - - - -
Property and Equipment 2,985 791 523 1,042 322 541 2,467 2,134
Intangible assets 56 23 8 21 24 6 3 15
Deferred tax asset 70 2 - - 1,239 - - -
199,233 34,896 134,506 194,937 55,080 41,736 49,893 124,266
Financed by:
Deposits from banks 13,597 378 1,586 95,435 27,262 - - 22,342
Deposits from customers 136,597 27,779 113,989 78,468 19,236 34,658 33,662 86,907
Other liabilities 5,806 1,303 5,388 5,387 790 3,265 5,897 2,773
Current tax liability (169) - - - - - - -
Deferred tax liability 66 - - - - - - -
Total Equity 43,336 5,436 13,543 15,647 7,792 3,813 10,334 12,244
199,233 34,896 134,506 194,937 55,080 41,736 49,893 124,266
Condensed cash flows
Net cash from operating activities (30,972) (33) (74,658) 9,097 18,217 (5,848) (926) 1,003
Net cash from financing activities (4,969) (930) (331) (2,487) (17,845) (1,002) (361) (649)
Net cash from investing activities 45,484 (1,222) (3,124) 657 756 (6,043) (8,442) (1,586)
Increase/(decrease) in cash and cash
equivalents
9,543 (2,185) (78,113) 7,267 1,128 (12,893) (9,729) (1,232)
Cash and cash equivalents at
beginning of period
34,862 20,764 88,024 64,492 12,071 9,991 13,465 14,446
Cash and cash equivalents at end of
the period
44,405 18,579 9,911 71,759 13,199 (2,902) 3,736 13,214
Page 147 of 155 Consolidated and Separate Financial Statements for the period ended 30 June, 2019

United Bank for Africa Plc
Notes to the financial statements
Condensed result of consolidated subsidiaries continued
For the period ended 30 June 2019
UBA Sierra
Leone
UBA
Burkina
Faso
UBA Chad UBA
Uganda
UBA
Congo
Brazza-
ville
UBA
Mozambi
que
UBA
Cameroun
UBA Pension
Custodian
UBA Mali
In millions of Nigerian Naira
Condensed statements of comprehensive income
Operating income 2,432 6,381 3,243 1,962 9,869 1,095 10,156 3,108 536
Total operating expenses (1,099) (5,107) (1,668) (1,774) (5,766) (1,121) (5,823) (623) (1,169)
Net impairment gain/(loss) on financial
assets
- (101) (168) (6) (204) 12 (153) - 56
Profit before income tax 1,333 1,173 1,407 182 3,899 (14) 4,180 2,485 (577)
Income tax expense (295) (53) - - - - (1,437) - -
Profit for the period 1,038 1,120 1,407 182 3,899 (14) 2,743 2,485 (577)
Condensed statements of financial position
Assets
Cash and bank balances 7,719 11,167 10,380 10,360 13,808 5,290 74,671 8,350 3,274
Loans and advances to customers 2,095 74,513 17,851 3,300 33,524 257 56,625 58 8,539
Investment securities 13,178 100,165 15,481 17,350 20,576 9,495 75,574 - -
Other assets 303 2,377 1,005 - 1,775 672 3,127 931 391
Property and Equipment 543 3,028 673 438 559 228 1,055 176 -
Intangible assets - 96 8 28 - 21 7 23 -
Deferred tax asset 2 - - - - - - 76 -
23,840 191,346 45,398 31,476 70,242 15,963 220,502 9,614 12,204
Financed by:
Deposits from banks 116 30,215 501 777 - 879 25,447 509 96
Deposits from customers 17,407 141,181 32,470 23,571 46,201 6,445 160,931 - 5,219
Other liabilities 665 3,731 1,837 3,024 3,811 190 11,961 1,165 1,677
Current tax liability 31 - - - - - - 353 -
Deferred tax liability - - - - - - - 21 -
Total Equity 5,621 16,219 10,590 4,104 20,230 8,449 22,163 7,566 5,212
23,840 191,346 45,398 31,476 70,242 15,963 220,502 9,614 12,204
Condensed cash flows
Net cash from operating activities 1,673 (13,447) 8,968 7,301 8,308 (3,726) 51,510 (971) (1,260)
Net cash from financing activities 704 (2,658) (73) (78) (1,481) 2 (81) (12) 91
Net cash from investing activities (1,204) 3,415 (4,795) (7,502) (8,917) 4,679 (3,228) 8,864 582
(Decrease)/Increase in cash and cash
equivalents
1,173 (12,690) 4,100 (279) (2,090) 955 48,201 7,881 (587)
Cash and cash equivalents at
beginning of period
6,546 23,857 6,280 10,639 15,898 4,335 26,470 469 3,861
Cash and cash equivalents at end of
the period
7,719 11,167 10,380 10,360 13,808 5,290 74,671 8,350 3,274
Page 148 of 155 Consolidated and Separate Financial Statements for the period ended 30 June, 2019

United Bank for Africa Plc
Notes to the financial statements
Condensed result of consolidated subsidiaries continued
For the period ended 30 June 2019
UBA
Tanzania
UBA
Congo
DRC
UBA FX
Mart
UBA UK
Limited
SSIT UBA RFS
Limited
Bank Group
Adjustments
Group
In millions of Nigerian Naira
Condensed statements of comprehensive income
Operating income 1,171 1,578 - 5,362 - - 140,186 (11,546) 218,694
Total operating expenses (1,087) (1,518) - (2,639) - - (74,445) 23,155 (109,587)
Net impairment gain/(loss) on financial
assets
8 (38) - - - - (3,071) 2 (3,120)
(Loss)/Profit before income tax 92 22 - 2,723 - - 62,670 11,954 70,274
Income tax expense - - - - - - (7,164) (14,101) (13,535)
(Loss)/Profit for the period 92 22 - 2,723 - - 55,506 (2,147) 56,739
Condensed statements of financial position
Assets
Cash and bank balances 27,488 11,764 - 9,740 - - 1,205,804 (155,546) 1,416,170
Financial assets at FVTPL - - - - - - 72,783 - 89,419
Derivative assets - - - - - - 41,948 (9,443) 41,948
Loans and Advances to Banks - - - 29,318 - - 59,078 (25,742) 81,257
Loans and advances to customers 4,488 8,102 - 2,186 - - 1,192,564 (1,133,542) 1,687,506
Investment securities 6,104 5,864 - 33,575 - - 934,885 (4,891) 1,540,826
Other assets 418 4,391 - 2,924 - - 65,751 (17,380) 81,318
Investments in equity-accounted
investee
- - - - - - 2,715 1,174 3,889
Investments in Subsidiaries - - - - - - 103,275 (103,275) -
Property and Equipment 185 461 - 281 - - 100,138 1 118,571
Intangible assets 6 46 - 961 - - 7,056 9,561 17,969
Deferred tax asset - - - - - - 21,862 (1) 23,250
38,689 30,628 - 78,985 - - 3,807,859 (1,439,084) 5,102,123
Financed by:
Derivative liabilities - - - - - - 1,285 - 1,285
Deposits from banks 8,388 - - 54,378 - - 25,608 (136,323) 171,191
Deposits from customers 27,407 17,407 - 551 - - 2,557,366 (57,215) 3,510,237
Other liabilities 356 4,002 - 5,382 - - 102,256 (19,781) 150,885
Current tax liability - 4 - - - - 6,293 (195) 6,317
Subordinated liabilities - - - - - - 29,976 - 29,976
Borrowings - - - - - - 689,637 - 689,637
Deferred tax liability - 50 - - - - - - 137
Total Equity 2,538 9,165 - 18,674 - - 395,438 (95,656) 542,458
38,689 30,628 - 78,985 - - 3,807,859 (309,170) 5,102,123
Condensed cash flows
Net cash from operating activities 21,946 6,390 (578) 12,487 - - 130,656 90,610 235,747
Net cash from financing activities 11 (1,162) (96) (546) - - (10,328) 7,223 (37,058)
Net cash from investing activities (892) (2,192) 2 (11,278) - - (59,053) (8,938) (63,977)
Increase/(decrease) in cash and cash
equivalents
21,065 3,036 (672) 663 - - 61,275 88,895 134,712
Effects of exchange rate changes on
cash and cash equivalents
- - - - - - 7,212 (29,456) (22,244)
Cash and cash equivalents at
beginning of period
6,423 8,728 672 9,077 - 450,063 (169,188) 662,245
Cash and cash equivalents at end of
the period
27,488 11,764 - 9,740 - - 518,550 (109,749) 774,713
Page 149 of 155 Consolidated and Separate Financial Statements for the period ended 30 June, 2019

United Bank for Africa Plc
Notes to the financial statements
48 Condensed result of consolidated subsidiaries
For the period ended 30 June 2018
UBA
Ghana
UBA
Liberia
UBA Cote
D' Ivoire
UBA
Senegal
UBA
Kenya
UBA
Guinea
UBA Gabon UBA Benin
In millions of Nigerian Naira
Condensed statements of comprehensive income
Operating income 20,820 1,260 5,014 5,739 2,063 1,297 3,211 5,135
Total operating expenses (9,927) (986) (3,958) (3,285) (1,899) (1,410) (1,788) (4,097)
Net impairment (loss)/gain on
financial assets
(3,445) (40) 210 (106) (52) (39) (35) 213
Profit before income tax 7,448 234 1,266 2,348 112 (152) 1,388 1,251
Income tax expense (2,368) 50 1,562 (399) - 3,260 (470) 261
Profit/(loss) for the period 5,080 284 2,828 1,949 112 3,108 918 1,512
Condensed statements of financial position
As at 31 December 2018
Assets
Cash and bank balances 34,862 20,764 88,024 64,492 12,071 9,991 13,465 14,446
Loans and advances to customers 41,368 9,695 79,059 72,293 12,040 14,796 22,974 35,268
Investment securities 144,787 3,680 30,174 47,937 28,031 17,972 14,395 69,755
Other assets 5,604 1,189 48 1,863 600 2,220 206 802
Property and Equipment 1,808 720 547 1,104 331 547 2,345 2,305
Intangible assets 82 26 10 15 35 - 6 19
Deferred tax assets 27 162 - - 1,106 968 - 295
228,538 36,236 197,862 187,704 54,214 46,494 53,391 122,890
Financed by:
Deposits from banks 37,082 377 1,559 35,329 6,719 9,532 - 29,528
Deposits from customers 134,845 28,668 179,655 129,452 21,182 29,293 38,352 78,731
Other liabilities 6,676 1,043 4,876 5,228 774 2,756 5,002 2,539
Current tax liabilities - 96 17 232 - - 974 67
Deferred tax liabilities 7,710 748 - - 17,940 - - -
Total Equity 42,225 5,304 11,755 17,463 7,599 4,913 9,063 12,025
228,538 36,236 197,862 187,704 54,214 46,494 53,391 122,890
Condensed cash flows
For the period ended 30 June 2018
Net cash from operating activities 37,767 4,695 (2,044) 7,958 7,846 (5,350) 14,523 (877)
Net cash from financing activities 2,472 (309) (666) (3,442) 18,082 3,170 (1,707) 1,248
Net cash from investing activities (39,032) (324) (1,178) 2,718 (20,963) 2,501 (4,281) 10,387
(Decrease)/Increase in cash and
cash equivalents
1,207 4,062 (3,888) 7,234 4,965 321 8,535 10,758
Cash and cash equivalents at
beginning of period
39,500 14,368 10,136 27,115 2,313 9,245 11,052 8,727
Cash and cash equivalents at end of
period
40,707 18,430 6,248 34,349 7,278 9,566 19,587 19,485
Page 150 of 155 Consolidated and Separate Financial Statements for the period ended 30 June, 2019

United Bank for Africa Plc
Notes to the financial statements
Condensed result of consolidated subsidiaries continued
For the period ended 30 June 2018
UBA Sierra
Leone
UBA
Burkina
Faso
UBA Chad UBA
Uganda
UBA
Congo
Brazza-
ville
UBA
Mozambi
que
UBA
Cameroun
UBA Pension
Custodian
UBA Mali
In millions of Nigerian Naira
Condensed statements of comprehensive income
Operating income 1,658 7,119 2,770 1,703 4,454 1,937 11,084 3,429 141
Total operating expenses (891) (5,791) (1,543) (1,517) (2,904) (1,669) (6,297) (815) (97)
Net impairment (loss)/gain on
financial assets
- 56 33 29 - - (1,948) - -
Profit/(loss) before income tax 767 1,384 1,260 215 1,550 268 2,839 2,614 44
Income tax expense (225) (29) (341) (66) (958) - (1,069) (672) -
Profit/(loss) for the period 542 1,355 919 149 592 268 1,770 1,942 44
Condensed statements of financial position
As at 31 December 2018
Assets
Cash and bank balances 6,546 23,857 6,280 10,639 15,898 4,335 26,470 469 3,861
Derivative assets - - - - - - - - -
Loans and advances to customers 2,645 74,573 22,861 2,607 39,918 269 64,101 - -
Investment securities 11,957 103,535 10,595 9,898 11,500 14,190 72,331 8,818 2,688
Other assets 286 2,652 943 747 856 731 3,613 1,332 97
Property and Equipment 560 3,112 761 387 662 171 1,067 204 550
Intangible assets - 57 11 29 56 62 10 41 32
Deferred tax assets (6) 22 427 - - - - 78 -
21,988 207,808 41,878 24,307 68,890 19,758 177,791 10,942 7,228
Financed by:
Deposits from banks 790 42,331 4,160 625 4,104 1,605 13,272 - -
Deposits from customers 15,627 146,345 27,217 19,682 40,554 9,432 134,111 - 17
Other liabilities 601 1,375 610 - 4,649 236 6,765 4,471 1,513
Current tax liabilities 53 - 635 - 1,771 24 4,142 1,357 -
Deferred tax liability 7 - - - - - - 21 -
Total Equity 4,910 17,757 9,256 4,000 17,812 8,461 19,501 5,093 5,698
21,988 207,808 41,878 24,307 68,890 19,758 177,791 10,942 7,228
Condensed cash flows
For the period ended 30 June 2018
Net cash from operating activities 829 (19,671) 2,033 7,151 3,453 3,744 10,423 (449) 150
Net cash from financing activities (503) (1,369) (2,644) (952) (1,500) (496) (2,624) (4) (420)
Net cash from investing activities (622) 15,878 (4,444) (4,837) 4,909 (435) 10,080 8,281 -
(Decrease)/Increase in cash and
cash equivalents
(296) (5,162) (5,055) 1,362 6,862 2,813 17,879 7,828 (270)
Cash and cash equivalents at
beginning of year
6,120 24,682 13,526 10,037 10,782 3,949 39,907 92 6,648
Cash and cash equivalents at end of
year
5,824 19,520 8,471 11,399 17,644 6,762 57,786 7,920 6,378
Page 151 of 155 Consolidated and Separate Financial Statements for the period ended 30 June, 2019
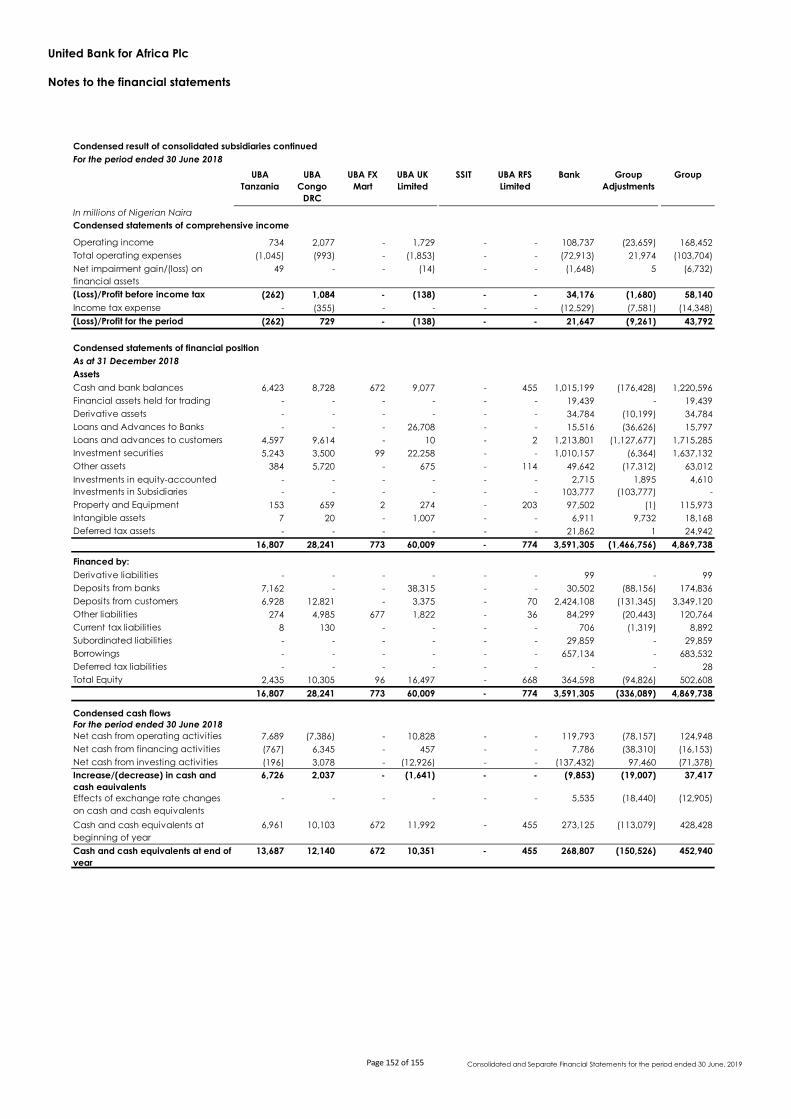
United Bank for Africa Plc
Notes to the financial statements
Condensed result of consolidated subsidiaries continued
For the period ended 30 June 2018
UBA
Tanzania
UBA
Congo
DRC
UBA FX
Mart
UBA UK
Limited
SSIT UBA RFS
Limited
Bank Group
Adjustments
Group
In millions of Nigerian Naira
Condensed statements of comprehensive income
Operating income 734 2,077 - 1,729 - - 108,737 (23,659) 168,452
Total operating expenses (1,045) (993) - (1,853) - - (72,913) 21,974 (103,704)
Net impairment gain/(loss) on
financial assets
49 - - (14) - - (1,648) 5 (6,732)
(Loss)/Profit before income tax (262) 1,084 - (138) - - 34,176 (1,680) 58,140
Income tax expense - (355) - - - - (12,529) (7,581) (14,348)
(Loss)/Profit for the period (262) 729 - (138) - - 21,647 (9,261) 43,792
Condensed statements of financial position
As at 31 December 2018
Assets
Cash and bank balances 6,423 8,728 672 9,077 - 455 1,015,199 (176,428) 1,220,596
Financial assets held for trading - - - - - - 19,439 - 19,439
Derivative assets - - - - - - 34,784 (10,199) 34,784
Loans and Advances to Banks - - - 26,708 - - 15,516 (36,626) 15,797
Loans and advances to customers 4,597 9,614 - 10 - 2 1,213,801 (1,127,677) 1,715,285
Investment securities 5,243 3,500 99 22,258 - - 1,010,157 (6,364) 1,637,132
Other assets 384 5,720 - 675 - 114 49,642 (17,312) 63,012
Investments in equity-accounted - - - - - - 2,715 1,895 4,610
Investments in Subsidiaries - - - - - - 103,777 (103,777) -
Property and Equipment 153 659 2 274 - 203 97,502 (1) 115,973
Intangible assets 7 20 - 1,007 - - 6,911 9,732 18,168
Deferred tax assets - - - - - - 21,862 1 24,942
16,807 28,241 773 60,009 - 774 3,591,305 (1,466,756) 4,869,738
Financed by:
Derivative liabilities - - - - - - 99 - 99
Deposits from banks 7,162 - - 38,315 - - 30,502 (88,156) 174,836
Deposits from customers 6,928 12,821 - 3,375 - 70 2,424,108 (131,345) 3,349,120
Other liabilities 274 4,985 677 1,822 - 36 84,299 (20,443) 120,764
Current tax liabilities 8 130 - - - - 706 (1,319) 8,892
Subordinated liabilities - - - - - - 29,859 - 29,859
Borrowings - - - - - - 657,134 - 683,532
Deferred tax liabilities - - - - - - - - 28
Total Equity 2,435 10,305 96 16,497 - 668 364,598 (94,826) 502,608
16,807 28,241 773 60,009 - 774 3,591,305 (336,089) 4,869,738
Condensed cash flows
For the period ended 30 June 2018
Net cash from operating activities 7,689 (7,386) - 10,828 - - 119,793 (78,157) 124,948
Net cash from financing activities (767) 6,345 - 457 - - 7,786 (38,310) (16,153)
Net cash from investing activities (196) 3,078 - (12,926) - - (137,432) 97,460 (71,378)
Increase/(decrease) in cash and
cash equivalents
6,726 2,037 - (1,641) - - (9,853) (19,007) 37,417
Effects of exchange rate changes
on cash and cash equivalents
- - - - - - 5,535 (18,440) (12,905)
Cash and cash equivalents at
beginning of year
6,961 10,103 672 11,992 - 455 273,125 (113,079) 428,428
Cash and cash equivalents at end of
year
13,687 12,140 672 10,351 - 455 268,807 (150,526) 452,940
Page 152 of 155 Consolidated and Separate Financial Statements for the period ended 30 June, 2019

United Bank for Africa Plc
UNITED BANK FOR AFRICA PLC
ADDITIONAL DISCLOSURES
Statement of Value Added
For the half year ended 30 June
2019 2018
N'million % N'million %
Group
Gross revenue 293,690 257,918
Interest paid (94,762) (76,218)
198,928 181,700
Administrative overheads:
- local (78,294) (74,477)
- foreign (1,250) (1,478)
Value added 119,384 100 105,745 100
Distribution
Employees
- Salaries and benefits 37,178 31 35,214 33
Government
- Taxation 13,535 11 14,348 14
The future
- Asset replacement (depreciation and amortization) 8,812 7 5,659 5
- Asset replacement (provision for losses) 3,120 3 6,732 6
- Expansion (transfer to reserves and
non-controlling interest) 56,739 48 43,792 41
119,384 100 105,745 100
2019 2018
N'million % N'million %
Bank
Gross revenue 214,395 180,124
Interest paid (81,702) (61,169)
132,693 118,955
Administrative overheads:
- local (59,199) (58,597)
- foreign (88) (59)
Value added 73,406 100 60,299 100
Distribution
Employees
- Salaries and benefits 20,775 28 20,449 34
Government
- Taxation 7,164 10 12,529 21
The future
- Asset replacement (depreciation and amortization) 5,930 8 4,026 7
- Asset replacement (provision for losses) 3,071 4 1,648 3
- Expansion (transfer to reserves and
non-controlling interest) 36,466 50 21,647 36
73,406 100 60,299 100
Page 153 of 155 Consolidated and Separate Financial Statements for the period ended 30 June, 2019

United Bank for Africa Plc
UNITED BANK FOR AFRICA Plc
Group Five - Year Financial Summary
Statement of financial position
In millions of Nigerian Naira30 June
2019
31
December
2018
31
December
2017
31 December
2016
31 December
2015
ASSETS
Cash and bank balances 1,416,170 1,220,596 898,083 760,930 655,371
Financial assets at fair value through profit or loss 89,419 19,439 31,898 52,295 11,249
Derivative assets 41,948 34,784 8,227 10,642 1,809
Loans and advances to banks 81,257 15,797 20,640 22,765 14,600
Loans and advances to customers 1,687,506 1,715,285 1,650,891 1,505,319 1,036,637
Investment securities
- At fair value through other comprehensive income - - - - -
- Available-for-sale 924,415 1,036,653 593,299 276,758 275,496
- At amortised cost 616,411 600,479 - - -
- Held to maturity - - 622,754 693,634 581,374
Other assets 81,318 63,012 86,729 37,849 40,488
Investments in equity-accounted investee 3,889 4,610 2,860 2,925 2,236
Property and equipment 118,571 115,973 107,636 93,932 88,825
Intangible assets 17,969 18,168 16,891 14,361 11,369
Deferred tax assets 23,250 24,942 29,566 33,060 33,168
TOTAL ASSETS 5,102,123 4,869,738 4,069,474 3,504,470 2,752,622
LIABILITIES
Derivative liabilities 1,285 99 123 14 327
Deposits from banks 171,191 174,836 134,289 109,080 61,066
Deposits from customers 3,510,237 3,349,120 2,733,348 2,485,610 2,081,704
Other liabilities 150,885 120,764 98,277 110,596 54,885
Current tax liabilities 6,317 8,892 7,668 5,134 6,488
Borrowings 689,637 683,532 502,209 259,927 129,896
Subordinated liabilities 29,976 29,859 65,741 85,978 85,620
Deferred tax liabilities 137 28 40 62 15
TOTAL LIABILITIES 4,559,665 4,367,130 3,541,695 3,056,401 2,420,001
EQUITY
Share capital and share premium 115,815 115,815 115,815 135,514 135,514
Reserves 407,935 367,654 393,733 299,337 190,313
EQUITY ATTRIBUTABLE TO EQUITY - 523,750 483,469 509,548 434,851 325,827
HOLDERS OF THE BANK
Non-controlling interest 18,708 19,139 18,231 13,218 6,794
TOTAL EQUITY 542,458 502,608 527,779 448,069 332,621
TOTAL LIABILITIES AND EQUITY 5,102,123 4,869,738 4,069,474 3,504,470 2,752,622
Summarized Statement of Comprehensive Income
In millions of Nigerian Naira 30 June
2019
30 June
2018
30 June
2017
30 June
2016
30 June
2015
Net operating income 182,639 168,452 161,777 116,196 110,992
Operating expenses (109,587) (103,704) (94,804) (74,540) (69,678)
Net impairment loss on loans and receivables (3,120) (6,732) (9,441) (6,821) (2,216)
Share of profit/(loss) of equity-accounted investee 342 124 (1) (79) (52)
Profit before taxation 70,274 58,140 57,531 34,756 39,046
Taxation (13,535) (14,348) (15,192) (7,649) (7,047)
Profit after taxation 56,739 43,792 42,339 27,107 31,999
Profit for the period 56,739 43,792 42,339 27,107 31,999
- Non-controlling interest 1,444 1,600 890 616 622
- Equity holders of the parent 55,295 42,192 41,449 26,491 31,377
Other comprehensive income for the period 5,341 (13,311) 10,877 56,161 2,186
Total comprehensive income for the period 62,080 30,481 53,216 83,268 34,185
Page 154 of 155 Consolidated and Separate Financial Statements for the period ended 30 June, 2019

United Bank for Africa Plc
UNITED BANK FOR AFRICA Plc
Bank Five - Year Financial Summary
Statement of financial position
In millions of Nigerian Naira 30 June
2019
31
December
2018
31
December
2017
31
December
2016
31
December
2015
ASSETS
Cash and bank balances 1,205,804 1,015,199 727,546 610,910 590,774
Financial assets at fair value through profit or loss 72,783 19,439 31,898 52,295 11,249
Derivative assets 41,948 34,784 7,911 10,642 1,809
Loans and advances to banks 59,078 15,516 19,974 23,850 14,591
Loans and advances to customers 1,192,564 1,213,801 1,173,214 1,090,355 822,694
Investment securities:
- Fair value through other comprehensive income 851,720 925,892 423,293 244,424 270,409
- Held at amortised cost 83,165 84,265 - - -
- Held to maturity - - 242,185 288,592 297,794
Other assets 65,751 49,642 77,949 31,192 22,528
Investments in subsidiaries 103,275 103,777 103,777 70,702 65,767
Investments in equity-accounted investee 2,715 2,715 1,770 1,770 1,770
Property and equipment 100,138 97,502 89,285 80,252 80,145
Intangible assets 7,056 6,911 5,846 4,905 4,954
Deferred tax assets 21,862 21,862 27,178 29,696 31,853
- TOTAL ASSETS 3,807,859 3,591,305 2,931,826 2,539,585 2,216,337
LIABILITIES
Derivative liabilities 1,285 99 123 14 327
Deposits from banks 25,608 30,502 15,290 30,484 350
Deposits from customers 2,557,366 2,424,108 1,877,736 1,698,859 1,627,060
Current tax liabilities 6,293 706 1,108 522 634
Subordinated liabilities 29,976 29,859 65,741 85,978 85,620
Borrowings 689,637 657,134 502,209 259,927 129,896
Other liabilities 102,256 84,299 68,759 72,901 34,219
TOTAL LIABILITIES 3,412,421 3,226,707 2,530,966 2,148,685 1,878,106
EQUITY
Share capital and share premium 115,815 115,815 115,815 135,514 135,514
Reserves 279,623 248,783 285,045 255,386 202,717
TOTAL EQUITY 395,438 364,598 400,860 390,900 338,231
TOTAL LIABILITIES AND EQUITY 3,807,859 3,591,305 2,931,826 2,539,585 2,216,337
Summarized statement of comprehensive income
In millions of Nigerian Naira 30 June
2019
30 June
2018
30 June
2017
30 June
2016
30 June
2015
Net operating income 121,146 108,737 104,655 86,413 83,693
Operating expenses (74,445) (72,913) (63,932) (55,888) (53,389)
Net impairment loss on loans and receivables (3,071) (1,648) (7,193) (5,569) (1,892)
Profit before taxation 43,630 34,176 33,530 24,956 28,412
Taxation (7,164) (12,529) (7,676) (5,419) (4,108)
Profit for the period 36,466 21,647 25,854 19,537 24,304
Other comprehensive income for the period 16,604 1,635 3,183 23,700 4,685
Total comprehensive income for the period 53,070 23,282 29,037 43,237 28,989
Page 155 of 155 Consolidated and Separate Financial Statements for the period ended 30 June, 2019