unit – v. analytical techniqueschettinadtech.ac.in/storage/12-02-09/12-02-09-12-24-23... ·...
TRANSCRIPT
1
UNIT – V. ANALYTICAL TECHNIQUES Beer – Lambert’s law (problem) – UV-visible spectroscopy and IR spectroscopy – principles – instrumentation (problem) (block diagram only) – estimation of iron by colorimetry – flame photometry – principle – instrumentation (block diagram only) – estimation of sodium by flame photometry – atomic absorption spectroscopy – principles – instrumentation (block diagram only) – estimation of nickel by atomic absorption spectroscopy. Introduction:
Spectroscopy deals with the transitions that a molecule undergoes between its energy levels upon absorption of suitable radiations determined by quantum mechanical selections rule. UV – visible and IR spectroscopy plays an exclusive role in the study of various molecules with the help of analytical techniques like colorimetry , flame photometry and spectrophotometry, etc. Beer – Lambert’s law:
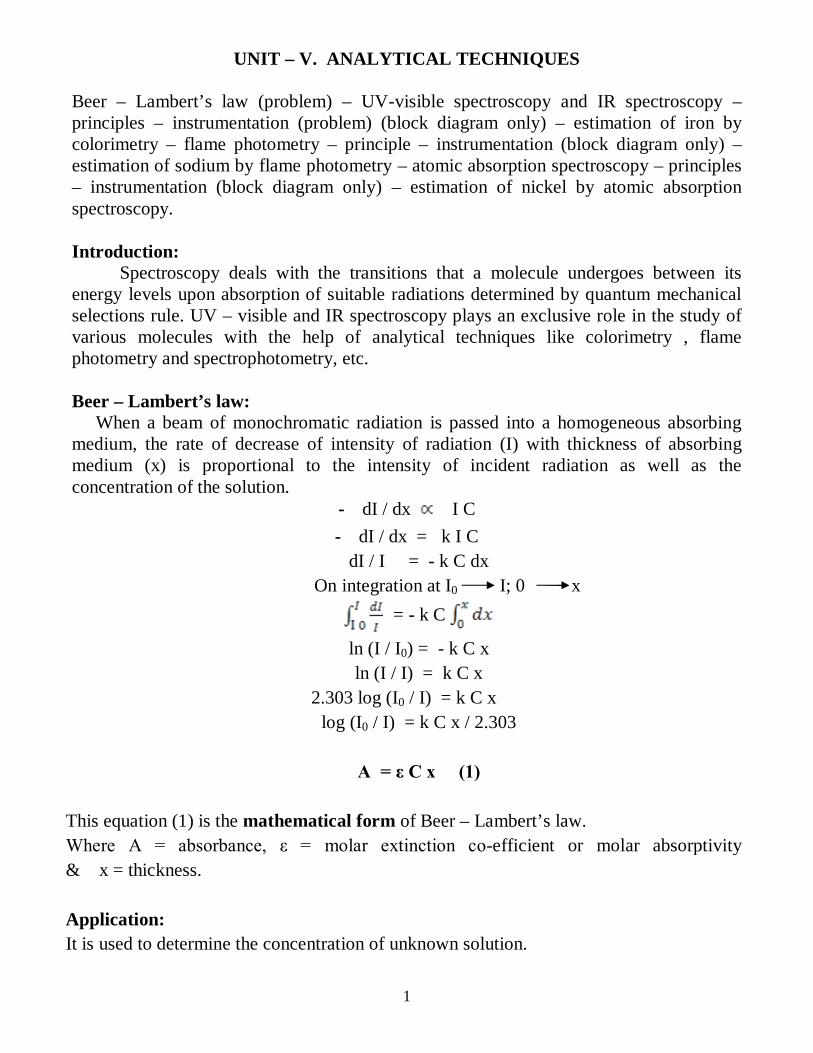
When a beam of monochromatic radiation is passed into a homogeneous absorbing medium, the rate of decrease of intensity of radiation (I) with thickness of absorbing medium (x) is proportional to the intensity of incident radiation as well as the concentration of the solution.
- dI / dx I C - dI / dx = k I C
dI / I = - k C dx On integration at I0 I; 0 x
= - k C
ln (I / I0) = - k C x ln (I / I) = k C x
2.303 log (I0 / I) = k C x log (I0 / I) = k C x / 2.303
A = ε C x (1)
This equation (1) is the mathematical form of Beer – Lambert’s law. Where A = absorbance, ε = molar extinction co-efficient or molar absorptivity & x = thickness. Application: It is used to determine the concentration of unknown solution.

2
Limitations: 1. The law is invalid, when non- monochromatic radiation is used. 2. The law is invalid, if temperature changes during measurements. 3. The law is only applicable for dilute solutions.
UV – Visible Spectroscopy: Absorption radiation in the UV (wave length range = 200 – 400 nm) and Visible
(wave length range = 400 – 750 nm) regions of the electromagnetic spectrum results transitions between electronic levels. This is due to the larger energy change corresponds to 100 – 100,000 kJ/mol which cause simultaneous change in vibrational and rotation energies.
Eelec > Evib > Erot Generally energy change due to electronic transition is greater than that of vibrational and rotational transitions. Hence the UV and Visible spectra of simple molecules exihibit narrow absorption peaks.
Permitted energy levels in UV and Visible regions.
The vibrational and rotational fine structure lines are not observed during the spectrum is run in solution. This is because of the physical interactions between sample organic molecule and the solvent molecule, cause collisional broadening of the lines.
Electronic absorption spectrum of a solution of benzene in hexane.

3
The above spectra of benzene shows larger peaks at 250 nm due to the presence of П electrons and smaller peaks & troughs indicate vibrations of molecules. Types of electrons in organic molecules involving in transitions: 1. σ electrons. 2. П electrons. 3. Non – bonding electrons.
According to Molecular orbital theory, the interaction of atomic orbitals leads to the formation of “bonding” and “anti – bonding” molecular orbitals. The relative energies of bonding, anti – bonding and non – bonding molecular orbitals are given in the following diagram.
Bonding and antibonding orbitals.
Molecules absorb radiation from UV – Visible region and undergo various
transitions. During this transition, an electron from one of the filled σ, П or non – bonding orbitals get excited to vacant σ* or П* orbitals. Corresponding to possible excitations, there are various transitions are possible as follows.
These transitions are classified into two types as follows: 1. Allowed transition:
2. Forbidden transition:
The order of transition is

4
Out of the above possible transitions, the last three ones account for the absorption in 200 – 800 nm region of electromagnetic radiation and first three transitions requires much higher energy, thus the molecules with n or П electrons give rise to characteristic spectra in the region 200 – 800 nm of electromagnetic region. Chromophores:
The structural units of the compound having n or П electrons, absorbs selective wavelength of UV – Visible radiation are called chromophores. Example: - N=N- , C=C, C=O, etc. Auxochromes:
The polar groups with lone pair of electrons support the intensity of chromophores are called auxochromes. Example: .. .. -O – H , - O – R , etc. .. ..
Absorption and intensity shifts.
Bathochromic shift: It is also called red shift. The substitution of a selective group in a molecule makes
the absorption to longer wavelength is called bathochromic shift. Example: Alkyl substitution on olefins. Hypsochromic shift:
It is also called blue shift. The substitution of a selective group in a molecule make the absorption to shorter wavelength is called hypsochromic shift. Example: Chlorine substitution on olefins. Hyperchromic effect:
The substitution of a selective group in a molecule causes increase in the intensity of absorption maximum of the molecule, and then the effect is called hyperchromic effect. Example: Methyl substitution on benzene.

5
Hypochromic effect: The substitution of a selective group in a molecule causes decrease in the intensity
of absorption maximum of the molecule, and then the effect is called hypochromic effect. Example: Chlorine substitution on benzene. UV – Visible Spectrophotometer: Instrumentation:
Block diagram for a UV – Visble spectrophotometer.
Components: Radiation source:
Hydrogen or deuterium lamps are used. It provides stable, continuous and sufficient intensity. Filter:
It is also called monochromator. It permits the radiation of required wavelength only. Cell:
It is a transparent and uniformly constructed container which contains either sample solution or reference solvent. Detectors:
It converts the absorbed radiation into current. There are three types of detectors, viz., Barrier layer cell, photo multiplier tube and photo cell. Recorder: It converts the signal reaches to itself into spectrum of a molecule. Working:
The radiation from the source is passed through the monochromator where it splitted into two equal beams, one half is passed into the sample cell and another half is passed into the reference cell containing solvent. The detector will measure the comparison of intensities of beam of light. If the sample absorbs light then the intensity of sample beam is less than the intensity of reference beam. It will be recorded as a signal in recorder. The instruments gives output graph (absorption spectrum) of a plot of the wavelength verses absorbance (A) of the light at each wavelength, where A = log (I0/I).

6
UV – Visble spectra : (a) benzene in ethanol (b) naphthalene in methanol. Applications of UV spectroscopy: 1. It is used to determine the structure of vitamins, detecting steric hindrance, study rates
of reactions and determine the dissociation constants of acids and bases from the change of absorption spectra with pH.
2. It is used to determine the dissociation energy of a molecule accurately from the wavelength.
3. It provides the information regarding moment of inertia, vibrational frequency and interatomic distances of diatomic molecules.
4. It is used to identify the cis and trans isomers of a compound from absorption spectra. 5. It is used to know the purity of a compound. 6. It is used to determine the structure of organic compounds. For example, isatin can be
assigned following two possible structures:
However, the corresponding structures of two possible methyl ethers are known to us.
On comparison of the spectra of isatin with that of two methyl isomers (III) and (IV), the spectrum of isatin is similar to that of N-methyl ether (III). Hence isatin is assigned the structure (I). 7. It is used in quantitative analysis to determine the concentration of unknown sample by using Beer – Lambert’s equation, A = E c l.

7
IR spectroscopy: The spectra of a molecule arised in IR region (12500 cm – 1 – 50 cm – 1 ) due to the
absorption of energy and transition occurs between different vibrational levels. Hence it is called vibration spectroscopy.
IR region (12500 Cm – 1 – 50 cm – 1 )
Near IR IR Far IR 12500 cm – 1 – 4000 cm – 1 4000 cm – 1 – 667 cm – 1 667 cm – 1 – 50 cm – 1
All types of molecules cannot interact with IR radiation. Only those molecules which exhibit change in dipole moment during a vibration can exhibit IR spectra. Evidently, the homo-nuclear diatomic molecules like H2, O2, N2, Cl2, etc do not show change in dipole moment during vibration. Consequently, these do not exhibit IR spectra. The hetero- nuclear diatomic / polyatomic molecules like HCl, BeCl2, NH3, CH4, CO2, C6H6, etc shows change in dipole moment and thus they exhibit IR spectra.
The IR spectral region at 1400 cm – 1 – 700 cm – 1 gives rich, intense and clear
absorption bands for all functional groups in the organic compounds. This region is called finger – print region. It is used to identify the functional group present in the organic compound, Identify the molecule and find out the characteristics of the molecule.
The IR spectral region at 4000 cm – 1 – 600 cm – 1 gives intense absorption bands associated with bending and stretching vibrations of particular functional group in organic compounds. This region is called group frequency region. It is used to identify the types of functional groups present in organic molecules.
The molecules have certain number of vibrational modes. It can be calculated using the following formulae. (a) For a linear molecule, No of fundamental vibrational mode = 3n – 5 (b) For a non – linear molecule, No of fundamental vibrational mode = 3n – 6
where n = number of atoms in a molecule. Molecule HCl BeCl2 NH3 CH4 CO2 C6H6 FVM 1 4 6 9 4 30
8
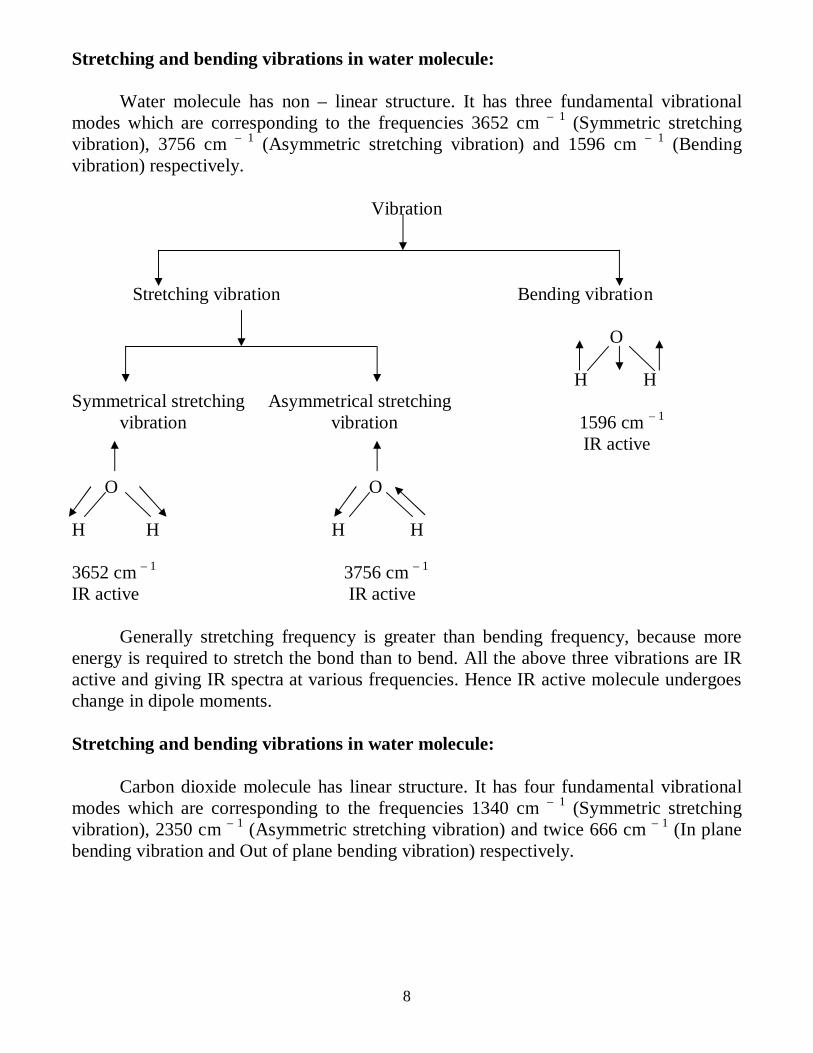
Stretching and bending vibrations in water molecule:
Water molecule has non – linear structure. It has three fundamental vibrational modes which are corresponding to the frequencies 3652 cm – 1 (Symmetric stretching vibration), 3756 cm – 1 (Asymmetric stretching vibration) and 1596 cm – 1 (Bending vibration) respectively.
Vibration
Stretching vibration Bending vibration O H H Symmetrical stretching Asymmetrical stretching
vibration vibration 1596 cm – 1 IR active O O H H H H 3652 cm – 1 3756 cm – 1 IR active IR active
Generally stretching frequency is greater than bending frequency, because more
energy is required to stretch the bond than to bend. All the above three vibrations are IR active and giving IR spectra at various frequencies. Hence IR active molecule undergoes change in dipole moments. Stretching and bending vibrations in water molecule:
Carbon dioxide molecule has linear structure. It has four fundamental vibrational modes which are corresponding to the frequencies 1340 cm – 1 (Symmetric stretching vibration), 2350 cm – 1 (Asymmetric stretching vibration) and twice 666 cm – 1 (In plane bending vibration and Out of plane bending vibration) respectively.

9
Vibration
Stretching vibration Bending vibration Symmetrical Asymmetrical In plane bending Out of plane bending stretching vibration stretching vibration vibration vibration O C O O C O O C O O C O 1340 cm – 1 2350 cm – 1 666 cm – 1 666 cm – 1 IR inactive IR active IR active IR active
In symmetrical stretching, both bonds are shortened or elongated to the same extent. Hence there is no change in dipole moment. So it is IR inactive.
In asymmetrical stretching, one of the bonds is shortened and the other is elongated. Hence there is change in bond length and dipole moment. So it is IR active.
In bending, both in-plane and out of plane bending involves variation of bond angle. Hence there is change in bond angle and dipole moment. So it is IR active.
Even we have three active vibrations at 2350 cm – 1, 666 cm – 1 and 666 cm – 1
respectively, we get two absorption band only, One at 2350 cm – 1 and another one at 666 cm – 1. Instrumentation:
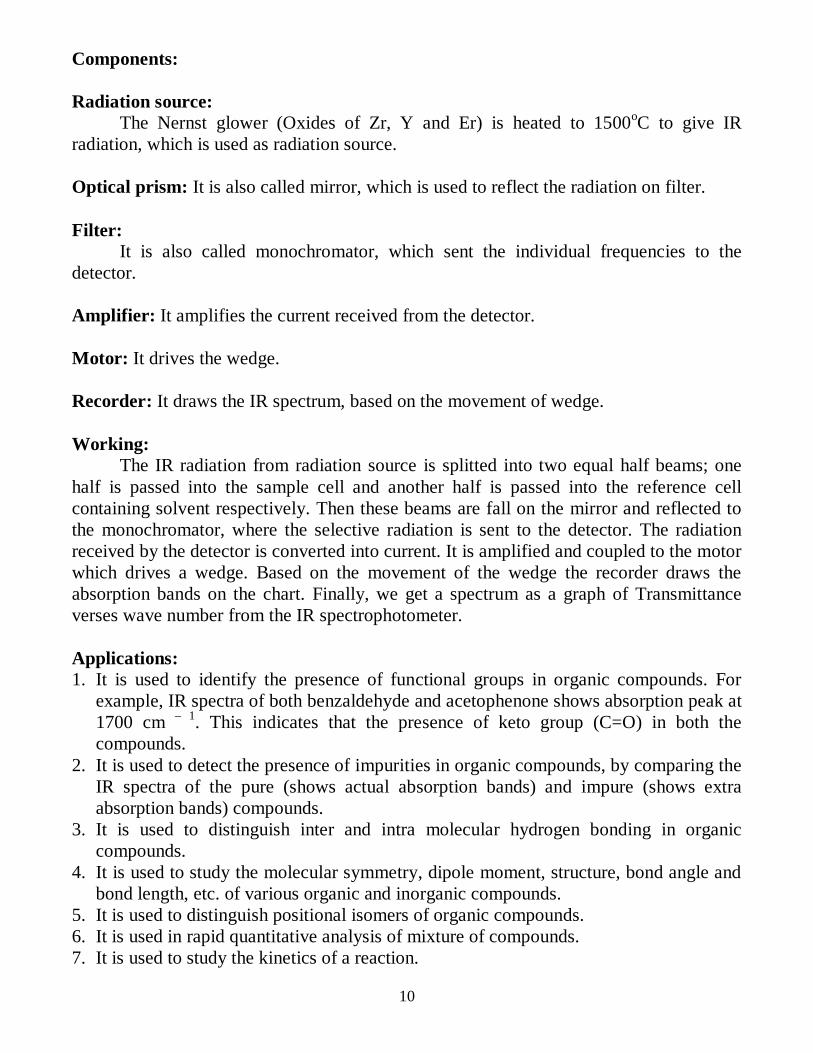
Block diagram of IR spectrophotometer.
Reference
cell
Sample
cell ce
Radiation
source
Amplifier
Mirror
Recorder
Wedge
Motor
Filter
Detector
10
Components: Radiation source:
The Nernst glower (Oxides of Zr, Y and Er) is heated to 1500oC to give IR radiation, which is used as radiation source. Optical prism: It is also called mirror, which is used to reflect the radiation on filter. Filter:
It is also called monochromator, which sent the individual frequencies to the detector. Amplifier: It amplifies the current received from the detector. Motor: It drives the wedge. Recorder: It draws the IR spectrum, based on the movement of wedge. Working:
The IR radiation from radiation source is splitted into two equal half beams; one half is passed into the sample cell and another half is passed into the reference cell containing solvent respectively. Then these beams are fall on the mirror and reflected to the monochromator, where the selective radiation is sent to the detector. The radiation received by the detector is converted into current. It is amplified and coupled to the motor which drives a wedge. Based on the movement of the wedge the recorder draws the absorption bands on the chart. Finally, we get a spectrum as a graph of Transmittance verses wave number from the IR spectrophotometer. Applications: 1. It is used to identify the presence of functional groups in organic compounds. For
example, IR spectra of both benzaldehyde and acetophenone shows absorption peak at 1700 cm – 1. This indicates that the presence of keto group (C=O) in both the compounds.
2. It is used to detect the presence of impurities in organic compounds, by comparing the IR spectra of the pure (shows actual absorption bands) and impure (shows extra absorption bands) compounds.
3. It is used to distinguish inter and intra molecular hydrogen bonding in organic compounds.
4. It is used to study the molecular symmetry, dipole moment, structure, bond angle and bond length, etc. of various organic and inorganic compounds.
5. It is used to distinguish positional isomers of organic compounds. 6. It is used in rapid quantitative analysis of mixture of compounds. 7. It is used to study the kinetics of a reaction.
11
Colorimetry: It is the technique deals with the determination of concentration of a substance by
absorption of visible region (400 – 750 nm) of the spectrum. A device used for measuring absorption of radiant energy by the sample is called colorimeter. Principle:
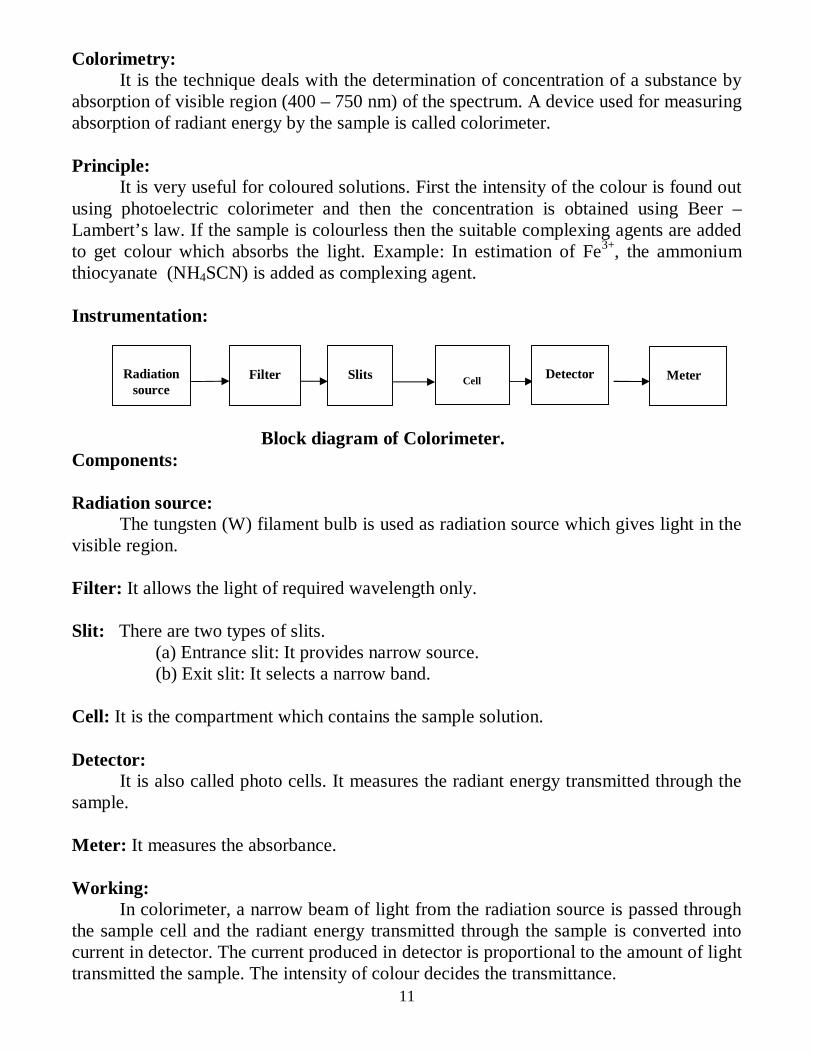
It is very useful for coloured solutions. First the intensity of the colour is found out using photoelectric colorimeter and then the concentration is obtained using Beer – Lambert’s law. If the sample is colourless then the suitable complexing agents are added to get colour which absorbs the light. Example: In estimation of Fe3+, the ammonium thiocyanate (NH4SCN) is added as complexing agent. Instrumentation:
Block diagram of Colorimeter. Components: Radiation source:
The tungsten (W) filament bulb is used as radiation source which gives light in the visible region. Filter: It allows the light of required wavelength only. Slit: There are two types of slits. (a) Entrance slit: It provides narrow source. (b) Exit slit: It selects a narrow band. Cell: It is the compartment which contains the sample solution. Detector:
It is also called photo cells. It measures the radiant energy transmitted through the sample. Meter: It measures the absorbance. Working:
In colorimeter, a narrow beam of light from the radiation source is passed through the sample cell and the radiant energy transmitted through the sample is converted into current in detector. The current produced in detector is proportional to the amount of light transmitted the sample. The intensity of colour decides the transmittance.
Radiation
source
Filter
Slits
Cell
Detector
Meter

12
i.e. Current Light transmitted 1 / concentration
Finally the transmitted light is sent to the meter, where the absorbance of the sample is measured. A graph of calibration curve is drawn between concentration verses absorbance. It gives a straight line satisfying Beer – Lambert’s law. After finding out the absorbance of test solution experimentally, the concentration will be determined from the graph.
Absorbance
Concentration (ppm)
Applications: 1. The instability constant and structure of certain complexes can be determined. 2. The molecular weight of a compound can be determined. 3. It is used to estimate Cu, Fe and Cr, etc in their dilute solutions. Limitations: 1. The concentration of colourless solutions cannot be estimated. 2. The complexing agents required in case of colourless solutions. Estimation of Ferric ion by colorimetry: It involves the following steps: Step: 1. (i) The stock solution of Ferric ammonium sulphate is prepared by dissolving 0.865 g of Ferric ammonium sulphate 10 mL of con. HCl and make up to 1 L using distilled water. (ii) The stock solution of Potassium thiocyanate is prepared by dissolving 20 g of KCNS in 100 mL of distilled water. Step: 2.
With the help of a pipette and the stock solutions, five different standard solutions of concentration 2, 4, 6, 8 and 10 ppm are prepared by mixing Fe3+ solution and KCNS solution. Step: 3. The colorimeter is set at zero absorbance (100 % transmittance) using the solvent.

13
Step: 4. In colorimeter, a narrow beam of light from the radiation source is passed through
the series of standard solutions and the radiant energy transmitted through the standard solutions is converted into current in detector. The current produced in detector is proportional to the amount of light transmitted the sample. The intensity of colour decides the transmittance.
i.e. Current Light transmitted 1 / concentration
Fe3+ + KCNS [Fe(SCN)6] 3 - + 6 K+
Finally the transmitted light is sent to the meter, where the absorbance of the
standard solutions is measured. Finally a graph of calibration curve is drawn between concentration verses absorbance. It gives a straight line satisfying Beer – Lambert’s law. After finding out the absorbance of test solution experimentally, the concentration will be determined from the graph.
Absorbance
Concentration (ppm)
***
Flame Photometry: Flame photometry is a technique in which the intensity of the emitted light is
measured when atomized metal is introduced into the flame. The wavelength and intensity of the colour indicates the element and the % of that element in the compound.
Flame photometer.
14
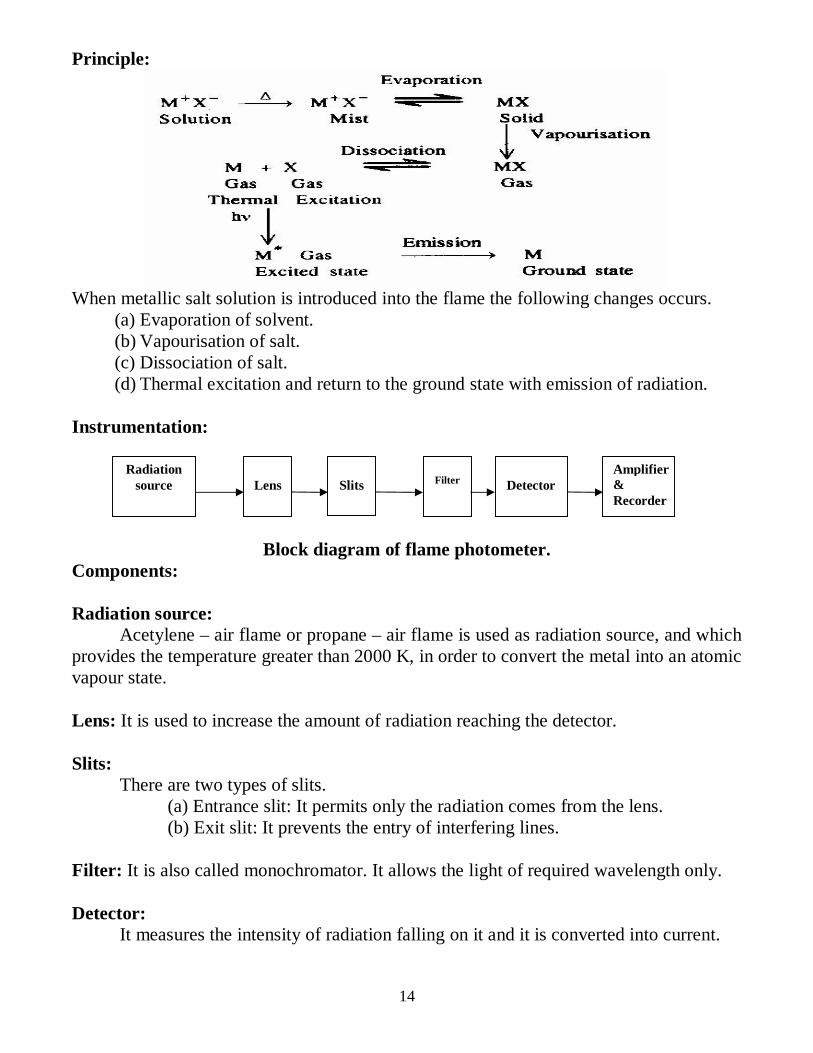
Principle:
When metallic salt solution is introduced into the flame the following changes occurs.
(a) Evaporation of solvent. (b) Vapourisation of salt. (c) Dissociation of salt. (d) Thermal excitation and return to the ground state with emission of radiation.
Instrumentation:
Block diagram of flame photometer. Components: Radiation source:
Acetylene – air flame or propane – air flame is used as radiation source, and which provides the temperature greater than 2000 K, in order to convert the metal into an atomic vapour state. Lens: It is used to increase the amount of radiation reaching the detector. Slits:
There are two types of slits. (a) Entrance slit: It permits only the radiation comes from the lens. (b) Exit slit: It prevents the entry of interfering lines. Filter: It is also called monochromator. It allows the light of required wavelength only. Detector:
It measures the intensity of radiation falling on it and it is converted into current.
Radiation source
Lens
Slits
Filter
Amplifier & Recorder
Detector

15
Amplifier & Recorder: The current coming out from the detector is weak, so it is amplified and recorded.
Working:
The sample is mixed with air and fuel gas in the mixing chamber and this mixture is passed into the burner. The radiation emitted from the flame is passed successively into the lens, filter, detector and finally into the recorder. The above experiment is carried out using a series of standard solutions and the readings noted for each trial. Finally a graph of calibration curve is drawn between concentration verses intensity of emitted light. After finding out the intensity of test solution experimentally, the concentration will be determined from the graph.
Intensity
Concentration (ppm)
Advantages: 1. It is a well – understood technique. 2. Low running and maintenance cost. 3. Measurement is possible in a wide range of liquid systems. Drawbacks: 1. It is necessary to use liquid samples. 2. It never emits the light on the molecular form of the metal present in the test solution. 3. All metal ions and inert gases cannot be determined. Applications: 1. It is very useful to detect the alkali and alkaline earth metals from the colour of the
flame. Li – Scarlet red colour ( = 670 nm), Na – yellow colour (= 589 nm) and Ca – Brick red colour (= 422 nm).
2. It is used in biological fluids and tissue analysis for the determination of Na, K, Ca & Fe.
3. In soil analysis Na, K, Al, Ca & Fe, etc are determined. 4. It is used to estimate alkali & alkaline earth metals in their metal salt solutions.
Limitations: 1. Liquid samples must be used. 2. Other than alkali & alkaline earth metals cannot be detected.
***

16
Estimation of sodium ion by flame photometry: It involves the following steps: Step: 1.
The stock solution of NaCl is prepared by dissolving 2.542 g of NaCl in 1 L of distilled water. Step: 2.
With the help of a pipette and the stock solution, five different standard solutions of concentration 2, 4, 6, 8 and 10 ppm are prepared. Step: 3. Working:
The sample is mixed with air and fuel gas in the mixing chamber and this mixture is passed into the burner. The radiation emitted from the flame is passed successively into the lens, filter, detector and finally into the recorder.
The above experiment is carried out using a series of standard solutions and the
readings noted for each trial. Finally a graph of calibration curve is drawn between concentration verses intensity of emitted light. It gives a straight line satisfying Beer – Lambert’s law. After finding out the intensity of test solution experimentally, the concentration will be determined from the graph.
Intensity
Concentration (ppm)
Step: 4. After finding out the intensity of test solution experimentally, the concentration of
unknown sample NaCl solution will be determined from the graph.
***
17
Atomic absorption spectroscopy (AAS):
It is used to determine the presence of metals like Ni, Fe, Cu, Al, Pb, Zn, etc in liquid samples. It is also used to measure the concentrations of metals in the samples of concentration range in the low mg/L range. Principle:
It is based on atomization of sample by absorption of radiation by ground state gaseous atoms. It can be done by the following steps.
Step: 1. Atomization of the sample. Step: 2. The absorption of radiation from a light source by the free atoms.
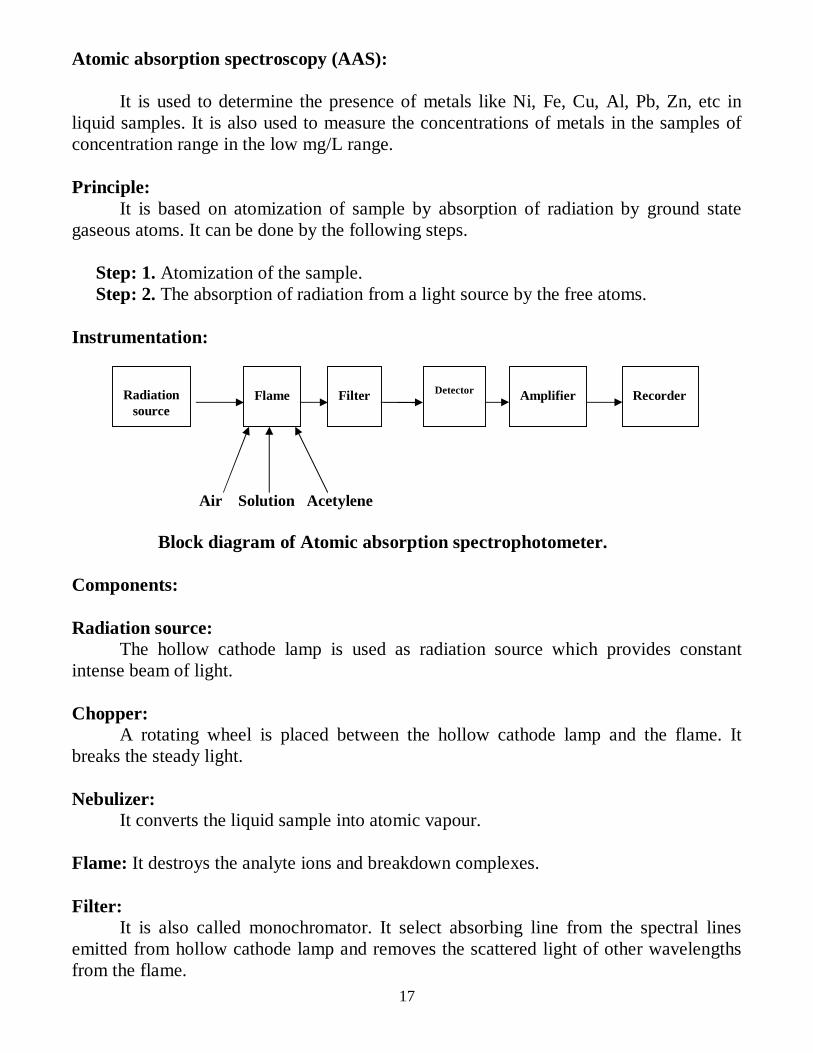
Instrumentation:
Air Solution Acetylene
Block diagram of Atomic absorption spectrophotometer.
Components: Radiation source:
The hollow cathode lamp is used as radiation source which provides constant intense beam of light. Chopper:
A rotating wheel is placed between the hollow cathode lamp and the flame. It breaks the steady light. Nebulizer:
It converts the liquid sample into atomic vapour.
Flame: It destroys the analyte ions and breakdown complexes. Filter:
It is also called monochromator. It select absorbing line from the spectral lines emitted from hollow cathode lamp and removes the scattered light of other wavelengths from the flame.
Radiation
source
Flame
Filter
Detector
Recorder
Amplifier
18
Detectors: It is also called photo multiplier tube. It converts the absorbed radiation into
current. Amplifier & recorder: The current from the detector is amplified and then recorded. Working:
The radiation obtained from the hollow cathode lamp is passed into the flame in which the sample is aspirated. The metallic compound decomposes to give atoms which absorb a part of radiation in the flame. The unabsorbed radiation in the flame is allowed to pass through the filter and then detector. Finally it is amplified and recorded.
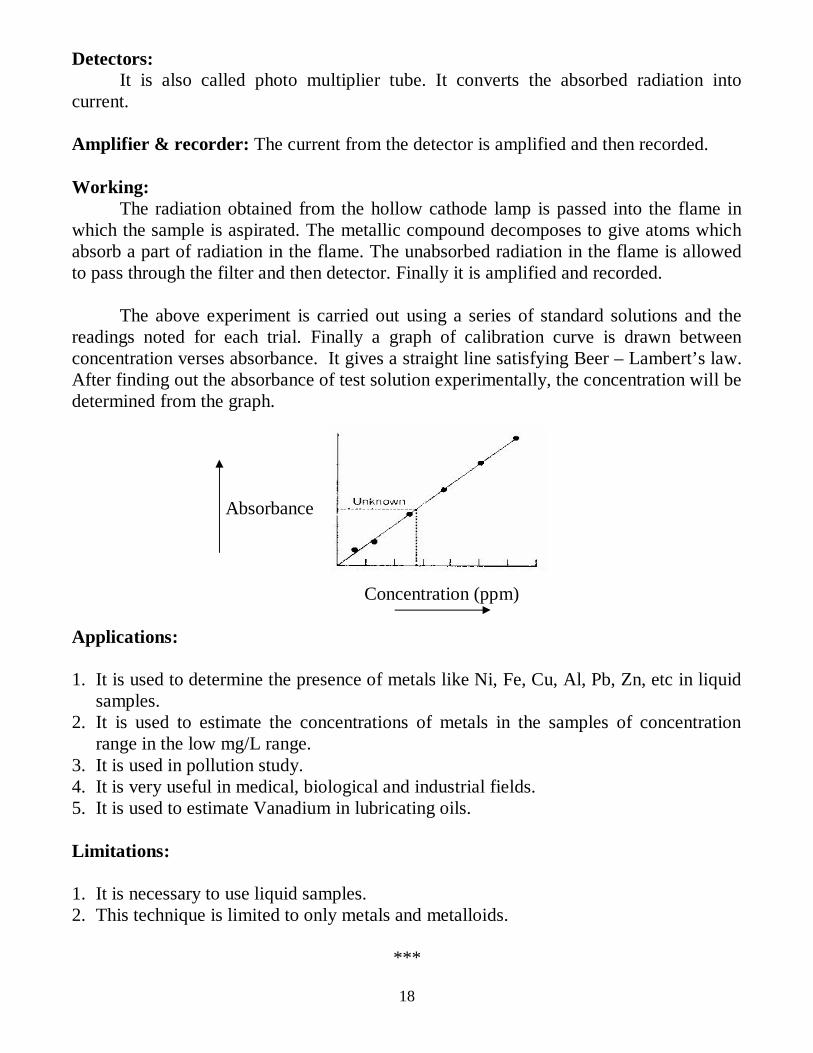
The above experiment is carried out using a series of standard solutions and the readings noted for each trial. Finally a graph of calibration curve is drawn between concentration verses absorbance. It gives a straight line satisfying Beer – Lambert’s law. After finding out the absorbance of test solution experimentally, the concentration will be determined from the graph.
Absorbance
Concentration (ppm)
Applications: 1. It is used to determine the presence of metals like Ni, Fe, Cu, Al, Pb, Zn, etc in liquid
samples. 2. It is used to estimate the concentrations of metals in the samples of concentration
range in the low mg/L range. 3. It is used in pollution study. 4. It is very useful in medical, biological and industrial fields. 5. It is used to estimate Vanadium in lubricating oils. Limitations: 1. It is necessary to use liquid samples. 2. This technique is limited to only metals and metalloids.
***
19
Estimation of Nickel ion by AAS: It involves the following steps: Step: 1.
The stock solution of Ni(NO3)2 is prepared by dissolving 1g of Ni(NO3)2 in minimum of dil. HNO3 and then diluted to 1 L with 1% HNO3. Step: 2.
With the help of a pipette and the stock solution, five different standard solutions of concentration 2, 4, 6, 8 and 10 ppm are prepared. Step: 3.
The atomic absorption spectrophotometer is adjusted to zero absorbance (100% transmittance) by aspirating the blank solution into the flame. Step: 4. Working:
The radiation obtained from the hollow cathode lamp is passed into the flame in which the sample is aspirated. The metallic compound decomposes to give atoms which absorb a part of radiation in the flame. The unabsorbed radiation in the flame is allowed to pass through the filter and then detector. Finally it is amplified and recorded.
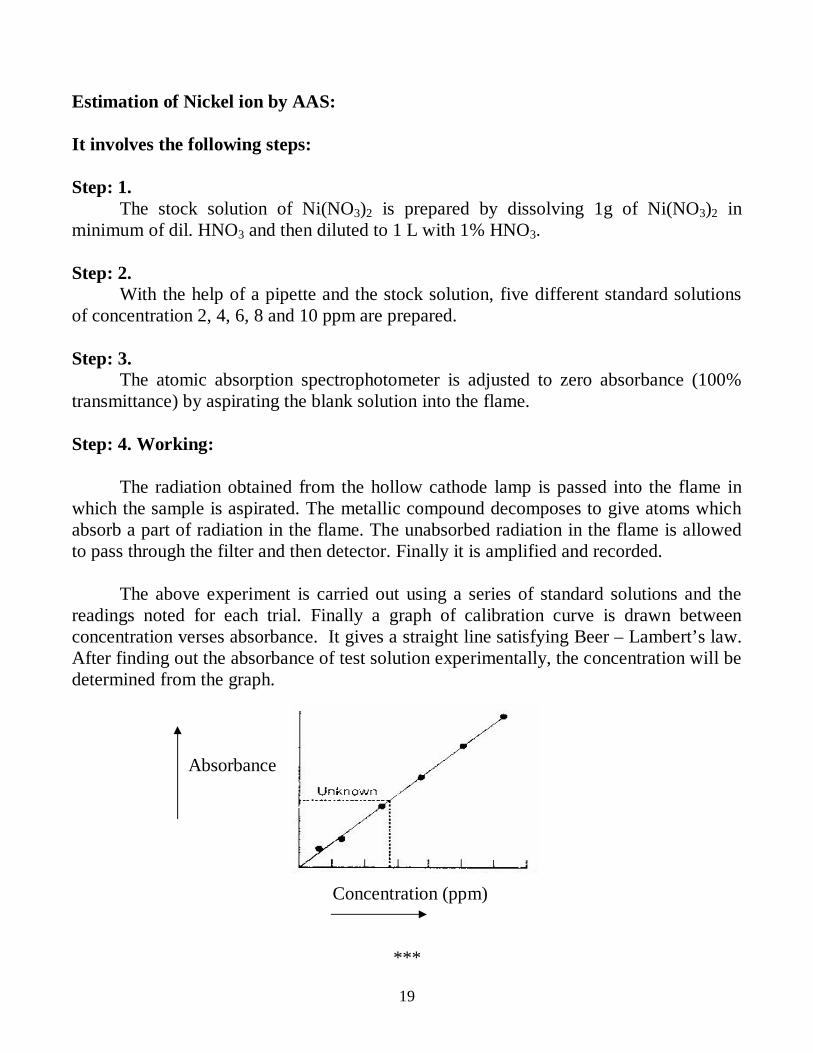
The above experiment is carried out using a series of standard solutions and the
readings noted for each trial. Finally a graph of calibration curve is drawn between concentration verses absorbance. It gives a straight line satisfying Beer – Lambert’s law. After finding out the absorbance of test solution experimentally, the concentration will be determined from the graph. Absorbance Concentration (ppm)
***

20
Problems based on Beer – Lambert’s law:
1. A solution of thickness 2 cm transmits 40% incident light. Calculate the concentration of the solution, given that ε = 6000 dm3/mol/cm. Answer: 3.316 X 10 – 5 mol / dm3.
2. Calculate the optical density, if 10% of incident light is transmitted. Answer: 1.0
3. A solution shows a transmittance of 20%, when taken in a cell of 2.5 cm thickness. Calculate its concentration, if the molar absorption coefficient is 12000 dm3/mol/cm. Answer: 2.33 X 10 – 5 mol / dm3.
4. Calculate the molar absorptivity of a 1 x 10 – 4 M solution, which has an absorbance of 0.20, when the path length is 2.5 cm. Answer: 800 dm3/mol/cm.
5. Calculate the absorbance of a solution when the transmittance is 33%. Answer: 0.4814
References:
Engineering chemistry – 15th Edition By Jain and Jain, Dhanpat Rai Publishing Company, New Delhi.
Engineering chemistry – S.S. Dara, S.Chand & Co., New Delhi.
Anna University Model question papers.
Anna University Previous semester examination question papers.
***

21
QUESTION BANK PART – A 1. State Beer – Lambert’s law. Mention it drawbacks. 2. Define molar absorption co-efficient of a solution. 3. IR spectra is often characterized as molecular finger prints. Justify this statement. 4. A molecule like HCl can undergo stretching vibration only, while a molecule like CO2
can undergo stretching as well as bending vibrations. Explain. 5. Methane does not absorb IR energy. Why? 6. What are chromophores? Give examples. 7. What are auxochromes? Give examples. 8. Which one of the following three modes of vibration of a linear tri atomic molecule
AB2 are IR active? (a) B A B (b) B A B (c) B - A - B
9. How many normal modes of vibrations are possible for (a) ethane (b) benzene. 10. How many normal modes of vibration do you expect from,
(a) CO2 (b) SO2 (c) Chloroform. 11. In colorimetric estimation of each metal ion in solution, a particular filter is selected.
Give reason. 12. Complexing agents are added to colourless solution of given specimens during
absorption spectroscopy. Explain. 13. Can a colourless solution of a compound be estimated by using colorimetry? Give an
example. 14. Mention any three applications of colorimetry. 15. What is finger print region? Give its importance. 16. Mention the uses of a finger print region. 17. Mention any two disadvantages of atomic absorption spectroscopy. 18. What happens to a molecule, when it is irradiated with
(a) IR radiation (b) Microwave radiation. 19. What are the number of vibrational modes for a (a) (b) 20. Calculate the number of IR bands for (a) Methane (b) Ethene (c) CO2 (d) Water. 21. Mention any two applications of IR spectroscopy. 22. Give the frequency region of IR spectrum. 23. Mention the transitions that are responsible for molecular spectra. 24. What is bathochromic shift? 25. What is hypsochromic shift? 26. Name any four metals which can be detected and estimated by flame photometry. 27. What are the sources of radiation in UV – visible spectrum? 28. What is flame photometry? 29. What are the important processes that occur in the flame emission spectroscopy?

22
30. What is a colorimeter? 31. Mention the components of a colorimeter. 32. What is monochromatic radiation? Give an example. 33. Write the functions of (a) Detector (b) Amplifier. 34. Write a note on (a) Radiation source (b) Recorder. 35. Name the various types of electronic transitions. 36. Name the different types of electrons present in organic molecules. 37. Write a note on (a) Hyperchromic effect (b) Hypochromic effect. 38. Mention the radiation sources of the following:
(a) UV – visible spectrophotometer (b) IR spectrophotometer (c) Colorimeter (d) Flame photometer (e) Atomic absorption spectrophotometer.
39. Mention any two applications of AAS. 40. Mention any two applications of flame photometry. 41. Give the block diagram of AAS. 42. Write down the principle involved in FES. 43. Mention the analytical techniques by whichthe following ions can be estimated in
their dilute solution. (a) Na+ ion (b) Fe3+ ion. 44. Name the various vibrations exhibited by CO2 molecule with respect to IR radiation. 45. Give two examples for each of the following: (a) Chromophores
(b) Auxochromes (c) IR inactive molecule (d) IR active molecule. 46. Mention the criteria for a molecule to exhibit IR spectra.
PART – B 1. State and explain Beer – Lambert’s law. 2. What is colorimetry? Explain the estimation of iron by colorimetry? 3. What is flame photometry? Give the theory, procedure and applications of
flame photometry. 4. Describe the instrumentation, principle and working of AAS. 5. How will you estimate the Nickel by AAS? 6. Discuss the estimation of Sodium by FES. 7. Discuss the applications of UV spectroscopy. 8. Discuss the applications of IR spectroscopy. 9. Explain different types of vibration exhibited by CO2 and water molecules in IR
spectroscopy. 10. Give the block diagram of the following spectrophotometers
(a) AAS (b) UV – visible spectrophotometer (c) FES (d) Colorimeter (e) IR
******