unit b1 *gsd12* *g5802* higher tier - revision science
TRANSCRIPT

10176
*G5802*
Centre Number
Candidate Number
TIME1 hour.
INSTRUCTIONS TO CANDIDATES
Write your Centre Number and Candidate Number in the spaces provided at the top of this page.You must answer the questions in the spaces provided.Do not write outside the boxed area on each page or on blank pages.Complete in blue or black ink only. Do not write with a gel pen.Answer all nine questions.
INFORMATION FOR CANDIDATES
The total mark for this paper is 70.Figures in brackets printed down the right-hand side of pages indicate the marks awarded to each question or part question.Quality of written communication will be assessed in Question 4(b).
*GSD12*
*GSD12*
*24GSD1201*
*24GSD1201*
Double Award Science: BiologyUnit B1Higher Tier
[GSD12]TUESDAY 17 MAY 2016, AFTERNOON
General Certificate of Secondary Education2015–2016

10176
1 (a) Plants take up minerals from the soil using specialised cells. The drawing shows one of these specialised cells.
Source: Principal Examiner
(i) Name this specialised cell.
[1]
(ii) Use the drawing to describe and explain how this cell is adapted for its role in mineral uptake.
[2]
*24GSD1202*
*24GSD1202*

10176[Turn over
(b) Farmyard manure is a natural fertiliser. The table shows the mass of three minerals in farmyard manure and in an
artificial fertiliser.
Mass of mineral/kg/tonne
Fertiliser Nitrate Phosphate Potassium
Farmyard manure 6.0 3.5 8.0
Artificial fertiliser 200.0 100.0 100.0
(i) Plants use nitrates to make a substance needed for growth. Name this substance.
[1]
(ii) There is an advantage in using artificial fertiliser rather than farmyard manure.
Give data from the table that supports this statement.
[1]
(iii) Give three advantages of using farmyard manure rather than artificial fertiliser.
1.
2.
3.
[3]
*24GSD1203*
*24GSD1203*

10176
2 (a) When coal and oil are burned, they produce air pollutants. Sulfur dioxide is one of these air pollutants. Coal and oil are the main fuels burned for heating homes in Belfast. Natural gas is another fuel that has become recently available for heating homes
in Belfast.
The table shows sulfur dioxide levels in Belfast city centre from 1990 to 2010.
Year Sulfur dioxide level/µg/m3
1990 65
1995 47
2000 18
2005 7
2010 5 © Crown Copyright. Air pollution in Northern Ireland by Alison Loader and Paul Willis. Department of Environment. ISBN: 978-1-907053-39-9
Use the table and the information given to answer the following.
(i) Which 10 year period showed the greatest decrease in sulfur dioxide levels? Give this decrease.
Show your working.
• 10 year period: to
• Decrease: µg/m3 [2]
(ii) Explain why sulfur dioxide levels have decreased.
[1]
*24GSD1204*
*24GSD1204*

10176[Turn over
Lichens are small organisms that are found living on rocks, walls and trees. They are sensitive to air pollution, especially sulfur dioxide.
The photographs show three types of lichen, a crusty, a leafy and a shrubby lichen.
Crusty lichen Leafy lichen Shrubby lichen
© Dr Jeremy Burgess / Science Photo Library © Claude Nuridsany & Marie Perennou / © mtreasure / iStock / Thinkstock Science Photo Library
• Crusty lichens can survive in levels of sulfur dioxide up to 70 µg/m3. • Leafy lichens can survive in levels of sulfur dioxide up to 59 µg/m3. • Shrubby lichens only survive in levels of sulfur dioxide below 19 µg/m3.
(b) Use this information and the table opposite to give the type of lichen that would have been found in Belfast city centre in 1990.
Type of lichen:
Reason for choice:
[2]
(c) Sulfur dioxide levels in Belfast city centre are now low. Explain why it is still important to continue monitoring the level of sulfur dioxide.
[1]
*24GSD1205*
*24GSD1205*
10176
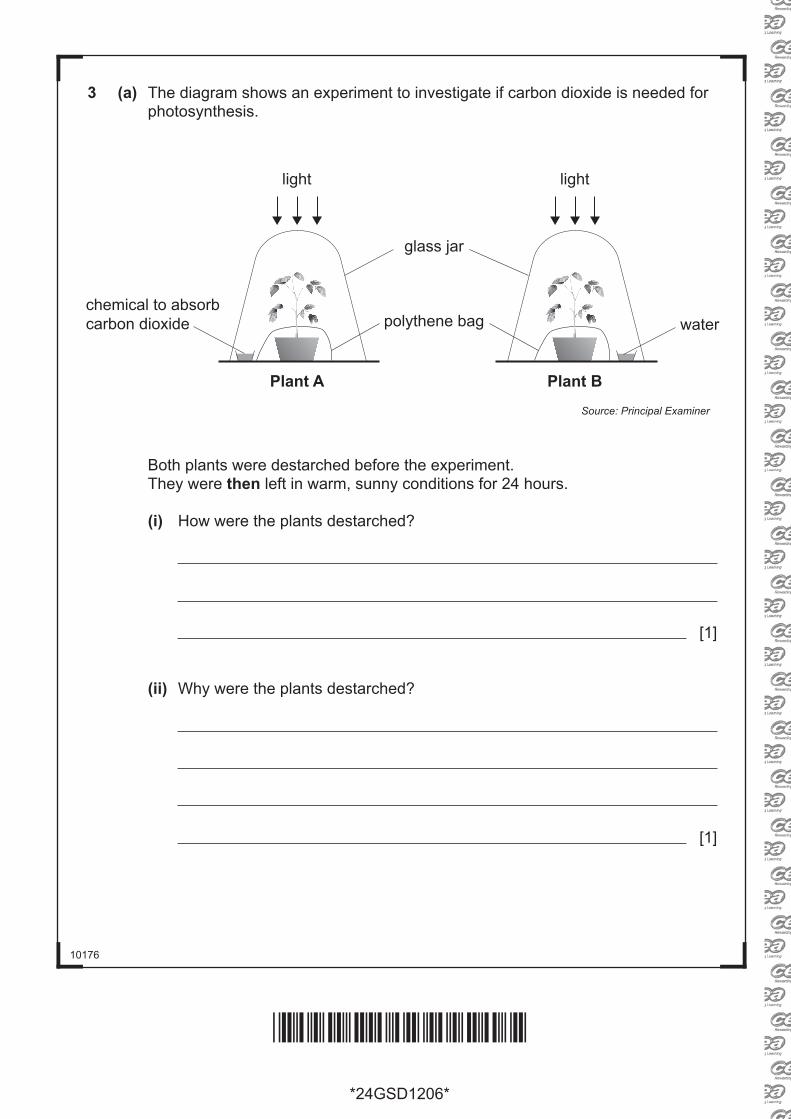
3 (a) The diagram shows an experiment to investigate if carbon dioxide is needed for photosynthesis.
light
Plant A
chemical to absorbcarbon dioxide
glass jar
polythene bag
light
Plant B
water
Source: Principal Examiner
Both plants were destarched before the experiment. They were then left in warm, sunny conditions for 24 hours.
(i) How were the plants destarched?
[1]
(ii) Why were the plants destarched?
[1]
*24GSD1206*
*24GSD1206*

10176[Turn over
(iii) Bacteria are living organisms present in the soil in the plant pots. Suggest why the plant pots are covered with polythene bags.
[2]
(iv) After 24 hours in warm, sunny conditions, a leaf from plant A and a leaf from plant B were tested for starch using iodine solution.
Describe and explain the results you would expect for the leaf from plant A and the leaf from plant B after testing with iodine solution.
[3]
*24GSD1207*
*24GSD1207*

10176
(b) Jude carried out an experiment to measure the rate of photosynthesis in a water plant at different light intensities.
The diagram shows the apparatus he used.
lamp
water plant
oxygen bubble
inverted funnel
beaker containing water
Source: Principal Examiner
The light intensity decreases as the lamp is moved further away from the plant.
Jude counted the number of oxygen bubbles given off by the plant in one minute at different distances of the lamp from the plant.
*24GSD1208*
*24GSD1208*

10176[Turn over
The graph shows the results of Jude’s experiment.
0
20
10
30
50
70
40
60
100 20 30 40 50
Distance of lamp from the plant /cm
Num
ber o
f oxy
gen
bubb
les
in o
ne m
inut
e
(i) Use the information given opposite and the graph to describe what happens to the number of oxygen bubbles given off by the plant as the light intensity decreases.
[1]
(ii) At what distance of the lamp from the plant did the plant produce 24 oxygen bubbles in one minute?
cm [1]
(iii) When Jude moved the lamp to a different distance, he waited for two minutes before counting the number of oxygen bubbles.
Explain why he did this. [1]
*24GSD1209*
*24GSD1209*
10176
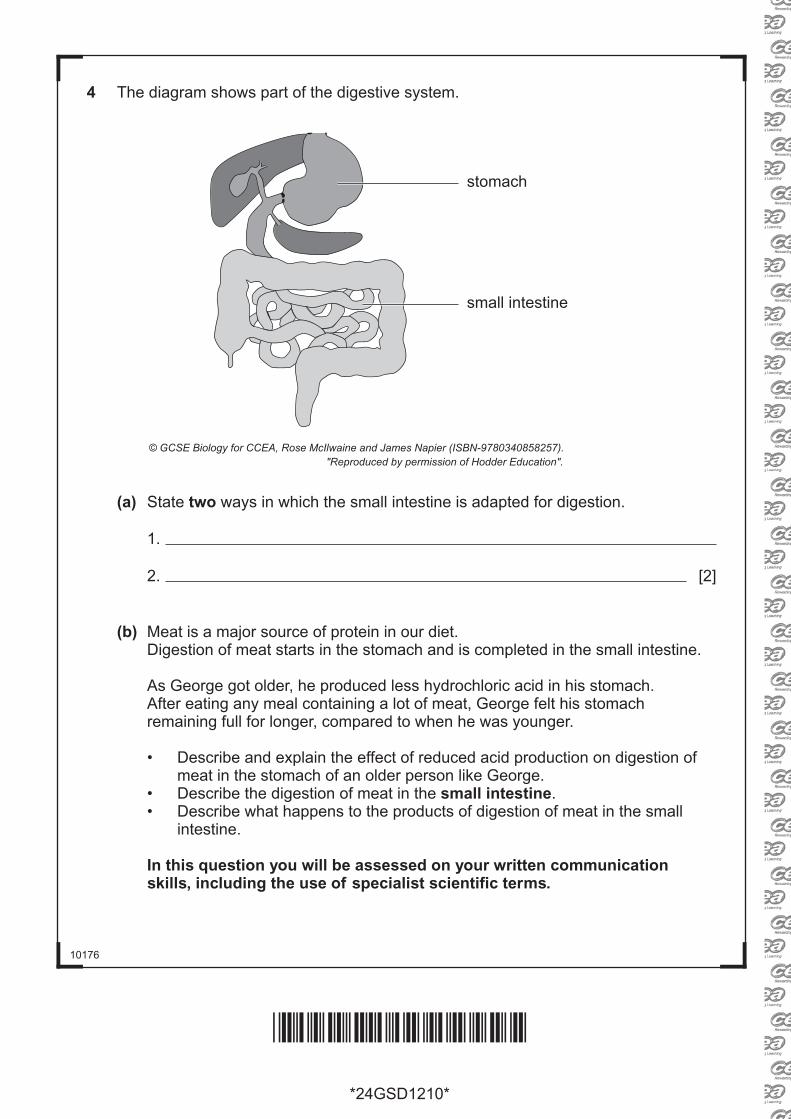
4 The diagram shows part of the digestive system.
small intestine
stomach
© GCSE Biology for CCEA, Rose McIlwaine and James Napier (ISBN-9780340858257). "Reproduced by permission of Hodder Education".
(a) State two ways in which the small intestine is adapted for digestion.
1.
2. [2]
(b) Meat is a major source of protein in our diet. Digestion of meat starts in the stomach and is completed in the small intestine.
As George got older, he produced less hydrochloric acid in his stomach. After eating any meal containing a lot of meat, George felt his stomach
remaining full for longer, compared to when he was younger.
• Describe and explain the effect of reduced acid production on digestion of meat in the stomach of an older person like George. • Describe the digestion of meat in the small intestine. • Describe what happens to the products of digestion of meat in the small
intestine.
In this question you will be assessed on your written communication skills, including the use of specialist scientific terms.
*24GSD1210*
*24GSD1210*

10176[Turn over
[6]
*24GSD1211*
*24GSD1211*

10176
5 (a) The photographs show a bat and an owl.
Bat Owl
© KirsanovV / iStock / Thinkstock © Andy Harmer / Science Photo Library
Read the passage and use the information and your knowledge to answer the
questions that follow.
Owls feed on bats. While flying, bats eat large numbers of small flies that feed on a few trees.
(i) Draw a pyramid of numbers for the organisms given in the passage. Label the organisms.
[3]
(ii) As well as feeding on trees, the small flies feed on crops like wheat. Give one advantage to a crop farmer of having bats living nearby his fields.
[1]
*24GSD1212*
*24GSD1212*

10176[Turn over
(b) Fish also eat small flies. Ponds have large numbers of small flies. This makes ponds good habitats for
both bats and fish. If there is a sudden increase in the fish population, their waste substances can
lead to a build-up of nitrates in the pond. This can cause eutrophication.
(i) Describe and explain how eutrophication can result in a lack of oxygen in the pond.
[4]
(ii) The lack of oxygen can lead to the death of fish in the pond. Describe and explain how this may affect the bat population living near
the pond.
[2]
*24GSD1213*
*24GSD1213*

10176
6 The diagram shows the flow of energy through a grassland ecosystem.
Sunlight ProducerPrimary
ConsumerSecondary Consumer→ → →
(a) At what trophic level are producers found?
[1]
(b) The amounts of energy in a food chain for a Northern Ireland beef cattle farm are given below.
Figures are in kJ/m2/year.
Grass60 000
Beef Cattle4000
Human350→ →
(i) Name the secondary consumer in this food chain.
[1]
(ii) Calculate the percentage of energy that is transferred between the grass and the beef cattle.
Show your working.
% [2]
*24GSD1214*
*24GSD1214*

10176[Turn over
(iii) Give two reasons for the loss of energy between the grass and the beef cattle.
1.
2.
[2]
(iv) The farmer decided to keep the beef cattle in a shed. The beef cattle do not have much space to move around in the shed. Suggest why keeping the beef cattle in the shed is more profitable for
the farmer.
[2]
*24GSD1215*
*24GSD1215*

10176
7 Amy carried out an experiment to investigate the effect of three different temperatures on the activity of the enzyme amylase.
The diagram shows the set-up at the start of the experiment.
starchsolution
10 ºC
amylasesolution
starchsolution
20 ºC
amylasesolution
starchsolution
40 ºC
amylasesolution
1 2 3 4 5 6
waterbath
Source: Principal Examiner
Amy kept the starch and amylase solutions separate in their water baths for five minutes.
She then added the contents of test tubes 1 and 2 together, 3 and 4 together and 5 and 6 together and placed them back in their water baths.
After mixing, she took a small sample from each of the three mixed solutions and tested it with iodine solution immediately and at one minute intervals, until no blue/black colour was seen.
The table shows her results.
Temperature/°C Time taken until no blue/black colour was seen/minutes
Speed of reaction
10 17
20 8
40 3
*24GSD1216*
*24GSD1216*

10176
(a) Explain why Amy kept the starch and amylase solutions separate in their water baths for five minutes before adding them together.
[1]
(b) Complete the table opposite to describe the speed of the starch/amylase reaction at the three temperatures.
Choose from the words fast, medium and slow. [1]
(c) What colour would the iodine solution be if added to the mixed solution after 18 minutes at 10 °C?
[1]
(d) The results may not show the best temperature for amylase activity. Suggest how the experiment could be modified to find the best temperature for
amylase activity.
[1]
(e) Describe and explain how the results of this experiment would differ if Amy had used boiled amylase solution.
[3]
*24GSD1217*
*24GSD1217*
[Turn over

10176
8 Animals and plants contain protein. Nitrogen is present in protein.
(a) Describe how the nitrogen in protein is released into the soil when animals and plants die.
[2]
*24GSD1218*
*24GSD1218*

10176[Turn over
Waterlogged soil contains very little oxygen compared to normal soil. The photograph shows a crop growing in waterlogged soil.
© photosbyjim / iStock / Thinkstock
The crop is not growing well.
(b) Use your knowledge of the nitrogen cycle to explain why the crop is not growing well in the waterlogged soil.
[3]
*24GSD1219*
*24GSD1219*

10176
9 The table shows the sources and masses of carbon dioxide emissions between 1990 and 2013 in the United Kingdom (UK).
Source
Mass of carbon dioxide emissions/millions of tonnes
1990 2013
Electricity generation 241.5 178.5
Transport 119.6 116.7
Business 113.7 75.4
Residential 79.0 76.9
Other 37.3 16.8
Total 591.1 464.3
© Crown Copyright. 2013 UK greenhouse gas emissions. Department of Energy & Climate Change, National Statistics
Use the table and your knowledge to answer the following questions.
(a) Suggest two reasons for the decrease in the amount of carbon dioxide emissions caused by electricity generation.
1.
2.
[2]
*24GSD1220*
*24GSD1220*

10176
(b) The total mass of carbon dioxide emissions in the UK from all sources has decreased between 1990 and 2013.
Suggest two reasons why global emissions of this gas continue to rise.
1.
2.
[2]
(c) A hectare is an area of land. The total land area available to plant trees in the UK is 23 million hectares. A one hectare area of trees absorbs, on average, 11 tonnes of carbon dioxide in
one year.
(i) Use the data in the table opposite to calculate the area of trees that would need to be planted to absorb the total mass of carbon dioxide emissions in the UK in 2013. Give the units.
Show your working.
Area of trees [3]
(ii) Planting trees is only part of the solution in reducing the mass of carbon dioxide emissions in the UK.
Use your calculated area from (c)(i) and the information given to explain why this statement is true.
[1]
*24GSD1221*
*24GSD1221*

10176
THIS IS THE END OF THE QUESTION PAPER
*24GSD1222*
*24GSD1222*
BLANK PAGE
DO NOT WRITE ON THIS PAGE

10176
*24GSD1223*
*24GSD1223*
BLANK PAGE
DO NOT WRITE ON THIS PAGE

10176
Permission to reproduce all copyright material has been applied for.In some cases, efforts to contact copyright holders may have been unsuccessful and CCEAwill be happy to rectify any omissions of acknowledgement in future if notified.
Examiner Number
For Examiner’suse only
QuestionNumber Marks
1 2 3 4 5 6 7 8 9
TotalMarks
DO NOT WRITE ON THIS PAGE
*24GSD1224*
*24GSD1224*