unit 8 sm20 - university of rhode island
TRANSCRIPT


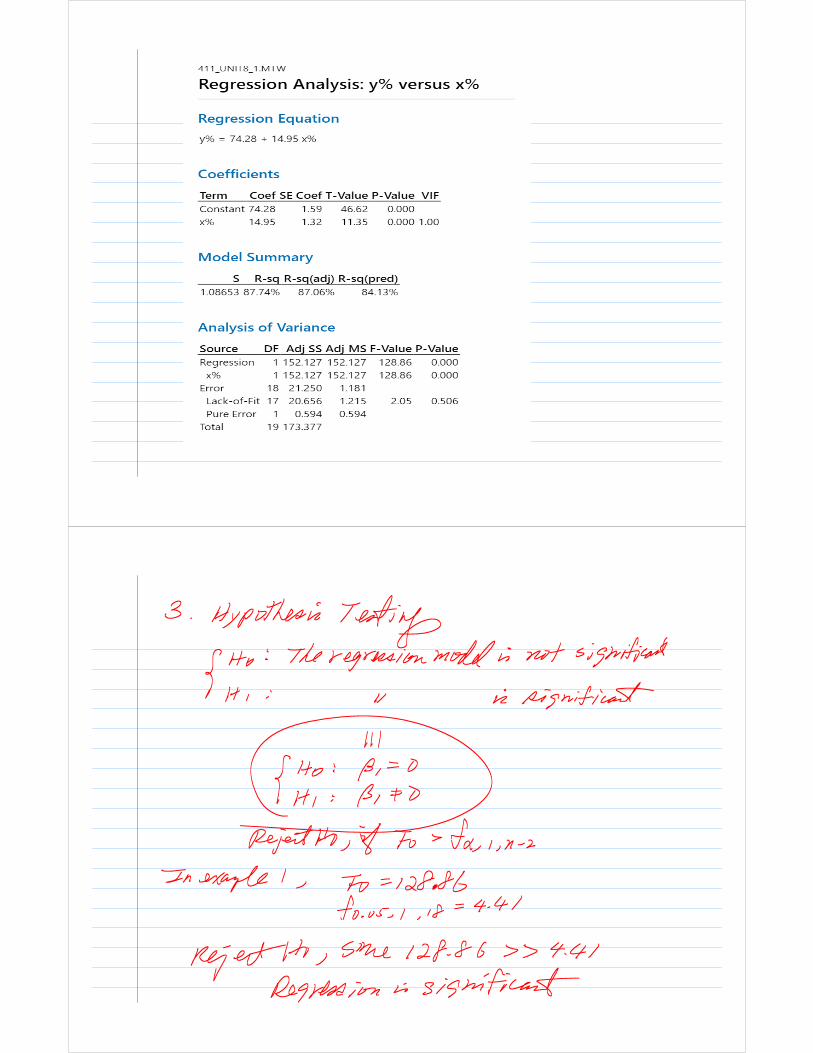
Example 1:
. Consider the data in the table below where y is the purity of oxygen produced in a chemical distillation process, and x is the percentage hydrocarbons that are present in the main condenser of the distillation. Find the relationship between the percentage hydrocarbon and the purity of oxygen produced.
Observation Number
Hydrocarbon Level, x%
Purityy%
Observation Number
Hydrocarbon Level, x%
Purity
y%1 0.99 90.01 11 1.19 93.542 1.02 89.05 12 1.15 92.523 1.15 91.43 13 0.98 90.564 1.29 93.74 14 1.01 89.545 1.46 96.73 15 1.11 89.856 1.36 94.45 16 1.20 90.397 0.87 87.59 17 1.26 93.258 1.23 91.77 18 1.32 93.419 1.55 99.42 19 1.43 94.9810 1.40 93.65 20 0.95 87.33


Example 2.In a study of the particle emission rate of a combustion engine, the emission rate (y) and the combustion temperature (x) were recorded as follows.
Obs. no.
x y Obs. no.
x y Obs. no.
x y
1 1148 724 9 867 550 17 1357 10072 1638 1293 10 1158 870 18 1405 9783 1678 1296 11 1082 669 19 1127 8494 1292 925 12 907 517 20 1073 6705 1422 1078 13 752 495 21 1308 9536 1285 948 14 1115 692 22 812 4977 1152 893 15 1307 1014 23 1260 7988 1357 1077 16 1528 1282 24 1008 657
25 875 580Determine whether there is a valid linear relationship between the emission rate and the combustion temperature. Assess the adequacy of the regression model, test the regression model significance of regression, and construct 95% confidence intervals on the slope and intercept.

Example 3Suppose that we have the following data showing the relationship between x (no. of drops) and y (temperature) in a chemical process.
x 1 1 2 2 3 3 4 5 6 7y 43 40 71 74 107 109 158 209 270 341
Fit a simple linear regression model between x and y. Test the regression model for lack of fit and significance of regression.

