unit 3- epidemiological study designs - university of the …€¦ · · 2016-09-15unit...
TRANSCRIPT

UNIT 3-Epidemiological
Study Designs
Introduction
This Unit presents an overview of the various possibilities in which an epidemiological study can organise data collection and analysis (study designs).
A Study Design is a structure which guides the way in which a study is conducted. Since epidemiology is located within the positivist quantitative tradition of research, which follows the scientific research method, it is not surprising that it has developed a fairly rigid set of study designs. Each study design has its own internal logic and is suited for various types of research questions. These study design types originally arose by the trial and error technique and became refined with repeated use over time. To appreciate the variety of study designs and their varied uses one would have to revisit why anyone would want to conduct an epidemiological study. One would conduct an Epidemiological Study in order:
• To describe health and ill-health (disease) conditions in a comprehensive manner:
What is the disease, how does it manifest, what is it’s progression and prognosis
Who gets the disease (which groups of people)
Where does it occur (in which area is it more common or more severe)
When does it occur (is it seasonal, has it changed over time) • To assess if there is an association with an exposure and an ill-health condition:
Does an exposure (smoking, bacteria) cause a disease
Does an exposure (vaccination, diet) prevent a disease
Does an exposure improve/cure (insulin, antibiotic) a disease The various study designs were then each developed to accomplish one or more of the above objectives. However there are two broad categories of epidemiological studies. Epidemiological studies can be either: A. Observational studies B. Intervention Studies In Observational Studies the researcher merely observes things (e.g. being exposed to contaminated drinking water) that have occurred amongst a group and then (almost always) compares them to another group without that occurrence (e.g. had uncontaminated drinking water) and then checks if that thing (contaminated drinking water in this example) might have been responsible for different levels of disease (e.g. gastroenteritis in this example) or different levels of good health. Whereas in Intervention Studies the researcher actively intervenes by doing something for one group, such as providing health education about treatment of gastroenteritis, but not for another similar group and then assesses the outcome of that intervention in relation to what it had hoped to achieve (e.g. ensure a speedy recovery from gastroenteritis and prevent any complications developing, in this example). One could also do different things for each group instead of doing something for one group and nothing for the other group (e.g. give lots of
3

health education to one group and give minimal health education to another group) and assess the outcome. Observational Studies can be further subdivided into Descriptive or Analytical studies, whereas all Intervention studies are Analytical studies. Descriptive Studies investigate mainly the What, Who, Where and When of health and ill-health. Analytical Studies investigate mainly the association between an exposure and an outcome (for example whether contaminated water (an exposure) causes gastroenteritis (a disease). However despite these two sub-types of studies being possible one should note that in practice most studies have both descriptive and analytical components but one of them would be more prominent than the other in the various study designs. Having grouped and sub-grouped the study designs it is now time to introduce you to each one of them. The figures below lists all the types of epidemiological study designs group as first Observational or Intervention (experimental) study designs with the Observational study designs then further split into Descriptive and Analytical sub-types. Thereafter the individual study designs are listed. The individual study designs are listed in order of their ability (all else being equal) to assess whether an exposure is likely to have caused a disease or not. In other words they are listed in order of analytical strength.
Each study design has its own inbuilt logic and rules, with the reasonable assumption that if you scrupulously follow those rules then you will have competently executed the study. In general this is correct. However just as there is no perfect study there is no perfect study design. Hence every study design has inbuilt into it (besides its logic and rules) its own foibles and deficiencies. Thankfully also inbuilt are the unique advantages peculiar to that study design. So when using a particular study design one should note its particular strengths and weaknesses and then decide

if it is the appropriate study design for the research question which one wishes to investigate. If it is appropriate then one should consider whether some other study design might not be better to use. In addition one would have to assess if implementing that study design would be more practicable and or more cost effective than another study design. Based on the above criteria (study design appropriate, best possible study design that is practicable and cost effective) one then makes a judgement regarding which study design to use, to answer any particular research question. Of course making such a judgement requires that one have some knowledge of all available study design options, as well as the strengths and limitations of each study design option. This Unit is designed to build on that base and provide you with the knowledge and skills to enable you to easily choose the most appropriate study design to use. Of course having chosen an appropriate study design one is still left with the problem of executing that study design properly. The other goal of this Unit is to provide you with sufficient skills to implement each of the epidemiological study designs and to interpret and critique any published epidemiological study. We will now proceed to briefly examine each of the study designs starting with the one at the top (the one with the least analytical causative strength) the case series (and single case) and then move to the one at the bottom (the one with the most analytical causative strength) the randomised controlled trial. Thereafter we will go through each of the study designs in a set order that facilitates distinguishing between them.

Unit 3- Observational studies Descriptive Session 1: Cross-sectional Descriptive Studies
Introduction
Below a brief summary of a cross-sectional descriptive study is provided. Later, a summary of a
cross-sectional analytical study is provided, highlighting the differences and similarities between
these types of studies. After this a reading, which covers the topic in more detail, is expected to
be worked through. This is then followed by tasks and feedback.
Timing This session should take you about 2 hours to do. In this session, there is one reading.
Learning Outcomes Define a Cross-sectional descriptive study and its main features
Learn how results from a Cross-sectional descriptive study can be appropriately
presented
Know the major strengths and limitations of this study design
Defining and Using Cross- sectional descriptive studies
A group of people (community, or suburb, or district, or province, or country) is assessed for occurrence of a disease or diseases at a point in time (or a period in time). So the amount of people with the disease as a proportion of the total population is calculated. This is also called the prevalence of disease (e.g. what proportion of people in the population of a district are infected with HIV). In addition to assessing the prevalence of disease amongst the total population one could also assess it amongst sub-groups such as the elderly, or young children, or adult men, etc. (e.g. prevalence of HIV amongst children aged 10 years or younger). The distinction between a point in time and a period in time, is that for a point in time the prevalence of disease is assessed at that point (e.g. a study done in January 2013 to assess who has HIV at the time of the study) while for a period in time it would be a follow-on from the point in time (e.g. a study done to assess HIV prevalence in January 2013 and then followed up to include cases that occur afterwards up until June 2014). This gives the point prevalence (January 2013) and the period prevalence (Jan 2013 to June 2014) respectively of HIV amongst the population that was studied. The key use of this type of study then is to assess prevalence of disease amongst a group of people or within sub-groups in the overall group you are interested in. Knowing the amount and proportion of disease means that you can plan to provide health services to treat (or cure if possible) that proportion of people and if possible prevent the disease amongst those who do not have it.

Research Problem it Primarily Addresses
It investigates and explores ramifications of a disease/s (e.g. tuberculosis or malaria) and/or a health service/s (e.g. quality of care for TB services or insecticide spraying for mosquitoes). It investigates who gets (or doesn’t get) an identified disease and who receives (or doesn’t receive) a service; who gets variants of the disease (mild form or severe form) or who get variants of the service (basic care or extended care); where (in which areas) the disease is more prominent or where the service is better supplied; and which sub-groups of the population get the disease or which sub-groups of the population access which type of services.
Study Population
The study population is always a distinct group. This could be any group but it must be a specifically circumscribed group who are clearly identified. Examples of study populations could be people living in a suburb, people living in a district, people living in a province, residents in a country, students registered at a school, people working in a specific factory (e.g. clothing factory X or Farm Y), people working in a particular industry (e.g. clothing manufacturers or wine farmers).
Both inclusion and exclusion criteria should be provided when describing the study population. The inclusion criteria describe exactly who are included in the study population and by extension who are not included in the study population. The exclusion criteria then further refine the included study population by specifically excluding particular sub-sets of those initially included in the study population. Note that the exclusion criteria are not just the opposite of the inclusion criteria. They are further refinements.
Sampling
In general since cross-sectional descriptive studies usually involve the assessment of large groups (except on the few occasions when they are used to assess specific places of employment or schools) one would almost always require a sample. Since the group has to be clearly defined, random sampling or systematic is usually feasible with small to medium size groups. With larger groups one would have to employ multi-stage random or systematic sampling.
Data Collection Procedures

Data would typically be collected from those members of the group selected into the sample via a questionnaire (e.g. diseases they are being treated for) or via accessing their records (e.g. diseases diagnosed or services used), or via direct measurement (e.g. blood pressure, weight, height).
Analysis
The proportion (prevalence) of those with the diseases or the proportion of the health services meeting specified preconditions is calculated (a measure of frequency) and could be grouped into sub-groups relating to time or place or person. This would give the prevalence of the disease overall amongst the population and in various sub-groups (e.g. age or gender), or at various times, or in various locations.
Strengths
It provides lots of information on particular health problems (diseases) and the provision of health services within a community (population) under study such as a district, or province, or region, or country or any group of people. It informs one not only of the burden of disease within a population but also which section of the population bears the burden of which diseases (health problems). It provides insight on which health services are provided to which groups and how those health services are provided and it allows one to assess the match of health services to the burden of disease.
Besides assessing the provision of health services it is useful to assess all facets of service provision. These would include coverage (how widespread are the services amongst various groups), appropriateness of the service provision given the burden of disease, quality of care provided by the services, acceptability of the services to the population, access to the services by the population, effectiveness of service provision, cost of service provision efficiency of service provision and equity of service provision.
The prevalence (or burden) of a variety of diseases (e.g. malaria) and subsets of diseases (e.g. cerebral malaria), as well as health problems (e.g. raised cholesterol, or obesity, or tobacco use, or alcohol abuse) can be assessed amongst the whole population when one is interested in or amongst sub-groups within that population.
It can be used to describe time trends of disease occurrence and health service provision and changes in diseases and health services over time in various places. It can additionally be used to assess changes in diseases and health problems when people migrate form one area to another, hence assessing environmental influences on diseases. Finally it can be used to assess the genetic influences on health by assessing the diseases/health problems encountered by close family members and in particular by studying twins.
Putting together information on diseases and health services would assist health managers and policy makers to decide how best to respond to the overall burden of diseases and health problem, as well as how to respond to particular types of diseases/health problems within the context of the overall burden and disease/health problems and within the constraints of existing resources.
It is useful for overall rational planning of health services and for allocation of health care resources.
It is relatively quick and easy to conduct as there are no long periods of follow-up, as data on all variables are only collected once.
Weaknesses
The study (whether point or period) measures the current prevalence and not the past or future prevalence of a disease, health problem or service provision. It therefore measures what is and

as such reflects both the likelihood of getting a disease and the likelihood of surviving with that disease or dying from or of being cured from the disease. If the disease has a high likelihood of mortality then there would be fewer people with the disease at any point or period in time, as several of them who developed the disease would have died. Hence the prevalence of disease is mixed up with the survival from it and hence is not a ‘clean’ measurement of the level of disease. Similarly if the disease has a high likelihood of being cured then there would be fewer people with the disease at any point or period in time, as several of them who developed the disease would have been cured. Hence again the prevalence of disease is not a ‘clean’ measurement of the level of disease as it is mixed up with the cure rate of the disease.
The prevalence of disease/ health problems in any cross-sectional descriptive study is usually limited to that particular study population amongst whom the study was conducted. Hence the results of a cross-sectional descriptive study cannot be assumed to extend to other communities. Generalisability of the results is therefore limited to the population under study.
It is not suitable for studying rare diseases as one would require a very large sample to detect the prevalence of rare diseases. It is not suitable for studying diseases with a short duration as one would obtain a falsely low prevalence as many of those who recently had the disease would no longer have it when the study is conducted. This disadvantage applies to a point prevalence study and not to a period prevalence study. It is susceptible to selection bias due to a low response rate as people selected into the sample come from a general population they would be less likely to be keen to participate in the study and might therefore decline participation. If the response rate is very low (below 60%) then serious selection bias is likely to be present.
One is unable to measure the incidence of disease as a cross-sectional descriptive study only measures the prevalence of disease.

Unit 3- Session 2: Case Series Introduction The Case Series refers to a group of people with a particular disease. This group is then assessed to determine if the individuals in the group have any exposures in common with each other as these exposures might then be candidates as a cause of the disease. A case series can also be used to ascertain the natural progression of the disease based on what happens to the people with the disease if there is no treatment for it (the natural history of the disease) or what happens to the people with the disease if there is one or more treatments for it (the treatment history).
Timing This is a very short session and should take you about 30 minutes to complete. Learning Outcomes
Define a Case Series and its main features
Learn the uses of a Case Series study design, and when this study design is appropriate
Know the major strengths and limitations of this study design
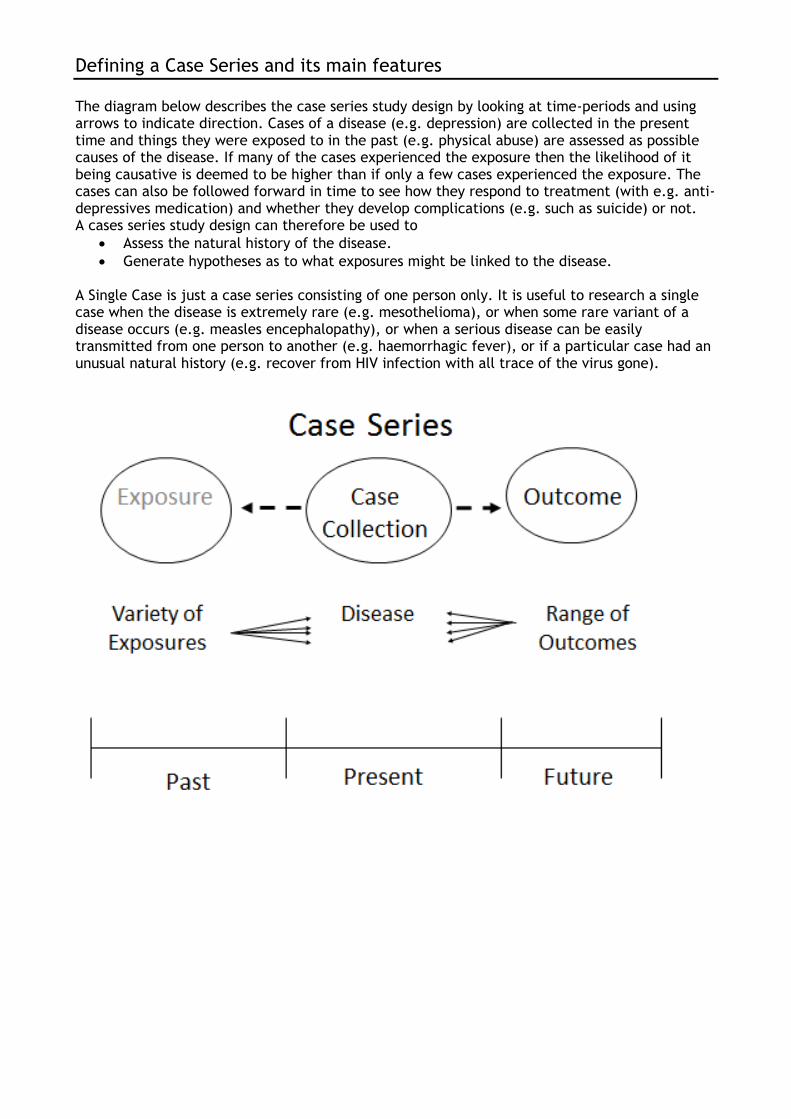
Defining a Case Series and its main features
The diagram below describes the case series study design by looking at time-periods and using arrows to indicate direction. Cases of a disease (e.g. depression) are collected in the present time and things they were exposed to in the past (e.g. physical abuse) are assessed as possible causes of the disease. If many of the cases experienced the exposure then the likelihood of it being causative is deemed to be higher than if only a few cases experienced the exposure. The cases can also be followed forward in time to see how they respond to treatment (with e.g. anti-depressives medication) and whether they develop complications (e.g. such as suicide) or not. A cases series study design can therefore be used to
Assess the natural history of the disease.
Generate hypotheses as to what exposures might be linked to the disease. A Single Case is just a case series consisting of one person only. It is useful to research a single case when the disease is extremely rare (e.g. mesothelioma), or when some rare variant of a disease occurs (e.g. measles encephalopathy), or when a serious disease can be easily transmitted from one person to another (e.g. haemorrhagic fever), or if a particular case had an unusual natural history (e.g. recover from HIV infection with all trace of the virus gone).
Unit 3 – Observational Analytical
Session 3: Prospective Cohort Studies
Introduction
A cohort study design is very similar in many respects to a randomised controlled trial which you will learn about in session 3.8. In both study designs one follows up two groups of people with one group being exposed to a risk factor for disease (or exposure) and the other not being exposed to that risk factor and then we compare the level of disease (or outcome) which develops in one group with the other group. If the group with the exposure develops more disease, then the exposure is associated with and might cause the disease. Conversely if the group with the exposure develops less disease, then the exposure is associated with and might prevent the disease. The key difference between a randomised controlled trial and a cohort study is that in a randomised controlled trial the researcher introduces the exposure (in the form of a specific intervention) to the intervention group who then becomes exposed. Hence it is an intervention study. Whereas in a cohort study the exposed group becomes exposed independent of the researcher and the researcher then merely observes whether that exposure is then associated with (causes or prevents) the disease or not. Hence it is an observational study.
Timing
This session should take you about one hour to do. In this session, there is one reading and a short task based on the reading. The feedback on the task has been provided to you but you are encouraged to attempt the task before checking the feedback.
Learning Outcomes
Define a Prospective Cohort study and its main features
Learn how results from a Prospective Cohort study can be appropriately presented
Know the major strengths and limitations of this study design

Defining and Using a Prospective Cohort Study
A group without a disease but with an exposure thought to be linked to the disease, is followed up for a period of time and then compared to a similar group without the exposure (and also without the disease and who were also followed up for the same period of time) to assess if the disease is more common in the exposed group or the unexposed group. If the disease (e.g. tuberculosis) over time develops more frequently amongst the exposed group (e.g. living in an over-crowded house) than amongst the unexposed group (don’t live in an over-crowded house) then the exposure might be causing the disease. The proportion of people who develop the disease over time is referred to as the incidence of disease. The incidence of disease is the number of new cases of the disease. As the people in the group did not have the disease to begin with, when they develop the disease it would be a new case of the disease. The incidence tells one how rapidly the disease is developing amongst a population. The main usage of this study design is when one wants to measure the new cases of a disease (incidence of disease) and assess which exposures might have caused the disease with the certainty that the exposure was present before the disease appeared. The period of time for which groups of people are followed up would then have to be sufficient for the disease (outcome) to have developed if it were going to develop. How long is ‘sufficient time’, is based on prior knowledge of the natural history of the disease.
Research Problem it Primarily Addresses
It is used to measure the incidence (new cases) of a disease (health problem) amongst a population. It is also used to assess whether an exposure (risk factor) for a disease (outcome) is indeed associated with that disease in a manner which is causal or preventive.
Study Population

The study population would be a group of people without the disease but who are able to develop the disease or are susceptible to developing it. Hence it seems obvious that women would be the only ones able to develop uterine cancer as men don’t have a uterus. However that would not be an accurate enough description of the susceptible group as women who have had their uterus removed would also not be able to develop uterine cancer. Hence those susceptible to uterine cancer would therefore be women with an intact uterus (or women who haven’t had a hysterectomy). However that is still not a sufficiently good description of the susceptible group as uterine cancer takes a long while to develop and hence young girls and young women do not get it. Therefore the susceptible group would have to be women with an intact uterus above a certain age. Of course the obvious question now is what age? That would have to be decided based upon a search of the literature to obtain a cut-off point below which it is extremely rare (note: not impossible but rather extremely rare) for women to develop uterine cancer. That age would then be the cut-off point and women above that age with an intact uterus are then the susceptible group. The susceptible group (or Cohort) would then have to be split into the:
Exposed Cohort: group of people with no disease but susceptible to the disease and exposed to the risk factor
Unexposed Cohort: similar group of people with no disease also susceptible to the disease but not exposed to the risk factor
Inclusion and exclusion criteria would then be used as in other study designs to define the exposed and unexposed cohort.
Sampling
The sample is not a random sample but is rather a pragmatic one. This is unavoidable as it is a descriptive study and hence the researcher has to conduct the study amongst a group of people who have been exposed to the exposure of interest. This means that those who were exposed were self-selected (their actions exposed them to the exposure) or ‘environmentally-selected’ (the environment they live or work in exposed them to the exposure), or ‘socially-selected’ (the social circumstances they find themselves in exposes them to the exposure), or ‘genetically- selected’ (their genes exposed them to the exposure).
The trick then is to make sure you obtain an unexposed group who are similar in every important way to the exposed group except for having the exposure of course. This means that inclusion and exclusion criteria must then be carefully applied to ensure that that is the case.
Alternatively one could prevent selection bias by choosing a homogenous group of people to follow before they develop the exposure (a cohort; no exposed cohort and no unexposed cohort but rather just one cohort) and then wait for some of them to become exposed. Once some of them become exposed then they have automatically become the exposed group with the remainder being the unexposed group. This however has the distinct disadvantage of requiring a longer period of follow-up as one now has to follow them up until sufficient numbers of them develop the exposure (and hence conveniently split themselves into the exposed and unexposed), and then follow them up further until they develop the disease. There are thus 2 periods of follow-up required.
Data Collection Procedures
Data has to be collected on the exposure and potential confounders at the start of the study. Data would typically be collected from those selected into the sample via a questionnaire or via accessing their records, or via direct measurement (e.g. blood pressure, weight, height). The most important point to note here is that data must be collected for the exposed in the same way as it is collected for the unexposed. If this is not done then you would have introduced measurement bias.
The participants are then followed-up regularly and measured at intervals (again using a questionnaire, or health records, or direct measurement) to determine if the disease (outcome)
has occurred or not. This means that you have to be able to find the participants to check if they have developed the disease or not. This can become quite difficult when the period of follow-up is long (years) as people might move from their residences and workplaces. It also means a greater commitment by the participants as they would have to agree at the start of the study to be followed up regularly. These regular assessments could be quite burdensome to the participants and therefore they need to be done in a manner which causes the least interference to and is most convenient for the participants.
As in all studies those people (research assistants or researchers) who are tasked with collecting the data on the exposed and unexposed cohorts should be blinded (not aware of) as to who are the exposed and who are the unexposed.
Analysis
Univariate and bivariate analysis should be done on. Multivariate analysis is usually also done but we won’t cover that. Univariate analysis consists of frequency measurements. Bivariate analysis consists of relative and absolute measurements.
Frequency measurements computed on both the exposed and unexposed cohorts and are the cumulative incidence and incidence rate, while relative association measures such as the cumulative incidence ratio and incidence rate ratio are computed (refer to Unit 2 for calculations of these).
Absolute Association measurements that are computed are the:
Cumulative Incidence Difference: (also called the risk ratio; also called the Risk Difference): this is when you do the comparison using the Cumulative Incidences of the two groups.
Incidence Rate Difference: this is when you do the comparison using the Incidence Ratios of the two groups.
Strengths
Prospective Cohort studies are very efficient when the exposure is rare as one can collect together all those with the rare exposure and then follow them up and a similar comparison group.
Prospective Cohort studies are very efficient when the disease (health problem) occurs soon after the exposure as the follow-up period is short thus making the logistics easy, keeping the costs low and obtaining the results and answering the research question relatively quickly.
Prospective Cohort studies are very efficient when the disease (health problem) is common as then sufficient numbers of participants would develop the disease during the follow-up period to make a statistically significant comparison between the exposed and unexposed cohorts easily possible.
Using a Prospective Cohort study design ensures that the exposure occurred before the disease and hence fulfills an absolute requirement for being potentially causal.
Using a Prospective Cohort study design one can assess many diseases which might result from one exposure.
If one uses a Prospective Cohort study design where one starts with a homogenous group and then waits for the exposure to develop, then one can assess many exposures (a variation on the single exposure cohort study) as well as many diseases.
Using a Prospective Cohort study design reduces selection bias as the exposed and unexposed are clearly delineated form the start.

Weaknesses
Prospective Cohort studies are Difficult to do when there is a long time between being exposed and the onset of disease (latent period)
Prospective Cohort studies are Expensive as relatively large numbers of participants have to be followed up for long periods of time and outcome measures may have to be done repetitively, which involves considerable cost.
Similarly as above Prospective Cohort studies are Time consuming which means one may have to wait for long periods of time for a result and an answer to the research question one is pursuing.
There is the potential to ‘loose’ many participants during the follow-up period and hence the study would become biased (Loss to follow-up).
Prospective Cohort studies are extremely Inefficient for Rare Diseases
Having now read and appreciated the basic description of a prospective cohort study, you
should now work through the text by Gordis (from page 167 to page 176) which provides a
detailed description of a cohort study. Note that Gordis combines prospective cohort studies
and retrospective cohort studies into just cohort studies.
Once you have gone through the reading by Gordis you should attempt the task below.
Task 1
There is a nuclear power plant situated 10 kilometres from a low income socio-economic group residential suburb both of which are close to a large city. Nuclear radiation is known to cause early age leukaemia, other rare types of cancer and congenital defects. The nuclear power plant has been in existence for the past 30 years. The operators of the nuclear power plant maintain that for normal working conditions there is minimal radiation leakage beyond 100 metres form the plant and that the amount of leakage is too low to cause any harmful effects to humans anyway. Hence they assert that the staff working at the plant as well as the nearby community are entirely safe from and dangers due to nuclear irradiation. They are also confident that in the unlikely event of a nuclear accident, their emergency evacuation plans are sophisticated and comprehensive enough and they are at a more than sufficient level of preparedness at all times, to easily and safely evacuate everyone from the area. Residents from the nearby low income socio-economic group suburb are however not convinced. They point to isolated cases of leukaemia, congenital defects, asthma, pnuemonia and skin rashes as evidence of the harmful effects of the nuclear power plant. The operators of the nuclear power plant respond that they don’t dispute that these problems are occurring amongst the community but suggest that they are probably due to the large number of industries and factories which are present on the border of the suburb.
Using the scenario above, answer the following questions.
1. Is a prospective cohort study an appropriate study to assess the effect of the nuclear power plant on the development of leukaemia?
2. Is a prospective cohort study an appropriate study to assess the effect of the nuclear power plant on the development of rare cancers?
3. Is a prospective cohort study an appropriate study to assess the effect of the nuclear power plant on the development of congenital defects?
4. Who would be the most appropriate study population (list both the exposed and the unexposed populations) for a study on the effect of the nuclear power plant on the development of leukaemia?

5. Who would be the most appropriate study population (list both the exposed and the unexposed populations) for a study on the effect of the nuclear power plant on the development of congenital defects?
6. What would the exposure be for a study on the effect of the nuclear power plant on the development of leukaemia?
7. What would the outcome be for a study on the effect of the nuclear power plant on the development of leukaemia?
8. What would the exposure be for a study on the effect of the nuclear power plant on the development of congenital defects?
9. What would the outcome be for a study on the effect of the nuclear power plant on the development of congenital defects?
10. Assume that you were present at the time of the construction of the nuclear power plant. Describe in detail the study methods you would use for a prospective cohort study to determine if the presence of the nuclear power plant is associated with the development of leukaemia. Show all the important methodological steps you would implement.
Feedback on Task 1
1. Yes, because exposure to nuclear radiation is rare and leukaemia is a relatively common cancer. Hence a prospective cohort study would be extremely efficient.
2. In general no, as they outcome is rare (rare cancers). However when a rare outcome also has a rare exposure then for those people who are exposed to the exposure the outcome might not be as rare as for the general population. So for people exposed to the rare exposure the outcome might be much more common if that exposure does indeed cause the outcome. Hence when one has a combination of rare exposure and rare outcome then a prospective cohort study can be used.
3. Yes, because exposure to nuclear radiation is rare and congenital defects are not uncommon.
4. Exposed cohort would be people living in the suburb near to the nuclear power plant. Would need to exclude those working at the nuclear power plant or in any other nuclear industry.
5. Unexposed cohort would be people living in low income socio-economic suburb which also has industries and factories close to it. Would need to exclude those working at the nuclear power plant or in any other nuclear industry.
6. Exposed cohort would be children born to mothers who at the time of their pregnancy lived in the suburb near to the nuclear power plant. Would need to exclude those working at the nuclear power plant or in any other nuclear industry.
7. Unexposed cohort would be children born to mothers who at the time of their pregnancy lived in a low income socio-economic suburb which also has industries and factories close to it. Would need to exclude those working at the nuclear power plant or in any other nuclear industry.
8. The exposure would be the time that they lived near to the nuclear power plant (the longer they lived there then the higher the degree of exposure) and the distance that they lived from the nuclear power plant (if the suburb is very large in geographic area; the closer they lived then the higher the degree of exposure).
9. For the outcome you would have to decide between all leukaemias and early onset leukaemia. It is best though to be pragmatic and assess both of these outcomes.
10. The exposure would be the mother living in the suburb near to the nuclear power plant while she was pregnant.
11. The outcome would be all congenital defects which are not known to be caused by a hereditary mechanism, or by some other known exposure. However you might want to assess those congenital defects know to have another cause as the exposure to the nuclear power plant could be an additional cause of those congenital defects or it could act as an effect modifier.
12. Send you proposed study methodology to us and we will provide you with individual feedback.

Unit 3 – Session 4: Retrospective Cohort Studies
Introduction
This is the same as a prospective cohort study except that the exposure was in the past and the disease could have occurred in the past (but after the exposure) or it could occur in the present or future. So a group without a disease in the past but with an exposure thought to be linked to the disease, is assessed in the present to see if they have the disease and compared to a similar group without the exposure (also without the disease in the past and who are also assessed to see if they have the disease) to determine if the disease is more common in the exposed group or the unexposed group. To do this study one would have to have good records on what people were exposed to in the past or else they should be easily be able to recall whether they had the exposure in the past or not (e.g. lived in over-crowded house for the past 5 years).
Timing This session should take you about one half an hour to complete. The same reading by Gordis referred to in Session 3 is also applicable here. Learning Outcomes
Define Retrospective Cohort studies and contrast them with prospective Cohort studies
Learn how results from a Retrospective Cohort study can be appropriately presented
Know the major strengths and limitations of this study design

Defining and Using a Retrospective Cohort Study
The main usage of this study design is the same as for the prospective cohort study except that one is less certain that the exposure was present before the disease appeared. It requires data to have been collected on the exposure (and the level of the exposure) in the past and that data to have been stored and be available for use in the study. Hence a retrospective cohort study can only be done if good records of the exposure status of the proposed participants in the study are available. One can assess the participants currently to determine via questionnaire, records, direct measurement if the disease has occurred or not. The great advantage of the study is that one does not have to follow-up people for a long period of time in order to complete the study, so it can be done much quicker than a prospective cohort study.
Advantages over a prospective cohort study
Quicker
Cheaper
Disadvantages compared to a prospective cohort study
Requires that data was collected in the past
If data was not specifically collected for the study then the danger of misclassification and measurement bias is higher
Requires good record keeping
Requires access to the data
Selection bias is a greater problem than with a prospective cohort study
Unit 3 – Session 5: Cross-sectional Analytical
Introduction
A cross-sectional analytical study is the same as a cross-sectional descriptive study except that it goes further than a cross-sectional descriptive study. The cross-sectional descriptive study assesses a group of people for occurrence of a disease (or diseases) at a point in time (or a period in time). The cross-sectional analytical study does the same but then goes further by also assessing the potential causes of that disease/s. Similarly it assesses not only the extent (prevalence) of health problems and health service provision but also the potential causes of them. These potential causes are assessed as exposures or risk factors.
Timing
This session should take you about two hours to complete. In this session, you will need to read an article specified at the end of the session. Thereafter, you should attempt the task based on the reading. Feedback on the task has been provided to you but you are encouraged to attempt the task before checking the feedback.
Learning Outcomes
Define a Cross-sectional analytical study and its main features
Learn how results from a Cross-sectional analytical study can be appropriately presented
Know the major strengths and limitations of this study design

Defining and Using Cross- sectional analytical studies
A population is assessed for occurrence of a disease or diseases at a point (or period) in time and for the presence of risk factors (exposures) for those diseases at the same time.
A group (community, or suburb, or district, or province, or country) is assessed for occurrence of a disease at a point in time (prevalence of disease) AND for possible exposures associated with the disease and hence possibly causing the disease. Examples of potential causes of a disease could be any factor which might make it more likely for one to develop the disease (e.g. for HIV it could be such things as income, education, nutrition, crowding, sexual partners, alcohol, violence, etc.). In practice it would be quite inefficient to conduct a cross-sectional descriptive study only as it is a lot of work to assess a whole population (or more likely a sufficiently large sample of the population) for a disease and then only get a partial picture if one didn’t also use the opportunity to measure potential cause of that disease in the population. So to enhance efficiency in the use of research resources (time, researchers and money) the cross-sectional studies done tend to be overwhelmingly cross-sectional analytical studies.
Research Problem it Primarily Addresses
Investigates and explores ramifications of a disease (or health problem or health service provision) and possible causes of the disease/s by investigating whether there is an association between the disease (or outcome) and the potential cause (or exposure). This means that it is a far more efficient type of study than a cross-sectional descriptive study as for only a small increase in cost (and time and logistics) it provides much more information than a purely

descriptive cross-sectional study. In one study one could assess more than one outcome and more than one exposure thereby further enhancing the efficiency of the study.
Study Population and Sampling
The same as for a cross-sectional descriptive study
Data Collection Procedures
The same as for a cross-sectional descriptive study
Analysis
The prevalence of those with the disease/s (outcome/s) is calculated as the measure of frequency, in the same way as for a cross-sectional descriptive study. In addition, the relative and absolute association of the outcome/s with the exposure/s is assessed. For the relative association this is done via the Prevalence Ratio, while for the absolute association this is done via the Prevalence Difference.
Strengths
The same as for a cross-sectional descriptive study, plus:
It provides lots of information on particular health problems within the context of the community under study and investigates many potential causes for those health problems.
It quantifies the association between several exposures and diseases and hence discerns the possibility of causality. It hence provides hypotheses on causation, which can then be tested using other, more robust study designs, such as randomised controlled trials or cohort studies.
It is useful for deciding which exposures to explore further and which do not warrant further exploration.
One can usually generalise any association found between exposures and diseases to almost any other population. Note that the prevalence of disease cannot be generalized.
Weaknesses
The same as for a cross-sectional descriptive study, plus:
Causality is mixed up with death and recovery (cure) from disease since if one dies from the disease then the prevalence is lowered and if one is cured of the disease then one also lowers the prevalence and hence this results in a lower association of exposure with disease that would have occurred had there been no deaths or cures.
It is often difficult to determine whether the outcome followed the exposure in time or whether the exposure might have resulted from the outcome. This gives rise to a ‘who came first: the chicken or the egg’ scenario. This arises because the exposure and the disease are measured at the same time. Hence often one has difficulty in deciding which was present first. This makes any associations identified difficult to interpret.
It is not a good study design for rare exposures, as one would require a very large sample to detect the prevalence of rare exposures.
Final Comment on cross-sectional Descriptive and cross-sectional Analytical studies
In practise, whereas in the past cross-sectional descriptive studies were common, nowadays almost all cross-sectional studies conducted are cross-sectional analytical studies as they are so
much more efficient and useful than cross-sectional descriptive studies. Indeed most textbooks lump them together as the analytical is simply an extension of the descriptive.
Having read and assimilated the basic description of cross-sectional descriptive and cross-sectional analytical studies above, you should now work through the text by Hennekens and Buring (from page 108 to page 127) which provides detailed commentary on cross-sectional studies. Note that Hennekens and Buring combine the cross-sectional descriptive and analytical studies into just cross-sectional studies.
Once you have gone through the reading by Hennekens and Buring you should attempt the task below.
Task 1
Read through the article by Page, Hustache, Luquero, et. al and then answer the questions
below. The article is available on the Measuring health and Disease II (SPH 856) iKamva site and
your USB flash drive.
Health care seeking behaviour for diarrhoea in children under 5 in rural Niger: Results of a cross-sectional survey.
Page, Anne-Laure; Hustache, Sarah; Luquero, Francisco; Djibo, Ali; Manzo, Mahamane et al. (2011) BMC Public Health vol. 11 (1) p. 389
a) List two reasons that the authors provide for carrying out this study?
b) What is the primary objective of the study?
c) The study is cross-sectional, what are the potential strengths and weaknesses you will be
looking for in the study?
d) What were the characteristics of the study site/s chosen? Can you comment on the
authors justification for choosing these sites?
e) Who are the study population?
f) What was the sampling method used?
g) What were the factors the authors considered in calculating sample size? Why is
considering these factors important?
h) What were the inclusion and exclusion criterion?
i) What do the authors do to correct for potential bias resulting from sampling?
j) What did the authors do to reduce measurement error?
k) What were the exposures and outcomes the authors were looking at? How are the
outcomes described/presented?
l) Is there bias in the survey? If so what is it?
m) Please explain and interpret the prevalence statistics from Table 2 for the Aguie district
of all diarrhoea cases (n, %, 95% CI)?
n) Please describe and interpret the significant associations in Table 3?
o) What are the key conclusions the authors make?
p) What evidence in there to suggest what type of facility is best for the surveillance of severe diarrheal diseases? (include discussion of statistical results and authors argument to support these)

Feedback on Task 1
a) List two reasons that the authors provide for carrying out this study?
A. The knowledge about the disease burden as well as the circulating strains is still lacking in many countries, such as Niger.
B. WHO protocol recommends a survey to establish children’s hospital-use pattern in case of diarrhoea.
C. A field-test demonstrates a need for investigating local specificities before implementing a surveillance system.
b) What is the primary objective of the study?
The objective of this study was to determine the proportion of children under 5 years of age
suffering from severe diarrhoea, who were treated in the health care system of Maradi region,
Niger.
c) The study is cross-sectional, what are the potential strengths and weaknesses you will
be looking for in the study?
Strengths
• Relatively quick and easy to conduct (no long periods of follow-up).
• Data on all variables is only collected once.
• Able to measure prevalence for all factors under investigation.
• Multiple outcomes and exposures can be studied.
• The prevalence of disease or other health related characteristics are important in public
health for assessing the burden of disease in a specified population and in planning and
allocating health resources.
• Good for descriptive analyses and for generating hypotheses.
• Greater generalizability.
• Can study entire populations or a representative sample
Weaknesses
• Difficult to determine whether the outcome followed exposure in time or exposure
resulted from the outcome or ‘cause' and ‘effect'.
• Not suitable for studying rare diseases or diseases with a short duration.
• As cross-sectional studies measure prevalent rather than incident cases, the data will
always reflect determinants of survival as well as aetiology.
• Unable to measure incidence.
• Associations identified may be difficult to interpret.
• Susceptible to bias due to low response (e.g. selective survival) and misclassification due
to recall bias.
• Not good for rare diseases or rare exposures
d) What were the characteristics of the study site/s chosen? Can you comment on the
authors justification for choosing these sites?
4 health districts in the region of Maradi
One urban (City of Maradi)
3rd largest and economic capital
Three rural (districts of Madarounfa, Aguié and Guidan Roumdji)
Total population of 1.4 million
The authors want to assess health service utilisation and the four communities represent a
varying access to different health facilities. The districts also represent variations in health
system coverage.
e) Who are the study population?
Children aged 0-59 months and resident in the survey districts.
f) What was the sampling method used?
Stratified cluster sampling.
g) What were the factors the authors considered in calculating sample size? Why is
considering these factors important?
An alpha error of 0.05
Precision of 5%
A design effect of 2
Expected prevalence of severe diarrhoea of 30%.
The authors also account for 10% of missing or incomplete data.
h) What were the inclusion and exclusion criterion?
Households were defined as individuals sleeping regularly under the same roof and sharing
meals.
As polygamy is common in this region, a wife and her children were each considered a unique
household.
If more than one household was present in a home, one household was chosen randomly with the
aid of a random number table.
Similarly, if more than one child aged 0 to 59 months was eligible for inclusion in the selected
household; one child was selected at random.
i) What do the authors do to correct for potential bias resulting from sampling?
The authors used updated census data to proportionally allocate clusters in each stratum.
The authors use the WHO/EPI methodology and spatial sampling using a grid to randomly sample
households within villages/urban areas.
The data was weighted to account for potential sampling biases.
The authors do not actually mention the words ‘random sampling’ but from their description of
the sample it is clear that they did indeed use random sampling.
j) What did the authors do to reduce measurement error?
All information was elicited by interviews, which were conducted with the mother or caretaker.
A recall period of 27 days (April 24th until May 21st) was used.
The questionnaire was standardized and based on a WHO questionnaire.
The questionnaire was adapted locally after field testing.
Questions were removed for the purpose of simplification: socio-economic status, duration of
the disease and some symptoms during illness.
Precise definition of what constitutes diarrhoea and what constitutes severe diarrhoea was used.
k) What were the exposures and outcomes the authors were looking at? How are the
outcomes described/presented?
Exposures the study measures are:
Education of caregiver
Number of children under 5 in the household

Age of child
Outcomes
Diarrhoea – for prevalence. Measured as acute or severe cases.
Health service utilisation was described using a proportion of consultations at any health
structure and type of health structure consulted.
For those who sought treatment the authors measured treatment and hospitalization
outcomes.
Students may have interpreted the second part of the question differently and explain that the
outcomes are explained both in the text and in the tables.
The authors also measured symptoms associated with the diarrheal outcomes to assess severity,
reasons for not consulting a health structure.
l) Is there bias in the survey? If so what is it?
There is potentially bias in the survey.
Sources of bias are:
Recall bias for diarrhoea which may result in under-reporting
Consultation at a health structure may have been over-reported because it is a positive
behaviour- socially desirable.
Application of definitions of diarrhoea and severe diarrhoea might have been different
between data collectors, despite standardisation of questionnaire.
m) Please explain and interpret the prevalence statistics from Table 2 for the Aguie
district of all diarrhoea cases (n, %, 95% CI)?
Total N=735
Of the total in this community 250 (34%) report any diarrhoea
We estimate with 95% confidence that the true prevalence of diarrhoea among young children in
Aguie is between 28.2% and 39.8%.
Of the total in this community 15 (1.5%) report severe diarrhoea
We estimate with 95% confidence that the true prevalence of severe diarrhoea among young
children in Aguie is between 0.6% and 2.5%.
n) Please describe and interpret the significant associations in Table 3?
Table 3 shows the association between demographic characteristics/exposure and the proportion
of consultations at health structures in children with diarrhoea.
The results show:
No association between consultations at a health care structure and the level of education of
the caretaker (CI cross 1 and p-vales are > 0.05).
Consultations were associated with increasing number of children under 5 years of age in the
household (ref category is those with 1 or 2 children) (CI do not cross 1 and p-values are <0.05).
Age was also associated to consultations at a health care structure, with a higher proportion of
consultations for children aged 6 to 18 months (ref category is oldest children) (CI do not cross 1
and p-values are <0.05 for all groups over 3 months).
o) What are the key conclusions the authors make?
The results of this survey show an increase in health care seeking behaviour in case of diarrhoea
of children under 5 years of age in the Maradi region since the 2006 DHS survey, suggesting the
efficacy of recent health policies for children in Niger.

In addition, the data suggest that hospital-based surveillance of severe diarrheal diseases might
not be appropriate in this type of decentralized health system.
Health centres and posts are the cornerstone of the health system, in particular in rural areas,
and should not be overlooked for the establishment of surveillance systems.
p) What evidence in there to suggest what type of facility is best for the surveillance of
severe diarrheal diseases? (include discussion of statistical results and authors argument
to support these)
The authors argue that the data suggests that hospital-based surveillance of severe diarrheal
diseases might not be appropriate in this type of decentralized health system.
The health structures where people reported seeking care and said they would seek care if there
was future diarrhoea (acute and severe) was overwhelmingly health centres, followed by health
posts. Figure 1 in the text shows this and suggests that over 80% would choose these options over
a hospital or private clinic.
In the discussion the authors expand on these findings and argue that although referrals were
not precisely documented, hospitalizations for at least one night were recorded and reported in
only 44% of severe cases. As this also includes patients who stayed overnight at a health centre
(therefore not a hospital), it is an over-estimate of the proportion of severe cases who were
admitted to hospital.
They go on to argue that these findings when considered in conjunction with the decentralized
nature of the system and recommendations for treatment of severe dehydration at the health
centre level, that the majority of children with severe diarrhoea would be missed by a hospital-
based surveillance system. Therefore they argue that health centres and posts are the
cornerstone of the health system, in particular in rural areas, and could be the ideal place to
establish surveillance systems for diarrhoea.

Unit 3 – Session 6: Case Control
Studies
Introduction
A case control study design is an ingenious study design which uses ‘cases’ of a disease (or a
health problem or a health service provision or any outcome) and then compares them to
‘controls’ which are people who are from the same population as the ‘cases’ but who don’t have
the disease or outcome. This allows one to then use a relative measure of association to assess if
an exposure is associated with the outcome. Using a relative measure of association is possible
because one would collect data on exposures they experienced from both the ‘cases’ and the
‘controls’ thereby allowing the comparison between the two groups.
Timing This session should take you about two to three hours to complete. In this session, you will need to work on several tasks based on specified readings. Learning Outcomes
Define a Case-Control study and its main features
Learn how results from a Case-Control study can be appropriately presented
Know the major strengths and limitations of this study design

Defining and using a Case Control Study
People with a disease (cases) are compared to similar people without a disease (controls) to
determine if the cases are more likely to have particular exposures that the controls. If they do
then those exposures are deemed to be associated with the outcome being measured. A large
number of exposures could be measured but only one outcome is permissible.
This is an odd type of study and its effectiveness depends on properly and fairly selecting the
controls to compare the cases with. For example women with breast cancer (cases) are
compared to their female neighbours of the same age but who do not have breast cancer
(controls) and then one looks to see what exposures are different between them. Many
exposures such as weight, exercise, diet, use of contraceptive pills, number of children, etc. can
be compared to see if one of them is higher amongst the cases (those with breast cancer) than
amongst the controls (those with no breast cancer). If an exposure is higher amongst the cases
then it might be a cause of breast cancer.
The main usage of this study design is to:
Investigate exposures in rare diseases
Investigate exposures which take a long time to cause a disease
Investigate many exposures of a disease
Research Problem it Primarily Addresses
It is used to determine if various exposures are causal factors for diseases (or health problems or
a health service provisions).

Study Population
This is the tricky part. One cannot just find some people with the disease (cases) and then just
compare them to any other people without the disease (controls).
The important point is that both the cases and the controls must come from the same population
and must be representative of that population. Note that the population for a case control study
is usually called the base population (as it is where the cases and controls are based).
In practise the controls are usually selected from the population from which the cases arose in
such a way that they fully represent that population from which the cases came. The cases
therefore in practise determine who the population is and one must then ensure that the
controls then represent that population. The cases by virtue of being cases automatically
represent the people from the population with the outcome (disease) Hence selection of the
controls is the tricky part, as one must make sure that they fully represent the base population.
For example if one were to take pnuemonia amongst children aged 5 to 15 years living within a
district as the cases, then the controls would have to come from children aged 5 to 15 years
living within that same district but who do not have pnuemonia.
Sampling
There are two distinct samples: the cases and the controls. Both of them must have specific
inclusion criteria and exclusion criteria and one needs to know how this sample will be accessed.
The inclusion criteria are used to define the group one is interested in and the exclusion criteria
then refines that group. This refinement could be to exclude people with particular variants of
the disease (e.g. very severe form of the disease), who have other diseases (as the exposures
might get mixed up between the diseases) and who have a particular disease already known to
be or suspected to be caused by the same exposures that cause the disease you are interested
in.
How the sample will be accessed depends on where they are likely to be found. Cases can
usually be found in health facilities (either as inpatient or as outpatients), or else they would
have to be found amongst the community. Accessing them from health facilities is an easier and
passive way to obtain the cases but runs the risk of only finding a sub-set of the cases, namely
those who access a health facility when they are ill. However if the outcome is a relatively
serious disease then this won’t be a problem as all or almost all who get the disease would
access a health facility as the disease is serious. For a mild disease many might not access a
health facility and hence one would end up with a sub-set of the cases if one accessed them via
the health facilities and therefore one should access them via the community. To find them in
the community however could be logistically difficult.
For controls one could similarly access them either from health facilities or from the community.
Let’s explore these concepts using the example of pnuemonia given above. We will do so first for
the cases and then for the controls.
Cases
Inclusion and Exclusion criteria must be specified taking into account the outcome, the base
study population, specific forms of the disease and other diseases.
Inclusion Criteria:

Children aged 5 to 15 years from District A who have pnuemonia (outcome and base
population) and are seen in a health facility as either an inpatient or outpatient (where
you obtain them).
Pnuemonia must be diagnosed as having at least 3 of the following typical symptoms (fever, cough, dyspnoea, chest pain, yellow/green sputum) and they must have x-ray evidence of pnuemonia (outcome).
Exclusion Criteria:
Being ill enough to be admitted to an intensive care unit or having died from pnuemonia (form of disease) to avoid mixing up risk factors for getting the disease with risk factors for developing complications form the disease.
Being immunocompromised for any reason such as having HIV, or on treatment for
cancer, or being treated with steroids for any reason (other diseases), as this renders
them more likely to get any infection.
Having any other lung disease (other diseases), as this might render them more likely to
get any infection.
Controls
As with the cases, Inclusion and Exclusion criteria must be specified taking into account the
outcome, the base study population, specific forms of the disease and other diseases.
Although the controls must all come from the same base population as the cases there can
however be three types of controls based on how the controls are accessed. These are facility
based controls, community controls or special types of controls.
Inclusion Criteria:
Children aged 5 to 15 years from District A who do not have pnuemonia (outcome and base population).
Exclusion Criteria:
Having any upper respiratory tract infection as this could be caused by the same risk factors which cause pnuemonia (other diseases).
Must not be immunocompromised for any reason as above (base population and other diseases).
Must not have any other lung disease (base population and other diseases)
The controls can now be accessed in the ways described above:
If facility based controls then access them from randomly selecting children who are seen for other illnesses which are unrelated to pnuemonia or any infection (e.g. those seen at the facility due to injuries) at the facility
If community based controls then randomly select households and then randomly select one of the children from each household meeting the criteria.
If special type then one of the classmates of each of the cases can be randomly selected as a control. Note that the cases definition would then have to include being at school.
Note that great care must be taken when selecting controls as there is the constant danger of
selection bias if the criteria are not carefully specified and if the means of accessing them is not
carefully thought through.
Avoiding selection bias requires stringent application of the above selection principles.
Sample Size
This is dealt with below.
You should now go through the reading by Bruce, Pope and Stanistreet from page 257 until
page 268. This section of the reading first provides a fleshed out description of the basic
features of a case control study. It does this with the aid of referring to a specific study in order
to make the concepts easier to comprehend. It then moves on to describe how cases and
controls can be selected and accessed and warns of the dangers of selection bias.
Task 1
Go through the questions in section 6.2.2 in the reading by Bruce, Pope and Stanistreet on page
267.
Feedback on Task 1
Feedback is provided at the end of the reading.
Data Collection Procedures
Data would typically be collected from those selected into the sample via a questionnaire or via
accessing their records, or via direct measurement (e.g. blood pressure, weight, height).
The most important point to note here is that data must be collected for the controls in the
same way as it is collected for the cases. If this is not done than then you would have introduced
measurement bias.
Collecting data for the cases in a different manner than for the controls is an easier trap to fall
into than one would imagine. This is because the cases are ill, therefore data would have been
collected on them in a very thorough manner and might have included some expensive tests.
One must then make sure that the same thoroughness is applied and the same tests are used for
the controls.
As in all studies those people (research assistants or researchers) who are tasked with collecting
the data on the cases and controls should be blinded (not aware of) as to who are the cases and
who are the controls.
Further details on data collection and on potential measurement bias are provided in the
reading by Bruce, Pope and Stanistreet from page 270 until page 272. Go through that section
of the reading now.
Task 2
Attempt the questions in section 6.2.5 in the reading by Bruce, Pope and Stanistreet on page
272.
Feedback on Task 2
Feedback is provided at the end of the reading.
Analysis
The analysis consists of frequency measurements and measurements of association.
The frequencies are just the calculation of the proportions of the exposures amongst the cases
and amongst the controls. If basic demographic data were also collected then frequencies of
these can be calculated as well to assess if the cases are really similar to the controls.
The important measurement of association is the Odds Ratio. This is similar to the incidence
ratio (relative risk).
Further details on analysis and how to calculate the Odds Ratio are provided in the reading by
Bruce, Pope and Stanistreet from page 273 until page 277. Work your way through that section
of the reading now.
Task 3
Attempt the questions in section 6.3.1 in the reading by Bruce, Pope and Stanistreet on page
277.
Feedback on Task 3
Feedback is provided at the end of the reading.
Sample Size
One should calculate the sample size for both the cases and the controls. One can specify
whether there will be one control per case or whether there will be more than one control per
case. One can increase the number of controls in order to increase the power of the study. This
would however only be done if there was a small number of cases due to the disease being very
rare. Since one cannot then obtain a large number of cases the power can be increased by using
more than one control per case. However this is only done if one cannot access more cases to
increase the sample size and improve the power. Using more than 4 controls pre case is not
recommended because the increase in power one obtains for 5 or more controls is minimal.
To estimate the sample size required for a case control study one would have to specify the
following:
1. The clinically significant odds ratio
2. The power level (usually 80%)
3. The confidence level (usually 5% or 0.05)
4. The ratio of cases to controls (usually 1:1 ; occasionally 1:2 ; never more than 1:4)
5. The estimated frequency of the exposure in the controls
Further details on sample size calculation are provided in the reading by Bruce, Pope and
Stanistreet from page 281 until page 847. They provide detailed instructions on how to
calculate the sample size using Epi Info. Carefully and methodically work your way through this
section of the reading now.
Strengths
The Ethics of this research design is usually easier as the outcome has already occurred when one starts the study. The exception is if one uses incident cases (newly developed

cases instead of existing cases), but even then cases only come to the researchers attention once they have already occurred.
It is Quick to do as the outcomes have already occurred
It is quite Cheap as the sample size is relatively low and relatively easy to access
It is very useful for assessing Rare Diseases (outcomes) as a relatively substantial number of these cases can be accessed at the outset of the study
It is very useful for assessing diseases with Long latent periods as the outcome has already occurred at the outset of the study
Can assess the effects of many confounders
Can assess the effects of many exposures (but beware of data dredging)
Weaknesses
It is prone to both Selection Bias and Measurement bias
It cannot be used with Rare Exposures
There is little value obtained with using it for diseases with short latency periods (unless the outcome is very rare)
Task 4
You are given a research problem and the aim of a proposed study below. Then you are asked to
develop the methodology of that study using a case control study design. To guide you in this
some pertinent methodological questions are posed for you to answer. Feedback is provided at
the end of the study session.
Research Problem: Does a cervical cancer screening programme to find an early and treatable
stage of cervical cancer, reduce the risk of developing invasive (advanced) cervical cancer which
is untreatable and always fatal?
Aim of study: To assess whether a cervical screening programme assists to prevent the
development of invasive (advanced) cervical cancer
As cervical cancer is a serious and difficult to treat disease, most people with this disease would
be treated at a tertiary or special care facility.
Questions:
1. Why would a case control study be the best study design to use to investigate this
research problem?
2. State who your study population is likely to be.
3. What types of controls could you use?
4. Describe your probable data collection procedures.
5. What potential confounders would you be likely to assess.
6. What analysis would you conduct?
Feedback on Task 4
1. Why chose Case Control Study Design
It is the most useful study design to use when the exposure is common and the disease is rare.
Cervical cancer screening is commonly performed and although invasive cervical cancer is not

rare it is considered unethical not to screen women as it is strongly believed to prevent invasive
cervical cancer. Hence a randomised controlled trial and a prospective cohort study is not
ethically permissible. Records of cervical cancer screening are spread over many clinics and
laboratories and are poorly kept precluding the use of a retrospective cohort study.
2. Study Population
Cases: All women diagnosed with invasive cervical cancer at a hospital which admits and treats
invasive cervical cancer cases.
Controls option one (hospital controls): Women of a similar age who were admitted to the
hospital for other conditions and who do not have invasive cervical cancer or any other cancer.
Controls option two (community controls): Women of a similar age who live in the same
neighbourhood as the women with invasive cervical cancer and who do not have invasive cervical
cancer or any other cancer.
3. Types of controls to use
Controls will be obtained by selecting the closest female neighbour of a similar age provided
that that neighbour does not have invasive cervical cancer or any other cancer. The selected
neighbours will then be interviewed using a structured questionnaire as to whether they
received any cervical cancer screening and if so how frequently they received it.
4. Data Collection Procedures
Hospital discharge records will be checked to find people with invasive cervical cancer and these
women will be interviewed using a structured questionnaire as to whether they received any
cervical cancer screening and if so how frequently they received it.
5. Potential Confounders
Data could be collected on potential confounders such as number of sexual partners, age and
whether they had STIs. These would also be collected during the interview.
6. Analysis
The Odds Ratio
Ratio comparing the odds of women with invasive cervical cancer having being screened for
cervical cancer with the odds of women without invasive cervical cancer having being screened
for cervical cancer.
The Odds Ratio should be less than one indicating that cervical cancer screening protects against
developing invasive cervical cancer.
Task 5
Read through the article by Adjorlolo-Johnson, Unger, Boni-Quatarra et.al 2010 and then answer the questions below.
The article is available on the Measuring health and Disease II (SPH 856) iKamva site and your USB flash drive
1. What was the primary aim of the study?
2. Were cases properly defined? Please justify your answer by describing the definition and criteria for inclusion/exclusion?
3. Were controls properly defined? Please justify your answer by describing the definition and criteria for inclusion/exclusion?
4. What if any bias was there in the selection of the controls? 5. What were the primary outcome and exposure variables? 6. What confounders if any did the authors account for in their analysis? 7. Table 3 presents the risk factors for cervical cancer in the study. The authors provide
crude odds ratios and two sets of adjusted odds ratios for each variable. Please discuss both the crude and the 2 adjusted odds ratios for each of the variables shown in Table 3.
8. Explain what bias occurred when measuring HPV infection 9. Suggest how this bias could have been arisen? 10. What do the authors conclude and recommend? 11. Do you agree with, disagree with, or partially agree with, the authors’ conclusions and
recommendations. Motivate your answer
Feedback on Task 5
Please send your answers through to us and we will provide you with individualised feedback on them.

Unit 3 – Session 7: Ecological Studies
Introduction
This session introduces a family of study designs in which the characteristics of interest are not
referred to individuals but to groups of individuals. Or, put in another way, a family of study
designs in which the variables involved summarise the characteristics of populations instead of
single individuals in a population.
The main features and the advantages/disadvantages of this kind of study designs are presented.
Among the latter, the concept of "ecological fallacy" is presented and explained.
Timing
This is a relatively short session and should take you about one hour to do. In this
session, there is one reading and a short task based on the reading. The feedback on the
task has been provided to you but you are encouraged to attempt the task before having
a look at the feedback.
Learning outcomes
Define ecological studies;
Know the major strengths and limitations of these studies.
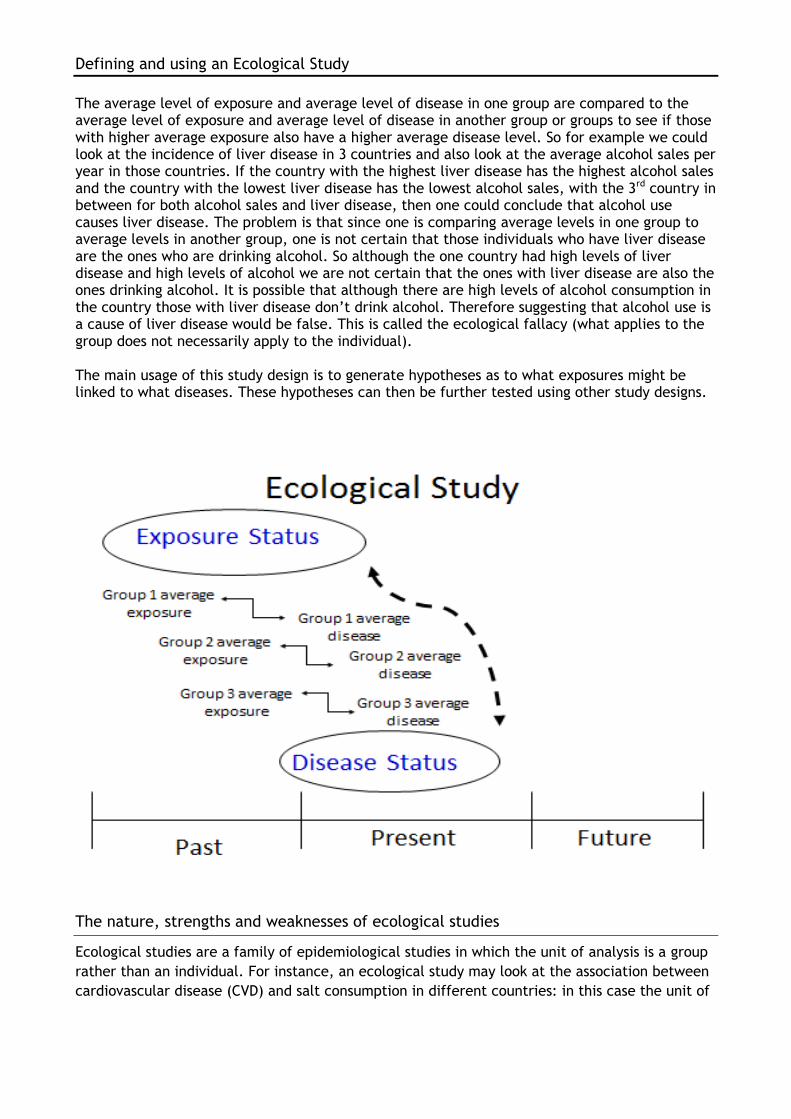
Defining and using an Ecological Study
The average level of exposure and average level of disease in one group are compared to the average level of exposure and average level of disease in another group or groups to see if those with higher average exposure also have a higher average disease level. So for example we could look at the incidence of liver disease in 3 countries and also look at the average alcohol sales per year in those countries. If the country with the highest liver disease has the highest alcohol sales and the country with the lowest liver disease has the lowest alcohol sales, with the 3rd country in between for both alcohol sales and liver disease, then one could conclude that alcohol use causes liver disease. The problem is that since one is comparing average levels in one group to average levels in another group, one is not certain that those individuals who have liver disease are the ones who are drinking alcohol. So although the one country had high levels of liver disease and high levels of alcohol we are not certain that the ones with liver disease are also the ones drinking alcohol. It is possible that although there are high levels of alcohol consumption in the country those with liver disease don’t drink alcohol. Therefore suggesting that alcohol use is a cause of liver disease would be false. This is called the ecological fallacy (what applies to the group does not necessarily apply to the individual). The main usage of this study design is to generate hypotheses as to what exposures might be linked to what diseases. These hypotheses can then be further tested using other study designs.
The nature, strengths and weaknesses of ecological studies
Ecological studies are a family of epidemiological studies in which the unit of analysis is a group
rather than an individual. For instance, an ecological study may look at the association between
cardiovascular disease (CVD) and salt consumption in different countries: in this case the unit of

analysis is the country (the whole population) and the variables of interest are the prevalence of
cardiovascular diseases and the average consumption of salt.
Ecological studies can be easily confused with cohort studies, especially if different cohorts are
located in different places. The difference is that in the case of ecological studies there is no
information available about the individual members of the populations compared. The central
point to understand in ecological studies is that the data are for the group, and this is in
contrast to cross-sectional, cohort and case-control studies, where we look at information on
exposures and outcomes for every individual.
Weaknesses
The variables in ecological studies do not represent characteristics of individuals, but are
summary measures, at group level, of the characteristics of many individuals (in our example the
summary measures are the prevalence of CVD and the average salt consumption).
The reading by Gordis describes in more detail the characteristics of ecological studies, and
discusses the main reason why they are normally regarded as inferior to non-ecological designs
such as cohort and case-control studies: i.e. their susceptibility to the ecological fallacy.
Reading Gordis, L. (2009). Epidemiology (4th edition). Philadelphia: Sanders. p 228-230.
Strengths
Despite their weaknesses, ecological studies are useful because they can be carried out easily,
quickly and inexpensively using data that are generally already available. If interesting and
strong associations are observed, the results of ecological studies can provide the opportunity
for later, more carefully designed studies (though more expensive and time-consuming) to build
on the initial observations.
Task – Thinking critically about ecological studies According to Durkheim, in 19th century Europe, suicide rates were higher in countries that were
more heavily Protestant. In his seminal monograph "The Suicide", the French scholar Emile
Durkheim used this observed association to conclude that suicide was promoted by the social
conditions of Protestantism. 1
This conclusion was later criticised widely. Can you think of any reason why this conclusion could be misleading? Task Feedback This is a classic example of ecological fallacy.
The problem is that aggregate measures tell us nothing about individuals, and an association
which exists between aggregate measures can be very different at individual level.
1 Durkheim, E. (1897). Le suicide. Paris: F. Alcan. English translation by J A Spalding (1951). Toronto, Canada: Free
Press/Collier-MacMillan.

The unwarranted assumption which makes Durkheim's conclusion doubtful is that we do not
know whether the individuals who profess the protestant religion in each country had a higher
suicide rate than the individuals of catholic faith, because we only have averages at country
level.
It is very possible that, within each country, Catholics had a greater risk of suicide than
Protestants but the average risk of suicide was higher among countries in which the latter were
the majority. Aggregate measures, by their very nature, do not take into account the variability
between individuals.
Unit 3 – Intervention Studies
Session 8: Randomised Controlled
Trials (RCTs)
Introduction
This session describes the fundamental features of a widely used study design, the Randomised
Controlled Trial (RCT).
RCT’s are considered, with reason, especially "strong" study designs in terms of their ability to
provide evidence of causal association between risk factors and health outcomes. Form this
point of view, they can be thought as the opposite end than the Cross-sectional study design
which are weak in assessing causality.
The session will present a definition of what a RCTs are, their main feature, the appropriate
measures to be used to express their results, and a summary of their strengths and weaknesses.
Timing
This session should take you about one to two hours to complete. In this session, there is
one reading and a short task based on the reading. The feedback on the task has been
provided to you but you are encouraged to attempt the task before having a look at the
feedback.
Learning outcomes
Define a Randomised Controlled Trial and its main features
Learn how results from a RCT can be appropriately presented
Know the major strengths and limitations of this study design

Defining and using RCT’s
A RCT is a type of intervention study (in which the experimenter controls the exposure, as
opposed to observational studies, in which the exposure is determined by external factors),
often used to study the efficacy/effectiveness of various type of interventions (e.g. drugs,
medical procedures, preventive interventions).
A group of similar people (e.g. adults in a village) with a disease (e.g. haemorrhagic fever) are randomly selected into either an Intervention Group or a Non-intervention Group. The Intervention Group receives an active intervention from the researcher besides the usual care they are already receiving which is typically expected to reduce, or cure the disease (e.g. receive a new drug which they hope might cure haemorrhagic fever for which there is currently no known cure), while the Non-intervention Group do not receive any intervention from the researcher, but continue to receive their usual care. Giving a potential cure to one group but not another is justified as it is as yet uncertain that the drug will cure (or even diminish) the disease. Indeed the study is used to determine if the treatment will be successful at all and if successful to what degree it is successful, in either curing or minimising the disease. The success or failure of the treatment is assessed by following up both the Intervention group and the Non-intervention group and measuring if there is any change in disease status and how large the change is (if there is any change). If disease levels are absent (they are cured) or lower (the disease is lessened) amongst the Intervention Group than amongst the Non-intervention Group, then the treatment has been the cause of the cure (or lessening of) the disease, as that was the only difference between the two groups. As with the case series the diagramme below describes the study design by looking at time-periods and using arrows to indicate direction. A randomised control trial is used when one wants to assess a new possible cure, or treatment, or prevention of a disease when there is no currently available cure, or treatment, or prevention. It is also used when one wants to compare a new cure, or treatment, or prevention of a disease with an existing cure, or treatment, or prevention, to see if the new one is better than the existing one. Since the people in the study are chosen to be similar and since they are then randomly selected into the intervention and non-intervention groups thereby ensuring that the only difference between them is the treatment. A randomised control trial yields the strongest causal evidence of all the study designs.
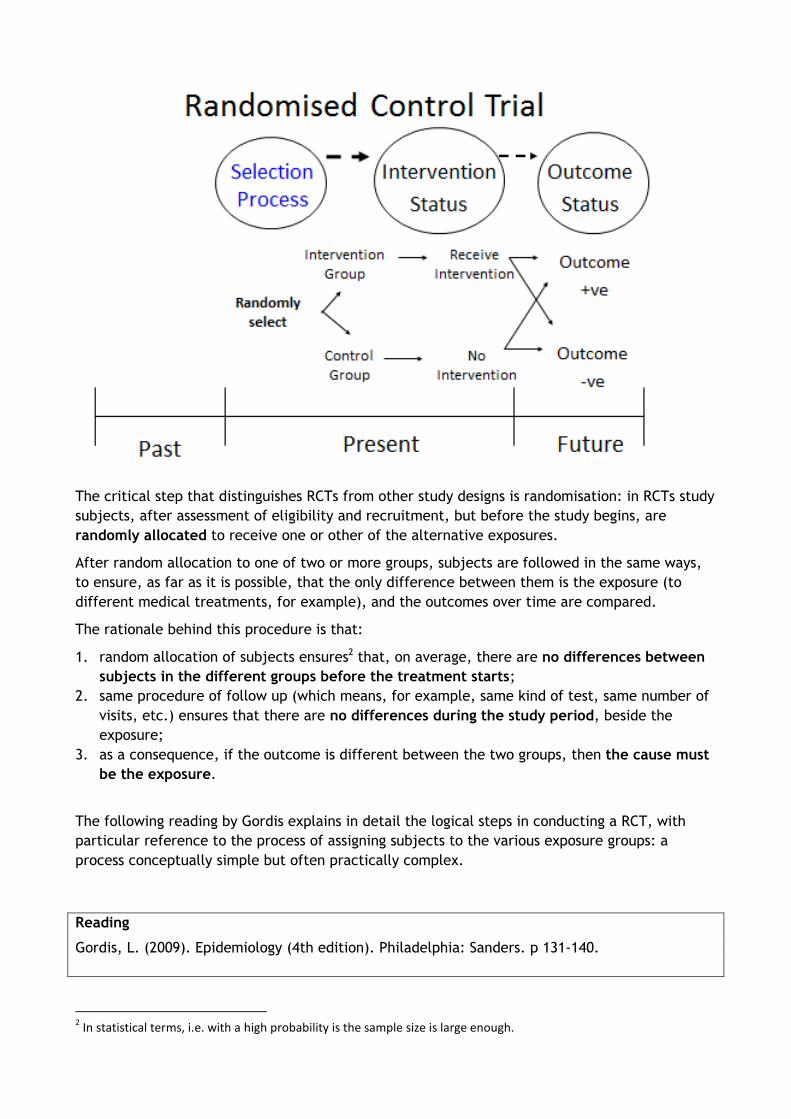
The critical step that distinguishes RCTs from other study designs is randomisation: in RCTs study
subjects, after assessment of eligibility and recruitment, but before the study begins, are
randomly allocated to receive one or other of the alternative exposures.
After random allocation to one of two or more groups, subjects are followed in the same ways,
to ensure, as far as it is possible, that the only difference between them is the exposure (to
different medical treatments, for example), and the outcomes over time are compared.
The rationale behind this procedure is that:
1. random allocation of subjects ensures2 that, on average, there are no differences between
subjects in the different groups before the treatment starts;
2. same procedure of follow up (which means, for example, same kind of test, same number of
visits, etc.) ensures that there are no differences during the study period, beside the
exposure;
3. as a consequence, if the outcome is different between the two groups, then the cause must
be the exposure.
The following reading by Gordis explains in detail the logical steps in conducting a RCT, with
particular reference to the process of assigning subjects to the various exposure groups: a
process conceptually simple but often practically complex.
Reading
Gordis, L. (2009). Epidemiology (4th edition). Philadelphia: Sanders. p 131-140.
2 In statistical terms, i.e. with a high probability is the sample size is large enough.
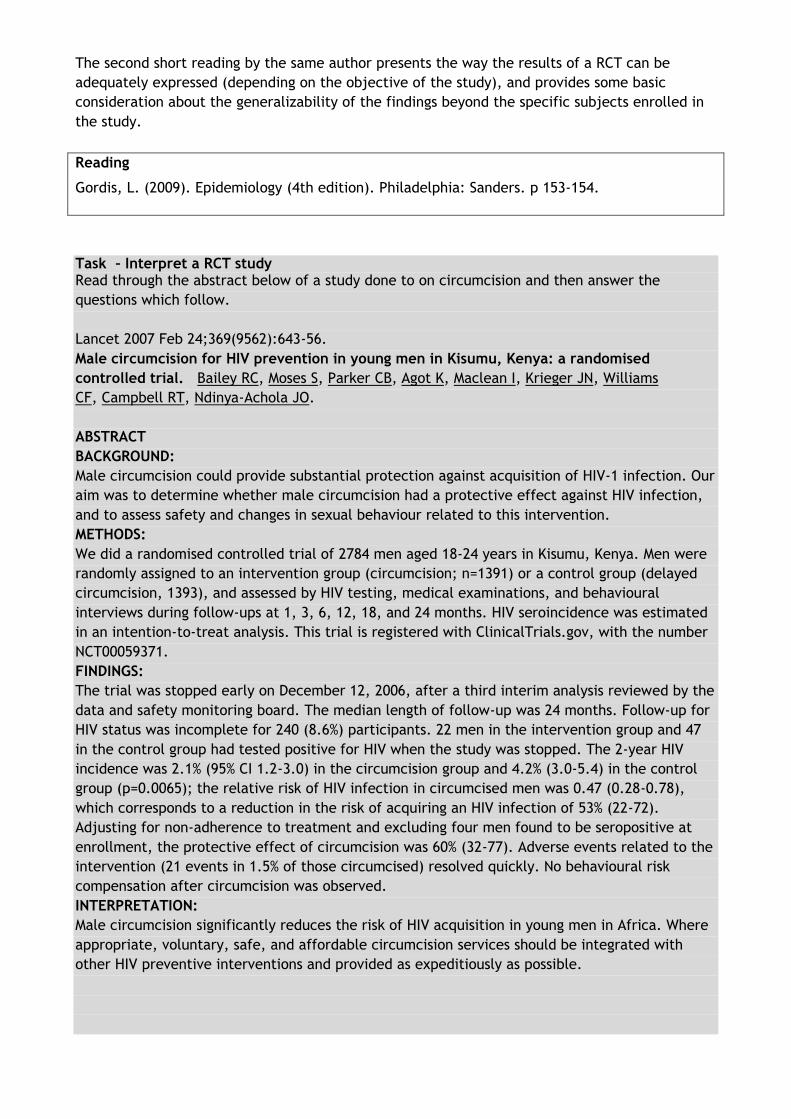
The second short reading by the same author presents the way the results of a RCT can be
adequately expressed (depending on the objective of the study), and provides some basic
consideration about the generalizability of the findings beyond the specific subjects enrolled in
the study.
Reading
Gordis, L. (2009). Epidemiology (4th edition). Philadelphia: Sanders. p 153-154.
Task – Interpret a RCT study Read through the abstract below of a study done to on circumcision and then answer the
questions which follow.
Lancet 2007 Feb 24;369(9562):643-56.
Male circumcision for HIV prevention in young men in Kisumu, Kenya: a randomised
controlled trial. Bailey RC, Moses S, Parker CB, Agot K, Maclean I, Krieger JN, Williams
CF, Campbell RT, Ndinya-Achola JO.
ABSTRACT
BACKGROUND:
Male circumcision could provide substantial protection against acquisition of HIV-1 infection. Our
aim was to determine whether male circumcision had a protective effect against HIV infection,
and to assess safety and changes in sexual behaviour related to this intervention.
METHODS:
We did a randomised controlled trial of 2784 men aged 18-24 years in Kisumu, Kenya. Men were
randomly assigned to an intervention group (circumcision; n=1391) or a control group (delayed
circumcision, 1393), and assessed by HIV testing, medical examinations, and behavioural
interviews during follow-ups at 1, 3, 6, 12, 18, and 24 months. HIV seroincidence was estimated
in an intention-to-treat analysis. This trial is registered with ClinicalTrials.gov, with the number
NCT00059371.
FINDINGS:
The trial was stopped early on December 12, 2006, after a third interim analysis reviewed by the
data and safety monitoring board. The median length of follow-up was 24 months. Follow-up for
HIV status was incomplete for 240 (8.6%) participants. 22 men in the intervention group and 47
in the control group had tested positive for HIV when the study was stopped. The 2-year HIV
incidence was 2.1% (95% CI 1.2-3.0) in the circumcision group and 4.2% (3.0-5.4) in the control
group (p=0.0065); the relative risk of HIV infection in circumcised men was 0.47 (0.28-0.78),
which corresponds to a reduction in the risk of acquiring an HIV infection of 53% (22-72).
Adjusting for non-adherence to treatment and excluding four men found to be seropositive at
enrollment, the protective effect of circumcision was 60% (32-77). Adverse events related to the
intervention (21 events in 1.5% of those circumcised) resolved quickly. No behavioural risk
compensation after circumcision was observed.
INTERPRETATION:
Male circumcision significantly reduces the risk of HIV acquisition in young men in Africa. Where
appropriate, voluntary, safe, and affordable circumcision services should be integrated with
other HIV preventive interventions and provided as expeditiously as possible.

Task Questions
1. Who were the study population?
2. What was the intervention?
3. What did the controls receive ?
4. What was the outcome measurement?
5. What were the Main Results?
6. Did they analyse on “intention to treat”?
7. Was there any blinding?
8. Was there any contamination?
9. Was there any co-intervention?
10. What did they conclude?
11. Do you agree with their conclusion
Task Feedback
1. Who were the study population
Men aged 18-24 years in Kisumu, Kenya
It was implied that they were uncircumcised and HIV negative
2. What was the intervention
Circumcision
3. What did the controls receive
Nothing
“Delayed circumcision” means that if the intervention is successful in reducing HV
incidence, then they will be offered a circumcision after the study is completed.
But during the actual study they didn’t receive anything (based on the abstract).
4. What was the outcome measurement
HIV seroincidence
5. What were the Main Results
2-year HIV incidence was 2.1% (95% CI 1.2-3.0) in the circumcision group and 4.2% (3.0-5.4)
in the control group
The relative risk or Cumulative Incidence Ratio over 2 years of HIV infection in circumcised
men was 0.47 with a 95% confidence interval of 0.28-0.78.
Incidence difference (4.2% - 2.1% = 2.1%) and Number Needed to Treat (100/2.1 = 48) were
not shown, but could easily be calculated.
They state that “No behavioural risk compensation after circumcision was observed” but
analysis results for this was not shown in the abstract (it is shown in the full article).
6. Did they analyse on intention to treat
They claimed to and did use “intention to treat” analysis, but then they strongly suggested
that the results based on “actually received treatment” should have been used instead.
They note that: “Adjusting for non-adherence to treatment and excluding four men found to
be seropositive at enrollment, the protective effect of circumcision was 60% (32-77).” This is
incorrect as using the results based on “actually received treatment” would introduce a
selection bias.
7. Any blinding

It is uncertain from the abstract. One would have to read the whole article.
It would of course have been impossible to blind the participants to the circumcision, but
one could blind those conducting the HIV tests and could blind the researchers doing the
analysis.
8. Any contamination
Uncertain from the abstract. One would have to read the whole article.
9. Any co-intervention
Uncertain from the abstract. One would have to read the whole article.
10. What did they conclude
Circumcision significantly reduces the likelihood of HIV infection. Circumcision (if it can be
done safely) should be offered (strongly encouraged) with other HIV preventive activities.
11. Do you agree with their conclusion
Yes, in that it reduces the risk of developing HIV infection over a short period of time.
No, regarding encouraging people to adopt it, as the number needed to treat (NNT) is high
(note that in other areas the NNT might be lower), the long term benefit needs to be
established and the cost of the circumcision and the risk of complications need to be
considered.

Unit 3 – Session 9 : Quasi-
experimental Studies
Introduction
This session describes the features of a class of study designs with can be considered as intermediate design between "full" experimental studies (in which the experimenter has a complete control over the assignment of subjects to the different exposure groups), and observational studies in which the researchers can only observe differences in the outcomes between subjects, but cannot decide the assignment of subjects. The main features and the advantages/disadvantages of this kind of study designs are presented.
Timing
This is a relatively short session and should take you about one hour to do. In this
session, there is one reading and a short task based on the reading. The feedback on the
task has been provided to you but you are encouraged to attempt the task before having
a look at the feedback.
Learning outcomes
Define quasi-experimental studies and contrast them with RCTs and observational
studies;
Know the most commonly applied quasi-experimental designs;
Know the major strengths and limitations of these studies.

Defining and using a Quasi-experimental study
A quasi-experiment is (1) a study in which the researchers have control over the exposure (e.g.
they administer a treatment) but lack the possibility to control for important confounders (by
random assignment of participants), or (2) a study in which control for confounding is reasonably
strong but the researchers lack the possibility to manipulate the exposure. A quasi-experiment is
therefore the same as a randomised controlled trial except that the participants in the study are
not randomly selected into the Intervention and the Non-intervention groups. So, a group of
similar people with a disease are non-randomly selected into an Intervention Group and Non-
intervention Group. The intervention group receives an intervention (e.g. join an exercise
programme) and the non-intervention group receives usual therapy (e.g. advised to exercise
regularly). Then follow–up the two groups for a period of time and assess which group has a
better outcome (e.g. decrease in Body Mass Index). If the intervention group has a better
outcome then the intervention may have caused the better outcome. Unfortunately the outcome
might also be because of a selection bias since the groups were not randomly selected so it is
possible that those who received the intervention were the ones who were more likely to
exercise anyway and hence they had a better outcome rather than due to the specific exercise
programme.
The main usage is when one wants to assess a possible cure, or treatment, or prevention of a disease and randomisation is not possible, e.g. staff to run an exercise programme are present at some schools but not in others.

There are many types of quasi-experiments. Among the most important and widely used are:
Non-Equivalent Groups Design
Pre-test-Post test Design
Interrupted Time-Series Designs
These designs are described in the reading by Price & Oswald:
Reading Price, P. & Oswald, K. (2008). Quasi-Experiments. Available at: http://psych.csufresno.edu/psy144/Content/Design/Nonexperimental/quasi.html [accessed 15/11/2013]
Task – Identifying quasi-experimental studies The abstract of an article by Graham and Neill3, says:
"Objective:
The study aimed to explore the short-term effects of “green exercise” on state
anxiety and to examine the influence of exercise type, intensity, duration, and
degree of greenness.
Method:
A quasi-experimental design involved eight pre-existing outdoor exercise groups (N =
101) who completed pre- and post-exercise questionnaires.
Results:
Results indicated a significant reduction in participants' state anxiety following green
exercise experiences (d = −0.47). However...."
1. Why do you think the authors defined their study as quasi-experimental? 2. Among the sub-types of quasi experimental studies you know, to which category would
you assign the study of Graham and Neill?
Task feedback This is an example of pre-post study, in which a group of individuals is subject to an "exposure" (the "green exercise" training) and an outcome (the anxiety status) after the exposure is compared with the same outcome before the exposure. The same group of individuals (in different times) constitute the "treatment" and the "control" group. The study is quasi-experimental, not "fully" experimental, because the researchers have control over the exposure, but they cannot assign the subjects randomly to it.
3 Graham M, Neill J (2012). The effect of “green exercise” on state anxiety and the role of exercise duration, intensity, and greenness : a quasi-experimental study. Psychology of Sport and Exercise, 11 (3) , pp. 238-245

Unit 3 – Session 10: Before-after
Study
Introduction
A before-after study design is one type of quasi-experimental studies. This design is
characterised by a pretest and posttest but no comparison group, thus measurements on an
outcome are made before and after some intervention in a single group of individuals. Often
these types of designs are used in programme evaluation activities linked to public health
interventions.
Timing This is a relatively short session and should take you about two hours to do. At the end of this
session, there is a ‘summary’ tasks on all study designs for you to work on. The feedback on the
task has been provided to you but you are encouraged to attempt the task before having a look
at the feedback.
Learning Outcomes Define a Before-after study design and its main features
Understand when a Before-after study design may be applicable
Know the major strengths and limitations of this study design

Defining and using a Before- After Study
An intervention is given to one group and that group is then compared with regard to an outcome to a time when they did not have the intervention, (e.g. doctors are trained on ART provision and then the quality of care given to HIV patients after training is compared to what they received before the training). If the outcome shows an improvement (quality of care increases) then the intervention is thought to have caused the outcome. Unfortunately the outcome could be due to something else that occurred between the time-period from before the intervention to after the intervention (e.g. no stock-outs of ART drugs whereas before there were stock-outs of ART drugs). One is not sure if this is the case as there is no non-intervention group to compare with. If there was a non-intervention group then the other things (the absence stock-outs) would have applied to that group as well and hence if the intervention group would be expected to have an even better outcome than the improved outcome of the non-intervention group. However since there is no non-intervention group one is unable to decide if the improvement is wholly due to the intervention. The main usage of this study design is when an intervention is available which was not available before and withholding it from a group would be unethical (e.g. the training programme for doctors). Hence one cannot have a non-intervention group.

Now that you have gone through the introduction to epidemiological study designs you should go over the reading by Hennekens and Buring (Chapter 2: pages 16 – 29; Design Strategies in Epidemiologic Research) and then attempt the tasks below. Reading Hennekens, C. H. and Buring, J. E. (1987) Epidemiology in Medicine. Boston: Lippincott Williams & Wilkins. Pages 16 – 29. Summary Tasks on all study designs Task A For each of the brief study descriptions 1-8 presented below, identify whether the study is experimental or observational and then describe the particular Study Design that was used.
1. Avian adeno-associated virus (bird flu) is suspected of resulting from exposure to poultry. Serum samples from a general adult population sample are tested to determine the proportion of individuals with positive Avian A-A antibody and they are asked if they had handled poultry in the last month.
2. A behaviour pattern identified as Type A (characterized by high ambition and time
urgency) is thought to be associated with coronary artery disease. A group of men in a post coronary rehabilitation programme are assessed to see who are Type A and who are Type B (all men not falling into the Type A group are denoted as Type B). Type A and Type B men are followed for 5 years to assess recurrence rates of coronary artery disease.
3. Investigators are studying employees at a large company to test their hypothesis that
occupational stress causes high blood pressure. The investigators measure the blood pressure and stress levels of all staff. . The mean blood pressure of staff that have high stress levels is higher than that of the staff that have low stress levels and the investigators conclude that stress causes high blood pressure.
4. One hundred newly diagnosed women with breast cancer are interviewed to determine
their lifelong dietary history for the consumption of fat. Healthy first-degree female relatives (mothers or sisters) of these women are interviewed in a similar manner. We compare the proportion of women reporting a history of high dietary fat consumption in breast cancer patients and the healthy relatives. . Fifteen hundred adult females working for a university are recruited to participate in a study of coronary heart disease. Every 3 years they are examined for new occurrences of this disease. Coronary artery disease rates are compared among groups defined by personal characteristics as they were recorded at the beginning of the study (such as exercise level, smoking, diet, cholesterol levels, age).
5. A random sample of middle-age sedentary males was selected from a soccer fan club and
each was examined for coronary artery disease. All those having the disease were excluded from the study. All the others were randomly assigned to either an exercise group, which followed a 2-year program of systematic exercise, or a control group, which had no exercise program. Both groups were observed quarterly for the incidence of coronary artery disease.
6. One hundred persons with infectious hepatitis and 100 healthy neighbours were
questioned regarding their history of eating raw oysters within the preceding 3 months.
7. Questionnaires were mailed to every tenth person listed in the city of Cape Town telephone directory. Each person was asked to list their age, sex, and respiratory symptoms during the preceding 7 days. Over 90% of questionnaires were completed and returned. The prevalence of upper respiratory symptoms was determined from the responses.

Task B For each of the examples below state what Study Design could one use to answer the research question being posed.
1. The prevalence of malnutrition among children under five year of age in a community. 2. A study describing knowledge, attitudes and practices of caregivers concerning diarrhoea
and its treatment. 3. A comparison of the childhood mortality in communities with and without piped water. 4. Socio-economic risk factors for diarrhoea. 5. Maternal education as a risk factor for death among children who get diarrhoea. 6. A comparison of the diarrhoea mortality in a community before and after the
introduction of piped water into that community. 7. An evaluation of the effect of a community health worker (CHW) programme focusing on
appropriate treatment by mothers of children with diarrhoea. 8. To evaluate which method of rehydration is most effective in a hospital setting.
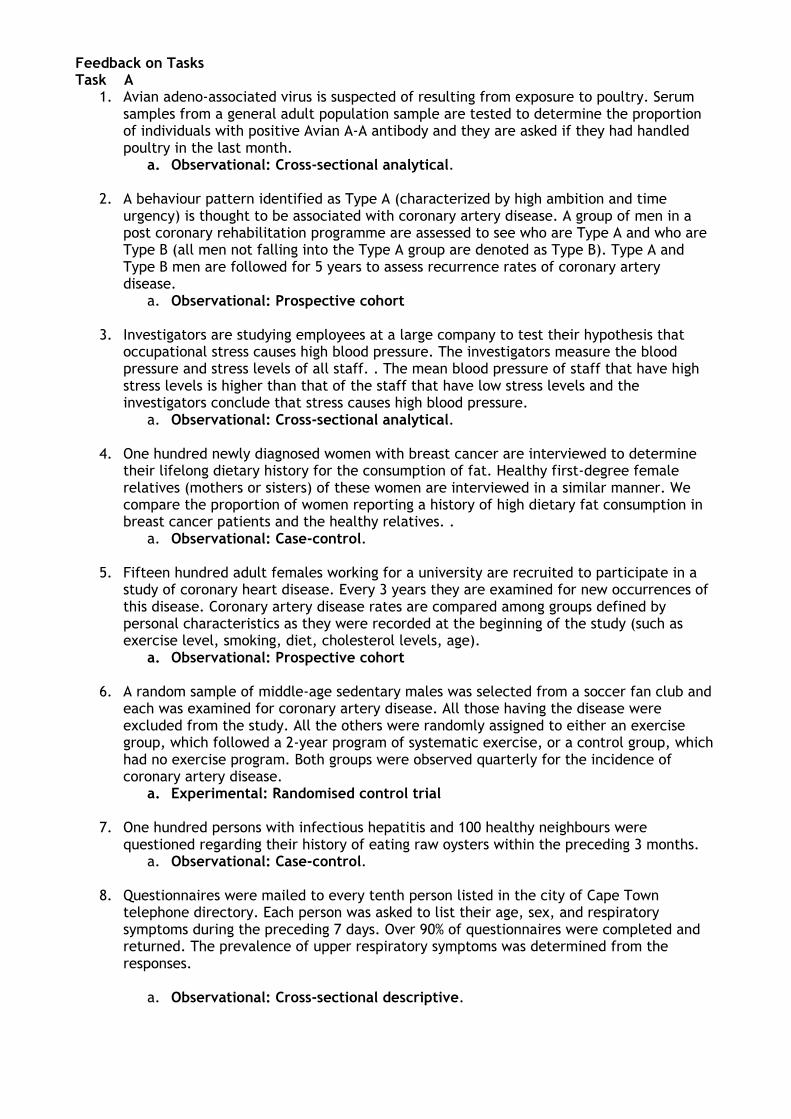
Feedback on Tasks Task A
1. Avian adeno-associated virus is suspected of resulting from exposure to poultry. Serum samples from a general adult population sample are tested to determine the proportion of individuals with positive Avian A-A antibody and they are asked if they had handled poultry in the last month.
a. Observational: Cross-sectional analytical.
2. A behaviour pattern identified as Type A (characterized by high ambition and time urgency) is thought to be associated with coronary artery disease. A group of men in a post coronary rehabilitation programme are assessed to see who are Type A and who are Type B (all men not falling into the Type A group are denoted as Type B). Type A and Type B men are followed for 5 years to assess recurrence rates of coronary artery disease.
a. Observational: Prospective cohort
3. Investigators are studying employees at a large company to test their hypothesis that occupational stress causes high blood pressure. The investigators measure the blood pressure and stress levels of all staff. . The mean blood pressure of staff that have high stress levels is higher than that of the staff that have low stress levels and the investigators conclude that stress causes high blood pressure.
a. Observational: Cross-sectional analytical.
4. One hundred newly diagnosed women with breast cancer are interviewed to determine their lifelong dietary history for the consumption of fat. Healthy first-degree female relatives (mothers or sisters) of these women are interviewed in a similar manner. We compare the proportion of women reporting a history of high dietary fat consumption in breast cancer patients and the healthy relatives. .
a. Observational: Case-control.
5. Fifteen hundred adult females working for a university are recruited to participate in a study of coronary heart disease. Every 3 years they are examined for new occurrences of this disease. Coronary artery disease rates are compared among groups defined by personal characteristics as they were recorded at the beginning of the study (such as exercise level, smoking, diet, cholesterol levels, age).
a. Observational: Prospective cohort
6. A random sample of middle-age sedentary males was selected from a soccer fan club and each was examined for coronary artery disease. All those having the disease were excluded from the study. All the others were randomly assigned to either an exercise group, which followed a 2-year program of systematic exercise, or a control group, which had no exercise program. Both groups were observed quarterly for the incidence of coronary artery disease.
a. Experimental: Randomised control trial
7. One hundred persons with infectious hepatitis and 100 healthy neighbours were questioned regarding their history of eating raw oysters within the preceding 3 months.
a. Observational: Case-control.
8. Questionnaires were mailed to every tenth person listed in the city of Cape Town telephone directory. Each person was asked to list their age, sex, and respiratory symptoms during the preceding 7 days. Over 90% of questionnaires were completed and returned. The prevalence of upper respiratory symptoms was determined from the responses.
a. Observational: Cross-sectional descriptive.
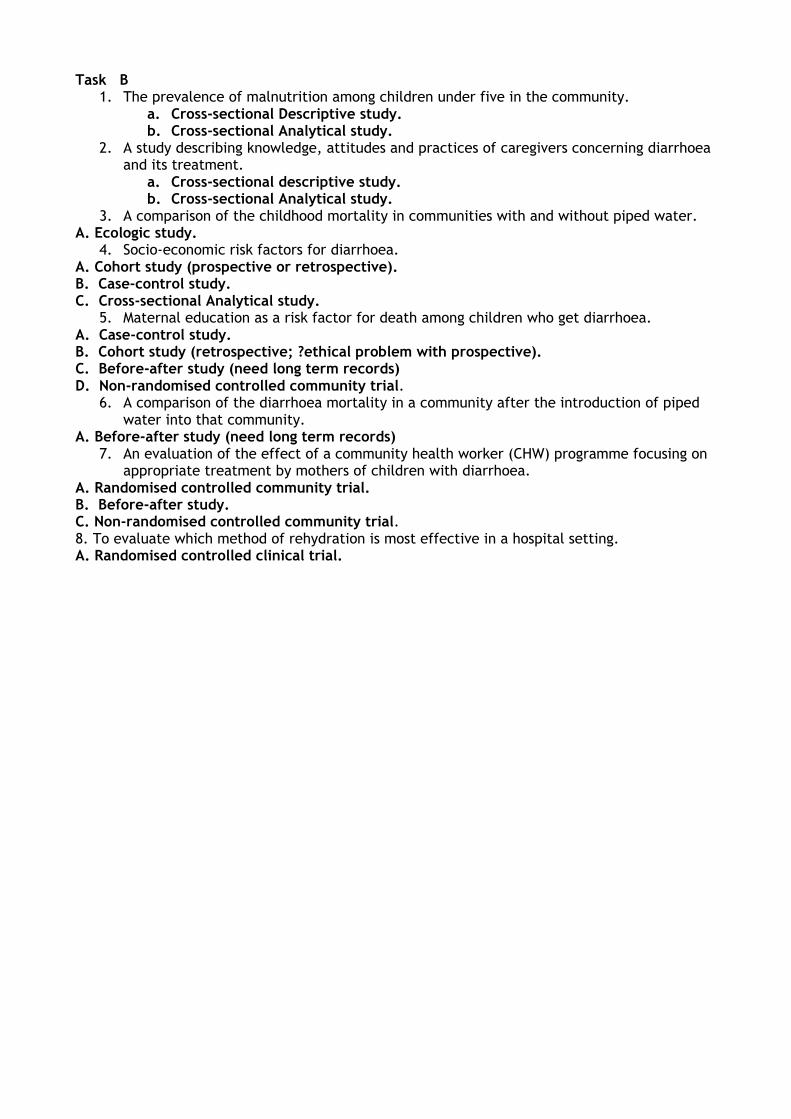
Task B
1. The prevalence of malnutrition among children under five in the community. a. Cross-sectional Descriptive study. b. Cross-sectional Analytical study.
2. A study describing knowledge, attitudes and practices of caregivers concerning diarrhoea and its treatment.
a. Cross-sectional descriptive study. b. Cross-sectional Analytical study.
3. A comparison of the childhood mortality in communities with and without piped water. A. Ecologic study.
4. Socio-economic risk factors for diarrhoea. A. Cohort study (prospective or retrospective). B. Case-control study. C. Cross-sectional Analytical study.
5. Maternal education as a risk factor for death among children who get diarrhoea. A. Case-control study. B. Cohort study (retrospective; ?ethical problem with prospective). C. Before-after study (need long term records) D. Non-randomised controlled community trial.
6. A comparison of the diarrhoea mortality in a community after the introduction of piped water into that community.
A. Before-after study (need long term records) 7. An evaluation of the effect of a community health worker (CHW) programme focusing on
appropriate treatment by mothers of children with diarrhoea. A. Randomised controlled community trial. B. Before-after study. C. Non-randomised controlled community trial. 8. To evaluate which method of rehydration is most effective in a hospital setting. A. Randomised controlled clinical trial.