unit 2: jun 2010 - mark scheme
DESCRIPTION
TRANSCRIPT

Mark Scheme (Results)
Summer 2010
GCE
GCE ECONOMICS (6EC02) Paper 01
Edexcel Limited. Registered in England and Wales No. 4496 50 7 Registered Office: One90 High Holborn, London WC1V 7BH

Edexcel is one of the leading examining and awarding bodies in the UK and throughout the world. We provide a wide range of qualifications including academic, vocational, occupational and specific programmes for employers.
Through a network of UK and overseas offices, Edexcel’s centres receive the support they need to help them deliver their education and training programmes to learners.
For further information, please call our GCE line on 0844 576 0025, our GCSE team on 0844 576 0027, or visit our website at www.edexcel.com.
If you have any subject specific questions about the content of this Mark Scheme that require the help of a subject specialist, you may find our Ask The Expert email service helpful. Ask The Expert can be accessed online at the following link: http://www.edexcel.com/Aboutus/contact-us/ Alternatively, you can speak directly to a subject specialist at Edexcel on our dedicated subject* telephone line: 0207 190 5329
Summer 2010
Publications Code US023771
All the material in this publication is copyright © Edexcel Ltd 2010

Question Number
Answer Mark
1(a A measure of the difference between actual and potential (or trend)
out
lo up to 2 marks for written explanation OR an appropriate diagram
s o
)(i) growth/output/GDP. Reward explanations of both positive and negative
put gaps. (2 marks).
Al w(AS/AD, PPF, Business Cycle showing trend or potential and actual) h wing actual and potential growth/output/GDP.
The Output Gap
O
National outpu
t
Time
Potential output
Actualoutput
A
B C
D
continued on next page
)
(4

Output Gap using AD AS: Q1 – Q2
5
O
Pric
e le
vel
National output
AS1
AD
P1
Q1 Q2
B
OResource A
Resource B
A
Output Gap: difference between actual and potential production
Reference: data or extract (2 marks)
Question Number
Answer Mark
1(a)(ii) Definition of fiscal (2 marks: G 1 and T 1) and monetary policies – interest rates are sufficient (2 marks) Use of extract 2 marks Identification of certain differences (up to 4 marks), e.g.
• body in charge, government vs MPC; • frequency of adjustment, typically annual vs monthly.
(6)

Question Number
Answer Mark
1(a)(iii) KAA 12 marks Expansionary: (4 marks) G rises or T falls (2 marks); interest rate falls (2 marks) How the policy shifts AD (right/up) either:
• Written explanation (2x4 marks); or • Up to 8 marks can be awarded for a written explanation and
diagram; Axes labelled (1), Lines labelled (1), correct movement (1), Equilibrium labelled (1)
Evaluation (4 marks) factors might include (1x4 marks or 2x2 marks) • that demand management might not work if AS vertical • the policies work in tandem • the policies cancel each other out • inaccurate or missing information • time lag or other short run/long run distinction • taxes may have to rise, or government spending fall in the
future • size of multiplier, e.g. high savings ratio means the policy is not
very effective • other things not equal, e.g. low confidence, credit crisis
(16)
Question Number
Answer Mark
1(b)(i) Unemployment (ILO) up to 2 marks: • out of work in last four weeks (1) • ready to work in two (1) • Questionnaire/interview (1) • Survey by phone call/paper (1) • Internationally recognised (1) • age 16-65 (1) • Sample, and related problems (1)
Claimant count up to 2 marks:
• the number of people claiming/receiving (1) • JSA/dole/or unemployment related benefit (1) • Age range – 18-60/65 (1) • savings cap (1) • must be able to prove they are looking for work (1). • Register at unemployment offices (1)
(4)
Question Number
Answer Mark
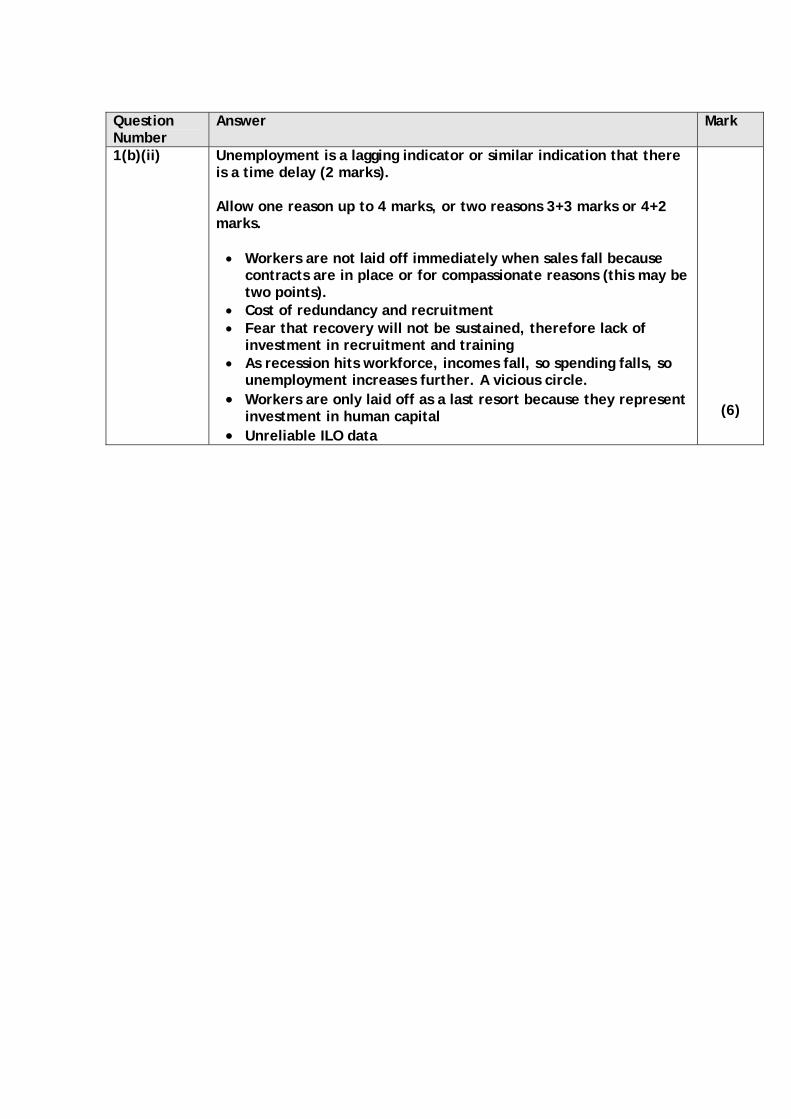
1(b)(ii) Unemployment is a lagging indicator or similar indication that there is a time delay (2 marks). Allow one reason up to 4 marks, or two reasons 3+3 marks or 4+2 marks. • Workers are not laid off immediately when sales fall because
contracts are in place or for compassionate reasons (this may be two points).
• Cost of redundancy and recruitment • Fear that recovery will not be sustained, therefore lack of
investment in recruitment and training • As recession hits workforce, incomes fall, so spending falls, so
unemployment increases further. A vicious circle. • Workers are only laid off as a last resort because they represent
investment in human capital • Unreliable ILO data
(6)

Question Number
Answer Mark
1(c) KAA 10 marks Use of data (2 marks) Significance of immigration for employment:
• 30% of immigrants have definite job – the immigrants may fill vacancies that cannot be filled by indigenous workers
• Increased supply of labour might push down wages and average wage levels will fall. The demand for workers increases and employment increases
• Increased consumer spending from increased population means more jobs are created
(4 marks for one point or 2+2 marks or 3+1 mark) Significance of immigration for unemployment:
• 12% of immigrants are looking for work or the 30% with jobs – these might displace current employees
• Surplus labour in the market, e.g. friends and family, might attempt to join labour market but with inappropriate skills
(4 marks for one point or 2+2 marks or 3+1 mark) The arguments in reverse are allowable in the context of falling immigration rates (shown in fig. 3) Evaluation 4 marks (2+2 marks or 3+1 mark): • Evidence might not be reliable – e.g. reason for immigration is a
loaded question • It is not known whether those coming for ‘formal study’ are going
to remain in the UK • The friends and family may or may not wish to join the labour
market; they cannot be counted as unemployed unless they are willing and able to work in the next two weeks. Might have dependents.
• Dependents may or may not have an effect • Net migration is a more significant figure
(14)
Question Number
Answer Mark
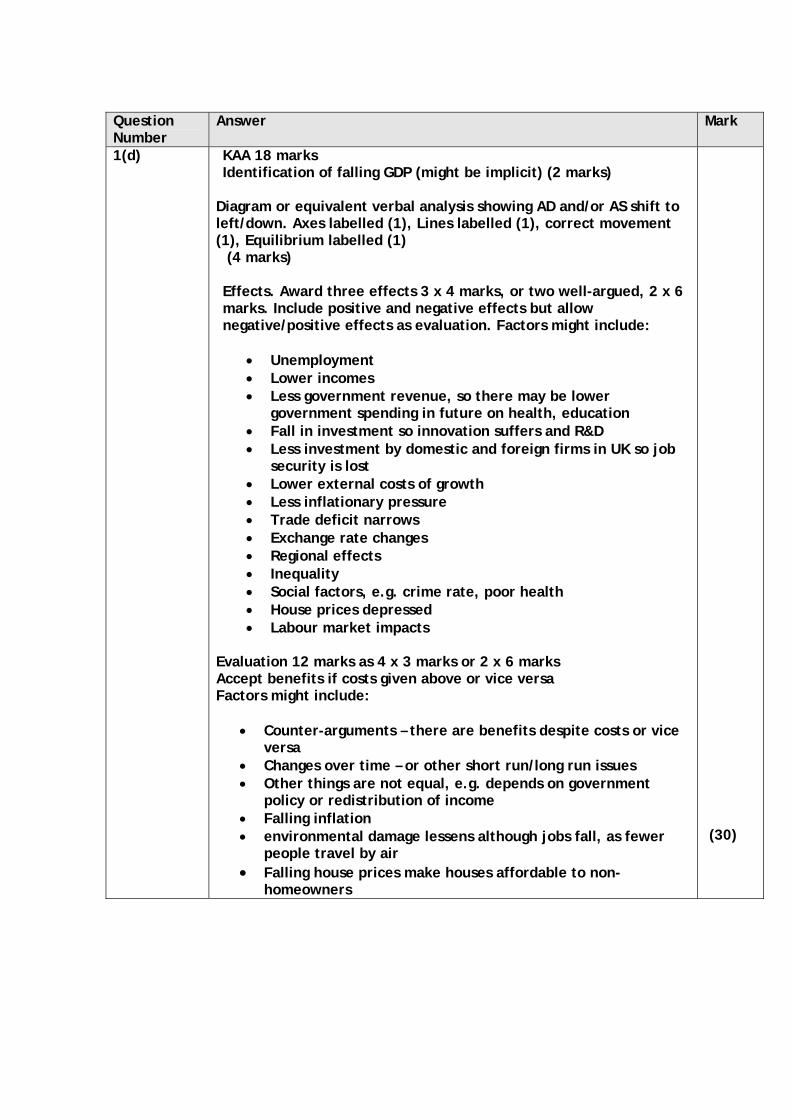
1(d) KAA 18 marks Identification of falling GDP (might be implicit) (2 marks)
Diagram or equivalent verbal analysis showing AD and/or AS shift to left/down. Axes labelled (1), Lines labelled (1), correct movement (1), Equilibrium labelled (1) (4 marks) Effects. Award three effects 3 x 4 marks, or two well-argued, 2 x 6 marks. Include positive and negative effects but allow negative/positive effects as evaluation. Factors might include:
• Unemployment • Lower incomes • Less government revenue, so there may be lower
government spending in future on health, education • Fall in investment so innovation suffers and R&D • Less investment by domestic and foreign firms in UK so job
security is lost • Lower external costs of growth • Less inflationary pressure • Trade deficit narrows • Exchange rate changes • Regional effects • Inequality • Social factors, e.g. crime rate, poor health • House prices depressed • Labour market impacts
Evaluation 12 marks as 4 x 3 marks or 2 x 6 marks Accept benefits if costs given above or vice versa Factors might include:
• Counter-arguments – there are benefits despite costs or vice versa
• Changes over time – or other short run/long run issues • Other things are not equal, e.g. depends on government
policy or redistribution of income • Falling inflation • environmental damage lessens although jobs fall, as fewer
people travel by air • Falling house prices make houses affordable to non-
homeowners
(30)
Question Number
Answer Mark
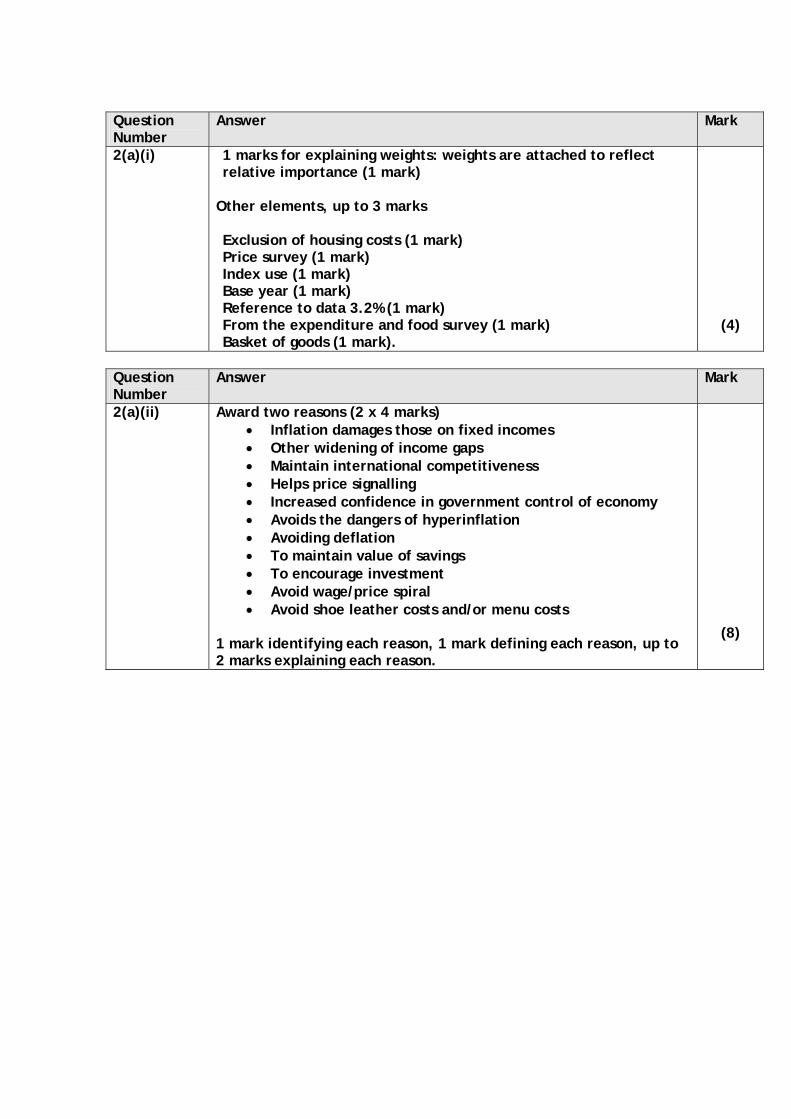
2(a)(i) 1 marks for explaining weights: weights are attached to reflect relative importance (1 mark)
Other elements, up to 3 marks Exclusion of housing costs (1 mark) Price survey (1 mark) Index use (1 mark) Base year (1 mark) Reference to data 3.2% (1 mark) From the expenditure and food survey (1 mark) Basket of goods (1 mark).
(4)
Question Number
Answer Mark
2(a)(ii) Award two reasons (2 x 4 marks) • Inflation damages those on fixed incomes • Other widening of income gaps • Maintain international competitiveness • Helps price signalling • Increased confidence in government control of economy • Avoids the dangers of hyperinflation • Avoiding deflation • To maintain value of savings • To encourage investment • Avoid wage/price spiral • Avoid shoe leather costs and/or menu costs
1 mark identifying each reason, 1 mark defining each reason, up to 2 marks explaining each reason.
(8)
Question Number
Answer Mark
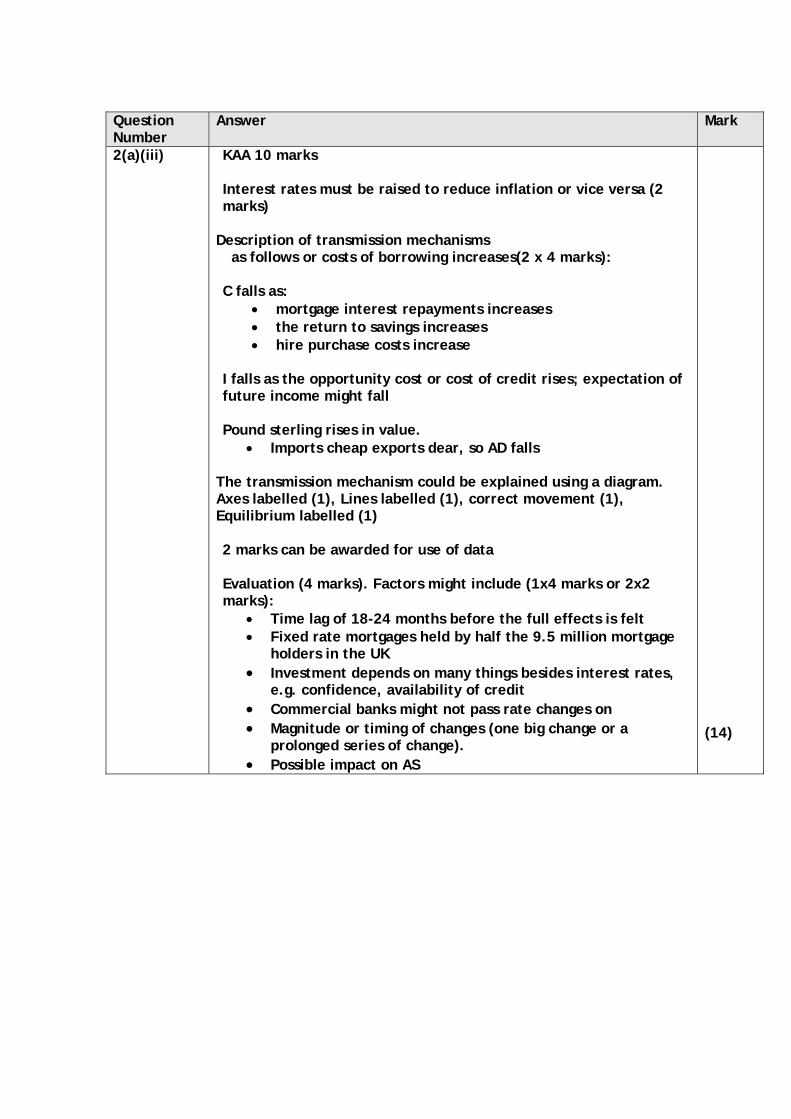
2(a)(iii) KAA 10 marks Interest rates must be raised to reduce inflation or vice versa (2 marks)
Description of transmission mechanisms as follows or costs of borrowing increases(2 x 4 marks): C falls as:
• mortgage interest repayments increases • the return to savings increases • hire purchase costs increase
I falls as the opportunity cost or cost of credit rises; expectation of future income might fall Pound sterling rises in value.
• Imports cheap exports dear, so AD falls The transmission mechanism could be explained using a diagram. Axes labelled (1), Lines labelled (1), correct movement (1), Equilibrium labelled (1) 2 marks can be awarded for use of data Evaluation (4 marks). Factors might include (1x4 marks or 2x2 marks):
• Time lag of 18-24 months before the full effects is felt • Fixed rate mortgages held by half the 9.5 million mortgage
holders in the UK • Investment depends on many things besides interest rates,
e.g. confidence, availability of credit • Commercial banks might not pass rate changes on • Magnitude or timing of changes (one big change or a
prolonged series of change). • Possible impact on AS
(14)

Question Number
Answer Mark
2(b)(i) Up to 2 marks for each figure Trend (1 mark) correct use of numerical data (1 mark)
e.g. fig. 1 House prices peaked (1) in 2007 (1) or at £200 000 (1) e.g. fig. 2 Affordability similar path (1) – reached over 5 times earnings of first time buyers (1), but houses are now more affordable (1), at 4 times earnings (1) Affordability peak in 2007, but give credit for 2008. (1)
(4)
Question Number
Answer Mark
2(b)(ii) When asset (accept house prices or shares etc.) values change (accept data) (2 marks) This affects changes in spending (or similar, e.g. confidence) (2 marks).
(4)
Question Number
Answer Mark
2(b)(iii) KAA 12
Diagram AD shifts to left. Axes labelled (1), Lines labelled (1), correct movement (1), Equilibrium labelled (1) (4 marks) State output falls (2 marks) and price level falls (2 marks) Transmission mechanisms (1x4 or 2x2 marks) showing:
• house price effect on consumption and/or other elements of AD
• AD falls with multiplier effects, as C falls. Refer to mortgage equity withdrawal, credit problems or confidence issues.
Evaluation (1 x 4 marks or 2 x 2 marks) might include:
• This appears to be a return to trend of affordability.
• ence is likely to improve, but it depends on other factors
ession effects on
pact
inaccurate information.
• Depends on elasticity of AS • Magnitude of the multiplier effect
• Housing is a very significant proportion of UK assets
Confidtoo.
• Other things may not be equal, e.g. global recconfidence
• First time buyers can now enter the market.
• Time factors might delay im
• There is only limited and possibly
(16)

Question Number
Answer Mark
2(c) KAA 18 marks of which Identification of concept of stimulating growth, that is, raising real or potential GDP (might be implicit) (2 marks)
Diagram, or equivalent written analysis (4 marks). AD/AS or shift to the right. Axes labelled (1), Lines labelled (1), correct movement (1), Equilibrium labelled (1) Policies that might stimulate growth (12 marks) 3 x 4 marks might include:
• Increased government spending • Cutting tax • Monetary policy (e.g. cutting interest rates) • Improved trade, e.g. export led growth • Supply side policies (may count as up to three separate
policies) Evaluation (12 marks) 3 x 4 marks or 2 x 6 marks might include:
• Depends on elasticity of AS when AD shifts • Conflict between policies • Depends on credit availability. Credit problems might prevent
growth policy from working, e.g. Greece 2010 or other countries with problems of increased fiscal deficit
• Time lag and implementation lags • Other things are not equal – e.g. depends on global economic
changes • Proximity to full capacity if AD led growth • Magnitude of multiplier effect
Other side effects of policies, e.g. higher growth rates tend to widen income inequality.
(30)


Further copies of this publication are available from Edexcel Publications, Adamsway, Mansfield, Notts, NG18 4FN Telephone 01623 467467 Fax 01623 450481 Email [email protected] Order Code US023771 Summer 2010 For more information on Edexcel qualifications, please visit www.edexcel.com/quals Edexcel Limited. Registered in England and Wales no.4496750 Registered Office: One90 High Holborn, London, WC1V 7BH