unit 1 workstudy and ergonomics 1.0 work ...fmcet.in/mech/me2027_uw.pdfall the details about the...
TRANSCRIPT

UNIT 1
WORKSTUDY AND ERGONOMICS
1.0 WORK STUDY
First technique applied for increasing productivity.
Considered as a valuable tool in increasing productivity.
Definition: Work study is a generic term for the techniques of method study and work
measurement.
These techniques are used in the examination of human work in all its contexts. They lead
systematically to the investigation of all the factors which affect the efficiency and economy at
the
work place in order to affect improvement.
1.1.METHOD STUDY
Method study is the technique of systematic recording and critical examination of
existing and
proposed ways of doing work and developing an easier and economical method.
1.1.1 Objectives of Method Study
1. Improvement of manufacturing processes and procedures.
2. Improvement of working conditions.
3. Improvement of plant layout and work place layout.
4. Reducing the human effort and fatigue.
5. Reducing material handling
6. Improvement of plant and equipment design.
7. Improvement in the utility of material, machines and manpower.
8. Standardisation of method.
9. Improvement in safety standard.
1.2. BASIC PROCEDURE FOR METHOD STUDY
The basic procedure for conducting method study is as follows:
1. Select the work to be studied.
2. Record all facts about the method by direct observation.
3. Examine the above facts critically.
4. Develop the most efficient and economic method.
5. Define the new method.
6. Install the new method
7. Maintain the new method by regular checking.
1. Select
While selecting a job for doing method study, the following factors are considered:
(a) Economical factors.
(b) Human factors.
(c) Technical factors.
(a) Economical Factors
The money saved as a result of method study should be sufficiently more. Then only the study
will
be worthwhile. Based on the economical factors, generally the following jobs are selected.
(a) Operations having bottlenecks (which holds up other production activities).
(b) Operations done repetitively.
FMCET

FFMCET
(c) Operations having a great amount of manual work.
(d) Operations where materials are moved for a long distance.
(b) Human Factors
The method study will be successful only with the co-operation of all people concerned viz.,
workers,
supervisor, trade unions etc.
Workers may resist method study due to
1. The fear of unemployment.
2. The fear of reduction in wages.
3. The fear of increased work load.
then if they do not accept method study, the study should be postponed.
(c) Technical Factors
To improve the method of work all the technical details about the job should be
available. Every machine tool will have its own capacity. Beyond this, it cannot be improved.
For example, a work
study man feels that speed of the machine tool may be increased and HSS tool may be used. But
the capacity of the machine may not permit increased speed. In this case, the suggestion of the
work study man cannot be implemented. These types of technical factors should be considered.
2. Record
All the details about the existing method are recorded. This is done by directly observing
the work.
Symbols are used to represent the activities like operation, inspection, transport, storage and
delay.
Different charts and diagrams are used in recording. They are:
1. Operation process chart: All the operations and inspections are recorded.
2. Flow process chart
(a) Man type All the activities of man are recorded
(b) Material type All the activities of the material are recorded
(c) Equipment type All the activities of equipment or machine are recorded.
3. Two-handed process chart: Motions of both lands of worker are
Right hand-Left hand chart recorded independently.
4. Multiple activity chart: Activities of a group of workers doing a single job or the
activities of a
single worker operating a number of machines are recorded.
5. Flow diagram: This is drawn to suitable scale. Path of flow of material in the shop is
recorded.
6. String diagram: The movements of workers are recorded using a string in a diagram
drawn to
scale.
3. Examine
Critical examination is done by questioning technique. This step comes after the
method is recorded by suitable charts and diagrams.
The individual activity is examined by putting a number of questions.
The following factors are questioned

1. Purpose – To eliminate the activity, if possible.
2. Place – To combine or re-arrange the activities.
3. Sequence – -do-
4. Person – -do-
5. Means – To simplify the activity.
The following sequence of questions is used:
1. Purpose – What is actually done?
Why is it done?
What else could be done?
What should be done?
2. Place – Where is it being done?
Why is it done there?
Where else could it be done?
Where should it be done?
3. Sequence – When is it done?
Why is it done then?
When could it be done?
When should it be done?
4. Person – Who is doing it?
Why does that person do it?
Who else could do it?
Who should do it?
5. Means – How is it done?
Why is it done that way?
How else could it be done?
How should it be done?
By doing this questioning
Unwanted activities can be eliminated
Number of activities can be combined or re-arranged
Method can be simplified.
All these will reduce production time.
4. Develop
The answer to the questions given below will result in the development of a better method.
1. Purpose – What should be done?
2. Place – Where should it be done?
3. Sequence – When should it be done?
4. Person – Who should do it?
5. Means – How should it be done?
5. Define
Once a complete study of a job has been made and a new method is developed, it is
necessary to
obtain the approval of the management before installing it. The work study man should prepare a
report giving details of the existing and proposed methods. He should give his reasons for the
changes
suggested. The report should show
(a) Brief description of the old method.

(b) Brief description of the new method.
(c) Reasons for change.
(d) Advantages and limitations of the new method.
(e) Savings expected in material, labour and overheads.
(f) Tools and equipment required for the new method.
(g) The cost of installing the new method including.
1. Cost of new tools and equipment.
2. Cost of re-layout of the shop.
3. Cost of training the workers in the new method.
4. Cost of improving the working conditions.
Written standard practice: Before installing the new method, an operator‘s instructions sheet
called written standard practice is prepared. It serves the following purposes:
1. It records the improved method for future reference in as much detail as may be
necessary.
2. It is used to explain the new method to the management foreman and operators.
3. It gives the details of changes required in the layout of machine and work places.
4. It is used as an aid to training or retraining operators.
5. It forms the basis for time studies.
The written standard practice will contain the following information:
(a) Tools and equipment to be used in the new method.
(b) General operating conditions.
(c) Description of the new method in detail.
(d) Diagram of the workplace layout and sketches of special tools, jigs or fixtures
required.
6. Install
This step is the most difficult stage in method study. Here the active support of both
management
and trade union is required. Here the work study man requires skill in getting along with other
people and winning their trust. Instal stage consists of
(a) Gaining acceptance of the change by supervisor.
(b) Getting approval of management.
(c) Gaining the acceptance of change by workers and trade unions.
(d) Giving training to operators in the new method.
(e) To be in close contact with the progress of the job until it is satisfactorily executed.
7. Maintain
The work study man must see that the new method introduced is followed. The workers
after some time may slip back to the old methods. This should not be allowed. The new method
may have defects. There may be difficulties also. This should be rectified in time by the work
study man. Periodical review is made. The reactions and suggestions from workers and
supervisors are noted. This may lead to further improvement. The differences between the new
written standard practice and the actual practice are found out. Reasons for variations are
analysed. Changes due to valid reasons are accepted. The instructions are suitably modified.
1.3 CHARTS AND DIAGRAMS USED IN METHOD STUDY (TOOLS AND
TECHNIQUES)
As explained earlier, the following charts and diagrams are used in method study.
1. Operation process chart (or) Outline process chart.
2. Flow process chart.
(a) Material type
(b) Operator type
(c) Equipment type
3. Two-handed process chart. (or) Left hand-Right hand chart
4. Multiple activity chart.
5. Flow diagram.
6. String diagram.
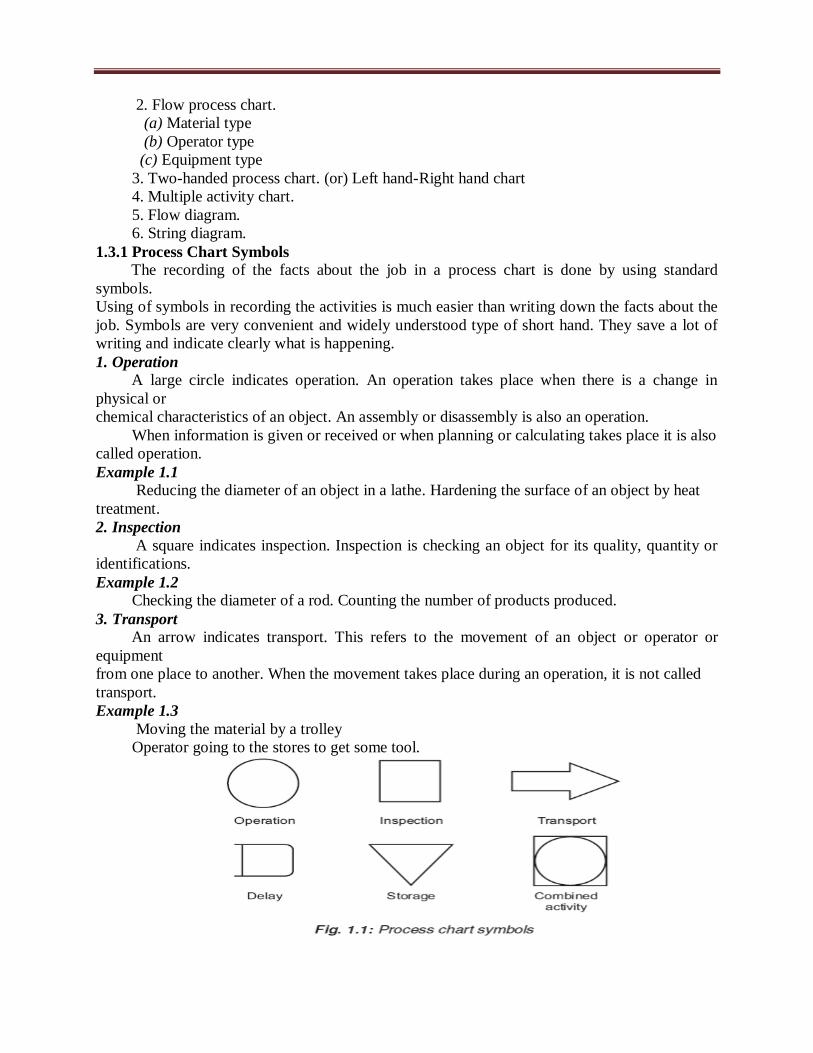
1.3.1 Process Chart Symbols
The recording of the facts about the job in a process chart is done by using standard
symbols.
Using of symbols in recording the activities is much easier than writing down the facts about the
job. Symbols are very convenient and widely understood type of short hand. They save a lot of
writing and indicate clearly what is happening.
1. Operation
A large circle indicates operation. An operation takes place when there is a change in
physical or
chemical characteristics of an object. An assembly or disassembly is also an operation.
When information is given or received or when planning or calculating takes place it is also
called operation.
Example 1.1
Reducing the diameter of an object in a lathe. Hardening the surface of an object by heat
treatment.
2. Inspection
A square indicates inspection. Inspection is checking an object for its quality, quantity or
identifications.
Example 1.2
Checking the diameter of a rod. Counting the number of products produced.
3. Transport
An arrow indicates transport. This refers to the movement of an object or operator or
equipment
from one place to another. When the movement takes place during an operation, it is not called
transport.
Example 1.3
Moving the material by a trolley
Operator going to the stores to get some tool.
4. Delay or temporary storage
A large capital letter D indicates delay. This is also called as temporary storage. Delay occurs
when an object or operator is waiting for the next activity.
Example 1.4
An operator waiting to get a tool in the stores. Work pieces stocked near the machine before
the next operation.
10 Process Planning and Cost Estimation
5. Permanent storage
An equilateral triangle standing on its vertex represents storage. Storage takes place when an
object
is stored and protected against unauthorized removal.
Example 1.5
Raw material in the store room.
6. Combined activity
When two activities take place at the same time or done by the same operator or at the same
place, the two symbols of activities are combined.
Example 1.6
Reading and recording a pressure gauge. Here a circle inside a square represents the combined
activity of operation and inspection.
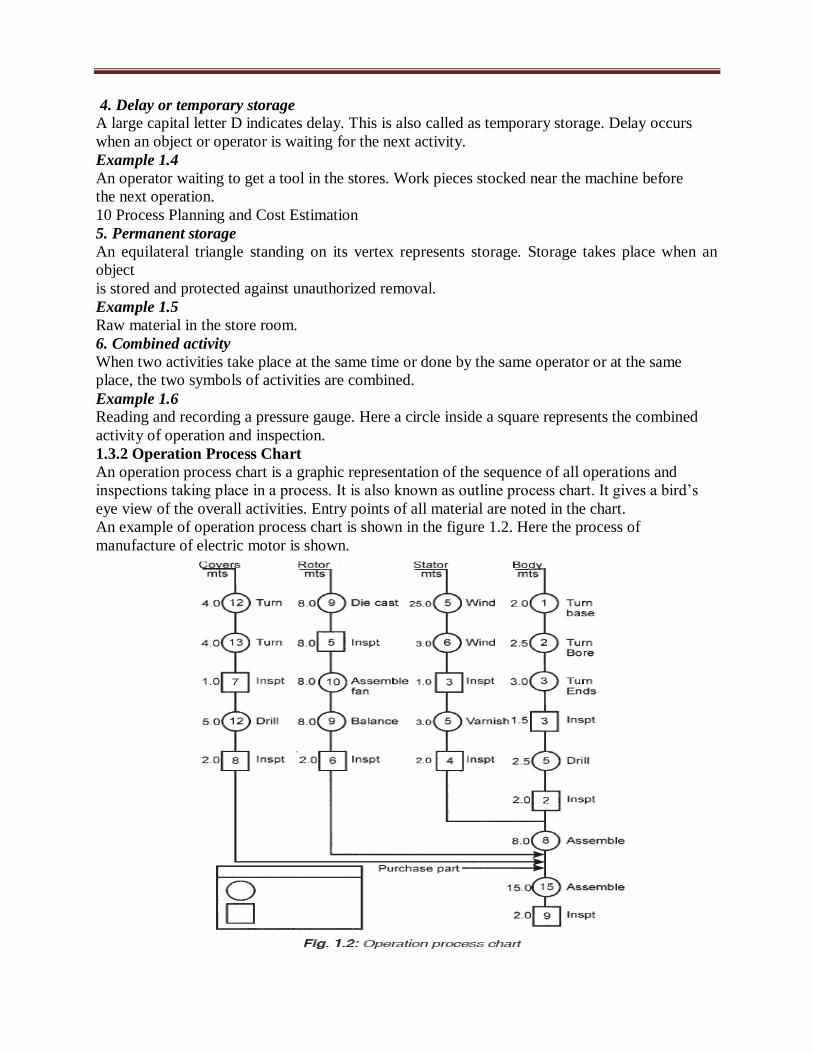
1.3.2 Operation Process Chart
An operation process chart is a graphic representation of the sequence of all operations and
inspections taking place in a process. It is also known as outline process chart. It gives a bird‘s
eye view of the overall activities. Entry points of all material are noted in the chart.
An example of operation process chart is shown in the figure 1.2. Here the process of
manufacture of electric motor is shown.

The conventions followed in preparing the chart are
1. Write title at the top of the chart.
2. Begin the chart from the right hand side top corner.
3. Represent the main component at the right extreme.
4. Represent the sequence of operations and inspections by their symbols. Connect them
by
vertical flow lines.
5. Record the brief description of the activity to the right side of the symbols.
6. Note down the time for each activity to the left of the symbol.
7. Number all operations in one serial order. Start from the right hand top (from number
1).
8. Similarly number all inspections in another serial order (starting from 1).
9. Continue numbering, till the entry of the second component.
10. Show the entry of purchased parts by horizontal lines.
1.3.3 Flow Process Chart
A flow process chart is a graphical representation of the sequence of all the activities
(operation,
inspection, transport, delay and storage) taking place in a process. Process chart symbols are
used
here to represent the activities. There are three types of flow process charts. They are
1. Man type flow process chart
This flow process chart records what the worker does.
2. Material type flow process chart
This flow process chart records how the material is handled or treated.
3. Equipment type flow process chart
This flow process chart records how the equipment or machine is used.
Example 1.7
The activities of a stenographer in preparation of a letter are recorded in the operator type
flow process chart shown in figure 1.3.

The chart records the activities of the steno. Here, the manager calls the steno and
dictates a letter. The steno takes notes of the letter, types it, gets the signature of the manager and
sends it for dispatching. These activities are shown in the chart. This is operator type flow
process chart. Considering the message in the letter as material, we can prepare the material type
flow process chart.
General guidelines for making a flow process chart
1. The details must be obtained by direct observation—charts must not be based on
memory.
2. All the facts must be correctly recorded.
3. No assumptions should be made.
4. Make it easy for future reference.
5. All charts must have the following details:
(a) Name of the product, material or equipment that is observed.
(b) Starting point and ending point.
(c) The location where the activities take place.
(d) The chart reference number, sheet number and number of total sheets.
(e) Key to the symbols used must be stated.
1.3.4 Two-Handed Process Chart (or) Right Hand, Left Hand Chart
It is the process chart in which the activities of two hands of the operator are
recorded.
It shows whether the two hands of the operator are idle or moving in relation to
one another, in a timescale.
It is generally used for repetitive operations.
Operation: Represents the activities grasp, position, use, release etc. of a tool,
component or
material.
Transport: Represents the movement of the hand or limb to or from the work or a tool
or material.
Delay: Refers to the time when the hand or limb is idle.
Storage (Hold): The term ‗hold‘ is used here instead of storage. This refers to the time
when the
work is held by hand.
The activity ‗inspection‘ by hand is considered as an operation. Hence, the symbol for
inspection
is not used in this chart.
Two-handed process chart can be used for assembly, machining and clerical jobs.
General guidelines for preparing the chart
1. Provide all information about the job in the chart.
2. Study the operation cycle a few times before starting to record.
3. Record one hand at a time.
4. First record the activities of the hand which starts the work first.
5. Do not combine the different activities like operations, transport etc.
Example 1.8
Example of a two-handed process chart is shown in figure 1.4. Here the assembly of a nut
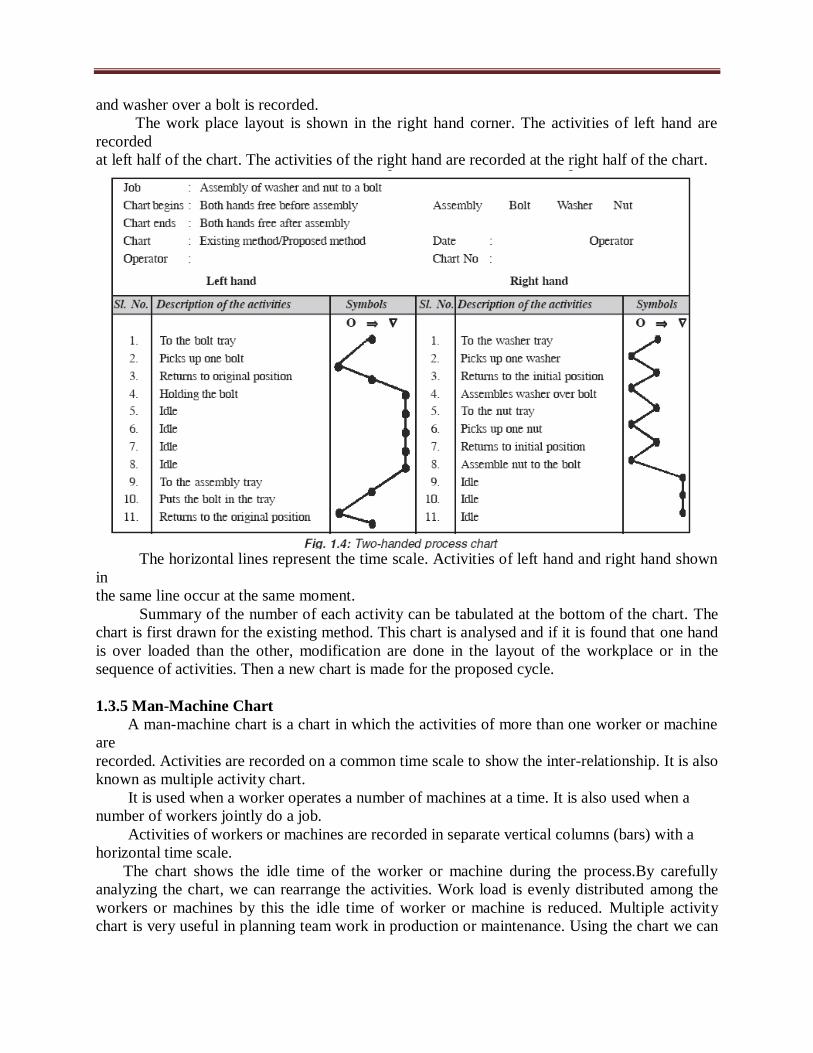
and washer over a bolt is recorded.
The work place layout is shown in the right hand corner. The activities of left hand are
recorded
at left half of the chart. The activities of the right hand are recorded at the right half of the chart.
The horizontal lines represent the time scale. Activities of left hand and right hand shown
in
the same line occur at the same moment.
Summary of the number of each activity can be tabulated at the bottom of the chart. The
chart is first drawn for the existing method. This chart is analysed and if it is found that one hand
is over loaded than the other, modification are done in the layout of the workplace or in the
sequence of activities. Then a new chart is made for the proposed cycle.
1.3.5 Man-Machine Chart
A man-machine chart is a chart in which the activities of more than one worker or machine
are
recorded. Activities are recorded on a common time scale to show the inter-relationship. It is also
known as multiple activity chart.
It is used when a worker operates a number of machines at a time. It is also used when a
number of workers jointly do a job.
Activities of workers or machines are recorded in separate vertical columns (bars) with a
horizontal time scale.
The chart shows the idle time of the worker or machine during the process.By carefully
analyzing the chart, we can rearrange the activities. Work load is evenly distributed among the
workers or machines by this the idle time of worker or machine is reduced. Multiple activity
chart is very useful in planning team work in production or maintenance. Using the chart we can
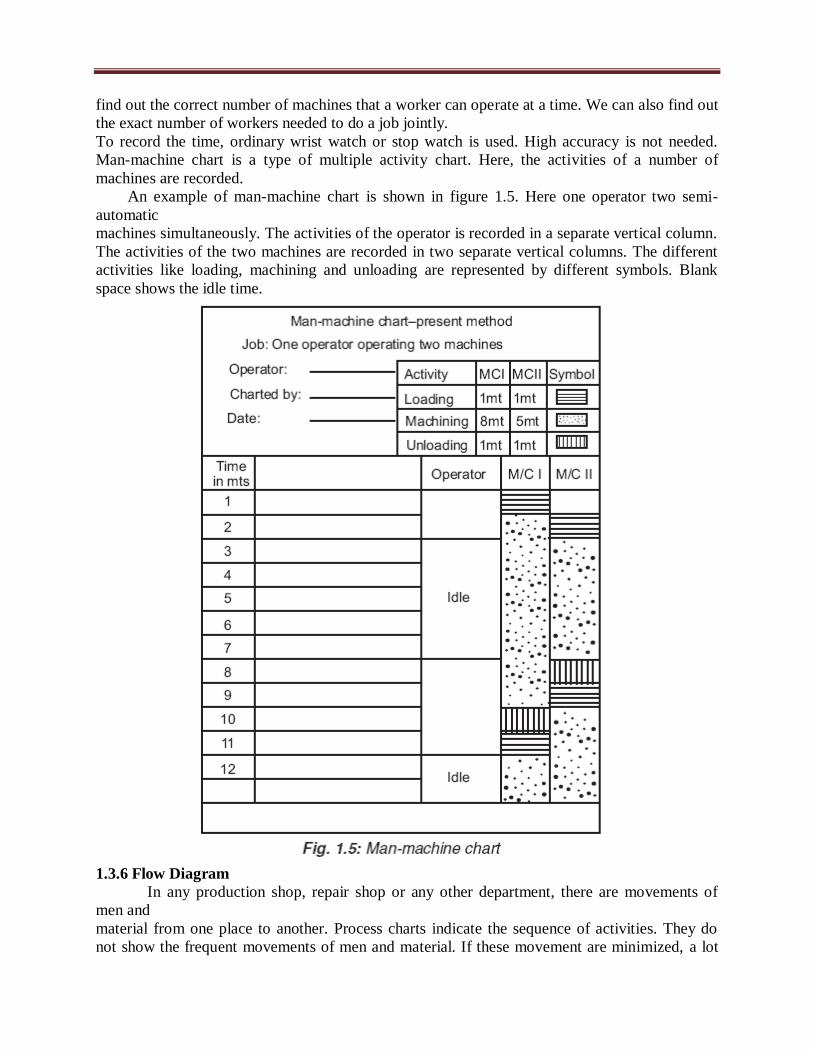
find out the correct number of machines that a worker can operate at a time. We can also find out
the exact number of workers needed to do a job jointly.
To record the time, ordinary wrist watch or stop watch is used. High accuracy is not needed.
Man-machine chart is a type of multiple activity chart. Here, the activities of a number of
machines are recorded.
An example of man-machine chart is shown in figure 1.5. Here one operator two semi-
automatic
machines simultaneously. The activities of the operator is recorded in a separate vertical column.
The activities of the two machines are recorded in two separate vertical columns. The different
activities like loading, machining and unloading are represented by different symbols. Blank
space shows the idle time.
1.3.6 Flow Diagram
In any production shop, repair shop or any other department, there are movements of
men and
material from one place to another. Process charts indicate the sequence of activities. They do
not show the frequent movements of men and material. If these movement are minimized, a lot
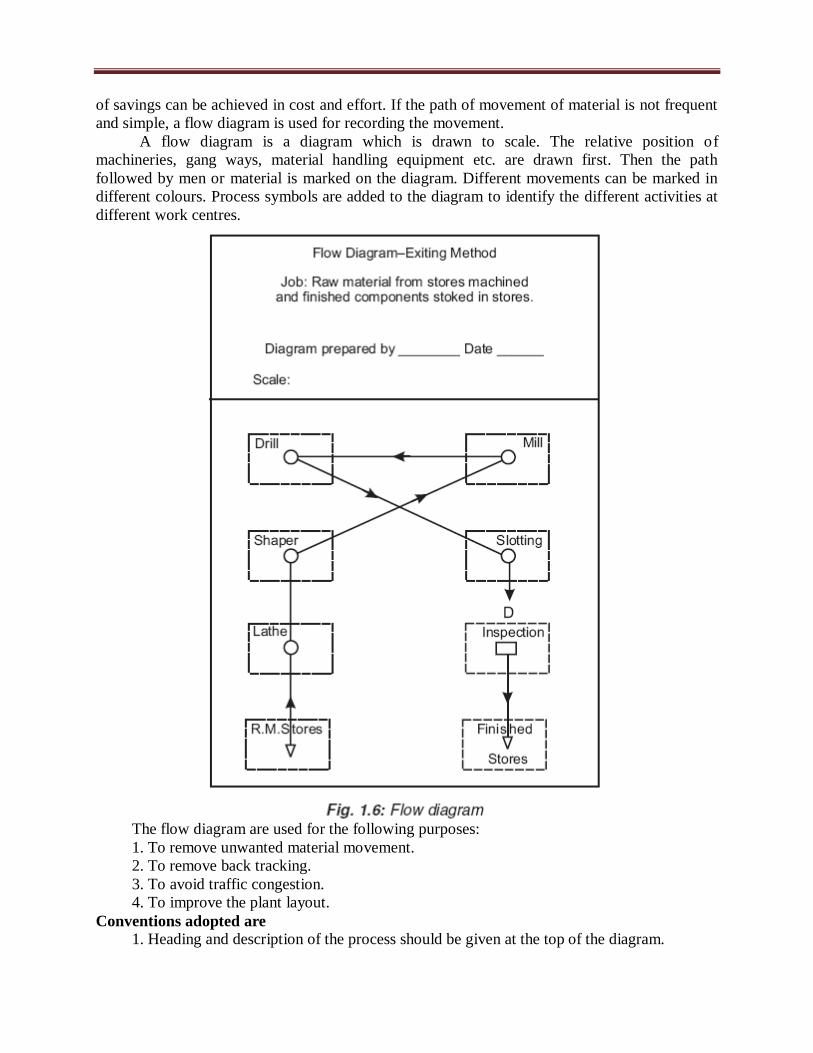
of savings can be achieved in cost and effort. If the path of movement of material is not frequent
and simple, a flow diagram is used for recording the movement.
A flow diagram is a diagram which is drawn to scale. The relative position of
machineries, gang ways, material handling equipment etc. are drawn first. Then the path
followed by men or material is marked on the diagram. Different movements can be marked in
different colours. Process symbols are added to the diagram to identify the different activities at
different work centres.
The flow diagram are used for the following purposes:
1. To remove unwanted material movement.
2. To remove back tracking.
3. To avoid traffic congestion.
4. To improve the plant layout.
Conventions adopted are
1. Heading and description of the process should be given at the top of the diagram.
2. Other informations like location, name of the shop, name of the person drawing the
diagram
are also given.
3. The path followed by the material is shown by a flow line.
4. Direction of movement is shown by small arrows along the flow lines.
5. The different activities are represented by the symbols on the flow lines. (Same symbols
used in flow process chart are used here).
6. If more than one product is to be shown in the diagram different colours are used for
each
path.
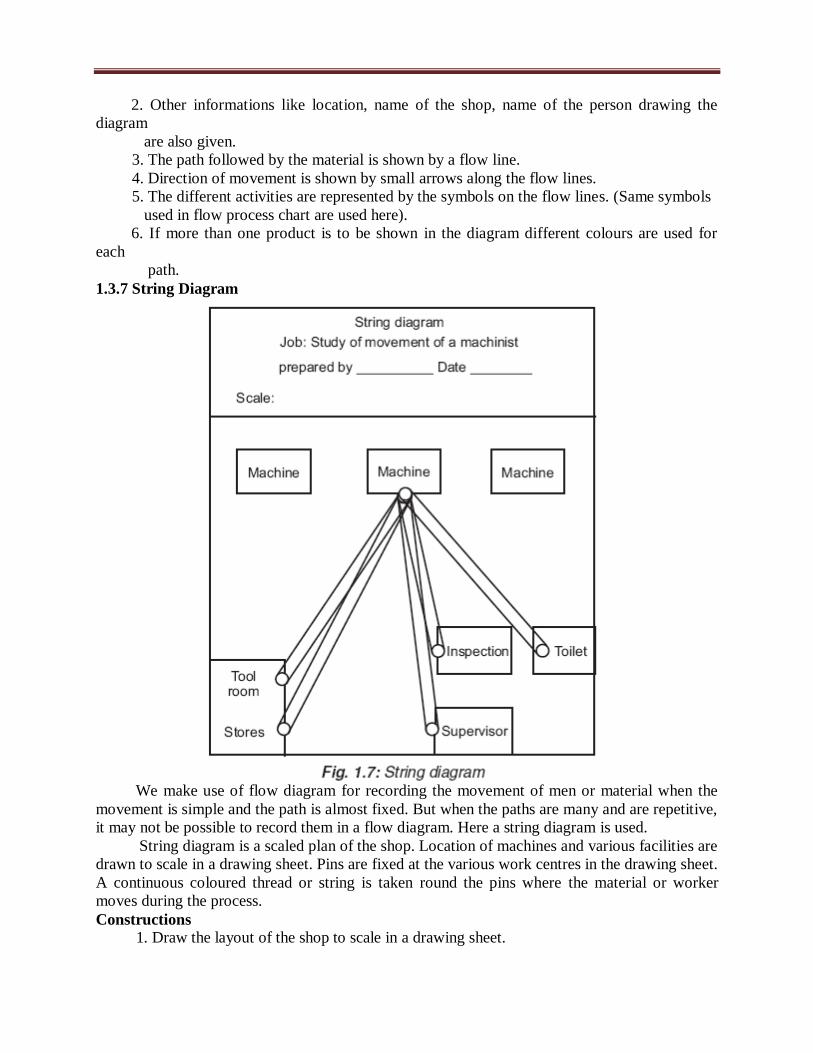
1.3.7 String Diagram
We make use of flow diagram for recording the movement of men or material when the
movement is simple and the path is almost fixed. But when the paths are many and are repetitive,
it may not be possible to record them in a flow diagram. Here a string diagram is used.
String diagram is a scaled plan of the shop. Location of machines and various facilities are
drawn to scale in a drawing sheet. Pins are fixed at the various work centres in the drawing sheet.
A continuous coloured thread or string is taken round the pins where the material or worker
moves during the process.
Constructions
1. Draw the layout of the shop to scale in a drawing sheet.

2. Mark the various work centres like machines, stores, work bench etc. in the diagram.
3. Hold the drawing sheet on a soft board and fix pins at the work centres.
4. Tie one end of a coloured string to the work centre from which the movement starts.
5. Follow the path of the worker to different work centre and accordingly take the thread to
different points on the drawing board.
6. At the end of the session note down the number of movements from one work centre to
another.
7. Remove the string and measure the total length of the string. Multiply by the scale and
get the actual distance of movement.
Applications
1. It is used for recording the complex movements of material or men.
2. Back tracking, congestion, bottlenecks, under utilized paths are easily found out.
3. It is used to check whether the work station is correctly located.
4. Used to record irregular movements.
5. Used to find out the most economical route.
1.4 WORK MEASUREMENT
Work measurement is a technique to establish the time required for a qualified worker to
carry out
a specified job at a defined level of performance.
Objectives of work measurement
1. To reduce or eliminate non-productive time.
2. To fix the standard time for doing a job.
3. To develop standard data for future reference.
4. To improve methods.
Uses of work measurements
1. To compare the efficiency of alternate methods. When two or more methods are available
for doing the same job, the time for each method is found out by work measurement. The
method which takes minimum time is selected.
2. Standard time is used as a basis for wage incentive schemes.
3. It helps for the estimation of cost. Knowing the time standards, it is possible to work out
the cost of the product. This helps to quote rates for tenders.
4. It helps to plan the workload of man and machine.
5. It helps to determine the requirement of men and machine. When we know the time to
produce one piece and also the quantity to be produced, it is easy to calculate the total
requirement of men and machines.
6. It helps in better production control. Time standards help accurate scheduling. So the
production control can be done efficiently.
7. It helps to control the cost of production. With the help of time standards, the cost of
production can be worked out. This cost is used as a basis for control.
8. It helps to fix the delivery date to the customer. By knowing the standard time we will be
able to calculate the time required for manufacturing the required quantity of products.
1.5 TECHNIQUES OF WORK MEASUREMENT
The different techniques used in work measurement are
1. Stop watch time study.
2. Production study.
3. Work sampling or Ratio delay study.

4. Synthesis from standard data.
5. Analytical estimating.
6. Predetermined motion time system.
1.5.1 Stop Watch Time Study
Stop watch time study is one of the techniques of work measurement commonly used.
Here we
make use of a stop watch for measuring the time.
Procedure for conducting stop watch time study
The following procedure is followed in conducting stop watch time study:
1. Selecting the job.
2. Recording the specifications.
3. Breaking operation into elements.
4. Examining each element.
5. Measuring using stop watch.
6. Assessing the rating factor.
7. Calculating the basic time.
8. Determining the allowances.
9. Compiling the standard time.
1. Selection of job
Time study is always done after method study. Under the following situations, a job is
selected for
time study:
1. A new job, new component or a new operation.
2. When new time standard is required.
3. To check the correctness of the existing time standard.
4. When the cost of operation is found to be high.
5. Before introducing an incentive scheme.
6. When two methods are to be compared.
2. Record
The following informations are recorded
1. About the product-name, product-number, specification.
2. About the machine, equipment and tools.
3. About the working condition-temperature-humidity-lighting etc. These informations are
used
when deciding about the allowances.
4. About the operator name-experience-age etc. This is needed for rating the operator.
3. Break down operation into elements
Each operation is divided into a number of elements. This is done for easy observation and
accurate
measurement. The elements are grouped as constant element, variable element, occasional
element, man element, machine element etc.
4. Examine each element
The elements are examined to find out whether they are effective or wasteful. Elements are
also examined whether they are done in the correct method.

5. Measure using a stop watch
The time taken for each element is measured using a stop watch. There are two methods
of measuring. viz., Fly back method and Cumulative method. Cumulative method is preferable.
The time measured from the stop watch is known as observed time. Time for various groups
of elements should be recorded separately. This measurement has to be done for a number of
times. The number of observations depend upon the type of operation, the accuracy required and
time for one cycle.
6. Assess the rating factor
Rating is the measure of efficiency of a worker. The operator‘s rating is found out by
comparing
his speed of work with standard performance. The rating of an operator is decided by the work
study man in consultation with the supervisor. The standard rating is taken as 100. If the operator
is found to be slow, his rating is less than 100 say 90. If the operator is above average, his rating
is more than 100, say 120.
7. Calculate the basic time
Basic time is calculated as follows by applying rating factor
8. Determine the allowance
A worker cannot work all the day continuously. He will require time for rest going for
toilet, drinking water etc. Unavoidable delays may occur because of tool breakage etc. So some
extra time is added to the basic time. The extra time is known as allowance.
9. Compile the standard time
The standard time is the sum of basic time and allowances. The standard time is also known
as allowed time.
1.5.1.1 Breaking a Job into Elements
It is necessary to break down a task (job) into elements for the following reasons:
1. To separate productive time and unproductive time.
2. To assess the rating of the worker more accurately.
3. To identify the different types of elements and to measure their timings separately.
4. To determine the fatigue allowance accurately.
5. To prepare a detailed work specification.
6. To fix standard time for repetitive elements (such as switch on or switch off of
machine).
Classification of elements
1. Repetitive elements
It is an element which occurs in every work cycle of the job.
Example 1.9
Loading the machine, locating a job in a fixture.
2. Constant element
It is an element for which the basic time remains constant whenever it is performed.
Example 1.10
Switching on the machine, switching off the machine.
3. Variable element
It is an element for which the basic time varies depending on the characteristics of
the product, equipment or process.
Example 1.11
Saving a log of wood-time changes with diameter or the work.
4. Occasional element
It is an element which does not occur in every work cycle of the job. It may occur
at regular or irregular intervals.
Example 1.12
Regrinding of tools, re-setting of tools.
5. Foreign element
It is an element which is not a part of the job.
Example 1.13
Cleaning a job that is to be machined.
6. Manual element
It is an element performed by the worker.
Example 1.14
Cleaning the machine, loading the machine.
7. Machine element
It is the element automatically performed by a power driven machine.
Example 1.15
Turning in a lathe using automatic feed.
General rules to be followed in breaking down a task into elements
1. Element should have a definite beginning and ending.
2. An element should be as short as possible so that it can be conveniently timed.
The shortest element that can be timed using a stop watch is 0.04 mt.
3. Manual elements and machine elements should be separately timed.
4. Constant element should be separated from variable elements.
5. Occasional and foreign elements should be timed separately.
1.5.1.2 Measuring Time with a Stop Watch
There are two methods of timing using a stop watch. They are
1. Fly back or Snap back method.
2. Continuous or Cumulative method.
1. Fly back method
Here the stop watch is started at the beginning of the first element. At the end of the
element the reading is noted in the study sheet (in the WR column). At the same time, the stop
watch hand is snapped back to zero. This is done by pressing down the knob, immediately the
knob is released. The hand starts moving from zero for timing the next element. In this way the
timing for each element is found out. This is called observed time (O.T.) .
2. Continuous method
Here the stop watch is started at the beginning of the first element. The watch runs
continuously

throughout the study. At the end of each element the watch readings are recorded on the study
sheet. The time for each element is calculated by successive subtraction. The final reading of the
stop watch gives the total time. This is the observed time (O.T.).
1.6 CALCULATION OF BASIC TIME
Basic time is the time taken by an operator of standard performance (rating of 100). A
man whose work is observed, may be a slow worker or a fast worker. His rating may be less than
100 or above 100. The observed time cannot be taken as the basic time. Here the rating factor is
applied and basic time is calculated as follows.
For example, assume that observed time for an operation is 0.7 mts. The rating of the
operator
is found to be 120.
1.7 ALLOWANCES
Various types of allowance are
1. Rest and personal allowance.
2. Process allowance.
3. Contingency allowance.
4. Special allowance.
5. Policy allowance.
1.8 CALCULATION OF STANDARD TIME
Standard time or allowed time is the total time in which a job should be completed at
standard
performance. It is the sum of normal time (basic time) and allowances. Policy allowance is not
included.
Standard time is worked out in a stop watch time study in the following manner.
Observed time
This is the actual time observed by using a stop watch. The observed time of an operation is
the
total of the elemental times.
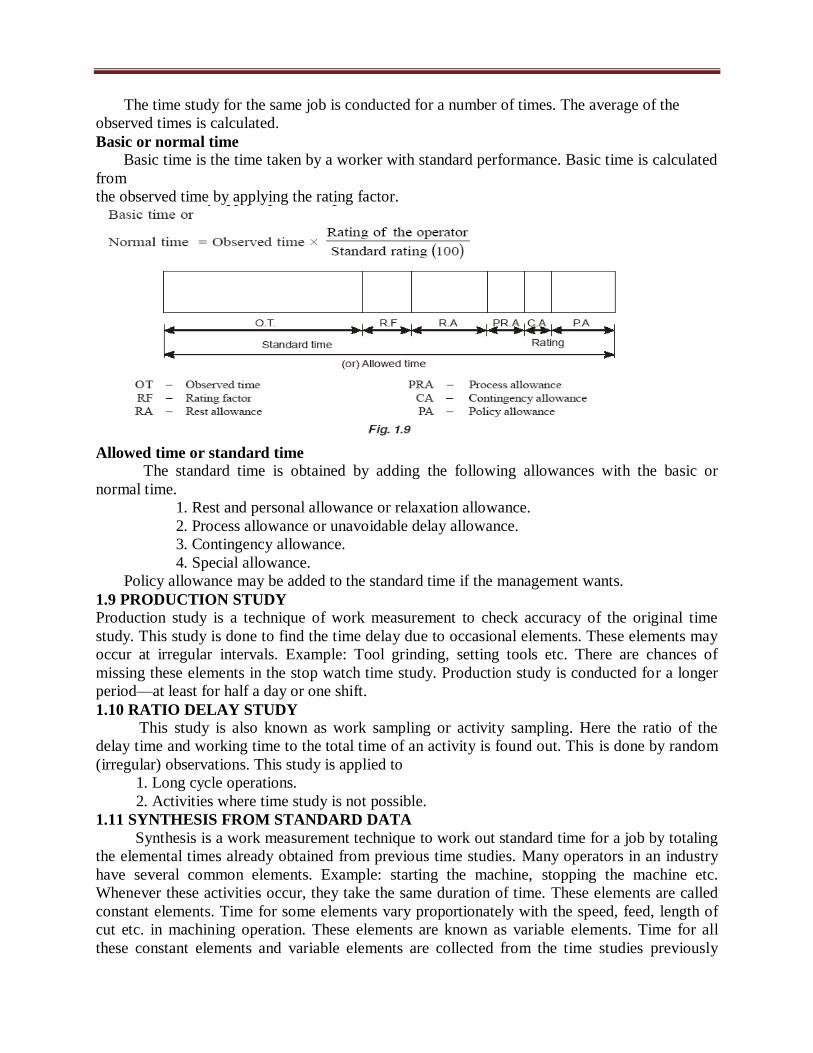
The time study for the same job is conducted for a number of times. The average of the
observed times is calculated.
Basic or normal time
Basic time is the time taken by a worker with standard performance. Basic time is calculated
from
the observed time by applying the rating factor.
Allowed time or standard time
The standard time is obtained by adding the following allowances with the basic or
normal time.
1. Rest and personal allowance or relaxation allowance.
2. Process allowance or unavoidable delay allowance.
3. Contingency allowance.
4. Special allowance.
Policy allowance may be added to the standard time if the management wants.
1.9 PRODUCTION STUDY
Production study is a technique of work measurement to check accuracy of the original time
study. This study is done to find the time delay due to occasional elements. These elements may
occur at irregular intervals. Example: Tool grinding, setting tools etc. There are chances of
missing these elements in the stop watch time study. Production study is conducted for a longer
period—at least for half a day or one shift.
1.10 RATIO DELAY STUDY
This study is also known as work sampling or activity sampling. Here the ratio of the
delay time and working time to the total time of an activity is found out. This is done by random
(irregular) observations. This study is applied to
1. Long cycle operations.
2. Activities where time study is not possible.
1.11 SYNTHESIS FROM STANDARD DATA
Synthesis is a work measurement technique to work out standard time for a job by totaling
the elemental times already obtained from previous time studies. Many operators in an industry
have several common elements. Example: starting the machine, stopping the machine etc.
Whenever these activities occur, they take the same duration of time. These elements are called
constant elements. Time for some elements vary proportionately with the speed, feed, length of
cut etc. in machining operation. These elements are known as variable elements. Time for all
these constant elements and variable elements are collected from the time studies previously

made. These are stored in a file. This is called time standard data bank. Data bank contains data
in the form of
1. Tabulated standard time for constant elements.
2. Charts and graphs.
3. Formulae etc.
1.12 ANALYTICAL ESTIMATING
Setting the time standards for long and non-repetitive operations by stop watch method
are uneconomical. Analytical estimating technique determines the time values for such jobs
either by using the synthetic data or on the basic of the past experience of the estimator when no
synthetic or standard data is available. In order to produce accurate results the estimator must
have sufficient experience of estimating, motion study, time study and the use of synthesized
time standards.
1.13 PREDETERMINED MOTION TIME SYSTEM (PMTS)
Definition: PMTS is a work measurement technique where by times, established for basic
human motions (classified according to the nature of the motion and the conditions under which
it is made) are used to build up the time for a job at a defined level of performance. Few well-
known systems using this concept are
1. M.T.M. : Method Time Measurement.
2. W.F.S. : Work Factor System.
3. M.T.A. : Motion Time Analysis.
4. D.M.T. : Dimensional Motion Times.
5. B.M.T. : Basic Motion Times.
1.14 ERGONOMICS
Ergons means ‗work‘ and Nomos means ‗Natural laws‘. Ergonomics or its American
equivalent ‗Human Engineering may be defined as the scientific study of the relationship
between man and his working environments. Ergonomics implies ‗Fitting the job to the worker‘.
Ergonomics combines the knowledge of a psychologist, physiologist, anatomist, engineer,
anthropologist and a biometrician.
1.14.1 Objectives
The objectives of the study of ergonomics is to optimize the integration of man and
machine in
order to increase work rate and accuracy. It involves
1. The design of a work place befitting the needs and requirements of the worker.
2. The design of equipment, machinery and controls in such a manner so as to minimize
mental
and physical strain on the worker thereby increasing the efficiency, and
3. The design of a conductive environment for executing the task most effectively.
Both work study and Ergonomics are complementary and try to fit the job to the workers;
however Ergonomics adequately takes care of factors governing physical and mental strains.
1.14.2 Applications
In practice, ergonomics has been applied to a number of areas as discussed below
1. Working environments 2. The work place, and 3. Other areas.
1. Working environments

(a) The environment aspect includes considerations regarding light, climatic conditions
(i.e.,
temperature, humidity and fresh air circulation), noise, bad odour, smokes, fumes, etc., which
affect the health and efficiency of a worker.
(b) Day light should be reinforced with artificial lights, depending upon the nature of work.
(c) The environment should be well-ventilated and comfortable.
(d) Dust and fume collectors should preferably be attached with the equipments giving rise
to
them.
(e) Glares and reflections coming from glazed and polished surfaces should be avoided.
(f) For better perception, different parts or sub-systems of equipment should be coloured
suitably. Colours also add to the sense of pleasure.
(g) Excessive contrast, owing of colour or badly located windows, etc., should be eluded.
(h) Noise, no doubt distracts the attention (thoughts, mind) but if it is slow and continuous,
workers become habituated to it. When the noise is high pitched, intermittent or sudden, it
is more dangerous and needs to be dampened by isolating the place of noise and through
the use of sound absorbing materials.
2. Work place layout
Design considerations
(a) Materials and tools should be available at their predetermined places and close to the
worker.
(b) Tools and materials should preferably be located in the order in which they will be
used.
(c) The supply of materials or parts, if similar work is to be done by each hand, should be
duplicated. That is materials or parts to be assembled by right hand should be kept on right
hand side and those to be assembled by the left hand should be kept on left hand side.
(d) Gravity should be employed, wherever possible, to make raw materials reach the
operator
and to deliver material at its destination (e.g., dropping material through a chute).
(e) Height of the chair and work bench should be arranged in a way that permits
comfortable
work posture. To ensure this
• Height of the chair should be such that top of the work table is about 50 mm below
the
elbow level of the operator.
• Height of the table should be such that worker can work in both standing and
sitting
positions.
• Flat foot rests should be provided for sitting workers.
• Figure 1.12 shows the situation with respect to bench heights and seat heights.
• The height and back of the chair should be adjustable.
• Display panel should be at right angles to the line or sight of the operator.
(f) An instrument with a pointer should be employed for check readings where as for
quantitative readings, digital type of instrument should be preferred.
(g) Hand tools should be possible to be picked up with least disturbance or rhythm and
symmetry

of movements.
(h) Foot pedals should be used, wherever possible, for clamping declamping and for
disposal
of finished work.
(i) Handles, levers and foot pedals should be possible to be operated without changing
body
position.
(j) Work place must be properly illuminated and should be free from glare to avoid eye
strain.
(k) Work place should be free from the presence of disagreeable elements like heat,
smoke,
dust, noise, excess humidity, vibrations etc.
Suggested work place layout
Figure 1.13 shows a work place layout with different areas and typical dimensions. It
shows the
left hand covering the maximum working area and the right hand covering the normal working
area.
Normal working area
It is within the easy reach of the operator.

Maximum working area
It is accessible with full arm stretch. Figure 1.14 shows work place layout for assembling
small component parts. A-1 is the actual working area and the place of assembly (POA) where
four component parts
P-1, P-2, P-3, and P-4 are assembled together. Bins containing P-1, P-2, P-3, and P-4 and
commonly
employed tools (CET) (like screw driver, plier, etc.) lie in the normal working area A-2.
ORT
Occasionally required Tools (ORT) (hammers etc.) lie in the maximum working area A-
3. After
the assembly has been made at POA, it is dropped into the cut portion in the work table – PDA
(Place for dropping assemblies) from where the assembly is delivered at its destination with the
help of a conveyer. This work place arrangement satisfies most of the principles of motion
economy.
3. Other areas
Other areas include studies related to fatigue, losses caused due to fatigue, rest pauses,
amount of
energy consumed, shift work and age considerations.

FMCET
UNIT 2
PROCESS PLANNING
PROCESS PLANNING
Process planning is a detailed specification which lists the operation, tools, and facilities Usually accomplished in manufacturing department Also known as operations planning Systematic determination of the engineering processes and systems to manufacture a product
competitively and economically
DEFINITION
Process planning can be defined as an act of preparing a detailed processing documentation for
the manufacture of a piece part or assembly
APPROACHES TO PROCESS PLANNING
1. Manual Process planning 2. Computer Aided Process planning (CAPP)
a. Retrieval CAPP system b. Generative CAPP system
MANUAL PROCESS PLANNING
Manually prepared Task involves examining and interrupting engineering drawings, making decisions on machining
process selection, equipment selection, operation sequence, and shop practices Dependent on judgment and experience of process planner
Advantages
Very much suitable for small scale companies Highly flexible Low investment costs
Disadvantages
Very complex Time consuming Requires large amount of data Requires skilled process planner More possibilities for human error Increases paper work Inconsistent process plans results in reduced productivity
COMPUTER AIDED PROCESS PLANNING (CAPP)
To overcome drawbacks of manual process planning Computer Aided Process planning (CAPP) is used
Provides interface between CAD and CAM
Benefits
Process rationalization and standardization Productivity improvement Product cost reduction Elimination of human error Reduction in time Reduced clerical effort and paper work Improved legibility Faster response to engineering changes Incorporation of other application programs
RETRIEVAL CAPP SYSTEM
It is also called as variant CAPP, widely used in machining applications Basic idea behind is, similar parts will have similar process plans Process plan for new part is created by recalling, identifying and retrieving an existing plan for a
similar part, and making necessary modification for new part
PROCEDURE FOR RETRIEVAL CAPP SYSTEM
Retrieval CAPP system is based on principles of group technology (GT) and part classification and coding
For each part family, standard process plan is prepared and stored in computer files Through classification and coding, code number is generated

Standard plan is retrieved and edited for new part
Advantages
Once a standard plan has been written, variety of parts can be planned Requires simple programming and installation Understandable, and planner has control of final plan Easy to learn and easy to use
Disadvantages
Components to be planned are limited to similar components previously planned Requires experienced process planners to modify the standard plan for specific component
New part design
Preparatory storage
Derive GT code number
for part
Search part family file for
GT code number Part family file
Select coding system and
form part families

General procedure for using Retrieval CAPP systems
GENERATIVE CAPP SYSTEM
In this approach computer is used to synthesize or generate each individual process plan automatically without reference to any prior plan
Generates the process plan based on decision logics and pre-coded algorithms. Computer stores the rules of manufacturing and equipment capabilities
Retrieve standard
process plan
Edit existing plan or
write new plan
Process plan formatter
Process plan
(Route sheet)
Standard Process plan
file
Other applications such
as cost estimating and
work standards
Prepare standard
process plans for part
families

Specific process plan for specific part can be generated without any involvement of process planner
Components of Generative CAPP system
Part descriptor Subsystem to identify machine parameters Subsystem to select and sequence individual operations Database Report generator
Advantages
Generate consistent process plan rapidly New components can be planned as easily as existing components It has potential for integrating with automated manufacturing facility to provide detailed control
information
Drawbacks
Complex and very difficult to develop
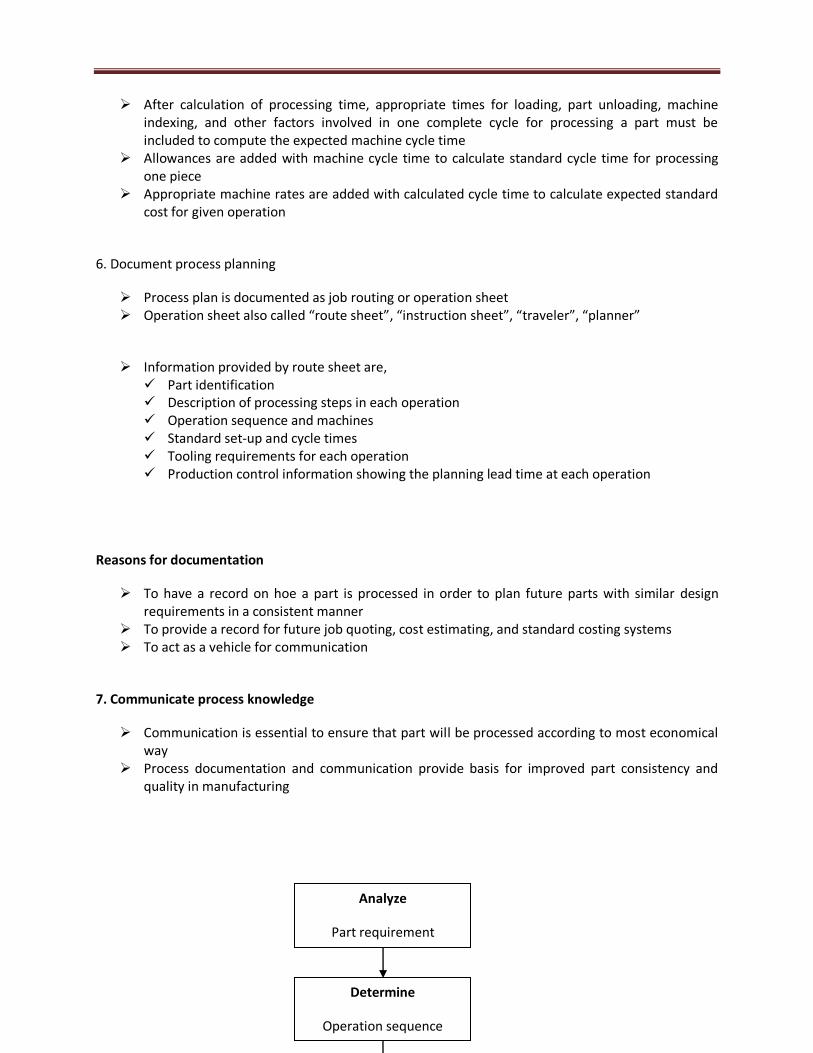
PROCESS PLANNING ACTIVITIES
1. Specific activities involved in Process planning are 2. Analysis of the finished part requirements as specified in the engineering design 3. Determining the sequence of operation required 4. Selecting the proper equipment to accomplish the required operations 5. Calculating the specific operation setup times and cycle times on each machine 6. Documenting the established process plans 7. Communicating the manufacturing knowledge to the shop floor
1. Analyze finished part requirements
Component drawing should be analyzed to identify its features, dimensions, and tolerance specifications
Part’s requirement defined by its features, dimensions, and tolerance specifications will determine corresponding processing requirements
2. Determine operating sequence
Basic aim is to determine the type of processing operation that has the capability to generate various types of features, given the tolerance requirements

There are two ways of viewing decision process First view is to consider processing evaluation of part from rough state to finished final
state. In this view material is removed or modified on rough part in stages in order to transform it into finished part
Second view is to consider part evaluation from finished state back to rough/ initial state. In this view material is added back onto the part.
3. Select machines
Machine selection requires determining how the part would be processed on each of the alternative machines so that best machine can be selected
At this phase, firm has to decide whether to make or buy the component part Break even analysis is most convenient method for selecting optimum method of manufacture
or machine amongst the competing ones
Factures which influence the selection of machine are, Economic considerations Production rate and unit cost of production Durability and dependability Lower process rejection Minimum set-up and put away times Longer productive life of machines or equipment Functional versatility
4. Material selection parameters
Function Appearance Reliability Service life Environment Compatibility Productivity Cost
5. Calculate processing time
Determination of set-up times requires knowledge of available tooling and sequence of steps necessary to prepare the machine for processing given work piece
For establishing accurate set-up times, detailed knowledge of equipment capacity, tooling, and shop practice required
Calculation of part processing time requires determination of sequence of processing steps on each machine. This is called as OUTPLANNING
After calculation of processing time, appropriate times for loading, part unloading, machine indexing, and other factors involved in one complete cycle for processing a part must be included to compute the expected machine cycle time
Allowances are added with machine cycle time to calculate standard cycle time for processing one piece
Appropriate machine rates are added with calculated cycle time to calculate expected standard cost for given operation
6. Document process planning
Process plan is documented as job routing or operation sheet Operation sheet also called “route sheet”, “instruction sheet”, “traveler”, “planner”
Information provided by route sheet are, Part identification Description of processing steps in each operation Operation sequence and machines Standard set-up and cycle times Tooling requirements for each operation Production control information showing the planning lead time at each operation
Reasons for documentation
To have a record on hoe a part is processed in order to plan future parts with similar design requirements in a consistent manner
To provide a record for future job quoting, cost estimating, and standard costing systems To act as a vehicle for communication
7. Communicate process knowledge
Communication is essential to ensure that part will be processed according to most economical way
Process documentation and communication provide basis for improved part consistency and quality in manufacturing
Determine
Operation sequence
Analyze
Part requirement


Process planning activities
DEVELOPING MANUFACTURING LOGIC AND KNOWLEDGE
To support process planning system, the acquisition and documentation of manufacturing knowledge is very essential
Knowledge structure should be determined prior to any type of program coding or data presentation
Knowledge structure will help to ensure error reduction, debugging case, clarity, and future modification
Production engineers need a tool to develop Knowledge structure format that can be used in an interactive process and will emphasis what questions to ask and what data to collect to support standardized format
Commonly used tools are, 1. Flow charts 2. Decision tables 3. Expert system shells
1. FLOW CHARTS
Most commonly used tool for collection and display of manufacturing knowledge
Condition
1
Condition
2
Condition
3
Action 1
Yes
No
Yes

Flow chart format
Disadvantages of flow charts
It focus on process rather than on the structure decision logic Provides no check against incompleteness, and redundancy
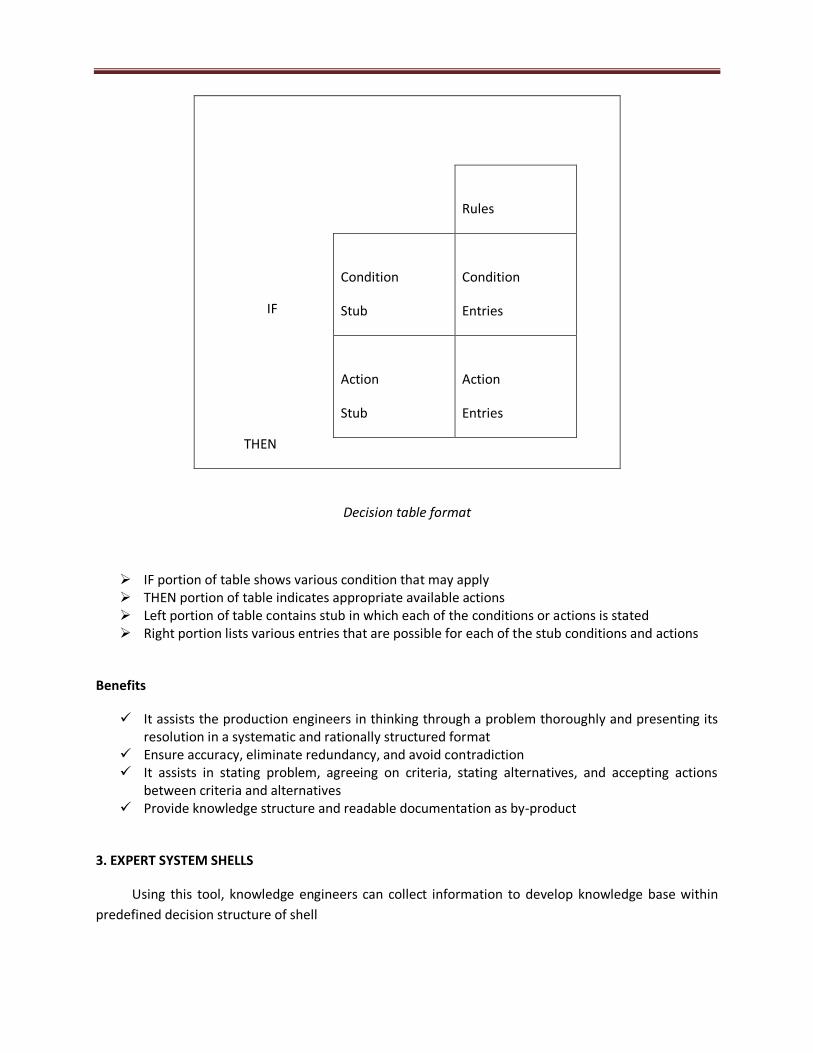
2. DECISION TABLE
It is a system / logic tool to bring together, analyze, and display complex decision logic in such a
way that its meaning can be easily grasped
Condition
4
Condition
5
Action 2
Action 4 Action 3
Yes
Yes
Yes
No
No
No
No
IF
THEN
Rules
Condition
Stub
Condition
Entries
Action
Stub
Action
Entries
Decision table format
IF portion of table shows various condition that may apply THEN portion of table indicates appropriate available actions Left portion of table contains stub in which each of the conditions or actions is stated Right portion lists various entries that are possible for each of the stub conditions and actions
Benefits
It assists the production engineers in thinking through a problem thoroughly and presenting its resolution in a systematic and rationally structured format
Ensure accuracy, eliminate redundancy, and avoid contradiction It assists in stating problem, agreeing on criteria, stating alternatives, and accepting actions
between criteria and alternatives Provide knowledge structure and readable documentation as by-product
3. EXPERT SYSTEM SHELLS
Using this tool, knowledge engineers can collect information to develop knowledge base within
predefined decision structure of shell

Knowledge engineer
Knowledge base
If/then rules
Interference Engine
Forward or backward
Report generator
Conclusions
Inference explanation
Answers
Expert
Queries

Expert system shells format
Expert system shells format is similar to decision table format Like decision table format, knowledge base is formatted in structures of “if this condition then
this action”, or “if this condition then this action, or else this action”
SELECTION OF PROCESS PLANNING SYSTEM
Factors to be considered while selecting best process planning system are,
Environment in which process planning is conducted Organizational structure of company Technical expertise available to the company Needs and objective of company regarding generation of manufacturing information and
process plans
2 MARKS
1. Define Process planning
Process planning can be defined as an act of preparing a detailed processing documentation for
the manufacture of a piece part or assembly.
User

2. Brief about scope of Process planning
Process rationalization and standardization Faster response to engineering changes Standard plans leads to achieve six sigma level
3. What are the documents used in Process planning?
Process sheet Operation sheet Route sheet
4. What are the factors affect process planning?
Volume of production The skill and experience of manpower Delivery dates for parts or products Material specifications Accuracy and process capability of machines Accuracy requirements of parts or products
5. What are the reasons for process documentation?
To have a record on hoe a part is processed in order to plan future parts with similar design requirements in a consistent manner
To provide a record for future job quoting, cost estimating, and standard costing systems To act as a vehicle for communication
6. State the general approaches to process planning?
1. Manual Process planning
2. Computer Aided Process planning (CAPP)
a. Retrieval CAPP system
b. Generative CAPP system

8. State the benefits of decision table?
It assists the production engineers in thinking through a problem thoroughly and presenting its resolution in a systematic and rationally structured format
Ensure accuracy, eliminate redundancy, and avoid contradiction It assists in stating problem, agreeing on criteria, stating alternatives, and accepting actions
between criteria and alternatives Provide knowledge structure and readable documentation as by-product
9. List Material selection parameters
Function Appearance Reliability Service life Environment Compatibility Productivity Cost
10. State the process planning activities
1. Specific activities involved in Process planning are 2. Analysis of the finished part requirements as specified in the engineering design 3. Determining the sequence of operation required 4. Selecting the proper equipment to accomplish the required operations 5. Calculating the specific operation setup times and cycle times on each machine 6. Documenting the established process plans 7. Communicating the manufacturing knowledge to the shop floor
7. What are the tools usedfor acquiring anddocumentingknowledge?
1. Flow charts

UNIT 3
INTRODUCTION TO COST ESTIMATION
3.0 INTRODUCTION
Cost estimation may be defined as the process of forecasting the expenses that must be
incurred to manufacture a product.
These expenses take into consideration all expenditures involved in design and
manufacturing with all the related service facilities such as pattern making, tool making as well
as portion of the general administrative and selling costs. Cost estimates are the joint product of
the engineer and the cost accountant.
Estimating is the calculation of the costs which are expected to be incurred in
manufacturing a component in advance before the component is actually manufactured.
Costing may be defined as a system of accounts which systematically and accurately
records every expenditure in order to determine the cost of a product after knowing the different
expenses incurred in various department.
3.1 REASONS FOR DOING ESTIMATES
Cost estimates are developed for a variety of different reasons. The most important reasons
are shown below.
Should the product be produced? When a company designs a new product, a detailed
estimate of cost is developed to assist management in making an intelligent decision about
producing the product.
This detailed estimate of cost includes an estimate of material cost, labour cost, purchased
components and assembly cost. In addition to product cost, many other elements must be
estimated. These include all tooling costs.
A cost estimate must be developed for jigs, fixtures, tools, dies and gauges. Also, the cost
of any capital equipment must be entered into the estimate. These figures are usually supplied
through quotation by vendors.
An estimate of this nature will include a vast amount of details, because if management
approves the project, the estimate now becomes the budget.
Estimates as temporary work standards. Many companies that produce product in high
volume, such as automotive companies, will use estimates on the shop floor as temporary work
standards.
Temporary work standards are replaced with time studied work standards as rapidly as
possible.
3.1.1 Importance of Estimating
Estimating is of great importance to a concern because it enables the factory owner to
decide about the manufacturing and selling policies.
It is obvious that too high estimates will not get jobs to the firm by quoting higher rates
according to over estimate whereas under estimating will put the owner to a loss and will lead
the concern to utter failure.
So, estimation should be carried out accurately. The persons preparing estimates should be
highly qualified and experienced. They should be chosen from shops or should be first trained in
all the shop methods and their estimates preparation.
3.2 OBJECTIVES OR PURPOSE OF ESTIMATING
The main purpose or objective of estimating are
(i) To establish the selling price of a product.
(ii) To ascertain whether a proposed product can be manufactured and marketed
profitably.
(iii) To determine how much must be invested in equipment.
(iv) To find whether parts or assemblies can be more cheaply fabricated or purchased
from
outside (make or buy decision).
(v) To determine the most economical process, tooling or material for making a product.
(vi) To establish a standard of performance at the start of project.
(vii) For feasibility studies on possible new products.
(viii) To assist in long term financial planning.
(ix) To prepare production budget.
(x) To help in responding to tender enquiries.
(xi) To evaluate alternate designs of a product.
(xii) To set a standard estimate of costs.
(xiii) To initiate programs of cost reduction that result in economics due to the use of new
materials, which produce lower scrap losses and which create savings due to revisions
in methods of tooling and processing, and
(xiv) To control actual operating costs by incorporating these estimates into the general
plan
of cost accounting.
3.3 FUNCTIONS OF ESTIMATING
(i) To calculate the cost of new material needed to manufacture a product.
(ii) To find the cost of parts to be purchased from outside vendors.
(iii) To find the cost of equipment, machinery, tools, jigs and fixtures etc. required to be
purchased to make the product.
(iv) To calculate the direct and indirect labour cost associated with the manufacture of the
product, based upon work study.
(v) To calculate various overhead charges associated with the product.
(vi) To decide about the profit to be charged, taking into consideration other manufacturers
of same product in the market.
(vii) To calculate the selling price of the product.
(viii) To maintain records of previous estimating activities of the company for future
references.
(ix) To decide the most economical method of making the product.
(x) To submit cost estimates with the competent authority for further action.
3.4 COST ACCOUNTING OF COSTING
It is the determination of an actual cost of a component after adding different expenses
incurred invarious departments or it may be defined as a system which systematically records all
the expenditures to determine the cost of manufactured products.

The work of cost accountings begins with the pre-planning stage of the product. It ends
only after the whole lot of the product has been fully manufactured. Costing progresses with the
progress of the product through the plant.
3.5 IMPORTANCE OF COSTING
Costing is an essential work for the efficient management of any enterprise and gives most
useful information for the preparation of financial accounts.
It enables a business not only to find out what various jobs or processes have costed but
also what they should have costed.
It indicates where losses are wastage are occurring before the work is finished, so that
immediate action may be taken to avoid such loss or waste. Also all expenditure are localized
and thereby controlled in the light of information provided by the cost records.
Costing shows which type of output will yield a profit and which type does not. Thus, it
makes up the deficiency.
A planned system of cost accounting will point out the weak spots and thus enable the
administration to have a clear picture and show up immediately the essential facts in such a way
that the responsible persons can put forth their efforts to bring improvements and reduce
costs.
Costing has proved so beneficial that nowadays almost every concern has adopted the cost
accounting system.
3.6 AIMS OF COST ACCOUNTING
The purpose of costing are:
1. To compare the actual cost with the estimated cost to know whether the estimate had
been realistic or not.
2. Wastages and undesirable expenses are pointed out requiring corrective measures.
3. The costing data helps in changing the selling price because of change in material cost of
labour cost etc.
4. It helps to locate the reasons for the increase or decrease of loss of profits of a company.
5. It helps in determining the discount on catalogue or market price of the product.
6. The actual cost helps the company to decide whether to continue with the manufacture of
a product or to buy it from outside.
7. It helps the enterprise to prepare its budget.
8. The costing data helps to formulate policies and plans for the pricing of a new job.
9. It helps in regulating from time to time the production of a job so that it may be profitable
to the company.
3.7 METHODS OF COSTING (a) Process costing.
(b) Job costing.
(c) Batch costing. (d) Hybrid costing systems.
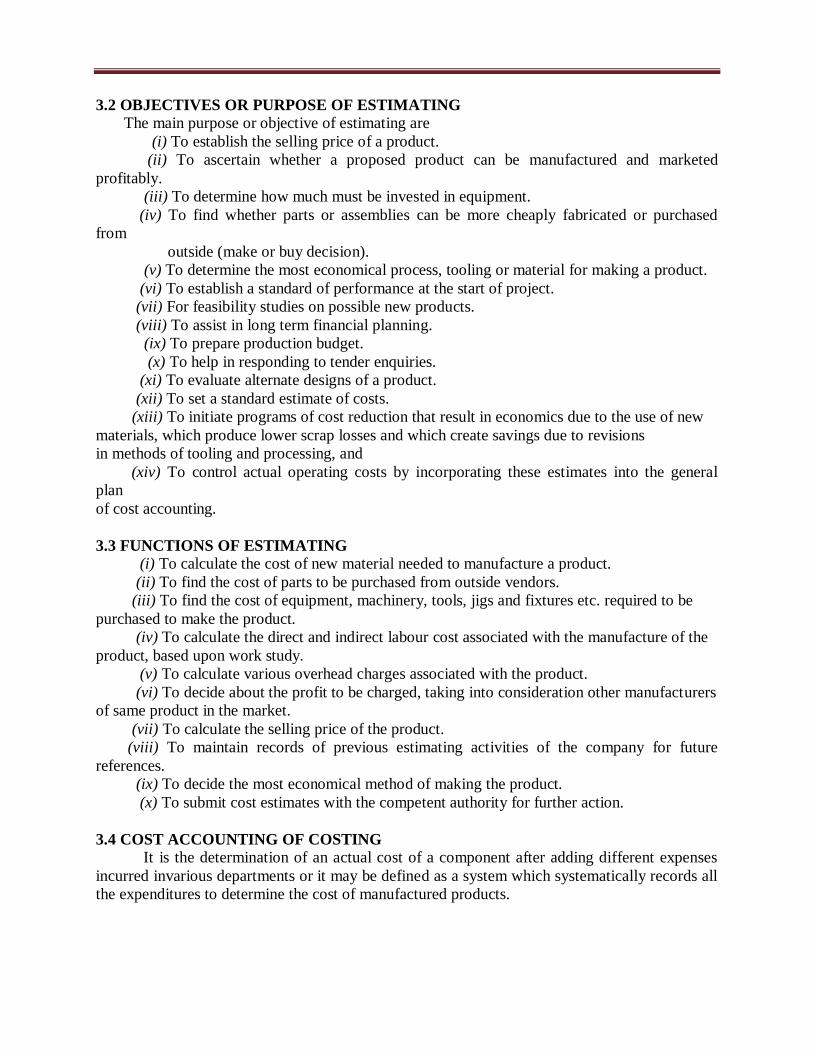
(a) Process costing
• This method is employed when a standard product is being made which involves a number
of distinct processes performed in a definite sequence. Introduction to Cost Estimation 83
• In oil refining, chemical manufacture, paper making, flour milling, and cement manufacturingetc., this method is used.
• The object i.e., record and trace cots for each distinct stage.
• While costing, the by-products of each process should be considered. • This method indicates the cost of a product at different stages as it passes through various
processes.
• The total time spent and materials used on each process, as well as services such as power,
light and heating are all charged. For this purpose cost sheet may be employed. The process cost sheet is a summary of all operations for the month. The current operating
charges are entered on the sheet showing
1. The transfer cost from the previous operation. 2. The costs incurred by each operation showing materials, labour and overhead in separate
columns.
This separation of transfer cost and conversion cost is extremely important for the charges incurred by a department are its measures of efficiency.
The sheet can be used as a basis for:
1. Closing entries at the end of each month.
2. Operating statements, without need to lookup the ledger accounts. Within the cost ledger an account is kept for each process. The direct material, direct labour and
factory overhead costs are transferred from the process cost sheet. There are debited to the process
account, and then any completed units are credited to cover the transfer to the next process. The balance on the account represents the work-in-progress at the end of the period, which, of
course, becomes the opening balance for the next period.
(b) Job costing or order costing • Job costing is concerned with finding the cost of each individual job or contract. Examples
are to be found in general (job order) engineering industries, ship building, building contracts,
etc.
• The main features of the system is that each job has to be planned and costed separately. • Overhead costs may be absorbed on jobs on the basis of actual costs incurred or on
predetermined costs.
• The process of determining in advance what a job or order will cost is known as estimating. It involves consideration of the following factors for each job/order:
1. Materials requirements and prices to arrive at the direct material cost.
2. Labour hours and rates to determine labour costs.
3. Overhead costs. 4. Percentage added to total cost to cover profit.
A record of above costs per unit time is kept in separate cost sheets.
(c) Batch costing • Batch costing is a form of job costing. Instead of costing each component separately, each
batch of components are taken together and treated as a job. Thus, for example, if 100
units of a component, say a reflector are to be manufactured, then the costing would be as far a single job. The unit price would be ascertained by dividing the cost by 100. 84 Process Planning and Cost Estimation
• Besides maintaining job cost sheets it may also be necessary to keep summary sheets on
which the cost of each component can be transferred and the cost of the finished product can be calculated. This applies in general engineering where many hundreds of components
may go towards making the finished machine or other product.
(d) Hybrid costing systems • Many costing systems do not fall nearly into the category of either job costing or process
costing. Often systems use some features of both main costing systems.
• Many engineering companies use batch costing, which treats each batch of components
as a job and then finds the average cost of a single unit. • Another variation is multiple costing, used when many different finished products are made.
Many components are made which are subsequently assembled into the completed article,
which may be bicycles, cars, etc. Costs have to be ascertained for operations, processes, units and jobs, building together until the total cost is found.
• Different names may be used to describe either process costing or job costing. Thus, for
example, unit costing is the name given to one system where there is a natural unit, such as sack of flour, a barrel of beer etc.
• In unit costing method, the expenses on various items are charged per unit quantity or
production.
• Operation costing is a variation of unit costing, and is used when production is carried out on a large scale, popularly known as mass production.
• Operation costing is the term applied to describe the system used to find the cost of
performing a utility service such as transport, gas, water or electricity. • In this method, the cost per unit is found on the basis of operating expenses incurred on
various items of expenditure.
• Unit costing, operation costing and operating costing are variations of process costing. • Contract or terminal costing is the name given to job costing employed by builders and
constructional engineers.
• All these methods ascertain the actual cost.
Departmental costing method In big industries like steel industry or automobile industry each department is producing
independently one or more components. Departmental costing method is used in such industries and the
actual expenditure of each department on various products is entered on the separate cost sheet and the
costing for each department is separately undertaken.
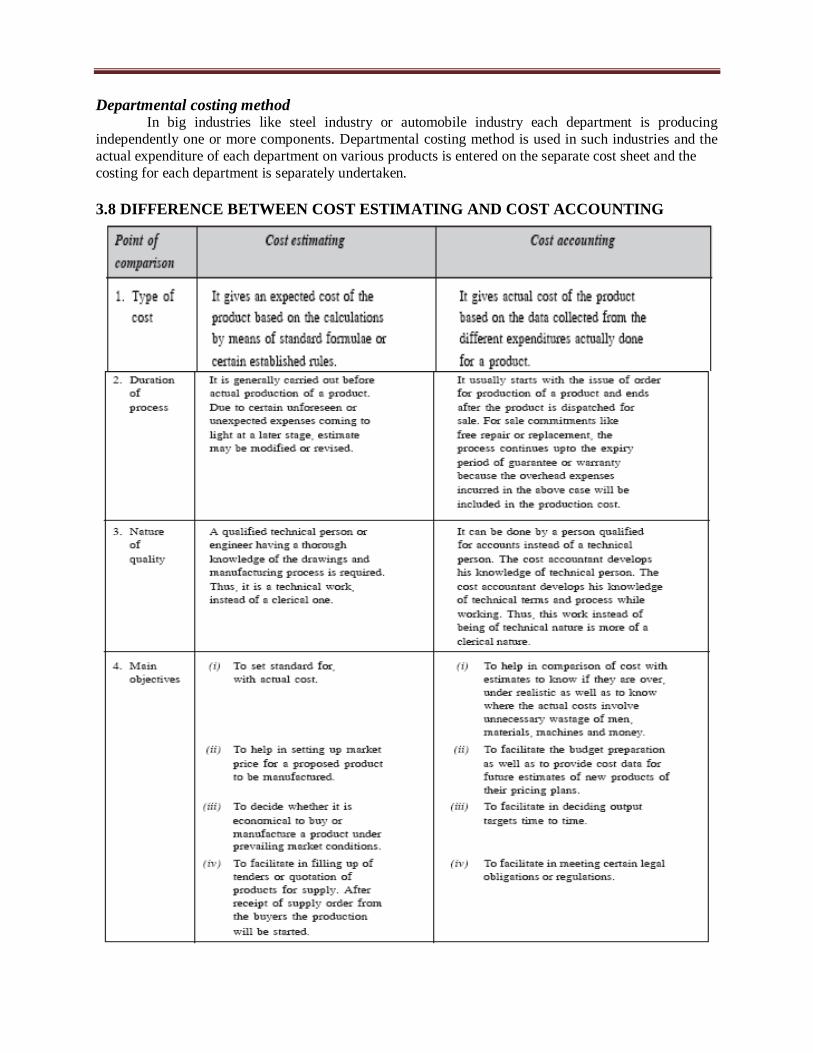
3.8 DIFFERENCE BETWEEN COST ESTIMATING AND COST ACCOUNTING

3.9 DIFFERENCE BETWEEN FINANCIAL ACCOUNTING AND COST
ACCOUNTING
• Accounting information is vital for showing the indebtedness of a business accounting
uses words and figures to communicate the transactions which have been entered into.
• Both financial accounting and cost accounting are concerned with the recording of
transactions so as to enable to calculate profit (or loss) for one or more transactions and
to show the assets and liabilities owned or incurred by the business.
• Financial accounting is concerned with the external transactions and, therefore, record
all dealings with the outside world. Any purchase or sale of goods and services and fixed
assets, whether for cash or on credit are covered.
• Cost accounting, on the other hand, deals with the internal affairs of a business. It
attempts to show the results of the operations carried out and emphasizes throughout the
measurement and achievement of efficiency.
• Fixed assets, workers and materials are brought together with the object of transforming
the resources employed and thereby obtaining a saleable product or service.
• Generally special attention is paid to the control aspect of the quantities and prices of
the resources necessary for the transformation.
3.10 ELEMENTS OF COST INTRODUCTION
The total cost is made up of three main elements (figure 3.1).
1. Material.
2. Labour.
3. Expenses.
3.11 MATERIAL COST
Material cost consists of the cost of materials which are used in the manufacture of
product. It is divided into the following:
3.11.1 Direct Material Cost
It is the cost of those materials which are directly used for the manufacture of the product
and become a part of the finished product.
The procedure for calculating the direct material cost is as follows:
(i) From the product drawing, make a list of all the components required to make the final
product.
(ii) Calculate the volume of each component from the drawing dimensions after adding

machining allowances, wherever necessary.
(iii) The volume of component multiplied by the density of material used gives the weight
of the material per component.
(iv) Add process rejection and other allowances like cutting allowance to get the gross
weight per component.
(v) Multiply the gross weight by the rate of material per unit weight to get the cost of raw
material per component.
(vi) The cost of raw material for all the components is, similarly, calculated and added up
which gives the cost of direct material for the product.
3.11.2 Indirect Material Cost
In addition to direct materials a number of other materials are necessary to help in the
conversion of direct materials into final shape. Though these materials are consumed in the
production, they don‘t become part of the finished product and their cost cannot be directly
booked to the manufacture of a specific product. Such materials are called indirect materials.
The indirect materials include oils, general tools, greases, sand papers, coolants, cotton
waste etc. The cost associated with indirect materials is called indirect material cost.
Depending upon the product manufactured, the same may be direct materials for one
concern and indirect materials for others.
3.12 LABOUR COST
It is the expenditure made on the salaries, wages, overtime, bonuses, etc. of the employees
of the enterprise. It can be classified as
3.12.1 Direct Labour Cost
Direct labourer is one who actually works and processes the materials to convert it into the
final shape. The cost associated with direct labour is called direct labour cost.
The direct labour cost can be identified and allocated to the manufacture of a specific
product. Examples of the direct labour are the workers operating lathes, milling machines or
welders, or assemblers in assembly shop. The direct labour cost may be allocated to a product or
job on the basis of time spent by a worker on a job.
3.12.2 Determination of Direct Labour Cost
Determination of labour is much more complicated problem than calculating material
cost. To find the labour cost one must have the knowledge of all the operations which are carried
out for production of the product, tools and machines to be used and the departments in which
the product is to be manufactured.
For calculating time required for a particular job following considerations should be taken
into account:
(a) Setup time.
(b) Operation time.
(i) Handling time.
(ii) Machining time.
(c) Tear down time
(d) Down (or) lost time.
(e) Miscellaneous allowances:
(i) Personal allowance.
(ii) Fatigue allowance.
(iii) Tool sharpening and changing allowance.
(iv) Checking allowance.
(v) Other oiling and cleaning.
(vi) Filling coolant reservoirs.
(vii) Disposing of scraps and surplus stocks.
Setup time
Before starting any operation, first we have to set the job, tools and other auxiliary
equipment. So, set up time is the time required for setting and fixing the jobs and tools on the
machine.
Time to study the drawings, blueprints, time to make adjustment for getting the required
size are all included in set up time. This time is also known as setting time.
Man (or) handling time
This is the time the operator spends loading and unloading the work, manipulating the
tools and the machine and making measurements during each cycle of operation.
Machinery time
This is the time during each cycle of operation that the machine is working or the tools
are cutting.
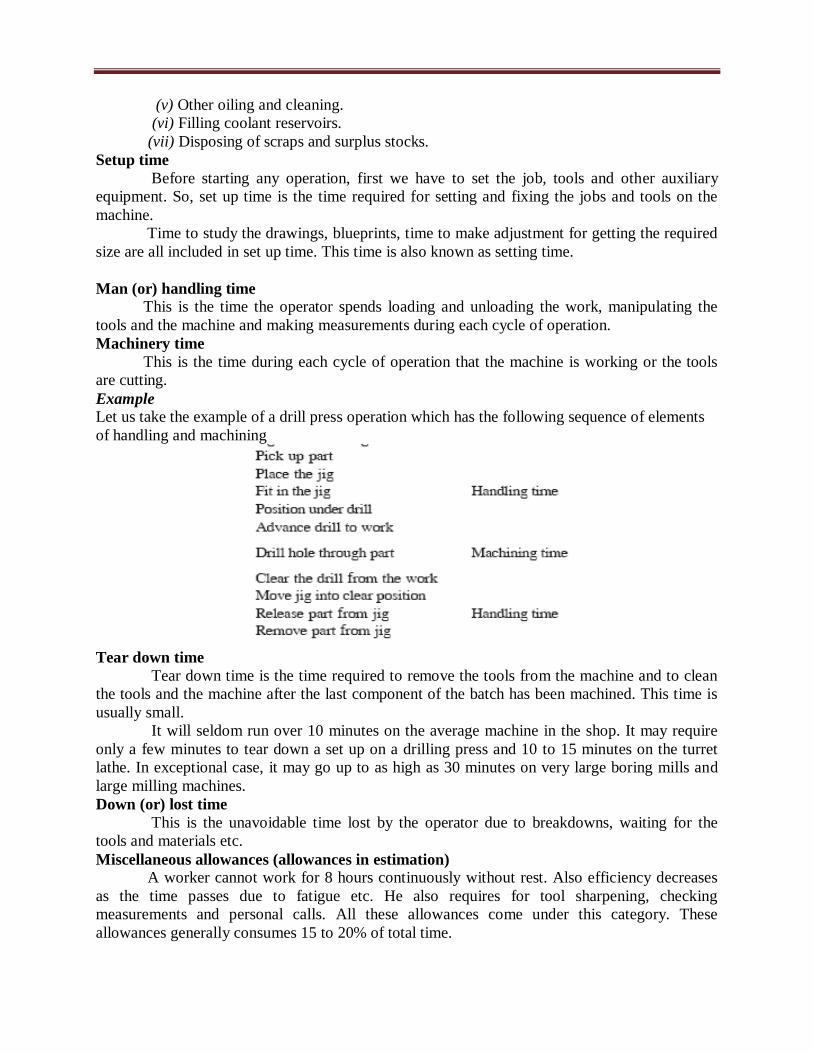
Example
Let us take the example of a drill press operation which has the following sequence of elements
of handling and machining
Tear down time
Tear down time is the time required to remove the tools from the machine and to clean
the tools and the machine after the last component of the batch has been machined. This time is
usually small.
It will seldom run over 10 minutes on the average machine in the shop. It may require
only a few minutes to tear down a set up on a drilling press and 10 to 15 minutes on the turret
lathe. In exceptional case, it may go up to as high as 30 minutes on very large boring mills and
large milling machines.
Down (or) lost time
This is the unavoidable time lost by the operator due to breakdowns, waiting for the
tools and materials etc.
Miscellaneous allowances (allowances in estimation)
A worker cannot work for 8 hours continuously without rest. Also efficiency decreases
as the time passes due to fatigue etc. He also requires for tool sharpening, checking
measurements and personal calls. All these allowances come under this category. These
allowances generally consumes 15 to 20% of total time.

(a) Personnal allowances
This is the time allowed for a worker for his personal needs like going to rest rooms,
smoking, having a cup of tea, going to Lavatories to take water for personal cleanliness etc. This
is generally about 5% of the total working time.
(b) Fatigue
The efficiency of the worker decreases due to fatigue (or) working at a stretch and also
due to working conditions such as poor lighting, heating (or) ventilation. The efficiency is also
affected by the psychology of the worker. It may be due to domestic worries, job securities etc.
For normal work, the allowance for fatigue is about 5% of the total time. This allowance can be
increased depending upon the type and nature of work and working conditions.
(c) Total sharpening and changing allowance
It is the time required to remove the tool and its holder, to walk up to the grinder to grind
the tools, to come back to the machine and then to fix the tool again in the machine.
(d) Checking allowance
It is the time taken for checking the dimensions. Rough dimensions take less while
accurate dimensions require more time. This allowance should be considered only when the
operator is doing checking only and no work on the machine. If the checking is done during
machining time it should not be considered. The checking times for the various instruments are
given below to check one dimension.
(e) Oiling and cleaning
It is the time required for cleaning the machine and to lubricate its various parts for
smooth functioning of the machine.
(f) Filling coolant reservoirs
It is the time required for filling the reservoirs of the coolant which are used for cooling
the jobs and tools.
(g) Disposing off scraps and surplus stocks
It is the time consumed for disposing off the scraps and other surplus stocks.
The miscellaneous allowances should be added to the set up, the operation and tear down times
to complete the element.
3.12.3 Indirect Labour Cost
Indirect labourer is one who is not directly employed in the manufacturing of the product
but his services are used in some indirect manner.
The indirect labour includes supervisors, foreman,storekeeper, gatekeeper, maintenance,
staff, crane driver etc. The cost associated with indirect labour is called indirect labour cost.

The indirect labour costs cannot be identified with a particular job or product but are
charged on the total number of products made during a particular period in a plant.
3.13 EXPENSES
Apart from material and labour cost in each factory there are several other expenditures
such as cost of special layouts, designs, etc. hire of special tools and equipments; depreciation
charges of plants and factory building; building rent; cost of transportation, salaries and
commissions to salesman etc.
All these expenditures are known as overheads or expenses. So, from above it is clear that
3.13.1 Direct Expenses
Direct expenses also known as chargeable expenses include any expenditure other than
direct material or direct labour incurred on a specific cost unit. These are the expenses which can
be charged directly to a particular job and are done for that specific job only. For example, hire
of special tools and equipment, cost of special jigs and fixtures or some special patterns and its
maintenance cost,
costs of layouts, designs and drawings or experimental work on a particular job etc.
3.13.2 Indirect Expenses (Overheads)
These are known as overhead charges, burden or on cost. All the expenses over and above
prime cost are indirect expenses. Overhead is the sum of indirect labour cost, indirect material
cost and other expenses including service which cannot be conveniently charged to specific cost
unit. These can be further classified as
1. Production expenses/Factory expenses.
2. Administrative expenses.
3. Selling expenses.
4. Distribution expenses.
(i) Production expenses
These expenses cover all indirect expenditures incurred by the undertaking from the
receipt of the order until its completion ready for dispatch. Production expenses are also known
as factory on cost, production overhead, factory overhead, work on cost, works overhead etc.
Some examples of factory expenses or production expenses are:
(i) Rent, rates and insurance chargeable against the works.
(ii) Indirect labour example: supervision such as salaries of foreman, supervisors, factory
manager etc.
(iii) Consumable stores and all forms of indirect material such as cotton waste, grease, oil
etc.
(iv) Depreciation, maintenance and repair of buildings, plant, machine tools etc.,
(v) Power such as steam, gas, electricity, hydraulic or compressed air, internal transport
etc.
(ii) Administrative expenses
These expenses include all the expenses on managerial or administerial staff for the
planning and policy making work. Some examples of administrative expenses are:
(i) Salaries of directors and managing directors.
(ii) Salaries of cost, finance and secretary office staff including clerks and peons.
(iii) Expenses of direct amenities like telephone, coolers and other modern equipments.
(iv) Travelling expenses for attending meetings etc.
(v) Charges for electric consumption for light, heating and cooling.

(vi) Stationary, auditing expenses.
(vii) Insurance of building and employees, repairs, maintenance and depreciation of
building and furniture.
(iii) Selling expenses
These consist of the expenditures spent towards securing orders, and finding or retaining
markets for the products manufactured. Following is the list of selling expenses:
(i) Advertising and publicity expenses.
(ii) Salaries of the sales department staff including sales manager, salesman etc.
(iii) Travelling expenses of sales engineers.
(iv) Cost of preparing tenders and estimates.
(v) Expenses of making blocks and posters.
(vi) Sales stock storage charges.
(iv) Distribution expenses
These are the expenses which are paid for the distribution of the product. It includes the
expenditure made on holding finished stock, packing cost and dispatching them to the customer.
This type of expenses include
(i) Finished stock storages.
(ii) Lost of packing.
(iii) Loading, unloading charges, freight and warfare.
(iv) Expenses of transportation and vehicles.
(v) Salaries of dispatch clerks and labourers.
3.14 COST OF PRODUCT (LADDER OF COST)
The elements of cost can be combined to give following types of cost:
1. Prime cost: It consists of direct material cost, direct labour cost and direct expenses.
Prime cost = Direct material cost + Direct labour cost + Direct expenses.
Prime cost is also called as direct cost.
2. Factory cost: It consists of prime cost and factory expenses.
Factory cost = prime cost + factory expenses.
Factory cost is also named as works cost.
3. Office cost: It consists of factory cost and administrative expenses.
Office cost = Factory cost + Administrative expenses
It is also named as manufacturing cost (or) cost of production.
4. Total cost: It includes manufacturing cost and selling and distribution expenses.
Total cost = Manufacturing cost + selling and distribution expenses.
Selling price
If the profit is added in the total cost of the product, it is called selling price. The
customers get the
articles by paying the price which is named as selling price.
Selling price = Total cost + Profit
= Total cost – Loss
Making price (or) catalogue price: Some percentage of discount allowed to the distributors of
product is added into the selling price. The result obtained is called the market price (or)
catalogue price (figure 3.2).

UNIT 4
COST ESTIMATION
4.1 TYPES OF ESTIMATE
Estimates can be developed in a variety of different ways depending upon the use of the
estimates
and the amount of detail provided to the estimator.
Every estimator should understand every estimating method and when to apply each,
because no one estimating method will solve all estimating problems.
4.1.1 Guesstimates
Guesstimates is a slang term used to describe as estimate than lacks detail. This type of
estimate
relies on the estimators experience and judgment.
Usually, the tool and die estimator is estimating tool cost without any tool or die
drawings. The estimator typically works from a piece part drawing and must visualize what the
tool or die looks like. Some estimators develop some level of detail in their estimate.

Material cost, for example, is usually priced out in some detail, and this brings greater
accuracy to the estimator by reducing error. If the material part of the estimate has an estimating
error of plus or minus 5 per cent and the reminder of the estimate has an estimating error of plus
or minus 10 per cent, the overall error is reduced.
4.1.2 Budgetary
The budgetary estimate can also be a guesstimate but is used for a different purpose. The
budgetary estimate is used for planning the cost of a piece part, assembly, or project.
This type of estimate is typically on the high side because the estimator understands that
a low estimate could create real problems.
4.1.3 Using Past History
Using past history is a very popular way of developing estimates for new work. Some
companies go to great lengths to ensure that estimates are developed in the same way actual cost
is conducted.
This provides a way past history in developing new estimates. New advancements in
group
technology now provide a way for the microcomputer to assist in this effort.
4.1.4 Estimating in Some Detail
Some estimators vary the amount of detail in an estimate depending on the risk and dollar
amount
of the estimate. This is true in most contract shops. This level of detail might be at the operation
level where operation 10 might be a turning operation and the estimator would estimate the setup
time at 0.5 hours and the run time at 5.00 minutes. The material part of the estimate is usually
calculated out in detail to reduce estimating error.
4.1.5 Estimating in Complete Detail
When the risk of being wrong is high or the dollar amount of the estimate is high, the
estimator will develop the estimate in as much detail as possible.
Detailed estimates for machinery operations, for example, would include calculations for
speeds, feeds, cutting times, load and unload times and even machine manipulations factors.
These time values are calculated as standard time and adjusted with an efficiency factor
to predict actual performance.
4.1.6 Parametric Estimating
Parametric estimating is an estimating method developed and used by trade associations.
New housing constructions can be estimated on the basis of cost per square.
There would be different figures for wood construction as compared with brick and for
single strong construction as compared with multilevel construction.
Some heat-beating companies price work on a cost per pound basis and have different
cost curves for different heat-treating methods.
4.1.7 Project Estimating
Project estimating is by far the most complex of all estimating tasks. This is especially
true if the project is a lengthy one. A good example of project estimating is the time and cost of
developing a new missile.
The project might take 5 years and cost millions of dollars. The actual manufacturing cost
of the missile might be a fraction of the total cost.
Major projects of this nature will have a PERT network to keep track of the many
complexities of the project. A team of people with a project leader is usually required to develop
a project estimate.
4.2 STANDARD DATA
Standard data are defined as standard time values for all the manual work in an estimate
standard
data provide the opportunity for the estimator to be consistent in developing an estimate.
4.2.1 How Standard Data are Developed?
Standard data are developed in a variety of ways depending on the industry that uses
them. Experience shows that it is easier to develop standard data for machinery operation as
compared with fabrication operation.
This is because machinery operations can be calculated by using speeds, feeds and
lengths of cut to determine time values.
Most of the work content of a fabrication operation is manual effort rather than machine
time, and for this reason reliable standard data for the fabrication industry are difficult to find.
Listed below are the basic methods used to develop standard data.
4.2.2 Past History
Many companies use past history or actual performance on joules produced to develop
standard data.
Developing standard data this way rarely considers the best method of organizing work.
This method is popular in smaller companies that do not have industrial engineers or time study
engineers.
4.2.3 Time Study
Larger, well-organised companies will develop standard data from stop-watch time
studies. Time studies are used to establish rates of production.
However, when time studies are also used to establish standard data, care must be taken
in defining element content so work content can be isolated.
Time study engineers must be taught how to establish the element content of their studies
in a way that will permit the development of standard data.
4.2.4 Predetermined Time Standards
Another approach in the development of standard data is to use one of the many
predetermined time standard systems like MTM or MOST.
This method has its advantages and disadvantages. The chiefly advantage is consistency
of data, and the chief disadvantage is the amount of time necessary to develop the data.
Some predetermined time standard systems are now computerized, which shortens the
development time.
4.2.5 Standard Data Specific to a Shop and Lot Size
It should be pointed out that ―all standard data are specific to a given shop and lot size.‖
Standard data developed in a high-production shop under ideal methods are of little value to a
job shop that runs lot, sizes of 10 parts each. The reverse is also true.
The use of efficiency factors or off standard factors can assist in using the same data for
both conditions, but this is less than ideal.
The reverse use of learning curves, that is, backing up the curve, is a better method of
repricing work for small lot sizes using this method, the same standard data can be used for high
and low production.

4.3 MATERIALS AVAILABLE TO DEVELOP AN ESTIMATE
Materials available for developing an estimate vary widely depending on what is being
estimated.
In most cases the quality of the estimate will depend on the amount of materials to make the
estimate.
Estimating materials shown below is a listing of the materials available for making an
estimate.
No drawings
In many cases there are no drawings of what is being estimated. One clear example of
this is tool estimating. The estimator will develop an estimate for a progressive die, for example,
by reviewing the price part drawing. Some die estimators will develop a strip layout for the part
and then estimate the die cost station by station.
Sketches
Sometimes sketches of the parts represent the only information available. This is
typically true for
a budgetary estimate.
Line drawings
Loftings or line drawings are used for estimating in some industries. The pleasure boat
industry represents an example. A full-scale lofting of a deck and hull is used to estimate both
the material and labour for a new fiber glass boat.
Complete drawings
Complete drawings and specifications are available for estimating some work. The
aircraft industry is one good example.
Many times the estimator will spend more time reading the specifications than
developing the estimate. This is necessary because the specifications will often determine the
part process.
4.4 METHODS OF ESTIMATES
4.4.1 Computer Estimating
Computer estimating has become very popular in recent years primarily because of the
advent of the micro computer. Early efforts of computer estimating date back to the early 1970s
but were cumbersome to use because they were on a mainframe and were card-driven.
No less than 15 U.S. companies now offer estimating software for a microcomputer.
Because the computer estimating industry is new, there are no real standards for estimating
programs. Some programs are nothing more than a way to organize the calculations of an
estimate, while others calculate all the details of the estimate.
Advantages and disadvantages
Shown below are some of the major advantages of computer cost estimating.
Accuracy versus consistency
Computer estimates are very consistent, provided they calculate the detail of an estimate.
Because these estimates are consistent, they can be made to be accurate.
Through the use of consistent efficiency factors or leaving curves, estimates can be
adjusted up or down. This is one of the chief advantages of computer cost estimating.

Levels of details
Some computer estimating systems provide different levels of estimating cost. The level
of detail selected by the user depends on the dollar risk.
Many estimators produce an estimate in more detail because the computer can calculate
speeds and feeds, for example, much faster than an estimator can a hand-held calculators.
Refinements
Some computer estimating systems provide many refinements that would be impossible
for the estimator to do in any timely manner. One example is to adjust speeds and feeds for
material hardness.
Typically, the harder the material the more slowly a part will be turned or bored. Another
refinement is the ability to calculate a feed state and adjust it based on the width of a form tool.
Source code
Some companies offer the source code uncompiled to their users. This is important
because it affords the user the opportunity to customize the software.
In addition, many companies have written their
own software to do something that is not available on the market. If the source code is not
compiled, the users can build upon a computer estimating system.
Disadvantages
The chief disadvantage of computer estimating is that no one estimating system can suit
everyone‘s need. This is especially true if the source code is compiled and not customizable.
Another problem with computer estimating is that the estimator will, in all probability,
have to change some estimating methods. Computer software for estimating cost is seldom
written around one method of estimating.
4.4.2 Group Technology
Group technology is not new. It was invented by a Russian engineer over 30 years ago.
Unfortunately the subject is not taught in many of our colleges and universities.
Group technology (GT) is a coding system to describe something. Several proprietary
systems are on the market.
One such system, the MICAPP system, uses four code lengths, a 10-,15-,20-,25- digit
code. The code length selected is based on the complexity of the piece part or tool being
described.
Use for group technology
Shown below are several uses for group technology along with several examples of use both
internally
and externally.
Cost estimating
GT can be used very efficiently in estimating cost. Assume a company manufactures
shaft-type parts. Also arsum there is a computer data base named SHAFT that contains 10-digit
code followed by a part number, that is, code part number, and so on.
When an estimator must estimate the cost of a new shaft, the process starts by developing
a code that describes the characteristics of the part. The first digit in the code might be assigned
the part length, while the second digit is assigned the largest diameter and so on.
Next, the code is keyed in and the computer finds all the parts that meet the numeric
descriptions and points out the part numbers. The best fit is selected to be modified into a new
part.

All the details of each description are retrieved. These include diameter, length of cut,
number of surfaces, and the like. The estimator can alter these features and make the old part into
a new one.
Actual performance
As the part is being produced, the estimated information is updated with actual
performance and refined. This gives the estimator the ability to improve estimating accuracy,
because the next time, the computer finds that part as one to be modified into a new one, the
estimator is working with actual performance.
Other use for GT
There are many other uses for group technology one that is similar to estimating is
variant process planning, in which a standard process plan is on file for each operation and can
be modified into a new plan. One carbide tool manufacturer produced a line of carbide drills and
reamers and in their series 10 line and they had 758 different designs.
After a matrix to describe these tools was developed, a code for each tool was developed
and the database was established. The company conducted a redundancy search and found that
9% of the existing designs were either look-alikes or very similar. Now the company conducts a
database search first when confronted with a new design.
4.4.3 Parametric Estimating
Parametric estimating is the act of estimating cost or time by the application of
mathematical formulas.
These formulas can be as simple as multiplices or as complex as regression models.
Parametric estimating, sometimes refused as statistical modeling, was first documented by the
Rard Corporation in the early 1950‘s in an attempt to predict military hardware cost.
Use of parametric estimating
Many companies use some form of parametric estimating to develop sales forecasting.
The four
examples cited below will give the reader a good feel of how parametric estimating is used in a
variety of different industries.
Construction industry
In developing a cost estimate for residential buildings, some cost estimators use a dollar
value per square foot. The estimator constitutes curves based on different construction such as
wood on brick buildings and single or multi-storey dwellings.
These numbers can then be multiplied by the number of square feet in the building. Some
construction companies have refined this process to provide additional detail carpeting, for
example, could have a separate multiplier.
Heat treating
Most commercial heat-treating companies price their work based on a cost per pound and
heattreating method.
Heat-treating costs are very difficult to define because many times more than one type of
part is in the heat-treating furnace at the same time.
It is difficult to think of a more effective way to estimate cost for this type of industry.
Tool and die industry
As pointed out earlier, estimating cost for a progressive die can be very difficult because
the estimator seldom has a die drawing to work from some tool and die shops have developed
parametric estimating methods that take out some of the guestimating.

This method is known as the ―unit value‖ method over a period of time, the estimator
collects actual time values about dies being produced. Once the estimator is satisfied that the data
are correct, they are over aged into usable hours.
As an example, this might include 4 hours for every inch of forming or 3 hours for every
hole under 2 inches in diameter. The unit value can stand for several meanings. For flowing it is
a number of inches being formed.
For holes under 2 inches, in diameter, it represents the number of holes. The estimator
might establish a factor of 40 hours for a degree of difficulty. If the scrap cutter is ‗Standard‖ the
unit value is 1.
If the scrap cutter is more difficult, the unit value might have a value of 1.5 where the
hours allotted would be 60.
Helicopter transmission
A helicopter transmission is a large complicated assembly comprised of a planetary gear
system, bevel gears, shafting, and housings. Budgetary estimates for a transmission are usually
developed using a variety of parametric methods.
The housing costs are based on weight. The bevel gear cost is based on number of teeth,
and the planetary gear cost is based on gear face width and number of teeth. If methods like these
were not employed, it would take hundred man-hour to produce an estimate.
Collecting and testing data
The single most important activity in parametric estimating is data collection and testing.
Once the estimator develops the estimating methods, enough sample data should be collected for
a natural bell curve. Statistical testing of the curve is also very important.
Once the parametric data are used for estimating it is important to continually test them
against actual performance and refine them as necessary.
(a) Other factors that affect cost estimating
There are other factors that affect the accuracy of a cost estimate. Several of these are
cited below.
Project estimating
Inflation analysis and risk analysis come into play in project estimating. A multi-year
estimate, such as many government contracts, is especially sensitive to both these factors.
Inflation
When the estimate is being developed for future time periods, inflation rates are very
important
considerations.
The three most popular measurements of inflation are the wholesale price index, the
implicit price index, and the consumer index, the last being the most quoted.
Because inflation rates are difficult to estimate accurately most multi-year contracts have
some provisions reopeners to renegotiate. An after-tax evaluation of a multi-year project
provides a more accurate assessment because it take into consideration costs that are not
sensitive to inflation.
These costs might be loans repayment, leases, and depreciation costs.
Risk analysis
Risk analysis is a series of methods used to quantify uncertainty. Most of these methods
are math

models. Three broad classifications of risk associated with a project are cost, schedule, and
performance. Some of the most popular methods of risk analysis are:
1. Program Evaluation and Review Technique (PERT).
2. Probabilistic Analysis of Network (PAN).
3. Risk Information System and Network Evaluation Technique (RISNET).
4.4.4 Statistical Estimating
The analysis of data through the use of statistical methods has been used for centuries.
These
data can be cost versus other information that leads to cost development.
The practitioner must have a well-founded background in the use and application of
statistical methods because an endless array of methods is available, several of which are
described below.
Parametric estimating
Statistical estimating is another form of parametric estimating. The parametric methods
made industry oriented whereas the methods discussed below are universal.
Regression analysis
They form most popular of regression analysis are simple regression, multiple regression,
log-linear regression and curvilinear regression.
Each math model is different and is designed for a specific use. Information can be
regressed along a straight line or along a curve.
Statistical estimating methods are very useful in parametric estimating. To use any of
these methods also requires the user to have a sound knowledge of ―goodness of data fit‖.
Math models are available to determine how well data fit a straight line, curve or log-
linear relationship.
Computers
Because of the complex nature of statistical estimating, the use of a computer is required.
Fortunately, many good commercial programs, many of which are not expensive, are available
on the market.
4.5 IMPORTANCE OF REALISTIC ESTIMATES
If the estimated cost of a product proves later on, to be almost same as the actual cost of
that product, it is a realistic estimate. The cost estimate may prove to be
(i) A realistic estimate,
(ii) An over-estimate, or
(iii) An under-estimate.
• An over-estimate, later on, proves to be much more than the actual cost of that
product.
• An under-estimate, later on, proves to be much lower than the actual cost of that
product.
• Both over-estimate and under-estimate may prove to be dangerous and harmful
for a concern. Assume that on the basis of an estimate, the concern has to fill up a
tender enquiry.
The over estimate means the concern will quote a higher rate and thus will not get the job
or contract. In case of an under-estimate, the concern will get the contract but it will not be able
to complete the work within that small quoted amount and hence will suffer heavy losses.

This emphasizes the importance of making realistic estimates. Realistic estimates are
very essential for the survival and growth of a concern.
4.6 ESTIMATING PROCEDURE
The estimating department is generally attached with the planning department and is
controlled by production manager. The total procedure is considered to have three stages.
(i) Fixing of design, accuracy and finish.
(ii) Proper working of estimating department.
(iii) Obtaining a delivery promise from the progress department in view of existing load
on the
shop.
The planning department sets down the requirements and specifications, type and
quantities of materials, make out the drawing, lays down the methods and sequence of
operations, machines to be used, allowed times and rates of labour etc. Main items to be
estimated in order of sequence are as follows:
1. Price list: To prepare the list of all the components of the product.
2. Buy or Manufacture: To decide which components should be made in the factory itself
and which component should be procured from the market.
3. Weight of material: Determination of the weight of the materials with various
allowances.
4. Material cost: Determination of the material cost either at market price or at a forecast
price.
5. Outside purchases: Determination of prices of outside purchases.
6. Machinery or processing data: Determination of cutting speeds and feeds for the
materials selected and machining times for all operations.
7. Labour cost: Determination of labour cost of each operation from performance times
and wage rates, including manufacturing and assembly and testing.
8. Cost of tools and equipment: Determination of cost of necessary special tools or
equipment etc.
9. Prime cost: Determination of prime cost by adding labour cost into material cost.
10. Factory overheads: Determination of factory on cost and general overhead charges.
11. Package and delivery charges: Determination of package and delivery charges and
also insurance charges if necessary.
12. Total cost: To calculate the total cost.
13. Standard profit and sales price: To decide standard profit and adding this into total
cost so as to fix the sale price.
14. Discount to be allowed: To decide discount allowed to the distributors and adding
this into sale price to get market price or catalogue price.
15. Time of delivery: Determination of time of delivery in collaboration with the progress
department.
16. Approval of management: When the estimate is complete, it is entered into the
‗Estimate form‘ and submitted to the directors and sales department for dispatch of the quotation
or tender.

4.7 DIVISION OF ESTIMATING PROCEDURE
The above said procedure for simplicity can be divided into following major groups:
1. Material Cost. 2. Direct Labour Cost.
3. Direct Expenses. 4. Various Overhead Expenses.
1. Material cost
This estimation is most important in cost estimation. In calculating material cost both
direct and indirect materials should be taken into account. The estimation of materials for this job
or product includes the calculation of quantities to be provided including allowances for scrap
and wastage in cutting, punching, turning etc. and for spoilage in processing.
After calculating weights or volumes of materials required, the cost of materials is
estimated from rate of material. The estimator should have full information about the availability
of the material.
2. Labour cost
Next stage is the estimation of labour cost. For this purpose the estimator must have the
knowledge of the operations which will be performed, tools to be used, machine that will be
employed and the department in which the product is to work for different operations.
The labour cost is calculated by multiplying hourly rate of the worker by total time spent
in processing a job. The total time spent includes the set up time, tear down time, operation time
and other miscellaneous allowances such as personal, fatigue, tool sharpening and charging,
checking etc.
3. Direct expenses

It includes any expenditure other than direct material and direct labour incurred on a
specific cost
unit such as
(i) Hire charges of special tools or equipments for a particular production order or
product.
(ii) Cost of special layout, design or drawing.
(iii) Cost of jigs and fixtures/pattern specially meant for the particular job only.
4. Various overhead expenses
All expenses other than direct material, direct labour and other direct expenses are called
overhead expenses. These include the expenses such as
(i) Indirect material cost: These expenses include the cost of oil greases, coolants, cotton
waste,etc.
(ii) Industrial labour cost: These expenses include the salaries of supervisors, foreman,
draftsman, designers, chowkidars, storekeepers, etc.
4.8 CONSTITUENTS OF A JOB ESTIMATE
The various constituents of estimating the cost of a product may be sub-divided as under:
(a) Design time.
(b) Drafting time.
(c) Method studies, time studies, planning and production time.
(d) Design, procurement and manufacture of special patterns, cores, core boxes,
flasks, tools, dies, jigs and fixtures etc.
(e) Experimental work.
Cost Estimation 103
(f) Materials.
(g) Labour.
(h) Overheads.
Design time
The time required for designing a product is estimated either on the basis of similar
product previously manufactured or on the judgement of the designer. This time is generally
considerable in quantity. It should be taken as the important.
(i) Repairs and maintenances expenses of machines and tools.
(ii) Insurance premium on building and plants.
(iii) Expenses of power such as steam, gas, electricity, etc.
(iv) Depreciation on building, furniture and equipment.
(v) Administrative overhead or expenses: These expenses include the salaries of high
officials,persons working in general office, telephone telegraph, stationary etc.
(vi) Selling expenses: These expenses include the salaries of salesman, commission to
salesman,advertising, publicity expenditure.
(vii) Light and power expenses.
(viii) Packing expenses.
(ix) Supervisory staff expenses.
Planned as regard the various processes and time to be taken by each. In case of routine
or repetitive jobs, the planning would be available in the records. This may be checked up and
the necessary modifications required may be made. In case of new jobs its method studies and
time studies must be carried out.

The jobs should be broken down into its elements. For each part, sub-assembly and
complete assembly, the type and sequence of operation should be studied and planned. Times for
various operation and the schedules for doing the work should be seen.
This time setting effect both the delivery date as well as the cost. In case of a special
order requiring considerable time, a special calculation should be made by making some
allowance factor in estimating the cost of the product. The standard man hour rate should be used
for calculating the cost of the designing time.
Drafting time
The next step after the design of the component is the preparation of its drawing to be
used by the worker during production. An experienced draughtsman is required to prepare them.
He also estimates the time and cost of drafting a new product. The probable time for drafting and
the cost of drafting are estimated on the basis of drawing of similar previous components, and
the standard man hour rate.
Method studies, time studies, planning and production time
Before the product is actually put into production, the material situation and purchase
requisition
are investigated for different materials required for the product.
Now, the job must be produced. The main points to be considered for this purpose are
cost of the equipment, labour, material, depreciation, overheads, repair and maintenance, special
buildings if required, supervision and the time required to conduct the experimental work.
Materials
It is the most important factor in cost estimation of any component. While computing the
cost of
material both the direct and indirect material should be taken into account. For this purpose the
calculations of the quantities of raw materials allowances for scrap, spoilage and wastage during
cutting, punching, turning etc. should be made.
Now the cost of the material is estimated from the rate of the material design,
procurement and manufacture of special patterns, core boxes etc. The cost of special patterns,
core boxes, tools, jigs, fixtures, gauges, consumable cutting fads etc. required for manufacturing
a product should be considered for estimation. This cost should be added to the estimated cost.
This cost is generally estimated in close coordination with Tool Department.
Experimental work
Certain types of experimental work has to be carried out in case of new type of products
or inventions. The main purpose of experimental work is to find the quickest, easiest, and
cheapest way of manufacture product. When estimating the cost of the new or undeveloped type
of products the estimator should be very careful to make proper allowances to the experimental
work.
Labour
For estimating the labour cost, the estimator is to go into greater details. He must be in
knowledge of the various operations to be performed, tool to be used, machines employed and
the departments in which the product is to be manufactured.
He must also be conversant with the wage rate for different operations. For time
calculations we must consider. ―The set up time; the operation time including the handling and
machine time; the tear down time and various allowances like personal fatigue, tool sharpening
or changing, checking etc.
4.9 COLLECTION OF COST

The various components of cost of any product manufacturing in any production concern
are
1. Prime cost = Direct material cost + Direct labour
cost + Direct expenses (if any)
2. Factory cost = Prime cost + Factory overheads
3. Cost of production = Factory cost + Administrative overheads
+ Miscellaneous overheads (if any)
4. Total cost = Cost of production + Selling and distribution overheads
The selling price of any product manufactured can be arrived at by adding a certain
percentage of profit to total cost.
The given stepped diagram explains the step-by-step procedure of arriving at selling price
of any product manufactured.
4.10 ALLOWANCES IN ESTIMATION
A worker cannot work continuously without rest. His efficiency decreases as time passes
due to fatigue etc. He also requires time for tool sharpening checking measurements and for
personal calls. All these allowance are called miscellaneous allowances.
The allowances amount to 15% of total time. Miscellaneous allowances are classified as
personal fatigue, tool changing of grinding, checking, oiling and cleaning allowances, filling
coolant reservoir and disposing off scraps and surplus, stock, etc.
UNIT 5
PRODUCTION COST ESTIMATION
5.1 ESTIMATION OF MATERIAL COST
5.1.1 Determination of Material Cost To calculate the material cost of the product the first step is to study drawing of the product and
split it into simple standard geometrical shapes and to find the volume of the material in the product and
then to find the weight. The volume is multiplied by density of the metal used in the product. The exact
procedure to find the material cost is like this: 1. Study the drawing carefully and break up the component into simple geometrical shapes.
(Cubes, prisms, cylinders, etc.)
2. Add the necessary machining allowances on all sides which are to be machined. 3. Determine the volume of each part by applying the formulae of mensuration.
4. Add the volumes of all the simple components to get total volume of the product.
5. Multiply the total volume of the product by the density of the material to get the weight of the material.
6. Find out the cost of the material by multiplying the cost per unit weight to the total weight
of the material.
5.1.2 Mensuration in Estimating
Introduction Mensuration is the science which deals with the calculation of length of lines, areas of surfaces
and volumes of solids by means of mathematical rules and formulae. An estimator is often required to
calculate the length, area of volume of a job he is going to perform.

Hence, he must be thoroughly acquainted with the rules and formulae of mensuration. The
general formulae for calculating the volume of a simple solid having a uniform crosssectional area throughout in the direction normal to the section considered, is to find the product of the cross-sectional
area and the length of the solid in the direction normal to the section considered.
To calculate the volume of a complex solid, it should be divided into a number of sample
geometric solids. The volume of all these parts are calculated separately and then added together to get the total volume.
The volume of a solid of revolution, as generated by the rotation of a plane area about a given
axis in its plane, is equal to the product of the area of the revolving section and the length of the path covered by its centroid in describing a circle about the axis.
This theorem was given by Guldinus. Volume of a circular ring, a half-round rib surrounding the
boss of a fly wheel, and Vgroove of a V-belt pulley may be calculated by Guildinus theorem.