unit 1 measurement · unit 1: matter and measurement page 7 chapters 1, 2, 3 standards of...
TRANSCRIPT
Unit 1: Matter and Measurement Page 1 Chapters 1, 2, 3
Unit 1 Measurement
Scientific Methods The scientific method refers to a ____________________ approach to scientific investigation. There is
________________________ one process known as the scientific method.
A. ____________________
1. Use existing __________________ and __________________
2. Qualitative data relates to the ______ ____________; describes _________________________
Examples:
3. Quantitative data involves _________________________ – numbers with ____________
Examples:
B. ____________________
1. Tentative ____________________ or ____________________ based upon observations
2. Includes ____________________ of results and _________________________
3. Two possible formats:
If/then statement
o If: _____________________________________________________________________
________________________________________________________________________
o Then: __________________________________________________________________
________________________________________________________________________
o May also include a ____________ to support prediction (____________)
Conditional statement
o Suggests ________________________________________________________________
________________________________________________________________________
o Reason _________________________________________________________________
C. ____________________
1. An experiment is a set of controlled ____________________ to test the hypothesis.
Unit 1: Matter and Measurement Page 2 Chapters 1, 2, 3
2. Only _____________________ variable can be changed or manipulated at a time.
3. _________________________ or manipulated variable is changed by the researcher. It may be
the treatment applied or the ____________ and is graphed on the ____________.
4. _________________________ or responding variable changes in response. The value depends
on the _________________________ variable. It represents the ____________ and is graphed
on the ____________.
5. A _______________ is a factor that is not changed and that provides a basis or standard for
__________________. An experiment may have control ____________ or _________________
_________________.
Control groups _____________________________________________________________.
Controlled variables _________________________________________________________.
If an experiment is testing the effectiveness of a new fertilizer, what would be held constant?
Example Melissa believes that turtles eating Tasty Turtle Tidbits food will become smarter and will be able to
navigate a maze faster than turtles eating regular Turtle Chow. She decides to perform an experiment to
test her hypothesis. She has ten turtles navigate a maze and records the time it takes for each one to
make it to the end. She feeds Tasty Turtle Tidbits to five turtles and Turtle Chow to five other turtles.
After one week, she puts the turtles through the maze again and records the times for each.
1) What was Melissa’s hypothesis?
2) Which fish are in the control group?
3) What is the independent variable?
4) What is the dependent variable?
************************************************************************************
Writing Activity: A medical research team is investigating how taking aspirin will affect the number of
heart attacks in men over 50 years of age.
The control group takes a ____________________ instead of aspirin. Why? ______________________
____________________________________________________________________________________
What are the manipulated and responding variables? _________________________________________
____________________________________________________________________________________
____________________________________________________________________________________
Unit 1: Matter and Measurement Page 3 Chapters 1, 2, 3
What other factors would need to be controlled? ____________________________________________
____________________________________________________________________________________
____________________________________________________________________________________
Write a possible hypothesis for this investigation. ___________________________________________
____________________________________________________________________________________
____________________________________________________________________________________
In a line graph for this investigation, how would the x- and y-axes be labeled? _____________________
____________________________________________________________________________________
____________________________________________________________________________________
************************************************************************************
D. ____________________
1. ________ ____________ must be placed into meaningful context.
2. Involves performing _____________________________________________ and summarizing
data from multiple __________________.
3. Review, __________________, and make sense of collected data.
4. Allows comparison of experimental results to the ____________________.
E. ____________________
1. A ____________________ based on information obtained through experimentation
2. Data/results will ________________ or _________________________ the hypothesis.
3. A written conclusion _________________________ the results of the scientific process.
Hypotheses, Theories, and Laws
A. Hypothesis: supported by many ____________________
B. Theory: states a broad ____________________ of ____________ supported by many experiments
over time. A theory is considered successful if it can be used to make predictions that are
____________. Example:
C. Scientific Law: describes a relationship in nature that is supported by multiple experiments with no
_________________________. Example:
Unit 1: Matter and Measurement Page 4 Chapters 1, 2, 3
Measurement Mars Climate Orbiter: What would happen if measurements were expressed one way but interpreted in
another?
Reliability of Measurements
A. Every measurement consists of two parts: 1) a ____________ followed by 2) a __________ from the
measuring tool.
A measurement can only be as ____________ as the measuring tool used.
The more _______________ in a measurement, the more _______________ it is.
o Example: __________________________________________________________________
B. All _________________________ possess a certain degree of ______________________________.
C. Types of Error
1. ____________________ error (_______________) are due to mistakes in procedure by
experimenter or instrument and can be _______________.
2. _______________ error is expected, has an ____________ chance of being high or being low, and
is addressed by _________________________________.
3. _______________ error or ________ occurs in the same direction (always high or always low)
and is usually to _________________________________________________________________.
D. Propagation of error: _______________________________________________________________
_________________________________________________________________________________
_________________________________________________________________________________
Process begins with the experimenter making the measurement with a _____________________.
o __________________________ are indicated by markings on measuring tool.
o Space between markings gives one __________________________.
Error is inherent in making measurements due to __________________ digits, and these errors
subsequently affect ______________________________.
E. The maximum possible _______________ for a measuring tool is defined as ___________________
the smallest division marked on the tool. The uncertainty in the final digit of the measurement is
assumed to be ________ (known as the ____________________________), unless otherwise noted.
For rulers marked only by centimeters, the uncertainty in the last digit (estimated) is
________________________. Therefore, the plus-or-minus amount is _________________.
For rulers with markings for millimeters in addition to centimeters, the plus-or-minus amount is
____________________________________. This ruler is __________________ than the first.
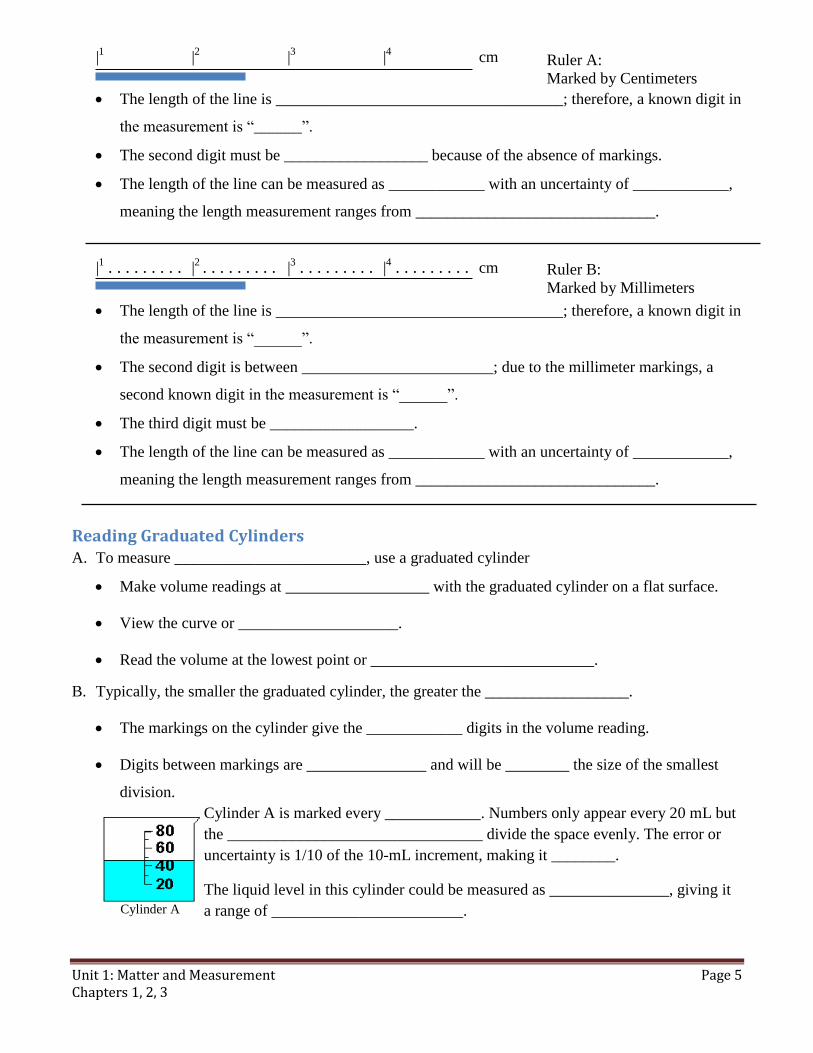
Unit 1: Matter and Measurement Page 5 Chapters 1, 2, 3
|1 |
2 |
3 |
4 cm
The length of the line is ____________________________________; therefore, a known digit in
the measurement is “______”.
The second digit must be __________________ because of the absence of markings.
The length of the line can be measured as ____________ with an uncertainty of ____________,
meaning the length measurement ranges from ______________________________.
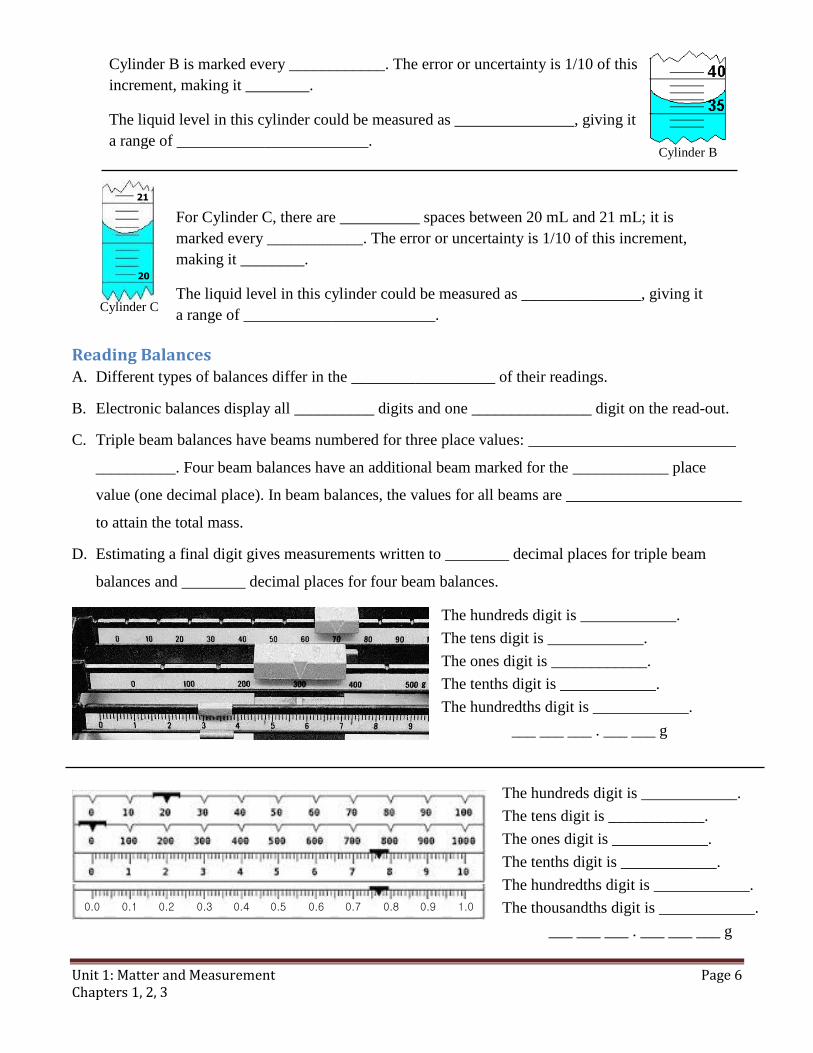
|1 . . . . . . . . . |2 . . . . . . . . . |
3 . . . . . . . . . |
4 . . . . . . . . .
cm
The length of the line is ____________________________________; therefore, a known digit in
the measurement is “______”.
The second digit is between ________________________; due to the millimeter markings, a
second known digit in the measurement is “______”.
The third digit must be __________________.
The length of the line can be measured as ____________ with an uncertainty of ____________,
meaning the length measurement ranges from ______________________________.
Reading Graduated Cylinders A. To measure ________________________, use a graduated cylinder
Make volume readings at __________________ with the graduated cylinder on a flat surface.
View the curve or ____________________.
Read the volume at the lowest point or ____________________________.
B. Typically, the smaller the graduated cylinder, the greater the __________________.
The markings on the cylinder give the ____________ digits in the volume reading.
Digits between markings are _______________ and will be ________ the size of the smallest
division.
Cylinder A is marked every ____________. Numbers only appear every 20 mL but
the ________________________________ divide the space evenly. The error or
uncertainty is 1/10 of the 10-mL increment, making it ________.
The liquid level in this cylinder could be measured as _______________, giving it
a range of ________________________. Cylinder A
Ruler A:
Marked by Centimeters
Ruler B:
Marked by Millimeters
Unit 1: Matter and Measurement Page 6 Chapters 1, 2, 3
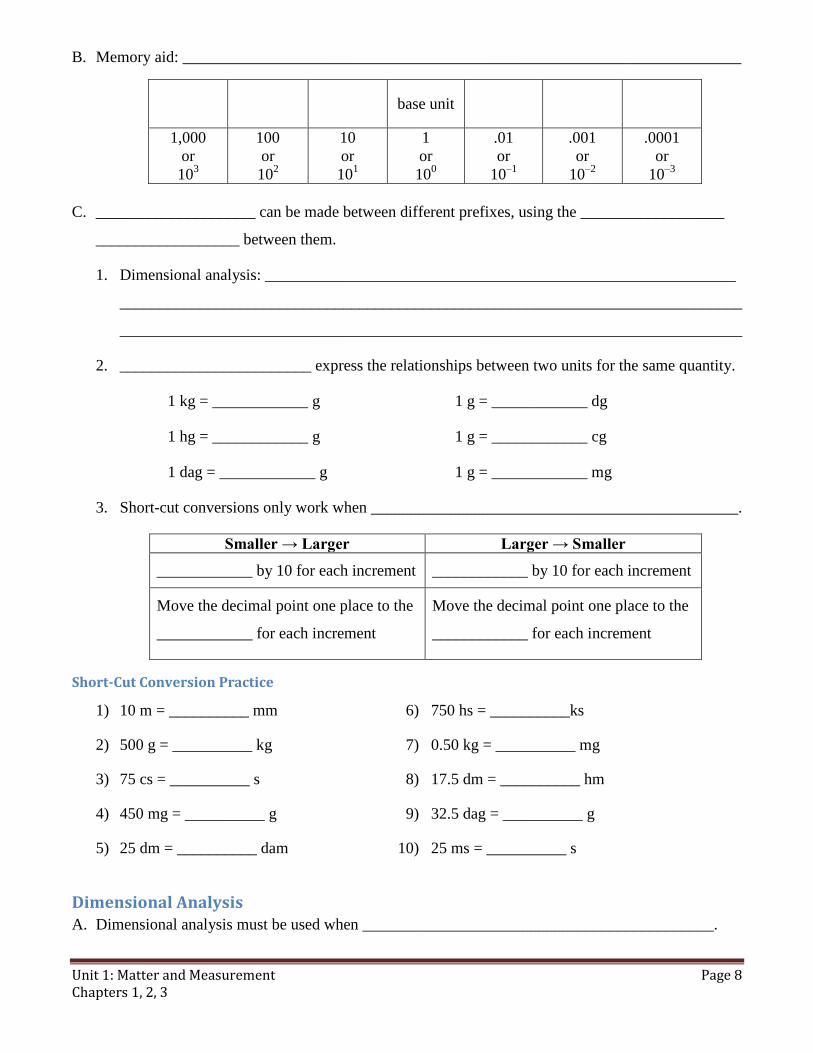
Reading Balances A. Different types of balances differ in the __________________ of their readings.
B. Electronic balances display all __________ digits and one _______________ digit on the read-out.
C. Triple beam balances have beams numbered for three place values: __________________________
__________. Four beam balances have an additional beam marked for the ____________ place
value (one decimal place). In beam balances, the values for all beams are ______________________
to attain the total mass.
D. Estimating a final digit gives measurements written to ________ decimal places for triple beam
balances and ________ decimal places for four beam balances.
Cylinder B
Cylinder B is marked every ____________. The error or uncertainty is 1/10 of this
increment, making it ________.
The liquid level in this cylinder could be measured as _______________, giving it
a range of ________________________.
Cylinder C
For Cylinder C, there are __________ spaces between 20 mL and 21 mL; it is
marked every ____________. The error or uncertainty is 1/10 of this increment,
making it ________.
The liquid level in this cylinder could be measured as _______________, giving it
a range of ________________________.
21
20
The hundreds digit is ____________.
The tens digit is ____________.
The ones digit is ____________.
The tenths digit is ____________.
The hundredths digit is ____________.
___ ___ ___ . ___ ___ g
0.1 0.0 0.2 0.3 0.4 0.5 0.6 0.7 0.8 0.9 1.0
The hundreds digit is ____________.
The tens digit is ____________.
The ones digit is ____________.
The tenths digit is ____________.
The hundredths digit is ____________.
The thousandths digit is ____________.
___ ___ ___ . ___ ___ ___ g
Unit 1: Matter and Measurement Page 7 Chapters 1, 2, 3
Standards of Measurement A. Measurement involves using a ________________________ to compare a specific dimension of an
object to a _______________.
1. Ancient Egyptians used the length of ________________________ as the standard of measure.
2. What are some problems with this standard? _________________________________________
______________________________________________________________________________
B. In the 1790s, during the French revolution, the ________________________ was instituted as a
standard system of measurement. A revision of this system began in 1948 and culminated in the
publication of the _____________________________________________ (or SI system) in 1960.
C. The building blocks of SI are the standard __________________ for seven quantities, which are
defined in terms of objects or events in the physical world, while ________________________ are
defined by combinations of the seven base units.
1. Time: __________________ (____)
2. Length: __________________ (____)
3. Mass: __________________ (____)
4. Temperature: __________________ (____)
5. Amount of a substance: __________________ (______)
a. ____________________ items makes up one mole of that item
b. AKA ____________________ Number
6. Electric current: __________________ (______)
7. Luminous intensity: __________________ (______)
Prefixes for SI Units A. Prefixes are used to produce a __________________ of the original unit.
1. All multiples are _______________________________________________________________.
2. Prefixes are used with the SI ________________________ but are never combined. Prefixes
may also be used with certain ________________________, which are considered acceptable for
use with SI.
3. Multiples for mass are named as if the _______________ is the base unit.
Unit 1: Matter and Measurement Page 8 Chapters 1, 2, 3
B. Memory aid: ______________________________________________________________________
base unit
1,000
or
103
100
or
102
10
or
101
1
or
100
.01
or
10–1
.001
or
10–2
.0001
or
10–3
C. ____________________ can be made between different prefixes, using the __________________
__________________ between them.
1. Dimensional analysis: ___________________________________________________________
______________________________________________________________________________
______________________________________________________________________________
2. ________________________ express the relationships between two units for the same quantity.
1 kg = ____________ g 1 g = ____________ dg
1 hg = ____________ g 1 g = ____________ cg
1 dag = ____________ g 1 g = ____________ mg
3. Short-cut conversions only work when ______________________________________________.
Smaller → Larger Larger → Smaller
____________ by 10 for each increment ____________ by 10 for each increment
Move the decimal point one place to the
____________ for each increment
Move the decimal point one place to the
____________ for each increment
Short-Cut Conversion Practice
1) 10 m = __________ mm 6) 750 hs = __________ks
2) 500 g = __________ kg 7) 0.50 kg = __________ mg
3) 75 cs = __________ s 8) 17.5 dm = __________ hm
4) 450 mg = __________ g 9) 32.5 dag = __________ g
5) 25 dm = __________ dam 10) 25 ms = __________ s
Dimensional Analysis A. Dimensional analysis must be used when ____________________________________________.
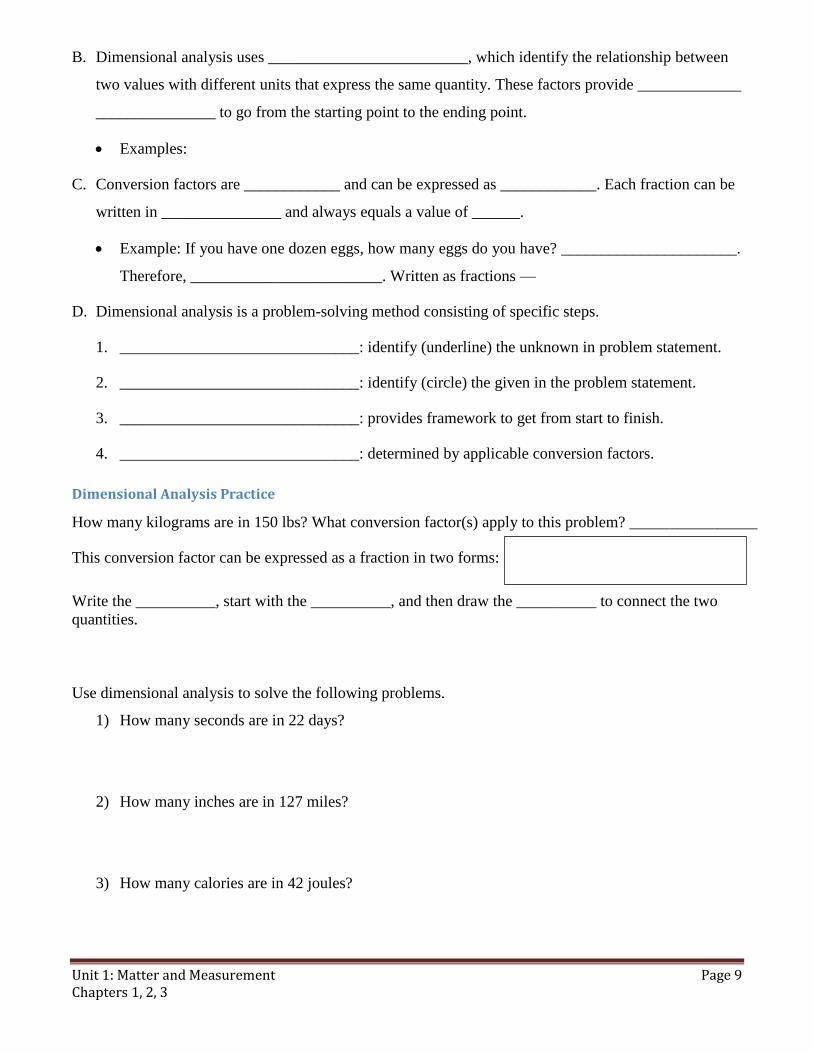
Unit 1: Matter and Measurement Page 9 Chapters 1, 2, 3
B. Dimensional analysis uses _________________________, which identify the relationship between
two values with different units that express the same quantity. These factors provide _____________
_______________ to go from the starting point to the ending point.
Examples:
C. Conversion factors are ____________ and can be expressed as ____________. Each fraction can be
written in _______________ and always equals a value of ______.
Example: If you have one dozen eggs, how many eggs do you have? ______________________.
Therefore, ________________________. Written as fractions —
D. Dimensional analysis is a problem-solving method consisting of specific steps.
1. ______________________________: identify (underline) the unknown in problem statement.
2. ______________________________: identify (circle) the given in the problem statement.
3. ______________________________: provides framework to get from start to finish.
4. ______________________________: determined by applicable conversion factors.
Dimensional Analysis Practice
How many kilograms are in 150 lbs? What conversion factor(s) apply to this problem? ________________
This conversion factor can be expressed as a fraction in two forms:
Write the __________, start with the __________, and then draw the __________ to connect the two
quantities.
Use dimensional analysis to solve the following problems.
1) How many seconds are in 22 days?
2) How many inches are in 127 miles?
3) How many calories are in 42 joules?
Unit 1: Matter and Measurement Page 10 Chapters 1, 2, 3
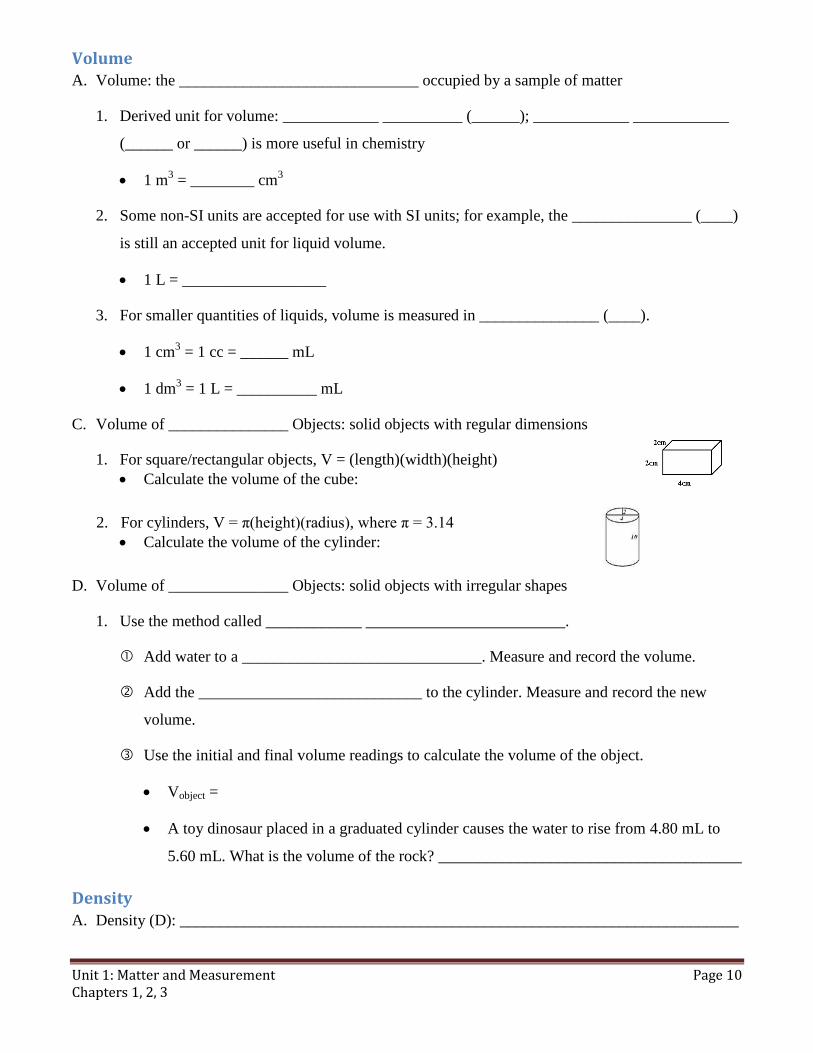
Volume A. Volume: the ______________________________ occupied by a sample of matter
1. Derived unit for volume: ____________ __________ (______); ____________ ____________
(______ or ______) is more useful in chemistry
1 m3 = ________ cm
3
2. Some non-SI units are accepted for use with SI units; for example, the _______________ (____)
is still an accepted unit for liquid volume.
1 L = __________________
3. For smaller quantities of liquids, volume is measured in _______________ (____).
1 cm3 = 1 cc = ______ mL
1 dm3 = 1 L = __________ mL
C. Volume of _______________ Objects: solid objects with regular dimensions
1. For square/rectangular objects, V = (length)(width)(height)
Calculate the volume of the cube:
2. For cylinders, V = π(height)(radius), where π = 3.14
Calculate the volume of the cylinder:
D. Volume of _______________ Objects: solid objects with irregular shapes
1. Use the method called ____________ _________________________.
Add water to a ______________________________. Measure and record the volume.
Add the ____________________________ to the cylinder. Measure and record the new
volume.
Use the initial and final volume readings to calculate the volume of the object.
Vobject =
A toy dinosaur placed in a graduated cylinder causes the water to rise from 4.80 mL to
5.60 mL. What is the volume of the rock? ______________________________________
Density A. Density (D): ______________________________________________________________________
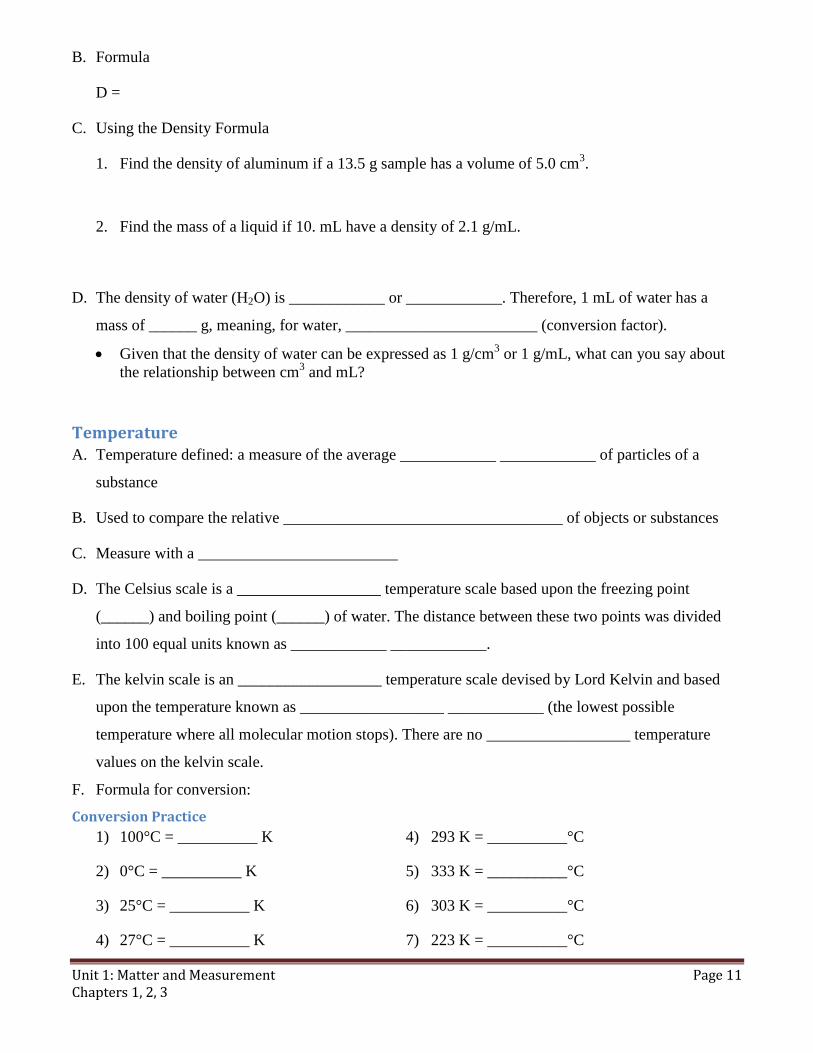
Unit 1: Matter and Measurement Page 11 Chapters 1, 2, 3
B. Formula
D =
C. Using the Density Formula
1. Find the density of aluminum if a 13.5 g sample has a volume of 5.0 cm3.
2. Find the mass of a liquid if 10. mL have a density of 2.1 g/mL.
D. The density of water (H2O) is ____________ or ____________. Therefore, 1 mL of water has a
mass of ______ g, meaning, for water, ________________________ (conversion factor).
Given that the density of water can be expressed as 1 g/cm3 or 1 g/mL, what can you say about
the relationship between cm3 and mL?
Temperature A. Temperature defined: a measure of the average ____________ ____________ of particles of a
substance
B. Used to compare the relative ___________________________________ of objects or substances
C. Measure with a _________________________
D. The Celsius scale is a __________________ temperature scale based upon the freezing point
(______) and boiling point (______) of water. The distance between these two points was divided
into 100 equal units known as ____________ ____________.
E. The kelvin scale is an __________________ temperature scale devised by Lord Kelvin and based
upon the temperature known as __________________ ____________ (the lowest possible
temperature where all molecular motion stops). There are no __________________ temperature
values on the kelvin scale.
F. Formula for conversion:
Conversion Practice
1) 100°C = __________ K 4) 293 K = __________°C
2) 0°C = __________ K 5) 333 K = __________°C
3) 25°C = __________ K 6) 303 K = __________°C
4) 27°C = __________ K 7) 223 K = __________°C

Unit 1: Matter and Measurement Page 12 Chapters 1, 2, 3
Representing Data A. ____________: a visual display of data that helps to reveal _______________
B. A _______________ graph shows parts, often as percentages, of a fixed whole (100%).
C. A __________ graph shows how a quantity varies with specific factors.
D. A ________ graph, the most useful in chemistry, consists of points representing the intersection of
data for two variables: the independent on the ____-axis and the dependent on the ____-axis.
1. _______________ plot: points are plotted based upon the values for the independent and
dependent variables
2. ________ ______ line: does not have to touch all data points; drawn with as many points above
the line as below it
3. Straight line indicates a _______________ relationship.
A _______________ slope (line rises to the right) indicates that the dependent variable
_______________ with an increase in the independent variable.
A _______________ slope (line sinks to the right) indicates that the dependent variable
_______________ with an increase in the independent variable.
E. Creating a line graph requires specific steps.
1. General guidelines: _____________________________________________________________
_____________________________________________________________________________.
2. Calculate the __________ for both the independent and dependent variables by taking the
_______________ between the highest and lowest value for each. The _____________________
is graphed on the longest side of the graph paper, determining whether to use the paper in the
_____________________________________________________________________________.
3. Data collected for the independent variable usually appears in the _______________ column of
the data table and is graphed on the __________. Data for the _______________ variable is in
the righthand column of the data table and is graphed on the __________. Both axes should be
labeled with the ____________________ followed by the appropriate ________ in parentheses.
4. The ____________ is the value represented by one box on the graph paper and can vary for each
graph. The scale should be set as ____________ as possible based upon the size of the graph
paper, but it usually equals ______________________________. Scales for the x- and y-axes do
not have to be the same.

Unit 1: Matter and Measurement Page 13 Chapters 1, 2, 3
5. Mark the __________________ on each axis evenly, such as every line or every other line. Both
axes do not have to be marked the same, but each should be marked ____________________.
Increments are usually marked by ______________________________ and must make sense in
terms of the __________.
6. Only one __________________ (upper right) of a graph is used and should be drawn to take up
as much space on the graph paper as possible. Do not extend axes below or to the left of the
origin and do not draw __________________. The intersection of axes (____________) is the
starting point for both axes, but it does not have to be ________ and does not have to be the
__________________ for both axes.
7. Draw a ________ representing the intersection of the x- and y-axes for each data value in the
data table. The points must remain _______________ once the line is drawn but are only labeled
with their ____________________ if the labeling does not clutter the graph.
8. Unless otherwise instructed, all lines should be drawn as ________________________, which
may be ____________________________. Do not draw ____________ on the ends of lines.
9. The __________ of the graph should be written toward the top of the graph in any available
space; do not allow the title to obscure the lines in any way. The title should use the __________
________________________ for the x- and y-axes in the format _________________________
________________________ to show the dependence of the dependent variable on the
independent variable.
Graphing Practice
A sample of gas was collected at 100°C and then cooled. Changes in volume were recorded in the
following data table. Graph the data shown on the graph paper provided on the next page.
Temperature (°C) Volume (mL)
100 315
80 300
60 290
40 280
30 250
20 245
10 240
0 235
–10 225
–30 200

Unit 1: Matter and Measurement Page 14 Chapters 1, 2, 3
Unit 1: Matter and Measurement Page 15 Chapters 1, 2, 3
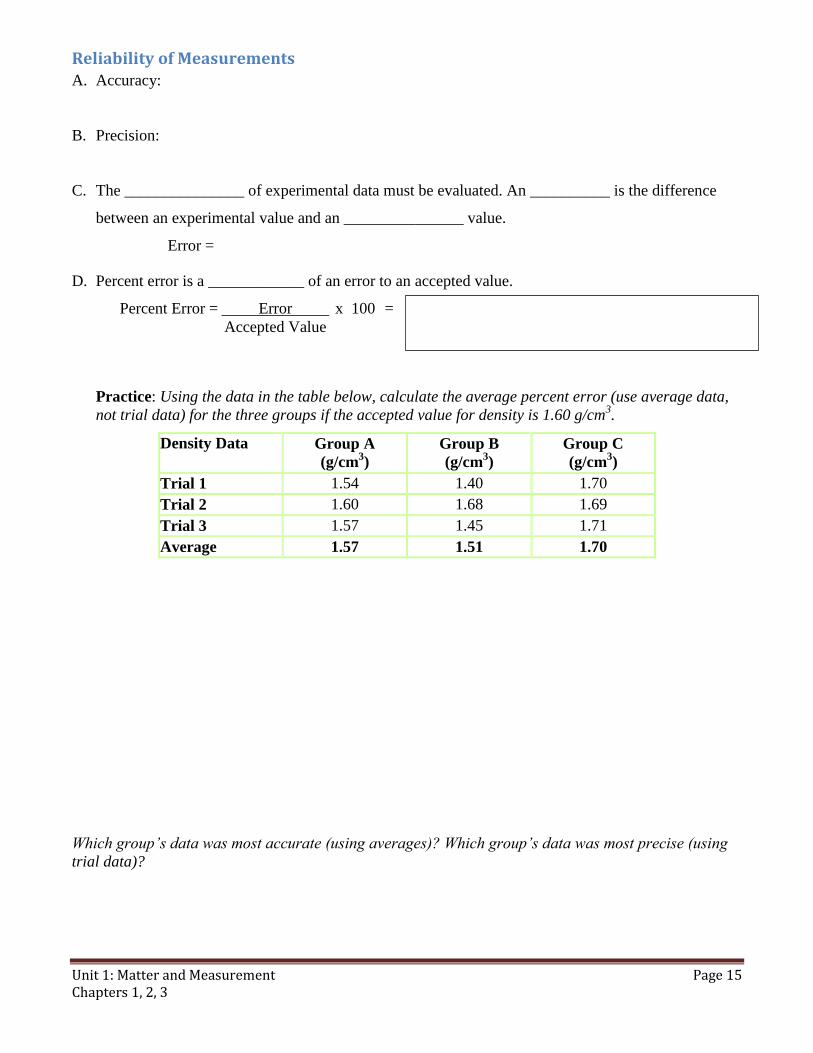
Reliability of Measurements A. Accuracy:
B. Precision:
C. The _______________ of experimental data must be evaluated. An __________ is the difference
between an experimental value and an _______________ value.
Error =
D. Percent error is a ____________ of an error to an accepted value.
Percent Error = Error x 100 =
Accepted Value
Practice: Using the data in the table below, calculate the average percent error (use average data,
not trial data) for the three groups if the accepted value for density is 1.60 g/cm3.
Density Data Group A
(g/cm3)
Group B
(g/cm3)
Group C
(g/cm3)
Trial 1 1.54 1.40 1.70
Trial 2 1.60 1.68 1.69
Trial 3 1.57 1.45 1.71
Average 1.57 1.51 1.70
Which group’s data was most accurate (using averages)? Which group’s data was most precise (using
trial data)?
Unit 1: Matter and Measurement Page 16 Chapters 1, 2, 3
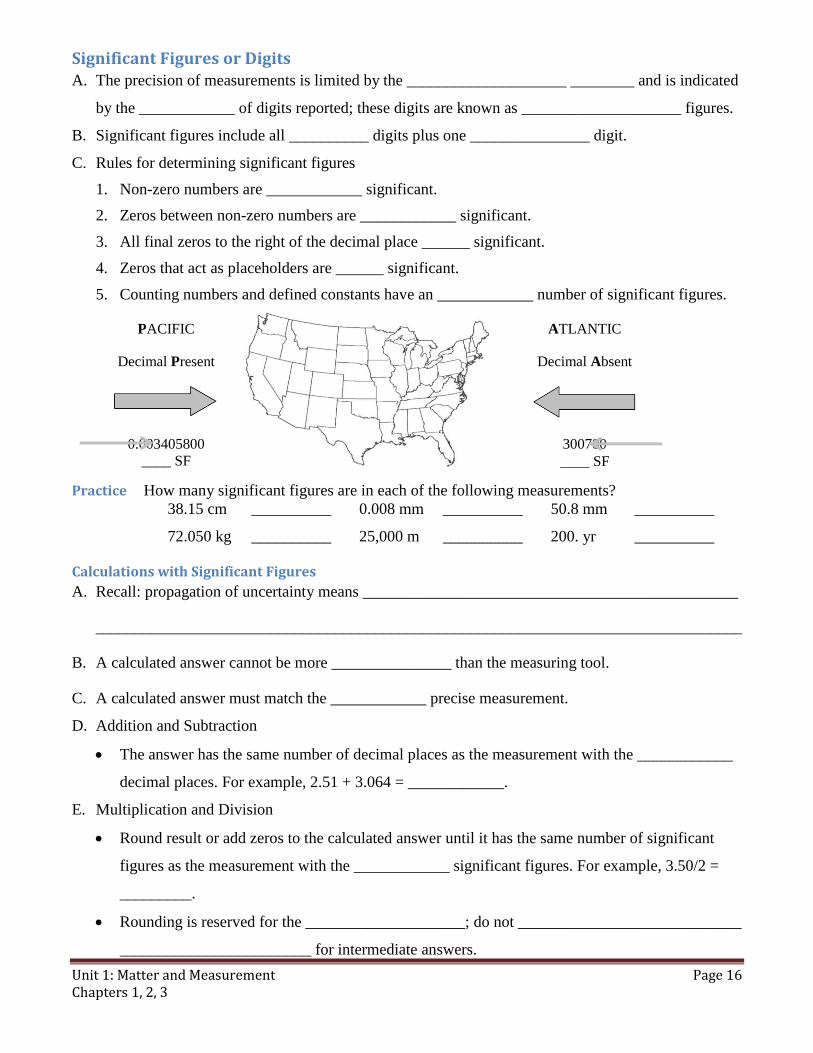
Significant Figures or Digits A. The precision of measurements is limited by the ____________________ ________ and is indicated
by the ____________ of digits reported; these digits are known as ____________________ figures.
B. Significant figures include all __________ digits plus one _______________ digit.
C. Rules for determining significant figures
1. Non-zero numbers are ____________ significant.
2. Zeros between non-zero numbers are ____________ significant.
3. All final zeros to the right of the decimal place ______ significant.
4. Zeros that act as placeholders are ______ significant.
5. Counting numbers and defined constants have an ____________ number of significant figures.
Practice How many significant figures are in each of the following measurements?
38.15 cm __________ 0.008 mm __________ 50.8 mm __________
72.050 kg __________ 25,000 m __________ 200. yr __________
Calculations with Significant Figures
A. Recall: propagation of uncertainty means _______________________________________________
_________________________________________________________________________________
B. A calculated answer cannot be more _______________ than the measuring tool.
C. A calculated answer must match the ____________ precise measurement.
D. Addition and Subtraction
The answer has the same number of decimal places as the measurement with the ____________
decimal places. For example, 2.51 + 3.064 = ____________.
E. Multiplication and Division
Round result or add zeros to the calculated answer until it has the same number of significant
figures as the measurement with the ____________ significant figures. For example, 3.50/2 =
_________.
Rounding is reserved for the ____________________; do not ____________________________
________________________ for intermediate answers.
PACIFIC
Decimal Present
0.003405800
____ SF
ATLANTIC
Decimal Absent
300700
____ SF