unique challenges of clay binders in a pelletised chromite pre
TRANSCRIPT

Unique challenges of clay binders in a pelletised chromite pre-reduction
process – a case study
Ernst L.J. Kleynhans
B.Sc. Industrial Science
Dissertation submitted in partial fulfilment of the
requirements for the degree Master of Science in
Chemistry at the Potchefstroom Campus of the
North-West University
Supervisor: Dr JP Beukes
Co-Supervisor: Dr PG van Zyl
November 2011
Potchefstroom

ACKNOWLEDGEMENTS i
ACKNOWLEDGEMENTS
Since we find ourselves fashioned into all these excellently formed and
marvellously functioning parts in Christ’s body, let’s just go ahead and be what
we were made to be. What you are is God’s gift to you; what you do with
yourself is your gift to God
Romans 12:5 (Msg), Danish proverb
It is my honour and privilege to acknowledge and thank the following people:
My supervisor, Dr. Paul Beukes and co-supervisor, Dr. Pieter van Zyl
Prof. C.A. Strydom, Prof. M. Coetzee, Dr. L.R Tiedt
Paul Kestens, Jabu Langa
My parents, Ernst and Yvette, my family and Anzel, Thank you for your love,
support, inspiration and encouragement

CONTENTS ii
CONTENT
LIST OF FIGURES vi
LIST OF TABLES xi
ABSTRACT 1
OPSOMMING 3
GRAPHICAL OUTLINE OF THE DISSERTATION 5
CHAPTER 1: MOTIVATION AND OBJECTIVES 6
1.1. Problem statement and motivation 6
1.2. Objectives 10
CHAPTER 2: LITERATURE STUDY 11
2.1. General information on chromium 11
2.1.1. Origin and properties 11
2.1.2. Use of chromium 13
2.2. South Africa’s ferrochrome industry 14
2.2.1. Economic and market considerations 14
2.2.2. Electricity supply 17
2.2.3. Chromite ore resources 19
2.2.4. Ferrochromium production 20

CONTENTS iii
2.3. Core processes and techniques 23
2.3.1. Mining and beneficiation of chromite ores 23
2.3.2. Ferrochromium production 26
2.4. Chromite pre-reduction 28
2.4.1. Extent of pre-reduction technology commercialisation 28
2.4.2. Strategic advantages of chromite pre-reduction 31
2.4.3. Fundamental aspects of chromite pre-reduction 33
2.4.4. Factors influencing the pre-reduction of chromite 41
2.4.4.1. Effect of time and temperature 41
2.4.4.2. Effects of additives on pre-reduction 42
2.5. Clay binders 45
2.5.1. Basic principles of agglomeration 45
2.5.2. Structure and chemistry of clay binders 47
2.5.2.1. Clay minerals, major constituents of raw clay materials 47
2.5.2.2. Smectites, mineral group of Bentonite 48
2.5.2.3. Palygorskite, mineral group of Attapulgite 55
CHAPTER 3: MATERIALS AND METHODS 57
3.1. Materials 57
3.2. Methods 58
3.2.1. Chemical and surface analysis 58
3.2.1.1. Scanning Electron Microscopy and Energy Dispersive
X-ray Spectroscopy 58

CONTENTS iv
3.2.1.2. Inductively Coupled Plasma Spectrometry 59
3.2.1.3. Proximate analysis 61
3.2.1.4. Elemental analysis 62
3.2.1.5. X-ray Diffraction 62
3.2.2. Sample material preparation 63
3.2.3. Pelletising 64
3.2.4. Pre-reduction and oxidative sintering procedure 65
3.2.5. Abrasion resistance testing 67
3.2.6. Compressive strengths testing 67
3.2.7. Thermo-Mechanical Analysis 69
3.2.8. Ash Fusion Temperature Analysis 69
3.2.9. Analysis of pre-reduction 70
3.3. Statistical handling of data 72
CHAPTER 4: RESULTS AND DISCUSSION 74
4.1. Raw material characterisation 74
4.2. Characterisation of typical industrial pellets 77
4.3. Compressive strength 81
4.4. Abrasion resistance 83
4.5. XRD and Ash Fusion Temperature Analysis 84
4.6. Thermo-Mechanical Analysis 90
4.7. Pellet pre-reduction 92
4.8. Conclusions 95

CONTENTS v
CHAPTER 5: PROJECT EVALUATION AND FUTURE
PERSPECTIVES 99
5.1. Project evaluation 99
5.2. Future perspectives 101
5.3. Final remarks 102
BIBLIOGRAPHY 104

LIST OF FIGURES vi
LIST OF FIGURES
CHAPTER 2: LITERATURE STUDY
Figure 2–1: World production in million metric tons per annum
(MMTPA) for 1990-2009 (Ideas 1st Research, 2010) 15
Figure 2–2: Stainless steel (SS) and FeCr price indexes (CRU, 2010; Ideas
1st Research, 2010) 16
Figure 2–3: Monthly average exchange rates: South African Rand (ZAR)
per U.S. Dollar (US$) (Pacific exchange rate service, 2011) 16
Figure 2–4: Electricity demand overview for South Africa (Basson et al.,
2007; Pfister, 2006) 18
Figure 2–5: Eskom’s tariff adjustment as a percentage of consumer
price index (CPI) using 1990 as a basis (Eskom, 2009) 19
Figure 2–6: High carbon charge grade ferrochromium production
2000-2009 (ICDA, 2010) 21
Figure 2–7: General process flow sheet for chromite ore beneficiation
(Murthy et al., 2011) 24
Figure 2–8: A flow diagram adapted by Beukes et al. (2010) from
Riekkola-Vanhanen (1999), indicating the most common
process steps utilised for FeCr production in South Africa 26
Figure 2–9: Net energy requirement for the production of 1 ton of FeCr
as a function of the degree of pre-reduction achieved and
charging temperature (Takano et al., 2007; Niayesh &
Fletcher, 1986) 33

LIST OF FIGURES vii
Figure 2–10: The relationship between reduction and metallisation,
based on South African LG-6 chromite treated at 1200 °C
(Dawson & Edwards, 1986) 36
Figure 2–11: Standard free energies of reduction of metal oxides with
carbon and carbon monoxide (Niemelä et al., 2004) 38
Figure 2–12: Schematic representation of the reduction mechanism of
chromite (Ding & Warner, 1997b) 40
Figure 2–13: The effect of time and temperature on the rate of chromite
reduction (Barnes et al., 1983) 41
Figure 2–14: The effect of various salt additives (1 wt% addition) on the
reduction rate of Russian chromium ore at 1200 °C
(Katayama et al., 1986) 44
Figure 2–15: Magnitudes of bond strengths for various classes of
interparticle bonds in pellets: (A) van der Waals, magnetic,
or electrostatic forces; (B) capillary forces from the liquid
phase; (C) adhesional and cohesional forces; (D) mechanical
interlocking; (E) solid bridges formed by sintering or
crystallisation of dissolved materials (Eisele & Kawatra,
2003; Sastry, 1996a; Sastry, 1996b) 46
Figure 2–16: Structure of the smectite crystal (Murry, 1991; Grim, 1968) 49
Figure 2–17: Effect of Ca2+ ions in water on the expansion of sodium
bentonite. (A) Water contains no ions, bentonite expands
freely. (B) Calcium in the water can displace sodium and
increase the bonding between bentonite platelets so that
the expansion is reduced (Kawatra & Ripke, 2003) 50

LIST OF FIGURES viii
Figure 2–18: Conventional view of how bentonite platelets bind mineral
grains in a pellet. Platelets are initially dispersed in the
liquid, and the platelets bond to the mineral grains and each
other as the liquid dries. Bonding is enhanced by the
electrostatic attraction between the platelet faces (which
have a negative charge) and the platelet edges (which are
positively charged) (Van Olphen, 1987) 52
Figure 2–19: Two bonding mechanisms of bentonite on ferrous ore
particles. Diagrams A and B show the dispersion
mechanism. Diagram C shows the fibre mechanism
(Kawatra & Ripke, 2001) 53
Figure 2–20: Behaviour of bentonite grains that are not completely
dispersed in water. The grain expands when moistened and
the platelets are lubricated by the interplatelet water.
Under shear stress, the grain can then spread into a long
fibre in an effect similar to spreading a deck of cards across
a table (Eisele & Kawatra, 2003; Kawatra & Ripke, 2001) 54
Figure 2–21: Scanning electron micrographs of silica sand (A) and of the
same sand after bonding with bentonite (B). The bentonite
formed strands stretching over and between grains, which
is consistent with the bonding mechanism described by
Kawatra and Ripke (2001). (A) Sand grains, AFS Fineness
No. 55, taken at 250 times magnification. (B) Sand with
6.0% sodium bentonite, mixed 1.5 minutes with 3.2% water,
taken at 250 times magnification (Wenninger & Green,
1970) 54
Figure 2–22: Structure of palygorskite (attapulgite) (Murry, 1991) 55

LIST OF FIGURES ix
CHAPTER 3: MATERIALS AND METHODS
Figure 3-1: Temperature profiles used in pre-reduction and oxidative
sintering experiments 66
Figure 3-2: Graphic representation of compression strength test 68
Figure 3-3: An example of a typical compressive strength graph 68
CHAPTER 4: RESULTS AND DISCUSSION
Figure 4–1: SEM micrograph images of the attapulgite clay (4‒1A),
bentonite clay (4‒1B) and chromite ore (4‒1C) taken at 200
times magnification as well as the anthracite (4‒1D) taken
at 60 times magnification 75
Figure 4–2: Partial SEM micrograph image taken at 45 times
magnification of a polished section of an industrial pre-
reduced pellet split in two (4‒2A), a micrograph of an
unpolished section zoomed in (650 times) on the
transitional zone and showing part of the core area (4‒2B),
a micrograph taken at 550 times magnification of the outer
layer of a polished section (4‒2C), a micrograph taken at
300 times magnification of the inner core of an unpolished
section (4‒2D) and micrographs of the surface of an
industrial pre-reduced pellet taken at 800 times (4‒2E) and
650 times (4‒2F) magnification 78
Figure 4–3: Compressive strength (kN) of pre-reduced (primary axis)
and oxidative sintered (secondary axis) pellets for the
temperature profile up to 1250 °C and hold time of 20 min 81

LIST OF FIGURES x
Figure 4–4: Compressive strength (kN) of pre-reduced (primary axis)
and oxidative sintered (secondary axis) pellets for the
temperature profile up to 1300 °C with no hold time 82
Figure 4–5: Abrasion resistance strength indicated in weight percentage
remaining above 9.5 mm versus abrasion time (note error
bars were removed, since they were smaller than the
markers) 84
Figure 4–6: Qualitative XRD analysis of the attapulgite clay 86
Figure 4–7: Qualitative XRD analysis of the bentonite clay 87
Figure 4–8: Average percentage dimensional changes of in-situ pre-
reduced of pellets as a function of temperature for both
clays investigated at 3.5 and 10% additions 91
Figure 4–9: Percentage pre-reduction achieved as function of clay
content, for both case study clays with both temperature
profiles utilised 92

LIST OF TABLES xi
LIST OF TABLES
CHAPTER 2: LITERATURE STUDY
Table 2–1: The main commercial grades of ferrochromium according to
ISO-standard 5448-81 (Lyakishev & Gasik, 1998; Downing et
al., 1986) 14
Table 2–2: Production capacity of South African FeCr producers
adapted from Jones (2010) by Beukes et al. (2011) 22
CHAPTER 3: MATERIALS AND METHODS
Table 3-1: Microwave digestion reagents and their ratios according to
sample matrix (EPA, 1996) 60
Table 3-2: Mixing ratios of the recipes for pre-reduced and oxidative
sintered pellet mixtures 64
Table 3-3: Critical values for the rejection of quotient Q (Dean & Dixon,
1951) 73
CHAPTER 4: RESULTS AND DISCUSSION
Table 4–1: Chemical characterization of the different raw materials
utilised, with various techniques 76
Table 4–2: SEM-EDS analysis performed on selected areas of the
industrial pre-reduced pellet 79
Table 4–3: Quantitative XRD analysis of the attapulgite and bentonite
clays utilised 85
LIST OF TABLES xii
Table 4–4: Ash fusion temperatures for the attapulgite and bentonite
clays utilised 89

ABSTRACT 1
ABSTRACT
As a result of increasing cost, efficiency and environmental pressures
ferrochrome producers strive towards lower overall energy consumption.
Increases in local electricity prices have placed particular pressure on South
African ferrochrome producers. Pelletised chromite pre-reduction is likely the
currently applied ferrochrome production process option with the lowest
specific electricity consumption. In this process fine chromite, together with a
carbonaceous reductant and a clay binder is milled, pelletised and pre-reduced.
In this dissertation it is demonstrated that the functioning of the clay binder in
this process is not as straightforward as in conventional metallurgical
pelletisation processes, since the cured pre-reduced pellets are characterised by
an oxidised outer layer and a pre-reduced core. Conventional performance
characteristics of clay binders (e.g. compressive strength and abrasion
resistance) therefore have to be evaluated in both oxidative sintering and
reducing environments. Two clay samples, i.e. attapulgite and bentonite, were
obtained from a local ferrochrome producer and investigated within the context
of this study. Results indicated that the compressive and abrasion resistance
strengths of oxidative sintered pellets for both clays were substantially better
than that of pre-reduced pellets. Thus, although the objective of the chromite
pre-reduced process is to achieve maximum pre-reduction, the strength of pre-
reduced chromite pellets is significantly enhanced by the thin oxidised outer
layer. The strength of the bentonite-containing pellets was found to be superior
in both pre-reducing and oxidative sintering environments. This is significant,
since the attapulgite clay is currently the preferred option at both South African
ferrochrome smelting plants applying the pelletised chromite pre-reduction
process. Although not quantitatively investigated, thermo-mechanical analysis
indicated that the hot strength of the attapulgite pellets could be weaker than

ABSTRACT 2
the bentonite-containing pellets. The possible effects of clay binder selection
on the level of pre-reduction were also investigated, since it could have
substantial efficiency and economic implications. For both case study clays
investigated, higher clay contents resulted in lower pre-reduction levels. This
has relevance within the industrial process, since higher clay contents are on
occasion utilised to achieve improved green strength. The average pre-
reduction of the bentonite-containing pellets were also consistently higher than
that of the attapulgite-containing pellets. Again, this is significant, since the
attapulgite clay is currently the preferred option. In general the case study
results presented in this dissertation indicated that it is unlikely that the
performance of a specific clay binder in this relatively complex process can be
predicted; based only on the chemical, surface chemical and mineralogical
characterisation of the clay.
Keywords: Chromite, Ferrochrome, Pre-reduction, Pelletisation, Clay binder,
Attapulgite, Bentonite

OPSOMMING 3
OPSOMMING
As gevolg van stygende koste, asook verhoogde druk om effektiwiteit te
verbeter en omgewingsimpakte te minimaliseer streef ferrochroomprodusente
daarna om hul algehele energieverbruik te verminder. Stygende
elektrisiteitspryse in Suid Afrika het veral groot druk op die plaaslike
ferrochroomprodusente geplaas. Tans is die pre-reduksie van chromiet
waarskynlik die ferrochroomproduksieproses met die laagste spesifieke
energieverbruik. In hierdie proses word fyn chromiet saam met ʼn
koolstofreduktant en ʼn kleibinder vermaal, geagglomereer om sfeeragtige
agglomerate (“pellets”) te vorm en daarna geprereduseer.
In hierdie verhandeling is daar bewys dat die werking van ʼn kleibinder in ʼn pre-
reduksie proses nie so eenvoudig is as in konvensionele metallurgiese
agglomerasieprosesse nie, aangesien die verharde geprereduseerde
agglomerate gekenmerk word deur ‘n geoksideerde buitenste laag en ‘n
geprereduseerde kern. Dus moet konvensionele vereistes waaraan ‘n kleibinder
moet voldoen (bv. druksterkte en slytweerstand) in beide oksidatiewe en
reduserende omgewings geëvalueer word. Twee kleimonsters, naamlik
attapulgiet en bentoniet, is vanaf ‘n plaaslike ferrochroomprodusent verkry en
binne die konteks van hierdie studie ondersoek. Resultate het aangetoon dat
die druksterkte en slytweerstand van oksidatief gesinterde agglomerate van
albei kleie aansienlik sterker was as dié van geprereduseerde agglomerate. Dus,
al is die doel van die industriële pre-reduksieproses om die maksimum pre-
reduksie te bereik, word die sterkte van geprereduseerde chromiet agglomerate
aansienlik verbeter deur die dun geoksideerde buitenste laag. Daar is ook
gevind dat die druksterkte en slytweerstand van agglomerate wat bentoniet
bevat het superieur was in beide oksidatiewe en reduserende omgewings. Dit is
betekenisvol omdat beide Suid Afrikaanse ferrochroomsmelters wat gebruik

OPSOMMING 4
maak van die pre-reduksie proses tans attapulgiet as binder verkies. Alhoewel
die sterkte van geprereduseerde agglomerate by hoë temperature nie
kwantitatief ondersoek kon word nie het termo-meganiese analises wel getoon
dat agglomerate wat attapulgiet bevat moontlik swakker is as agglomerate wat
bentoniet bevat. Die effek van kleibinder-seleksie op die vlak van pre-reduksie
wat behaal kon word is ook ondersoek, aangesien dit aansienlike effektiwiteits-
en ekonomiese implikasies tot gevolg kan hê. Vir albei kleie het resultate
aangetoon dat ‘n hoër klei-inhoud die vlak van pre-reduksie verlaag. Dit is
relevant tot die industriële proses, omdat die klei-inhoud somtyds verhoog
word om die groensterkte van nuutgevormde agglomerate te verbeter. Die
gemiddelde vlak van pre-reduksie van agglomerate wat bentoniet bevat het was
konstant hoër as agglomerate wat attapulgiet bevat het. Weereens is dit
betekenisvol, omdat attapulgiet tans as binder verkies word. Die resultate van
hierdie gevallestudie toon aan dat dit onwaarskynlik is dat die prestasie van ʼn
spesifieke kleibinder in hierdie relatief komplekse proses voorspel kan word
deur slegs die chemiese, oppervlak-chemiese en mineralogiese karakterisering
van die klei te oorweeg.
Sleutelwoorde: Chromiet, Ferrochroom, Pre-reduksie, Agglomerasie,
Klei binder, Attapulgite, Bentonite

GRAPHICAL OUTLINE OF THE DISSERTATION 5
GRAPHICAL OUTLINE OF THE DISSERTATION

MOTIVATION AND OBJECTIVES 6
CHAPTER 1: MOTIVATION AND OBJECTIVES
1.1. Problem statement and motivation
Chromium is a versatile element that is used in numerous applications in the
metallurgical, chemical and refractory industries. It is one of the most
fundamentally important metals in the modern steel industry, with no adequate
replacement for it in corrosion, oxidation-resistant or high temperature alloys.
This, combined with the fact that geographically chromium ore (chromite)
reserves are very limited, chromium is regarded as a commodity of critical and
strategic importance (Murthy et al., 2011; Ideas 1st Research, 2010; Akyüziü &
Eric, 1992).
Mined chromite ore, containing chromium in the characteristic spinel mineral
form, is the only commercially viable source of new chromium units (Murthy et
al., 2011; Beukes et al., 2010; Cramer et al., 2004). South Africa holds
approximately 75% of the world’s exploitable chromite resources (Lungu, 2010;
Basson et al., 2007; Basson et al., 2007; Cramer et al., 2004; Riekkola-Vanhanen,
1999; Cowey, 1994; Howat, 1986), with other smaller but substantial deposits
occurring in Kazakhstan, Zimbabwe, India and Finland (Papp, 2009a).
Approximately 90-95% of mined chromite ore is consumed by the metallurgical
industry for the production of different grades of ferrochrome (FeCr). The

MOTIVATION AND OBJECTIVES 7
stainless steel industry consumes 80-90% of FeCr produced, primarily as high-
carbon or charge grade (Murthy et al., 2011; CRU, 2010; ICDA, 2010). Stainless
steel markets have been growing at a rate of 5% per year on average. This
trend is predicted to continue and likely to increase to approximately 8% in
2020, thus further increasing the demand for FeCr. FeCr production levels of 7
million t/y were reached in 2007 and 2008 (ICDA, 2010; Ideas 1st Research,
2010) and are predicted to double by 2020 (CRU, 2010; ENRC, 2008; Holappa &
Xiao, 2004).
Most FeCr is produced by means of smelting chromite in submerged arc
furnaces (SAF) in the presence of carbonaceous reducing agents (Singh &
Mohan Rao, 2008; Sing et al., 2007; Weber & Eric, 2006; Akyüziü & Eric, 1992).
Historically, the use of fine chromite (usually < 6mm) in this process is limited,
since fine materials increases the tendency of the surface layer of the SAF to
sinter. This traps evolving process gas, which can result in so-called bed
turnovers and blowing of the furnace that could have disastrous consequences
(Beukes et al., 2010; Riekkola-Vanhanen, 1999). The majority of South African
chromite ore is relatively friable (Beukes et al., 2010; Glastonbury et al., 2010;
Cramer et al., 2004; Gu & Wills, 1988), thus an agglomeration (e.g. pelletisation)
step is required, prior to feeding it into the SAF (Beukes et al., 2010; Singh &
Mohan Rao, 2008; Pei & Wijk, 1993).
Internationally South Africa is the leading producer of FeCr (ICDA, 2010). There
are currently fourteen separate FeCr smelter plants in South Africa, with a
combined production capacity of 4.7 million t/y (Beukes et al., 2011; Jones,
2010). The abundant chromite resources and the relatively low historical cost of
electricity have contributed to South Africa’s dominant position in the FeCr
industry (Basson et al., 2007). However, South Africa’s electricity demand has
caught up with electricity-generating capacity (Baker, 2006). This has led to a
dramatic increase in electricity prices that is set to continue for the foreseeable

MOTIVATION AND OBJECTIVES 8
future (Basson et al., 2007). In the period 1980 to 2005 South Africa's nominal
electricity price increased steadily at a rate of roughly 0.58 cents/kWh per year
(NERSA, 2009b). According to statistic from the National Energy Regulator of
South Africa (NERSA) the nominal price of electricity increased by 174% at a rate
of about 4.7 cents/kWh per year from 19 cent/kWh in 2007 to 33.14 cent/kWh
in 2010 (NERSA, 2009a; NERSA, 2009b). NERSA has since granted Eskom a
three-year rate increase resulting in electricity costs of 41.57 cents/kWh for
2010/11, 52.30 cents/kWh for 2011/12 and 65.85 cents/kWh for 2012/13
(Eskom, 2011; NERSA, 2009a). Considering that electricity consumption is the
single largest cost component in FeCr production (Daavittila et al., 2004), the
afore-mentioned cost increases are very significant. However, the pressure on
South African FeCr producers is not unique, since globally lower specific energy
consumption (MWh/t FeCr) and a decreased carbon footprint have become
driving factors.
Another cause for concern that has emerged out of the above-mentioned
electrical generation capacity limitations is the export of unbeneficiated (raw)
chromite ore, in particular to China (Creamer, 2011). This could place South
African FeCr producers under additional production cost pressure. When
chromite is converted locally into FeCr, significant value addition takes place
and employment opportunities are created. Considering South Africa’s high
unemployment rate, the export of large amounts of raw chromite ore will
certainly have a negative impact on South Africa’s socioeconomic circumstances
(Creamer, 2011; Ideas 1st Research, 2010).
Historically, the specific energy consumption of conventional SAF was 3.9-4.2
MWh/t FeCr (Naiker & Riley, 2006; Weber & Eric, 2006). Several processes have
been developed to minimise energy consumption (Outotec, 2009; Pei & Wijk,
1993; Niayesh & Fletcher, 1986). However, the technology that is of interest to
this study is the pre-reduction of chromite (Takano et al., 2007; Ding & Warner,
MOTIVATION AND OBJECTIVES 9
1997a; Lekatou & Walker, 1997; Dawson & Edwards, 1986), which is applied at
two FeCr smelter plants in South Africa (Beukes et al., 2010; McCullough et al.,
2010; Naiker, 2007; Naiker & Riley, 2006). In this process fine chromite ore, a
clay binder and a carbon reductant are dry-milled, pelletised and pre-heated
before being fed into a rotary kiln where the chromite is partially pre-reduced.
The pre-reduced pellets are then charged hot, immediately after exiting the kiln,
into closed SAF (Beukes et al., 2010; Naiker, 2007). The advantages of pelletised
pre-reduced feed are observed in all aspects of operation, i.e. ability to
consume fine chromite, much lower specific energy consumption of
approximately 2.4 MWh/t, chromium recoveries in the order of 90% and the
ability to produce a low silicon containing FeCr product (McCullough et al.,
2010; Naiker, 2007; Takano et al., 2007; Botha, 2003). It can therefore only be
assumed that this process option will become more commonly applied, as
pressure on energy consumption and environmental consciousness increase.
In the pelletised chromite pre-reduction process clay is added to the raw
material mixture to act as a binder for the green pellets (newly formed) and to
aid in the cured strengths of the pelletised agglomerates. This is not unique,
since clay binders also play a similar role in other chromite pelletisation
processes. However, due to the unique nature of the pelletised chromite pre-
reduction process, there are also other aspects that should be considered
during clay selection. In this case study, these unique process considerations of
clay binders in the chromite pre-reduced process are highlighted and
demonstrated utilising two case study clays.

MOTIVATION AND OBJECTIVES 10
1.2. Objectives
The specific objectives of this case study are as follows:
i) The compilation of a comprehensive literature survey in which the
importance of the FeCr industry in South Africa, the core processes
utilised by this industry, the significance of chromite pre-reduction
and a general overview of clay binders utilised in this industry are
reported.
ii) Obtaining and characterisation of typical raw material utilised in the
production of pre-reduced pelletised feed, as well as characterisation
of typical industrially produced pre-reduced pellets using appropriate
techniques.
iii) Identifying unique process performance requirements that a clay
binder has to fulfil in a pelletised chromite pre-reduction process,
from the above-mentioned industrially produced pre-reduced pellet
characterisation.
iv) Designing and conducting experimental procedures to test clay
performance of two case study clays in terms of the process
performance requirements identified in objective (iii).
v) Analysing the experimental results obtained and making
recommendations with regard to the selection of clay binders utilised
in the pelletised chromite pre-reduction process.
vi) Making recommendations with regards to further research work in
this field.

LITERATURE STUDY 11
CHAPTER 2: LITERATURE STUDY
2.1. General information on chromium
2.1.1. Origin and properties
Chromium is the ninth most abundant compound in the earth’s crust and exists
in various mineral forms; however chromite is the only source that is
economically feasible to exploit commercially (Roza, 2008; IETEG, 2005; Nriagu
& Nieboer, 1988). Chromite ore that is commercially produced is found in South
Africa, India, Kazakhstan, Turkey, Oman, Russia, Brazil, Finland, Zimbabwe,
Pakistan, Australia, Albania, China and Iran. Chromite deposits are also found in
many other countries like Madagascar, Vietnam, United Arab Emirates, Sudan,

LITERATURE STUDY 12
Cuba, the Philippines, Afghanistan, Greece and the USA (Papp, 2011; Papp,
2009a; Papp, 2008).
Pure chromium has a bluish-silver colour. It is a lustrous, hard but brittle,
malleable metal and can take a high polish. It is odourless and tasteless.
Chromium has a high melting and boiling point, 1907 °C and 2671 °C
respectively. It has a density near room temperature (20 °C) of 7.15 g/cm3 and a
liquid density of 6.3 g/cm3 at its melting point. The heat of fusion of chromium
is 21 kJ/mol, its heat of vaporisation is 339.5 kJ/mol and it has a specific heat
capacity of 23.35 J/mol.K at 25 °C (Lide, 2009; Roza, 2008; IETEG, 2005).
Chromium is a member of the transition metals. The oxidation states of
chromium range between Cr2- and Cr6+, but it most commonly occurs as Cr0,
Cr2+, Cr3+and Cr6+. Chromium in the 2+ oxidation state is, however, rather
unstable and is rapidly oxidised to the 3+ state, thus only the trivalent and
hexavalent forms are found in nature. Trivalent chromium is of nutritional
importance for a large range of organisms. In trace amounts it influences sugar
and lipid metabolism in humans and a shortage is suspected to cause a disease
called chromium deficiency. Chromium is found in humans at 30 ppb by body
mass. In contrast, airborne hexavalent chromium is considered to be
carcinogenic (IETEG, 2005; Anon, 1974).
The oxidation potential of hexavalent to trivalent chromium is strong, and it is
highly unlikely that oxidation of the trivalent form could occur in vivo (Anon,
1974). The hexavalent form of chromium is almost always linked to oxygen and
is a strong oxidising agent. The most important chromium ions are chromates
and dichromates. These ions are easily reduced to trivalent chromium
(Schroeder, 1970).
The trivalent state is the most stable and important oxidation state of
chromium. In this state it forms complexes whose ligand exchange rates are

LITERATURE STUDY 13
low. Trivalent chromium forms octahedral complexes of coordination number
six. A large number of these complexes are known. It is because of this kinetic
inertness that these compounds can persist for long periods in solution, even in
conditions that are thermodynamically unstable (Anon, 1974). All hexavalent
chromium compounds except chromium hexafluoride, CrF6, are oxo-
compounds. Acid solutions of dichromate are strong oxidising agents.
Chromium metal resists attack by a wide variety of chemicals at normal
temperatures, but reacts with many of them at high temperatures. It reacts
with several common acids with evolution of hydrogen and it reacts slowly with
diluted sulphuric acid. Chromium is soluble in aqueous hydrogen fluoride,
hydrogen chloride, hydrogen bromide and hydrogen iodide, and forms Cr2+ as
long as air is not present. Chromium resists attack from phosphoric acid and
many organic acids, including formic, citric and tartaric acid. It is, however,
slowly attacked by acetic acid. Chromium is insoluble in nitric acid and aqua
regia. These acids as well as many other oxidising agents like chlorine, bromine,
solutions of hydrochloric acid and chromium oxide make chromium passive and
render it relatively non-reactive. It is also slowly passivated by superficial
oxidation in air. Passive chromium can be made active by a reduction process
such as treatment with hydrogen gas or by immersion in diluted sulphuric acid
while bringing the chromium into contact with zinc below the surface of the
acid. Passive chromium acts somewhat like a noble metal and is not attacked by
mineral acids but it is very active in the non-passive state. The passivation of
chromium is due to the fact that oxygen is absorbed onto the surface that leads
to the formation of an oxide coat (Anon, 1974).
2.1.2. Use of chromium
Different forms of chromium are required for different applications. The
chromite ore produced globally each year is divided into three principal
industrial end-uses, i.e. metallurgical, refractory and chemical applications

LITERATURE STUDY 14
(IETEG, 2005; Anon, 1974). Approximately 90-95% of mined chromite is
consumed by the metallurgical industry for the production of different grades of
FeCr, indicated in Table 2–1. The stainless steel industry consumes 80-90% of
FeCr, primarily as high-carbon or charge grade FeCr (Murthy et al., 2011; CRU,
2010; ICDA, 2010; Abubakre et al., 2007).
Table 2–1: The main commercial grades of ferrochromium according to ISO-standard 5448-81 (Lyakishev & Gasik, 1998; Downing et al., 1986)
% Cr %C %Si %P %S
High Carbon FeCr (HC FeCr) 45-70 4-10 0-10 < 0.05 < 0.10
Medium Carbon FeCr (MC FeCr) 55-75 0.5-4 < 1.5 < 0.05 < 0.05
Low Carbon FeCr (LC FeCr) 55-95 0.01-0.5 < 1.5 < 0.03 < 0.03
Charge grade 53-58 5-8 3-6
2.2. South Africa’s ferrochrome industry
2.2.1. Economic and market considerations
Although this dissertation is for the most part technically orientated, a small
section is devoted to understanding the economic and market considerations
impacting on the local ferrochromium industry.
Chromite ore is mined in over twenty countries, but about 80% of the
production originates from four countries, i.e. during 2007-2009 South Africa
accounted for 37% of the world’s production, with both India and Kazakhstan
accounting for around 16% and Turkey for 8% (ICDA, 2010; Papp, 2009b; Papp,
2008). As previously mentioned (Par. 2.1.2), the majority of chromite is
converted into FeCr, which in turn in mostly consumed for stainless steel
production (CRU, 2010; ICDA, 2010). It is therefore useful to consider the
correlation between chromite, FeCr and stainless steel production volumes.

LITERATURE STUDY 15
Figure 2–1 indicates that there is a direct correlation, with some lags, between
the production volume trends of these commodities.
Figure 2–1: World production in million metric tons per annum (MMTPA) for 1990-2009 (Ideas 1st Research, 2010)
From Figure 2–1 it is obvious that if the demand for stainless steel increases the
demand for FeCr will automatically follow suit. This will either lead to a supply
deficiency and a rise in FeCr prices or an increase in FeCr production, or both.
Figure 2–2 indicates the correlation between the stainless steel and FeCr price
indexes.
The South African Rand exchange rate is a potentially significant factor in the
price of chromite ore and FeCr because South Africa is a leading producer of
these materials (Papp, 2008). South Africa is also the largest and second largest
exporter of platinum and gold respectively, thus it is expected that these two
markets would have a significant influence on South Africa’s currency (Ideas 1st
Research, 2010). Figure 2–3 shows the monthly average South African Rand
(ZAR) per U.S. Dollar (US$) exchange rate (Pacific exchange rate service, 2011).

LITERATURE STUDY 16
From these exchange rate fluctuations the volatility and possible financial effect
on the South African ferrochromium industry are evident.
Figure 2–2: Stainless steel (SS) and FeCr price indexes (CRU, 2010; Ideas 1st Research, 2010)
Figure 2–3: Monthly average exchange rates: South African Rand (ZAR) per U.S. Dollar (US$) (Pacific exchange rate service, 2011)
10.11
7.96
6.30
7.23 7.17
6.93
7.66 7.65
7.53 7.11
5.00
6.00
7.00
8.00
9.00
10.00
11.00
ZAR
per
1 U
S$
ZAR:US$

LITERATURE STUDY 17
Another factor that has a significant impact on the South African FeCr industry is
the availability of suitable reductants. Coal, anthracite, char and coke are the
main sources of carbon (Makhoba & Hurman Eric, 2010). For FeCr production a
reductant with a low ash, low phosphorus and low sulphur content is required
(Ideas 1st Research, 2010; Makhoba & Hurman Eric, 2010; Basson et al., 2007).
Due to the specific properties required, reductant availability is a cause of
concern for FeCr producers. Moreover, there is no regulation within reductant
markets and therefore over-supply or shortages may occur regularly resulting in
enormous price fluctuations. In addition, the steel industry has a major
influence on the dynamics of coking coal prices (Ideas 1st Research, 2010;
Makhoba & Hurman Eric, 2010).
2.2.2. Electricity supply
Electricity supply is also an economic and market consideration and it could
therefore have been discussed in Par. 2.2.1. However, the relevance of it within
the context of this study necessitates a separate discussion thereof.
The electricity demand of South Africa has caught up with its electricity
generating capacity (Baker, 2006). The historic supply-demand overview of
electricity in South Africa up to 2007 is shown in Figure 2–4 (Basson et al., 2007;
Pfister, 2006). From this it is clear that the availability of surplus generation
capacity has significantly been eroded. Realistically it can be expected that this
trend continued beyond 2007, to 2011. The erosion of surplus generation
capacity has led to a dramatic increase in electricity prices, indicated in Figure
2–5, that is set to continue in the foreseeable future (Basson et al., 2007). In
the period 1980 to 2005 the nominal electricity price in South Africa increased
steadily at a rate of roughly 0.58 RSA cents/kWh per year (NERSA, 2009b).
According to statistics from the National Energy Regulator of South Africa
(NERSA), the nominal price of electricity increased by 174% from 2007 to 2010

LITERATURE STUDY 18
(NERSA, 2009a; NERSA, 2009b). NERSA has since granted Eskom a three-year
rate increase resulting in electricity costs of 41.57 RSA cents/kWh for 2010/11,
52.30 RSA cents/kWh for 2011/12 and 65.85 RSA cents/kWh for 2012/13
(Eskom, 2011; NERSA, 2009a). Considering that electricity consumption is the
single largest cost component in FeCr production (Daavittila et al., 2004), the
afore-mentioned cost increases are extremely significant. However, the
pressure on South African FeCr producers is not unique, since globally lower
specific energy consumption (MWh/t FeCr) and a decreased carbon footprint
have become driving factors.
Figure 2–4: Electricity demand overview for South Africa (Basson et al., 2007; Pfister, 2006)
0
5000
10000
15000
20000
25000
30000
35000
40000
45000
1988
1989
1990
1991
1992
1993
1994
1995
1996
1997
1998
199
9
2000
2001
2002
2003
2004
2005
2006
2007
Pe
ak D
em
and
an
d C
apac
ity
(MW
)
Year
Peak Demand
Installed Capacity (MW Sent-out)
Operational Capacity (MW Sent-out)

LITERATURE STUDY 19
Figure 2–5: Eskom’s tariff adjustment as a percentage of consumer price index (CPI) using 1990 as a basis (Eskom, 2009)
2.2.3. Chromite ore resources
The United States Geological Survey (USGS) define shipping-grade chromite ore
as the deposit quantity and grade normalised to 45% Cr2O3. The total world
shipping-grade chromite ore reserves are estimated by the USGS at around 474
million tonnes (Papp, 2008; Basson et al., 2007). According to various sources
South Africa holds from 68% to 80% of the world’s economically viable chromite
ore reserves (Lungu, 2010; Basson et al., 2007; Cramer et al., 2004; Riekkola-
Vanhanen, 1999; Cowey, 1994; Howat, 1986). Geologically the world’s chromite
ore resources are found in either podiform or stratiform deposits. Podiform-
type chromite deposits occur in irregular shapes like pods or lenses, while
stratiform-type chromite deposits occur as parallel seams in large, layered
igneous rock complexes. The layering is regular and there is large lateral
continuity. The largest and best example of this type of deposit is the Bushveld
Igneous Complex (BIC). South Africa’s entire chromite ore resources are located
within the BIC where several chromite seams exist (Cramer et al., 2004). The
0
20
40
60
80
100
120
1994 1996 1999 2002 2005 2007
(%)
Year
Tariff increase
CPI
LITERATURE STUDY 20
economically exploitable seams are the lower group 6 (LG6) with a Cr-to-Fe
(Cr/Fe) ratio of 1.5-2, the middle group 1 and 2 (MG1 and MG2) with a Cr/Fe
ratio of 1.5-1.8 and the upper group 2 (UG2) with a Cr/Fe ratio of 1.3-1.4. The
last of these is not of interest as a source of chromite alone but primarily as a
source of platinum group metals (PGMs). Chromite ores in South Africa are
therefore associated with PGMs. The major reserves of PGMs are the UG2 and
Merensky reefs which are the largest deposits of chromium, vanadium and
platinum in the world (Basson et al., 2007; Cramer et al., 2004; Xiao & Laplante,
2004; Cramer, 2001; Howat, 1986). UG2 chromite ore is gaining acceptance as a
source for charge chrome (ChCr) production with the utilisation of several
technological innovations (Basson et al., 2007). One should take note that
South Africa’s in situ chromites are largely low grade ores (< 45% Cr2O3) with
low Cr/Fe ratios (< 1.6) and are generally brittle. The resulting alloys produced
from these ores are mostly charge grade (ChCr) with a chromium content of
< 55%. There is also a general requirement for agglomeration of the ore to
render it suitable for efficient ChCr production. The production of ChCr with
lower chromium content also influences the transport cost per Cr unit adversely
(Basson et al., 2007).
2.2.4. Ferrochromium production
Since the advent of argon-oxygen decarburisation 50 years ago that triggered
the expansion of South Africa’s FeCr industry, South Africa has become the
world leader in FeCr production by some margin (Basson et al., 2007;
Featherstone & Barcza, 1982). This can be ascribed to an abundance of good
quality raw materials (ore, reductants and fluxes), historically relatively low
electricity costs, adequate infrastructure and reasonably low-cost capital
(Basson et al., 2007). In 2009 South Africa produced around 2.3 million metric
tonnes of the world’s ChCr, the most common production grade. This was
38.92% of the 5.9 million metric tonnes produced world-wide. When

LITERATURE STUDY 21
considering statistics of the International Chromium Development Association
(ICDA) Statistical Bulletin 2010, depicted in Figure 2–6, it is evident that South
Africa’s charge grade FeCr production went down by 7.37% from 46.29% in 2007
to 38.92% in 2009. This can be ascribed to the world economic crisis, as well as
the situation surrounding South Africa’s electricity supply mentioned previously
in Par. 2.2.2. The summarised production capacities of South Africa’s FeCr
smelter plants are shown in Table 2–2 (Beukes et al., 2011; Jones, 2010; Bonga,
2009; Basson et al., 2007).
Figure 2–6: High carbon charge grade ferrochromium production 2000-2009 (ICDA, 2010)
0.00
10.00
20.00
30.00
40.00
50.00
60.00
% o
f W
orl
d p
rod
uct
ion
Year
South Africa
Finland
Kazakhstan
China
India

LITERATURE STUDY 22
Table 2–2: Production capacity of South African FeCr producers adapted from Jones (2010) by Beukes et al. (2011)
Plant Locality Production capacity
(ton/year)
ASA Metals Dilokong Burgersfort 360 000#
Assmang Chrome Machadodorp 300 000
Ferrometals Witbank 550 000
Hernic Ferrochrome Brits 420 000#
International Ferro-Metals Rustenburg-Brits 267 000
Middelburg Ferrochrome Middelburg 285 000
Mogale Alloys Krugersdorp 130 000
Tata Ferrochrome Richards Bay 135 000
Tubatse Ferrochrome Steelpoort 360 000
Xstrata Lydenburg Lydenburg 400 000
Xstrata-Merafe Boshoek Rustenburg-Sun City 240 000
Xstrata-Merafe Lion Steelpoort 364 000*
Xstrata Rustenburg Rustenburg 430 000
Xstrata Wonderkop Rustenburg-Brits 545 000
TOTAL 4 786 000
# Production capacities of these facilities in the original reference (Jones, 2010) were updated by Beukes et al. (2011), since it did not consider relatively recent capacity enlargement projects
* An expansion project for this facility is currently underway and will double its current capacity (Beukes et al., 2011)

LITERATURE STUDY 23
2.3. Core processes and techniques
2.3.1. Mining and beneficiation of chromite ores
Open-cast mining as well as underground mining techniques are used to obtain
raw chromite ore. Specific mining techniques vary widely depending on the
local resources and materials (Gediga & Russ, 2007; Nafziger, 1982).
The purpose of beneficiation is to render the ore physically (granulometry) and
chemically suitable for subsequent treatments. Operations typically serve to
separate and concentrate mineral values from waste materials, remove the
impurities or prepare the ore for further refinement. Beneficiation activities do
not change the mineral values themselves other than by reducing (crushing and
grinding) or enlarging (pelletising and briquetting) particle size to facilitate
further processes. Chromite ore is beneficiated for processing using several
methods. The ore source, end use sector requirements, mineral characteristics
of the ore deposits, gangue mineral assemblage and the degree of
dissemination of constituent minerals determine the beneficiation practices and
methods that are used. A general representation of a chromite ore
beneficiation process is shown in Figure 2–7 and consists of two sections, i.e.
comminution (preparing the material for subsequent unit operations) and
concentration (Murthy et al., 2011; Abubakre et al., 2007).
In the feed preparation section the run-of-mine ore is screened from ±220 mm
to 75 mm. This is followed by a primary and secondary crushing stage
separated by screening to produce an offset of less than 3 mm. The secondary
crushers offset is recycled back and rescreened. The crushed ore is then further
grounded to less than 1 mm. In the concentration section the ore is upgraded
using conventional gravity techniques like spiral concentrators and shaking
tables (Murthy et al., 2011:377).

LITERATURE STUDY 24
Figure 2–7: General process flow sheet for chromite ore beneficiation (Murthy et al., 2011)
Though gravity techniques are well established and widely accepted for the
concentration of chromite ore, such techniques become inefficient and complex
while treating fine size particles of less than 75 µm. Recovery is a concern
particularly in finely disseminated ores due to its inherent complexities. Each
gravity separation technique delivers its maximum efficiency under specific
operating conditions and particle size range (Murthy et al., 2011:377).
Heavy medium and gravity concentration methods are the most commonly used
beneficiation processes. Heavy medium separation is the most economical
method when coarse particles ranging between 10-100 mm need to be treated.
In the case of finer particles, jigs, spirals and shaking tables are used. Spirals
are, however, the most important among gravity concentrators and are
currently the preferred choice. Chrome can be recovered within the range of 80
to 85% when using these processes (Gu & Wills, 1988; Howat, 1986).
Gravity separation methods predominate over flotation techniques (Nafziger,
1982). Flotation is thus not a major method of beneficiation for chromite ores.
In some instances fatty acids, such as oleic acid, have been used where flotation
LITERATURE STUDY 25
has been adopted as a method of separation. Chromites from different
locations exhibit a wide variation in surface properties which is a major difficulty
when making use of flotation (Gu & Wills, 1988).
All chromites are paramagnetic at room temperature. Their magnetic capacity
is dependent on the Fe2+content (Owada & Harada, 1985). It has been
speculated that this ferromagnetism is predominantly present in the sections
more concentrated with Fe2+ because of the non-uniform distribution of
magnetic ions in the crystalline structure. Low-intensity magnetic separation
(about 0.1 T) is used to reject the magnetite from paramagnetic chromite
material, but is inefficient in separating the chromites that are present in fine
intergrowths with other materials. In a high-intensity magnetic field (about 1 T)
chromite can be extracted as a magnetic product from the gangue material (Gu
& Wills, 1988; Nafziger, 1982).
South African chromite ores are relatively friable and easily break down to the
size of the chromite crystals (Gu & Wills, 1988). Due to this friability, it is
common to only recover 10-15% lumpy ore (15 mm < typical size range< 150
mm) and 8-12% chip or pebble ores (6 mm < typical size range< 15 mm) during
the beneficiation process employed after chromite mining. The remaining ore
would typically be in the < 6 mm fraction, which would usually be crushed
and/or milled to < 1 mm and then upgraded utilising typical gravity separation
techniques (e.g. spiral concentrators) to approximately 45% Cr2O3 content. This
upgraded < 1 mm ore is commonly known as metallurgical grade chromite ore
(Glastonbury et al., 2010).

LITERATURE STUDY 26
2.3.2. Ferrochromium production
A generalised process flow diagram, which indicates the most common process
steps utilised by South African FeCr producers, is shown in Figure 2–8 (Beukes et
al., 2010).
1. Grinding/Milling(Wet or dry)
2. Pelletizing(Drum or disk)
3. Curing(Sintering or
Prereduction)
4. Pellet storage
5. Batching
Metallurgical grade and other fine ores
Ore(Lumpy, Chips/Pebles, Fines, Recycle, etc.)
Reductants(Char, Coke,
Anthracite and Coal)
Fluxes(Quartz, Limestone,
Magnesite and Dolomite)
6. Preheating
7. Submerged arc funace(open, semi-closed, closed)
or DC (open bath, closed environment)
Slag
8. Slag cooldown
9. Product handling (Casting,
Granulation or hot metal to Stainless
steel plant)
Landfill
Market
Open/Semi-closed10. Bag house
11. Wet scrubbing
Closed
To atmosphere
CO (g)
CO (g) flare
Ferrochrome
Figure 2–8: A flow diagram adapted by Beukes et al. (2010) from Riekkola-Vanhanen (1999), indicating the most common process steps utilised for FeCr production in South Africa
In general, four relatively well-defined process combinations are utilised by
South African FeCr producers (Beukes et al., 2010):
1. Conventional semi-closed furnace operations, with bag filter off-gas
treatment. This is the oldest technology applied in South Africa, but still

LITERATURE STUDY 27
accounts for a substantial fraction of overall production (Gediga & Russ,
2007). In this type of operation, coarse (lumpy and chips/pebble ores) and
fine ores can be smelted without an agglomeration process undertaken to
increase the size of fine ores. Although it has been stated that fine ores
cannot be fed directly into a submerged FeCr arc furnace without causing
dangerous blow-outs or bed turnovers (Riekkola-Vanhanen, 1999),
substantial amounts of fine ores are in fact fed into some semi-closed
furnaces in the South African FeCr industry. With reference to the process
flow diagram indicated in Figure 2–8, the process steps followed are 5, 7, 8,
9 and 10. Some semi-closed furnaces do consume pelletized feed, in which
case process steps 1-4 would also be included. Most of semi-closed
furnaces used in South Africa are operated on an acid slag, with a basicity
factor smaller than 1. Equation 2‒1 defines the basicity factor (BF) (Beukes
et al., 2010):
2
%CaO %MgOBF
%SiO 2‒1
Some semi-closed furnaces might operate on BF > 1, but these are less
common and such operations are sometimes only temporarily undertaken
to compensate for refractory linings being in poor condition, or if enhanced
sulphur removing capacity by the slag is required (Beukes et al., 2010).
2. Closed furnace operation, usually utilising an oxidative sintered pelletised
feed (Outotec, 2011). This has been the technology most commonly
employed in South Africa, with the majority of green and brown field
expansions utilising this combination of process steps during the last
decade. Process steps usually include steps 1, 2, 3, 4, 5, 7, 8, 9 and 11, with
or without 6. In all green field FeCr developments the pelletising and
sintering (steps 2 and 3) sections were combined with closed furnaces.

LITERATURE STUDY 28
However, pelletising and sintering sections have also been constructed at
plants where the pelletised feed is utilised by conventional semi-closed
furnaces. These furnaces are usually operated on an acid slag (BF < 1)
(Beukes et al., 2010).
3. Closed furnace operation with pre-reduced pelletised feed (Naiker, 2007;
Botha, 2003). The process steps include steps 1, 2, 3, 4, 5, 7, 8, 9, 11. The
pelletised feed differs substantially from the oxidative sintered type due to
the fact that the pellets are pre-reduced and mostly fed hot, directly after
pre-reduction, into the furnaces. The furnaces are closed and operate on a
basic slag (BF > 1). At present, two South African FeCr smelter plants use
this process.
4. DC arc furnace operation (Curr, 2009; Denton et al., 2004). For this type of
operation, the feed can consist exclusively of fine material. Currently three
such furnaces are in routine commercial operation for FeCr production in SA
and typically utilize a basic slag regime (BF > 1). Process steps include 5, 7
(with a DC, instead of a SAF), 8, 9 and 11. Drying (process step 6) might also
be included.
2.4. Chromite pre-reduction
2.4.1. Extent of pre-reduction technology commercialisation
Pre-reduction technology has been around for a number of years, with the pre-
reduction of iron ore being a more commonly utilised process. Remarkably,
pre-reduction of chromite has not been widely used on a commercial scale;
however, it is a very well-established practice in South African FeCr production
and has been utilised since 1975 (McCullough et al., 2010; Basson et al., 2007;
Naiker, 2007; Dawson & Edwards, 1986). It is currently the second most
commonly employed pelletisation technology in the South African FeCr industry

LITERATURE STUDY 29
(Beukes et al., 2010). A number of studies have been conducted on the pre-
reduction of chromite ore utilising different reductant sources including coke,
anthracite, carbon monoxide, methane and hydrogen. This has led to a few
processes being partially developed as well as implemented on a commercial
scale.
The solid state reduction of chromite (SRC) process developed by Showa Denko
in Japan was the first commercially successful process (Naiker, 2007). In this
process, chrome ore fines are milled in a ball mill, pelletised using a clay binder
with coke added as reductant, dried in a travelling grate kiln, and fired in a
rotary kiln to approximately 1400 °C. The kiln is heated by a burner using
pulverised coal, CO or oil as fuel (Riekkola-Vanhanen, 1999). The SRC process
has been employed with success at two commercial plant facilities, the Shunan
Denko Plant in Japan and the Consolidated Metallurgical Industries (CMI) Plant
in Mpumalanga South Africa, and these have proved to be the most energy
efficient FeCr production plants at the time (Naiker, 2007). When Xstrata
purchased the CMI plant in 1998 from the Johannesburg Consolidated
Industries (JCI) group, they wanted to decrease cost structures at the Lydenburg
plant. Therefore, between 1998 and 2001, they developed the Premus process,
based on the SRC process, mainly by in-plant trials. Xstrata made a key
fundamental change in the operating philosophy of the process in that while the
original CMI process main objective was to maximize metallisation in the pellets,
the Premus process sought to maximize the energy output from the kiln while
still achieving the required efficiencies and therefore increasing furnace output
(Naiker, 2007) In 2006 third quarter Xstrata increased their FeCr capacity with
the commissioning of its Lion FeCr smelter plant which also makes use of a pre-
reduction stage utilising Xstrata’s Premus technology (McCullough et al., 2010;
Basson et al., 2007). In 2010 Xstrata announced the seconded phase expansion
of the Lion plant that will involve the construction of a 360 000 t/y capacity
smelter, raising their total FeCr production capacity above 2.3 million t/y.
LITERATURE STUDY 30
Construction of the smelter was due to begin in the first quarter of 2011, with
commissioning planned for the first half of 2013. The expansion will yet again
make use of the Premus pre-reduction technology (Wait, 2011; Creamer, 2010).
Alternative processes that have been used or have been partly developed
include the Krupp-Codir CDR (Chrome Direct Reduction Process) and Rotary
Hearth Furnace (RHF) of originally Krupp in Germany but acquired by Polysius
and Outokumpu’s pre-treatment process (McCullough et al., 2010). The CDR
process uses unagglomerated ore fines. Self-agglomeration of the fines occurs
inside the rotary kiln in the high temperature zone. A temperature of
approximately 1500 °C is used and the kiln feed consists of chromite
concentrate, a siliceous flux, and a large excess of reductant. This is because
coal is used as both energy source and reductant (Riekkola-Vanhanen, 1999;
Dawson & Edwards, 1986). A big disadvantage of this process is that the excess
reductant must be separated from the metal-slag mixture before smelting can
commence. To achieve this, the kiln discharge must be cooled which results in a
substantial loss of enthalpy (Dawson & Edwards, 1986). SAMANCOR installed
the CDR pre-reduction process at its Middelburg FeCr Plant with the process
involving the partial fluxing of chrome ore fines (not pellets) and the use of
oxygen enrichment to attain temperatures of around 1500 °C, but ran into
problems in particular with refractory wear. INMETCO developed its Direct
Reduced Iron (DRI) Technology process utilizing a RHF and applied it with great
success to stainless steel dust recycling. However, attempts to apply the RHF
process to chrome ore pre-reduction were only partly successful, the main
problem being the re-oxidation of the pre-reduced chrome pellets (McCullough
et al., 2010). Tenova Pyromet in co-operation with its technical partners, Paul
Wurth and Tenova LOI Italimpianti, has recently developed a pre-reduction
process for FeCr ores based on using Rotary Hearth Furnace technology fired
with closed furnace off-gas, but the process has not yet been industrially
applied (Dos Santos, 2010).

LITERATURE STUDY 31
Outokumpu studied its process for about ten years in the laboratory and on
pilot scale as well as for two years in a commercial scale operation. The process
consisted of a rotary kiln with a length of 55 m and inner diameter of 2.3 m. The
major problem that they encountered was to maintain an even pre-reduction
degree. Consequently, plant operation became difficult to maintain and
efficiency were not good enough to make the operation viable, so they returned
to using the equipment for preheating (Daavittila et al., 2004).
2.4.2. Strategic advantages of chromite pre-reduction
Although various processes are utilised in the production of FeCr (Par. 2.3.2),
the use of pelletised pre-reduction chromite has a number of key advantages
over other processes:
a) Pre-reduction’s most important advantage is certainly the reduction
of the overall process electric energy consumption. At present, high-
carbon FeCr is generally produced in electric arc furnaces. A major
disadvantage of this process is the amount of electrical energy
required for the reduction of the metal oxides to the metallic state. In
order to minimize energy consumption and consequently improve
cost efficiency, solid state carbothermic pre-reduction of chromite has
become a necessary option, since it requires the lowest specific
energy for operation of all FeCr production processes (Neizel, 2010;
Weber & Eric, 2006). With pre-reduction levels of up to 90% for the
iron and 50% achieved for chrome, electrical energy consumption is
reduced by approximately 40% from around 3.9 MWh/t required in
conventional processes down to 2.4 MWh/t (McCullough et al., 2010).
The net specific energy consumption as a function of the degree of
chromium pre-reduction achieved and then charged into an arc
furnace at different temperatures was reconstructed from Takano et

LITERATURE STUDY 32
al. (2007) and Niayesh and Fletcher (1986) and is presented in Figure
2–9.
b) The process utilises 100% fine chromite ore, therefore taking
maximum advantage of friable chromite ore available in South Africa
(Naiker & Riley, 2006).
c) Providing an agglomerate feed to furnaces thus reducing the risk of
bed turnovers and blowouts occurring (Naiker & Riley, 2006).
d) Although pre-reduction capital cost is higher than the capital incurred
for a conventional process, it is still the lowest capital cost per
annualised ton of FeCr and will thus have the lowest cost of
production for the foreseeable future when compared to other
alternative environmentally acceptable processes available (Naiker,
2007).
e) High recoveries of metallic oxides (90%).
f) Production of a low silicon product (< 3%).
g) The use of lower cost fine reductants instead of lumpy reductants and
the use of oxygen as an energy source (Naiker, 2007; Naiker & Riley,
2006; Botha, 2003).

LITERATURE STUDY 33
Figure 2–9: Net energy requirement for the production of 1 ton of FeCr as a function of the degree of pre-reduction achieved and charging temperature (Takano et al., 2007; Niayesh & Fletcher, 1986)
2.4.3. Fundamental aspects of chromite pre-reduction
In a chromite pre-reduction process certain terms are used to describe the
reduction rate and extent of reduction and metallisation. It is therefore
necessary to define these terms before going into further discussions. Barnes et
al. (1983) proposed definitions for the terms “degree of reduction” and
“metallisation” which have since been used by some researchers (Weber & Eric,
2006; Soykan et al., 1991a). Given that the removal of oxygen is associated with
reduction, the extent of reduction, R(%), was defined as (Barnes et al., 1983):
Mass of oxygen removed
R(%) 100Original removable oxygen
2‒2
y = 0.0721x2 - 28.503x + 3362.6 R² = 0.9989
y = 0.0524x2 - 23.424x + 2581.7 R² = 0.9996
y = 0.0562x2 - 21.186x + 2316.3 R² = 0.9995
0.0
0.5
1.0
1.5
2.0
2.5
3.0
3.5
4.0
0 20 40 60 80 100
Un
it e
ner
gy c
on
sum
pti
on
(M
Wh
/t)
Cr pre-reduction (%)
300K
1300K
1500K

LITERATURE STUDY 34
In the pre-reduction process solid carbon is used as a reductant and CO is thus
formed as a reduction reactions product (illustrated in Equation 2‒5,
Equation 2‒6 and Equation 2‒7). The extent of reduction can thus also be
defined as (Barnes et al., 1983):
Mass of CO evolvedR(%) 100
28 /16 Original removable oxygen 2‒3
The amount of removable oxygen used to define Equation 2‒2 and
Equation 2‒3 is determined from the oxygen loss associated with the metal
oxides Fe2O3, FeO and Cr2O3.
The extent of metallisation, M(%), is defined as (Barnes et al., 1983):
0 0
tot tot
(Cr + Fe )M(%) 100
(Cr + Fe ) 2‒4
Where: Cr0 is the amount of chromium reduced to the metal state
Fe0 is the amount of iron reduced to the metal state
Crtot is the total chromium amount
Fetot is the total iron amount

LITERATURE STUDY 35
Since complete oxygen removal corresponds to complete metallisation, 100%
reduction corresponds to 100% metallisation. The relationship between
metallisation and reduction is, however, not linear and Barnes et al. (1983)
attributed this to the following factors:
1) In the early stages of reduction, Fe2O3 is reduced to FeO without any
metallisation:
2 3Fe O + C 2FeO + CO 2‒5
2) FeO is reduced to Fe0, producing 1 mol of CO for every mole of Fe0
produced:
FeO + C Fe + CO 2‒6
3) Cr2O3 is reduced to Cr0, producing 1.5 mol of CO per mole of Cr produced:
2 3Cr O + 3C 2Cr + 3CO 2‒7
Dawson and Edwards (1986) illustrated the individual difference in metallisation
and reduction of iron and chromium, confirming the above mentioned factors
proposed by Barnes et al. (1983). A graphic illustration of this relationship
between reduction and metallisation were reconstructed for Dawson and
Edwards (1986) and shown in Figure 2–10.

LITERATURE STUDY 36
Figure 2–10: The relationship between reduction and metallisation, based on South African LG-6 chromite treated at 1200 °C (Dawson & Edwards, 1986)
Chromite ore is primarily composed of FeO·Cr2O3, MgO·Cr2O3, MgO·Al2O3,
(Cr,Al)2O3, forming a complex spinel structure and may also hold a certain
amount of free iron, not contained inside the spinel (Takano et al., 2007). The
general formula for South African chromite ore located in the BIC is
=1.01 =1.99
2+ 3+0.74 0.27 1.42 0.40 0.15 0.01 0.01 4(Fe Mg ) (Cr Al Fe Ti V ) O . The reduction mechanism for
chromite is therefore much more complex, due to the number of metal oxides,
slag components (SiO2, TiO2, Al2O3, MgO, CaO, including gaseous Mg and SiO)
and alkalis contained inside the spinel structure or existing as free compounds
(Niemelä et al., 2004).
Takano et al. (2007) identified three ways in which high temperature reduction
of chromites using a carbon reductant can generally occur, i.e. i) solid chromites
is reduced by solid or gaseous reductant; ii) direct reaction at the interface
between the slag and metal, where the dissolved chromites in the slag are
0
20
40
60
80
100
0 20 40 60 80 100
Met
allis
atio
n (
%)
Reduction (%)
Fe
Cr

LITERATURE STUDY 37
reduced by carbon dissolved in the metal phase; and iii) direct reaction between
dissolved chromites in the slag and the carbon particles floating on it. In SAF
mechanisms ii and iii should be predominant, while in the chromite pre-
reduction process a large portion of chromite is expected to reduce by solid or
gaseous reductants before liquid phase formation. The reactions required for
the carbon based reduction of chromite by a solid or gaseous reductant are
indicated in Equation 2‒8 and Equation 2‒9 (Niemelä et al., 2004).
22C + O (g) 2CO(g) 2‒8
2 22CO(g) + O (g) 2CO (g) 2‒9
Niemelä et al. (2004) investigated the formation, characterisation and utilisation
of CO-gas formed during the carbothermic reduction of chromite. According to
the Ellingham diagram calculations they conducted (indicated in Figure 2–11)
they showed that solid carbon reduces Fe2O3 to FeO at around 250 °C. The
reduction of Fe3O4 to FeO occurs kinetically at temperatures above
approximately 710 °C. FeO is reduced to the Fe0 state at relatively low
temperatures, around 710 °C and above, while the reduction of Cr2O3 occurs at
higher temperatures of 1250 °C and above. Carbon monoxide reduces Fe2O3 to
Fe3O4 over the whole calculated temperature range, but as mentioned earlier
reduction of Fe3O4 to FeO occurs kinetically above 710 °C. Form the calculations
it is evident that the reduction of Cr2O3 and (FeO·Cr2O3) is not possible with
carbon monoxide alone.

LITERATURE STUDY 38
Figure 2–11: Standard free energies of reduction of metal oxides with carbon and carbon monoxide (Niemelä et al., 2004)
The mechanisms and kinetics of the reduction of South African chromite ores
have been studied by numerous researchers. A comprehensive reference list of
these investigations is given by Hayes (2004). Significant results on the solid-
state carbothermic reduction mechanism and kinetics of a chromite from the
LG6 layer of the BIC treated at 1400 °C have been published by Soykan et al.
(Soykan et al., 1991a; Soykan et al., 1991b). Soykan et al. proposed a
stoichiometric ionic diffuse reduction model involving somewhat complex
reactions among the solid carbon reductant, altered chromite spinel phases,
and various ionic species. It also included site-exchange mechanisms between
Fe2- and Cr3+ ions, with the Cr3+ being placed in octahedral sites due to its very
high affinity for octahedral coordination (Weber & Eric, 2006; Weber & Eric,
1993; Soykan et al., 1991a; Soykan et al., 1991b). The proposed mechanism,
furthermore, included a swap mechanism between the Cr2+ ions of the surface
unit cell and the Fe2+ ions of the unit cell just below the surface. Soykan et al.
(1991a&b) observed that localisation occurred in partially reduced chromites
-800
-600
-400
-200
0
200
400
0 250 500 750 1000 1250 1500 1750 2000
ΔG
(El
lingh
am, k
J/m
ol)
Temperature ( °C)
CO CO2Fe2O3 Fe3O4FeO Cr2FeO4Cr2O3
LITERATURE STUDY 39
and that all the oxygen are removed from the surface as iron and chromium is
reduced. The inner cores were found to be rich in iron, whereas the outer cores
were depleted of iron. A graphic representation, shown in Figure 2–12, of the
reduction of chromite was proposed by Ding & Warner (1997b) correlating to
the observations of Soykan et al. (1991a&b). Soykan et al. (1991a&b) revealed
that, within the outer core (Reduced area, Figure 2–12), Fe2+ and Cr3+ ions
diffused outward, whereas Cr2+, Al3+ and Mg2+ ions diffused inward. Initially,
Fe3+ and Fe2+ ions at the surface of chromite particle (Interface 1, Figure 2–12)
were reduced to the metal state. This was followed immediately by the
reduction of Cr3+ ions to the 2+ oxidation state. Cr2+ ions diffusing toward the
inner core of the particle reduced the Fe3+ ions in the spinel under the surface of
the particle to Fe2+ at the interface (Reduced area, Figure 2–12) between the
inner and outer cores. Fe2+ ions diffuse toward the surface, where they were
reduced to metallic iron. After the iron had been completely reduced, Cr3+ and
any Cr2+ that was present were reduced to the metal state, leaving an iron and
chromium free spinel, MgAl2O4. The metallised iron and chromium carburised
during the reduction into (Fe,Cr)7C3 according to Equation 2‒10 and
Equation 2‒11.
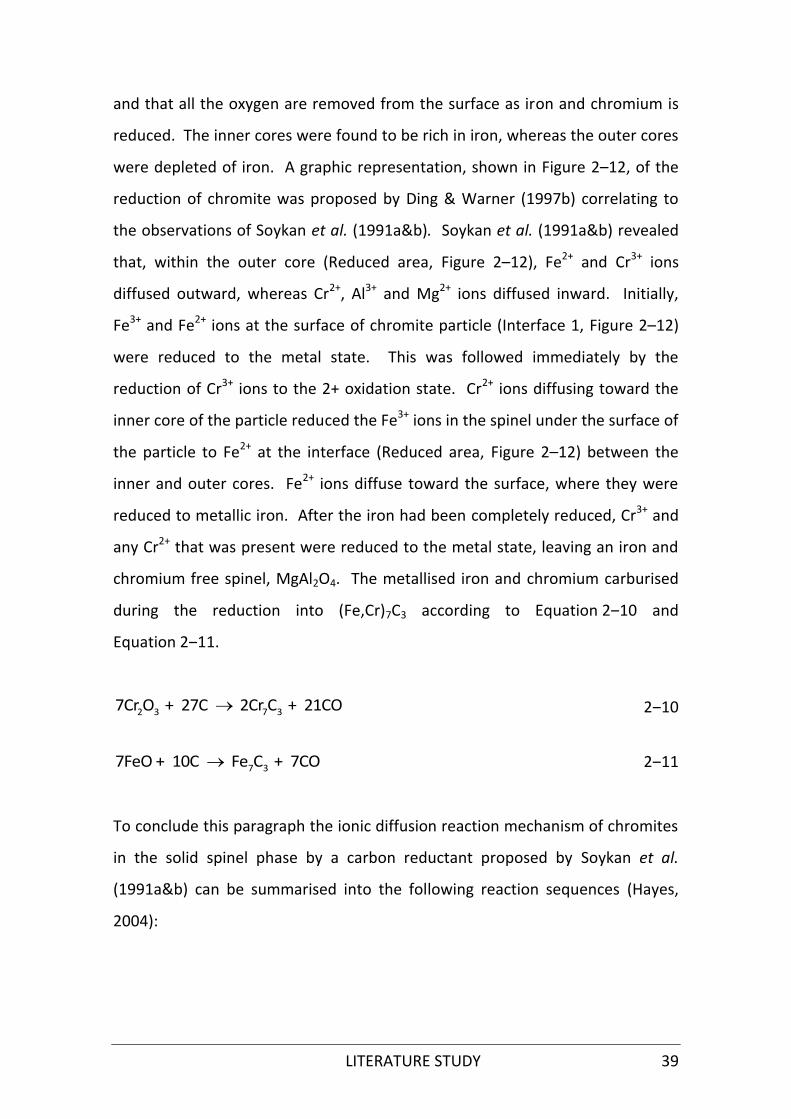
2 3 7 37Cr O + 27C 2Cr C + 21CO 2‒10
7 37FeO + 10C Fe C + 7CO 2‒11
To conclude this paragraph the ionic diffusion reaction mechanism of chromites
in the solid spinel phase by a carbon reductant proposed by Soykan et al.
(1991a&b) can be summarised into the following reaction sequences (Hayes,
2004):

LITERATURE STUDY 40
1) Initially, Fe3+ and Fe2+ at the surface of the chromite particle are
reduced to the metal state. This is followed instantaneously by the
reduction of Cr3+ ions to Cr2+ (Interface 1, Figure 2–12).
2) Cr2+ ions diffusing toward the inner core of the particle reduce the
Fe3+ ions in the spinel under the surface of the particle to Fe2+ at the
interface between the inner core (Unreacted chromite core, Figure 2–
12) and the surface of the particle. Fe2+ ions diffuse towards the
surface, where they are reduced to metal iron.
3) After the iron has been completely reduced, Cr3+ and any Cr2+ that is
present are reduced to the metal state, leaving an iron and
chromium-free spinel, MgAl2O4.
Figure 2–12: Schematic representation of the reduction mechanism of chromite (Ding & Warner, 1997b)

LITERATURE STUDY 41
2.4.4. Factors influencing the pre-reduction of chromite
2.4.4.1. Effect of time and temperature
Figure 2–13: The effect of time and temperature on the rate of chromite reduction (Barnes et al., 1983)
The extent of chromite pre-reduction achieved in industrial operations is seldom
more than 60%. This involves nearly complete metallisation of the iron and
typically less than 30% metallisation of the chromium. The low metallisation of
the chromium, therefore, limits the potential further reduction in electrical
energy required, as mentioned in Par. 2.4.2. The relatively low degree of
reduction obtained in current industrial operations is a result of the slow
reduction kinetics of chromium species occurring in the chromite. The kinetics
is determined by the temperature of operation, which is limited to a maximum
1300 °C
1250 °C
1200 °C
1150 °C
1100 °C
1050 °C
1000 °C
0
10
20
30
40
50
60
70
80
90
100
0 10 20 30 40 50 60 70 80
Re
du
ctio
n (
%)
Time (min)

LITERATURE STUDY 42
of about 1350 °C. At temperatures above 1350 °C, partial melting of the pellets
occurs, that consequently causes dam-ring formation in the kiln and hence a
decrease in operation efficiency (Dawson & Edwards, 1986). The effect of time
and temperature on the pre-reduction of chromite concentrates with a low
chromium-to-iron ratio, studied by Barnes et al. (1983), is indicated in Figure 2–
13.
2.4.4.2. Effects of additives on pre-reduction
The reduction of chromite in the presence of various additives and fluxes with
the aim of improving the pre-reduction of chromite has been a subject of
several investigations in recent years.
Sundar Murti et al. (1983) studied the effect of 8% CaO addition on
the reduction of synthetic and natural chromites at 1200-1300 °C
using graphite as a reductant. They found that the reduction was
enhanced by the additive and attributed this to the CaO diffusing into
the spinel and then releasing the FeO, thereby increasing the
chromite reducibility.
Katayama et al. (1986) proved that 1 wt% addition of Na2B4O7, NaF,
NaCl, CaB4O7, B2O3 and CaF2 improved the reduction rate of Russian
chromium ore; while the same wt% CaCl2 addition inhibited the
reduction rate the longer it was exposed to the experimental
temperature of 1200 °C. The effect that these salt additives had on
the reduction rate of Russian chromium ore at 1200 °C where
reconstructed from Katayama et al. (1986) and illustrated in Figure 2–
14.
Dawson and Edwards (1986) investigated the addition of a fluxing
agent, CaF2, and a eutectic mixture, NaF-CaF2, on the reduction rate
of chromite. While a moderate addition of CaF2 was found to be

LITERATURE STUDY 43
beneficial for chromite reduction, the eutectic mixture of NaF-CaF2
were much more effective than using only CaF2.
Van Deventer (1988) studied the effect of K2CO3, Na2O2, CaO, SiO2,
Fe0, Cr0, Al2O3 and MgO additions on the reduction of Kroondal
chromite at 1400 °C by graphite. K2CO3, Na2O2, CaO, SiO2 and Fe0
were found to enhance the rate of reduction, while Al2O3 and MgO
inhibited the reaction. Cr0 additions had little influence on reduction
rates.
Nunnington and Barcza (1989) found that the addition of granite and
fluorospar to act as fluxing agents in the pre-reduction of chromite
ore pellets under oxidising conditions improved reduction rates.
Weber and Eric studied the carbothermic reduction of chromite in the
presence of silica flux extensively and found that reduction was
enhanced at and above 1400 °C (Weber & Eric, 2006; Weber & Eric,
1993; Weber & Eric, 1992).
Ding and Warner investigated the catalytic effect of both lime and
SiO2 additions on the reduction of ground South African chromite
concentrates. SiO2 was found to have an enhanced effect on the
reduction rate at and above 1380 °C, but only if reduction levels are
higher than 40%, constituting the formation of a liquid slag (Ding &
Warner, 1997b). Experiments on the catalytic reduction of carbon
chromite composite pellets by lime were carried out at 1270-1433 °C
and the reduction rate and extent were found to increase with
increasing reduction temperature and lime addition (Ding & Warner,
1997a).
Lekatou & Walker (1997) also researched the effect of SiO2 additions
on the solid state reduction of chromite concentrates.

LITERATURE STUDY 44
Takano et al. (2007) utilised Portland cement, hydrated lime and silica
as additives and proved that composite pellets containing these
compounds had enhanced chromite reduction rates.
The above-mentioned investigations indicate that the addition of certain
additive could have an effect on the reduction of chromite, either positive or
negative. The list given above are by no mean comprehensive, but it does
provide some insight into past research activities.
Figure 2–14: The effect of various salt additives (1 wt% addition) on the reduction rate of Russian chromium ore at 1200 °C (Katayama et al., 1986)
Na2B4O7
NaF
Na2CO3
NaCl
No addition
0
20
40
60
80
100
R (
%)
CaB4O7
B2O3
CaF2
CaCl2
No addition
0
20
40
60
80
100
0 30 60 90 120 150
R (
%)
Time (min)
0

LITERATURE STUDY 45
2.5. Clay binders
2.5.1. Basic principles of agglomeration
Binders (e.g. clay) accomplish two very important functions in ore
agglomeration (e.g. pelletisation) (Eisele & Kawatra, 2003):
The binder, along with the moisture added, gives the raw materials
adhesive properties, so that it will nucleate seeds that can grow at a
controlled rate into well-formed good quality pellets.
During drying, the binder holds the particles in the agglomerates
together while the water is removed and continues to bind them
together until the pellet is heated sufficiently to sinter the grains
together.
Binder selection is therefore determined by how well it can carry out each of
these functions while at the same time not causing contamination or efficiency
problems. An additional feature of certain clay binders, e.g. bentonite, which is
helpful in pelletisation, is its ability to absorb several times its own weight in
water. This makes it possible to control the free moisture content of the
pelletisation feed and consequently green pellet quality by simply adjusting the
clay addition rate. This is an important characteristic because pelletisation
works over a fairly narrow range of feed moisture contents. Because not all ore
concentrates will filter to the same moisture content, this capability of a clay
binder provides a convenient method for making small adjustments to the feed
moisture content. The strength of a pellet is dependent on the type of bonding
produced by the binder, indicated in Figure 2–15 (Eisele & Kawatra, 2003;
Sastry, 1996a; Sastry, 1996b).

LITERATURE STUDY 46
Figure 2–15: Magnitudes of bond strengths for various classes of interparticle bonds in pellets: (A) van der Waals, magnetic, or electrostatic forces; (B) capillary forces from the liquid phase; (C) adhesional and cohesional forces; (D) mechanical interlocking; (E) solid bridges formed by sintering or crystallisation of dissolved materials (Eisele & Kawatra, 2003; Sastry, 1996a; Sastry, 1996b)
Almost any material with a fine consistency can contribute to Van der Waals
bonding, however, this bonding type is very weak and of little importance.
Capillary forces are stronger but are not adequate in providing adhesive
strength to formed pellets as it requires the presence of liquid in the pellet.
Binders that can take advantage of adhesional or cohesional forces are
therefore needed (Eisele & Kawatra, 2003). It should be noted that, in addition
to affecting the unfired strength of the pellets, various additives alter the
characteristics of fired pellets. Ball et al. (1974) studied the effects of additives
such as NaCl, KCl, CaCl2, MgCl2, Ca(OH)2, MgO, Al2O3, CaCO3, CaMg(CO3)2,
glucose, ferrous sulphate, and bentonite on the fired pellet properties of iron
ore pellets. Some of these additives increased strength up to a certain point,

LITERATURE STUDY 47
whereas others had no effect or even caused a strength decrease.
Microstructural studies conducted by Ball et al. (1974) showed that these
effects correlated to the degree to which additives cause quartz dissolution and
melt formation. In general, electrolytes (NaCl, KCl, CaCl2) and alkali calcium
compounds (Ca(OH)2, CaCO3) tended to cause an increase in fired strength,
mainly due to an increase in the amount of slag melt that formed; however,
over-dosage of any of these additives lead to a decrease in strength. MgO
reduced the fired strength, due to reaction with the magnetite to produce a
solid mixture solutions of magnetite and magnesioferrite, with relatively little
material left over to form a slag. Bentonite tended to increase the pellet
strength due to increased amounts of slag whereas glucose reduced the
strength by increasing the porosity. Ferrous sulphate had no significant effect
on fired pellet strength (Ball et al., 1974). Since it is much more likely that the
above mentioned additives, if naturally present in clays, are incorporated into
the various mineral phases in forms other than simple oxides and ionic
compounds, it would therefore be difficult to be certain in advance whether a
particular binder will have undesirable effects on the fired pellet quality.
2.5.2. Structure and chemistry of clay binders
2.5.2.1. Clay minerals, major constituents of raw clay materials
Clay minerals are the fundamental constituents of raw clay materials. Their
crystal structure, with some exceptions, consists of sheets, giving rise to the
terms sheet silicates or phyllosilicates, firmly arranged in structural layers. The
individual layers are composed of two to four sheets that are formed by either
tetrahedrons, [SiO4]4-, or by octahedrons, e.g. [AlO3(OH)3]6-. The interior of
tetrahedrons and octahedrons contains smaller metal cations, their apices being
occupied by oxygen from which some are bonded to protons (as OH). All these
fundamental structural elements are arranged to form a hexagonal network in
each sheet (Velde & Meunier, 2008; Moore & Reynolds, 1997; Konta, 1995).

LITERATURE STUDY 48
The crystilline clay minerals are classified into seven groups according to i) the
number and the ratio of sheets in a fundamental structural layer, ii) the existing
cation substitutions in the tetrahedral and octahedral sub-structures and iii) the
resulting charge of the layers. These groups are the kaolinite and serpentine
group, micas, vermiculites, smectites, pyrophyllite and talc group, chlorites and
the palygorskite and sepiolite group (Konta, 1995; Newman, 1987). For the
purpose of this study only the smectite and palygorskite groups will be
discussed further, since these correlate with the clays selected in this case
study.
2.5.2.2. Smectites, mineral group of Bentonite
Smectite is name given to a group of sodium, calcium, magnesium, iron, and
lithium aluminum phyllosilicate minerals, both dioctahedral and trioctahedral,
all of which are able to expand and contract their structures while maintaining
two-dimensional crystallographic integrity. The individual mineral names for
these are sodium montmorillonite, calcium montmorillonite, saponite,
nontronite, beidellite and hectorite (Moore & Reynolds, 1997; Murry, 1991).
These minerals consist of three-sheet phyllosilicates, where the
tetrahedron:octahedron ratio is 2:1 and the charge of the three-sheet layer is
0.5-1.2.
Bentonite is formed by hydrothermal alteration of igneous volcanic ash
deposits. It is actually a mixture of clay minerals, with the primary component
being the smectite class mineral, montmorillonite, which has the ideal
composition (Ball et al., 1974):
+ 3+ 2+x+y 4-y y 8-x x 20 4 2M (Al,Fe ) (Fe ,Mg) [Si Al O ](OH) nH O 2‒12

LITERATURE STUDY 49
M+ represents the absorbed alkali cations in the interlayer space (especially
Na+). Where, however, alkaline earths (Ca2+, Mg2+) occur, they are represented
by 2+x/2M (Konta, 1995). The basic crystal structure of montmorillonite is shown in
Figure 2–16 (Murry, 1991; Grim, 1968).
Figure 2–16: Structure of the smectite crystal (Murry, 1991; Grim, 1968)

LITERATURE STUDY 50
Isomorphic substitution of Al3+ with Mg2+ into the [SiO4]4- tetrahedrons sheets
alters the crystal charge balance and requires surface adsorption of
exchangeable cations, normally Na+ and Ca2+, to balance the charge. When
coming into contact with water, illustrated in Figure 2–17, hydration of these
exchangeable cations causes the clay mineral to swell. The swelling ability of
montmorillonite differs depending on the type of exchangeable cation. Ca2+
have a higher charge and smaller diameter than Na+, and as a result tend to
interact more strongly with the aluminophyllosilicates platelets, making them
less susceptible to hydration. As a result, sodium bentonites hydrate and
expand readily on contact with water whereas calcium bentonites expand to a
much lesser extent (Eisele & Kawatra, 2003; Kawatra & Ripke, 2002; Kawatra &
Ripke, 2001; Ripke & Kawatra, 2000c).
Figure 2–17: Effect of Ca2+ ions in water on the expansion of sodium bentonite. (A) Water contains no ions, bentonite expands freely. (B) Calcium in the water can displace sodium and increase the bonding between bentonite platelets so that the expansion is reduced (Kawatra & Ripke, 2003)

LITERATURE STUDY 51
The expansion of the clay minerals in bentonite when they come in contact with
water has three effects that are of interest in ore pelletisation (Eisele &
Kawatra, 2003):
i) It absorbs water, which can be valuable for controlling the moisture
content of the pellets. It also increases the viscosity of the fluid
between the mineral grains in the pellet, leading to a well-rounded,
elastic pellet that can be conveniently handled and transported in the
plant.
ii) The clay binder is spread exceptionally easily throughout the raw
materials upon mixing. During drying, the clay bonds to the mineral
grains and to each other, giving excellent dry strength to the pellet.
This is an important function of a pellet binder because in the absence
of a binder, the pellet will disintegrate after it is dried. The effect of
bentonite platelets on pellets during the drying process is presented
in Figure 2–18.
iii) During sintering to produce finished high-strength pellets, the sodium
and calcium components of the bentonite act as fluxing agents,
reducing the melting point of some of the minerals in the pellet. This
allows a portion of the pellet to melt before the sintering
temperature is reached. This helps to strengthen the pellets during
the preheating stage, allowing dusting and breakage to be minimised
during transfer to the final firing step.

LITERATURE STUDY 52
Figure 2–18: Conventional view of how bentonite platelets bind mineral grains in a pellet. Platelets are initially dispersed in the liquid, and the platelets bond to the mineral grains and each other as the liquid dries. Bonding is enhanced by the electrostatic attraction between the platelet faces (which have a negative charge) and the platelet edges (which are positively charged) (Van Olphen, 1987)
The conventional view (Figure 2–18, Figure 2–19 A and B) of the behaviour of
clay as a binder is that the expanded clay disaggregates into submicron
platelets, which would then adhere to the raw material particles and to each
other as they dry. One of the characteristics of clay minerals that helps in this
regard is that the edges of the platelets tend to have an electrostatic charge
opposite than that of the platelets faces. This causes the clay platelets to bond
to each other quite strongly by electrostatic bonding during the drying process
(Van Olphen, 1987); however, it appears that this conventional view may not be
entirely correct, particularly when the moisture content is not sufficient to
completely disband and disperse the bentonite platelets (Eisele & Kawatra,
2003; Kawatra & Ripke, 2002; Kawatra & Ripke, 2001; Wenninger & Green,
1970). Kawatra and Ripke suggested a bentonite fibre bonding mechanism that
is quite different from that of the conventional dispersion mechanism of

LITERATURE STUDY 53
bentonite binding. They proposed that in low-moisture conditions the clay
particles would, rather than disperse, expand into a fibrous matrix (Figure 2–
19C) that ties the raw material particles together. These fibres form when a
shearing action or force is applied, promoting the bentonite platelets to slide
relative to one another, like a deck of cards pushed across a table, forming a
fibrous web of strands Figure 2–20. The proposed mechanism is consistent with
the fibrous appearance of silica sand grains bonded with bentonite in low
moisture conditions, which is shown in the scanning electron micrographs of
Figure 2–21.
Figure 2–19: Two bonding mechanisms of bentonite on ferrous ore particles. Diagrams A and B show the dispersion mechanism. Diagram C shows the fibre mechanism (Kawatra & Ripke, 2001)

LITERATURE STUDY 54
Figure 2–20: Behaviour of bentonite grains that are not completely dispersed in water. The grain expands when moistened and the platelets are lubricated by the interplatelet water. Under shear stress, the grain can then spread into a long fibre in an effect similar to spreading a deck of cards across a table (Eisele & Kawatra, 2003; Kawatra & Ripke, 2001)
Figure 2–21: Scanning electron micrographs of silica sand (A) and of the same sand after bonding with bentonite (B). The bentonite formed strands stretching over and between grains, which is consistent with the bonding mechanism described by Kawatra and Ripke (2001). (A) Sand grains, AFS Fineness No. 55, taken at 250 times magnification. (B) Sand with 6.0% sodium bentonite, mixed 1.5 minutes with 3.2% water, taken at 250 times magnification (Wenninger & Green, 1970)
A B

LITERATURE STUDY 55
2.5.2.3. Palygorskite, mineral group of Attapulgite
Palygorskite and attapulgite are names for the same hydrated magnesium
aluminum silicate clay mineral (Murry, 1991). The term attapulgite is largely
used industrially even though the international mineral nomenclature
committee ruled that palygorskite was first used and therefore the preferred
term (Murray, 2002). The general molecular formula for palygroskite is
3 8 20 2 2 4 2Mg Si O (OH) (OH ) 4H O , with a small possibility of magnesium substitution
by aluminium (Konta, 1995). Palygroskite’s crystal shape (Figure 2–22) is
typically that of fibres with thin elongate chain type structures because of two
particularities of the crystal lattice i.e. i) a discontinuous octahedral sheet; ii) the
[SiO4]4- tetrahedra are periodically reversed (Velde & Meunier, 2008).
Figure 2–22: Structure of palygorskite (attapulgite) (Murry, 1991)

LITERATURE STUDY 56
The silicon tetrahedra form ribbons elongated in one direction and due to
periodic interruptions in the octahedral sheet, channels are formed. Therefore,
when dispersed in water, these elongate crystals are inert and non-swelling and
form a random lattice capable of trapping liquid by attraction due to the
unbalanced charge of the cations. These clays do not flocculate with
electrolytes and are stable at high temperatures, which make them uniquely
applicable for a number of uses. The major uses of palygorskite are in drilling
muds, paints, liquid detergents, adhesives, car polish, flexiographic inks,
cosmetics, floor absorbents, potting mixes, oil-spill clean-up material, carriers
for fertilizers, pesticides, or hazardous chemicals, decolourization of various
mineral, vegetable and animal oils, as a receptor coating on carbonless copy
paper, and for pet litter. Because these clays are relatively unaffected by
electrolytes their viscosity is retained whereas bentonite flocculates and loses
its high viscosity (Velde & Meunier, 2008; Murray, 2002; Konta, 1995; Murry,
1991).
Compared to bentonite, very little has been published about the possible
binding mechanism of attapulgite during ore agglomeration processes. This
makes theoretical comparison of the two different clay groups difficult.

MATERIALS AND METHODS 57
CHAPTER 3: MATERIALS AND METHODS
3.1. Materials
The raw materials utilised in the industrial pelletised chromite pre-reduction
process consist of ore, a carbonaceous reducing agent and a clay binder. All the
raw materials used in this study, except the bentonite, were collected in bulk
during a sampling campaign at the Xstrata Lydenburg FeCr plant (Xstrata,
2011b). The plant is situated in the Mpumalanga Province and is currently
applying the pelletised chromite pre-reduction process. Samples of
metallurgical grade chromite (< 1 mm), anthracite breeze and attapulgite clay
being utilised by this FeCr plant were obtained. The metallurgical-grade
chromite originally came from Xstrata’s Helena Chrome Mine situated on the
Eastern Limb of the BIC (Xstrata, 2011a). The anthracite breeze originated from
Nkomati Anthracite (Pty) Ltd’s mining operations south of eMangweni in the

MATERIALS AND METHODS 58
Mpumalanga Province (Sentula, 2008). The attapulgite clay (lumpy) was from
Atta Clay (Pty) Ltd’s mine located in the Maandagshoek District in the Limpopo
Province (AttaClay (Pty) Ltd., 2011). At the time this study was undertaken, this
specific clay was the preferred choice for a binder at the Lydenburg FeCr plant.
The bentonite clay used was from G&W Base and Industrial Minerals (Pty) Ltd
(Pel-Bond bentonite grade) mined at their Koppies Bentonite Mine in the Free
State Province. The bentonite is a sodium-activated bentonite that is
specifically prepared for pelletising of ores (G&W Base (Pty) Ltd., 2011).
Industrially produced chromite pre-reduced pellets were also obtained from the
Xstrata Lydenburg FeCr plant.
SARM 8 and SARM 18 obtained from Industrial Analytical (Pty) Ltd were used as
reference materials in the analysis of carbonaceous reductants and chromite
containing materials, respectively. All other chemicals used were analytical
grade (AR) reagents, obtained from the different suppliers and used without any
further purification. Ultra-pure water (resistivity 18.2 MΩ.cm-1), produced by a
Milli-Q water purification system, was used for all procedures requiring water.
Instrument grade synthetic air and nitrogen gas were supplied by Afrox.
3.2. Methods
3.2.1. Chemical and surface analysis
3.2.1.1. Scanning Electron Microscopy and Energy Dispersive X-ray
Spectroscopy
Analyses using scanning electron microscopy incorporated with energy
dispersive x-ray spectroscopy (SEM-EDS) were employed to visually and
chemically characterise surface properties of samples. Analyses were
conducted at both the North-West University and at Mintek
(http://www.mintek.co.za/). Two different instruments were utilised, i.e. i) a

MATERIALS AND METHODS 59
FEI QUANTA 200 ESEM, integrated with an OXFORD INCA X-Sight 200 EDS
system operating with a 15 kV electron beam at a working distance of 10 mm
located at the North-West University and ii) a Zeiss MA 15 SEM incorporating a
Bruker AXS XFlash® 5010 Detector X-ray EDS system operating with a 20 kV
electron beam at a working distance of 17.4 mm located at Mintek. Sample
materials were mounted on buttons with carbon tape for visual and chemical
characterisation at different magnifications. Copper tape instead of carbon tape
was used to mount the anthracite sample to avoid carbon contamination when
determining the surface chemical composition. For SEM-EDS characterisation of
typical industrial pellets, sample pellets were split in half. The one half was
polished before analysis, while the other half was left unpolished and analysed
as is.
3.2.1.2. Inductively Coupled Plasma Spectrometry
Inductively Coupled Plasma Spectrometry (ICP) analyses of the bentonite and
attapulgite clays were performed by SMI Analytical. Samples were microwave
digested prior to analysis using a Perkin Elmer MultiwaveTM 3000 microwave
sample preparation system. Typically nitric acid is placed in the reaction
container with the sample and a combination of other reagents such as
hydrochloric and hydrofluoric acid, or hydrogen peroxide is added depending on
the sample matrix. Hydrofluoric and hydrochloric acids are used as digestive
reagents, especially in the presence of silicates and precious metals
respectively. The use of hydrogen peroxide enhances the oxidation properties
of nitric acid especially in the digestion of organics. A 0.25 to 1.0 g sample was
weighed and placed in the reaction container along with 9 mL of nitric acid.
Depending on the sample matrix the appropriate amount of hydrofluoric and/or
hydrochloric acid were then added. Finally the hydrogen peroxide was added.
The mixture was then allowed to react for approximately one minute prior to
sealing the container. The container was then slotted into a rotor and placed

MATERIALS AND METHODS 60
inside the microwave. The sample container was then heated to at least 180 °C
over 5.5 minutes and then held at 180 °C for at least 9.5 minutes (Kingston &
Walter, 1998; EPA, 1996). The microwave digestion reagents and their specified
mixing ratios according to different sample matrixes are indicated in Table 3-1.
Table 3-1: Microwave digestion reagents and their ratios according to sample matrix (EPA, 1996)
Matrix Reagent and Volume (mL)
HNO3 HF HCl H2O2
Soil/Metallurgical 9 3 2 1
Sediment 9 3 2 1
Biological 9 0 1 2
Botanical (e.g. leaves) 9 0.5 0.5 1
Botanical (e.g. wheat) 9 0 0.5 2
Waste oil (e.g. wear metals in lubricating oil) 9 0.5 0.5 2
Inductively coupled plasma mass spectrometry (ICP-MS) and inductively coupled
plasma optical emission spectrometry (ICP-OES) of the bentonite and
attapulgite clays were performed using a Perkin Elmer Optima 5300 ICP-OES, to
determine major components, and a Perkin Elmer Elan 6100 ICP-MS to
determine minors and trace elements. All results are as per ISO 17025
standards.
ICP-OES of the metallurgical grade chromite ore, anthracite, as well as the pre-
reduced pellets were performed using a SPECTRO CIROS VISION ICP-OES
Spectrometer. For the determination of major elements in the anthracite by ICP
exactly 1 g of sample and 1 g of SARM 18, used as a reference, was placed on
silica dishes and exposed to 815 °C for 1½ hour using a muffle furnace. The ash
residues were separately transferred into zirconium crucibles each containing
2 g sodium peroxide and 0.5 g sodium carbonate as fluxes and mixed using a

MATERIALS AND METHODS 61
spatula. The mixtures were then fused over a Bunsen flame until a complete
melt was achieved. The crucibles were allowed to cool after which the fusions
were taped loose from the crucibles and transferred to 500 mL beakers. The
remaining fusion residue was washed out of the crucibles using four parts of
20 mL water. 20 mL 1:1 nitric acid was then added to the beakers. To ensure
that the entire fusion residue had been removed, the crucibles were rinsed with
10 mL 1:1 nitric acid. All washings were added to the respective beakers,
containing the previously collected solutions. The beakers were then placed on
a hot plate and heated until the solutions cleared near boiling point. After
clearing the solutions were removed and allowed to cool. The solutions were
transferred to 200 mL volumetric flasks and 10 mL yttrium solution was added
to each, where after they were diluted. The dilutions where then used for ICP
analysis. The yttrium solution was prepared by dissolving 0.635 g yttrium oxide
in 50 mL 1:1 water:HNO3, heating the solution slightly until dissolved. The
solution was then diluted to 5 L in a volumetric flask. Analysis of the chromite
and pre-reduced pellets by ICP was conducted using the same procedure,
except that samples were not reduced to ash at 815 °C. Instead exactly 0.2 g of
sample was weighed off as starting material and SARM 8 used as a reference.
3.2.1.3. Proximate analysis
Proximate (inherent moisture, ash, volatile contents and fixed carbon) analysis
of the anthracite was determined according to ASTM standard method D3172-
07A (ASTM, 2007). The moisture content of the anthracite was determined by
placing a 1 g sample in a drying oven at 110 °C for 1½ hours and measuring
weight loss to determine the inherent moisture. Similarly, the ash content was
determined by exposing a 1 g sample to 815 °C for 1½ hour using a muffle
furnace. The volatile content of the anthracite was determined by adding
4 drops of methyl isobutyl ketone/acetone to a 1 g sample and exposing it to
900 °C for precisely 7 minutes. The fixed carbon was determined by deducting

MATERIALS AND METHODS 62
the ash, moisture and volatile contents from the total weight (combined total
100%). Additionally the water loss and loss on ignition (LOI) of the clays were
also determined at 110 and 1000 °C, respectively.
3.2.1.4. Elemental analysis
Elemental carbon and sulphur contents were determined to characterise the
anthracite and to determine the fixed carbon (FC) in the experimentally
prepared pre-reduced pellets. The pre-reduced pellets were analysed to
confirm an excess of free carbon and ensure the reduction rates were not
affected by a lack of reducing agent. This was done by means of IR
spectrophotometry utilizing a LECO CS 244. A 1:1 mixture of tungsten and iron
chips was used as the accelerator flux. Elemental carbon and sulphur analysis of
the two clays was performed by SMI Analytical and similarly determined by
using a LECO CS 230 IR spectrophotometer.
3.2.1.5. X-ray Diffraction
X-ray diffraction (XRD) of the clays was performed by XRD Analytical and
Consulting cc as well as at the North-West University. The material was
prepared for XRD analysis using a back-loading preparation method. Semi-
quantitative and qualitative XRD analyses of the compounds in the clays were
performed using two different instruments, i.e. i) a PANalytical X’Pert Pro
powder diffractometer with Fe filtered Co-K radiation incorporating a
X’Celerator detector located at XRD Analytical and Consulting cc and ii) a Philips
X-ray diffractometer (PW 3040/60 X’Pert Pro) with Cu-Kα radiation located at
the North-West University. The measurements were performed between
variable divergence- and fixed receiving slits. The phases were identified using
X’Pert Highscore plus software. The relative phase amounts were estimated
using the Rietveld method (Autoquan programme).

MATERIALS AND METHODS 63
3.2.2. Sample material preparation
A Wenman Williams & Co disc mill was used to grind the lumpy attapulgite clay
and the anthracite to < 1 mm. Different mixing ratios of the components
present in the pre-reduced (chromite ore, anthracite and clay) and oxidative
sintered pellets (chromite ore and clay) were then made up, according to the
objectives of specific experiments. At the time when the experiments were
conducted 3-4 wt% clay addition was being utilised in the industrial process. It
was therefore decided to cover the range 2.5-5 wt% clay addition, but also to
include a 10 wt% clay addition to help identify trends that might be difficult to
recognize at low clay additions. The anthracite was kept constant at 20 wt%
(relating to approximately 15 wt% fixed carbon) in all pre-reduction
experiments. Anthracite was not added to the pellet mixtures made up for
oxidative sintering experiments. The remainder of the mixtures were made up
with the chromite ore. The recipes for a 50 g batch of pre-reduced and
oxidative sintered pellet mixtures are indicated in Table 3-2.
All raw material mixtures were dry-milled to the particle size specifications
applied for industrial pre-reduction feed material (90% smaller than 75 µm). A
Siebtechnik laboratory disc mill with a tungsten carbide grinding chamber, to
avoid possible iron contamination, was used for this purpose. A Malvern
Mastersizer 2000 was used to determine the particle size distribution of the
pulverised material. A very dilute suspension of milled ore was ultrasonicated
for 60 s prior to the particle size measurement, in order to disperse the
individual particles and to avoid the use of a chemical dispersant. It was
determined that for a 50 g mixture of raw materials a milling time of 2 min was
required to obtain the desired size specification, hence all raw material mixtures
were milled similarly.

MATERIALS AND METHODS 64
Table 3-2: Mixing ratios of the recipes for pre-reduced and oxidative sintered pellet mixtures
Pre-reduction experiments (50 g mixture)
Clay Anthracite Ore
wt% g wt% g wt% g
2.5 1.25 20 10 77.5 38.75
3 1.5 20 10 77 38.5
3.5 1.75 20 10 76.5 38.25
4 2 20 10 76 38
5 2.5 20 10 75 37.5
10 5 20 10 70 35
Oxidative sintering conditions (50 g mixture)
Clay Anthracite Ore
wt% g wt% g wt% g
2.5 1.25 - - 97.5 48.75
3 1.5 - - 97 48.5
3.5 1.75 - - 96.5 48.25
4 2 - - 96 48
5 2.5 - - 95 47.5
10 5 - - 90 45
3.2.3. Pelletising
The milled material was pressed into cylindrical pellets with a LRX Plus strength
testing machine equipped with a 5 kN load cell from Ametek Lloyd Instruments
and a Specac PT No. 3000 13 mm die set. Pellets were prepared in batches of
10 each. At the time when the experiments were conducted a pre-wet water
content of approximately 12 wt% was being utilised in the industrial process. It
was observed that water was being pressed out of the pellet mixtures when
water contents higher than 9 wt% were used. This could have led to some of
the mineral constituents dissolving in the water and thus subsequently being
removed from the mixtures. For each batch 50 g of dry mixed raw material was
pre-wetted with 5 g of water and mixed thoroughly. This related to the mixture

MATERIALS AND METHODS 65
having a water content of approximately 9 wt%. 3.2 g of pre-wetted material
was then placed in the die set and compressed at a rate of 10 mm/min until a
load of 1500 N was reached, after which this load was held for 10 s. Although
time-consuming (each pellet made individually), this technique was preferred
over conventional disc pelletisation, since disk pelletisation on laboratory scale
can result in the formation of pellets with different densities, sizes and spherical
shapes. Pressing the pellets according to the above procedure ensured
consistent density, form and size, making monovariance investigation of other
process parameters possible.
3.2.4. Pre-reduction and oxidative sintering procedure
A ceramic tube furnace (Lenton Elite, UK model TSH15/75/610) with a
programmable temperature controller was used to conduct all pre-reduction
and oxidative sintering experiments. Ceramic heat shields were inserted at both
ends of the tube furnace to improve the tube length in which a stable working
temperature could be achieved. These heat shields also protected the stainless
steel caps, which were fitted onto both side of the ceramic tube to seals the
ends. The stainless steel caps had a gas inlet on the one side and an outlet on
the other.
The gaseous atmosphere inside the ceramic tube was controlled by either
utilising a N2 flow rate of 1 NL/min, or synthetic air flow rate of 1 NL/min. N2
was used when pre-reduction experiments were conducted, while synthetic air
was used when oxidative sintering conditions were required. An inert (N2)
gaseous atmosphere was preferred for the pre-reduction experiments above a
reducing gaseous atmosphere, since pre-reduction due to the presence of the
carbonaceous reductant in the material mixture was of interest in this study,
not pre-reduction occurring due to external gaseous conditions. For the pre-
reducing experiments the tube furnace, already loaded with pellets, was flushed

MATERIALS AND METHODS 66
with N2 for at least 30 min at a flow rate of 1.25 NL/min at room temperature
prior to the commencement of an experiment. This was done to avoid oxidising
gasses being present.
Two temperature profiles (illustrated in Figure 3-1) were used in this
experimental study. These profiles were compiled to attempt simulating
conditions occurring in the industrial pelletised pre-reduction of chromite.
Figure 3-1: Temperature profiles used in pre-reduction and oxidative sintering experiments
Both temperature profiles consisted of three segments, i.e. i) heating up to
900 °C, ii) heating to the final temperature (and soaking if applicable) and iii)
cooling down. In the first segment of both temperature profiles, pellets were
heated from room temperature to 900 °C over a period of 30 min. In the
second segment of the first temperature profile, the temperature was raised
from 900 to 1250 °C within a 50 min period and held constant for 20 min, after
which the furnace was switched off and allowed to cool down while gas flow
50 min 1250
20 min
1st temperature profile
30 min
900
1300 2nd temperature
profile
0
200
400
600
800
1000
1200
1400
0 20 40 60 80 100 120 140
Tem
per
atu
re (
°C)
Time (min)
Segment i Segment ii Segment iii
Segment i Segment ii Segment iii

MATERIALS AND METHODS 67
was maintained (segment three). In the second segment of the second
temperature profile the temperature was raised from 900 to 1300 °C within a
50 min period, after which the furnace was switched off without any soaking
time and allowed to cool down while gas flow was maintained (segment three).
3.2.5. Abrasion resistance testing
The abrasion resistance test apparatus was based on a downscaled version of
the European standard EN 15051 rotating drum. The drum was designed
according to specifications provided by Schneider and Jensen (2008). The drum
was rotated at 44 rpm, which is 4 times faster than that used by Schneider and
Jensen (2008). This was done to obtain measurable abrasion on the hardest
experimentally prepared pellets. A batch (ten pellets) of the pre-reduced or
oxidative sintered pellets was abraded for different time periods, i.e. 1, 2, 4, 8,
16, 32 min. After every time interval the material was screened using 9.5 and
1.18 mm screens. The over and under-sized material was then weighed and the
material returned to the drum for further abrasion, until the final abrasion time
was achieved.
3.2.6. Compressive strengths testing
Compressive strength is defined as the tensile or compressive load required to
fracture a sample. The compressive strength testing method is based on
measurements of the mechanical strength that develops in the pellets as
sintering takes place. Compressive strengths of the pre-reduced or oxidative
sintered pellets (Par. 3.2.4) were tested with an Ametek Lloyd Instruments
LRXplus strength tester. A cylindrical pellet was placed on its round side
between the compression plates as shown in Figure 3-2. This was done since it
is more comparable to the relatively spherical shapes of the industrial pre-
reduced pellets.

MATERIALS AND METHODS 68
Figure 3-2: Graphic representation of compression strength test
The preload stress and preload speed were set to 0.0056 kN and 22 mm/min
respectively. The speed of the compression plates was maintained at
10 mm/min during crushing to apply an increasing force on the pellets. The
maximum load/force that each pellet endured before breakage occurred, as
shown in Figure 3-3, was recorded.
Figure 3-3: An example of a typical compressive strength graph
Compression plate
Pellet

MATERIALS AND METHODS 69
3.2.7. Thermo-Mechanical Analysis
Pellets were prepared in the same manner as described in Par. 3.2.3 but not
pre-reduced or oxidatively sintered as indicated in Par. 3.2.4. A smaller Specac
PT No. 3000 10 mm die set was used to pelletise 1 g of material in order for the
pellet to fit inside the loading chamber. A single pellet was placed at a time in
the Seiko Instruments Inc. TMA/SS 6100 thermal mechanical analyser,
interfaced with SII EXSTAR 6000. With this instrument the thermal expansion of
the pellets could be measured as a function of temperature up to 1300 °C. The
temperature programme was set to ramp at a rate of 5 °C/min from ~22 °C to
1300 °C over a time period of 260 min. All thermo-mechanical analysis (TMA)
experiments were conducted in a N2 atmosphere (1.67 NL/h), since oxidative
corrosion of the internal parts of this specific instrument has been detected
when operating under atmospheric gaseous conditions. Since the TMA probe
was made of alumina, α-alumina coefficients correction was applied to the data
as specified in the operational manual of the instrument.
3.2.8. Ash Fusion Temperature Analysis
Ash fusion temperature analysis is usually done to characterise the melting and
sintering behaviours of coal ash (Nel et al., 2011). However, it was also applied
to the two clays utilised as case study materials in this investigation. The SABS
ISO 540:2008 standard method was performed with a Carbolite CAF digital
imaging coal ash fusion test furnace by Advanced Coal Technology
(http://www.advancedcoaltech.com/). In this test a moulded cone of each clay
was viewed and the following four temperatures recorded: i) deformation
temperature, when the corners of the mould first became rounded; ii) softening
temperature, when the top of the mould took on a spherical shape;
iii) hemisphere temperature, when the entire mould took on a hemisphere

MATERIALS AND METHODS 70
shape and iv) fluid temperature, when the molten material collapsed to a
flattened button on the furnace floor.
3.2.9. Analysis of pre-reduction
This extent of chromite pre-reduction was determined according to the method
utilised by laboratories associated with the FeCr smelters in South Africa
currently applying the pelletised chromite pre-reduction process, which was
based on the methods published by Dinnin (1959).
The % soluble iron and % soluble chrome, required for calculating the % total
reduction, is obtained by firstly leaching a pulverised sample in an acidified
water solution. Exactly 1 g of pulverised sample material is weighed into a
500 mL Erlenmeyer flask and 50 mL leaching solution is added. The sample is
leached under reflux for 1.5 hours at 120 °C on a hot plate. The leaching
solution is prepared by adding 100 mL concentrated H3PO4 and 400 mL
concentrated H2SO4 to 500 mL water. The sample solution is then diluted to
250 mL in a volumetric flask where after it is filtrated. Twenty percent of the
leachate solution is used for the determination of the soluble chrome and forty
present for soluble iron determination.
A 50 mL (20% aliquot) of the filtrate solution is pipetted into a 250 mL Phillips
beaker. 5 mL potassium permanganate solution, 3% w/v (weight by volume), is
added and the solution brought to boil for 4 min. 25 mL sodium chloride
solution, 20% w/v, is then added and the solution boiled until clear. The
solution is removed, allowed to cool and 100 mL water is then added. The
% soluble chrome is determined volumetrically by a ferrous ammonium
sulphate-potassium dichromate titration, with the titrate value designated as T.
10 mL of a 0.2 M ferrous ammonium sulphate solution is added to the cooled
chrome leached solution. 2-3 drops of diphenylamine sulphonate are added as
indicator. The indicator is prepared by dissolving 0.5 g diphenylamine

MATERIALS AND METHODS 71
sulphonate in 100 mL water. The solution is then titrated against a 0.1 M
potassium dichromate solution till a definite purple colour is reached. The
% soluble Cr was determined using Equation 3‒1.
(E T) F 0.1734% Sol Cr
Sample Mass 20% (Aliquot mass) 3‒1
The equivalent, E, is obtained by adding 50 mL of the acid leaching solution to
200 mL water. 10 mL of 0.2 M ferrous ammonium sulphate solution and 2-3
drops of diphenylamine sulphonate is added where after the solution is titrated
against 0.1 M potassium dichromate solution till a purple colour is reached. The
titration value is designated E.
The % soluble iron is determined by pipetting 100 mL (40% aliquot) of the
leached filtrate solution into a 500 mL Erlenmeyer flask, adding 2-3 drops of
diphenylamine sulphonate indicator and titrating the solution against 0.1 M
potassium dichromate. The % soluble Fe was determined using Equation 3‒2.
T F 0.5585% Sol Fe
Sample Mass 40% (Aliquot mass) 3‒2
The results for % soluble chrome as well as soluble iron obtained by this method
are ~1% low when compared with K2Cr2O7 taken as the primary standard
(Dinnin, 1959). For greater accuracy a correction factor, designated F, is used. F
is determined after K2Cr2O7 standardisation. 0.2 g K2Cr2O7 is weighed into a
500 mL Erlenmeyer flask. 100 mL water followed by 20 mL 1:1 H2SO4 and 5 mL
phosphoric acid is added to the flask. Using a pipette 40 mL 0.2 M ferrous
ammonium sulphate is added to the solution. As an indicator 3-5 drops of
diphenylamine sulphonate are added and the solution titrated against the 0.1 M

MATERIALS AND METHODS 72
potassium dichromate solution with the titration value designated T. The factor
F was calculated using Equation 3‒3.
2 2 7Mass K Cr O 1000F
4.904 (E T) 3‒3
The equivalent, E, is determined as described above, however 40 mL of 0.2 M
ferrous ammonium sulphate solution and 3-5 drops of diphenylamine
sulphonate are used.
The % total pre-reduction was calculated using Equation 3‒4.
% Sol Cr % Sol Fe
34.67 55.85% Total Pre-reduction0.0121
3‒4
3.3. Statistical handling of data
Most of the analyses and experiments were performed a number of times. In
order to ensure that outliners did not influence statistically calculated values,
such as averages and standard deviations, the Q-test as recommended by Skoog
et al. (2004) was applied to the datasets with the aim of identifying and
eliminating outliners. The absolute value of the difference between the
questionable result (xq) and its nearest value (xn) is divided by the spread (w) of
the entire dataset to give the estimated Q-value as indicated in Equation 3‒5.
q nx xQ
w 3‒5

MATERIALS AND METHODS 73
This Q-value is then compared to critical values (Qcrit) found in Table 3-3 (Dean &
Dixon, 1951). If the value of Q was greater than Qcrit, the questionable value
was rejected from statistical calculations. During this study, a 95% confidence
level, as indicated in Table 3-3, was used.
Table 3-3: Critical values for the rejection of quotient Q (Dean & Dixon, 1951)
Number of observations
Qcrit (Reject if Q > Qcrit)
90% Confidence 95% Confidence 99% Confidence
3 0.941 0.97 0.994
4 0.765 0.829 0.926
5 0.642 0.71 0.821
6 0.56 0.625 0.74
7 0.507 0.568 0.68
8 0.468 0.526 0.634
9 0.437 0.493 0.598
10 0.412 0.466 0.568
The compressive strength results were compiled from 20 repetitions for every
set of experimental conditions reported, the abrasion resistance strength tests
from 3 repetitions, the TMA results from 6 repetitions and the pre-reduction
determinations from 5 repetitions of the entire experimental procedure for
every experimental condition tested. The mean and standard deviations were
calculated for every dataset, after the elimination of possible outliers utilising
the Q-test with 95% confidence level. The mean and standard deviations were
then used in the presented data shown in Chapter 4.

RESULTS AND DISCUSSION 74
CHAPTER 4: RESULTS AND DISCUSSION
4.1. Raw material characterisation
Different chemical and physical properties of raw materials (ore, carbon
reductant and clay binder) play a crucial role in the various pelletising and pre-
reduction sub-processes (drying, grinding, moistening, pelletisation, pellet
drying, pre-heating and roasting) and variations in these properties could
significantly affect the process as a whole (Singh & Mohan Rao, 2008;
Chakraborty et al., 2007; Pistorius, 2002; Dawson & Edwards, 1986). It was
therefore very important to not only characterise the two case study clays
properly, but the chromite ore and anthracite reductant as well. The visual and
chemical characterisation by means of SEM, ICP, SEM-EDS, proximate and

RESULTS AND DISCUSSION 75
elemental analysis of the raw materials utilised are indicated in Figure 4–1 and
Table 4–1.
Figure 4–1: SEM micrograph images of the attapulgite clay (4‒1A), bentonite clay (4‒1B) and chromite ore (4‒1C) taken at 200 times magnification as well as the anthracite (4‒1D) taken at 60 times magnification
Figure 4–1C is a micrograph of a chromite ore sample taken at 200 times
magnification. It can be seen from Figure 4–1C that the majority of ore particles
are smaller than 0.5 mm, which is consistent with beneficiated chromite ore
commonly known as metallurgical grade (< 1 mm) (Glastonbury et al., 2010).
Figure 4–1A and Figure 4–1B is micrographs of an attapulgite and bentonite
sample respectively taken at 200 times magnification. It can be seen from
Figure 4–1A and Figure 4–1B that the bentonite had a much finer consistency
than the attapulgite clay.
4‒1A 4‒1B
4‒1C 4‒1D

RESULTS AND DISCUSSION 76
Table 4–1: Chemical characterization of the different raw materials utilised, with various techniques
Chromite Anthracite
ICP (%) SEM-EDS (%) ICP (%) SEM-EDS (%)
Cr2O3 45.37 Cr 27.21 SiO2 10.09 Si 2.53
FeO 25.39 Fe 15.33 Al2O3 3.13 Al 0.89
Al2O3 15.21 Al 6.39 FeO 1.62 Fe 1.19
MgO 9.83 Mg 6.37 CaO 0.8 Ca 0.18
SiO2 1.72 Si 3.70 MgO 0.35 - -
CaO 0.22 Ca 0.48 P 0.011 - -
P < 0.01 Ti 0.37 S 0.59 S 0.68
- - O 40.16 - - C 76.9
- - O 17.63
Proximate analysis (%)
FC 75.08
Inherent Moisture 0.26
Ash 17.79
Volatiles 6.87
Attapulgite Bentonite
ICP (%) SEM-EDS (%) ICP (%) SEM-EDS (%)
SiO2 46.91 Si 21.80 SiO2 53.53 Si 23.61
Al2O3 14.76 Al 8.11 Al2O3 13.17 Al 7.35
Fe2O3 6.72 Fe 5.32 Fe2O3 5.33 Fe 5.73
Fe 4.70 - - Fe 3.73 - -
CaO 5.63 Ca 3.14 CaO 4.77 Ca 3.37
MgO 5.29 Mg 2.91 MgO 2.64 Mg 1.70
TiO2 0.26 Ti 0.15 TiO2 0.45 Ti 0.31
- - Na 0.12 - - Na 2.15
K2O 0.21 K 0.09 K2O 1.14 K 1.10
MnO 0.15 - - MnO 0.08 - -
P < 0.01 - - P 0.02 - -
- - O 58.36 - - O 54.69
LECO (%) LECO (%)
C 1.47 C 1.14
S < 0.001 S < 0.001
Water loss (110 °C) 8.73 wt% Water loss (110 °C) 9.78 wt%
LOI (1000 °C) 13.04 wt% LOI (1000 °C) 7.69 wt%

RESULTS AND DISCUSSION 77
From the ICP and SEM-EDS results, the Cr-to-Fe ratio of the chromite was
calculated as 1.57, which is typical of South African deposits (Cramer et al.,
2004; Howat, 1986). The anthracite had a fixed carbon content of
approximately 75% and a volatile content of 6.87%. This volatile content was
under the maximum acceptable volatile content specification of 7%, as a higher
volatile content generally results in pellets bursting while passing through the
grate and rotary kiln (Naiker, 2007). The major ash elements in the anthracite
were found to be Si, Al, Fe, P, Ca and Mg. As expected the clays were mainly
alumina-silicates. The significance of other elements in the clays will be
discussed later. Phosphorous and sulphur contents are usually included in the
FeCr specifications (Basson et al., 2007), hence they were also measured where
applicable.
4.2. Characterisation of typical industrial pellets
In order to illustrate the unique process considerations of clay binders in the
pelletised chromite pre-reduced process, SEM backscatter micrograph images of
an industrially produced pellet as well as SEM-EDS analysis of different zones
occurring in the industrial pellet are shown in Figure 4–2 and Table 4–2
respectively.

RESULTS AND DISCUSSION 78
Figure 4–2: Partial SEM micrograph image taken at 45 times magnification of a polished section of an industrial pre-reduced pellet split in two (4‒2A), a micrograph of an unpolished section zoomed in (650 times) on the transitional zone and showing part of the core area (4‒2B), a micrograph taken at 550 times magnification of the outer layer of a polished section (4‒2C), a micrograph taken at 300 times magnification of the inner core of an unpolished section (4‒2D) and micrographs of the surface of an industrial pre-reduced pellet taken at 800 times (4‒2E) and 650 times (4‒2F) magnification
4
5 +
3
2
1
Transitional
Outer layer
Core
4‒2B
4‒2C
4‒2A
4‒2D
4‒2F 4‒2E

RESULTS AND DISCUSSION 79
Table 4–2: SEM-EDS analysis performed on selected areas of the industrial pre-reduced pellet
wt%
Area C Mg Al Si Ca Ti Cr Fe O
1 7.16 3.85 5.50 3.87 0.88 0.33 21.70 11.83 44.89
2 1.06 5.43 7.71 2.37 0.67 0.40 30.23 16.84 35.28
3 1.91 4.38 6.38 3.34 0.55 0.43 25.32 21.78 35.90
4 1.01 1.03 7.30 8.62 0.17 0.17 31.41 14.00 36.30
5 3.21 0.48 3.77 2.87 9.10 3.65 2.66 36.91 37.37
Figure 4–2A is a partial micrograph of a polished sectional view taken at 45
times magnification of an industrial pre-reduced pellet split in half. As can be
seen from Figure 4–2A, it seems as if there are two different zones in such
pellets, i.e. the core (Figure 4–2D) and an outer layer (Figure 4–2C), with a
transitional zone in between. These two zones correspond to the different
conditions to which the pelletised material is exposed during the industrial pre-
reduction process. Initially the raw material components (chromite, carbon
reductant and clay) are homogeneously spread throughout the pellet.
However, as the pellet is exposed to the high temperatures inside the rotary
kiln, where the pre-reduction process takes place, the carbon in the outer layer
is mostly burned off and a partially oxidised outer layer is formed due to the
presence of oxygen at these high temperatures. As the carbon is burned off,
pores are formed as well as a network of sintered slag bridges, which can be
observed in Figure 4–2C and Figure 4–2E. A small amount of iron reduction
might take place before all carbon is consumed in this outer layer, but this can
be re-oxidised again. In contrast, oxygen ingress to the core does not take
place. At temperatures above 710 °C, reducing reactions of the iron oxides
commence (Niemelä et al., 2004), causing reaction gas to escape from within
the pellet, thus making it impossible for oxygen to diffuse into the pellet core.
Therefore, very little carbon combustion of the core takes place around this

RESULTS AND DISCUSSION 80
temperature range and higher. The carbon in the core acts as a reductant,
resulting in pre-reduction without any oxidation impacting the core. Figure 4–
2B indicates the transitional area between these two different zones. In the
core area (top right of Figure 4–2B), small globules of pre-reduced metal can be
seen, while the transitional zone (bottom left of Figure 4–2B) seems to have a
more sintered appearance not indicating any significant metal globules. SEM-
EDS analysis was performed in order to chemically characterise the different
zones forming within the industrial pellet. Analysis of the core (Figure 4–2A,
Area 1) and the outside (Figure 4–2F, Area 4) of the pellet indicated that the
surface chemical carbon content of this specific pellet was approximately
7.1 wt% and 1 wt%, respectively. Analysis of the transitional zone (Figure 4–2B,
Area 2&3) indicated a surface chemical carbon content of 1-2 wt%. The small
amount of carbon still present in the outer layer is most likely due to the
formation of iron carbides, prior to complete oxidative combustion of the free
carbon in this layer. The thickness of the outer layer is usually less than 1 mm
(approximately 0.5 mm in this case), while the overall diameter of the industrial
pellets is usually between 12-20 mm.
From the above description it is evident that the functioning of a clay binder
within the pelletised chromite pre-reduced process has to be evaluated within
two different environments, i.e. performance within an oxidative environment
(corresponding to the outer layer of the industrially pre-reduced pellets) and
performance within a reducing environment (corresponding to the core of the
industrially pre-reduced pellets). This is in contrast with other chromite
pelletised processes, e.g. the oxidative sintered pelletised process (Beukes et al.,
2010; Outotec, 2009; Outotec, 2008) where only one condition prevails. In the
paragraphs that follow, clay binder functioning and characteristics are therefore
explored in both environments (reducing and oxidative) in order to fully
understand its functioning in the pelletised chromite pre-reduced process. In
experiments where the oxidative sintering characteristics were investigated, the

RESULTS AND DISCUSSION 81
carbonaceous reducing agent, i.e. anthracite, was omitted from the raw
material mixture to ensure that reducing behaviour did not influence the
results.
4.3. Compressive strength
The compressive strength results for the pellets pre-reduced up to 1250 °C for
20 min (contained anthracite and pre-reduced under N2), as well as oxidative
sintered pellets cured at 1250 °C for 20 min (containing no anthracite and
sintered in synthetic air) are shown in Figure 4–3. Figure 4–4 shows similar
results, but with the second temperature profile utilised, i.e. maximum
temperature of 1300 °C, with no soaking time.
Figure 4–3: Compressive strength (kN) of pre-reduced (primary axis) and oxidative sintered (secondary axis) pellets for the temperature profile up to 1250 °C and hold time of 20 min
1
1.2
1.4
1.6
1.8
2
2.2
2.4
2.6
2.8
3
0
0.1
0.2
0.3
0.4
0.5
0.6
0.7
0.8
0.9
1
1 3 5 7 9 11
Max
imu
m L
oad
(kN
) O
xid
ativ
e s
inte
red
Pre
-re
du
ced
M
axim
um
load
(kN
)
Clay content (wt%)
Attapulgite 1250 Red
Bentonite 1250 Red
Attapulgite 1250 Ox
Bentonite 1250 Ox

RESULTS AND DISCUSSION 82
Figure 4–4: Compressive strength (kN) of pre-reduced (primary axis) and oxidative sintered (secondary axis) pellets for the temperature profile up to 1300 °C with no hold time
From both these sets of results several important deductions can be made. The
compressive strengths of the oxidative sintered pellets were approximately an
order of magnitude higher than that of the pre-reduced pellets. Thus, although
the objective of the industrially applied pelletised chromite pre-reduced process
is to achieve maximum pre-reduction, the compressive strength of pre-reduced
chromite pellets is enhanced significantly by the thin oxidised outer layer
(Par. 4.2).
By comparison of the compressive strengths of the two case study clays it is
clear that the bentonite clay was superior in both pre-reducing and oxidative
sintering environments. This is significant, since the attapulgite clay is currently
the preferred option at both South African FeCr smelting plants applying the
pelletised chromite pre-reduction process.
0.4
0.6
0.8
1
1.2
1.4
1.6
1.8
2
2.2
2.4
2.6
2.8
3
0
0.1
0.2
0.3
0.4
0.5
0.6
0.7
0.8
0.9
1
1 3 5 7 9 11
Max
imu
m lo
ad (
kN)
Oxi
dat
ive
sin
tere
d
Pre
-red
uce
d
Max
imu
m lo
ad (
kN)
Clay content (%)
Attapulgite 1300 Red
Bentonite 1300 Red
Attapulgite 1300 Ox
Bentonite 1300 Ox

RESULTS AND DISCUSSION 83
The compressive strength of the bentonite-containing pre-reduced pellets
generally improved with increased clay content between 2 and 5 wt% additions,
which is the industrially relevant addition range. Increased attapulgite content
did not, however, result in any significant increased compressive strength of the
pre-reduced pellets. Increasing the attapulgite clay content of the industrial
pre-reduced pellets might therefore not result in a stronger pellet core
(Par. 4.2), although it might aid the green strength, which was not considered in
this study.
For both case study clays an increased clay addition resulted in a slightly
decreasing trend in compressive strengths of the oxidative sintered pellets. This
indicates that clay content addition is not such an important parameter in
attaining a strong oxidised outer layer (Par 4.2) on the industrially produced
pellets.
4.4. Abrasion resistance
The abrasion resistance strength results for both pre-reduced (contained
anthracite and pre-reduced under N2) and oxidative sintered pellets (containing
no anthracite and sintered in synthetic air) cured up to 1300 °C without holding
time, for 3.5 and 10% clay contents are shown in Figure 4–5. The results are
presented as the percentage weight retained in the size fraction > 9.5 mm.
Similar to the compressive strength results, the abrasion resistance strength of
the oxidative sintered pellets (indicated on secondary y-axis) was substantially
better than that of the pre-reduced pellets (indicated on primary y-axis) with
both clay contents. This again confirmed the importance of the oxidised outer
layer (Par. 4.2) in imparting strength to the industrially produced pellets. Also,
the bentonite outperformed the attapulgite in pre-reduced, as well as oxidative
sintered abrasion resistance strength, which again is significant considering that
attapulgite is currently the preferred option.

RESULTS AND DISCUSSION 84
Figure 4–5: Abrasion resistance strength indicated in weight percentage remaining above 9.5 mm versus abrasion time (note error bars were removed, since they were smaller than the markers)
4.5. XRD and Ash Fusion Temperature Analysis
In order to gain some insight into the reasons why the bentonite performed
better than the attapulgite in the compressive strength and abrasive resistance
tests SEM, SEM-EDS, XRD and ash fusion investigations were performed. Visual
investigation with SEM (e.g. observing bridge formations, pore sizes, densities,
etc.) and surface chemically analysis with SEM-EDS did not give any conclusive
results and are therefore not discussed further.
Quantitative XRD analyses of the two clays are indicated in Table 4–3.
Amorphous phases, if present, were not taken into account in the
quantification. Due to crystallite size effects the errors may be larger than
indicated and the wt% contents may therefore differ. Also, mineral names may
not reflect the actual compositions of minerals identified, but rather the mineral
group (e.g. “Muscovite” would represent the mineral group “Mica”). As
92
93
94
95
96
97
98
99
100
0
20
40
60
80
100
120
140
0 5 10 15 20 25 30 35
wt%
>9
.5m
m
Oxi
dat
ive
sin
ered
Pre
-red
uce
d
wt%
>9
.5m
m
Time (min)
Attapulgite 3.5 % Red
Bentonite 3.5 % Red
Attapulgite 10 % Red
Bentonite 10 % Red
Attapulgite 3.5 % Ox
Bentonite 3.5 % Ox
Attapulgite 10 % Ox
Bentonite 10 % Ox

RESULTS AND DISCUSSION 85
expected, the smectite clay group minerals were the largest component in both
clays. However, the attapulgite clay had considerably higher smectite group
content than the bentonite. If only these results were considered, one might
wrongly consider the attapulgite clay as the better binder, due to the higher
smectite mineral group content.
Table 4–3: Quantitative XRD analysis of the attapulgite and bentonite clays utilised
Attapulgite wt% Error Bentonite wt% Error
Augite 1.97 (0.17) Augite 0.64 (0.09)
Calcite 6.66 (0.08) Calcite 6.34 (0.09)
Kaolinite 2.45 (0.11) Kaolinite 0.97 (0.10)
Muscovite 2.23 (0.20) Muscovite 4.93 (0.16)
Orthoclase 1.78 (0.10) Orthoclase 4.25 (0.12)
Plagioclase 3.86 (0.11) Plagioclase 5.98 (0.12)
Quartz 4.22 (0.13) Quartz 14.39 (0.11)
Smectite 76.8 (1.08) Smectite 62.51 (0.59)
Limitations of the Rietveld method prevent further breakdown of the smectite
group, hence qualitative XRD analyses were also conducted and shown in Figure
4–6 and Figure 4–7. These qualitative results indicated that the attapulgite
contains palygroskite, which confirms its status as attapulgite clay, but it did not
contain any montmorillonite. In contrast, the bentonite contained
montmorillonite, but no palygroskite. It is therefore assumed that the afore-
mentioned quantitative smectite mineral contents (Table 4–3) of the two clays
can be ascribed to mainly palygroskite in the attapulgite and montmorillonite in
the bentonite.

RESULTS AND DISCUSSION 86
Figure 4–6: Qualitative XRD analysis of the attapulgite clay

RESULTS AND DISCUSSION 87
Figure 4–7: Qualitative XRD analysis of the bentonite clay
Bentonite is a blend of layered aluminum hydrosilicate clays with its chemical
composition varying between montmorillonite and beidellite (Kawatra & Ripke,
2003; Murry, 1991). The crystalline structure of the smectite minerals present
in bentonite consists of three-layer aluminosilicate platelets that are freely held
together by electrostatic forces (Kawatra & Ripke, 2003; Murry, 1991; Grim,
1968). Isomorphic substitution of Al3+ by Mg2+ within the crystal structure alters
the charge balance, giving the lattice an overall negative charge. Cations, like

RESULTS AND DISCUSSION 88
Na+ and Ca2+, are then absorbed to equilibrate the charge. The hydration of
these exchangeable interlayer cations allows for water absorption in between
the layered clays, increasing the clay volume by an order of magnitude and thus
creating a gel-like viscous fluid (Kawatra & Ripke, 2003; Ripke & Kawatra,
2000c). Kawatra and Ripke (2003) stated that two ways exist in which bentonite
promotes dry strength of iron ore pellets, i) it provides a source of colloidal
material that decreases interparticle distances, and thus increases van der
Waals forces, and ii) it forms a solid bridge of hardened gel that strengthens
particle contact points. Several studies have been published proving
mechanisms and explanations of bentonite bonding (Kawatra & Ripke, 2002;
Kawatra & Ripke, 2001; Ripke & Kawatra, 2000a; Ripke & Kawatra, 2000b; Ripke
& Kawatra, 2000c; Elzea & Murray, 1994; Smiernow et al., 1980). Kawatra and
Ripke (2000c) identified an interesting bentonite-bonding mechanism and
summarised it as follows: when bentonite clay is hydrated, it begins to expand
and the electrostatic attraction relaxes, allowing the individual platelets to free
up and slip across each other to spread like a deck of cards pushed across a
table. When a combination of compression and shear forces is applied, the
platelets that make up the clay particles slide to form fibres and sheets over the
surface of the material being bonded. Thus, in the pelletising process a high
swelling type of clay is desirable. This property is usually associated with
sodium-bentonites, whereas calcium-bentonites are associated with low
swelling (Naiker, 2007; Konta, 1995). Palygorskite and attapulgite are
nomenclature for the same magnesium aluminum hydrosilicate mineral that
occur as elongated fibrous lath-like crystals (Murray, 2002; Murry, 1991).
Palygorskites constituents are made up of double silica tetrahedral chains linked
together by octahedral oxygen and hydroxyl groups containing aluminum and
magnesium ions in a chain-like structure. The neto charge on the particles,
structural channels and large surface area gives palygorskite a high capacity to
absorb and adsorb various materials. The fibrous particles cause high viscosity

RESULTS AND DISCUSSION 89
when it is added to any liquid (Konta, 1995; Murry, 1991). However, one of
palygorskites properties that seem to inhibit its ability to outperform bentonite
as a high performance binder is its lattice capability of trapping liquid while the
elongate particles remain inert and non-swelling (Reeves et al., 2006; SME,
2006; Murray, 2002; Ciullo, 1996). Considering the bentonite-bonding
mechanism identified by Kawatra and Ripke (2000c) it is evident that high-
swelling coupled with the hydrous desperation of plate-like particles is an
essential characteristics that a clay binder should possess. However, trying to
explain why the bentonite seems to be a better binder in this specific
application, based only the above-mentioned mineralogical information, would
still be presumptuous. Hence ash fusion tests were conducted to derive
parameters which could maybe shed more light on this issue. The four ash
fusion temperatures recorded for each clay, both in oxidative and reducing
conditions, are indicated in Table 4–4.
Table 4–4: Ash fusion temperatures for the attapulgite and bentonite clays utilised
Atmosphere Ash Fusion Temperatures Attapulgite Bentonite
Reducing (N2)
Initial deformation temperature 1216 1170
Softening temperature 1242 1191
Hemispherical temperature 1294 1251
Fluid temperature 1337 1301
Oxidising (O2)
Initial deformation temperature 1219 1224
Softening temperature 1256 1255
Hemispherical temperature 1336 1274
Fluid temperature 1364 1304
The ash fusion temperatures indicated that in all but one aspect, i.e. initial
deformation temperature in an oxidizing environment, the bentonite had a
lower deformation, softening, hemispherical and fluid temperatures in both

RESULTS AND DISCUSSION 90
oxidising and reducing environments. This can possibly give some practical
explanation as to why the bentonite performed better in the compressive and
abrasion strength tests, for both pre-reduced and oxidative sinter pellets.
Having a lower melting point (construed as incorporating all four measured ash
fusion temperatures) implies that the bentonite could at lower temperatures
than the attapulgite start forming bridges between the particles. It is also
notable that the attapulgite’s fluid temperatures in both environments were
above 1300 °C, implying that it might not have fully liquefied under the
experimental conditions.
4.6. Thermo-Mechanical Analysis
Cold compressive and abrasion resistance strength tests give an indication of
the cured strength of the pelletised materials after being treated under the
different environments. However, the question could be asked what the hot
pellet strengths are, since that would influence pellet breakdown in the rotary
kiln used in the industrial application. This has relevance to the formation or
build-up of damrings (material sticking to inside of the rotary kiln).
Unfortunately no instruments that could directly measure high temperature
compressive strength or abrasion resistance were available for this
investigation. However, a TMA instrument, which measures the thermal
expansion of a material as a function of temperature, was available. TMA
results for the pre-reduced pellets are shown in Figure 4–8. Oxidative sintering
could not be investigated due to instrumental limitation as explained earlier
(Par 3.2.7).

RESULTS AND DISCUSSION 91
Figure 4–8: Average percentage dimensional changes of in-situ pre-reduced of pellets as a function of temperature for both clays investigated at 3.5 and 10% additions
The TMA results of the pellets being pre-reduced in situ containing either
bentonite or attapulgite, with the different clay additions, all indicate the same
initial trends – small shrinkage up to about 120 °C probably due to moisture
loss, there after thermal expansion up to approximately 600 °C. However, after
700 °C more significant shrinkage occurred for the attapulgite-containing
pellets. In the range 900-1200 °C the attapulgite-containing pellets had shrunk
significantly more than the bentonite-containing pellets. This additional
shrinkage of the attapulgite can possibly be related to the LOI of the attapulgite
(13.04%) measured at 1000 °C as indicated in Table 4–1, which was significantly
higher than that of the bentonite (7.69%). Although thermal expansion and
shrinkage cannot be related directly to hot pellet strength, more variation in
thermal dimensional behaviour could indicate weaker pellets. Thus, although
not quantitatively investigated, there is some indication that the hot strength of
the attapulgite pellets could be weaker than the bentonite-containing pellets.
-1
-0.7
-0.4
-0.1
0.2
0.5
0 400 800 1200
Exp
ansi
on
(%
)
Temperature (°C)
Atta 3.5%
Atta 10%
Bento 3.5%
Bento 10%

RESULTS AND DISCUSSION 92
4.7. Pellet pre-reduction
The levels of pre-reduction achieved for the two temperature profiles used, as
well as clay contents from 2.5 to 10 wt% are shown in Figure 4–9. There are a
number of interesting features of this data. Firstly, the pre-reduction levels
achieved with 1250 °C and holding times of 20 min were significantly higher
than those achieved with 1300 °C without any holding time. According to the
Ellingham diagram calculations of Niemelä et al. (2004) iron carbon reduction
can occur above 710 °C and chromium reduction above 1200 °C. It is therefore
not surprising that higher pre-reduction levels were achieved with the lower
temperature profile – the maximum temperature of this profile was still above
the temperatures required for both Fe and Cr reduction and the increased
holding time therefore resulting in higher levels of pre-reduction occurring.
Figure 4–9: Percentage pre-reduction achieved as function of clay content, for both case study clays with both temperature profiles utilised
y = -0.9934x + 71.701
y = -0.9527x + 73.394
y = -0.8061x + 57.34
y = -0.7567x + 59.043
45.00
50.00
55.00
60.00
65.00
70.00
75.00
1 3 5 7 9 11
Pre
-red
uct
ion
(%
)
Clay content (%)
Attapulgite 1250°CBentonite 1250°C
Attapulgite 1300°CBentonite 1300°C

RESULTS AND DISCUSSION 93
From the data in Figure 4–9 it is also evident that higher clay contents resulted
in lower pre-reduction levels, for both clays and both temperature profiles. This
is significant within the industrial process, since higher clay contents are on
occasion utilised to achieve improved green strength of the uncured pellets. In
order to quantify this observation better, trend lines with associated equations
are indicated in Figure 4–9. In the industrial application of pelletised chromite
pre-reduction, clay contents of 3 to 4 wt% are utilised. Substituting these values
into the equations indicate that 0.76 to 0.99% lower pre-reduction levels can be
expected if 4 wt% instead of 3 wt% clay addition is made. Not many references
exist in the public domain which can be used to translate these lower pre-
reduction values into energy and financial losses. Niayesh and Fletcher (1986)
published a graph of chromite pre-reduction as a function of specific energy
consumption (kWh/t FeCr produced), for different temperatures of pre-reduced
feed material. The graph assuming that the material was fed to the furnace at
room temperature of Niayesh and Fletcher (1986) was reconstructed and an
empirical fit of the data made. Using this fit and assuming 45% pre-reduction as
the base case for an industrial plant, it was calculated that 16.7 kWh/t (for the
0.76% lower pre-reduction) to 21.7 kWh/t (for the 0.99% lower pre-reduction)
more electricity would be used for 4 wt% clay, instead of the 3 wt% clay
additions. For a FeCr smelting plant producing 300 000 t/y this relates to 5 006
to 6 516 MWh/y more, or R2.62 to R3.41 million using the 52.30 SA cent/kWh
price of 2011/2012 (Eskom, 2011; NERSA, 2009c).
The third significant observation for the data in Figure 4–9, is that there seems
to be a difference between the performances of the two case study clays with
regard to pre-reduction levels achieved. Although there are some overlaps
between the error bars, it is clear that the average pre-reduction of the
bentonite-containing pellets were consistently higher than that of the
attapulgite-containing pellets. Utilising intercept values on the y-axis of the
trend lines already indicated, it was calculated that the bentonite-containing

RESULTS AND DISCUSSION 94
pellets had on average 1.7 % higher pre-reduction levels with both temperature
profiles. This is significant, since the attapulgite is currently the preferred
industrial option, mostly due to raw material cost considerations. Again using
the fitted reconstructed plot of Niayesh and Fletcher (1986) as a guide, the
difference in pre-reduction was again converted to possible electricity and
financial losses. For a 300 000 t/y smelter, operation at a specific energy
consumption of 2.4 MWh/t, this related to 9 163 (1250 °C temperature profile,
Par. 3.2.4) to 10 275 MWh/y (1300 °C temperature profile, Par. 3.2.4) more, or
R4.79 to R5.37 million using the 52.30 SA cent/kWh price of 2011/2012 (Eskom,
2011; NERSA, 2009c). Considering the compressive strength and abrasion
resistance results presented earlier (Par. 4.3), where it was proved that
bentonite outperformed attapulgite, it seems possible that lower bentonite
pellet additions could be used than attapulgite to obtain the same pellet
strength. Again using the trend lines fitted to the data in Figure 4–9, it was
calculated that a pre-reduction process utilising 3 wt% bentonite as oppose to
4 wt% attapulgite as a binder, had on average 2.7 % higher pre-reduction levels
with both temperature profiles. Using the reconstructed plot of Niayesh and
Fletcher (1986) the electricity and financial losses could again be estimated for a
300 000 t/y smelter operation at a specific energy consumption of 2.4 MWh/t.
This related to 15 616 (1250 °C temperature profile, Par. 3.2.4) to 16 349
MWh/y (1300 °C temperature profile, Par. 3.2.4) more, or R8.17 to R8.55 million
using the 52.30 SA cent/kWh price of 2011/2012 (Eskom, 2011; NERSA, 2009c).
The reason why the bentonite-containing pellets performed better with regard
to pre-reduction could be due to two reasons:
i) The case study bentonite had a lower melting point (Par. 4.5) than the
case study attapulgite, thus it might already melt during the pre-
reduction process, and hence serve as a flux in promoting metal
reduction.

RESULTS AND DISCUSSION 95
ii) The minerals present in the two different clays could contain materials
that could serve to catalyse or inhibit the pre-reduction of chromite.
Several studies have been published proving that various substances
could have catalytic or inhibiting pre-reduction effects (Takano et al.,
2007; Weber & Eric, 2006; Ding & Warner, 1997b; Lekatou & Walker,
1997; Pei & Wijk, 1993; Weber & Eric, 1993; Nunnington & Barcza, 1989;
Van Deventer, 1988; Dawson & Edwards, 1986; Katayama et al., 1986).
As an example, both clays contain CaO and SiO2 (Table 4–1), which have
been proven to have catalytic effects on chromite pre-reduction
(Par. 2.4.4.2). On the other hand, both clays also contained Al2O3 (Table
4–1) that has an inhibiting effect (Par. 2.4.4.2). However, these
statements are not entirely true, since the chemical composition of the
clays was presented (Table 4–1) according to common practice, i.e. as
simple oxides, but in fact it cannot be stated categorically that the
elements occur as these compounds. It is much more likely that the
elements are incorporated into the various mineral phases in forms other
than simple oxides. To quantify the catalytic and/or inhibiting effect of
each constituent of the two different clays on chromite pre-reduction
would constitute a study on its own. This was, however, beyond the
scope of this study.
4.8. Conclusions
Several important conclusions could be made from the results presented in this
chapter:
i) From a SEM-EDS investigation (Par. 4.2) of industrially produced pre-
reduced pellets it became evident that the functioning of a clay
binder within the pelletised chromite pre-reduced process has to be
evaluated within two different environments, i.e. performance within

RESULTS AND DISCUSSION 96
an oxidative environment (corresponding to the outer layer of the
industrially pre-reduced pellets) and performance within a reducing
environment (corresponding to the core of the industrially pre-
reduced pellets). This is in contrast with other chromite pelletised
processes, e.g. the oxidative sintered pelletised process (Beukes et al.,
2010; Outotec, 2009; Outotec, 2008) where only one condition
prevails.
ii) The compressive strengths of the oxidative sintered pellets were
approximately an order of magnitude higher than that of the pre-
reduced pellets (Par. 4.3). Similarly, the abrasion resistance strength
of the oxidative sintered pellets was also substantially better than
that of the pre-reduced pellets (Par. 4.4). Thus, although the
objective of the industrially applied pelletised chromite pre-reduced
process is to achieve maximum pre-reduction, the strength
(compressive and abrasion) of pre-reduced chromite pellets is
significantly enhanced by the thin oxidised outer layer.
iii) From compressive strengths (Par. 4.3) and abrasion resistance
(Par. 4.4) tests of the two case study clays it was clear that the
bentonite clay was superior in both pre-reducing and oxidative
sintering environments. This is significant, since the attapulgite clay is
currently the preferred option at both South African FeCr smelting
plants applying the pelletised chromite pre-reduction process.
iv) The compressive strength of the bentonite-containing pre-reduced
pellets generally improved with increased clay content; however,
increased attapulgite content did not result in any significant
increased compressive strength of the pre-reduced pellets (Par. 4.3).
Increasing the attapulgite clay content of the industrial pre-reduced
pellets might therefore not result in a stronger pellet core, although it
might aid the green strength, which was not considered in this study.

RESULTS AND DISCUSSION 97
v) For both the case study clays an increased clay addition resulted in a
slightly decreasing trend in compressive strengths of the oxidative
sintered pellets (Par. 4.3). This indicates that clay content addition is
not such an important parameter in attaining a strong oxidised outer
layer on the industrially produced pellets.
vi) It became apparent that predicting the performance, i.e. compressive
and abrasion strength, of a clay binder in the pelletised chromite pre-
reduction process based on chemical and mineralogical analyses of
the clays is unlikely, even if such analyses are done in considerable
detail, as presented in Par. 4.1.
vii) Ash fusion analysis, both in oxidative and reducing conditions, of the
two case study clays (Par. 4.5) gave some insight into the possible
reason why the specific bentonite considered outperformed the
specific attapulgite considered. The bentonite had a lower melting
point (construed as incorporating all four measured ash fusion
temperatures) implying that it could at lower temperature than the
attapulgite start forming bridges between the particles. The
attapulgite’s fluid temperatures in both oxidative and reducing
environments were above 1300 °C, implying that it might not have
fully liquefied under the experimental conditions.
viii) Although not quantitatively investigated, TMA analysis indicated that
the hot strength of the attapulgite pellets could be weaker than the
bentonite-containing pellets (Par. 4.6).
ix) Higher clay contents resulted in lower pre-reduction levels for both
clays and both temperature profiles investigated (Par. 4.7). This is
significant within the industrial process, since higher clay contents are
on occasion utilised to achieve improved green strength of the
uncured pellets. Results indicated that 0.76 to 0.99% lower pre-
reduction levels can be expected if 4 wt% instead of 3 wt% clay
RESULTS AND DISCUSSION 98
addition is made. Using data published by Niayesh and Fletcher
(1986) it was indicated that this related to significant additional
electricity consumption and financial loss.
x) The average pre-reduction of the bentonite-containing pellets were
consistently higher than that of the attapulgite-containing pellets
(Par. 4.7). It was calculated that the bentonite-containing pellets had
on average 1.7 % higher pre-reduction levels with both temperature
profiles. This is significant, since the attapulgite is currently the
preferred industrial option, mostly due to raw material cost
considerations. Again using data of Niayesh and Fletcher (1986) as a
guide, the difference in pre-reduction was again converted to possible
electricity and financial losses that were significant.
xi) The reason why the bentonite-containing pellets performed better
with regard to pre-reduction was attributed to two possibilities: i) the
case study bentonite had a lower melting point (Par. 4.5) that the
case study attapulgite, thus it might already melt during the pre-
reduction process, hence serve as a flux in promoting metal reduction
or ii) the minerals present in the two different clays could contain
materials that could serve to catalyse or inhibit the pre-reduction of
chromite

CONCLUTION 99
CHAPTER 5: PROJECT EVALUATION AND FUTURE
PERSPECTIVES
5.1. Project evaluation
The project was evaluated using the objectives set in Chapter 1. The points
listed below therefore correlate with the objectives set in Par. 1.2:
i) A comprehensive literature survey was conducted (Chapter 2). The
importance of South Africa’s ferrochrome industry was justified in
terms of chromite resources (Par. 2.2.3) and ferrochrome production
(Par. 2.2.4). Factors influencing this industry were discussed in the
light of economic and market considerations (Par. 2.2.1) and
electricity supply, as one of these factors, was highlighted (Par. 2.2.2).
Form the core processes and techniques discussed in Par. 2.3 it was
evident that, although various processes are utilised for the
production of FeCr, pre-reduction seem to be the most viable option
to reduce a FeCr smelter plant’s specific energy consumption.

CONCLUTION 100
Chromite pre-reduction was found to be a well-established practice in
the South African FeCr production industry (Par. 2.4.1). The use
thereof poses numerous advantages for FeCr producers (Par. 2.4.2).
Numerous studies have been conducted on the effect of additives on
chromite pre-reduction (Par. 2.4.4.2). It was therefore clear that
apart for the clay acting as a binding agent, it could also be considered
as an additive of which the effect on chromite pre-reduction needs to
be established. In a general overview of clay binders utilised for the
agglomeration of ore (Par. 2.5), the functions and requirements that a
clay binder need to fulfil was established (Par. 2.5.1). In general
bentonite seems to be the preferred choice for an ore binding agent,
as a number of researches have been conducted on bentonite as
binder and its mechanism for ore agglomeration (Par. 2.5.2.2). In
contrast, very little has been published on the possible utilisation of
attapulgite as a binder for ore pelletisation.
ii) In order to draw comparisons between experimental results and the
industry, typical raw materials were obtained from a local FeCr
producer actually applying the chromite pre-reduction process. These
materials were extensively characterised (Par. 4.1). Industrially
produced chromite pre-reduced pellets were also obtained from the
same FeCr producer and visually (SEM), as well as surface-chemically
characterised (SEM-EDS).
iii) SEM-EDS analysis showed that chromite pre-reduced pellets consisted
of an oxidised outer layer containing small amounts of carbon and a
pre-reduced core containing a substantial amount of carbon
(Par. 4.2). It was thus decided to distinguish between these two
zones and test the two case study clays performances in oxidative
sintered and pre-reduced environment.

CONCLUTION 101
iv) Various experiments were designed and conducted to test the
performance of the two case study clays (Par. 4.3-4.7).
v) Apart from making an academic contribution in this study, various
industrial relevant recommendations dealing with the selection of
clay binder for chromite pre-reduction could be made (Par. 4.8).
vi) The final objective concerning recommendations with regard to
further research work is discussed in Par. 5.2.
5.2. Future perspectives
From the literature survey and results three recommendations can be made
with regard to further work related to this research area:
i) The catalytic and/or inhibiting effect of clay binders on pre-reduction
needs to be investigated in more detail in future, as to identify the
mineral species present in clay binders responsible for
catalytic/inhibiting effects. This would aid industry in selecting the
most appropriate clay binders.
ii) From studies conducted by Ripke & Kawatra it was found that
bentonite clay formed fibres when prepared under proper moisture
and mechanical mixing conditions. Bentonite also became more
effective as a binder when mixed in a manner that promoted fibre
formation. Considering the above mentioned results, could it be
possible to improve the strength of chromite pre-reduced pellets or
minimise the clay addition needed to produce good quality pellets by
developing bentonite into a fibrous matrix by manipulating conditions
to promoted fibre formation. This would be advantageous as it was
shown in Par. 4.7 that an increase in clay content resulted in lower
pre-reduction levels. It should also be established if a bentonite clay’s
characteristics would have an effect on fibre development.

CONCLUTION 102
iii) From the literature study conducted it became evident that little has
been published on the attapulgite agglomeration mechanism.
Considering the current use of attapulgite by the FeCr industry, more
work in the field is required.
5.3. Final remarks
In conclusion, the author (the candidate) would like to asses this MSc
dissertation using the exit level outcomes prescribe for a Master Scientiae
degree by the North-West University. In short, the exit level outcomes to which
an MSc dissertation should comply are listed:
i) Identification and formulation of a problem statement.
ii) Setting specific objective that are relevant to the problem, that is
both measurable and achievable.
iii) Thorough investigation of existing knowledge as reflected in
appropriate scientific literature.
iv) Appropriate research to solve the problem.
v) Scientific evaluation of the results in the context of the problem
statement.
vi) Scientific communication of the results in the form of a dissertation.
From the candidate’s point of view these exit level requirements were
successful achieved. Additionally a meaningful scientific contribution was made
in understanding the role and unique challenges of a clay binder in a pelletised
chromite pre-reduction process. As the true measure of scientific research is
the acknowledgment of the work by peers, the candidate intends on publishing
the results obtained. Since it is not required at MSc level to make a significantly
new scientific contribution, the abovementioned contribution can therefore be

CONCLUTION 103
regarded as sufficient proof that this study surpassed the requirements of an
MSc.

BIBLIOGRAPHY 104
BIBLIOGRAPHY
ABUBAKRE, O.K., MURIANA, R.A. & NWOKIKE, P.N. 2007. Characterization and
beneficiation of Anka chromite ore using magnetic separation process. Journal
of Minerals & Materials Characterization & Engineering, 6(2):143-150.
AKYÜZIÜ, M. & ERIC, R.H. 1992. Slag-metal equilibrium in the smelting of high-
carbon ferrochromium. Journal of the South African Institute of Mining and
Metallurgy, 92(4):101-110.
ANON. 1974. Chromium. Medical and Biologic Effects of Environmental
Pollutants. Washington D.C., USA: National Academy of Sciences. 155p.
ASTM. 2007. D3172-07A Standard Practice for Proximate Analysis of Coal and
Coke. In: American Society for Testing and Materials (ASTM), Book of
Standards v 05.06-Gaseous Fuels; Coal and Coke, West Conshohocken, USA.
ATTACLAY (PTY) LTD. 2011. Product info. http://www.attaclay.co.za Date of
access: 20 June 2011.
BAKER, R. 2006. Poor planning. Business Day, 3 May.
BALL, D.F., FITTON, J.T., DAWSON, P.R. & GOLDRING, D.C. 1974. Effect of
Additives on the Strength of Fired Iron Ore Pellets. Transactions of the
Institution of Mining and Metallurgy, 83C(808):47-58.
BARNES, A.R., FINN, C.W.P. & ALGIE, S.H. 1983. The prereduction and smelting
of chromite concentrate of low chromium-to-iron ratio. Journal of the South
African Institute of Mining and Metallurgy:49-54. March.
BIBLIOGRAPHY 105
BASSON, J., CURR, T.R. & GERICKE, W.A. 2007. South Africa's Ferro Alloy
Industry-Present Status and Future Outlook. (In Proceedings of The 11th
International Ferro Alloys Conference. New Delhi, India: Indian Ferro Alloy
Producers’ Association (IFAPA). p. 3-24.)
BEUKES, J.P., DAWSON, N.F. & VAN ZYL, P.G. 2010. Theoretical and practical
aspects of Cr(VI) in the South African ferrochrome industry. The Journal of The
Southern African Institute of Mining and Metallurgy, 110(12):743-750.
BEUKES, J.P., VAN ZYL, P.G. & RAS, M. 2011. Treatment of Cr(VI) containing
wastes in the South African ferrochrome industry - A review of currently applied
methods. Submitted to The Journal of The Southern African Institute of Mining
and Metallurgy
BONGA, M. 2009. Ferrous mineral commodities produced in the Republic of
South Africa 2009. Directorate: Mineral Economics, Department: Minerals and
Energy, Republic of South Africa. Date of access: 5 March 2011.
<http://www.dmr.gov.za/Mineral_Information/New/D8%202009.pdf.>
BOTHA, W. 2003. Ferrochrome production through the SRC process at Xstrata,
Lydenburg Works. Journal of the South African Institute of Mining and
Metallurgy, 103(6):373-389.
CHAKRABORTY, D., RANGANATHAN, S. & SINHA, S.N. 2007. Influence of
temperature and particle size on reduction of chromite ore. (In Proceedings of
The 11th International Ferro Alloys Conference. New Delhi, India. p. 144-152.)
CIULLO, P.A. 1996. Industrial minerals and their uses: a handbook and
formulary. New Jersey, USA: Noyes Publications.
COWEY, A. 1994. Mining and Metallurgy in South Africa - A Pictorial History.
Randburg, South Africa.

BIBLIOGRAPHY 106
CRAMER, L.A. 2001. The Extractive Metallurgy of South Africa’s Platinum Ores.
Journal of the Minerals, metals, and Materials Society:14-18. October.
CRAMER, L.A., BASSON, J. & NELSON, L.R. 2004. The impact of platinum
production from UG2 ore on ferrochrome production in South Africa. The
Journal of The South African Institute of Mining and Metallurgy, 104(9):517-
527. October.
CREAMER, M. 2010. Energy for Xstrata's R4,9bn Lion ferrochrome add-on, plus
new R700m mine. Mining Weekly, 20 October.
CREAMER, M. 2011. Merafe lobbying 2011 curb on raw chrome exports – CEO.
Mining Weekly, 1 March.
CRU. 2010. Ferrochrome cost and market service. Mount Pleasant, London.
CURR, T. 2009. History of DC arc furnace process development. (In Mintek 75 -
A celebration of technology. Randburg, South Africa. [online]. [Accessed 13
May 2011]. Available from World Wide Web:
http://www.mintek.co.za/Mintek75/Proceedings. )
DAAVITTILA, J., HONKANIEMI, M. & JOKINEN, P. 2004. The transformation of
ferrochromium smelting technologies during the last decades. The Journal of
The South African Institute of Mining and Metallurgy:541-549. October.
DAWSON, N.F. & EDWARDS, R.I. 1986. Factors Affecting the Reduction Rate of
Chromite. (In Proceedings of the 4th International Ferro-alloys Congress. Sao
Paulo, Brazil. p. 105-113.)
DEAN, R.B. & DIXON, W.J. 1951. Simplified statistics for small numbers of
observations. Analytical Chemistry, 23(4):636-638.

BIBLIOGRAPHY 107
DENTON, G.M., BENNIE, J.P.W. & GE JONG, A. 2004. An improved DC-arc
process for chromite smelting. (In Proceedings of The 10th International
Ferroalloys Congress. Cape Town, South Africa. p. 60-67.)
DING, Y.L. & WARNER, N.A. 1997a. Catalytic reduction of carbon-chromite
composite pellets by lime. Thermochimica Acta, 292:85-94.
DING, Y.L. & WARNER, N.A. 1997b. Reduction of carbon-chromite composite
pellets with silica flux. Ironmaking and Steelmaking, 24(4):283-287.
DINNIN, J.I. 1959. Rapid Analysis of Chromite and Chrome Ore. Washington:
United States Goverment Printing Office.
DOS SANTOS, M. 2010. Meeting the challenges of sustainability through
technology development and intergration in ferroalloy submerged arc furnace
plant desing. (In The12th International Ferroalloys Congress. Helsinki, Finland.
p. 71-80.)
DOWNING, J.H., DEELEY, P.D. & FICHTE, R.M. 1986. A7 vols. Chromium and
chromium alloys. In: Ullmans Encyclopedia of industrial chemistry, Weinheim,
Germany: VCH, Verlagsgeschellschaft mbH. 43-65 p.
EISELE, T. C. & KAWATRA, S. K. 2003. A review of binders in iron ore
pelletization. Mineral Processing and Extractive Metallurgy Review, 24(1):1-90.
ELZEA, J. & MURRAY, H.H. 1994. Bentonite. In: CARR, D.D., ed. Industrial
Minerals and Rocks, 6th Edition ed. Littleton, Colorado, USA: Society for
Mining, Metallurgy, and Exploration Inc. 223-246 p.
ENRC. 2008. An Introduction to Ferrochrome. Date of access: 12 June 2010.
<http://www.enrc.com/PageFiles/1748/ENRC%20-
%20Ferrochrome%20presentation%208%20May%20FINAL%20PRINT%20V3.pdf
>

BIBLIOGRAPHY 108
EPA. 1996. EPA Method 3052, SW-846. Environmental Protection Agency (EPA).
ESKOM. 2009. Average Price Increases. http://www.eskom.co.za/live/content.p
hp?Item_ID=188 Date of access: 2 February 2011.
ESKOM. 2011. Eskom retail tariff adjustment for 2011/2012. Date of access: 13
October 2011. <http://www.eskom.co.za/content/priceincrease2011.pdf>
FEATHERSTONE, R.A. & BARCZA, N.A. 1982. The growth of ferro-alloy
production in South Africa. Date of access: 2 February 2011.
<http://www.mintek.co.za/Pyromet/Files/1982FeatherstoneBarcza.pdf>
G&W BASE (PTY) LTD. 2011. Bentonite Ocean MD. Date of access: 20 June
2011. <http://www.gwbase.co.za/pdfs/Pel-Bond.pdf>
GEDIGA, J. & RUSS, M. 2007. Life cycle inventory (LCI) update of primary
ferrochrome production. Leinfelden-Echterdingen.
GLASTONBURY, R.A., VAN DER MERWE, W., BEUKES, J.P., VAN ZYL, P.G.,
LACHMANN, G., STEENKAMP, CJH, DAWSON, N.F. & STEWART, H.M. 2010.
Cr(VI) generation during sample preparation of solid samples - A chromite ore
case study. Water SA, 36(1):105-109.
GRIM, R.E. 1968. Clay Mineralogy, 2nd ed. New York, USA: McGraw-Hill.
GU, F. & WILLS, B.A. 1988. Chromite- Mineralogy and Processing. Minerals
Engineering, 1(3):235-240.
HAYES, P.C. 2004. Aspects of SAF smelting of ferrochrome. (In Proceedings of
the 10th International Ferroalloys Congress. Cape Town, South Africa. )
HOLAPPA, L. & XIAO, Y. 2004. Slags in ferroalloys production—review of
present knowledge. The Journal of The South African Institute of Mining and
Metallurgy, 104(7):429-437. August.

BIBLIOGRAPHY 109
HOWAT, D.D. 1986. Chromium in South Africa. Journal of The South African
Institute of Mining and Metallurgy, 86(2):37-50, Feb.
ICDA. 2010. Statistical Bulletin. Paris, France.
IDEAS 1ST RESEARCH. 2010. Ferrochrome March 2010. Date of access: 2
Febuary 2011. <http://ideasfirst.in/Admin/Downloads/Reports/1720868194_Ch
rome-Ferrochrome%20-%20Final%20-%2031Mar20101.pdf>
IETEG. 2005. Chromium(VI) Handbook. Boca Raton, USA: CRC Press. 784p.
JONES, R. 2010. Pyrometallurgy in South Africa. Date of access: 3 March 2011.
<http://www.pyrometallurgy.co.za/PyroSA/index.htm >
KATAYAMA, H.G., TOKUDA, M. & OHTANI, M. 1986. Promotion of the
Carbothermic Reduction of Chromium Ore by the Addition of Borates. The Iron
and Steel Institute of Japan, 72(10):1513-1520.
KAWATRA, S.K. & RIPKE, S.J. 2001. Developing and understanding the
bentonite fiber bonding mechanism. Minerals Engineering, 14(6):647-659.
KAWATRA, S.K. & RIPKE, S.J. 2002. Effects of bentonite fiber formation in iron
ore pelletization. International Journal of Mineral Processing, 65(3-4):141-149.
KAWATRA, S.K. & RIPKE, S.J. 2003. Laboratory studies for improving green ball
strength in bentonite-bonded magnetite concentrate pellets. International
Journal of Mineral Processing, 72:429-441.
KINGSTON, H.M. & WALTER, P.J. 1998. The Art and Science of Microwave
Sample Preparations for Trace and Ultratrace Elemental Analysis. In:
MONTASER, A., ed. In Inductively Coupled Mass Spectrometry, New York, USA:
Wiley-VCH. 964 p.
BIBLIOGRAPHY 110
KONTA, J. 1995. Clay and man: Clay raw materials in the service of man.
Applied Clay Science, 10:275-335.
LEKATOU, A. & WALKER, R.D. 1997. Effect of SiO2 addition on solid state
reduction of chromite concentrates. Ironmaking and Steelmaking, 24(2):133-
143.
LIDE, D.R., ed. 2009. CRC Handbook of Chemistry and Physics, 89th edition
(Internet Version). Boca Raton, USA: CRC Press/Taylor and Francis. 2692p.
LUNGU, J. 2010. Mining and the impact of the recession in the southern African
development community states. Date of access: 2 February 2010.
<http://www.sarwatch.org/sarwadocs/john_lungu/module1_SARW_Importanc
e_of_mining_in_SADC.pdf>
LYAKISHEV, N.P. & GASIK, M.I. 1998. Metallurgy of Chromium. New York, USA:
Allerton Press Inc.
MAKHOBA, G. & HURMAN ERIC, R. 2010. Reductant characterization and
selection for ferrochromium production. (In Proceedings of The 12th
International Ferroalloys Congress. Helsinki, Finland: Outotec Oyj. p. 359-365.)
MCCULLOUGH, S., HOCKADAY, S., JOHNSON, C. & BARCZA, N.A. 2010. Pre-
reduction and smelting characteristics of Kazakhstan ore samples. (In
Proceedings of The 12th International Ferroalloys Congress. Helsinki: Outotec
Oyj. p. 249-262.)
MOORE, D.M. & REYNOLDS, R.C. 1997. X-Ray Diffraction and the Identification
and Analysis of Clay Minerals. New York, USA: Oxford University Press.

BIBLIOGRAPHY 111
MURRAY, H.H. 2002. Industrial Clays Case Study. Mining, Minerals and
Sustainable Development project No. 64 of the International Institute for
Environment and Development (IIED). Date of access: 19 October 2011.
<http://pubs.iied.org/pubs/pdfs/G00556.pdf>
MURRY, H.H. 1991. Overview - clay mineral applications. Applied Clay Science,
5:379-395.
MURTHY, Y.R., TRIPATHY, S.K. & KUMAR, C.R. 2011. Chrome ore beneficiation
challenges & opportunities – A review. Minerals Engineering, 24(5):375-380.
NAFZIGER, R.H. 1982. A review of the deposits and beneficiation of lower-
grade chromite. Journal of The South African Institute of Mining and
Metallurgy:205-226, Aug. August.
NAIKER, O. 2007. The development and advantages of Xstrata’s Premus
Process. (In Proceedings of The 11th International Ferroalloys Congress. New
Delhi, India. p. 112-119.)
NAIKER, O. & RILEY, T. 2006. Xstrata Alloys in Profile. (In Southern African
Pyrometallurgy. Johannesburg, South Africa: South African Institute of Mining
and Metallurgy. p. 297-306.)
NEIZEL, B.W. 2010. Alteration of chrome-to-iron ratio in chromite ore by
chlorination. Potchefstroom: North-West University (Dissertation - M.Sc.). 90
p.
NEL, M.V., STRYDOM, C.A., SCHOBERT, H.H., BEUKES, J.P. & BUNT, J.R. 2011.
Comparison of sintering and compressive strength tendencies of a model coal
mineral mixture heat-treated in inert and oxidizing atmospheres. Fuel
Processing Technology, 92(5):1042-1051.

BIBLIOGRAPHY 112
NERSA. 2009a. Eskom price increase application 2009. Date of access: 8
September 2011. <http://www.nersa.org.za/Admin/Document/Editor/file/Elect
ricity/PricingandTariffs/Eskom%20Current%20Price%202009-10.pdf>
NERSA. 2009b. Histroric Eskom Average Selling Price. Date of access: 8
September 2011. <http://www.nersa.org.za/Admin/Document/Editor/file/Elect
ricity/PricingandTariffs/Eskom%20Historic%20Prices.pdf>
NERSA. 2009c. Inductive Future Eskom Price Direction. Date of access: 8
September 2011. <http://www.nersa.org.za/Admin/Document/Editor/file/Elect
ricity/PricingandTariffs/Eskom%20Future%20Pricepath.pdf>
NEWMAN, A.C.D., ed. 1987. Chemistry of clays and clay minerals. Essex,
England: Longman Scientific & Technical.
NIAYESH, M.J. & FLETCHER, G.W. 1986. An assessment of Smelting Reduction
Processes in the Production of Fe-Cr-C Alloys. (In Proceedings of the 4th
International Ferro-alloys Congress. Sao Paulo, Brazil. p. 115-123.)
NIEMELÄ, P., KROGERUS, H. & OIKARINEN, P. 2004. Formation,
characterization and utilization of CO-gas formed in ferrochrome smelting. (In
Proceedings of The 12th International Ferroalloys Congress. Cape Town, South
Africa. p. 68-77.)
NRIAGU, O.J. & NIEBOER, E. 1988. Chromium in the Natural and Human
Environments, Volume 20 of Advances in environmental science and
technology. New York, USA: Wiley-Interscience. 571p.
NUNNINGTON, R.C. & BARCZA, N.A. 1989. Pre-reduction of fluxed chromite-
ore pellets under oxidizing conditions. (In Proceedings of The 5th International
Ferroalloys Congress. New Orleans, USA. p. 55-68.)

BIBLIOGRAPHY 113
OUTOTEC. 2008. Outotec. http://www.outotec.com/default_6764.aspx?epslang
uage=EN Date of access: 21 October 2008.
OUTOTEC. 2009. Ferrochrome smelting with OPK™ Preheating Kiln. Date of
access: 19 October 2011. <http://www.outotec.com/37992.epibrw>
OUTOTEC. 2011. Preheating and smelting. http://www.outotec.com/pages/Pag
e____38387.aspx?epslanguage=EN Date of access: 3 May 2011.
OWADA, S. & HARADA, T. 1985. Grindability and magnetic properties of
chromites. Journal of The Mining and Metallurgical Institute of Japan, 101:781.
PACIFIC EXCHANGE RATE SERVICE. 2011. The University of British Columbia,
Vancouver BC, Canada, Sander School of Business, Database retrieval system.
http://fx.sauder.ubc.ca/data.html. Date of access: 2 February 2011.
PAPP, J.F. 2008. Chromium. Minerals Yearbook–2008 (Chromium – Advance
release). Date of access: 2 February 2011. <http://minerals.usgs.gov/minerals/p
ubs/commodity/chromium/myb1-2008-chrom.pdf>
PAPP, J.F. 2009a. 2009 Minerals Yearbook Chromium [Advance Release].
Date of access: 19 October 2011. <http://minerals.usgs.gov/minerals/pubs/com
modity/chromium/myb1-2009-chrom.pdf>
PAPP, J.F. 2009b. Chromium. Date of access: 2 February 2011.
<http://minerals.usgs.gov/minerals/pubs/commodity/chromium/mcs-2009-
chrom.pdf>
PAPP, J.F. 2011. Chromium. Date of access: 19 October 2011.
<http://minerals.usgs.gov/minerals/pubs/commodity/chromium/mcs-2011-
chrom.pdf>
PEI, W. & WIJK, O. 1993. A kinetic study on chromite ore smelting reduction.
Scandinavian Journal of Metallurgy, 22:38-44.
BIBLIOGRAPHY 114
PFISTER, J. 2006. The Eskom plan to meet Government’s 6% GDP aspiration.
Eskom, 27 March.
PISTORIUS, P.C. 2002. Reductant selection in ferro-alloy production: The case
for the importance of dissolution in the metal. The Journal of The South African
Institute of Mining and Metallurgy:33-36. January/February.
REEVES, G.M., SIMS, I. & CRIPPS, J.C., eds. 2006. Clay materials used in
construction. Bath, UK: The Geological Society Publishing House.
RIEKKOLA-VANHANEN, M. 1999. Finnish expert report on best available
techniques in ferrochromium production. Helsinki.
RIPKE, S.J. & KAWATRA, S.K. 2000a. Can fly-ash extend bentonite binder for
iron ore agglomeration? International Journal of Mineral Processing, 60:181-
198. Desember.
RIPKE, S.J. & KAWATRA, S.K. 2000b. Iron ore pellet binding mechanisms
pozzolanic vs. physical binders. (In Proceedings of the 21st International
Mineral Processing Congress. Rome, Italy: Elsevier Press. p. A4 120- A4 127.)
RIPKE, S.J. & KAWATRA, S.K. 2000c. Fibrous bonding mechanisms for reducing
bentonite dosage. American Foundry Society Transactions, 108:101-104.
ROZA, G. 2008. Understanding the Elements of the Periodic Table – Chromium.
New York, USA: The Rosen Publishing Group, Inc. 49p.
SASTRY, K. V. S. 1996a. Role of Bentonite in the Balling of Iron Ore Concentrates.
Presentation given at the Bentonite Task Force Meeting of the Empire Pellet
Plant, January 17.
SASTRY, K.V.S. 1996b. Process Engineering Principles of Iron Ore Balling Circuits.
Presentation to Cliffs Mining Services Co., April 3.

BIBLIOGRAPHY 115
SCHNEIDER, T. & JENSEN, K.A. 2008. Combined single-drop and rotating drum
dustiness test of fine to nanosize powders. Annals of Occupational Hygiene,
52(1):23-34.
SCHROEDER, H.A. 1970. Chromium. Air Quality Monograph #70-15. Washington
D.C., USA: American Petroleum Institute. 28p.
SENTULA. 2008. Nkomati Anthracite (Pty) Ltd. Date of access: 19 June 2011.
<http://www.sentula.co.za/pdf/Presentation%20Nkomati%20Site%20Visit%201
0-09-2008.pdf>
SINGH, V. & MOHAN RAO, S. 2008. Study the effect of chromite ore properties
on pelletisation process. International Journal of Mineral Processing, 88:13-17.
SING, V., TATHAVADKAR, V., MOHAN RAO, S. & RAJU, K.S. 2007. Predicting the
performance of submerged arc furnace with varied raw material combinations
using artificial neural network. Journal of Materials Processing Technology,
183:111-116.
SME. 2006. Industrial minerals & rocks: commodities, markets, and uses, 7th ed.
Littleton, Colorado, USA: Society for Mining, Metallurgy, and Exploration (SME)
Inc.
SMIERNOW, G.A., DOHENY, E.L. & KAY, J.G. 1980. Bonding mechanisms in sand
aggregates. (In AFS Transactions, Proceedings of the 84th Annual Meeting. p.
659-682.)
SOYKAN, O, ERIC, R.H. & KING, R.P. 1991a. The reduction mechanism of a
natural Chromite at 1416 C. Metallurgical Transactions B, 22B:53-63.
SOYKAN, O, ERIC, R.H. & KING, R.P. 1991b. Kinetics of the reduction of
Bushveld Complex chromite ore at 1416 C. Metallurgical Transactions B,
22B:801-810.
BIBLIOGRAPHY 116
TAKANO, C., ZAMBRANO, A.P., NOGUEIRA, A.E.A., MOURAO, M.B. & IGUCHI, Y.
2007. Chromites Reduction Reaction Mechanisms in Carbon–Chromites
Composite Agglomerates at 1 773 K. ISIJ International, 47(11):1585-1589.
VAN DEVENTER, J.S.J. 1988. The effect of additives on the reduction of
chromite by graphite. Thermochimica Acta, 127:25-35.
VAN OLPHEN, H. 1987. Dispersion and Flocculation. In: NEWMAN, A.C.D., ed.
Chemistry of Clays and Clay Minerals, Mineralogial Society Monograph No. 6
ed. Essex, England: Longman Scientific and Technical.
VELDE, B. & MEUNIER, A. 2008. The Origin of Clay Minerals in Soils and
Weathered Rocks. Berlin Heidelberg, Germany: Springer.
WAIT, M. 2011. Xstrata opens new mining complex in Steelpoort. Mining
Weekly, 4 March.
WEBER, P. & ERIC, R.H. 1992. Solid-state Fluxed Reduction of LG-6 Chromite
from the Bushveld Complex. (In Proceedings of The 6th International
Ferroalloys Congress. Cape Town, South Africa. p. 71-77.)
WEBER, P. & ERIC, R.H. 1993. The Reduction Mechanism of Chromite in the
Presence of a Silica Flux. Metallurgical Transactions B, 24B:987-995.
December.
WEBER, P. & ERIC, R.H. 2006. The reduction of chromite in the presence of
silica flux. Minerals Engineering, 19:318-324.
WENNINGER, C.E. & GREEN, R.A. 1970. Water-Clay Entities on Grain Surfaces
as Defined by a Scanning-Type Electron Microscope. Transactions of the
American Foundrymen’s Society, 78:40-44.
XIAO, Z & LAPLANTE, A. 2004. Characterizing and recovering the platinum
group minerals – a review. Minerals Engineering, 17:961-979.

BIBLIOGRAPHY 117
XSTRATA. 2011a. Helena mine. Date of access: 19 June 2011.
<http://www.xstrataalloys.com/EN/Operations/Pages/HelenaMine.aspx>
XSTRATA. 2011b. Lydenburg plant. Date of access: 19 June 2011.
<http://www.xstrataalloys.com/EN/Operations/Pages/LydenburgPlant.aspx>