unique capabilities of gas chromatography vacuum ... · unique capabilities of gas chromatography...
TRANSCRIPT

Unique Capabilities of Gas Chromatography –
Vacuum Ultraviolet Spectroscopy
Kevin A. Schug, Ph.D.
Department of Chemistry & Biochemistry,
The University of Texas at Arlington, Arlington TX
Disclaimer: KAS is a member of the Scientific Advisory Board for
VUV Analytics, Inc.
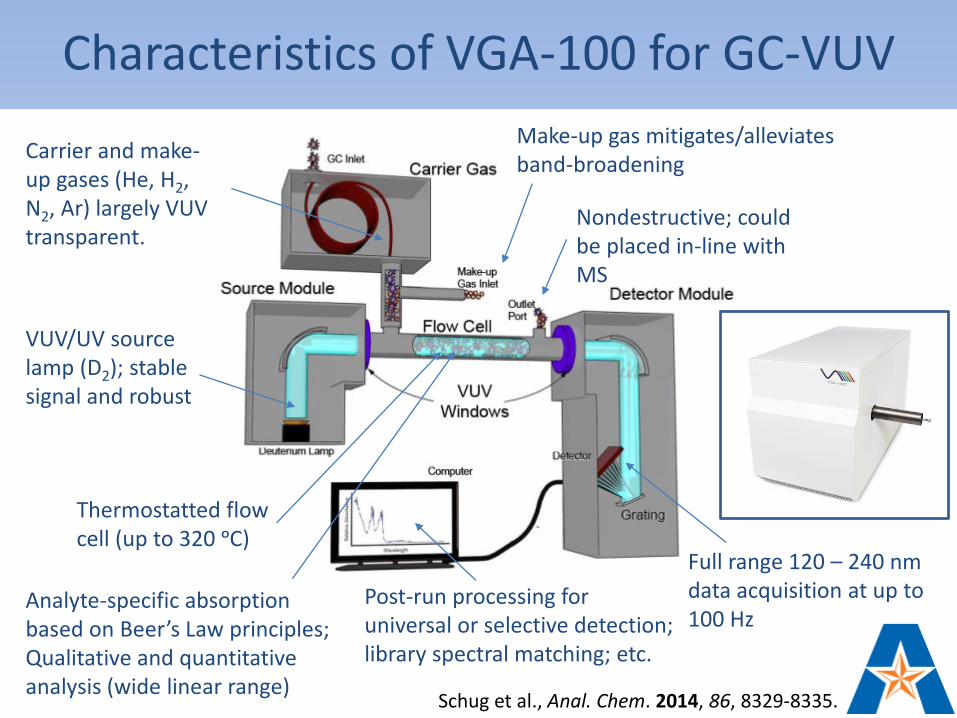
Characteristics of VGA-100 for GC-VUV
Make-up gas mitigates/alleviates band-broadening
Nondestructive; could be placed in-line with MS
Full range 120 – 240 nm data acquisition at up to 100 Hz
VUV/UV source lamp (D2); stable signal and robust
Thermostatted flow cell (up to 320 ᵒC)
Carrier and make-up gases (He, H2, N2, Ar) largely VUV transparent.
Post-run processing for universal or selective detection; library spectral matching; etc.
Analyte-specific absorption based on Beer’s Law principles; Qualitative and quantitative analysis (wide linear range)
Schug et al., Anal. Chem. 2014, 86, 8329-8335.
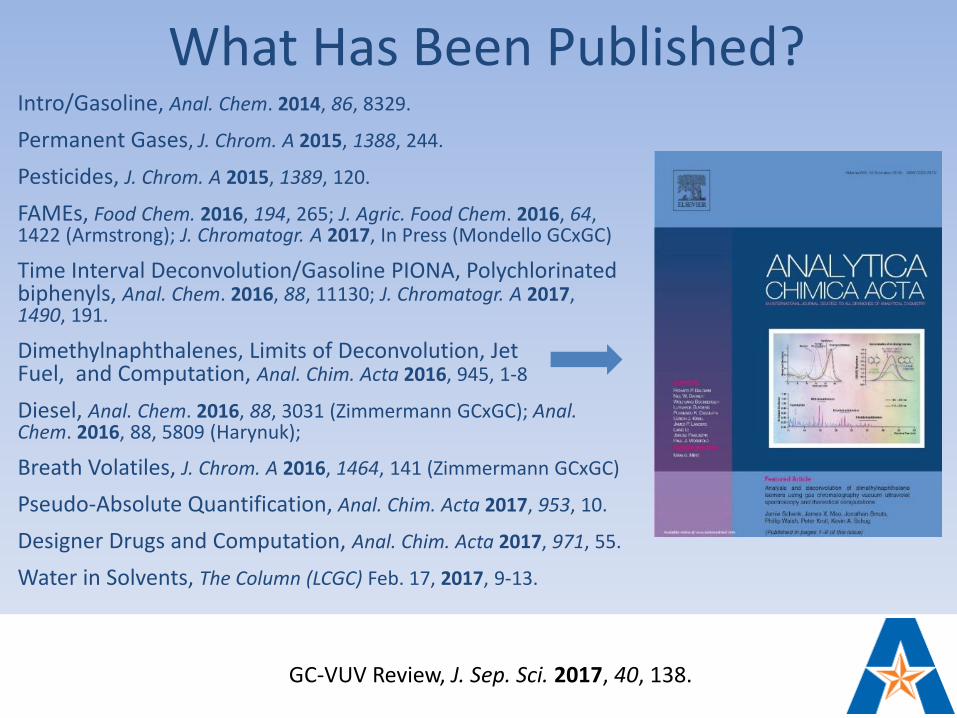
What Has Been Published?Intro/Gasoline, Anal. Chem. 2014, 86, 8329.
Permanent Gases, J. Chrom. A 2015, 1388, 244.
Pesticides, J. Chrom. A 2015, 1389, 120.
FAMEs, Food Chem. 2016, 194, 265; J. Agric. Food Chem. 2016, 64, 1422 (Armstrong); J. Chromatogr. A 2017, In Press (Mondello GCxGC)
Time Interval Deconvolution/Gasoline PIONA, Polychlorinated biphenyls, Anal. Chem. 2016, 88, 11130; J. Chromatogr. A 2017, 1490, 191.
Dimethylnaphthalenes, Limits of Deconvolution, Jet Fuel, and Computation, Anal. Chim. Acta 2016, 945, 1-8
Diesel, Anal. Chem. 2016, 88, 3031 (Zimmermann GCxGC); Anal. Chem. 2016, 88, 5809 (Harynuk);
Breath Volatiles, J. Chrom. A 2016, 1464, 141 (Zimmermann GCxGC)
Pseudo-Absolute Quantification, Anal. Chim. Acta 2017, 953, 10.
Designer Drugs and Computation, Anal. Chim. Acta 2017, 971, 55.
Water in Solvents, The Column (LCGC) Feb. 17, 2017, 9-13.
GC-VUV Review, J. Sep. Sci. 2017, 40, 138.
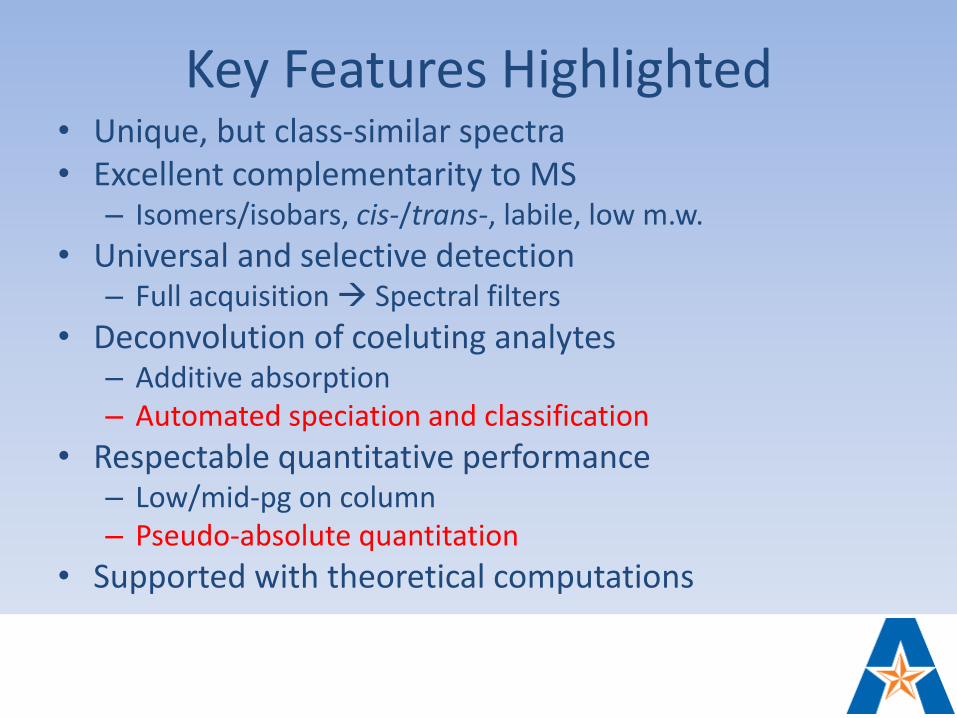
Key Features Highlighted• Unique, but class-similar spectra• Excellent complementarity to MS
– Isomers/isobars, cis-/trans-, labile, low m.w.
• Universal and selective detection– Full acquisition Spectral filters
• Deconvolution of coeluting analytes– Additive absorption– Automated speciation and classification
• Respectable quantitative performance– Low/mid-pg on column– Pseudo-absolute quantitation
• Supported with theoretical computations
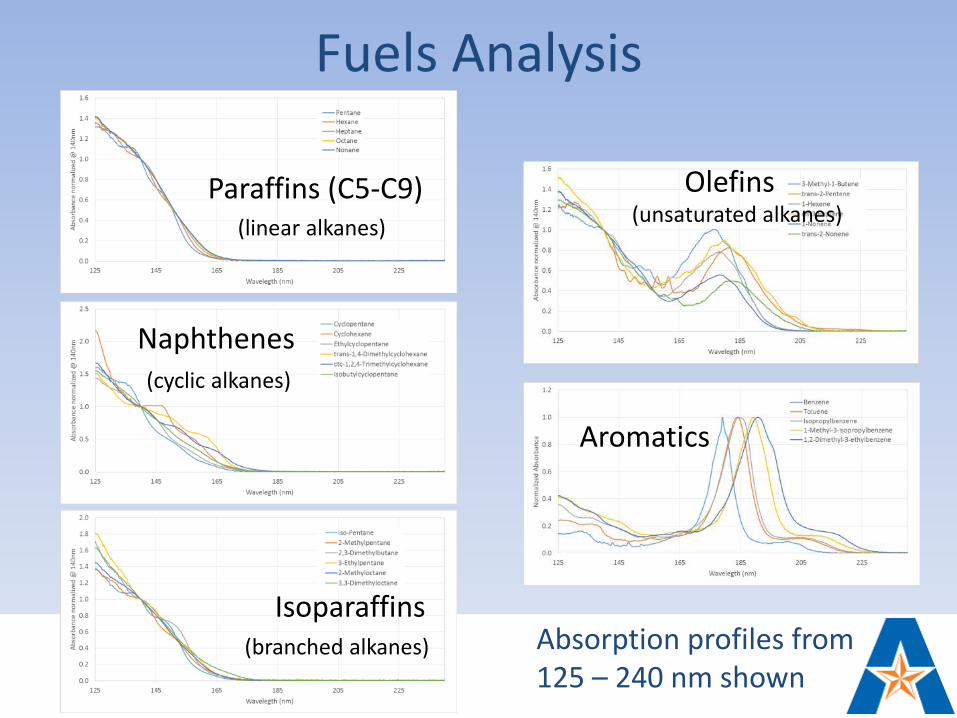
Paraffins (C5-C9)
Isoparaffins
Naphthenes
Fuels Analysis
(linear alkanes)
(branched alkanes)
(cyclic alkanes)
Absorption profiles from 125 – 240 nm shown
Olefins(unsaturated alkanes)
Aromatics

Gasoline Proficiency Standards
30 m nonpolar column Oven ramp: 30 0C 10min, 7 0C/min 200 0CInjector temperature: 250 0C Injection volume: 0.3 uLSplit Ratio: 50:1 Carrier flow rate: 1 mL/min
125 – 160 nm170 – 200 nm
Spectral Filters
Samples courtesy of Valero
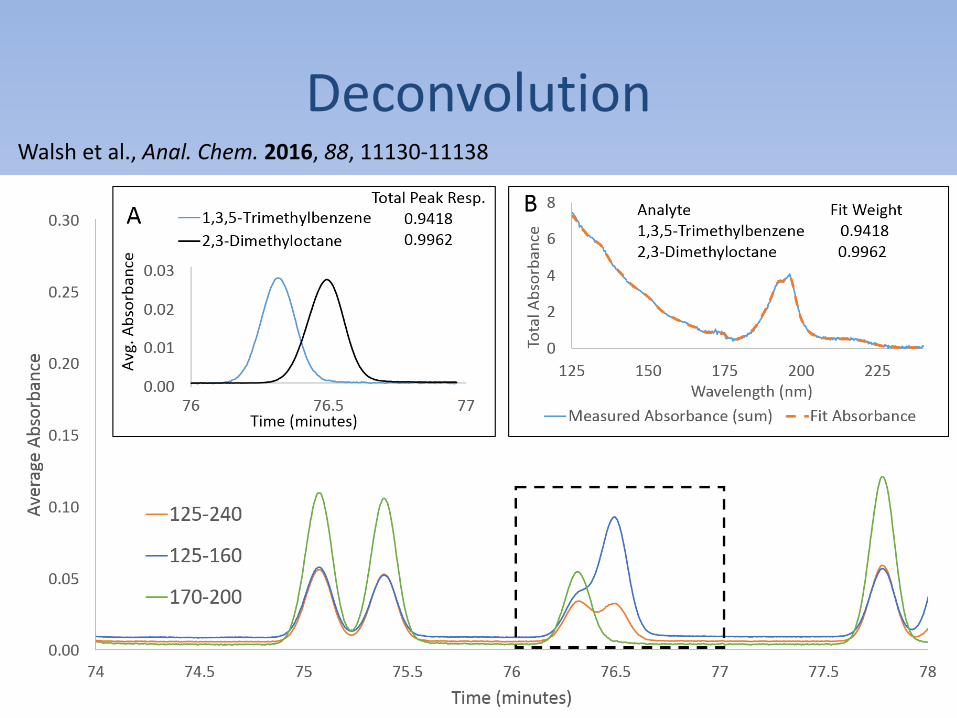
DeconvolutionWalsh et al., Anal. Chem. 2016, 88, 11130-11138
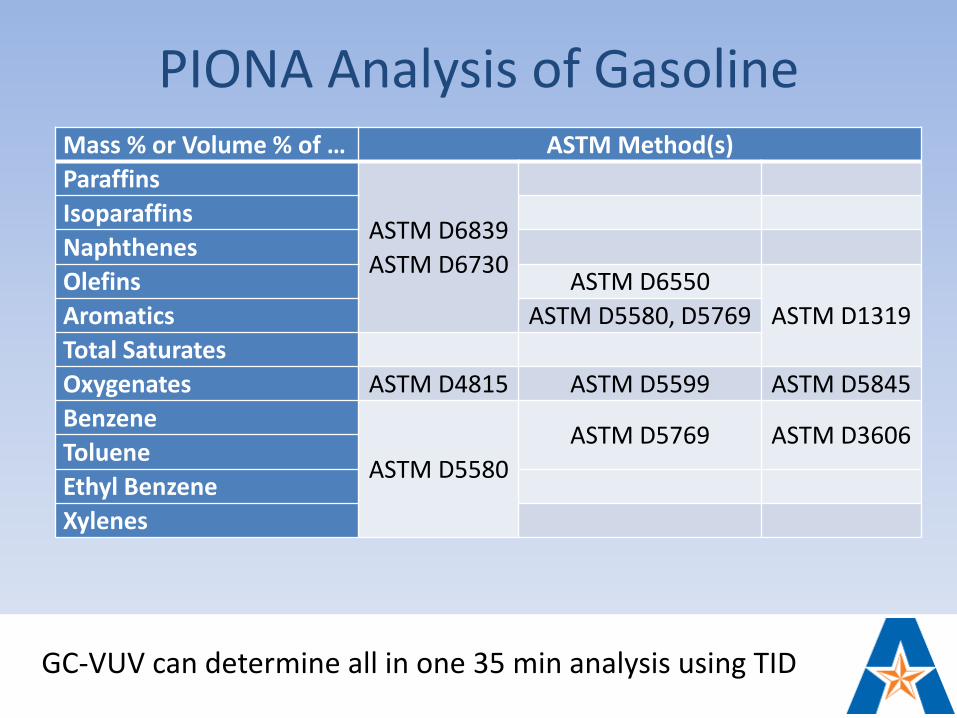
PIONA Analysis of GasolineMass % or Volume % of … ASTM Method(s)
Paraffins
ASTM D6839
ASTM D6730
Isoparaffins
Naphthenes
Olefins ASTM D6550
ASTM D1319Aromatics ASTM D5580, D5769
Total Saturates
Oxygenates ASTM D4815 ASTM D5599 ASTM D5845
Benzene
ASTM D5580
ASTM D5769 ASTM D3606Toluene
Ethyl Benzene
Xylenes
GC-VUV can determine all in one 35 min analysis using TID
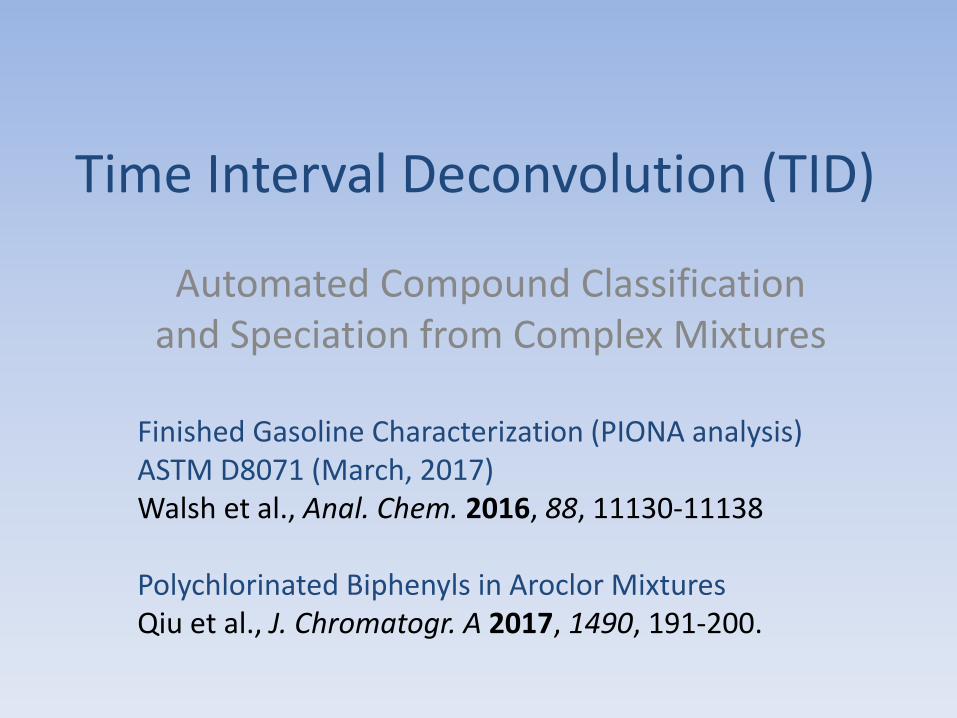
Time Interval Deconvolution (TID)
Automated Compound Classification and Speciation from Complex Mixtures
Finished Gasoline Characterization (PIONA analysis)ASTM D8071 (March, 2017)Walsh et al., Anal. Chem. 2016, 88, 11130-11138
Polychlorinated Biphenyls in Aroclor MixturesQiu et al., J. Chromatogr. A 2017, 1490, 191-200.
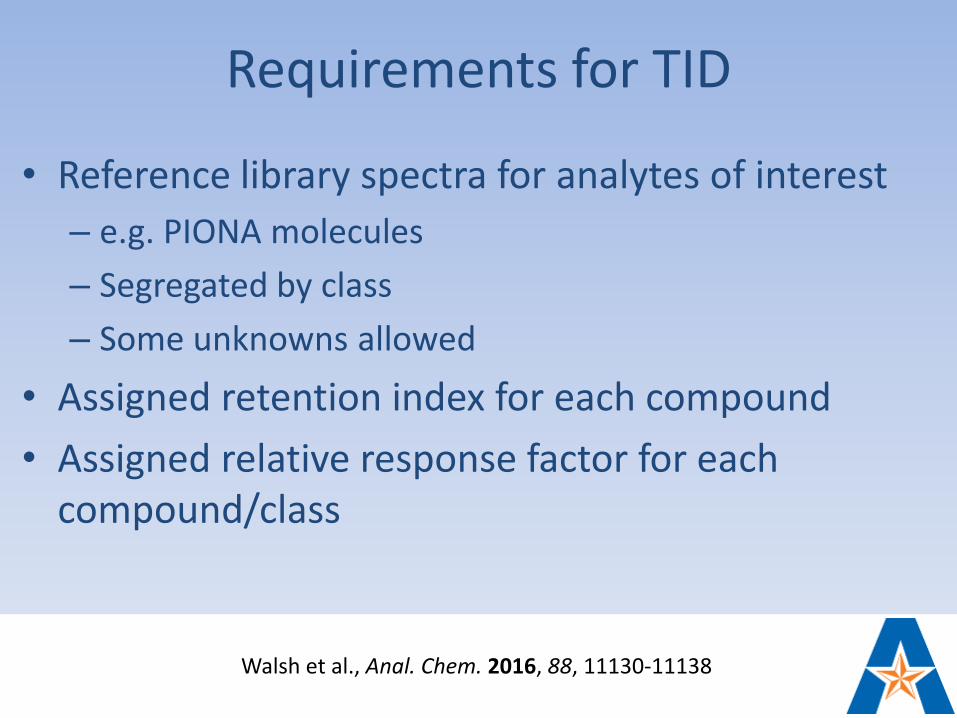
Requirements for TID
• Reference library spectra for analytes of interest
– e.g. PIONA molecules
– Segregated by class
– Some unknowns allowed
• Assigned retention index for each compound
• Assigned relative response factor for each compound/class
Walsh et al., Anal. Chem. 2016, 88, 11130-11138
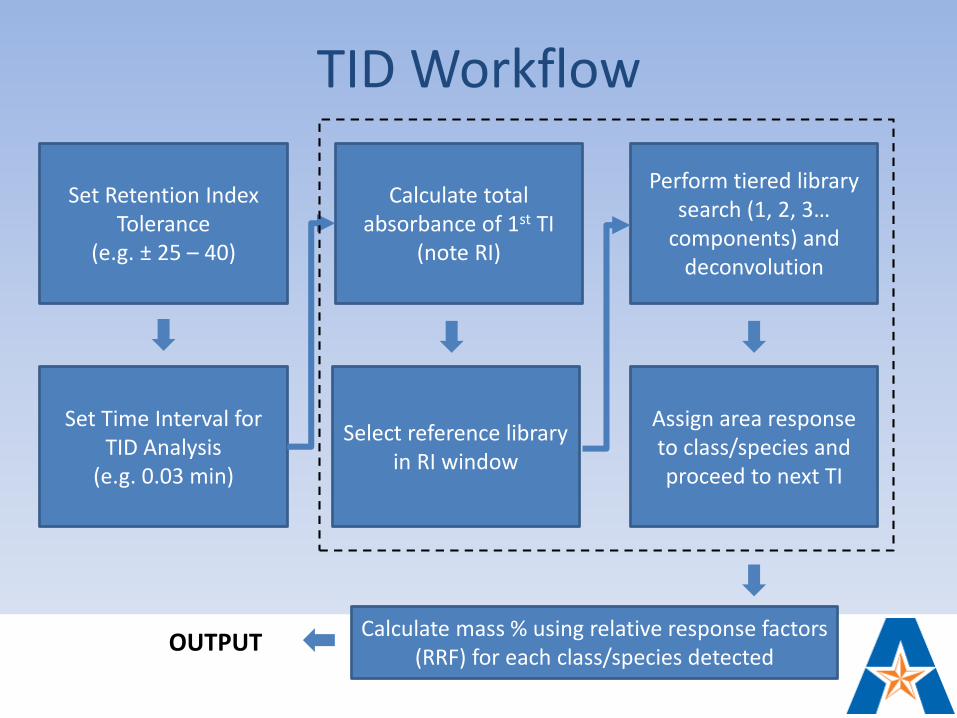
TID Workflow
Set Retention Index Tolerance
(e.g. ± 25 – 40)
Set Time Interval for TID Analysis
(e.g. 0.03 min)
Calculate total absorbance of 1st TI
(note RI)
Select reference library in RI window
Perform tiered library search (1, 2, 3…
components) and deconvolution
Assign area response to class/species and proceed to next TI
Calculate mass % using relative response factors (RRF) for each class/species detected
OUTPUT
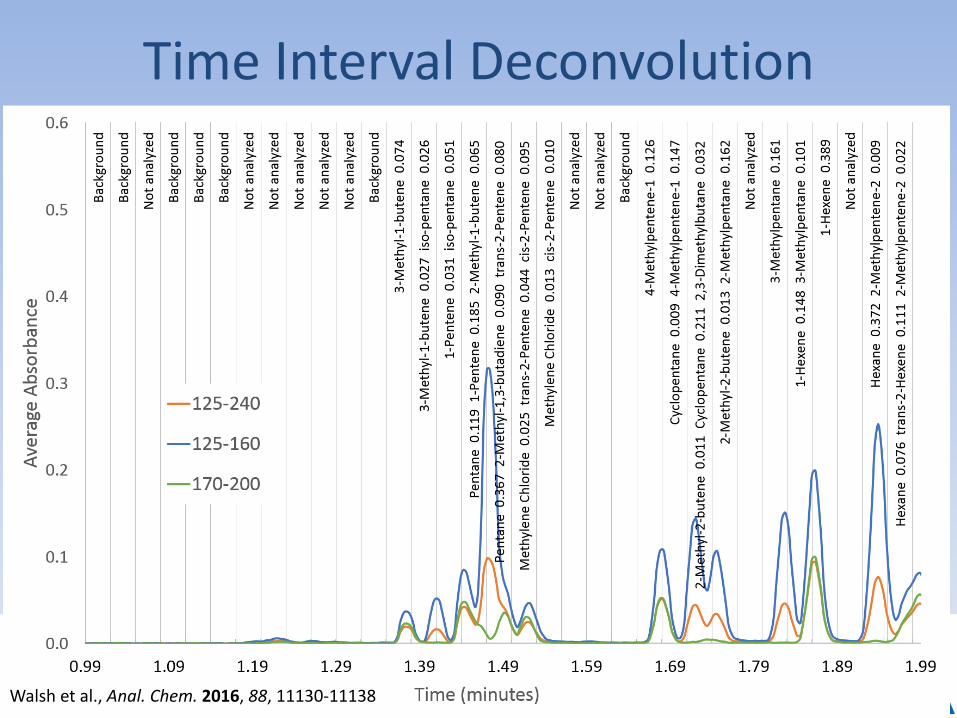
Time Interval Deconvolution
Walsh et al., Anal. Chem. 2016, 88, 11130-11138
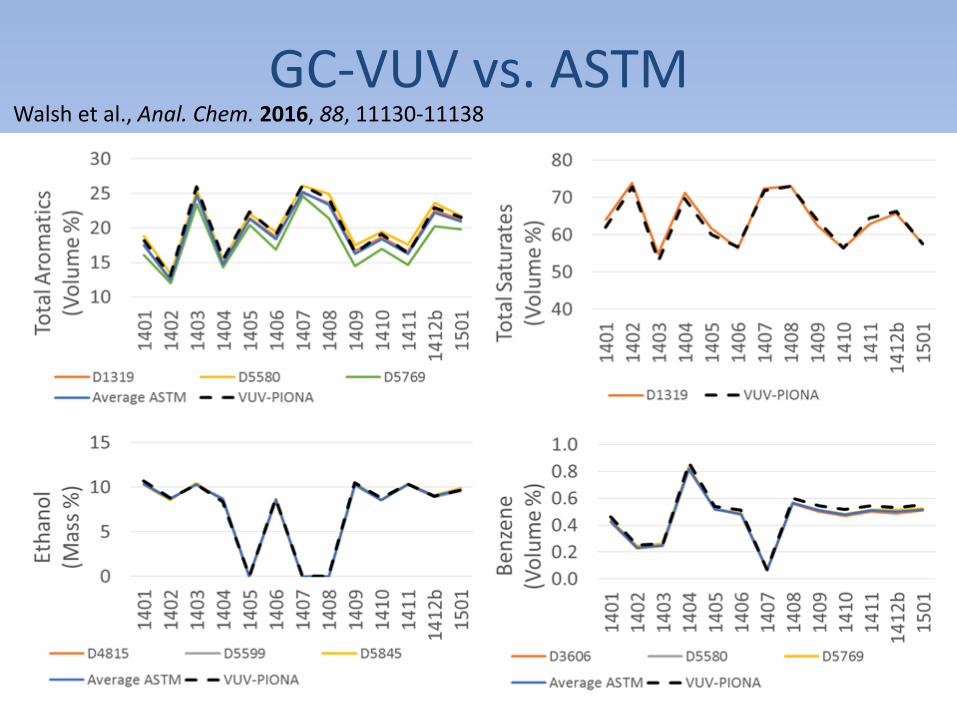
GC-VUV vs. ASTMWalsh et al., Anal. Chem. 2016, 88, 11130-11138

GC-VUV Analysis of Commercial Aroclors
Aroclor 1254
Aroclor 1242
Qiu et al., J. Chromatogr. A 2017, 1490, 191-200.
209 Congeners
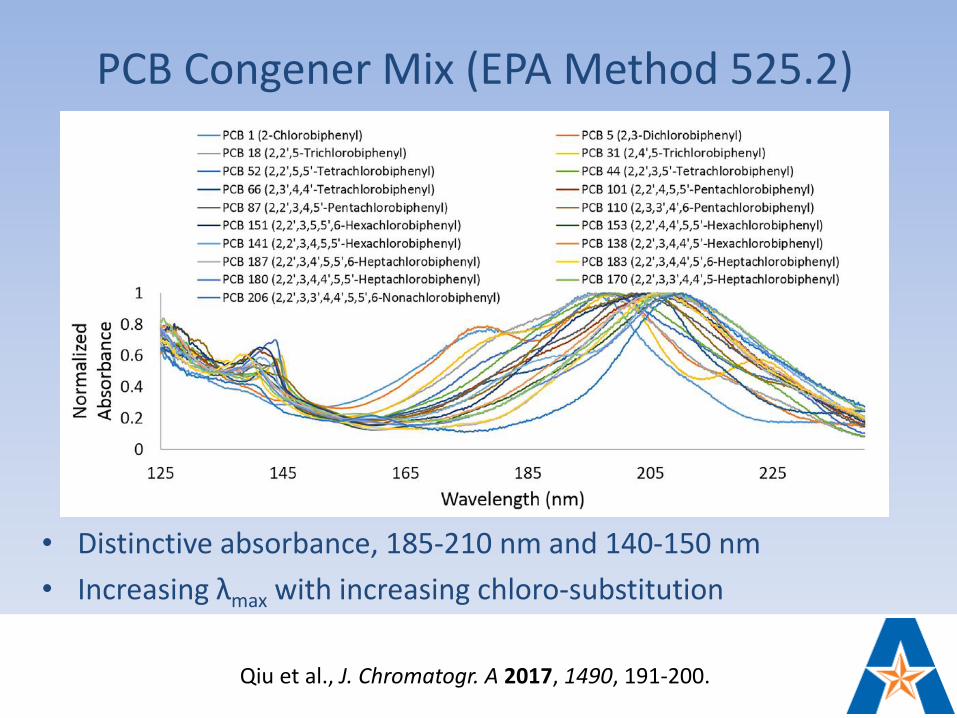
PCB Congener Mix (EPA Method 525.2)
• Distinctive absorbance, 185-210 nm and 140-150 nm
• Increasing λmax with increasing chloro-substitution
Qiu et al., J. Chromatogr. A 2017, 1490, 191-200.
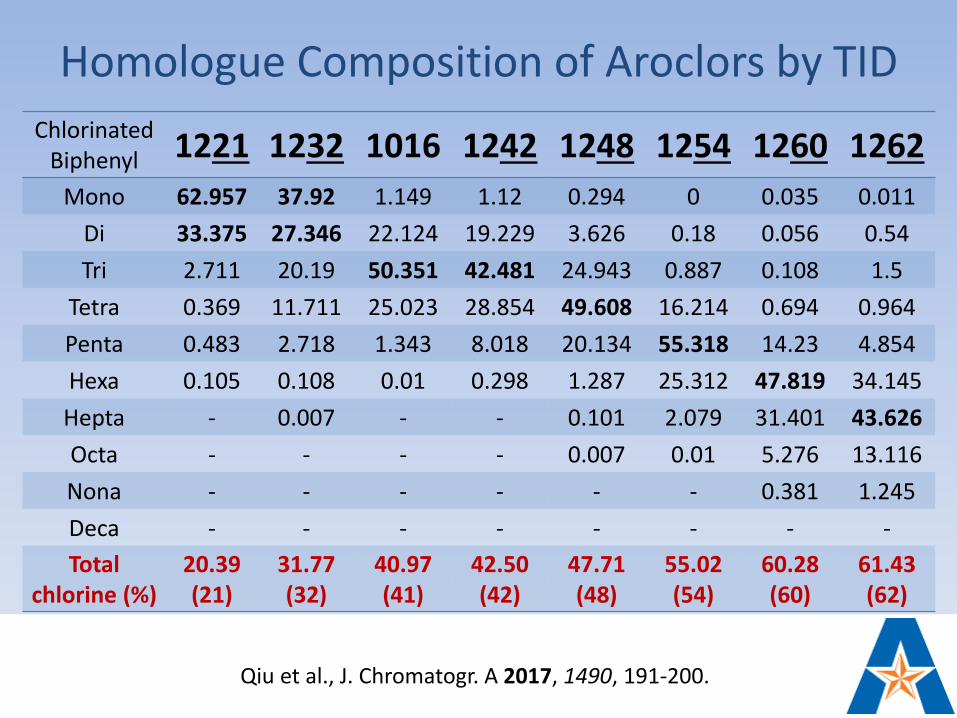
Homologue Composition of Aroclors by TID
Chlorinated Biphenyl 1221 1232 1016 1242 1248 1254 1260 1262
Mono 62.957 37.92 1.149 1.12 0.294 0 0.035 0.011
Di 33.375 27.346 22.124 19.229 3.626 0.18 0.056 0.54
Tri 2.711 20.19 50.351 42.481 24.943 0.887 0.108 1.5
Tetra 0.369 11.711 25.023 28.854 49.608 16.214 0.694 0.964
Penta 0.483 2.718 1.343 8.018 20.134 55.318 14.23 4.854
Hexa 0.105 0.108 0.01 0.298 1.287 25.312 47.819 34.145
Hepta - 0.007 - - 0.101 2.079 31.401 43.626
Octa - - - - 0.007 0.01 5.276 13.116
Nona - - - - - - 0.381 1.245
Deca - - - - - - - -
Total chlorine (%)
20.39 (21)
31.77 (32)
40.97 (41)
42.50 (42)
47.71(48)
55.02 (54)
60.28 (60)
61.43 (62)
Qiu et al., J. Chromatogr. A 2017, 1490, 191-200.
Pseudo-Absolute Quantitation
Absorption cross-section is a physical property of a molecule
GC Injection DiagnosticsBai et al., Anal. Chim. Acta 2017, 953, 10-22.
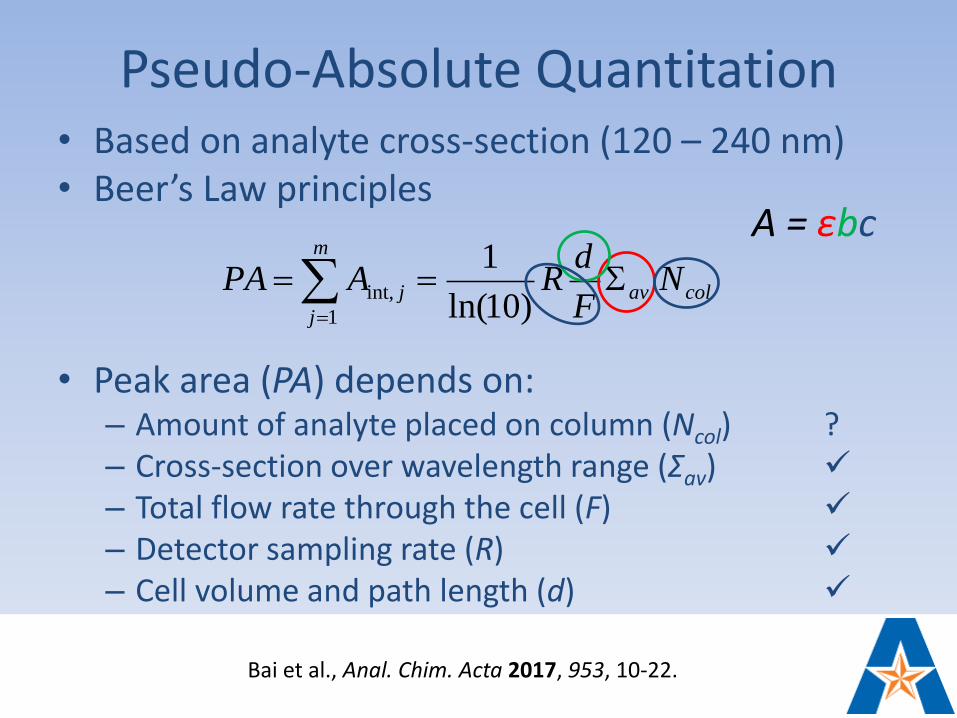
Pseudo-Absolute Quantitation• Based on analyte cross-section (120 – 240 nm)• Beer’s Law principles
• Peak area (PA) depends on:– Amount of analyte placed on column (Ncol) ?– Cross-section over wavelength range (Σav) ✓
– Total flow rate through the cell (F) ✓
– Detector sampling rate (R) ✓
– Cell volume and path length (d) ✓
colav
m
j
j NF
dRAPA
)10ln(
1
1
int,
Bai et al., Anal. Chim. Acta 2017, 953, 10-22.
A = εbc
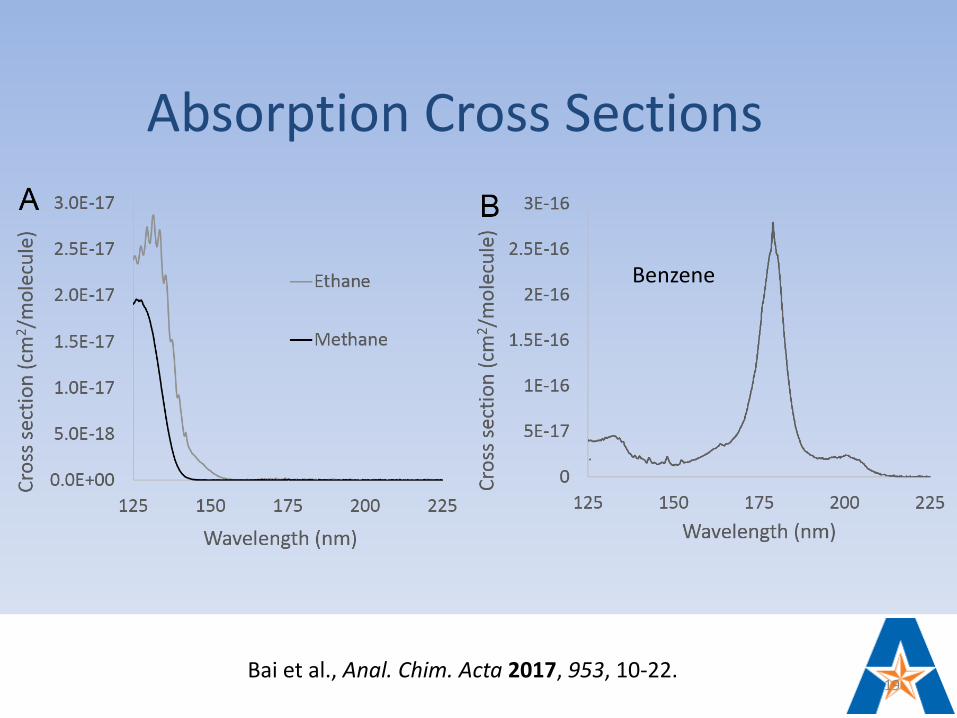
Absorption Cross Sections
19
Benzene
Bai et al., Anal. Chim. Acta 2017, 953, 10-22.
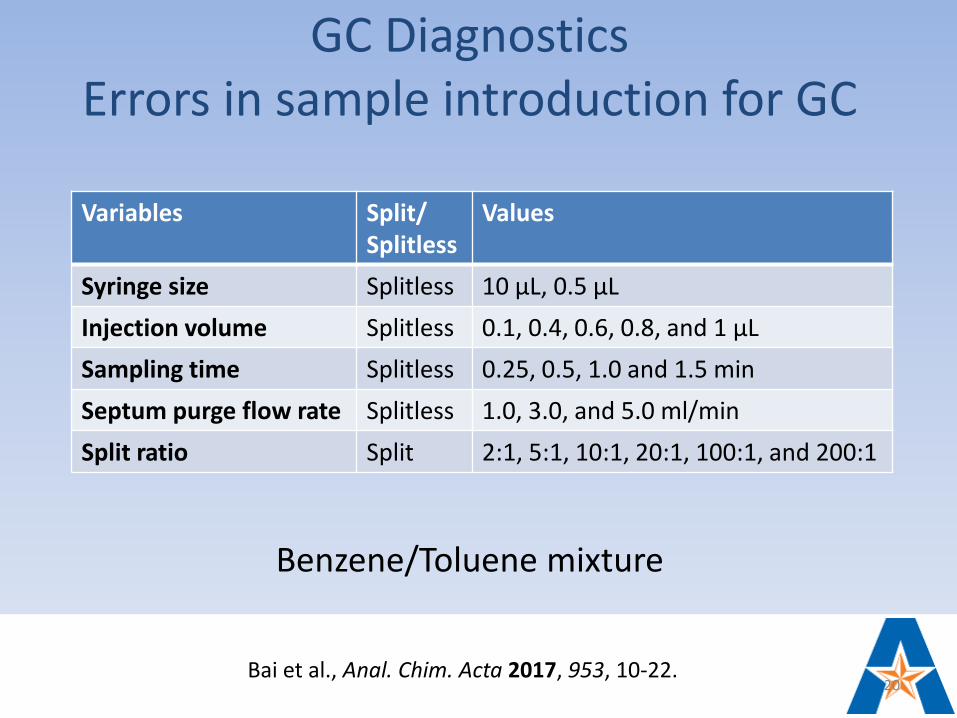
GC DiagnosticsErrors in sample introduction for GC
20
Variables Split/Splitless
Values
Syringe size Splitless 10 µL, 0.5 µL
Injection volume Splitless 0.1, 0.4, 0.6, 0.8, and 1 µL
Sampling time Splitless 0.25, 0.5, 1.0 and 1.5 min
Septum purge flow rate Splitless 1.0, 3.0, and 5.0 ml/min
Split ratio Split 2:1, 5:1, 10:1, 20:1, 100:1, and 200:1
Benzene/Toluene mixture
Bai et al., Anal. Chim. Acta 2017, 953, 10-22.
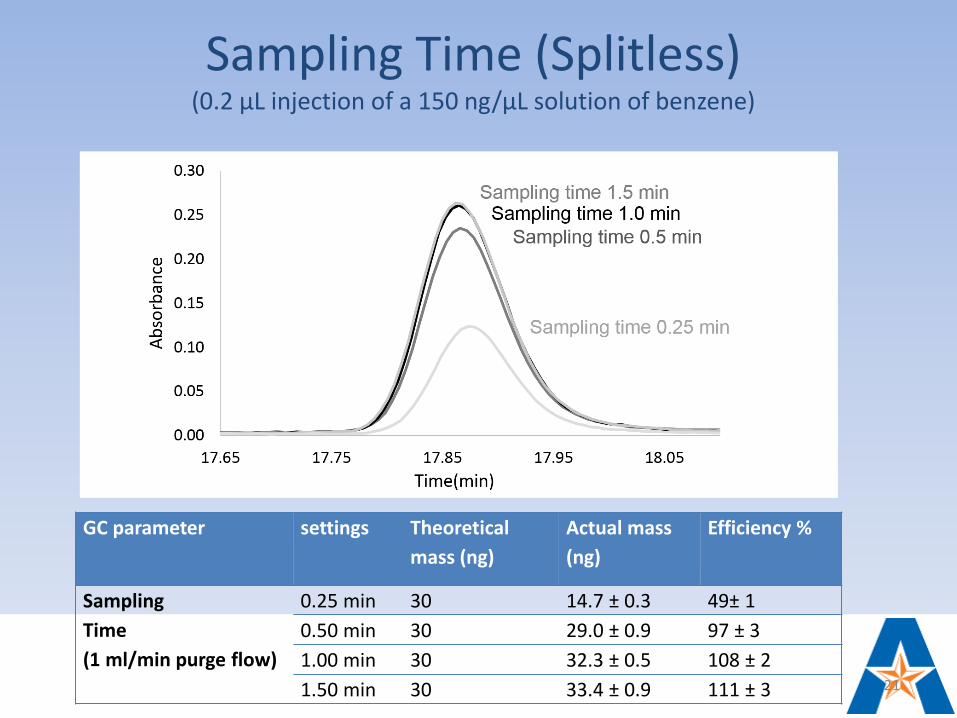
Sampling Time (Splitless)(0.2 µL injection of a 150 ng/µL solution of benzene)
GC parameter settings Theoretical
mass (ng)
Actual mass
(ng)
Efficiency %
Sampling
Time
(1 ml/min purge flow)
0.25 min 30 14.7 ± 0.3 49± 1
0.50 min 30 29.0 ± 0.9 97 ± 3
1.00 min 30 32.3 ± 0.5 108 ± 2
1.50 min 30 33.4 ± 0.9 111 ± 3 21
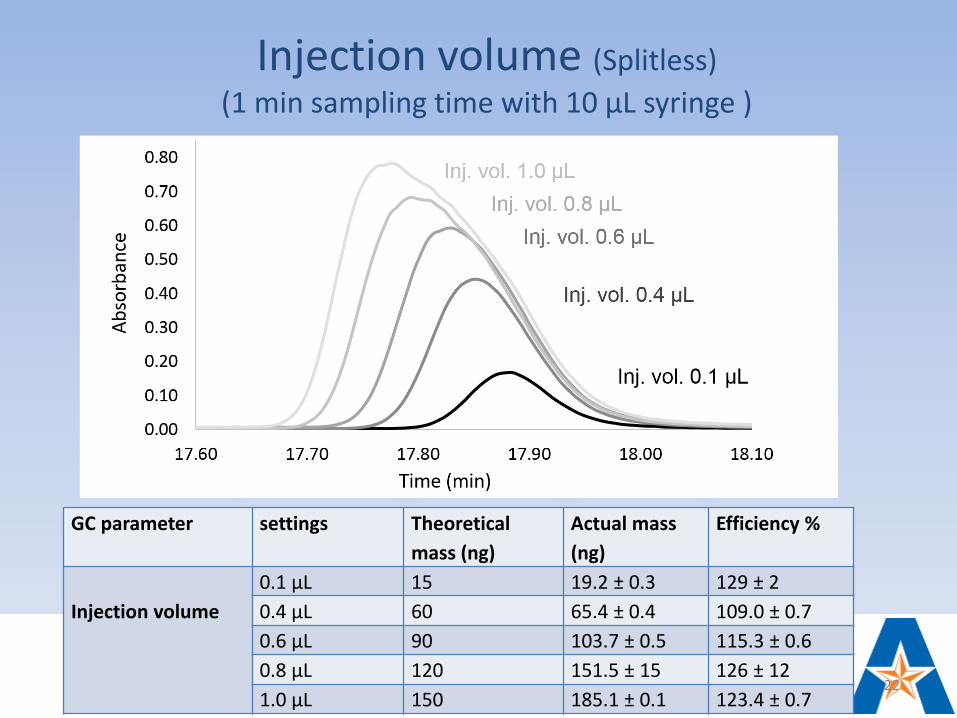
Injection volume (Splitless)
(1 min sampling time with 10 µL syringe )
GC parameter settings Theoretical
mass (ng)
Actual mass
(ng)
Efficiency %
Injection volume
0.1 µL 15 19.2 ± 0.3 129 ± 2
0.4 µL 60 65.4 ± 0.4 109.0 ± 0.7
0.6 µL 90 103.7 ± 0.5 115.3 ± 0.6
0.8 µL 120 151.5 ± 15 126 ± 12
1.0 µL 150 185.1 ± 0.1 123.4 ± 0.722
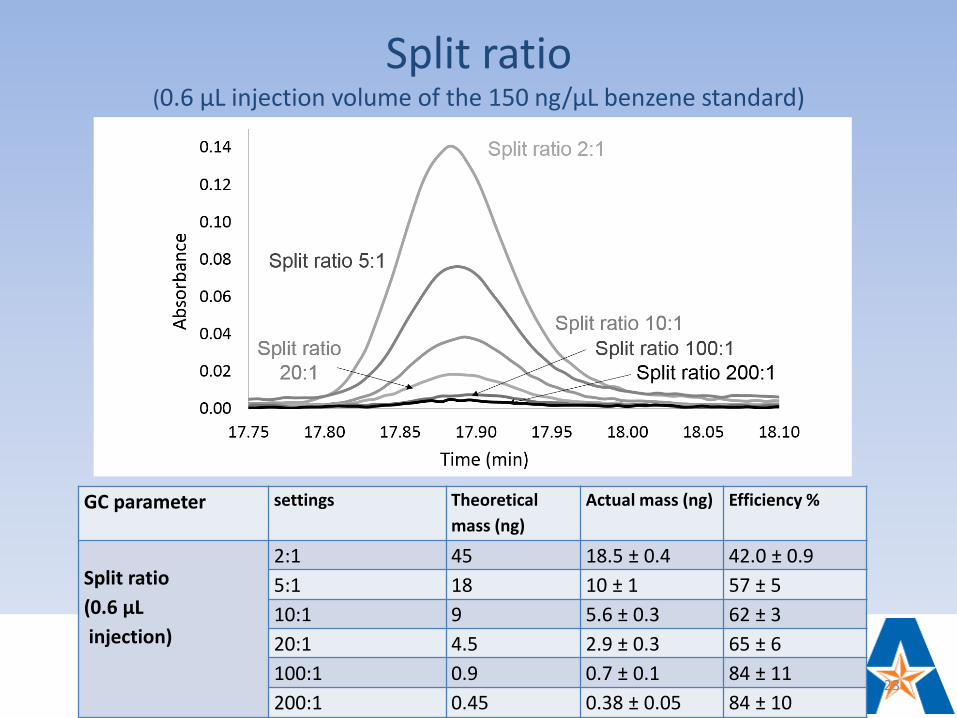
Split ratio(0.6 µL injection volume of the 150 ng/µL benzene standard)
GC parameter settings Theoretical
mass (ng)
Actual mass (ng) Efficiency %
Split ratio
(0.6 µL
injection)
2:1 45 18.5 ± 0.4 42.0 ± 0.9
5:1 18 10 ± 1 57 ± 5
10:1 9 5.6 ± 0.3 62 ± 3
20:1 4.5 2.9 ± 0.3 65 ± 6
100:1 0.9 0.7 ± 0.1 84 ± 11
200:1 0.45 0.38 ± 0.05 84 ± 1023
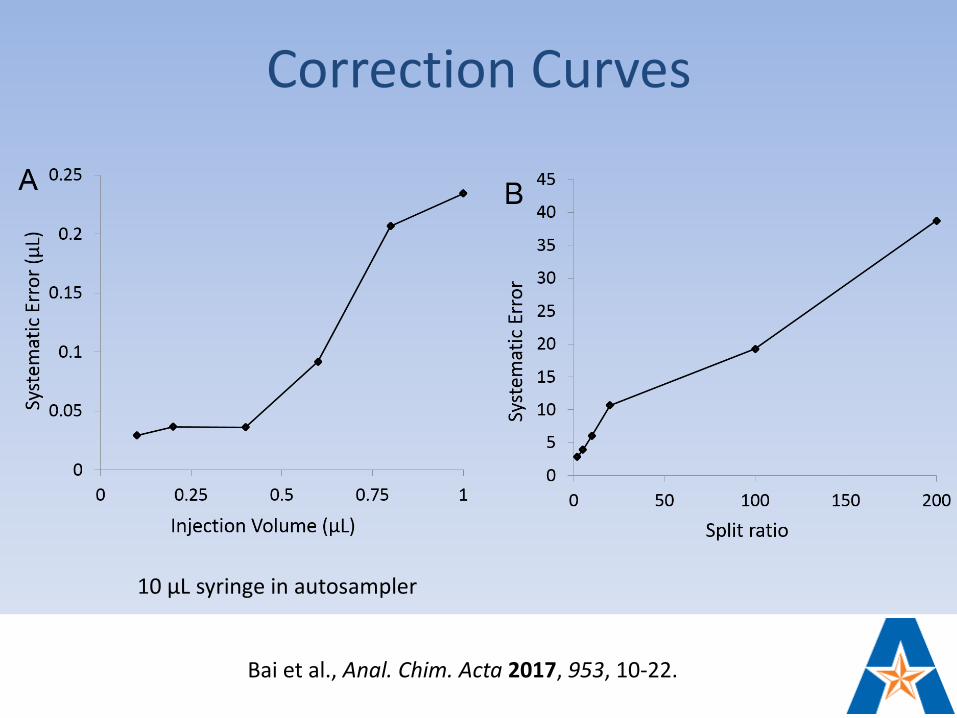
Correction Curves
10 µL syringe in autosampler
Bai et al., Anal. Chim. Acta 2017, 953, 10-22.
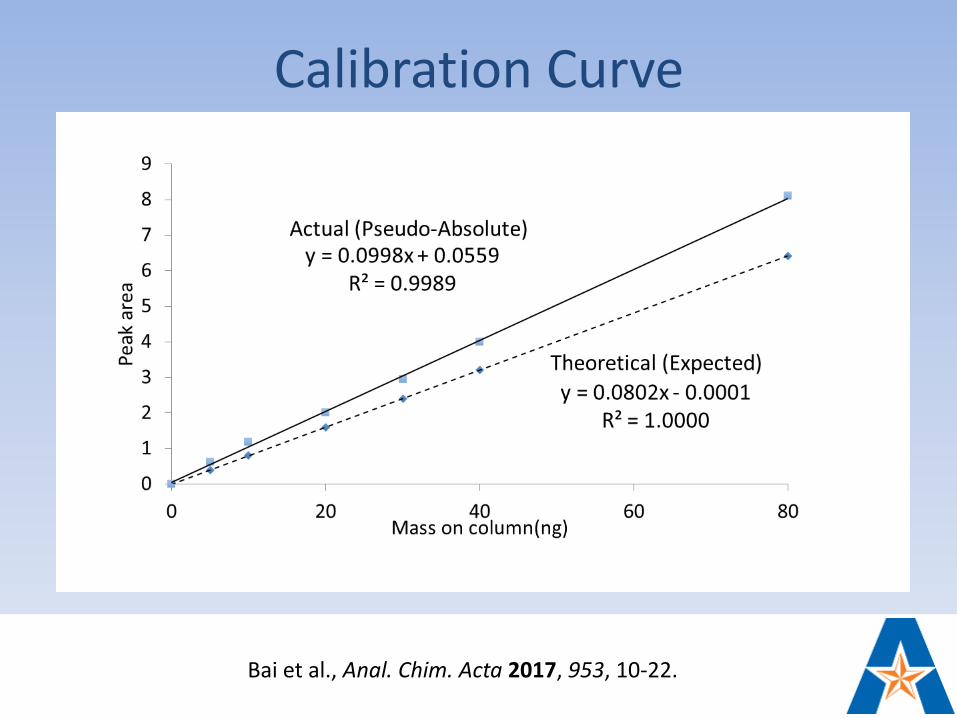
Calibration Curve
Bai et al., Anal. Chim. Acta 2017, 953, 10-22.
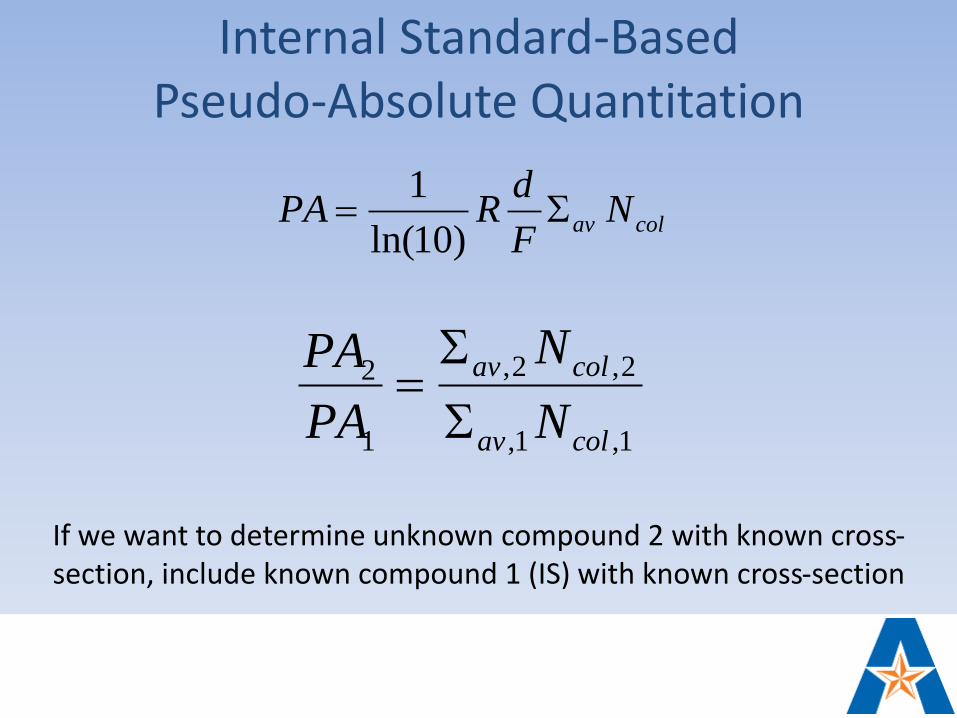
Internal Standard-Based Pseudo-Absolute Quantitation
1,1,
2,2,
1
2
colav
colav
N
N
PA
PA
colav NF
dRPA
)10ln(
1
If we want to determine unknown compound 2 with known cross-section, include known compound 1 (IS) with known cross-section
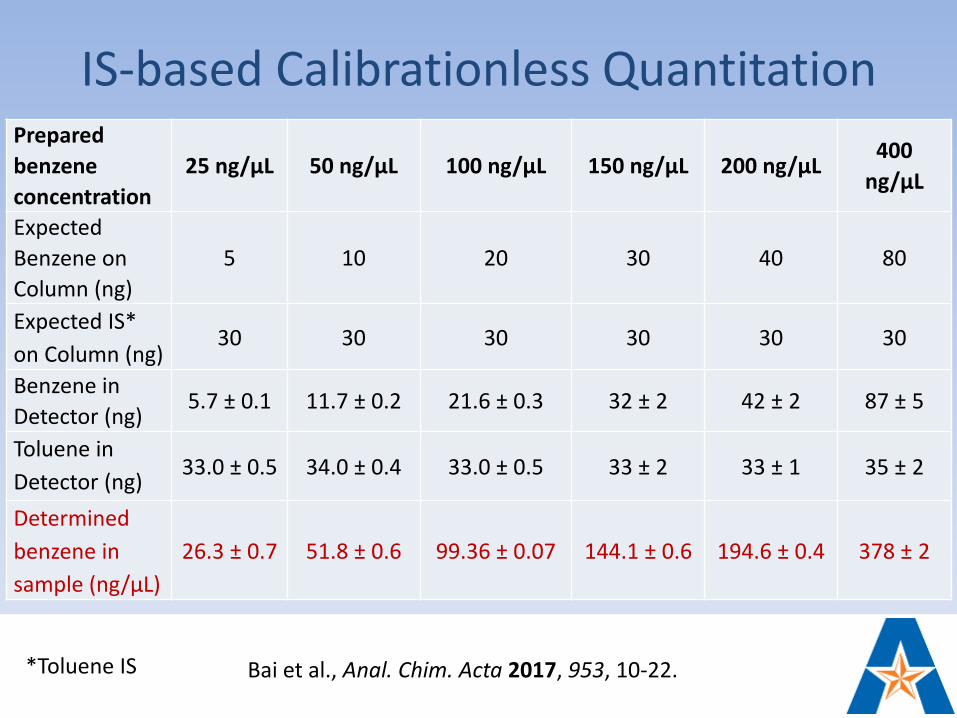
IS-based Calibrationless QuantitationPrepared
benzene
concentration
25 ng/µL 50 ng/µL 100 ng/µL 150 ng/µL 200 ng/µL400
ng/µL
Expected
Benzene on
Column (ng)
5 10 20 30 40 80
Expected IS*
on Column (ng)30 30 30 30 30 30
Benzene in
Detector (ng)5.7 ± 0.1 11.7 ± 0.2 21.6 ± 0.3 32 ± 2 42 ± 2 87 ± 5
Toluene in
Detector (ng)33.0 ± 0.5 34.0 ± 0.4 33.0 ± 0.5 33 ± 2 33 ± 1 35 ± 2
Determined
benzene in
sample (ng/µL)
26.3 ± 0.7 51.8 ± 0.6 99.36 ± 0.07 144.1 ± 0.6 194.6 ± 0.4 378 ± 2
*Toluene IS Bai et al., Anal. Chim. Acta 2017, 953, 10-22.
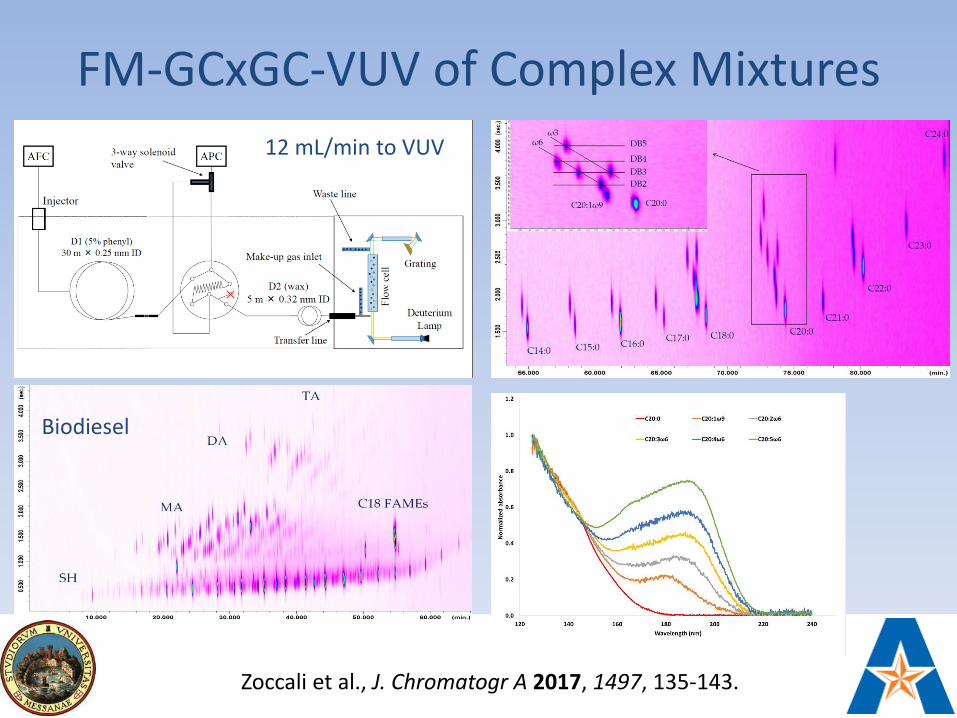
FM-GCxGC-VUV of Complex Mixtures
Zoccali et al., J. Chromatogr A 2017, 1497, 135-143.
Biodiesel
12 mL/min to VUV
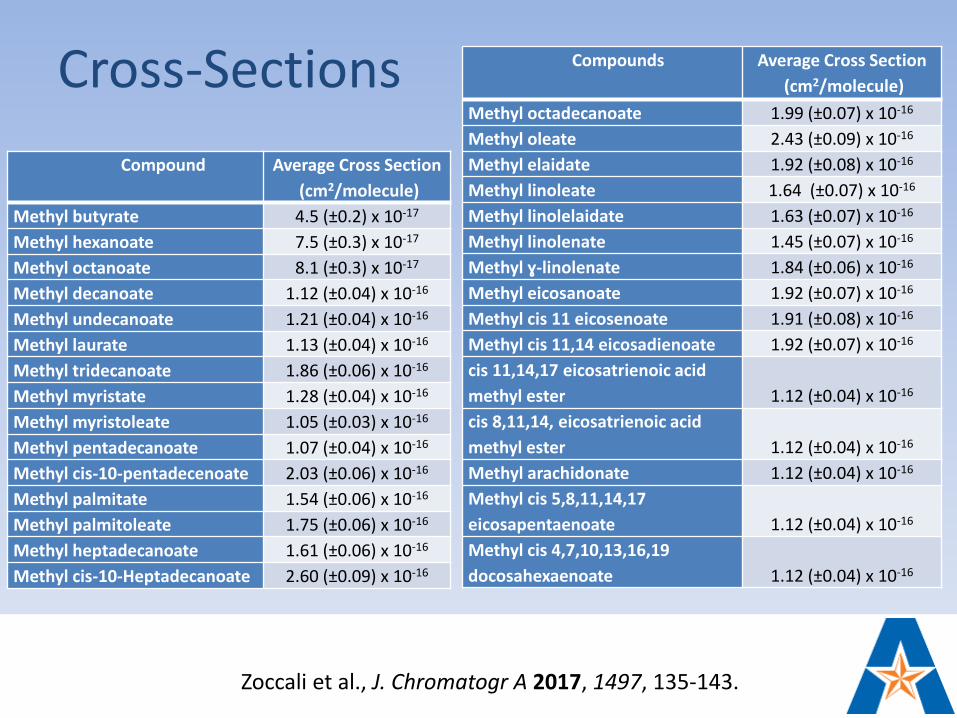
Cross-Sections
Compound Average Cross Section
(cm2/molecule)
Methyl butyrate 4.5 (±0.2) x 10-17
Methyl hexanoate 7.5 (±0.3) x 10-17
Methyl octanoate 8.1 (±0.3) x 10-17
Methyl decanoate 1.12 (±0.04) x 10-16
Methyl undecanoate 1.21 (±0.04) x 10-16
Methyl laurate 1.13 (±0.04) x 10-16
Methyl tridecanoate 1.86 (±0.06) x 10-16
Methyl myristate 1.28 (±0.04) x 10-16
Methyl myristoleate 1.05 (±0.03) x 10-16
Methyl pentadecanoate 1.07 (±0.04) x 10-16
Methyl cis-10-pentadecenoate 2.03 (±0.06) x 10-16
Methyl palmitate 1.54 (±0.06) x 10-16
Methyl palmitoleate 1.75 (±0.06) x 10-16
Methyl heptadecanoate 1.61 (±0.06) x 10-16
Methyl cis-10-Heptadecanoate 2.60 (±0.09) x 10-16
Compounds Average Cross Section
(cm2/molecule)
Methyl octadecanoate 1.99 (±0.07) x 10-16
Methyl oleate 2.43 (±0.09) x 10-16
Methyl elaidate 1.92 (±0.08) x 10-16
Methyl linoleate 1.64 (±0.07) x 10-16
Methyl linolelaidate 1.63 (±0.07) x 10-16
Methyl linolenate 1.45 (±0.07) x 10-16
Methyl ɣ-linolenate 1.84 (±0.06) x 10-16
Methyl eicosanoate 1.92 (±0.07) x 10-16
Methyl cis 11 eicosenoate 1.91 (±0.08) x 10-16
Methyl cis 11,14 eicosadienoate 1.92 (±0.07) x 10-16
cis 11,14,17 eicosatrienoic acid
methyl ester 1.12 (±0.04) x 10-16
cis 8,11,14, eicosatrienoic acid
methyl ester 1.12 (±0.04) x 10-16
Methyl arachidonate 1.12 (±0.04) x 10-16
Methyl cis 5,8,11,14,17
eicosapentaenoate 1.12 (±0.04) x 10-16
Methyl cis 4,7,10,13,16,19
docosahexaenoate 1.12 (±0.04) x 10-16
Zoccali et al., J. Chromatogr A 2017, 1497, 135-143.
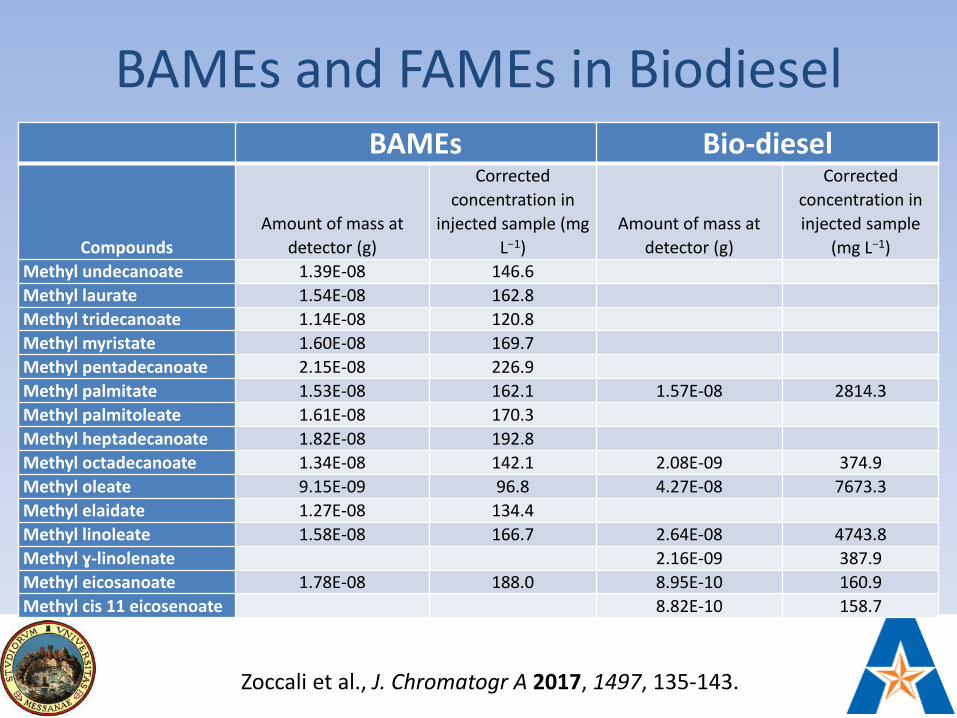
BAMEs and FAMEs in BiodieselBAMEs Bio-diesel
Compounds
Amount of mass at
detector (g)
Corrected
concentration in
injected sample (mg
L−1)
Amount of mass at
detector (g)
Corrected
concentration in
injected sample
(mg L−1)
Methyl undecanoate 1.39E-08 146.6
Methyl laurate 1.54E-08 162.8
Methyl tridecanoate 1.14E-08 120.8
Methyl myristate 1.60E-08 169.7
Methyl pentadecanoate 2.15E-08 226.9
Methyl palmitate 1.53E-08 162.1 1.57E-08 2814.3
Methyl palmitoleate 1.61E-08 170.3
Methyl heptadecanoate 1.82E-08 192.8
Methyl octadecanoate 1.34E-08 142.1 2.08E-09 374.9
Methyl oleate 9.15E-09 96.8 4.27E-08 7673.3
Methyl elaidate 1.27E-08 134.4
Methyl linoleate 1.58E-08 166.7 2.64E-08 4743.8
Methyl ɣ-linolenate 2.16E-09 387.9
Methyl eicosanoate 1.78E-08 188.0 8.95E-10 160.9
Methyl cis 11 eicosenoate 8.82E-10 158.7
Zoccali et al., J. Chromatogr A 2017, 1497, 135-143.
Summary• GC-VUV is a complementary tool to MS
• Unique class-specific signatures
• Isobars/Isomers – easily differentiated
• Beer’s law facilitates qualitative and quantitative analysis
• Deconvolution of co-eluting species– Less burden on separation
• Rapid compound classification and speciation of complex mixtures by TID
• Support by theoretical computations developing
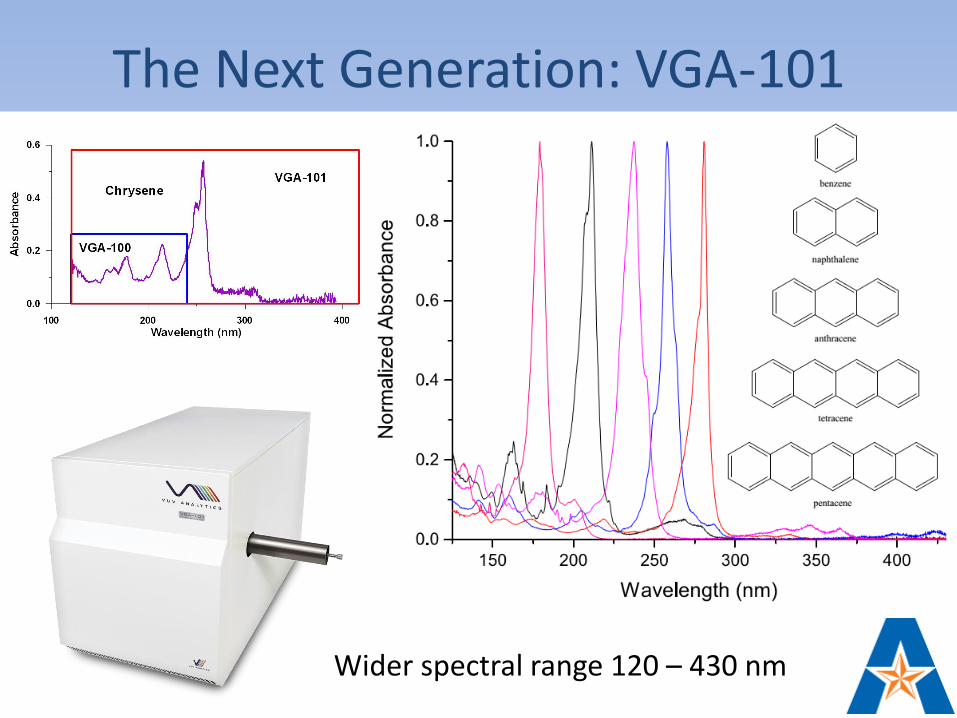
The Next Generation: VGA-101
Wider spectral range 120 – 430 nm
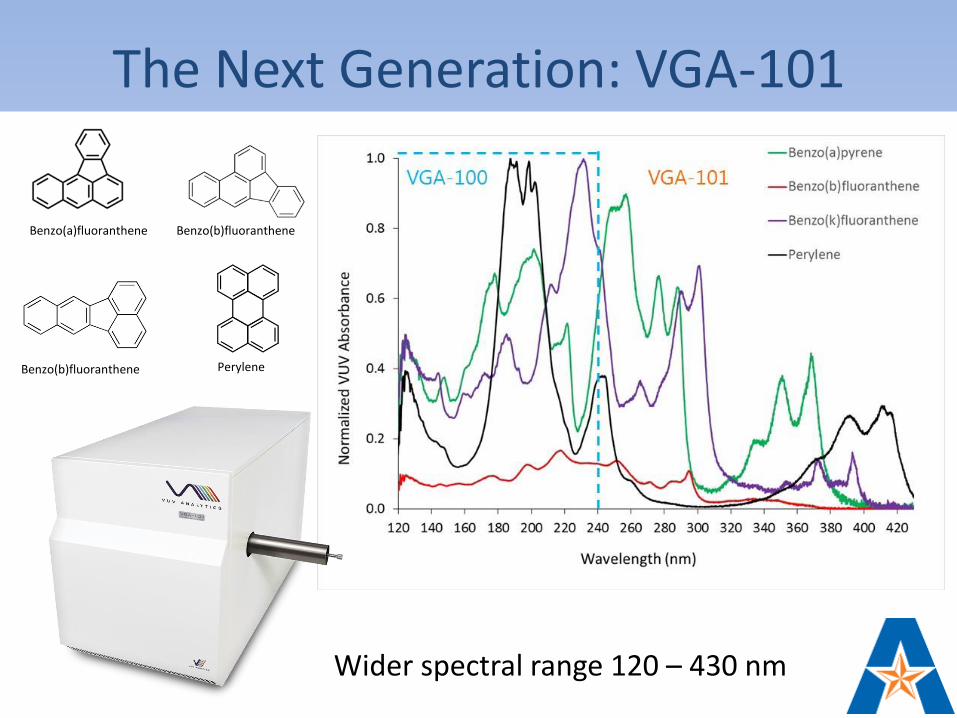
The Next Generation: VGA-101
Wider spectral range 120 – 430 nm
Benzo(a)fluoranthene Benzo(b)fluoranthene
Benzo(b)fluoranthene Perylene
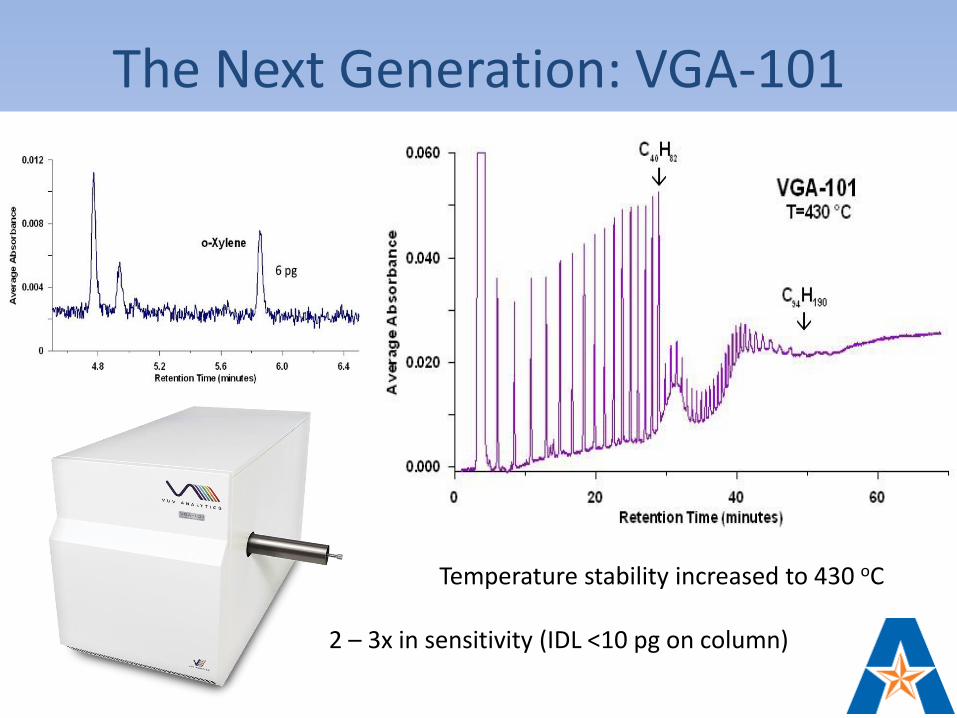
The Next Generation: VGA-101
Temperature stability increased to 430 oC
2 – 3x in sensitivity (IDL <10 pg on column)
Many Thanks!
VUV Analytics, Inc.:Clark JerniganSean Jameson
Dr. Dale HarrisonDr. Phillip Walsh
Dr. Jonathan SmutsJack Cochran
Dr. Hui FanDr. Doug D. Carlton, Jr.
Dr. Ines SantosDr. Changling Qiu
Dr. James MaoLing Bai
Jamie SchenkIan Sawicki
Courtney WestonAllegra Leghissa
Friends from CZ:Prof. Vladimir Havlicek
Prof. Karel LemrDr. Petr Frycak
Dr. Ludovit Skultety
GWU: Dr. Ira Lurie and students
Valero: Dr. Manuel Garbalena
Messina: Dr. Mariosimone Zoccali
Prof. Peter TranchidaProf. Luigi Mondello
UTA: Prof. Peter Kroll
Shimadzu:Dave JorissenDave Whitten