uniper russia deep dive · deep dive russia, 18-mar-2019 2 agenda 1. unipro as part of uniper group...
TRANSCRIPT

Deep Dive RussiaChristopher Delbrück – CFO, Uniper SE
Maxim Shirokov – CEO, Unipro PJSC
Ulf Backmeyer – CFO, Unipro PJSC
18 March 2019

Deep Dive Russia, 18-Mar-2019 2
Agenda
1. Unipro as part of Uniper Group
2. Unipro portfolio in the market context
3. Strategic development
4. Earnings drivers and prospects
5. Conclusion
Deep Dive Russia, 18-Mar-2019 3
Agenda
1. Unipro as part of Uniper Group
2. Unipro portfolio in the market context
3. Strategic development
4. Earnings drivers and prospects
5. Conclusion
Deep Dive Russia, 18-Mar-2019 4
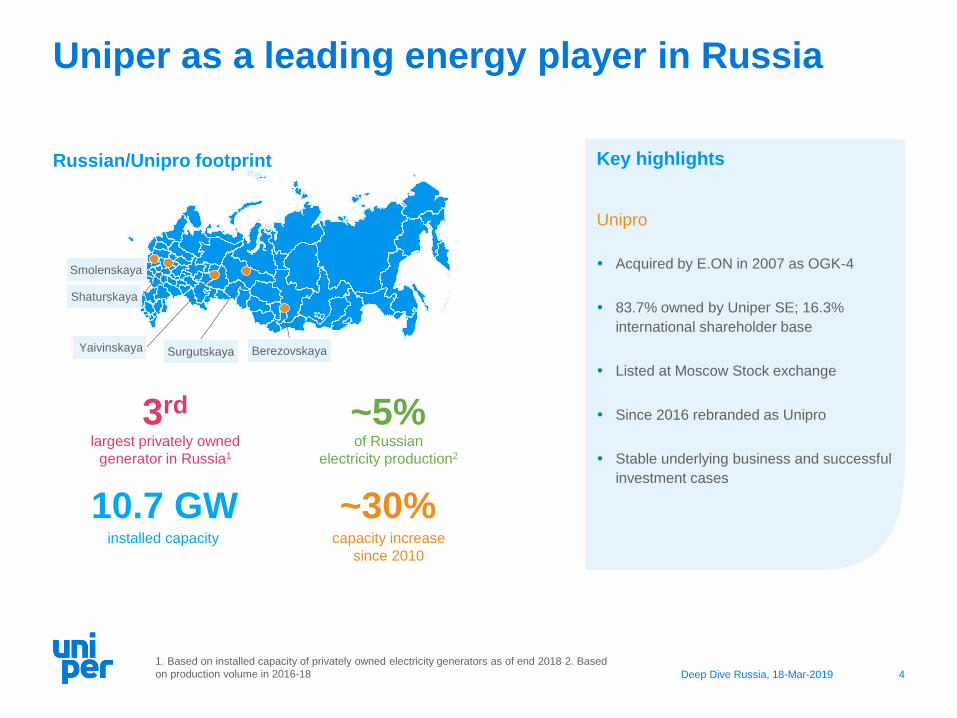
Uniper as a leading energy player in Russia
Key highlights
Unipro
Acquired by E.ON in 2007 as OGK-4
83.7% owned by Uniper SE; 16.3%
international shareholder base
Listed at Moscow Stock exchange
Since 2016 rebranded as Unipro
Stable underlying business and successful
investment cases
3rd
largest privately owned
generator in Russia1
~5%of Russian
electricity production2
10.7 GWinstalled capacity
~30%capacity increase
since 2010
1. Based on installed capacity of privately owned electricity generators as of end 2018 2. Based
on production volume in 2016-18
Russian/Unipro footprint
Smolenskaya
Shaturskaya
Yaivinskaya Surgutskaya Berezovskaya
Deep Dive Russia, 18-Mar-2019 5
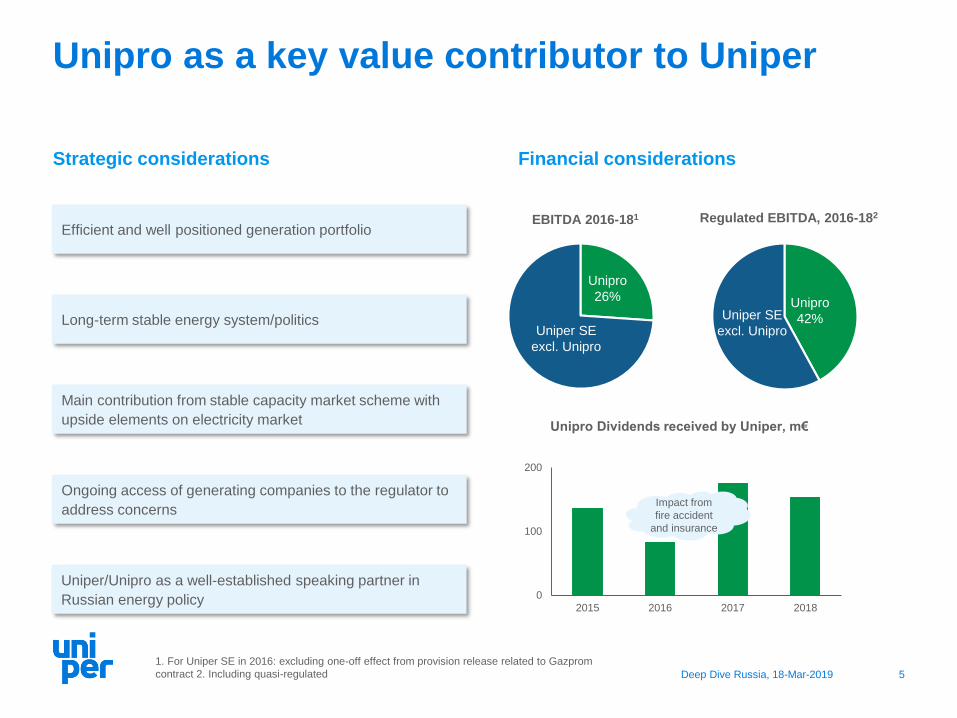
Unipro as a key value contributor to Uniper
EBITDA 2016-181 Regulated EBITDA, 2016-182
Unipro
26%
Uniper SE
excl. Unipro
1. For Uniper SE in 2016: excluding one-off effect from provision release related to Gazprom
contract 2. Including quasi-regulated
Unipro
42%Uniper SE
excl. Unipro
Strategic considerations Financial considerations
Unipro Dividends received by Uniper, m€
Efficient and well positioned generation portfolio
Main contribution from stable capacity market scheme with
upside elements on electricity market
Long-term stable energy system/politics
Ongoing access of generating companies to the regulator to
address concerns
Uniper/Unipro as a well-established speaking partner in
Russian energy policy 0
100
200
2015 2016 2017 2018
Impact from
fire accident
and insurance

Deep Dive Russia, 18-Mar-2019 6
Russian business delivers predictable earnings
Favourable regulation and investor protection
Stability of earnings in local currency terms
Stable business
Impact of RUB translation risk on reported figures
Hedging of dividends received from Unipro (12 months rolling)
Management of currency
risk
Clarity and stability of earnings drivers
Reaching new earnings plateau in mid-term
Transparent development
High importance of Russian business for UniperPart of Uniper
Deep Dive Russia, 18-Mar-2019 7
Agenda
1. Unipro as part of Uniper Group
2. Unipro portfolio in the market context
3. Strategic development
4. Earnings drivers and prospects
5. Conclusion
Deep Dive Russia, 18-Mar-2019 8
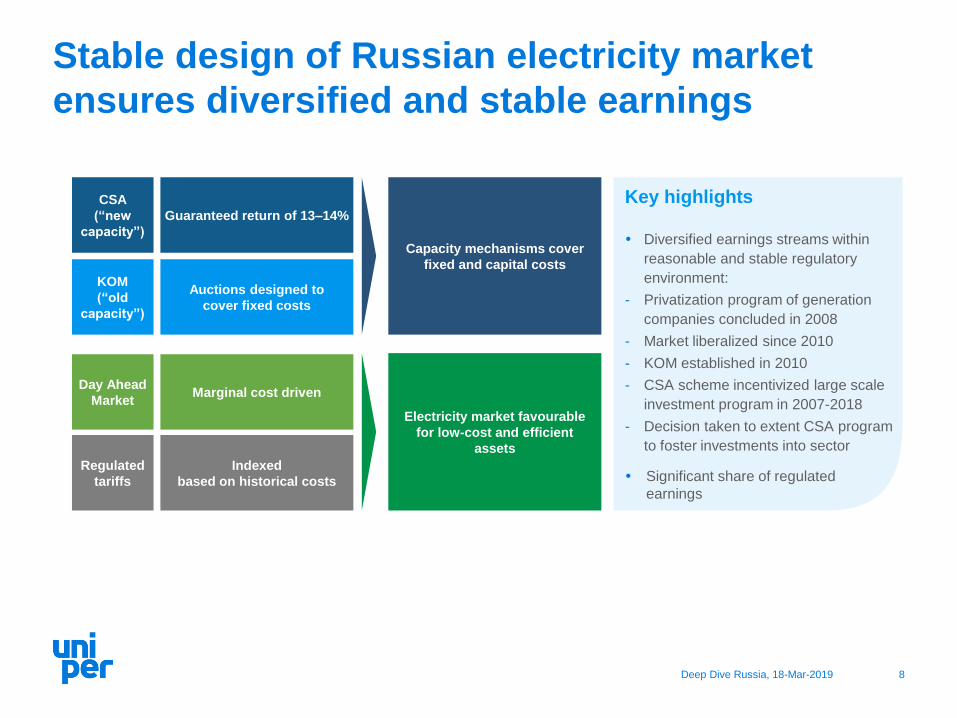
Stable design of Russian electricity market
ensures diversified and stable earnings
Day Ahead
Market
Regulated
tariffs
Marginal cost driven
Indexed
based on historical costs
Electricity market favourable
for low-cost and efficient
assets
Capacity mechanisms cover
fixed and capital costs
KOM
(“old
capacity”)
CSA
(“new
capacity”)
Auctions designed to
cover fixed costs
Guaranteed return of 13–14%
Key highlights
Diversified earnings streams within
reasonable and stable regulatory
environment:
- Privatization program of generation
companies concluded in 2008
- Market liberalized since 2010
- KOM established in 2010
- CSA scheme incentivized large scale
investment program in 2007-2018
- Decision taken to extent CSA program
to foster investments into sector
Significant share of regulated
earnings
Deep Dive Russia, 18-Mar-2019 9
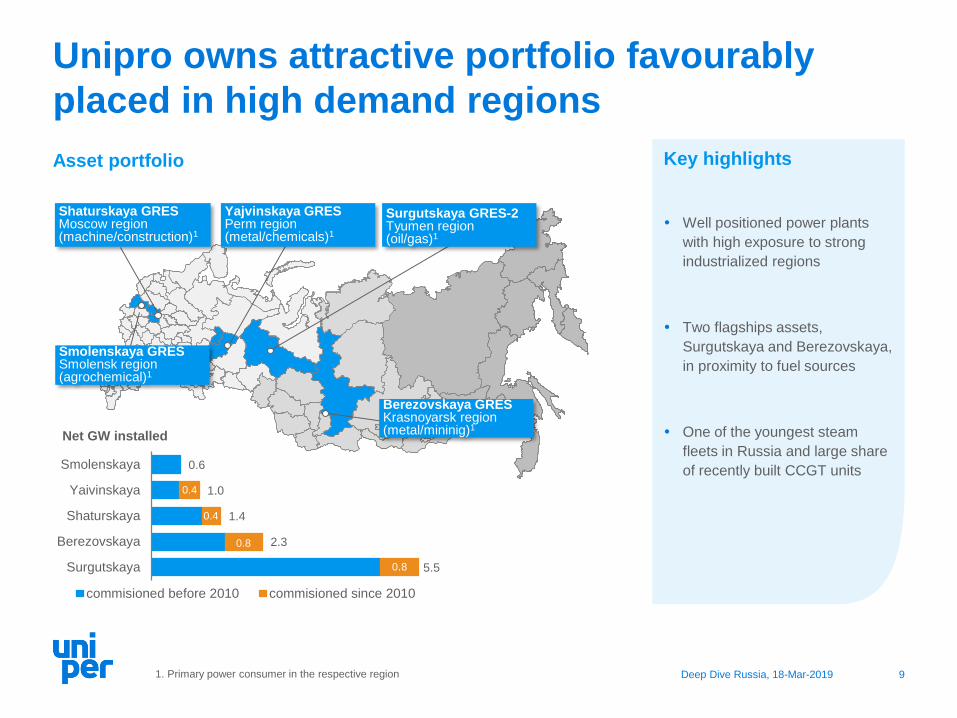
Unipro owns attractive portfolio favourably
placed in high demand regions
Shaturskaya GRESMoscow region(machine/construction)1
Smolenskaya GRESSmolensk region (agrochemical)1
Surgutskaya GRES-2Tyumen region(oil/gas)1
Berezovskaya GRESKrasnoyarsk region (metal/mininig)1
Yajvinskaya GRESPerm region (metal/chemicals)1
1. Primary power consumer in the respective region
Key highlights
Well positioned power plants
with high exposure to strong
industrialized regions
Two flagships assets,
Surgutskaya and Berezovskaya,
in proximity to fuel sources
One of the youngest steam
fleets in Russia and large share
of recently built CCGT units
Asset portfolio
0.6
1.0
1.4
2.3
5.5
Smolenskaya
Yaivinskaya
Shaturskaya
Berezovskaya
Surgutskaya
commisioned before 2010 commisioned since 2010
0.4
0.4
0.8
0.8
Net GW installed
Deep Dive Russia, 18-Mar-2019 10
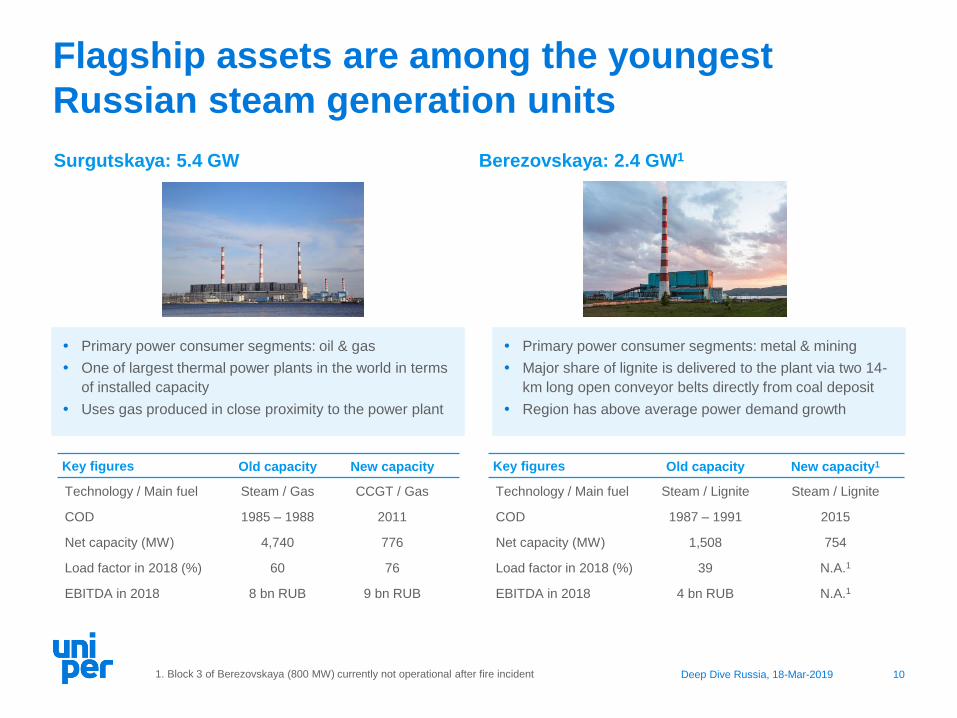
Flagship assets are among the youngest
Russian steam generation units
Surgutskaya: 5.4 GW
Primary power consumer segments: oil & gas
One of largest thermal power plants in the world in terms
of installed capacity
Uses gas produced in close proximity to the power plant
Key figures Old capacity New capacity
Technology / Main fuel Steam / Gas CCGT / Gas
COD 1985 – 1988 2011
Net capacity (MW) 4,740 776
Load factor in 2018 (%) 60 76
EBITDA in 2018 8 bn RUB 9 bn RUB
Berezovskaya: 2.4 GW1
Primary power consumer segments: metal & mining
Major share of lignite is delivered to the plant via two 14-
km long open conveyor belts directly from coal deposit
Region has above average power demand growth
Key figures Old capacity New capacity1
Technology / Main fuel Steam / Lignite Steam / Lignite
COD 1987 – 1991 2015
Net capacity (MW) 1,508 754
Load factor in 2018 (%) 39 N.A.1
EBITDA in 2018 4 bn RUB N.A.1
1. Block 3 of Berezovskaya (800 MW) currently not operational after fire incident
Deep Dive Russia, 18-Mar-2019 11
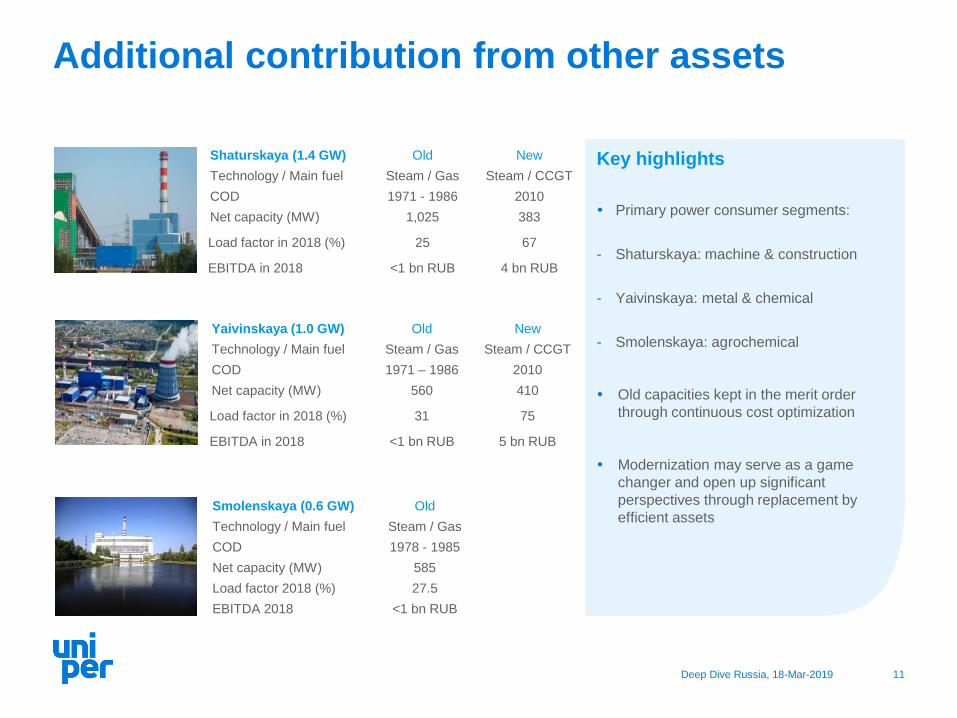
Additional contribution from other assets
Shaturskaya (1.4 GW) Old New
Technology / Main fuel Steam / Gas Steam / CCGT
COD 1971 - 1986 2010
Net capacity (MW) 1,025 383
Load factor in 2018 (%) 25 67
EBITDA in 2018 <1 bn RUB 4 bn RUB
Key highlights
Primary power consumer segments:
- Shaturskaya: machine & construction
- Yaivinskaya: metal & chemical
- Smolenskaya: agrochemical
Old capacities kept in the merit order
through continuous cost optimization
Modernization may serve as a game
changer and open up significant
perspectives through replacement by
efficient assets
Yaivinskaya (1.0 GW) Old New
Technology / Main fuel Steam / Gas Steam / CCGT
COD 1971 – 1986 2010
Net capacity (MW) 560 410
Load factor in 2018 (%) 31 75
EBITDA in 2018 <1 bn RUB 5 bn RUB
Smolenskaya (0.6 GW) Old
Technology / Main fuel Steam / Gas
COD 1978 - 1985
Net capacity (MW) 585
Load factor 2018 (%) 27.5
EBITDA 2018 <1 bn RUB
Deep Dive Russia, 18-Mar-2019 12
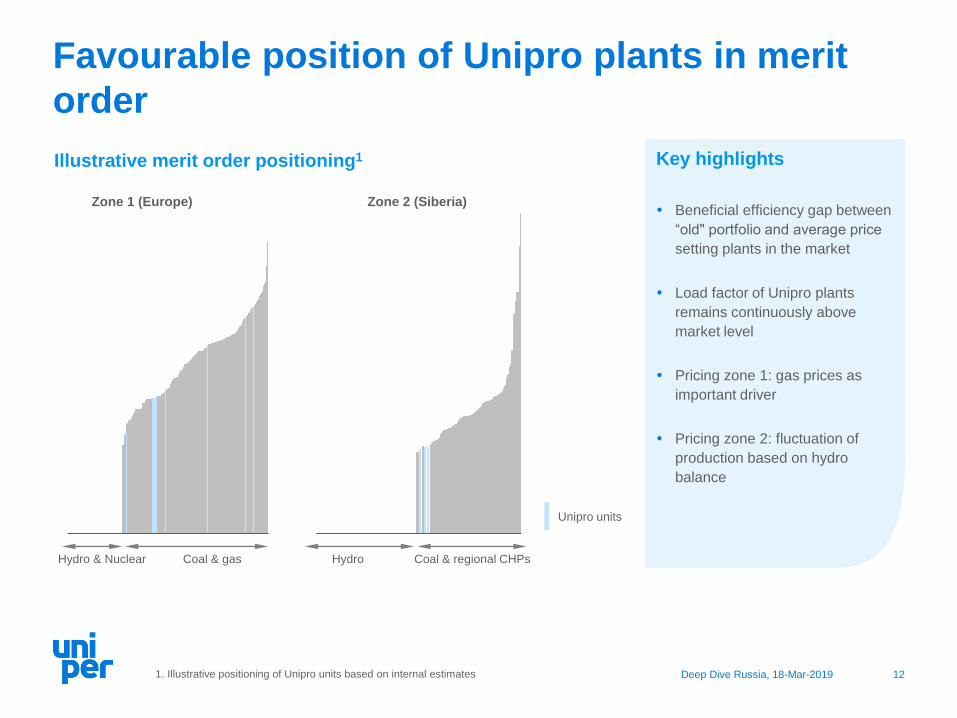
Favourable position of Unipro plants in merit
order
Unipro units
Zone 1 (Europe) Zone 2 (Siberia)
Illustrative merit order positioning1
1. Illustrative positioning of Unipro units based on internal estimates
Key highlights
Beneficial efficiency gap between
“old" portfolio and average price
setting plants in the market
Load factor of Unipro plants
remains continuously above
market level
Pricing zone 1: gas prices as
important driver
Pricing zone 2: fluctuation of
production based on hydro
balance
Hydro & Nuclear Coal & gas Hydro Coal & regional CHPs

Deep Dive Russia, 18-Mar-2019 13
Agenda
1. Unipro as part of Uniper Group
2. Unipro portfolio in the market context
3. Strategic development
4. Earnings drivers and prospects
5. Conclusion

Deep Dive Russia, 18-Mar-2019 14
Strategic priorities for Unipro
Incremental earnings through new business developmentNew markets
Recommissioning of Berezovskaya 3 after repair worksLegacy
Investment
Maintenance and enhancement of asset portfolio through
modernizationModernization
Ongoing application of operational efficiency and cost savingsOperating excellence
Deep Dive Russia, 18-Mar-2019 15
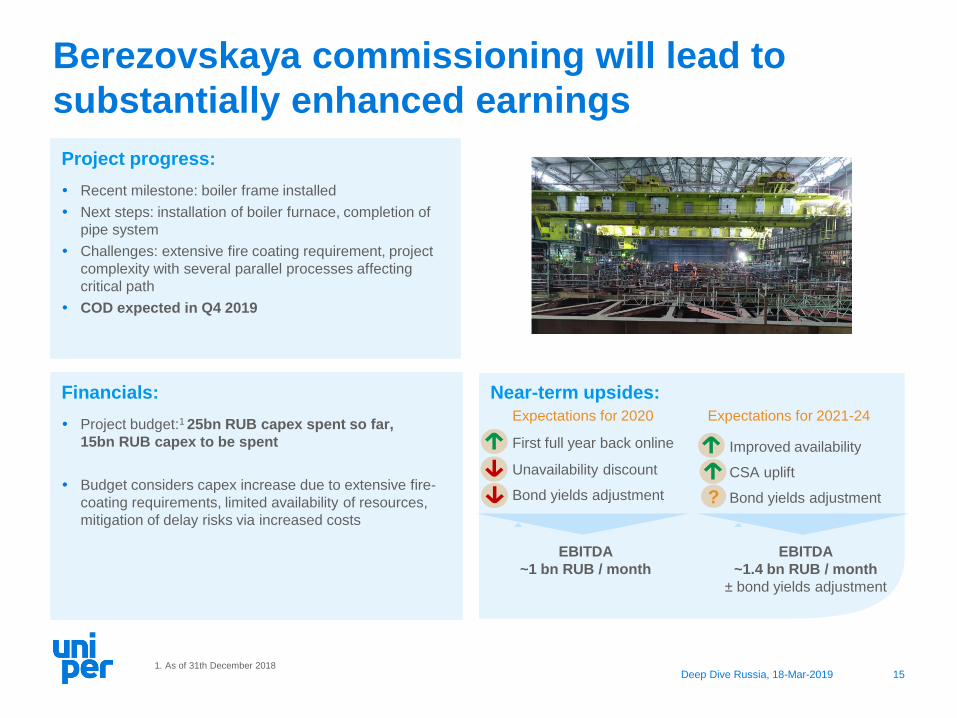
Near-term upsides:
Project progress:
Recent milestone: boiler frame installed
Next steps: installation of boiler furnace, completion of
pipe system
Challenges: extensive fire coating requirement, project
complexity with several parallel processes affecting
critical path
COD expected in Q4 2019
Berezovskaya commissioning will lead to
substantially enhanced earnings
Unavailability discount
Bond yields adjustment
Expectations for 2020
EBITDA
~1 bn RUB / month
Improved availability
CSA uplift
Bond yields adjustment?
EBITDA
~1.4 bn RUB / month
± bond yields adjustment
Expectations for 2021-24
First full year back online
1. As of 31th December 2018
Financials:
Project budget:1 25bn RUB capex spent so far,
15bn RUB capex to be spent
Budget considers capex increase due to extensive fire-
coating requirements, limited availability of resources,
mitigation of delay risks via increased costs
Deep Dive Russia, 18-Mar-2019 16
80
100
120
140
160
180
2011 2012 2013 2014 2015 2016 2017 2018
Non-fuel costs - RUB/MW
Russian CPI
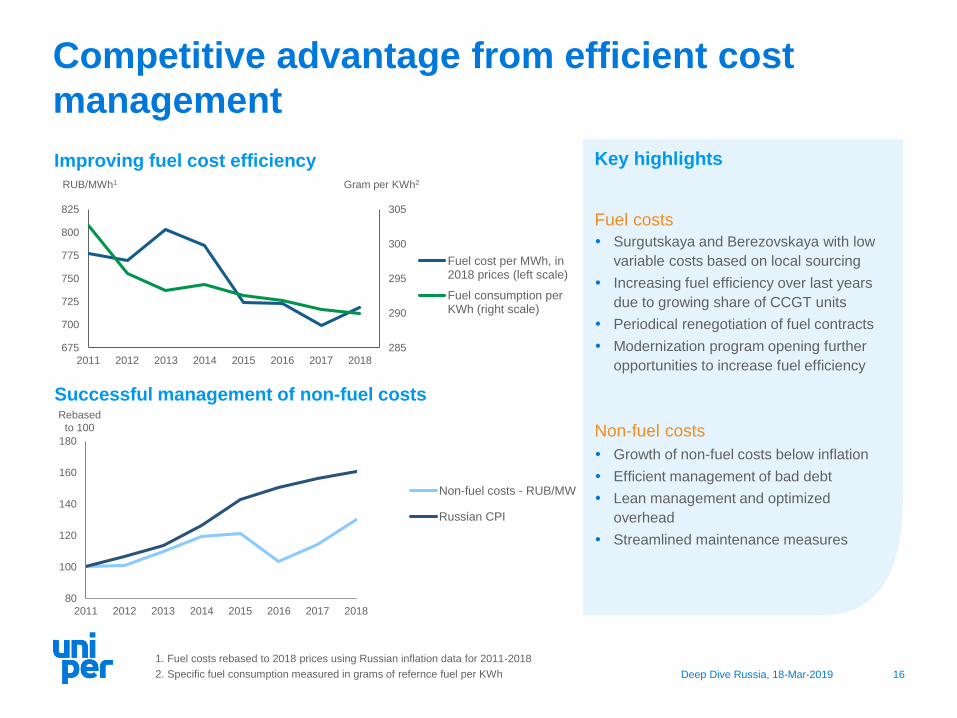
Competitive advantage from efficient cost
management
Improving fuel cost efficiency
285
290
295
300
305
675
700
725
750
775
800
825
2011 2012 2013 2014 2015 2016 2017 2018
Fuel cost per MWh, in2018 prices (left scale)
Fuel consumption perKWh (right scale)
RUB/MWh1 Gram per KWh2
1. Fuel costs rebased to 2018 prices using Russian inflation data for 2011-2018
2. Specific fuel consumption measured in grams of refernce fuel per KWh
Successful management of non-fuel costs
Key highlights
Fuel costs
Surgutskaya and Berezovskaya with low
variable costs based on local sourcing
Increasing fuel efficiency over last years
due to growing share of CCGT units
Periodical renegotiation of fuel contracts
Modernization program opening further
opportunities to increase fuel efficiency
Non-fuel costs
Growth of non-fuel costs below inflation
Efficient management of bad debt
Lean management and optimized
overhead
Streamlined maintenance measures
Rebased
to 100
Deep Dive Russia, 18-Mar-2019 17
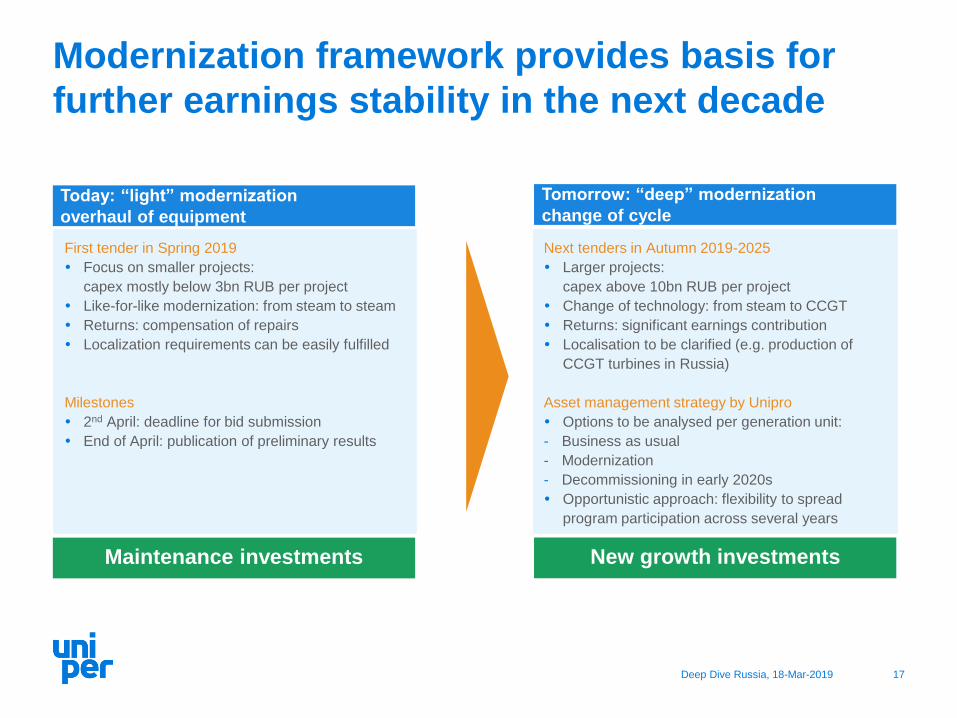
Modernization framework provides basis for
further earnings stability in the next decade
First tender in Spring 2019
Focus on smaller projects:
capex mostly below 3bn RUB per project
Like-for-like modernization: from steam to steam
Returns: compensation of repairs
Localization requirements can be easily fulfilled
Milestones
2nd April: deadline for bid submission
End of April: publication of preliminary results
Next tenders in Autumn 2019-2025
Larger projects:
capex above 10bn RUB per project
Change of technology: from steam to CCGT
Returns: significant earnings contribution
Localisation to be clarified (e.g. production of
CCGT turbines in Russia)
Asset management strategy by Unipro
Options to be analysed per generation unit:
- Business as usual
- Modernization
- Decommissioning in early 2020s
Opportunistic approach: flexibility to spread
program participation across several years
Maintenance investments New growth investments
Today: “light” modernization
overhaul of equipment
Tomorrow: “deep” modernization
change of cycle
Deep Dive Russia, 18-Mar-2019 18
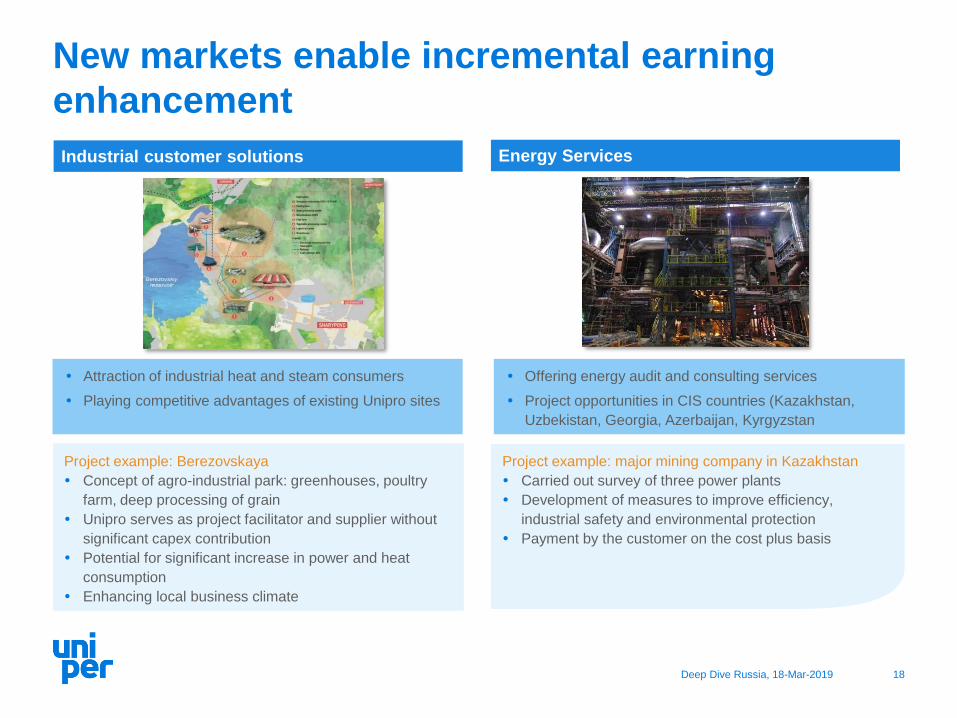
New markets enable incremental earning
enhancement
Project example: major mining company in Kazakhstan
Carried out survey of three power plants
Development of measures to improve efficiency,
industrial safety and environmental protection
Payment by the customer on the cost plus basis
Attraction of industrial heat and steam consumers
Playing competitive advantages of existing Unipro sites
Offering energy audit and consulting services
Project opportunities in CIS countries (Kazakhstan,
Uzbekistan, Georgia, Azerbaijan, Kyrgyzstan
Project example: Berezovskaya
Concept of agro-industrial park: greenhouses, poultry
farm, deep processing of grain
Unipro serves as project facilitator and supplier without
significant capex contribution
Potential for significant increase in power and heat
consumption
Enhancing local business climate
Industrial customer solutions Energy Services
Deep Dive Russia, 18-Mar-2019 19
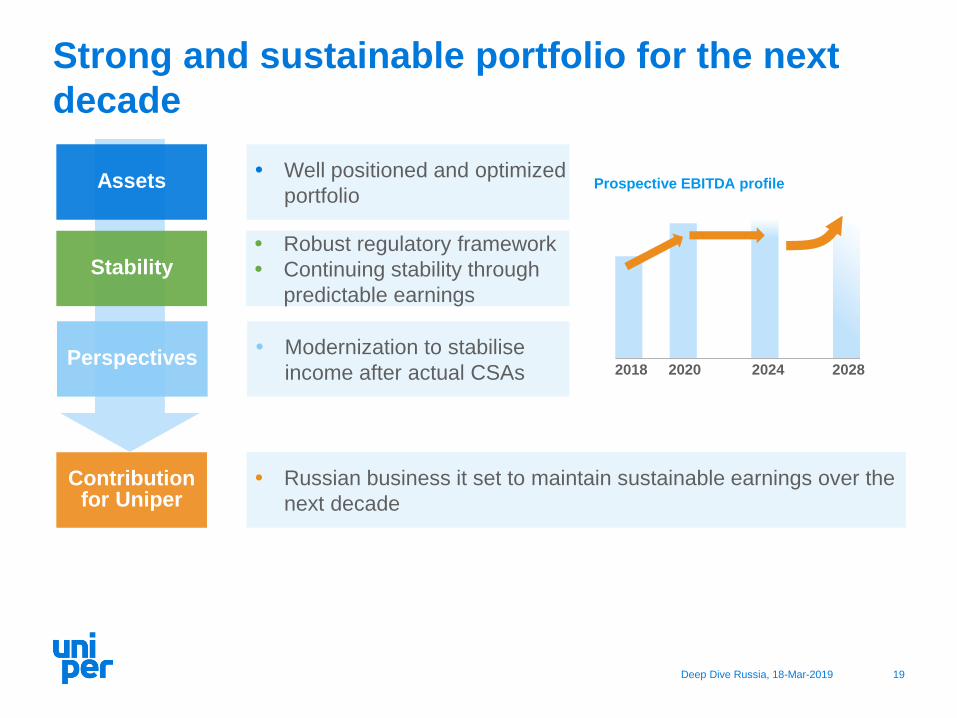
Strong and sustainable portfolio for the next
decade
Robust regulatory framework
Continuing stability through
predictable earnings
Stability
Modernization to stabilise
income after actual CSAsPerspectives
Russian business it set to maintain sustainable earnings over the
next decade
Contribution for Uniper
Well positioned and optimized
portfolioAssets Prospective EBITDA profile
2018 2020 2024 2028

Deep Dive Russia, 18-Mar-2019 20
Agenda
1. Unipro as part of Uniper Group
2. Unipro portfolio in the market context
3. Strategic development
4. Earnings drivers and prospects
5. Conclusion
Deep Dive Russia, 18-Mar-2019 21
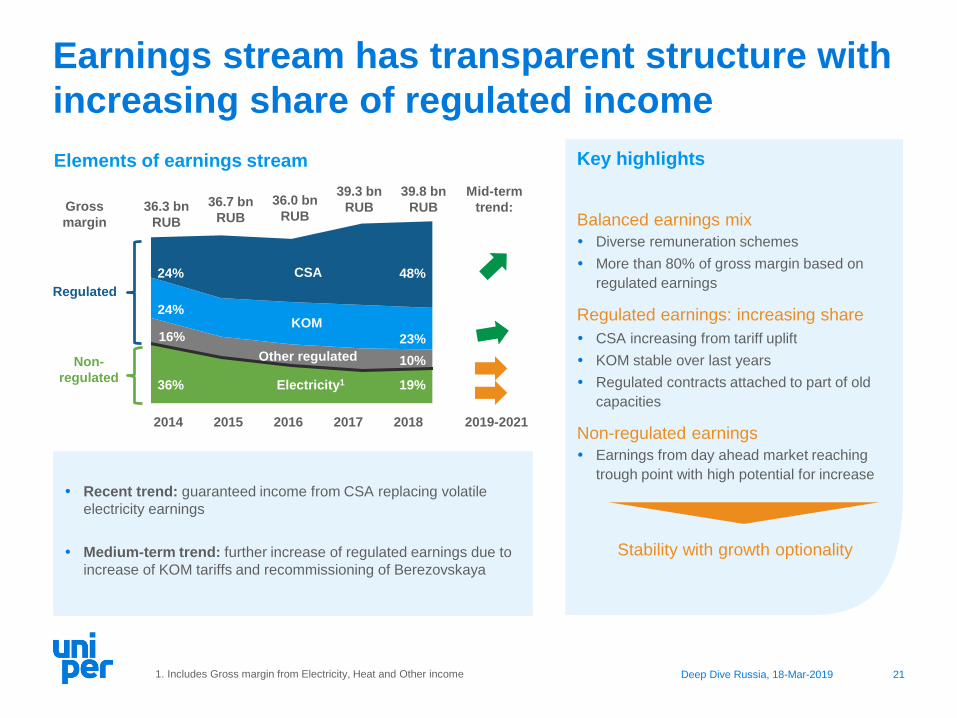
2014 2015 2016 2017 2018
Earnings stream has transparent structure with
increasing share of regulated income
Key highlights
Balanced earnings mix
Diverse remuneration schemes
More than 80% of gross margin based on
regulated earnings
Regulated earnings: increasing share
CSA increasing from tariff uplift
KOM stable over last years
Regulated contracts attached to part of old
capacities
Non-regulated earnings
Earnings from day ahead market reaching
trough point with high potential for increase
Stability with growth optionality
36.3 bn
RUB
36.7 bn
RUB
36.0 bn
RUB
39.3 bn
RUB
1. Includes Gross margin from Electricity, Heat and Other income
Regulated
Non-
regulated
39.8 bn
RUB
Other regulated
KOM
CSA
Electricity1
24%
24%
16%
36%
48%
23%
10%
19%
2019-2021
Mid-term
trend:
2014 2015 2016 2017 2018
Recent trend: guaranteed income from CSA replacing volatile
electricity earnings
Medium-term trend: further increase of regulated earnings due to
increase of KOM tariffs and recommissioning of Berezovskaya
Gross
margin
Elements of earnings stream
Deep Dive Russia, 18-Mar-2019 22
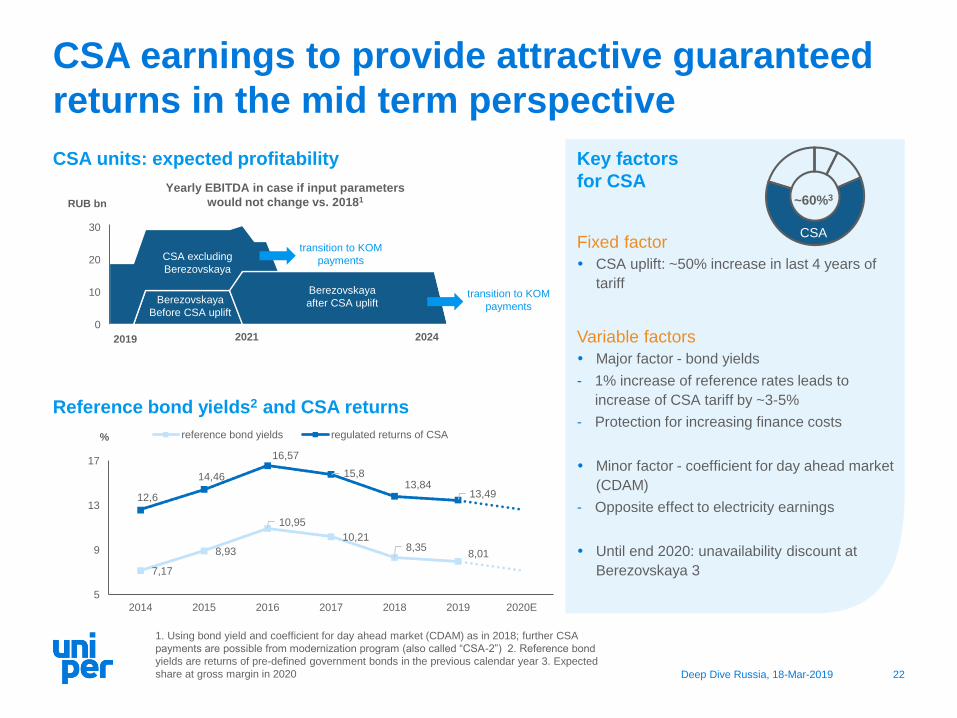
0
10
20
30
2018 2021 2024
Key factors
for CSA
Fixed factor
CSA uplift: ~50% increase in last 4 years of
tariff
Variable factors
Major factor - bond yields
- 1% increase of reference rates leads to
increase of CSA tariff by ~3-5%
- Protection for increasing finance costs
Minor factor - coefficient for day ahead market
(CDAM)
- Opposite effect to electricity earnings
Until end 2020: unavailability discount at
Berezovskaya 3
CSA earnings to provide attractive guaranteed
returns in the mid term perspective
CSA units: expected profitability
RUB bn
2019 2021 2024
Yearly EBITDA in case if input parameters
would not change vs. 20181
1. Using bond yield and coefficient for day ahead market (CDAM) as in 2018; further CSA
payments are possible from modernization program (also called “CSA-2”) 2. Reference bond
yields are returns of pre-defined government bonds in the previous calendar year 3. Expected
share at gross margin in 2020
Reference bond yields2 and CSA returns
CSA excluding
Berezovskaya
Berezovskaya
Before CSA uplift
Berezovskaya
after CSA uplift
% reference bond yields regulated returns of CSA
transition to KOM
payments
transition to KOM
payments
7,17
8,93
10,95
10,218,35
8,01
12,6
14,46
16,57
15,813,84
13,49
5
9
13
17
2014 2015 2016 2017 2018 2019 2020E
CSA
~60%3

Deep Dive Russia, 18-Mar-2019 23
100
140
180
220
260
2016 2018 2020 2022 2024
150
200
250
300
350
2016 2018 2020 2022 2024
Significant boost of KOM earnings to be
realised in the next years
Key factors
for KOM earnings
Current scheme
Established in 2010, possible for all capacities
which not subject to CSA3
Based on yearly auctions
First upsides started to realise
Upwards trend of last auction in 2017
Increase of indexation
Further upsides from updated regulation
Auction horizon prolonged up to 6 years
Shift of demand curve upwards to ensure
security of supply during modernization:
+15% for 2022-23, +20% for 2024-25
Further effects of market tightness
1. Source: internal estimates considering upward shift of the demand curve: +15% for 2022-23, +20% for
2024-25 2. indexed prices consider CPIs forecast as expected based on internal estimates 3. Special
treatment for capacities under regulated contracts 4. Expected share at gross margin in 2020
KOM prices: (expected) development until 20251
(kRUB/MW/month)
Zone 1 (Europe)
Zone 2 (Siberia)
Real
Indexed
Mid term perspective:
stable development
of real prices
Beginning of 2020s:
significant uplift
expected
KOM
Indexed
~20%4
Real

Deep Dive Russia, 18-Mar-2019 24
Electricity earnings add upside optionality on
top of regulated returns
Potential upside from higher generation volumes
Potential upside from growing gas prices as main driver
Key factors
for electricity
earnings
Mid-term driver:
supply-demand balance
GDP growth driving electricity consumption
40 GW to be timewise offline for
modernization
Long-term driver:
gas prices
Gas prices expected to rise above inflation
Increasing investments needs of gas
suppliers as major bullish factor
Competitive advantage of Unipro to benefit
from rising electricity prices:
- Load factor and fuel efficiency above
average market levels
- Attractive conditions of fuel procurement
Rebased
to 100 Development of supply / demand balance
for electricity in Russia1
1. Based on estimated development of supply and demand for capacity in zone 1 and zone 2,
sources: System operator (until 2021), internal estimates (after 2021) 2. Sources: IHS, Ministry
of Economic Development, internal estimates 3. Expected share at gross margin in 2020
100
125
150
175
2018 2020 2022 2024
Ministry of economic developmentIHSUpside based on breakeven price of gas producers
Electricity
earnings
Rebased
to 100 Development of gas prices in Russia2
95
98
101
104
2018 2020 2022 2024
Demand growth, % Supply growth, %
~8%3

Deep Dive Russia, 18-Mar-2019 25
27.9bnRUB
High level of earnings predictability until mid of
next decade
2018
Berezovskaya
back on line
Phase II:
New Plateau with
Berezovskaya
Phase I:
Enjoying CSAs
CSA uplift for
Berezovskaya
CSA expiration for
1.6 GW of capacity
Phase III:
Modernization to stabilize plateau
CSA expiration for
Berezovskaya
2018 2028
Upsides from KOM
1. Includes Gross margin from Electricity, Heat and Other income
CSA
KOM
Electricity1
Other
regulated
KOM
Electricity1
Other
regulated
Modernization
EBITDA development
Upsides from
modernization
Upsides from
electricity earnings
2020 2024 2028
Gross margin split Key highlights
Attractive cash stream from CSA earnings until 2024
Increasing KOM payments to partly outweigh CSA
expiration
Upsides from electricity earnings and from modernization
potential to minimize earnings cliff in mid 2020s
Deep Dive Russia, 18-Mar-2019 26
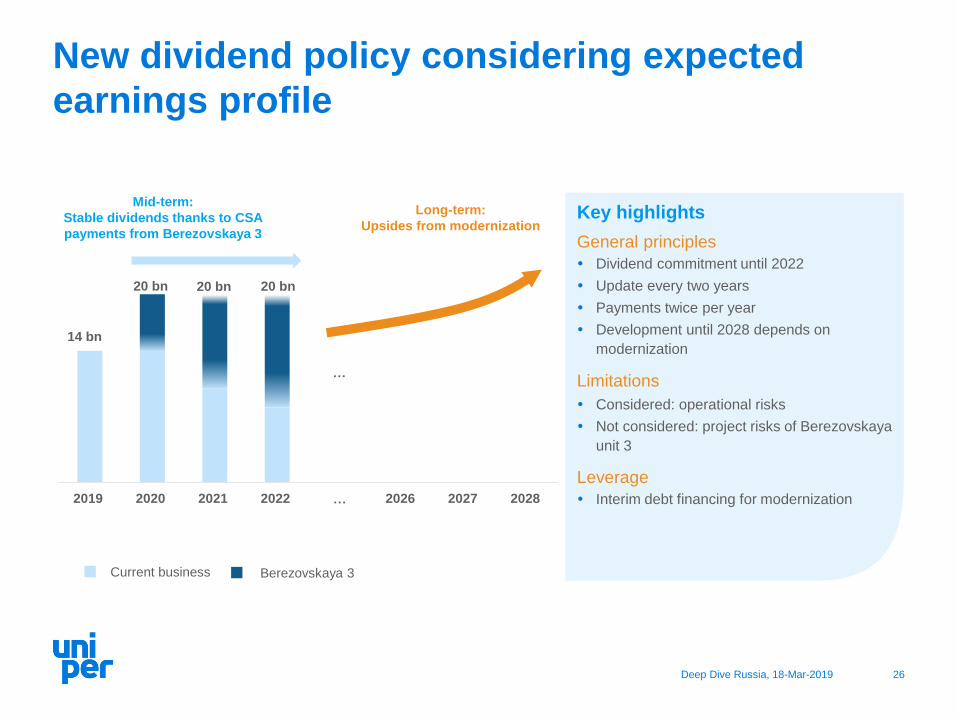
New dividend policy considering expected
earnings profile
0
5
10
15
20
25
2019 2020 2021 2022 … 2026 2027 2028
20 bn
Key highlights
General principles
Dividend commitment until 2022
Update every two years
Payments twice per year
Development until 2028 depends on
modernization
Limitations
Considered: operational risks
Not considered: project risks of Berezovskaya
unit 3
Leverage
Interim debt financing for modernization
14 bn
20 bn
Mid-term:
Stable dividends thanks to CSA
payments from Berezovskaya 3
Long-term:
Upsides from modernization
…
20 bn
Current business Berezovskaya 3

Deep Dive Russia, 18-Mar-2019 27
Key elements of the earnings story
Increasing share of regulated earningsDownside protection
Mitigation of earnings dip due to upsides in 2020sFilling the
gap
Predictable earnings for a sustainable dividend streamDividend
Profitability based on transparent earnings drivers Transparent
income streams

Deep Dive Russia, 18-Mar-2019 28
Agenda
1. Unipro as part of Uniper Group
2. Unipro portfolio in the market context
3. Strategic development
4. Earnings drivers and prospects
5. Conclusion

Deep Dive Russia, 18-Mar-2019 29
Long term sustainable profit contribution
Key part of Uniper generating portfolio
More than 80% of earnings are regulatedPortfolio
Modernization framework
Upsides mitigating expiration of CSAsPerspectives
Modernize portfolio
Sustainable dividend contributionValue
5th largest power market in the world1
Transparency and long-term stability of regulatory framework Market
1. Based on capacity installed in 2017
Deep Dive Russia, 18-Mar-2019 30
Disclaimer
This document and the presentation to which it relates contains information relating to Uniper SE, ("Uniper" or the "Company") that must not be relied upon for any purpose and may not be redistributed,
reproduced, published, or passed on to any other person or used in whole or in part for any other purposes. By accessing this document you agree to abide by the limitations set out in this document.
This document is being presented solely for informational purposes and should not be treated as giving investment advice. It is not, and is not intended to be, a prospectus, is not, and should not be
construed as, an offer to sell or the solicitation of an offer to buy any securities, and should not be used as the sole basis of any analysis or other evaluation and investors should not subscribe for or
purchase any shares or other securities in the Company on the basis of or in reliance on the information in this document.
Certain information in this presentation is based on management estimates. Such estimates have been made in good faith and represent the current beliefs of applicable members of management of
Uniper. Those management members believe that such estimates are founded on reasonable grounds. However, by their nature, estimates may not be correct or complete. Accordingly, no
representation or warranty (express or implied) is given that such estimates are correct or complete.
We advise you that some of the information presented herein is based on statements by third parties, and that no representation or warranty, express or implied, is made as to, and no reliance should be
placed on, the fairness, accuracy, completeness or correctness of this information or any other information or opinions contained herein, for any purpose whatsoever. Certain statements contained herein
may be statements of future expectations and other forward-looking statements that are based on the Company’s current views and assumptions and involve known and unknown risks and uncertainties
that may cause actual results, performance or events to differ materially from those expressed or implied in such statements. No one undertakes to publicly update or revise any such forward-looking
statement. Neither Uniper nor any of their respective officers, employees or affiliates nor any other person shall assume or accept any responsibility, obligation or liability whatsoever (in negligence or
otherwise) for any loss howsoever arising from any use of this presentation or the statements contained herein as to unverified third person statements, any statements of future expectations and other
forward-looking statements, or the fairness, accuracy, completeness or correctness of statements contained herein.
In giving this presentation, neither Uniper nor its respective agents undertake any obligation to provide the recipient with access to any additional information or to update this presentation or any
information or to correct any inaccuracies in any such information. This presentation is not intended to provide the basis for any evaluation of any securities and should not be considered as a
recommendation that any person should subscribe for or purchase any shares or other securities.
This presentation contains certain financial measures (including forward-looking measures) that are not calculated in accordance with IFRS and are therefore considered as "Non-IFRS financial
measures". The management of Uniper believes that the Non-IFRS financial measures used by Uniper, when considered in conjunction with (but not in lieu of) other measures that are computed in
accordance with IFRS, enhance an understanding of Uniper's results of operations, financial position or cash flows. A number of these Non-IFRS financial measures are also commonly used by securities
analysts, credit rating agencies and investors to evaluate and compare the periodic and future operating performance and value of Uniper and other companies with which Uniper competes. These Non-
IFRS financial measures should not be considered in isolation as a measure of Uniper's profitability or liquidity, and should be considered in addition to, rather than as a substitute for, net income and the
other income or cash flow data prepared in accordance with IFRS. In particular, there are material limitations associated with our use of Non-IFRS financial measures, including the limitations inherent in
our determination of each of the relevant adjustments. The Non-IFRS financial measures used by Uniper may differ from, and not be comparable to, similarly-titled measures used by other companies.