union pacific 2002 financial and operating statistics
TRANSCRIPT

Union Pacif ic 2002 Financial and Operating Statistics
Union Pacific Railroad 2 Railroad Overview
7 Density Map
8 Agricultural
10 Automotive
12 Chemicals
14 Energy
16 Industrial Products
18 Intermodal
20 Mexico
22 Financial and Operating Statistics
Overnite Corporation 27 Overnite Overview
29 Service Center Map
30 Financial and Operating Statistics
33 Cautionary Information

UNION PACIFIC RAILROAD ❘ 2
structure that serves customers in critical
and fast-growing markets. That
network, combined with a well-balanced
and diverse traffic mix, makes Union
Pacific the premier rail franchise in
North America.
A key strength of the franchise is
access to the coal fields in the Powder
River Basin (PRB) region of northeastern
Wyoming. Growth of PRB coal tonnage
hauled by UP has averaged 8% over the
past five years, reflecting PRB coal’s low-
production cost and low-sulfur content.
UP’s rail lines in the Midwest and
Plains states provide direct routes from
major grain-producing areas to domestic
markets, Mexico and to ports of export
in the Gulf Coast and Pacific Northwest.
Union Pacific also has broad coverage in
the large chemical-producing areas along
the Gulf Coast, hauling nearly 70% of all
goods in this market.
To handle growing east-west inter-
modal and automotive traffic, Union
Pacific has competitive long-haul routes
between all major West Coast ports and
eastern gateways.
Leveraging the automotive network
enables Union Pacific to deliver more
than 80% of the finished vehicles sold
west of the Mississippi River. By directly
serving all six major gateways to Mexico
and having the fastest and most direct
route to and from the industrial Midwest
and Mexico, the Railroad transports
approximately 80% of all rail traffic
crossing this southern border. UP also
reaches north into Canada through the
Eastport gateway, as well as through
exchange points in Minnesota, Wisconsin
and Illinois. Union Pacific’s routes in the
South and Southwest produce a single-
line rail network serving the fastest
growing population centers in this part
of the country. Leveraging the strengths
of this broad franchise is critical to
successfully implementing the Yield
Strategy which will allow Union Pacific
to improve customer service, grow
market share and achieve improved
financial returns.
Union Pacific is the largest railroad in North America, covering23 states across the western two-thirds of the United States. TheUnion Pacific franchise has a strategically advantageous route
U N I O N PA C I F I C R A I L R O A D O V E R V I E W
F I N A N C I A L S U M M A R Y
Union Pacific - Rail and Other Operations
2002 2001 2000(b)
Operating Revenues (millions of dollars) $11,159 $10,830 $10,765
Operating Income (millions of dollars) $2,253 $2,018 $1,965
Operating Margin 20.2% 18.6% 18.3%
Revenue Carloads (thousands) 9,131 8,916 8,901
Average Employees 47,298 48,632 50,523
Capital Investments (millions of dollars)(a) $1,850 $1,701 $1,867
(a) Includes long-term operating leases(b) 2000 excludes the impact of a $115 million pre-tax work force reduction charge Excludes results from Overnite Corporation

RAILROAD OVERVIEW ❘ 3
FINANCIAL REVIEW
The Railroad’s franchise diversity once
again paid dividends in 2002 as commod-
ity revenue grew to a record $10.7 billion,
up 3% from 2001. In the face of an
uncertain economic landscape and the
disruption at the West Coast ports, five
of the six business groups experienced
growth during the year. Rail employee
productivity, as measured by millions of
gross-ton miles per employee, reached
an all-time high in 2002 at 21.0, up nearly
7%. Employee safety continued its
positive trend as reportable injuries per
200,000 man hours declined 17% from
2001 levels. In addition, continued focus
on quality processes helped drive further
reductions in failure costs, as measured by
Cost of Quality, to 11.3% for 2002. These
efforts, combined with other operational
efficiencies, drove the operating margin
for the Railroad and Other Operations
up to 20.2%, the first year above 20%
since the Southern Pacific merger.
Earnings momentum continued in
2002 as net income for the Railroad and
Other Operations increased to a best-ever
$1.25 billion, up from the $920 million
reported in 2001. Excluding land sales to
the Utah Transit Authority and Santa
Clara Valley Transportation Authority, as
well as various tax adjustments, net
income rose by 18% over 2001 levels.
Capital spending at the Railroad, exclud-
ing long-term operating leases, increased
during 2002 to $1.817 billion from $1.687
billion in 2001, while free cash flow after
dividends increased to $654 million from
$321 million in 2001.
CHANGING THE GAME
In 1999, when Union Pacific first
began implementing the Yield Strategy,
the traditional views of how to maximize
railroad profitability were challenged.
The goals of this strategy, to achieve
improved operating margins and returns
in excess of the cost of capital, could only
be accomplished by focusing on the
fundamentals. Those fundamentals
Union Pacific Mission:Union Pacific is committed to be a railroad where:
Customers want to do business, Employees are proud to workand Shareholder value is created.
+8%
REVENUE GROWTH (percent change vs 2001)
Automotive
Energy
Intermodal
Chemicals
Industrial
Agricultural
Total
+5%
+4%
+3%
+2%
-2%
+3%
include providing a premium service for
a premium price, achieving a mix of busi-
ness that maximizes profitability, leverag-
ing volume across the system, increasing
productivity and efficiently utilizing the
assets of the Railroad. The franchiseis in place, however, now we need to
leverage alliances, improve servicereliability and identify businessdevelopment opportunities, all of
which are critical to accomplishing
these goals.
1999 2000* 20022001
OPERATING MARGIN
17.5%18.3% 18.6%
20.2%
Rail & Other Operations*Excluding $115 million pre-tax work force reduction charge
Union Pacific Railroad
1999 2000 20022001
COST OF QUALITY
15.3%13.9%
12.5%11.3%
Rail & Other OperationsFailure costs as a Percentage of Revenue

RAILROAD OVERVIEW ❘ 4
C H A N G I N G T H E G A M E
LEGEND
Single and Double Track
Triple and Quadruple Track
Major Classification Yards
Major Intermodal Trailer/Container Terminals
Auto Facilities
Auto Assembly Centers and Facilities
Las Vegas
Colton
Calexico
Phoenix
Nogales
Tucson
El Paso
Eagle Pass
Laredo
Brownsville
SanAntonio
Houston
Ft. Worth
Dallas
Livonia
Pine BluffN.Little RockAmarillo
OklahomaCity Memphis
Wichita
Shreveport
Pocatello
Ogden
Salt Lake CityReno
RosevilleLathrop
Oakland
SanFrancisco
Los Angeles
Long Beach
Denver
Cheyenne
ShawneeJct.
Seattle
Portland
SpokaneEastport
Tacoma
Hinkle
Nampa
Kansas City
St. Louis
OmahaDes Moines
Chicago
Milwaukee
Duluth
MinneapolisSt. Paul
North Platte
GibbonMarysville
PuebloTopeka
New Orleans
Green River
SilverBow
Tucumcari
The Franchise
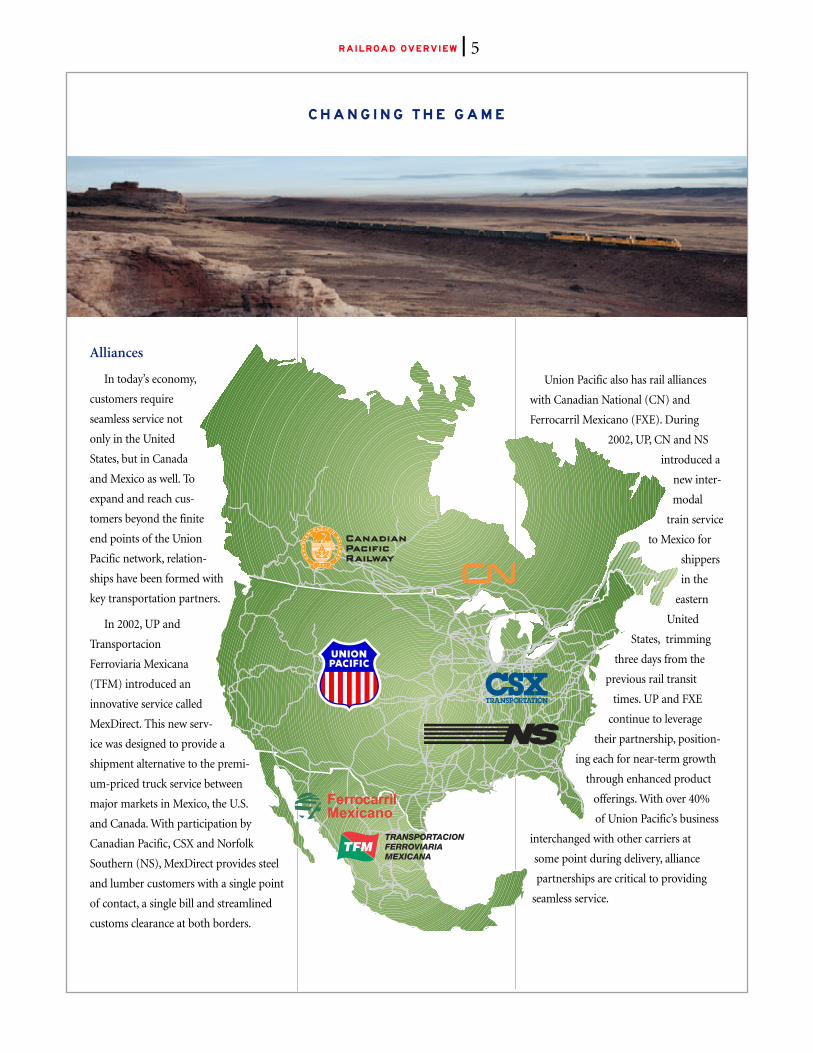
Alliances
In today’s economy,
customers require
seamless service not
only in the United
States, but in Canada
and Mexico as well. To
expand and reach cus-
tomers beyond the finite
end points of the Union
Pacific network, relation-
ships have been formed with
key transportation partners.
In 2002, UP and
Transportacion
Ferroviaria Mexicana
(TFM) introduced an
innovative service called
MexDirect. This new serv-
ice was designed to provide a
shipment alternative to the premi-
um-priced truck service between
major markets in Mexico, the U.S.
and Canada. With participation by
Canadian Pacific, CSX and Norfolk
Southern (NS), MexDirect provides steel
and lumber customers with a single point
of contact, a single bill and streamlined
customs clearance at both borders.
Union Pacific also has rail alliances
with Canadian National (CN) and
Ferrocarril Mexicano (FXE). During
2002, UP, CN and NS
introduced a
new inter-
modal
train service
to Mexico for
shippers
in the
eastern
United
States, trimming
three days from the
previous rail transit
times. UP and FXE
continue to leverage
their partnership, position-
ing each for near-term growth
through enhanced product
offerings. With over 40%
of Union Pacific’s business
interchanged with other carriers at
some point during delivery, alliance
partnerships are critical to providing
seamless service.
C H A N G I N G T H E G A M E
RAILROAD OVERVIEW ❘ 5

RAILROAD OVERVIEW ❘ 6
Service Reliability
Reliable, consistent service is the key to
capturing share from trucks, a market
estimated at $90 billion annually. UP eval-
uated its network and targeted six differ-
ent corridors on which it offers a strategic
advantage over other railroads. The I-5
corridor, running along the West Coast,
was UP’s “proof of concept” for improv-
ing service performance corridor by corri-
dor. By focusing on pick-up and delivery
service at customers’ facilities, over-the-
road performance and critical car connec-
tions at terminals, service reliability has
improved dramatically in this corridor.
CAR CYCLE TIME (in days)
TERMINAL DWELL TIME(in hours)
TO/FROM INDUSTRY(percent)
Houston
North LittleRock
St. Louis
TexasGulf Coast
To EasternConnections
Salem
Chicago
13.3
DEC 02
DEC 02
DEC 02
DEC 01
DEC 01
DEC 01
Good
Good
Good
61.8
17.9
29.0
95.9
12.1
To EasternConnections
MID-AMERICA CORRIDOR SERVICE INITIATIVE
TRIP PLAN COMPLIANCE(percent) 79.7
73.0Good
DEC 02DEC 01
In 2002, the successes and failures
experienced on the I-5 corridor were
translated into “best practices” that have
been implemented on three additional
corridors – the Overland, Gulf Coast and
Mid-America – driving customer satisfac-
tion levels for the Railroad to a seven year
high of 78%. These service improvements
correlate directly with the Railroad’s
internal measure for meeting customer
expectations, the service delivery index,
which improved 3 percentage points in
2002 to a best-ever 73%. Although still
in the early stages of implementation, the
Mid-America corridor is experiencing
significant service improvements, as well
as better asset utilization. Two additional
corridors, the Oregon Trail and Heartland
are scheduled for roll-out in 2003.
Business Development
The end result of “changing the game”
is the ability to develop new business
partners and penetrate new markets.
Focusing on franchise strengths,
synergies with alliance partners, new
product development and service
reliability has translated into top line
growth opportunities. As described in
the individual business sections that
follow, each of the six business teams, as
well as the Mexico team, have plans to
expand their market share through
business development initiatives.
THE FUTURE
With an uncertain economic outlook
and high fuel prices, Union Pacific
will face significant challenges in 2003.
However, UP’s dedication to achieving
continued productivity gains, improved
service reliability and increased customer
satisfaction remains unchanged. In
addition, the unparalleled franchise has
positioned Union Pacific’s stakeholders –
customers, employees and shareholders –
for a bright future in years to come.
C H A N G I N G T H E G A M E

UNION PACIFIC RAILROAD ❘ 7
D E N S I T Y M A P
THOUSANDS OF GROSS TON-MILES (GTM’S)
PER ROUTE MILE
■ 100,000+ GTM’s Per Route Mile
■ 50,000 - 99,999 GTM’s Per Route Mile
■ 0 - 49,999 GTM’s Per Route Mile
Dashed lines indicate operating rights on other railroads
Seattle
Portland Hinkle
SpokaneEastport
Eugene
Pocatello
Ogden
Salt Lake CityReno
RosevilleStockton
Fresno
Oakland
SanFrancisco
Las Vegas
ColtonLos Angeles
Long Beach
Yuma
Phoenix
Nogales
Tucson
El Paso
Eagle Pass
Laredo
Brownsville
SanAntonio
Houston
Ft. Worth
Dallas
Livonia
New Orleans
Texarkana Pine BluffN. Little Rock
Lubbock
Amarillo
OklahomaCity Memphis
Wichita
Topeka
Kansas CitySt. Louis
Omaha Des Moines
Chicago
Milwaukee
Duluth
MinneapolisSt. Paul
North Platte
DenverMarysville
Cheyenne
Pueblo
GrandJunction
Granger
ShawneeJct.
SierraBlanca
Del Rio
Woodland Jct.
E. CaballoJct.
R E V E N U E M I XCOMMODITY REVENUE: $10.7 BILLION
Agricultural 14%
Automotive11%
Industrial Products 19%
Intermodal 19%
Chemicals 15%
Energy 22%

UNION PACIFIC RAILROAD ❘ 8
2002 REVIEW
■ Whole grain traffic contracted 1% in
2002 due to continued softness in
export demand and declines in grain
processor business. However, a
significant increase in feed grain
movements into Mexico offset
some of the decline.
■ Grain Products experienced more
than a 2% increase in carloads over
2001 levels. Overall, the business
shifted to longer-haul, more prof-
itable traffic including gains in
ethanol, meal shipments to Mexico
and cottonseed.
■ Express Lane business continued to
capture market share from truck
taking an additional 7,500 trucks off
the highway in 2002. More than 650
refrigeration cars were refurbished
and placed back into service complet-
ing the first phase of UP’s reefer strat-
egy. Leveraging the equipment and
improved market share drove a 14%
increase in Express Lane revenue.
KEY MARKET FACTORS
■ Union Pacific offers a critical link
between producing areas in the
Midwest, West, Pacific Northwest
(PNW) and primary Gulf ports, as
well as to Mexico. UP’s domestic
markets include grain processors and
feeders, as well as ethanol producers,
in the Midwest, West, South and
Rocky Mountain states.
■ Producers and consumers of food
and beverages are distributed
broadly across the Railroad system.
■ Domestic and foreign crop produc-
tion, grain prices and shipping rate
spreads between the Gulf Coast
and the PNW are primary factors
affecting export grain traffic.
Union Pacific’s domestic traffic
is driven largely by consistent
service performance.
A G R I C U L T U R A L
2002 CARLOADS
■ Whole GrainCorn & Feed Grains (33%)Wheat & Food Grains (15%)
■ Grain ProductsMeals & Oils (13%)Sweeteners (10%)Proteins & Feed (6%)Food Grain Products (5%)
■ FoodCanned/Packaged/Beverages (9%)Fresh & Frozen Products (9%)
13%
9%33%
Arrow colors correspond to pie chart colors.
Note: Grain Products and Food move in the same lanes.
15%10%
6%
5%
9%
Mexico (13%)
Export (9%)
Domestic (78%)

Commodity Revenue (millions of dollars)
2002 2001 2000
1 2 3 4 1 2 3 4 1 2 3 4
Quarterly 369 354 373 410 370 345 358 381 350 334 363 353
Cumulative 369 723 1,096 1,506 370 715 1,073 1,454 350 684 1,047 1,400
Revenue Ton-Miles (millions)
2002 2001 2000
1 2 3 4 1 2 3 4 1 2 3 4
Quarterly 18,414 17,413 17,805 18,942 17,332 16,558 17,024 18,193 17,581 16,433 16,972 16,279
Cumulative 18,414 35,827 53,632 72,574 17,332 33,890 50,914 69,107 17,581 34,014 50,986 67,265
Revenue Carloads (thousands)
2002 2001 2000
1 2 3 4 1 2 3 4 1 2 3 4
Quarterly 219 212 216 234 219 212 214 231 221 213 217 222
Cumulative 219 431 647 881 219 431 645 876 221 434 651 873
Average Commodity Revenue Per Car (dollars)
2002 2001 2000
1 2 3 4 1 2 3 4 1 2 3 4
Quarterly 1,688 1,668 1,728 1,750 1,687 1,633 1,668 1,652 1,582 1,568 1,673 1,595
Cumulative 1,688 1,678 1,695 1,709 1,687 1,661 1,663 1,660 1,582 1,575 1,607 1,604
AGRICULTURAL ❘ 9
■ Grain moves most efficiently in unit
trains that shuttle continuously
between producers and export termi-
nals or domestic markets. Smaller
shipments, including grain products
and food and beverages, typically
move in the manifest train network.
2003 OUTLOOK
■ Express Lane and Wine Connection
will continue to be a primary focus
in the overall growth strategy.
Further penetration of the truck
market is critical to expansion and
should be accomplished by reaching
into new origin and destination mar-
kets and adding additional com-
modities. Throughout 2003, UP will
continue to add new and refurbished
cars to capture this service-sensitive
market. Benefits from the updated
equipment include improved cus-
tomer satisfaction, revenue and price
growth, a reduction in damage
claims due to temperature failure
and increased fuel efficiency. In addi-
tion, strategically locating freight car
cleaning facilities will help reduce
overall cycle times for the fleet.
■ Union Pacific will also continue to
focus on growth into Mexico. In
partnership with FXE and TFM, UP
expects to further expand its shuttle
train network into Mexico. As part of
the Express Lane expansion, fresh
and frozen fruits and vegetables will
begin to move both north and south-
bound. Northbound beer shipments
should also continue to post strong
growth for UP.
■ As export demand for grain contin-
ues to fluctuate widely, alliances
with other railroads will enable
Union Pacific to compete in previ-
ously unserviced markets in the
upper Midwest. Demand for
domestic feed grain is expected
to be strong in 2003.
■ Union Pacific is positioned to cap-
ture a significant share of the double
digit growth in the ethanol industry
as it expands further into the gaso-
line market. Union Pacific will utilize
North Platte to block ethanol ship-
ments from the Midwest for move-
ment into staging yards at
destinations in the West.
2001 2005Est.
2002
1.7
2.4
Source: Energy Information Administration & Industry Resources
KEY MARKET FACTORS continued
U.S. ETHANOL CONSUMPTION(billions of gallons)

UNION PACIFIC RAILROAD ❘ 10
2002 REVIEW
■ Automotive shipments rose 7% as the
result of share gains in finished vehicles
and automotive materials. Union
Pacific’s western U.S. rail market share
gained 6 points to 81% in 2002.
Overall, new light vehicle sales in the
U.S. dropped 2% in 2002.
■ Union Pacific and DaimlerChrysler fin-
ished the first full year of operations for
the newly formed Insight Network
Logistics Company, LLC (INL). INL
successfully deployed its VinVision
technology to manage and monitor
over 2.5 million vehicle movements in
2002, driving waste and non-value
added time from the distribution chain.
■ Service network improvements allowed
UP to convert auto materials business
that traditionally moved by truck to
rail. UP’s premium automotive
network provided products that deliver
consistent, reliable service. Customers
converted 35,000 truck loads of
business off the highway to rail.
■ Union Pacific continued to invest in
technology in 2002 to improve
network velocity. Radio frequency
infrastructure was installed at 18
vehicle distribution centers to provide
real time vehicle information to
customers and haul away carriers,
with additional facilities to be equipped
in 2003. The continued focus on
improving the distribution process
allowed UP to reduce ramp dwell time
by 12% in 2002.
■ In 2002, UP continued to receive high
marks from customers. Toyota
awarded UP their President’s Award
as their top rail supplier for the third
consecutive year. UP received the
DaimlerChrysler Gold Award as a
top rail supplier for the third consecu-
tive year. In addition, General
Motors awarded UP their Supplier
of the Year award.
A U T O M O T I V E
2002 CARLOADS
■ Assembled Autos (69%)
■ Auto Materials (31%)
69%
Arrow colors correspond to pie chart colors.
31%
Mexico (26%)
Domestic (68%)
International (6%)

Commodity Revenue (millions of dollars)
2002 2001 2000
1 2 3 4 1 2 3 4 1 2 3 4
Quarterly 283 325 285 316 276 301 253 288 290 307 280 305
Cumulative 283 608 893 1,209 276 577 830 1,118 290 597 877 1,182
Revenue Ton-Miles (millions)
2002 2001 2000
1 2 3 4 1 2 3 4 1 2 3 4
Quarterly 3,945 4,498 3,897 4,497 3,694 3,961 3,473 4,092 4,229 4,298 3,853 4,136
Cumulative 3,945 8,443 12,340 16,837 3,694 7,655 11,128 15,220 4,229 8,527 12,380 16,516
Revenue Carloads (thousands)
2002 2001 2000
1 2 3 4 1 2 3 4 1 2 3 4
Quarterly 193 219 193 213 185 199 177 202 199 214 196 206
Cumulative 193 412 605 818 185 384 561 763 199 413 609 815
Average Commodity Revenue Per Car (dollars)
2002 2001 2000
1 2 3 4 1 2 3 4 1 2 3 4
Quarterly 1,462 1,486 1,479 1,480 1,486 1,514 1,429 1,428 1,456 1,437 1,425 1,483
Cumulative 1,462 1,475 1,476 1,477 1,486 1,501 1,478 1,465 1,456 1,446 1,439 1,450
AUTOMO TIVE ❘ 11
KEY MARKET FACTORS
■ Union Pacific is the largest carrier of
finished vehicles west of the Mississippi
River. The Railroad has 42 facilities
strategically located to serve all major
population centers in the western U.S.
Union Pacific also serves seven assem-
bly centers and distributes import
vehicles from six West Coast ports
and two Gulf ports.
■ Mexico is an important automotive
market for the Railroad as companies
continue to produce vehicles for both
domestic and U.S. consumption.
Automotive materials flow north
and south across the border bound
for assembly centers in Mexico, the
U.S. and Canada. UP handled over
90% of all automotive rail traffic
between the US and Mexico in 2002.
2003 OUTLOOK
■ North American light vehicle sales are
expected to decline for the third year
in a row. Union Pacific expects to
offset industry weakness by leveraging
its premium automotive network
service product. The dedicated
automotive network should allow
UP to gain additional market share,
focused specifically at taking
automotive materials business off
the highway.
■ Supply chain logistics services, using
UP’s ongoing technology investments
in support of the automotive industry
should continue to enhance cus-
tomers’ “Fast-to-Market” strategies.
These products should facilitate
ongoing improvements in velocity
and reliability for the entire
distribution network.
■ The automotive materials business,
with particular focus on Mexico,
should provide opportunity for
growth as UP develops supply chain
solutions and new rail services for
customers, allowing UP to capture
additional market share from trucks.
■ UP and its rail partners continue to
provide seamless transportation
solutions for the auto materials
markets. UP also has increased the
awareness of rail solutions with
nontraditional rail customers and
anticipates carload gains in 2003.
16.9
17.4 16.817.1
1999 2000 20022001
FINISHED VEHICLE GROWTH
UP Carloadings (thousands)
Light Vehicle Sales (millions)
464512
568
509

UNION PACIFIC RAILROAD ❘ 12
2002 REVIEW
■ Improved economic demand from
2001’s recessionary levels resulted in a
3% increase in shipments of industri-
al chemicals and plastics.
■ Increasing demand from industrial
manufacturers resulted in a 3%
increase in liquid and dry carloadings.
■ Plastics carloadings increased 2% as
demand for consumer durable goods
improved during 2002.
■ Liquid petroleum products carload-
ings increased by 10% due to strong
domestic shipments and increased
exports to Mexico.
■ Soda ash carloads increased 3% as
demand for both export and domes-
tic soda ash improved.
■ The West Coast port disruption and
worldwide market conditions for
potash drove fertilizer carloads down
1% for the year. In contrast, domestic
nitrogen and phosphate shipments
rose in 2002, as lower natural gas
prices drove increased production of
nitrogen products.
KEY MARKET FACTORS
■ Natural gas prices impact chemical
production whether as a feed stock
component or as an energy source
during plant production.
■ Plastics customers depend on reliable
rail service and railroad-provided
storage-in-transit (SIT) yards for
intermediate storage of plastic resins.
UP’s SIT capacity leads the industry,
with some expansion planned
in 2003.
■ Fertilizers are produced and import-
ed in the Gulf Coast and the western
U.S. and Canada and are shipped to
major agricultural areas.
■ The liquid and dry market consists
of 22 different segments of various
intermediate chemicals produced by
and shipped to a multitude of large
and small customers.
C H E M I C A L S
2002 CARLOADS
■ Liquid & Dry (31%)Plastics (25%)Liquid Petroleum Products (17%)
■ Fertilizers & Related Products (17%)
■ Soda Ash (10%)
31%
25%17%
17%
10%
Mexico (5%)
Arrow colors correspond to pie chart colors.
International (14%)
Domestic (81%)

Commodity Revenue (millions of dollars)
2002 2001 2000
1 2 3 4 1 2 3 4 1 2 3 4
Quarterly 385 402 399 389 390 386 393 376 412 424 412 392
Cumulative 385 787 1,186 1,575 390 776 1,169 1,545 412 836 1,248 1,640
Revenue Ton-Miles (millions)
2002 2001 2000
1 2 3 4 1 2 3 4 1 2 3 4
Quarterly 12,906 13,715 13,615 13,161 12,785 12,856 12,936 12,555 13,514 13,607 13,152 12,877
Cumulative 12,906 26,621 40,236 53,397 12,785 25,641 38,577 51,132 13,514 27,121 40,273 53,150
Revenue Carloads (thousands)
2002 2001 2000
1 2 3 4 1 2 3 4 1 2 3 4
Quarterly 217 233 231 223 219 222 225 213 232 244 237 223
Cumulative 217 450 681 904 219 441 666 879 232 476 713 936
Average Commodity Revenue Per Car (dollars)
2002 2001 2000
1 2 3 4 1 2 3 4 1 2 3 4
Quarterly 1,771 1,728 1,729 1,742 1,778 1,748 1,744 1,755 1,777 1,741 1,738 1,753
Cumulative 1,771 1,749 1,742 1,742 1,778 1,763 1,757 1,756 1,777 1,759 1,752 1,752
CHEMICALS ❘ 13
■ UP directly serves Green River,
Wyoming, the largest soda ash pro-
ducing region in the world. Domestic
demand for soda ash is relatively
constant. Export markets to Asia,
Europe and Mexico, though volatile,
provide growth opportunity.
2003 OUTLOOK
■ Growth in plastics and liquid and
dry chemicals shipments are
contingent upon feed stock prices
and economic recovery.
■ Fertilizer demand is expected to
improve with the completion and
implementation of the 2002 Farm
Bill, aimed at assisting farmers in
investing in crop inputs.
■ Liquid petroleum products are
expected to strengthen through the
development of the petrochemical
industry domestically and in Mexico,
while increased Ethanol blending in
gasoline will bring changes to the
traditional traffic flows.
■ Continued demand for export and
domestic soda ash should result in
additional carload growth.
■ Expansion of the “Pipeline” service
into new lanes and continued focus
on operational improvements in the
Gulf Coast corridor will further
improve asset utilization for cus-
tomers and UP.
■ Implementation of the “Transflo”
transloading network will provide
chemical customers with additional
rail options. Transflo is an ISO-
9001:2000 registered, rail centric
transloader that delivers the
economics of rail to non-rail
served customers.
Houston
New OrleansTexasGulf Coast
To EasternConnections
GULF COAST CORRIDOR
SERVICE VARIABILITY
50%
25%
0%-96 -48 0 48 96
Hours
Span (Hrs):4Q 02 - 15.34Q 01 - 26.9
Livonia
KEY MARKET FACTORS continued

UNION PACIFIC RAILROAD ❘ 14
2002 REVIEW
■ In 2002, coal volume grew over 1%
to 241 million tons, with coke traf-
fic holding steady at 4 million tons.
The significant growth region in
2002 was Wyoming’s Powder River
Basin (PRB) which set a record with
171 million tons originated.
■ Soft demand for coal originating
out of Colorado and Utah mines
contributed to 1 million (2%) fewer
tons being loaded from these areas
in 2002 versus a year ago. This
reduction reflects the decline in
exports from the West Coast after
the first quarter of 2002.
■ PRB coal train productivity
increased 3% in 2002 driven by
continued improvements in both
cars per train and tons per car.
Average train size grew by nearly 3
cars while each car on average was
loaded with nearly one additional
ton of coal.
■ Capacity expansion continued on
the South Morrill Sub in 2002.
Between South Morrill and North
Platte, almost 32 miles of single
track were expanded to double
track. Additional capacity
improvements were made on the
East-West mainline through Iowa
and the Cedar River Bridge.
■ PRB cycle time performance
improved almost 4 percentage
points to a record 99%. Overall
coal train velocity was up from
15.5 miles per hour in 2001 to
16.3 miles per hour in 2002.
E N E R G Y
2002 CARLOADS
■ Powder River Basin (68%)
■ Colorado/Utah (18%)
■ Other (includes Coke) (14%)
Arrow colors correspond to pie chart colors.
68%
18%
14% Industrial (7%)West (9%)East (12%)
North (27%)
South (45%)
PowerGeneration

Commodity Revenue (millions of dollars)
2002 2001 2000
1 2 3 4 1 2 3 4 1 2 3 4
Quarterly 582 570 591 600 593 577 611 618 529 490 586 549
Cumulative 582 1,152 1,743 2,343 593 1,170 1,781 2,399 529 1,019 1,605 2,154
Revenue Ton-Miles (millions)
2002 2001 2000
1 2 3 4 1 2 3 4 1 2 3 4
Quarterly 56,528 54,304 57,327 59,010 54,943 53,318 56,574 58,258 48,580 44,934 54,323 50,879
Cumulative 56,528 110,832 168,159 227,169 54,943 108,261 164,835 223,093 48,580 93,514 147,837 198,716
Revenue Carloads (thousands)
2002 2001 2000
1 2 3 4 1 2 3 4 1 2 3 4
Quarterly 545 520 540 559 537 516 549 559 480 439 513 498
Cumulative 545 1,065 1,605 2,164 537 1,053 1,602 2,161 480 919 1,432 1,930
Average Commodity Revenue Per Car (dollars)
2002 2001 2000
1 2 3 4 1 2 3 4 1 2 3 4
Quarterly 1,068 1,095 1,095 1,074 1,106 1,117 1,113 1,107 1,103 1,115 1,141 1,101
Cumulative 1,068 1,081 1,086 1,083 1,106 1,111 1,112 1,111 1,103 1,109 1,120 1,116
ENERGY ❘ 15
KEY MARKET FACTORS
■ Union Pacific provides transporta-
tion service between most of the
coal-producing regions in the
western U.S. and utilities and
industrial facilities in 27 states. The
PRB represents the largest and fastest
growing segment of the market, as
utilities continue to favor the low
cost and low-sulfur content of the
coal mined there. In addition,
declining coal production in the
East, as well as a lack of economically
competitive alternatives for satisfying
the growing demand for electricity,
continue to favor western coal.
■ The Railroad also moves high-BTU
low-sulfur coal from Colorado
and Utah to domestic utilities
and industries. Colorado coal is
exported to Mexico via Eagle Pass,
Texas, and PRB coal is exported to
Europe through Mississippi River
Barge Terminals.
2003 OUTLOOK
■ Volume growth from existing cus-
tomers will be the key for 2003. A
stronger economy, cooperative
weather and inventory stock piles
will play critical roles in determining
volume growth for the year.
Leveraging past and future capacity
enhancements should assist in
improving the already solid service
performance and maintaining system
fluidity with higher volumes.
■ A continued focus on train size
improvements, routing efficiencies,
and recrew reductions should drive
productivity performance in the
upcoming year.
■ Additional expansion of western coal
to eastern utilities is expected
through UP’s partnerships with
the eastern carriers.
■ 2003 capital spending will focus
on double tracking half of the
remaining 13 miles of single track on
the South Morrill Sub between
North Platte and South Morrill.
The expansion of Dupo Yard is
expected to be complete in 2003,
increasing fluidity of business
moving beyond St. Louis.
EASTERN COAL SHORTAGE
800
650
50090 92 94 96 98 00 02
140
100
60
Tons (millions)
Megawatts (000)
Year
COAL-BASED POWER GENERATION - EAST
EASTERN COALPRODUCTION
(Megawatts)
(Tons)

showed strong growth due to
strength in highway construction
and market penetration in the
Southwest and mid-South.
■ The steel market improved in 2002,
with domestic production and
demand for Mexican steel increasing
over the prior year, due in part to the
Section 201 tariff.
■ Continued focus on yield manage-
ment resulted in a “win” for both a
lumber customer and UP. Pooling
the customer’s centerbeam flat cars
UNION PACIFIC RAILROAD ❘ 16
2002 REVIEW
■ Despite a decline in industrial pro-
duction of 1% and the impact from a
key steel customer’s bankruptcy,
carloads were up 1% in 2002. Average
revenue per car was up 3% resulting
in a 3% increase in total revenue.
■ Lumber revenues increased 12% over
2001, driven by a strong housing
market, aggressive sales penetration
efforts, and increased production
from the PNW and Canada.
■ Improved service levels, particularly
due to the continued success of the
5-7-9 strategy which focuses on
reliable service along the West Coast,
facilitated penetration efforts to
convert truck share in lumber,
paper and other key segments.
■ Construction products’ revenues
with UP’s existing fleet significantly
improved the utilization of these
cars, driving increased efficiencies
for both companies.
KEY MARKET FACTORS
■ Industrial Products covers a broad
range of commodities – from bulk
products like stone, cement, miner-
als, waste and scrap to higher-value
shipments like lumber, paper and
consumer goods – with growth
linked to U.S. industrial production.
I N D U S T R I A L P R O D U C T S
2002 CARLOADS
■ Minerals (40%)
■ Metals & Ores (16%)
■ Paper/Paper Products (16%)
■ Lumber/Building Materials (15%)
■ Consumer/Government (8%)
■ Waste (5%)
8%
40%
Arrow colors correspond to pie chart colors. 16%
16%
15%
5%
Domestic (87%)
International (4%)
Mexico (9%)

Commodity Revenue (millions of dollars)
2002 2001 2000
1 2 3 4 1 2 3 4 1 2 3 4
Quarterly 474 533 535 493 472 523 513 462 492 525 502 466
Cumulative 474 1,007 1,542 2,035 472 995 1,508 1,970 492 1,017 1,519 1,985
Revenue Ton-Miles (millions)
2002 2001 2000
1 2 3 4 1 2 3 4 1 2 3 4
Quarterly 18,250 20,141 20,116 18,894 18,417 20,340 19,899 17,849 20,310 20,723 19,401 18,322
Cumulative 18,250 38,391 58,507 77,401 18,417 38,757 58,656 76,505 20,310 41,033 60,434 78,756
Revenue Carloads (thousands)
2002 2001 2000
1 2 3 4 1 2 3 4 1 2 3 4
Quarterly 323 371 378 341 336 374 368 327 355 376 363 337
Cumulative 323 694 1,072 1,413 336 710 1,078 1,405 355 731 1,094 1,431
Average Commodity Revenue Per Car (dollars)
2002 2001 2000
1 2 3 4 1 2 3 4 1 2 3 4
Quarterly 1,469 1,435 1,415 1,447 1,405 1,396 1,399 1,410 1,387 1,398 1,383 1,382
Cumulative 1,469 1,451 1,438 1,440 1,405 1,400 1,400 1,402 1,387 1,392 1,389 1,387
INDUSTRIAL PRODUCTS ❘ 17
For most commodities, trucks pro-
vide a competitive transportation
alternative. Market share growth
hinges on providing consistent,
reliable service.
■ Bulk commodities like rock often
move in unit train service from
origin to a transload facility in major
metropolitan areas. Demand is
driven by construction activity and
peaks during the warmer months.
■ Other commodities move in mani-
fest trains and rely on UP’s extensive
network of rail terminals to move
between thousands of shippers and
customers across North America.
Demand is generally driven by
macro-economic conditions with
seasonal peaks.
2003 OUTLOOK
■ Population growth in key markets
served by the UP system should
continue to grow demand for
lumber and steel.
■ Continued strength in highway con-
struction projects in the Southwest
and mid-South should create growth
opportunities in the stone, sand and
gravel business.
■ Government shipments are expected
to increase significantly as a result of
the war in Iraq.
■ The uncertain economic outlook
could be a significant barrier to mar-
ket growth in 2003. The lumber mar-
ket could be impacted by a slowdown
in housing starts, which are forecast
to be down from 2002 levels.
Revenue growth will depend on pen-
etrating new markets through con-
tinued service improvements, com-
bined with the implementation of
pricing plans.
■ Leveraging our strategy to penetrate
imported steel, lumber and
non-ferrous metals markets
should continue to pay off in 2003
with double digit growth expected.
■ In partnership with TFM, UP’s
recently launched MexDirect service
is aimed squarely at capturing the
premium-priced truck market on
steel, lumber and wood products
movements to and from Mexico.
KEY MARKET FACTORS continued
LUMBER GROWTH
220
205
19099 00 01 02
1.75
1.62
1.5
Lumber Carloads(thousands)
Housing Starts(millions)
Year

UNION PACIFIC RAILROAD ❘ 18
2002 REVIEW
■ Despite the challenging economic
climate in 2002, intermodal car-
loads increased by 4% and average
revenue per car increased slightly
resulting in revenue growth
of 5% versus 2001.
■ The international market segment
continued its solid revenue growth
driven by strong demand for imports
and market share gains in some
major intermodal lanes. These gains
were partially offset by the significant
disruption caused by the labor dis-
pute at the West Coast ports during
the fourth quarter.
■ Blue Streak, UP’s premium service
Intermodal product, continued to
win business from long haul trucks.
By offering truck-like service and
reliability, as well as equipment guar-
antees, UP handled more than 5,000
new shipments during 2002.
In addition to Los Angeles to Atlanta,
service was expanded in 2002 to
include Los Angeles to Dallas and
Memphis, as well as Northern
California to Chicago and beyond
to New York and New Jersey.
■ Domestic revenue grew by 3%
despite soft demand from a sluggish
U.S. economy. In addition, UP’s
strategic decision to voluntarily
convert low-margin trailer business
to higher-margin container business
captured additional market share
from motor carriers.
■ UP’s Yield Strategy not only drove
top line growth in 2002, but also
focused on operational efficiency
as average train length increased
5%, average lifts per container
declined 4% and the percent of
containers double stacked improved
3 percentage points.
I N T E R M O D A L
2002 CARLOADS
■ International (58%)
Domestic:
■ Container & Trailer (37%)
■ Premium (5%)
Arrow represents key intermodal lanes.
5%
58%
37%

Commodity Revenue (millions of dollars)
2002 2001 2000
1 2 3 4 1 2 3 4 1 2 3 4
Quarterly 455 515 542 483 450 463 499 493 441 471 506 491
Cumulative 455 970 1,512 1,995 450 913 1,412 1,905 441 912 1,418 1,909
Revenue Ton-Miles (millions)
2002 2001 2000
1 2 3 4 1 2 3 4 1 2 3 4
Quarterly 16,992 18,887 18,731 16,712 16,547 16,995 17,666 17,458 17,029 17,832 18,370 17,818
Cumulative 16,992 35,879 54,610 71,322 16,547 33,542 51,208 68,666 17,029 34,861 53,231 71,049
Revenue Carloads (thousands)
2002 2001 2000
1 2 3 4 1 2 3 4 1 2 3 4
Quarterly 681 771 801 698 683 688 741 720 687 727 767 735
Cumulative 681 1,452 2,253 2,951 683 1,371 2,112 2,832 687 1,414 2,181 2,916
Average Commodity Revenue Per Car (dollars)
2002 2001 2000
1 2 3 4 1 2 3 4 1 2 3 4
Quarterly 668 667 677 692 659 671 674 686 642 647 661 667
Cumulative 668 668 671 676 659 665 668 673 642 645 650 655
INTERMODAL ❘ 19
KEY MARKET FACTORS
■ International: Consists of interna-
tional container traffic handled for
steamship customers.
■ Domestic: Two key domestic
market segments:
■ Domestic container and trailer:
Includes domestic container traffic
handled by Intermodal Marketing
Companies (IMC) and truckload
carriers. The EMP product line
continues to grow in this market
segment due to our success in
converting trailer business to
EMP containers.
■ Premium: Primarily less-than-
truckload and package carriers with
time-sensitive business needs. Service
performance and reliability drive
premium business growth.
2003 OUTLOOK
■ Continued Transpacific market
growth is anticipated for our
International segment. This growth
should offset the 2002 loss of a
major contract, contingent upon
economic improvement.
■ Expansion of the domestic container
fleet and continued penetration
of the truck market with Blue Streak
products should generate both
volume and price improvement.
■ Premium, IMC and truckload
domestic market segments offer
opportunities for growth, contingent
upon U.S. economic conditions.
■ Continued focus on operational
efficiency and asset utilization should
drive margin improvement.
■ The final phase of the Rochelle,
Illinois intermodal facility, to be
completed in the third quarter, will
provide needed intermodal terminal
MAJOR GROWTH LANES
capacity in the Chicago market and
improve the efficiency of UP’s
service in the growing rail-truck
freight market.
Market Size(billions)
Cost AdvantageVersus Truck
$0 $1.5 0% 50%
Chicago to Los Angeles
Los Angeles to Memphis
Chicago to Portland
Chicago to Mexico
Los Angeles to New Orleans
Oakland to Chicago

UNION PACIFIC RAILROAD ❘ 20
2002 REVIEW
■ Growth in Mexico’s agricultural
products, chemicals and industrial
products business groups helped
to offset the impact that plant
closings and production declines
had in the automotive group.
Overall Mexico revenues for the
year were up 1% versus 2001,
and excluding automotive were
up 7%.
■ Union Pacific became the first U.S.
railroad to be certified under
Customs-Trade Partnership Against
Terrorism (C-TPAT). C-TPAT is a
cooperative endeavor between the
trade community and the U.S.
Customs Service to develop, enhance
and maintain effective security
processes throughout the global
supply chain.
■ Union Pacific’s integrated marketing
and sales efforts with Mexico have
been successful as approximately
39,000 trucks annually have been
converted to new rail business.
■ During 2002, four new train
products began serving the Mexico
marketplace. New trains include
the Detroit premium automotive
train, Memphis to Laredo/Mexico
intermodal train, Salem to Vanegas
automotive run-through train and
the Laredo to West Coast premium-
manifest train.
M E X I C O
2002 CARLOADS
■ Automotive (42%)
■ Intermodal (20%)
■ Industrial Products (16%)
■ Agricultural Products (15%)
■ Chemicals (5%)
■ Energy (2%)
42%
Arrow colors correspond to pie chart colors.
16%
5%
20%
15%
2%
NORTH AMERICANRAIL LINK
UNIONPACIFIC

MEXICO ❘ 21
■ Also, in partnership with TFM, UP
introduced a product called
MexDirect. The MexDirect service
offering includes through rates on
steel and various forest products,
a single point of contact, a single
bill, easy to understand information
on how to do business in Mexico
and multiple warehouse and
transload options.
■ Agricultural Products efforts with
Mexico grain receivers has increased
the number of grain shuttle ship-
ments from only two percent in 2000
up to 29 percent in 2002. Grain shut-
tle trains are an efficient method to
deliver grain because trains load and
unload in a short period of time
increasing throughput and delivery.
■ Continued focus on service and
operational efficiency helped drive
the Mexico customer satisfaction
index to a record 87%.
KEY MARKET FACTORS
■ Union Pacific serves all six major
gateways to Mexico, connecting to
the two largest Mexican railways.
Union Pacific has the most efficient
route between Mexico and the
Chicago connections to Canada and
the eastern railroads.
■ The Mexican rail network comprises
five railroads, each providing effi-
cient transportation service to com-
pete for the northbound and south-
bound business opportunities creat-
ed by the North American Free Trade
Agreement (NAFTA). The Mexican
railroads continue to make substan-
tial investments in track structure,
equipment and facilities to improve
service, equipment utilization, safety
and damage prevention.
■ The Mexico land transportation
market is estimated to be over $6 bil-
lion per year and consists of a broad
range of commodities from raw
materials to finished goods. Trucks
are the dominant transportation
mode with a 63% share.
2003 OUTLOOK
■ The rail market is well positioned for
growth as the Mexican economy
expands and rail service within the
country continues to improve.
Continued foreign investment in
manufacturing and further privatiza-
tion in the petrochemical and utility
industries provide opportunities.
■ Growth in 2003 will be facilitated by
capturing additional market share
currently held by trucks and by
focusing on the ease of doing busi-
ness. The business development
group, established in 2001, will target
auto parts, industrial products and
intermodal opportunities.
■ FXE, in which UP has a 26% owner-
ship interest, will complete imple-
mentation of the Interline Settlement
System (ISS) in 2003. ISS allows ship-
pers to use through rates for ship-
ments to/from Mexico similar to
domestic shipments, while the rail-
road collects from the shipper/receiv-
er and electronically pays the other
railroads in the route.
■ UP, TFM and FXE continue to work
with receivers of grain products
to improve their facilities to enable
them to receive trainloads of
agricultural products – so they can
benefit from improved service and
economies of rail.
■ UP and its southern alliance partners
will continue to leverage intermodal
and industrial products service
offerings, focused on capturing addi-
tional share from trucks. In addition,
conversion of auto parts movements
from trucks should provide growth
in 2003.
FXETFMFSEShortlinesFXE Trackage Rights on TFMTFM Trackage Rights on FXE
56%13%
10%5%
16%
TRAFFIC BY GATEWAY
Colors in pie chart correspond to color ofgateway locations
CalexicoNogales El Paso
Eagle Pass
Laredo
Brownsville
1999 2000 20022001
311
362357370
MEXICO TRAFFIC (carloads in thousands)
278 310319329
589
699 676 672
Southbound
Northbound
2002 REVIEWcontinued

UNION PACIFIC RAILROAD ❘ 22
Union Pacific – Rail and Other Operations
for the year ended December 31 2002 2001
1 2 3 4 Total 1 2 3 4 Total
Financial and Revenue Statistics
Operating Revenues (millions of dollars) $2,662 $2,822 $2,850 $2,825 $11,159 $2,663 $2,708 $2,734 $2,725 $10,830
Operating Expenses (millions of dollars) $2,173 $2,239 $2,231 $2,263 $8,906 $2,233 $2,230 $2,178 $2,171 $8,812
Operating Margin (%) 18.4 20.7 21.7 19.9 20.2 16.2 17.7 20.3 20.3 18.6
Operating Ratio (%) 81.6 79.3 78.3 80.1 79.8 83.8 82.3 79.7 79.7 81.4
Salaries and Benefits (millions of dollars) $913 $913 $919 $949 $3,694 $914 $888 $886 $898 $3,586
Salaries and Benefits/Operating Revenues (%) 34.3 32.4 32.2 33.6 33.1 34.3 32.8 32.4 33.0 33.1
Commodity Revenue/Employee $148.1 $56.5 $56.9 $58.1 $225.4 $52.3 $52.4 $53.8 $55.2 $213.8(thousands of dollars)
Fuel Expense (millions of dollars) $197 $241 $249 $267 $954 $297 $291 $272 $266 $1,126
Average Fuel Price Per Gallon (cents) 61 72 75 81 73 92 92 86 81 88
Commodity Revenue (millions of dollars) $2,548 $2,699 $2,725 $2,691 $10,663 $2,551 $2,595 $2,627 $2,618 $10,391
Average Commodity Revenue Per Car (dollars) $1,170 $1,160 $1,156 $1,186 $1,168 $1,171 $1,173 $1,155 $1,163 $1,165
Average Commodity Revenue/ 2.01 2.09 2.05 2.05 2.05 2.06 2.09 2.06 2.04 2.06Revenue Ton-Mile (cents)
Passenger Revenue (millions of dollars) $28 $33 $28 $27 $116 $28 $28 $27 $28 $111
Operating Statistics
Revenue Carloads (thousands) 2,178 2,326 2,359 2,268 9,131 2,179 2,211 2,274 2,252 8,916
Revenue Ton-Miles (billions) 127 129 132 131 519 124 124 128 128 504
Gross Ton-Miles (billions) 240 248 253 253 994 232 235 243 247 957
Fuel Consumed (millions of gallons) 321 334 331 329 1,315 322 318 319 328 1,287
Average Employees (thousands) 47.2 47.8 47.9 46.3 47.3 48.8 49.5 48.8 47.4 48.6
Gross Ton-Miles Per Employee (millions) 5.08 5.19 5.28 5.46 21.01 4.75 4.75 4.98 5.21 19.69
Surface Transportation Board-Basis Operating Expense (millions of dollars)(a)
Transportation Expense $940 $997 $1,008 $1,013 $3,958 $1,041 $1,029 $1,004 $1,016 $4,090
Engineering Expense 383 381 376 386 1,526 369 360 354 396 1,479
Mechanical Expense 600 593 594 666 2,453 600 605 595 580 2,380
General and Administrative Expense 232 262 244 170 908 167 186 179 143 675
(a) UPRR only
Excludes results from Overnite Corporation
Refer to the Union Pacific Corporation 2002 Annual Report for additional information
F I N A N C I A L A N D O P E R AT I N G S TAT I S T I C S

UNION PACIFIC RAILROAD ❘ 23
Union Pacific – Rail and Other Operations (millions of dollars, unaudited)
for the year ended December 31, 2002 1 2 3 4 Total
Operating Revenues Transportation $2,662 $2,822 $2,850 $2,825 $11,159
Operating Expenses Salaries and Benefits 913 913 919 949 3,694
Equipment and Other Rents 315 308 316 301 1,240
Depreciation 284 286 288 289 1,147
Fuel and Utilities 225 268 277 295 1,065
Materials and Supplies 121 125 119 111 476
Other Costs 315 339 312 318 1,284
Total Operating Expenses 2,173 2,239 2,231 2,263 8,906
Operating Income $489 $583 $619 $562 $2,253
for the year ended December 31, 2001 1 2 3 4 Total
Operating Revenues Transportation $2,663 $2,708 $2,734 $2,725 $10,830
Operating Expenses Salaries and Benefits 914 888 886 898 3,586
Equipment and Other Rents 307 307 307 293 1,214
Depreciation 280 281 280 285 1,126
Fuel and Utilities 334 321 301 293 1,249
Materials and Supplies 126 133 121 107 487
Other Costs 272 300 283 295 1,150
Total Operating Expenses 2,233 2,230 2,178 2,171 8,812
Operating Income $430 $478 $556 $554 $2,018
Excludes results from Overnite Corporation
Refer to the Union Pacific Corporation 2002 Annual Report for additional information
F I N A N C I A L A N D O P E R AT I N G S TAT I S T I C S

UNION PACIFIC RAILROAD ❘ 24
Union Pacific Railroad Company (millions of dollars, unaudited)
for the year ended December 31 2002 2001 2000
Assets
Current Assets Cash and Temporary Investments $110 $87 $88
Accounts Receivable 529 440 393
Inventories 277 250 347
Other Current Assets 470 476 563
Total Current Assets 1,386 1,253 1,391
Investments 698 785 728
Properties Cost 36,821 35,440 34,613
Accumulated Depreciation (7,841) (7,177) (6,881)
Net Properties 28,980 28,263 27,732
Other Other Assets 250 262 142
Total Assets $31,314 $30,563 $29,993
Liabilities and Shareholders’ Equity
Current Liabilities Accounts Payable $416 $498 $558
Accrued Wages and Vacation 362 351 388
Accrued Casualty Costs 403 404 378
Income and Other Taxes Payable 226 284 220
Debt Due Within One Year 275 194 207
Interest Payable 71 75 82
Other Current Liabilities 537 550 712
Total Current Liabilities 2,290 2,356 2,545
Other Liabilities and Intercompany Borrowings-Net 4,464 5,003 5,082
Shareholders' Equity Debt Due After One Year 1,984 2,166 2,397
Deferred Income Taxes 8,823 8,430 8,117
Accrued Casualty Costs 658 673 778
Retiree Benefits Obligation 888 659 632
Other Long-Term Liabilities 333 429 440
Redeemable Preference Shares 18 21 23
Common Shareholders' Equity 11,856 10,826 9,979
Total Liabilities and Shareholders' Equity $31,314 $30,563 $29,993
Refer to the Union Pacific Corporation 2002 Annual Report for additional information
F I N A N C I A L A N D O P E R AT I N G S TAT I S T I C S

UNION PACIFIC RAILROAD ❘ 25
Union Pacific Railroad Company (millions of dollars, unaudited)
for the year ended December 31 2002 2001 2000
Operating Activities Net Income $1,374 $1,058 $926
Depreciation 1,139 1,120 1,089
Deferred Income Taxes 529 428 456
Other-Net (416) (432) (427)
Change in Current Assets and Liabilities (307) (150) 35
Cash Provided by Operating Activities 2,319 2,024 2,079
Investing Activities Capital Investments (1,817) (1,687) (1,735)
Proceeds from Asset Sales and Other Activities 357 184 158
Cash Used in Investing Activities (1,460) (1,503) (1,577)
Financing Activities Dividends Paid (205) (200) (200)
Debt Repaid (219) (368) (224)
Financings - Net (412) 46 (73)
Cash Used in Financing Activities (836) (522) (497)
Net Change In Cash and Temporary Investments 23 (1) 5
Cash and Temporary Investments at Beginning of Year 87 88 83
Cash & Temporary Investments at End of Year $110 $87 $88
Changes in Current Accounts Receivable $(89) $(47) $25
Assets and Liabilities Inventories (27) 97 (18)
Other Current Assets (44) (24) (43)
Accounts, Wages and Vacation Payable (71) (97) 73
Other Current Liabilities (76) (79) (2)
Net Change in Current Assets and Liabilities $(307) $(150) $35
Refer to the Union Pacific Corporation 2002 Annual Report for additional information
F I N A N C I A L A N D O P E R AT I N G S TAT I S T I C S

UNION PACIFIC RAILROAD ❘ 26
Union Pacific Railroad Company
for the year ended December 31 2002 2001 2000 1999 1998
Capital Expenditures (millions of dollars-includes long-term operating leases)
Track $1,200 $1,125 $1,066 $961 $989
Locomotives 187 176 250 468 655
Freight Cars 41 27 172 85 200
Facilities and Other 418 363 363 425 549
Total $1,846 $1,691 $1,851 $1,939 $2,393
Equipment Owned or Leased at Year-End
Locomotives 7,094 6,886 7,007 6,969 7,083
Freight Cars: (a)
Covered Hoppers 30,602 33,901 37,607 39,212 40,097
Box Cars 15,040 15,561 18,342 20,864 23,263
Open-Top Hoppers 15,891 17,202 18,683 19,828 20,324
Gondolas 14,793 15,431 17,480 18,099 17,828
Other 14,551 14,681 16,557 16,726 18,264
Total Freight Cars 90,877 96,776 108,669 114,729 119,776
Work Equipment 6,950 6,950 6,616 9,927 9,218
Average Age of Equipment (years)
Locomotives 14.4 14.9 14.9 15.4 14.4
Freight Cars 21.9 22.5 20.9 19.3 20.1
Track Miles at Year-End
Main Line 27,504 27,553 26,914 26,963 27,197
Branch Line 5,637 6,033 6,121 6,378 6,509
Yards, Sidings and Other Main Line 21,760 21,669 21,564 21,660 21,597
Total 54,901 55,255 54,599 55,001 55,303
Track Miles of Continuous Welded Rail at Year-End 26,080 25,488 24,855 24,771 23,647
Track Miles Under Centralized Traffic-Control at Year-End 17,836 17,538 17,163 16,199 15,944
Track Miles of Rail Installed and Replaced
New 783 857 943 950 858
Used 330 388 242 444 341
Track Miles Ballasted 7,699 8,975 6,966 4,579 3,259
Ties Installed and Replaced (thousands) 4,531 3,648 3,332 3,293 2,691
(a) Includes owned and leased freight cars with Union Pacific System marks
Refer to the Union Pacific Corporation 2002 Annual Report for additional information
F I N A N C I A L A N D O P E R AT I N G S TAT I S T I C S

Overnite Corporation is a leading provider of less-than-truck-load (LTL) transportation services, offering a full spectrum ofregional, inter-regional and long-haul services nationwide.
OVERNITE CORPORATION ❘ 27
31, 2002, Overnite operated 203 service
centers located throughout the United
States and employed nearly 14,000
predominantly non-union employees.
Overnite also created a new division
called OMC Logistics in 2002 to provide
third-party logistics services.
FINANCIAL REVIEW
Operating revenues grew $189 million
or 17% in 2002 to $1.33 billion. This rev-
enue growth was attributed to the acqui-
sition of Motor Cargo in December 2001,
additional freight volumes obtained after
the bankruptcy of Consolidated
Freightways, a general rate increase, con-
tract renegotiations, as well as other yield
initiatives. Operating expenses increased
by 16% or $172 million. Net income grew
93% to $89 million. However, net income
included a tax benefit of $34 million
related to the resolution of certain tax
matters that permitted Union Pacific to
treat a portion of its 1986 Overnite acqui-
sition costs as tax deductible. Excluding
the tax benefit, Overnite’s net income
would have been $55 million in 2002 ver-
sus $46 million in 2001. Overnite’s oper-
ating ratio improved to 94.7% in 2002
versus 95.3% in 2001. Salaries, wages, and
S U M M A R Y
Overnite Corporation
OVERVIEW
Overnite provides direct service to
over 45,000 cities in the United States,
Canada, Mexico, Guam, the U.S. Virgin
Islands and Puerto Rico. During 2002,
Overnite provided services to over 61,000
customers from various industries,
including retail, chemical, automotive,
electronics and furniture markets.
Overnite provides services under two
brand names: Overnite Transportation
and Motor Cargo. Motor Cargo was
acquired in December 2001, and is a lead-
ing regional LTL transportation provider,
primarily serving the western United
States, including Alaska and Hawaii, as
well as select markets in Canada. Overnite
leverages these two brand names to pro-
vide customers with a comprehensive
selection of high quality service products.
In addition to the core LTL services, a
number of value-added services are also
offered to customers, including expedited
and guaranteed delivery, cross-border
delivery, truckload, assembly and distri-
bution and warehousing. As of December
Capital Expenditures (millions) $66
Employees 13,600
Fleet:
Tractors 6,100
Trailers 21,600
Shipments (thousands) 9,482
Tonnage (thousands) 4,766
Revenue (per hundredweight) $13.40
Total Revenue (millions) $1,332
Operating Ratio (%) 94.7%
O V E R N I T E C O R P O R AT I O N

OVERNITE OVERVIEW ❘ 28
benefits expense increased by 17% prima-
rily due to the higher volumes (from the
Motor Cargo acquisition and incremental
Consolidated Freightways business),
annual wage increase and higher medical
and pension costs. Fuel and utilities
expense increased 1% or $1 million.
Equipment and other rent expense
increased 35% or $33 million due to costs
associated with the higher volumes.
Materials and supplies, as well as other
costs, increased by 8% and 4%, respective-
ly, primarily because of the higher volumes
in 2002.
DELIVERING VALUE INTRANSPORTATION
In 2002, Overnite continued its focus
on improving service by enhancing tran-
sit times on over 4,800 lanes, improving
its regional and inter-regional product,
and adding new features to its Web site.
In addition, Overnite created a new third
party logistics division called OMC
Logistics that provides customers with a
variety of supply chain management
services. These enhancements were
achieved despite a difficult economic
environment and while maintaining its
97 – 98% on-time performance, which is
one of the best in the industry. Overnite’s
services include:
Advantage Overnite is Overnite’s standard dependable LTL
service which provides nationwide cover-
age to more than 45,000 points, including
100 percent direct full-state coverage in
all 50 states.
Advantage Expeditedis for customers needing expedited
service for emergency, time-critical
shipments to any point in the world.
Overnite’s team of freight specialists
coordinate and track expedited shipments
from origin to destination to ensure the
shipment arrives on time.
Advantage Guaranteed is for time-sensitive shipments. Overnite
will guarantee delivery based on the
Company’s published transit times,
which are competitive with air freight
transit times in many lanes. It’s on time,
or it’s free.
Special Services Divisionoffers premium dedicated truckload serv-
ices to selected markets where on-time
reliability is a critical requirement. This
service is targeted to customers that
employ “just-in-time” manufacturing and
inventory control. This division consis-
tently provides on time service of 99%.
Overnite Mission:To be the most successful company in the industry, with thebest equipment and facilities. With this success, over time,
comes the best jobs in the industry in terms of job security,wages, benefits and job satisfaction.
96%
97% 97%97%
1999 2000 20022001
ON-TIME SERVICE PERFORMANCE
1Q 4Q3Q2Q
280305
290
332
292
349
281
346
REVENUE (millions of dollars)
2002
2001
OVERNITE OVERVIEW ❘ 29
Assembly & Distribution is a special logistical function for shippers
requiring consolidation and distribution
services. These services typically reduce
cycle times, lower transportation costs for
the customer and often enable the
customer to avoid costly investments in
warehouse facilities.
Cross-Border Services is a service offered to customers transport-
ing freight across the Canadian and
Mexican borders as well as into Puerto
Rico, Guam and the Virgin Islands.
Overnite provides single carrier responsi-
bility, eliminating the need to deal with a
second carrier in the destination country.
Overnite also handles customs documen-
tation and provides an advance
customs clearance process that generally
allows shipments to be cleared immediate-
ly upon arrival at the border.
Government Services is a service offered to government agencies
as well as to vendors who ship products to
the government. All government ship-
ments are coordinated by a special team
of employees who ensure the unique
shipping needs of government agencies
are consistently met.
Trade Show Services focuses on the time-sensitive market for
exhibit transportation. Customers who
routinely display and market their goods
at trade shows need a reliable and
dependable carrier who will ensure that
displays arrive on time for trade shows
and are stored in a safe environment
between shows.
OMC Logistic Solutions provides customers with a variety of sup-
ply chain management services, including
the management of the traffic department
for customers who desire to outsource
this function. In addition, services include
dedicated fleet, assembly and distribution,
truckload brokering, warehousing, freight
bill audit and payment, as well as trans-
portation management software that
illuminates the supply chain and enables
customers to more effectively and
efficiently manage their supply chain.
LABOR RELATIONS
On October 24, 2002, the Teamsters
ended a three-year nationwide strike of
Overnite Transportation. The Teamsters
ended their strike without having
obtained a contract or any concessions
from Overnite Transportation. At the
height of the Teamsters’ campaign to
unionize Overnite Transportation
employees, the Teamsters gained certifi-
cation at 26 of the 170 Overnite
Transportation service centers. Since July
2002, employees at 20 of these service
centers have voted to decertify Teamster
representation, and the Teamsters have
withdrawn representation for one other
service center. As a result of the decertifi-
cation elections and the successful resolu-
tion of the three-year old strike, the
Teamsters’ campaign to organize
Overnite Transportation employees has
become almost entirely dormant.
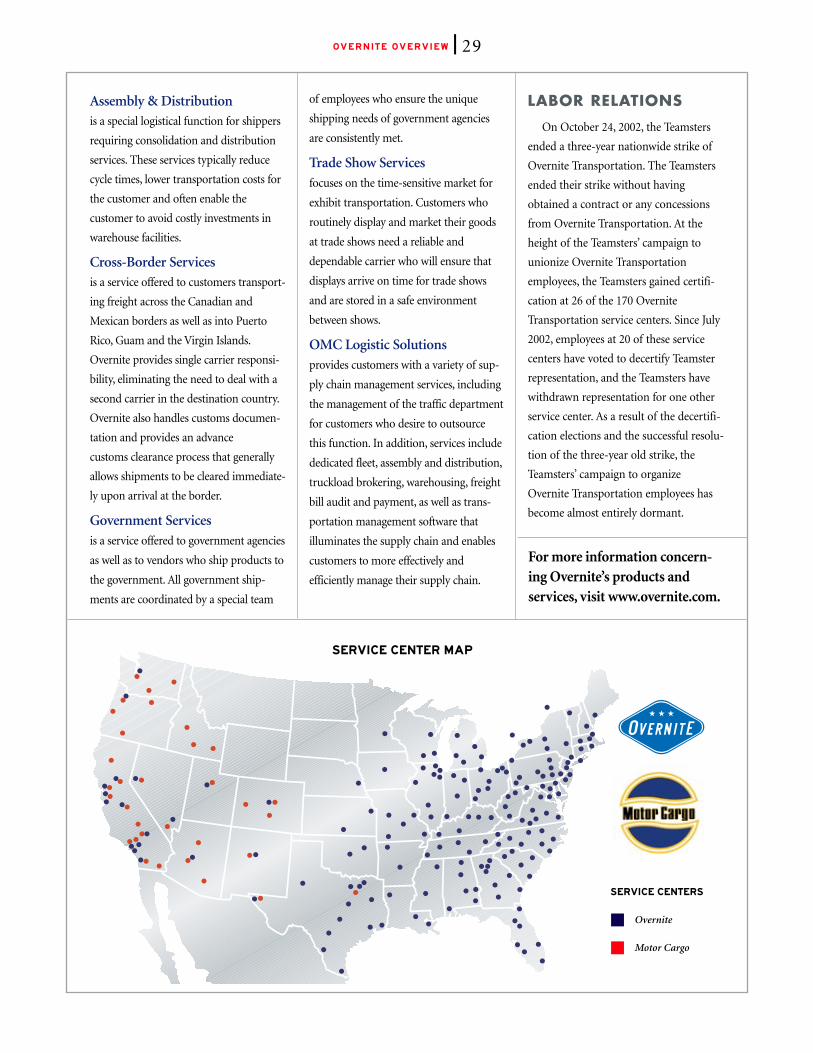
SERVICE CENTERS
■ Overnite
■ Motor Cargo
For more information concern-ing Overnite’s products and services, visit www.overnite.com.
SERVICE CENTER MAP

OVERNITE CORPORATION ❘ 30
Overnite Corporation (millions of dollars, unaudited)
for the year ended December 31 2002 2001(a)
1 2 3 4 Total 1 2 3 4 Total
Financial and Revenue Statistics
Operating Revenues (millions of dollars) $305 $332 $349 $346 $1,332 $280 $290 $292 $281 $1,143
Operating Expenses (millions of dollars) $295 $313 $323 $330 $1,261 $271 $274 $274 $270 $1,089
Operating Ratio (%) 96.6 94.5 92.7 95.2 94.7 96.9 94.6 93.7 95.8 95.3
Average Fuel Price Per Gallon (cents) 64 72 77 88 76 90 88 83 66 82
Total Fuel Consumed (thousands of gallons) 15,418 15,767 15,954 16,040 63,179 14,854 14,320 14,180 14,393 57,747
Average Employee Count 13,158 13,670 13,675 14,093 13,649 11,427 11,548 11,689 12,230 11,720
Millions of Pounds Hauled
Less-Than-Truckload 2,022 2,222 2,273 2,176 8,693 1,840 1,918 1,898 1,858 7,514
Truckload 194 215 220 210 839 124 118 117 133 492
Total 2,216 2,437 2,493 2,386 9,532 1,964 2,036 2,015 1,991 8,006
Average Revenue Per Hundredweight
Less-Than-Truckload $13.83 $13.71 $14.13 $14.58 $14.07 $14.04 $14.00 $14.37 $14.07 $14.12
Truckload 6.66 6.24 6.46 6.54 6.47 7.20 8.01 7.89 6.97 7.50
Total 13.20 13.05 13.45 13.87 13.40 13.61 13.66 13.99 13.59 13.71
Shipments (thousands)
Less-Than-Truckload 2,240 2,463 2,425 2,289 9,417 1,874 2,009 2,029 2,036 7,948
Truckload 15 17 17 16 65 8 8 8 9 33
Total 2,255 2,480 2,442 2,305 9,482 1,882 2,017 2,037 2,045 7,981
(a) Includes the December 2001 results for Motor Cargo Industries, Inc., acquired November 30, 2001
Refer to the Union Pacific Corporation 2002 Annual Report for additional information
F I N A N C I A L A N D O P E R AT I N G S TAT I S T I C S

OVERNITE CORPORATION ❘ 31
Overnite Corporation (millions of dollars, unaudited)
for the year ended December 31, 2002 1 2 3 4 Total
Operating Revenues Transportation $305 $332 $349 $346 $1,332
Operating Expenses Salaries and Benefits 192 205 206 204 807
Equipment and Other Rents 26 31 33 36 126
Depreciation 15 14 15 15 59
Fuel and Utilities 15 16 18 19 68
Materials and Supplies 12 13 14 15 54
Other Costs 35 34 37 41 147
Total Operating Expenses 295 313 323 330 1,261
Operating Income $10 $19 $26 $16 $71
Net Income $9 $14 $52 $14 $89
for the year ended December 31, 2001(a) 1 2 3 4 Total
Operating Revenues Transportation $280 $290 $292 $281 $1,143
Operating Expenses Salaries and Benefits 171 175 173 171 690
Equipment and Other Rents 22 24 25 22 93
Depreciation 12 12 12 12 48
Fuel and Utilities 18 17 17 15 67
Materials and Supplies 13 12 12 13 50
Other Costs 35 34 35 37 141
Total Operating Expenses 271 274 274 270 1,089
Operating Income $9 $16 $18 $11 $54
Net Income $8 $13 $14 $11 $46
(a) Includes the December 2001 results for Motor Cargo Industries, Inc., acquired November 30, 2001
Refer to the Union Pacific Corporation 2002 Annual Report for additional information
F I N A N C I A L A N D O P E R AT I N G S TAT I S T I C S

OVERNITE CORPORATION ❘ 32
Overnite Corporation (millions of dollars, unaudited)
for the year ended December 31 2002 2001(a) 2000
Assets
Current Assets $410 $445 $464
Net Properties 501 502 441
Other Assets 99 24 26
Total Assets $1,010 $971 $931
Liabilities and Shareholders' Equity
Current Liabilities $179 $160 $160
Debt Due After One Year - Third Parties - 1 -
Other Liabilities 200 168 159
Shareholders' Equity 631 642 612
Total Liabilities and Shareholders' Equity $1,010 $971 $931
Overnite Corporation (millions of dollars, unaudited)
for the year ended December 31 2002 2001(a) 2000
Cash Provided by Operating Activities 11 123 93
Cash Used In Investing Activities (58) (38) (30)
Cash Used In Financing Activities 40 (76) (63)
Net Change In Cash and Temporary Investments $(7) $9 $ -
(a) Includes the December 2001 results for Motor Cargo Industries, Inc., acquired November 30, 2001
Refer to the Union Pacific Corporation 2002 Annual Report for additional information
F I N A N C I A L A N D O P E R AT I N G S TAT I S T I C S

UNION PACIFIC ❘ 33
Certain statements in this report are,
or will be, forward-looking statements as
defined by the Securities Act of 1933 and
the Securities Exchange Act of 1934.
Forward-looking statements include,
without limitation, statements regarding:
expectations as to operational improve-
ments; expectations as to cost savings,
revenue growth and earnings; the time by
which certain objectives will be achieved;
estimates of costs relating to environmen-
tal remediation and restoration; proposed
new products and services; expectations
that claims, lawsuits, environmental costs,
commitments, contingent liabilities, labor
negotiations or agreements, or other
matters will not have a material adverse
effect on our consolidated financial
position, results of operations or liquidity;
and statements concerning projections,
predictions, expectations, estimates or
forecasts as to the Corporation’s and its
subsidiaries’ business, financial and
operational results, and future economic
performance, statements of management’s
goals and objectives and other similar
expressions concerning matters that are
not historical facts.
Forward-looking statements should
not be read as a guarantee of future
performance or results, and will not
necessarily be accurate indications of the
times at, or by which, such performance
or results will be achieved. Forward-look-
ing information is based on information
available at the time and/or manage-
ment’s good faith belief with respect to
future events, and is subject to risks and
uncertainties that could cause actual
performance or results to differ materially
from those expressed in the statements.
Important factors that could affect the
Corporation’s and its subsidiaries’ future
results and could cause those results or
other outcomes to differ materially from
those expressed or implied in the
forward-looking statements include, but
are not limited to: whether the
Corporation and its subsidiaries are fully
successful in implementing their financial
and operational initiatives; industry
competition, conditions, performance
and consolidation; legislative and regula-
tory developments, including possible
enactment of initiatives to re-regulate
the rail business; natural events such as
severe weather, fire, floods and earth-
quakes; the effects of adverse general
economic conditions, both within the
United States and globally; any adverse
economic or operational repercussions
from terrorist activities and any govern-
mental response thereto; war or risk of
war; changes in fuel prices; changes in
labor costs; labor stoppages; and the
outcome of claims and litigation, includ-
ing those related to environmental
contamination, personal injuries, and
occupational illnesses arising from
hearing loss, repetitive motion and
exposure to asbestos and diesel fumes.
Forward-looking statements speak
only as of the date the statements were
made. The Corporation assumes no
obligation to update forward-looking
information to reflect actual results,
changes in assumptions or changes in
other factors affecting forward-looking
information. If the Corporation does
update one or more forward-looking
statements, no inference should be
drawn that the Corporation will make
additional updates with respect thereto
or with respect to other forward-looking
statements.
C A U T I O N A R Y I N F O R M AT I O N
Contact for Portfolio Managersand Financial Analysts
Union Pacific’s analyst relations are
coordinated by the Corporate Treasurer
at the executive offices. Requests for
interviews, general information, offering
memoranda, bond circulars and other
publications should be directed to:
Investor Relations: (402) 271-4227
or (877) 547-7261