unintentional drowning mortality, by age and body of...
TRANSCRIPT
Unintentional drowning mortality, by age and bodyof water: an analysis of 60 countriesChing-Yih Lin,1,2 Yi-Fong Wang,2 Tsung-Hsueh Lu,3 Ichiro Kawach4
▸ Additional material ispublished online only. To viewplease visit the journal online(http://dx.doi.org/10.1136/injuryprev-2013-041110).1Department of InternalMedicine, Chi Mei MedicalCenter, Tainan, Taiwan2Department of Leisure,Recreation, and TourismManagement, Southern TaiwanUniversity of Science andTechnology, Tainan, Taiwan3NCKU Research Center forHealth Data, National ChengKung University, Tainan,Taiwan4Department of Social &Behavioral Sciences, HarvardSchool of Public Health,Harvard University, Boston,Massachusetts, USA
Correspondence toDr Tsung-Hsueh Lu,Department of Public Health,College of Medicine, NationalCheng Kung University, No. 1,Dah Hsueh Road, Tainan 701,Taiwan;[email protected]
Received 26 November 2013Revised 14 April 2014Accepted 26 May 2014
To cite: Lin C-Y, Wang Y-F,Lu T-H, et al. Inj PrevPublished Online First:[please include Day MonthYear] doi:10.1136/injuryprev-2013-041110
ABSTRACTBackground To examine unintentional drowningmortality by age and body of water across 60 countries,to provide a starting point for further in-depthinvestigations within individual countries.Methods The latest available three years of mortalitydata for each country were extracted from WHO HealthStatistics and Information Services (updated at 13November 2013). We calculated mortality rate ofunintentional drowning by age group for each country.For countries using International Classification of Disease10 (ICD-10) detailed 3 or 4 Character List, we furtherexamined the body of water involved.Results A huge variation in age-standardised mortalityrate (deaths per 100 000 population) was noted, from0.12 in Turkey to 9.19 in Guyana. Of the ten countrieswith the highest age-standardised mortality rate, six(Belarus, Lithuania, Latvia, Russia, Ukraine and Moldova)were in Eastern Europe and two (Kazakhstan andKyrgyzstan) were in Central Asia. Some countries ( Japan,Finland and Greece) had a relatively low rank inmortality rate among children aged 0–4 years, but had ahigh rank in mortality rate among older adults. On thecontrary, South Africa and Colombia had a relativelyhigh rank among children aged 0–4 years, but had arelatively low rank in mortality rate among older adults.With regard to body of water involved, the proportioninvolving a bathtub was extremely high in Japan (65%)followed by Canada (11%) and the USA (11%). Of the13 634 drowning deaths involving bathtubs in Japanbetween 2009 and 2011, 12 038 (88%) were olderadults aged 65 years or above. The percentage involvinga swimming pool was high in the USA (18%), Australia(13%), and New Zealand (7%). The proportion involvingnatural water was high in Finland (93%), Panama(87%), and Lithuania (85%).Conclusions After considering the completeness ofreporting and quality of classifying drowning deathsacross countries, we conclude that drowning is a high-priority public health problem in Eastern Europe, CentralAsia, Japan (older adults involving bathtubs), and theUSA (involving swimming pools).
INTRODUCTIONDespite the global decrease of age-standardisedunintentional drowning mortality rate from 7.5(deaths per 100 000 population) in 1990 to 5.1 in2010, there was still a total of 439 100 uninten-tional drowning deaths globally in 2010, accordingto the Global Burden of Disease Study 2010 (GBD2010).1 Of 439 100 estimated unintentionaldrowning deaths in 2010, one-third (32.1%) werechildren aged 0–14 years, and one-fifth (21.5%)were young adults aged 25–44 years. The drowningdeath rate differed by age group: 12.6 (deaths per
100 000 population) for children aged 1–4 years,3.0 for early adolescents aged 10–14 years, 5.0 forlate adolescents aged 15–19 years, 3.8 for adultsaged 44–49 years, and 7.5 for older adults aged70–75 years.1 For years of life lost, unintentionaldrowning ranked 21 among 179 causes of deathglobally; however, the rank was 12 in Eastern andCentral Asia and 54 in Western Europe.1 However,the GBD 2010 did not analyse drowning deaths bybody of water.1 The GBD found huge variations inunintentional drowning mortality by age andregion, which are mainly due to exposure to differ-ent bodies of water (eg, bathtub, swimming pool,pond, lake, stream, river, or beach), activities (eg,activities of daily living, recreation, or work-relatedactivities), and circumstances (eg, after drinkingalcohol, during a flood, or the occurrence of dis-eases, such as epilepsy).2
Brenner and Taneja suggest that delineation oflocation and circumstances surrounding the drown-ing event are key to identifying prevention strat-egies.3 While there have been manyepidemiological studies on locations and circum-stances surrounding drowning deaths, most of thesestudies were confined to a single country.Furthermore, most of these studies focused on chil-dren,4–18 which cannot help us understand theworldwide diversity of drowning mortality rates. Inregards to international comparisons, we foundonly two. One study examined drowning mortalityworldwide, but this study did not present the age-specific drowning mortality rate in each country.19
Another recent report revealed a detailed picture ofdrowning mortality rates among children in low-income and middle-income counties in Asia.20
However, no study yet has compared unintentionaldrowning mortality rates in middle and olderadults across countries. International comparisonsof injury mortality can help generate hypothesesand provide clues for injury prevention.21–24 Thus,we sought to examine unintentional drowning mor-tality by age and body of water across countries toprovide a starting point for further in-depth investi-gations of unintentional drowning mortality withinindividual countries.
METHODSData sourceMortality data for each country were extractedfrom the WHO Health Statistics and HealthInformation Services.25 As of 13 November 2013,153 countries had submitted mortality data toWHO. Because we are interested in relativelycurrent comparisons, we excluded countries forwhich the latest available data was before 2005.
Lin C-Y, et al. Inj Prev 2014;0:1–8. doi:10.1136/injuryprev-2013-041110 1
Original article IP Online First, published on June 18, 2014 as 10.1136/injuryprev-2013-041110
Copyright Article author (or their employer) 2014. Produced by BMJ Publishing Group Ltd under licence.
on 17 May 2018 by guest. P
rotected by copyright.http://injuryprevention.bm
j.com/
Inj Prev: first published as 10.1136/injuryprev-2013-041110 on 18 June 2014. D
ownloaded from
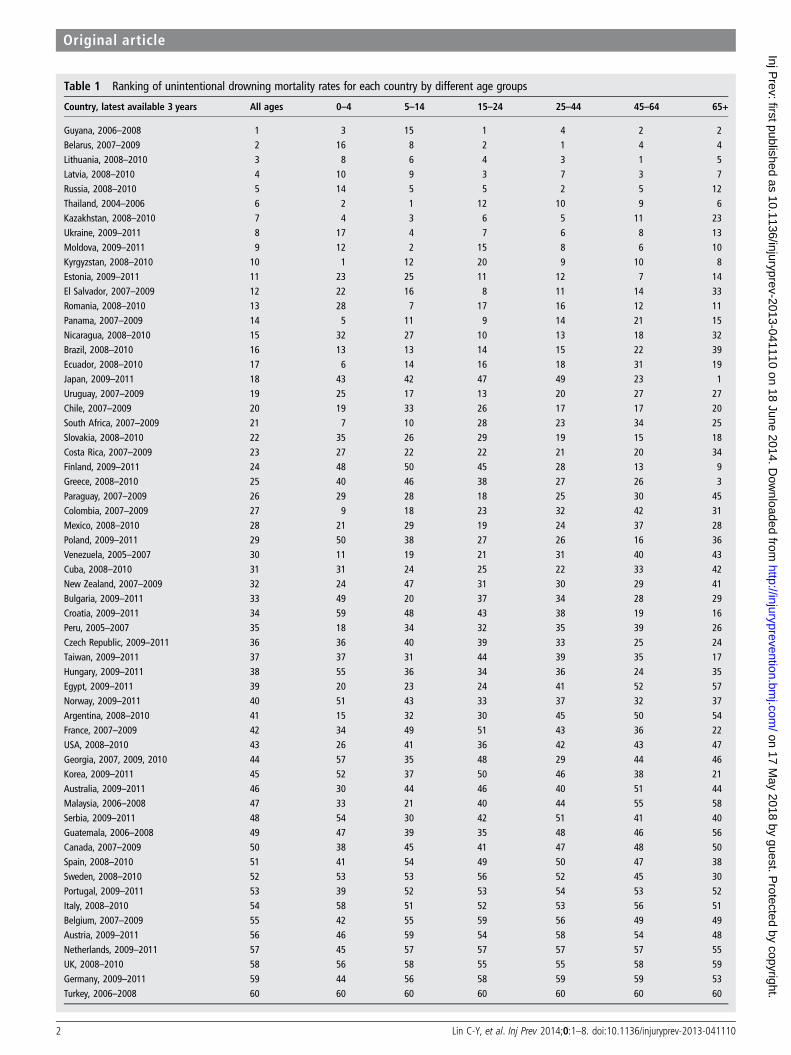
Table 1 Ranking of unintentional drowning mortality rates for each country by different age groups
Country, latest available 3 years All ages 0–4 5–14 15–24 25–44 45–64 65+
Guyana, 2006–2008 1 3 15 1 4 2 2Belarus, 2007–2009 2 16 8 2 1 4 4Lithuania, 2008–2010 3 8 6 4 3 1 5Latvia, 2008–2010 4 10 9 3 7 3 7Russia, 2008–2010 5 14 5 5 2 5 12Thailand, 2004–2006 6 2 1 12 10 9 6Kazakhstan, 2008–2010 7 4 3 6 5 11 23Ukraine, 2009–2011 8 17 4 7 6 8 13Moldova, 2009–2011 9 12 2 15 8 6 10Kyrgyzstan, 2008–2010 10 1 12 20 9 10 8Estonia, 2009–2011 11 23 25 11 12 7 14El Salvador, 2007–2009 12 22 16 8 11 14 33Romania, 2008–2010 13 28 7 17 16 12 11Panama, 2007–2009 14 5 11 9 14 21 15Nicaragua, 2008–2010 15 32 27 10 13 18 32Brazil, 2008–2010 16 13 13 14 15 22 39Ecuador, 2008–2010 17 6 14 16 18 31 19Japan, 2009–2011 18 43 42 47 49 23 1Uruguay, 2007–2009 19 25 17 13 20 27 27Chile, 2007–2009 20 19 33 26 17 17 20South Africa, 2007–2009 21 7 10 28 23 34 25Slovakia, 2008–2010 22 35 26 29 19 15 18Costa Rica, 2007–2009 23 27 22 22 21 20 34Finland, 2009–2011 24 48 50 45 28 13 9Greece, 2008–2010 25 40 46 38 27 26 3
Paraguay, 2007–2009 26 29 28 18 25 30 45Colombia, 2007–2009 27 9 18 23 32 42 31Mexico, 2008–2010 28 21 29 19 24 37 28Poland, 2009–2011 29 50 38 27 26 16 36Venezuela, 2005–2007 30 11 19 21 31 40 43Cuba, 2008–2010 31 31 24 25 22 33 42New Zealand, 2007–2009 32 24 47 31 30 29 41Bulgaria, 2009–2011 33 49 20 37 34 28 29Croatia, 2009–2011 34 59 48 43 38 19 16Peru, 2005–2007 35 18 34 32 35 39 26Czech Republic, 2009–2011 36 36 40 39 33 25 24Taiwan, 2009–2011 37 37 31 44 39 35 17Hungary, 2009–2011 38 55 36 34 36 24 35Egypt, 2009–2011 39 20 23 24 41 52 57Norway, 2009–2011 40 51 43 33 37 32 37Argentina, 2008–2010 41 15 32 30 45 50 54France, 2007–2009 42 34 49 51 43 36 22USA, 2008–2010 43 26 41 36 42 43 47Georgia, 2007, 2009, 2010 44 57 35 48 29 44 46Korea, 2009–2011 45 52 37 50 46 38 21Australia, 2009–2011 46 30 44 46 40 51 44Malaysia, 2006–2008 47 33 21 40 44 55 58Serbia, 2009–2011 48 54 30 42 51 41 40Guatemala, 2006–2008 49 47 39 35 48 46 56Canada, 2007–2009 50 38 45 41 47 48 50Spain, 2008–2010 51 41 54 49 50 47 38Sweden, 2008–2010 52 53 53 56 52 45 30Portugal, 2009–2011 53 39 52 53 54 53 52Italy, 2008–2010 54 58 51 52 53 56 51Belgium, 2007–2009 55 42 55 59 56 49 49Austria, 2009–2011 56 46 59 54 58 54 48Netherlands, 2009–2011 57 45 57 57 57 57 55UK, 2008–2010 58 56 58 55 55 58 59
Germany, 2009–2011 59 44 56 58 59 59 53Turkey, 2006–2008 60 60 60 60 60 60 60
2 Lin C-Y, et al. Inj Prev 2014;0:1–8. doi:10.1136/injuryprev-2013-041110
Original article
on 17 May 2018 by guest. P
rotected by copyright.http://injuryprevention.bm
j.com/
Inj Prev: first published as 10.1136/injuryprev-2013-041110 on 18 June 2014. D
ownloaded from

Different countries used different Revision and TabulationList of the International Classification of Disease (ICD). Weused ICD-8 condensed A List A143 (ie, detailed ICD-8 codeE910), ICD-9 condensed Basic Tabulation List B521 (ie, detailedICD-9 code E910), ICD-10 condensed Tabulation List 1 1098(ie, detailed ICD-10 codes W65-W74), and ICD-10 detailedThree and Four Character List ICD-10 codes V90, V92, W65–W74 to identify unintentional drowning deaths.
To ensure statistical stability in calculating the mortality rateby age group, we combined data for the latest available 3 years,and included only those countries that reported more than 150unintentional drowning deaths for all age groups. Based onthese inclusion criteria, a total of 60 countries were included inthe final analysis.
One country (Turkey) used condensed ICD-8 List A; onecountry (Greece) used condensed ICD-9 Basic Tabulation List;four countries (Kazakhstan, Belarus, Russia, and Ukraine) usedcondensed ICD-10 Tabulation List 1; seven countries (South
Korea, Malaysia, Taiwan, Bulgaria, Serbia, Egypt, South Africa)used detailed Three Character List ICD-10 codes; and theremaining 47 countries used detailed ICD-10 Four CharactersList codes.
Completeness and quality of mortality data differed acrosscountries; because this affects interpretation of this study, welisted the completeness of mortality data for each country asassessed by the WHO.26 There were nine countries for whichthe completeness of mortality data was less than 90%, andseven countries for which the information on completeness wasnot available (Appendix). For countries that used detailedICD-10 Three or Four Character List codes, we further exam-ined the quality of reporting for body of water (ie, bathtub,swimming pool, natural water, other) and mechanism (while inwater or falling into water). To do this, we calculated the per-centage of drowning deaths classified as ‘unspecified’ (ICD-10code W74) among all drowning deaths (ICD-10 codesW65-W74). We defined ‘high quality’ data as having less than
Figure 1 The age-standardised unintentional drowning mortalty rate(deaths per 100 000 population) and 95% CIs in each country.
Figure 2 Unintentional drowning mortalty rate (deaths per 100 000population) and 95% CIs for children aged 0–4 years in each country.
Lin C-Y, et al. Inj Prev 2014;0:1–8. doi:10.1136/injuryprev-2013-041110 3
Original article
on 17 May 2018 by guest. P
rotected by copyright.http://injuryprevention.bm
j.com/
Inj Prev: first published as 10.1136/injuryprev-2013-041110 on 18 June 2014. D
ownloaded from

20% as ‘unspecified’, as suggested by the Global Burden ofDisease Injury Expert Group.27
Statistical analysisWe first calculated the age-specific (0–4, 5–14 15–24, 25–44, 45–64, and 65+ years) unintentional drowning mortality rates(deaths per 100 000 population) and 95% CIs in each countryand region. Some countries did not provide population data toWHO, so we used population data from the 2010 Revision of theWorld Population Prospects undertaken by the PopulationDivision of the United Nations Department of Economic andSocial Affairs of the United Nations Secretariat.28 We used theWHO World Standard Population to compute theage-standardised mortality rate.25 We then ranked the uninten-tional drowning mortality rates of each country by age groups.For countries that used detailed ICD-10 Three or Four CharacterList codes, we further illustrated the percentage of drowningdeaths by body of water (ie, bathtub, swimming pool, natural
water, other, and unspecified). The countries were groupedaccording to region as used by the GBD 2010.1
RESULTSTable 1 presents the ranking of unintentional drowning mortalityrate for each country by age groups. Of the 10 countries withhighest ranking in age-standardised mortality rates, six (Belarus,Lithuania, Latvia, Russia, Ukraine and Moldova) were in EasternEurope and two (Kazakhstan and Kyrgyzstan) were in CentralAsia. Some countries ( Japan, Finland and Greece) had a relativelylow rank in mortality rate among children aged 0–4 years (43, 48and 40, respectively) but had a high rank in mortality rate amongolder adults (1, 9, and 4 respectively). On the contrary, SouthAfrica and Colombia had a relatively high rank among childrenaged 0–4 years (7 and 9) but had a relatively low rank in mortalityrate among older adults (25 and 31). The numbers, proportionsand rates of unintentional drowning deaths in each country areillustrated by age and region in online supplementary file 1.
Figure 3 Unintentional drowning mortalty rate (deaths per 100 000population) and 95% CIs for children aged 5–14 years in each country.
Figure 4 Unintentional drowning mortalty rate (deaths per 100 000population) and 95% CIs for young adults aged 15–24 years in eachcountry.
4 Lin C-Y, et al. Inj Prev 2014;0:1–8. doi:10.1136/injuryprev-2013-041110
Original article
on 17 May 2018 by guest. P
rotected by copyright.http://injuryprevention.bm
j.com/
Inj Prev: first published as 10.1136/injuryprev-2013-041110 on 18 June 2014. D
ownloaded from
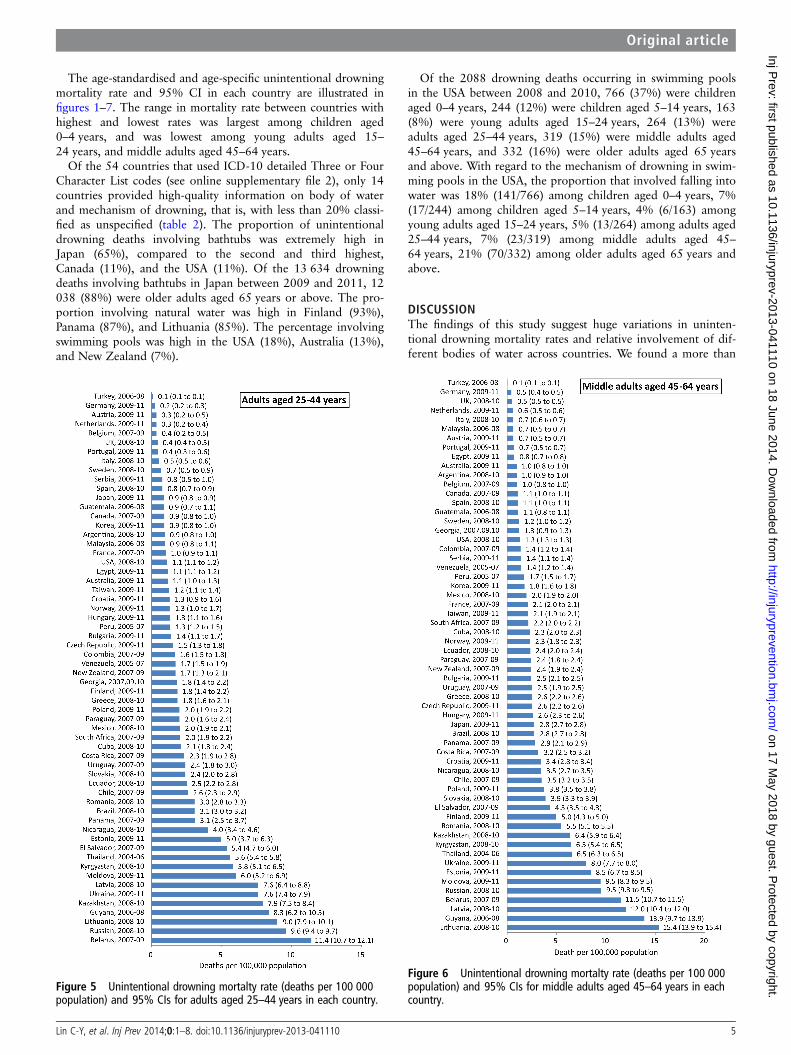
The age-standardised and age-specific unintentional drowningmortality rate and 95% CI in each country are illustrated infigures 1–7. The range in mortality rate between countries withhighest and lowest rates was largest among children aged0–4 years, and was lowest among young adults aged 15–24 years, and middle adults aged 45–64 years.
Of the 54 countries that used ICD-10 detailed Three or FourCharacter List codes (see online supplementary file 2), only 14countries provided high-quality information on body of waterand mechanism of drowning, that is, with less than 20% classi-fied as unspecified (table 2). The proportion of unintentionaldrowning deaths involving bathtubs was extremely high inJapan (65%), compared to the second and third highest,Canada (11%), and the USA (11%). Of the 13 634 drowningdeaths involving bathtubs in Japan between 2009 and 2011, 12038 (88%) were older adults aged 65 years or above. The pro-portion involving natural water was high in Finland (93%),Panama (87%), and Lithuania (85%). The percentage involvingswimming pools was high in the USA (18%), Australia (13%),and New Zealand (7%).
Of the 2088 drowning deaths occurring in swimming poolsin the USA between 2008 and 2010, 766 (37%) were childrenaged 0–4 years, 244 (12%) were children aged 5–14 years, 163(8%) were young adults aged 15–24 years, 264 (13%) wereadults aged 25–44 years, 319 (15%) were middle adults aged45–64 years, and 332 (16%) were older adults aged 65 yearsand above. With regard to the mechanism of drowning in swim-ming pools in the USA, the proportion that involved falling intowater was 18% (141/766) among children aged 0–4 years, 7%(17/244) among children aged 5–14 years, 4% (6/163) amongyoung adults aged 15–24 years, 5% (13/264) among adults aged25–44 years, 7% (23/319) among middle adults aged 45–64 years, 21% (70/332) among older adults aged 65 years andabove.
DISCUSSIONThe findings of this study suggest huge variations in uninten-tional drowning mortality rates and relative involvement of dif-ferent bodies of water across countries. We found a more than
Figure 5 Unintentional drowning mortalty rate (deaths per 100 000population) and 95% CIs for adults aged 25–44 years in each country.
Figure 6 Unintentional drowning mortalty rate (deaths per 100 000population) and 95% CIs for middle adults aged 45–64 years in eachcountry.
Lin C-Y, et al. Inj Prev 2014;0:1–8. doi:10.1136/injuryprev-2013-041110 5
Original article
on 17 May 2018 by guest. P
rotected by copyright.http://injuryprevention.bm
j.com/
Inj Prev: first published as 10.1136/injuryprev-2013-041110 on 18 June 2014. D
ownloaded from
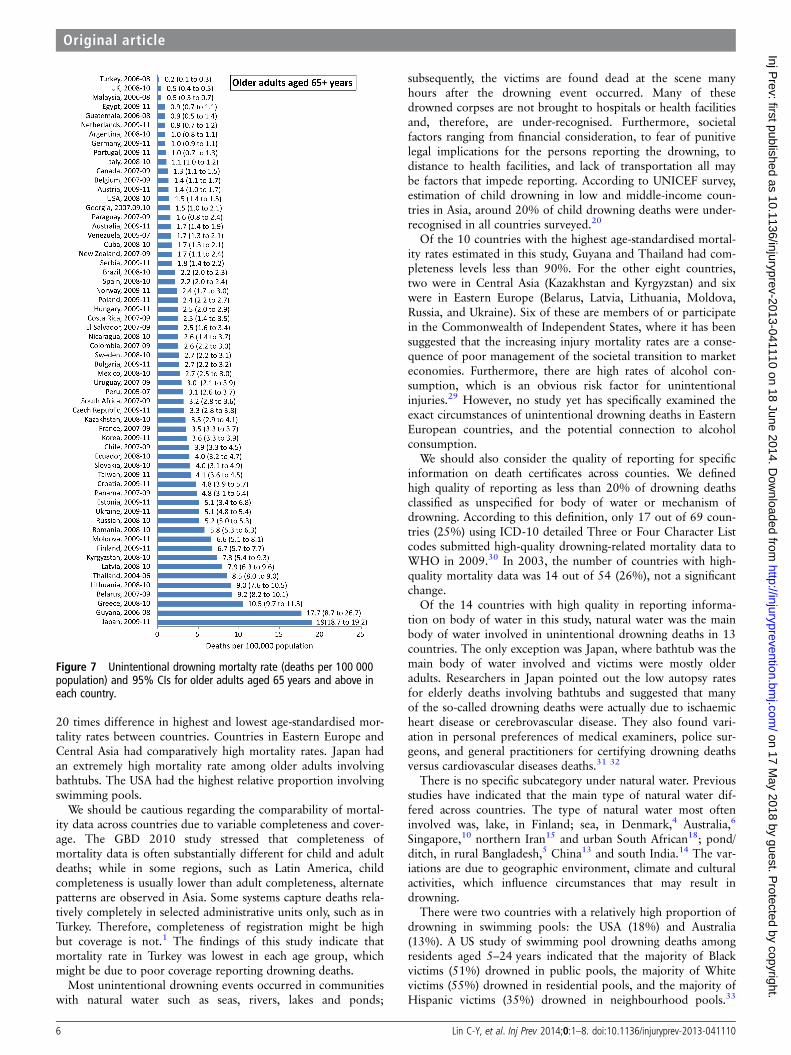
20 times difference in highest and lowest age-standardised mor-tality rates between countries. Countries in Eastern Europe andCentral Asia had comparatively high mortality rates. Japan hadan extremely high mortality rate among older adults involvingbathtubs. The USA had the highest relative proportion involvingswimming pools.
We should be cautious regarding the comparability of mortal-ity data across countries due to variable completeness and cover-age. The GBD 2010 study stressed that completeness ofmortality data is often substantially different for child and adultdeaths; while in some regions, such as Latin America, childcompleteness is usually lower than adult completeness, alternatepatterns are observed in Asia. Some systems capture deaths rela-tively completely in selected administrative units only, such as inTurkey. Therefore, completeness of registration might be highbut coverage is not.1 The findings of this study indicate thatmortality rate in Turkey was lowest in each age group, whichmight be due to poor coverage reporting drowning deaths.
Most unintentional drowning events occurred in communitieswith natural water such as seas, rivers, lakes and ponds;
subsequently, the victims are found dead at the scene manyhours after the drowning event occurred. Many of thesedrowned corpses are not brought to hospitals or health facilitiesand, therefore, are under-recognised. Furthermore, societalfactors ranging from financial consideration, to fear of punitivelegal implications for the persons reporting the drowning, todistance to health facilities, and lack of transportation all maybe factors that impede reporting. According to UNICEF survey,estimation of child drowning in low and middle-income coun-tries in Asia, around 20% of child drowning deaths were under-recognised in all countries surveyed.20
Of the 10 countries with the highest age-standardised mortal-ity rates estimated in this study, Guyana and Thailand had com-pleteness levels less than 90%. For the other eight countries,two were in Central Asia (Kazakhstan and Kyrgyzstan) and sixwere in Eastern Europe (Belarus, Latvia, Lithuania, Moldova,Russia, and Ukraine). Six of these are members of or participatein the Commonwealth of Independent States, where it has beensuggested that the increasing injury mortality rates are a conse-quence of poor management of the societal transition to marketeconomies. Furthermore, there are high rates of alcohol con-sumption, which is an obvious risk factor for unintentionalinjuries.29 However, no study yet has specifically examined theexact circumstances of unintentional drowning deaths in EasternEuropean countries, and the potential connection to alcoholconsumption.
We should also consider the quality of reporting for specificinformation on death certificates across counties. We definedhigh quality of reporting as less than 20% of drowning deathsclassified as unspecified for body of water or mechanism ofdrowning. According to this definition, only 17 out of 69 coun-tries (25%) using ICD-10 detailed Three or Four Character Listcodes submitted high-quality drowning-related mortality data toWHO in 2009.30 In 2003, the number of countries with high-quality mortality data was 14 out of 54 (26%), not a significantchange.
Of the 14 countries with high quality in reporting informa-tion on body of water in this study, natural water was the mainbody of water involved in unintentional drowning deaths in 13countries. The only exception was Japan, where bathtub was themain body of water involved and victims were mostly olderadults. Researchers in Japan pointed out the low autopsy ratesfor elderly deaths involving bathtubs and suggested that manyof the so-called drowning deaths were actually due to ischaemicheart disease or cerebrovascular disease. They also found vari-ation in personal preferences of medical examiners, police sur-geons, and general practitioners for certifying drowning deathsversus cardiovascular diseases deaths.31 32
There is no specific subcategory under natural water. Previousstudies have indicated that the main type of natural water dif-fered across countries. The type of natural water most ofteninvolved was, lake, in Finland; sea, in Denmark,4 Australia,6
Singapore,10 northern Iran15 and urban South African18; pond/ditch, in rural Bangladesh,5 China13 and south India.14 The var-iations are due to geographic environment, climate and culturalactivities, which influence circumstances that may result indrowning.
There were two countries with a relatively high proportion ofdrowning in swimming pools: the USA (18%) and Australia(13%). A US study of swimming pool drowning deaths amongresidents aged 5–24 years indicated that the majority of Blackvictims (51%) drowned in public pools, the majority of Whitevictims (55%) drowned in residential pools, and the majority ofHispanic victims (35%) drowned in neighbourhood pools.33
Figure 7 Unintentional drowning mortalty rate (deaths per 100 000population) and 95% CIs for older adults aged 65 years and above ineach country.
6 Lin C-Y, et al. Inj Prev 2014;0:1–8. doi:10.1136/injuryprev-2013-041110
Original article
on 17 May 2018 by guest. P
rotected by copyright.http://injuryprevention.bm
j.com/
Inj Prev: first published as 10.1136/injuryprev-2013-041110 on 18 June 2014. D
ownloaded from
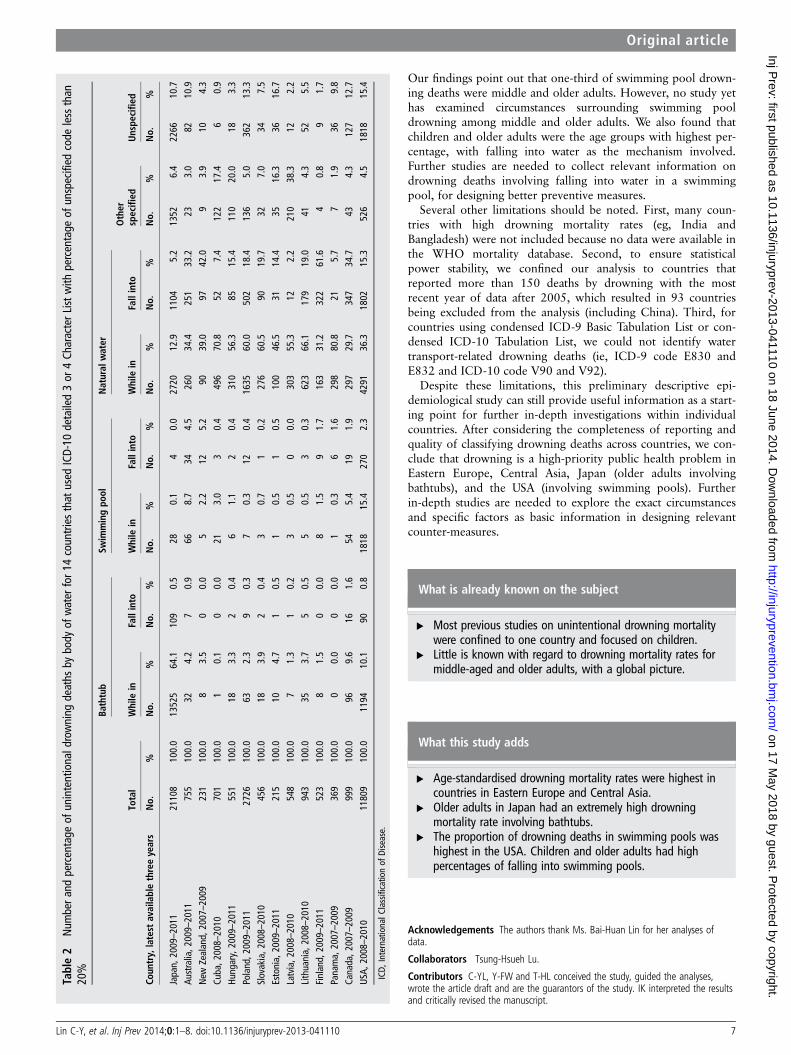
Our findings point out that one-third of swimming pool drown-ing deaths were middle and older adults. However, no study yethas examined circumstances surrounding swimming pooldrowning among middle and older adults. We also found thatchildren and older adults were the age groups with highest per-centage, with falling into water as the mechanism involved.Further studies are needed to collect relevant information ondrowning deaths involving falling into water in a swimmingpool, for designing better preventive measures.
Several other limitations should be noted. First, many coun-tries with high drowning mortality rates (eg, India andBangladesh) were not included because no data were available inthe WHO mortality database. Second, to ensure statisticalpower stability, we confined our analysis to countries thatreported more than 150 deaths by drowning with the mostrecent year of data after 2005, which resulted in 93 countriesbeing excluded from the analysis (including China). Third, forcountries using condensed ICD-9 Basic Tabulation List or con-densed ICD-10 Tabulation List, we could not identify watertransport-related drowning deaths (ie, ICD-9 code E830 andE832 and ICD-10 code V90 and V92).
Despite these limitations, this preliminary descriptive epi-demiological study can still provide useful information as a start-ing point for further in-depth investigations within individualcountries. After considering the completeness of reporting andquality of classifying drowning deaths across countries, we con-clude that drowning is a high-priority public health problem inEastern Europe, Central Asia, Japan (older adults involvingbathtubs), and the USA (involving swimming pools). Furtherin-depth studies are needed to explore the exact circumstancesand specific factors as basic information in designing relevantcounter-measures.
What is already known on the subject
▸ Most previous studies on unintentional drowning mortalitywere confined to one country and focused on children.
▸ Little is known with regard to drowning mortality rates formiddle-aged and older adults, with a global picture.
What this study adds
▸ Age-standardised drowning mortality rates were highest incountries in Eastern Europe and Central Asia.
▸ Older adults in Japan had an extremely high drowningmortality rate involving bathtubs.
▸ The proportion of drowning deaths in swimming pools washighest in the USA. Children and older adults had highpercentages of falling into swimming pools.
Acknowledgements The authors thank Ms. Bai-Huan Lin for her analyses ofdata.
Collaborators Tsung-Hsueh Lu.
Contributors C-YL, Y-FW and T-HL conceived the study, guided the analyses,wrote the article draft and are the guarantors of the study. IK interpreted the resultsand critically revised the manuscript.
Table2
Num
bera
ndpercentage
ofunintentionaldrowning
deaths
bybody
ofwater
for1
4countries
that
used
ICD-10
detailed3or
4Ch
aracterList
with
percentage
ofunspecified
code
less
than
20%
Coun
try,latest
availablethreeyears
Bathtub
Swim
mingpo
olNatural
water
Total
While
inFallinto
While
inFallinto
While
inFallinto
Other
specified
Unspe
cifie
d
No.
%No.
%No.
%No.
%No.
%No.
%No.
%No.
%No.
%
Japan,
2009–2011
21108
100.0
13525
64.1
109
0.5
280.1
40.0
2720
12.9
1104
5.2
1352
6.4
2266
10.7
Australia,2
009–2011
755
100.0
324.2
70.9
668.7
344.5
260
34.4
251
33.2
233.0
8210.9
New
Zealand,
2007–2009
231
100.0
83.5
00.0
52.2
125.2
9039.0
9742.0
93.9
104.3
Cuba,2
008–2010
701
100.0
10.1
00.0
213.0
30.4
496
70.8
527.4
122
17.4
60.9
Hungary,2009–2011
551
100.0
183.3
20.4
61.1
20.4
310
56.3
8515.4
110
20.0
183.3
Poland,2
009–2011
2726
100.0
632.3
90.3
70.3
120.4
1635
60.0
502
18.4
136
5.0
362
13.3
Slovakia,2
008–2010
456
100.0
183.9
20.4
30.7
10.2
276
60.5
9019.7
327.0
347.5
Estonia,
2009–2011
215
100.0
104.7
10.5
10.5
10.5
100
46.5
3114.4
3516.3
3616.7
Latvia,2
008–2010
548
100.0
71.3
10.2
30.5
00.0
303
55.3
122.2
210
38.3
122.2
Lithuania,
2008–2010
943
100.0
353.7
50.5
50.5
30.3
623
66.1
179
19.0
414.3
525.5
Finland,
2009–2011
523
100.0
81.5
00.0
81.5
91.7
163
31.2
322
61.6
40.8
91.7
Panama,
2007–2009
369
100.0
00.0
00.0
10.3
61.6
298
80.8
215.7
71.9
369.8
Canada,2
007–2009
999
100.0
969.6
161.6
545.4
191.9
297
29.7
347
34.7
434.3
127
12.7
USA,
2008–2010
11809
100.0
1194
10.1
900.8
1818
15.4
270
2.3
4291
36.3
1802
15.3
526
4.5
1818
15.4
ICD,
InternationalC
lassificationof
Disease.
Lin C-Y, et al. Inj Prev 2014;0:1–8. doi:10.1136/injuryprev-2013-041110 7
Original article
on 17 May 2018 by guest. P
rotected by copyright.http://injuryprevention.bm
j.com/
Inj Prev: first published as 10.1136/injuryprev-2013-041110 on 18 June 2014. D
ownloaded from
Funding This study was funded by the Department of Health of Taiwan(DOH101Z3087), the National Science Council (NSC102-2314-B-006-054) and theChi-Mei & National Cheng Kung University Joint Program (CMNCKU10016).
Competing interests None.
Patient consent No.
Ethics approval This study was approved by the Institutional Review Boards ofChi-Mei Medical Center (09909-004) and National Cheng Kung University Hospital(ER-99-170).
Provenance and peer review Not commissioned; externally peer reviewed.
Data sharing statement The data used in this study are accessible from websiteof the WHO Health Statistics and Health Information Services.
REFERENCES1 Lozano R, Naghavi M, Foreman K, et al. Global and regional mortality from 235
causes of death for 20 age groups in 1990 and 2010: a systematic analysis for theGlobal Burden of Disease Study 2010. Lancet 2012;380:2095–128.
2 Barss P, Smith GS, Baker SP, et al. Unintentional injuries: drownings, falls, andburns. In: Barss P, Smith GS, Baker SP, Mohan D. eds Injury prevention: aninternational perspective. New York: Oxford University Press, 1998:153.
3 Brenner RA, Taneja G. Injury prevention: drowning. Rivara F, tpic ed. In:Tremblay RE, Boivin M, Peters RdeV. eds Encyclopedia on early childhooddevelpment [online]. Montreal, Quebec: Centre of Excellence for Early ChildhoodDevelpment and Strategic Knowledge Cluster on Early Child Deveopment,2010:1–6.
4 Steensberg J. Epidemiology of accidental drowning in Denmark 1989–1993. AccAnal Prev 1998;30:755–62.
5 Ahmed MK, Rahman M, van Ginneken J. Epidemiology of child deaths due todrowning in Matlab, Bangladesh. Int J Epidemiol 1999;28:306–11.
6 Mackie IJ. Patterns of drowning in Australia, 1992–1997. Med J Aust1999;171:587–90.
7 Brenner RA, Trumble AC, Smith GS, et al. Where children drown, United States,1995. Pediatrics 2001;108:85–9.
8 Quan L, Cummings P. Characteristics of drowning by different age groups. Inj Prev2003;9:163–68.
9 Browne ML, Lewis-Michl EL, Stark AD. Unintentional drowning among New YorkState residents, 1988–1994. Public Health Rep 2003;118:448–58.
10 Tan RM. The epidemiology and prevention of drowning in Singapore. SingaporeMed J 2004;45:324–29.
11 Lunetta P, Smith GS, Penttilä A, et al. Unintentional drowning in Finland 1970–2000: a population-based study. Int J Epidemiol 2004;33:1053–63.
12 Capkova M, Veleminsky M, Benesova V, et al. Monitoring of drowning andnear-drowning in the Czech Republic in the year 2001–2002. Int J Inj Contr SafProm 2006;13:43–5.
13 Fang Y, Dai L, Jaung MS, et al. Child drowning deaths in Xiamen city and suburbs,People’s Republic of China, 2001–5. Inj Prev 2007;13:339–43.
14 Shetty BSK, Shetty M. Epidemiology of drowning in Mangalore, a coastal Taluk ofSouth India. J Forensic Legal Med 2007;14:410–5.
15 Kiakalayeh AD, Mohammadi R, Ekman DS, et al. Unintentional drowning innorthern Iran: a population-based study. Acc Ana Prev 2008;40:1977–81.
16 Rahman A, Mashreky SR, Chowdhury SM, et al. Analysis of the childhood fataldrowning situation in Bangladesh: exploring prevention measures for low-incomecountries. Inj Prev 2009;15:75–9.
17 Jagnoor J, Bassani DG, Keay L, et al. Unintentional injury deaths among childrenyounger than 5 years of age in India: a nationally representative study. Inj Prev2011;17:151–5.
18 Donson H, van Niekerk A. Unintentional drowning in urban South Africa: aretrospective investigation, 2001–2005. Int J Inj Contr Saf Prom 2013;20:218–26.
19 Peden MM, McGee K. The epidemiology of drowning worldwide. Inj Contr Saf Prom2003;10:195–99.
20 Linnan M, Rahman A, Scarr J, et al. Child drowning: evidence for a newlyrecognized cause of child mortality in low and middle income countries in Asia.Working Paper 2012–07, Special Series on Child Injury No. 2. Florence: UNICEFOffice of Research, 2012.
21 Smith GS, Langlois JA, Rockett IRH. International comparisons of injury mortality:hypothesis generation, ecological studies, and some data problems. Proceedings ofthe International Collaborative Effort on Injury Statistics. Volume 1. Hyattsville, MD:National Center for Health Statistics, 1995;13:1–15. (DHHS publication No (PHS)95–1252).
22 Langlois JA, Smith GS, Baker SP, et al. International comparisons of injury mortalityin the elderly: issues and differences between New Zealand and the United States.Int J Epidemiol 1995;24:136–43.
23 Hijar M, Chu LD, Kraus JF. Cross-national comparison of injury mortality: LosAngeles County, California and Mexico City, Mexico. Int J Epidemiol2000;29:715–21.
24 Lu TH, Chiang TL, Lynch JW. What can we learn from international comparisons ofsocial inequalities in road traffic injury mortality? Inj Prev 2005;11:131–3.
25 World Health Organization. Download the raw data files of the WHO MortalityDatabase. 2 February 2014. http://www.who.int/healthinfo/statistics/mortality_rawdata/en/index.html
26 Mathers C, Stevens G, Ma Fat D. WHO methods and data sources for global causesof death, 2000–2011. Geneva: Department of Health Statistics and InformationSystems, World Health Organization, 2013.
27 Bhalla K, Harrison JE, Shahraz S, et al. the Global burden of disease injury expertgroup. Availability and quality of cause-of-death data for estimating the globalburden of injuries. Bull World Health Organ 2010;88:831–8.
28 The Population Division of the United Nations Department of Economic and SocialAffairs. The 2010 Revision of the World Population Prospects. 2 February 2014.http://esa.un.org/unpd/wpp/
29 Hyder AA, Aggarwal A. The increasing burden of injuries in Eastern Europe andEuroasia: making the case for safety investments. Health Policy 2009;89:1–13.
30 Lu TH, Lunetta P, Walker S. Quality of cause-of-death reporting using ICD-10drowning codes: a descriptive study of 69 countries. BMC Med Res Methodol2010;10:30.
31 Yoshioka N, Nibe H, Enzan K, et al. Sudden death in the bathroom and itsmedico-legal issues. Res Pract Forensic Med 1998;41:353–9. (in Japanese).
32 Kurosaki K, Kuriiwa F, Hara S, et al. Questionable diagnoses on the cause of deathwhile bathing. Res Pract Forensic Med 2002;45:175–80. (in Japanese).
33 Saluja G, Benner RA, Trumble AC, et al. Swimming pool drownings among USresidents aged 5–24 years: understanding racial/ethic disparities. Am J Public Health2006;96:728–33.
8 Lin C-Y, et al. Inj Prev 2014;0:1–8. doi:10.1136/injuryprev-2013-041110
Original article
on 17 May 2018 by guest. P
rotected by copyright.http://injuryprevention.bm
j.com/
Inj Prev: first published as 10.1136/injuryprev-2013-041110 on 18 June 2014. D
ownloaded from