unincorporated communities in the san joaquin valley: new
TRANSCRIPT

Unincorporated Communities in the San Joaquin Valley:
New Responses to Poverty, Inequity, and a
System of Unresponsive Governance
Framing paper for the first convening hosted by
California Rural Legal Assistance and PolicyLink
Fresno, California
November 27, 2007
Written By:
Victor Rubin,
Arnold Chandler,
Erika Bernabei,
Rubén Lizardo
2
I. Summary
The low-income unincorporated communities of the San Joaquin Valley face uphill struggles to attain
basic features of a safe and healthy environment that residents of most other places have long taken for
granted. These communities range from remote settlements in farm country to neighborhoods that have
been surrounded by, but are not part of, the San Joaquin Valley’s fast-growing cities. There are at least
220 such low-income unincorporated communities in the eight county region. Whether it is a lack of
storm drains, streetlights, and sidewalks or an inadequate residential water supply, these communities
outside of the San Joaquin Valley’s cities are often systematically underserved if not neglected in the
overall allocation of public resources. This neglect prevents these places from realizing their potential as
livable neighborhoods and threatens the health and security of their residents. These disparities can be
dangerous, such as the illnesses caused from unsafe drinking water, the heightened likelihood of
mosquitoes carrying West Nile virus as a result of standing water arising from inadequate storm drains,
and the higher rates of traffic accidents on poorly maintained roads. Or, they can chip away more slowly
at the prospects for building a strong community, when there is illegal dumping, poor sanitation service,
few or no recreation facilities for youth, and dilapidated schools. When the official lack of attention and
resources becomes standard practice, it can create an overall discouraging cycle of decline that is hard to
break. The fact that governance structures are not organized to ensure meaningful political
representation for residents in decision-making only adds to the challenge.
This may be a grim picture, but it has never been taken as inevitable by residents of these communities
and their allies. Instead, there has been a continual ferment for change in the unincorporated
communities and an array of grass-roots organizing campaigns, lawsuits and efforts to promote
legislation. These efforts have brought some tangible improvements, and they have run up against some
barriers. Notwithstanding some important individual victories, the broad patterns of inequity have not
yet been shifted, and the San Joaquin Valley’s colonias, as they are sometimes called, are still getting a
bad deal.
This paper is a step in a year-long effort to think through new strategies for addressing the inequities
faced by the unincorporated communities. It has been written at the mid-point of a project in which
California Rural Legal Assistance, PolicyLink, and leaders from around the San Joaquin Valley are
examining issues, assessing past efforts, setting priorities, and creating new approaches for community
organizing, legislation, litigation or other methods for social and policy change. It is a modest framing
paper in that it does not attempt to overwhelm the reader with copious evidence of the problems or a
detailed analysis of the literature. We at PolicyLink owe a large debt to those who have labored for
years on these issues in community-based practice and in research, and we base our understanding on
their work. The value added by this paper will hopefully be in the framing itself: the recasting of
3
familiar issues and evidence in new and different ways; the tracing of a path toward a larger, more robust
and integrated movement for change. But this framing will be presented not as a roadmap or strategic
plan, for that would be premature, but simply as challenging questions for Valley leaders to sort through
and build on, beginning with our convening in Fresno on November 27, 2007. The results of that
discussion, in conjunction with the background research that has been conducted, will set the stage for
the next phase of the project, to develop a coordinated action plan. More detailed information about
these communities will be available at the convening on November 27th.
a. The Building Blocks of a New Frame for Understanding Unincorporated Communities
Our approach to framing the issues and opportunities for change includes four broad elements:
1. Identifying the Communities of Interest. There have been, over the years, several different
ways of defining and naming the unincorporated communities. For different reasons, the definitions
and names used, whether by local residents or government officials, have not always served to help
further research, assessment, and planning to improve conditions in these communities. For
example, all the settlements in San Joaquin Valley commonly referred to as colonias are
unincorporated but not all unincorporated communities exhibit social and economic conditions
associated with colonias. To account for these differences, we have chosen to refer to the subset of
San Joaquin Valley unincorporated settlements that meet the criteria for inclusion in this project as
“Communities of Interest,” (or COIs). To begin to systematically identify our Communities of
Interest, we started with the 122 Census Designated Places (CDPs), the term Census 2000 used to
identify unincorporated communities in the eight counties of the San Joaquin Valley. Using an
index that sorted CDPs according to key economic and social indicators and their racial and ethnic
composition we were able to identify 83 CDPs that fit our criteria of unincorporated settlements with
multiple indicators of concentrated poverty—our Communities of Interest. We have augmented this
list of 83 COIs with 134 additional settlements that have been identified by various public
documents and by the advisory committee to this project. To be sure, as this project continues other
unincorporated settlements will be added to the initial set of Communities of Interest we identified in
this report.
The Communities of Interest we have identified to date fall into three distinct types of
unincorporated settlements, based on their location in relationship to cities. There are 118 “islands,”
neighborhoods that may once have been semi-rural but have now been literally surrounded by the
city limits of the large and medium-sized cities of the Valley such as Modesto, Visalia, Porterville,
or Fresno. Then, there are 35 of what we have labeled “fringe” communities, to indicate that they
are on the outskirts of a city that is, in many cases, expanding, but whose borders have not yet
4
reached it. Finally, there are 66 rural settlements, labeled “hinterlands” to reinforce that they are far
enough away from any cities to be viewed as independent small towns, at least for the foreseeable
future. With the continued rapid sprawl of the cities in the Valley, today’s fringe can become
tomorrow’s island, and today’s hinterland can become tomorrow’s fringe, so while the three types
are distinct, the pattern is always evolving and even the most isolated communities are part of a
larger regional system of land development and conversion. Overall, more than 400,000 people live
in the lower income unincorporated settlements of the eight counties.
The term colonias literally means simply “settlement” but also carries a host of legal consequences
and informal connotations, and its use in the context of the Central Valley is a subject of active
discussion. Most, but not all, of the residents of most of the settlements are Latino, and the
conditions embody the racialized nature of poverty and inequality in the country. There are
unmistakable similarities to certain conditions in the border-region settlements in Texas, Arizona,
New Mexico, and California officially designated by the federal and state governments as colonias,
and important lessons to learn from their experiences. One of the policy discussions will no doubt
address whether there are advantages to seeking some kind of analogous government recognition for
San Joaquin Valley settlements. However, there are also important differences with the border areas,
as well as some reactions to negative images associated with the term.1 We will employ it on limited
occasions in this report and continue to encourage the constituencies for this project to develop a
consensus regarding the strategic use of the term.
2. Documenting conditions in the communities. The unincorporated settlements have a host of
conditions that present threats to health and safety, maintain economic and educational inequity, and
prevent the flourishing of more complete communities. There are deficiencies of physical
infrastructure, such as water systems, storm drain and sewer lines, sidewalks, roads and streetlights,
and of public buildings of all kinds. These are joined by substantial deficits in resources for decent
affordable housing and for adequate public human services, health care, and education. Some of
these issues have been relatively well-documented, while for others, information and data is either
not available or uneven. Many of the strongest efforts to improve these conditions have taken up
one issue at a time, such as the need for a new water system in a particular community or group of
communities, and thus some of the best data have been generated as part of those efforts. For this
project so far, we have collected and summarized many reports about the San Joaquin Valley
community conditions done by research and planning bodies across the state and tracking recent
developments as they are reported in the news media. While this information does not represent a
major breakthrough with regard to new evidence, reorganizing this information can help to frame
and sharpen the issues and tell us what new kinds of data would be needed to guide and inform

5
future activities. There are several different aspects of services and facilities that can be
documented. First, there are absolute shortcomings and deficiencies in the provision of
infrastructure and services, as noted above, when measured against standards of basic performance.
Then, there are also disparities, which refer the relative differences between the unincorporated areas
and other parts of the region. These can be disparities of inputs, such as how much is being spent
per capita on infrastructure and services, and disparities in outcomes, as measured by public health
and economic statistics or other measures. The measures of public finance conditions, which we
have only started, can include a wide range of information about revenue capacity, tax rates, local
expenditures, shares of county budgets, and resources from state programs.
The absence of good data about conditions and about the performance of local government can itself
become a potent political issue. The fragmented, under-resourced way in which unincorporated
communities are governed has limited the collection of useful data about their conditions compared
to those of neighborhoods in California cities. Information about conditions and resources in these
communities is uneven, scattered, inconsistent, not transparent and generally insufficient for
assessment and planning. Some of the public entities are so small or so rarely queried that they have
not created the systems for providing data to the public that are seen in larger units of government.
3. Documenting the system of governance. Being unincorporated – not being part of a city – has a
particular legal and administrative meaning in California and this has serious consequences on the
ability of residents to take part in the decision-making process about how services, utilities, and
infrastructure are provided, and how public funds are raised and allocated. The San Joaquin Valley
unincorporated island, fringe and hinterland communities are caught up in a perplexing, complicated,
fragmented, and dysfunctional array of local service providers: special districts, community service
districts, joint powers authorities, and municipal advisory councils, as well as numerous county
agencies. Furthermore, Local Area Formation Commissions (LAFCOs), Metropolitan Planning
Organizations, and other entities overseeing the growth of cities and counties and, more generally,
regional development determine the fates of many unincorporated communities. All of these bodies
exist within a complex system of state government financing and regulation of taxation, land
subdivision, public health, and other components of local government.
Any solution to the problems of unincorporated communities will require a high degree of
knowledge about this thicket of structures, rules and interests, for it must be untangled and revised, if
not rebuilt, in order to better serve low-income residents. This set of complex public entities will
need to become much more responsive to residents through their direct and active involvement in
decision-making. In this first phase of our research we are creating an inventory and guide to the

6
structure of local government operating in the colonias. Because the governance structure we are
contending with is so decentralized and complex, we chose to start by developing a clearer picture of
the situation in three counties with different patterns. It is our hope that this analysis will be useful
as community leaders develop approaches for engaging local government in addressing their
infrastructure needs.
4. Identifying a strategic approach for combined action, and policy targets for change in the
system of governance and public finance. The various problems which residents of
unincorporated communities confront are interconnected, and there can be power in building several
kinds of connections and relationships. The project, through its reports and convenings, will explore
five kinds of connections that should be made:
• Linking people in individual communities across the region that are experiencing similar
problems.
• Linking the efforts of researchers and advocates who have specialized in a particular issue or
service area, such as water, infrastructure, housing, or environmental health, so that they can see
where there is a basis for common or parallel actions.
• Exploring the extent to which the experiences and policy options for the three types of colonias
– island, fringe, and hinterland communities – overlap and can be the basis for common action.
• Examining the opportunities for coordinated action at four levels of geography and governance:
the community, the county, the region and the state.
• Identifying opportunities to link the challenges in colonias to existing and planned community
improvement efforts at the local and regional level.
If some or all of these bases for common activity are confirmed as valuable, then a wide range of
collaborative strategies can be developed. The toolbox for policy change has many instruments, and it
may be best not to choose the specific tool before working through the issues and strategies thoroughly.
To be sure, there will be a place for several kinds of legal action, for grass-roots organizing, and for
legislative advocacy. There also will be opportunities to build new alliances to generate sufficient
support for certain the various strategies. Various kinds of research and forms of communications will
be employed in support of each approach.
Our discussion to identify and select broad policy objectives to improve basic infrastructure and services
in colonias will be informed by a “lay of the land” discussion about policy targets (that is, the decision-
making organizations and individuals responsible for addressing the various issues), the unique
challenges the policy making bodies currently face, opportunities to tie-in to related advocacy efforts

7
currently underway, and our capacity to undertake different organizing methods, and build new alliances.
As a starting point for those discussions, this paper will present a set of questions about four key factors:
• The Complexity of Jurisdictional Issues. How can the fragmented, unrepresentative, often
poorly functioning system be reorganized, and what are the viable initial focal points for
change? How can such change bring about an increase in civic engagement as well as
improvements in the delivery of services and infrastructure?
• Challenges of Public Finance. The needs of these communities will take substantial new
investment, and it will not be sufficient to simply demand improvements without helping to
identify the sources of revenue. What are the strategies for finding new public capital and
operating funds for facilities and services in unincorporated communities, and how can we
emphasize solutions that are more than a “zero-sum game” within local governments?
• Opportunities to Reframe the Problem. Complicated jurisdictional issues and public finance
policy/practices present formidable challenges for small groups of community leaders and their
allies to build the organizing capacity and power to hold accountable the complex array of public
entities responsible for maintaining basic infrastructure. What are the prospects and possible
benefits of reframing the problems faced by residents in the low-income unincorporated
communities as planning and development challenges also facing their counties as a whole and
the nearby cities? If they are currently seen as primarily problems affecting politically isolated,
low-income Latinos, can we recast the racialized disparities in access to infrastructure for
healthy community development as a barrier to a goal of broader regional prosperity and equity?
For example, would emphasizing the threat posed by the high percentage of Communities of
Interest residents that rely on aging and leaking septic tanks to ground water that supplies all city
and county residents (and the greater costs associated with cleaning up contamination) serve as a
motivation to spend city and county funds to connect Communities of Interest to the sewer
system?
• Alliance-building on Behalf of the Colonias. Efforts to change policy, practice, and
investment related to infrastructure development in the Communities of Interest are likely to take
place within local and regional policy deliberations about water and other environmental
concerns, economic development, transportation, health and human services, and other issues
related to urban growth. Given all these dimensions to the issues, what new opportunities exist
for alliance building? Or put differently, how can community leaders engage a more diverse and
powerful set of constituencies to break through long standing patterns of resistance on the part of
local governance structures? Most substantial changes take the combined efforts of many
groups. Some coalitions or collaborative arrangements will come naturally, while others might
be unexpected.
8
II. Identifying Our Communities of Interest
The San Joaquin Valley is the primary region for understanding the issues and challenges facing small
unincorporated communities in California. It contains the largest relative concentration of number of
small unincorporated communities of any region in the state.2 The fourth largest region in the state, the
Valley is anchored by a string of urban areas that runs along California State Highway 99 from Stockton
to Bakersfield and includes the cities of Modesto, Merced, Tulare and Fresno, in eight counties (Fresno,
Kern, Kings, Madera, Merced, San Joaquin, Stanislaus and Tulare). Of the 3.9 million residents, more
than one in four live in unincorporated areas; more than 400,000 of those residents live in unincorporated
settlements with multiple indicators of concentrated poverty.
The universe of unincorporated communities is much larger than that of the colonias which we are
interested in for this project. The San Joaquin Valley has 122 unincorporated areas (Census Designated
Places) with an average population size of 3,101. Only four of these areas (Oildale, Rosamond, Lamont
and Salida) have populations greater than 10,000 people. Most of the Valley’s unincorporated
communities are smaller and more isolated, with much smaller tax bases and more challenges in securing
the resources needed for infrastructure and public services.
The eight counties in the Valley share a number of similarities that bind them together as a coherent
region. Importantly, however, their unincorporated communities evince a number of differences in their
size, type, and geographic distribution, as well as the governance structure in place to respond to their
service and infrastructure needs.
a. The Types of Communities that Comprise Our Communities of Interest (COIs)
There are three distinct types of unincorporated communities in the San Joaquin Valley that present
distinct issues and circumstances and require investigation in their own right:
1. Islands are unincorporated county areas that are fully or partially enclosed within the
boundaries of a city. For the purposes of this report, an island is defined as an unincorporated
geographic area that is surrounded by a city’s geographical boundaries on at least seventy-five
percent of its sides. 3 Since islands are not Census Designated Places, we do not have the same
demographic and housing data on islands that we do for most other unincorporated communities that
are CDPs.

9
Table 1. Islands by County
County Islands
Tulare 28
Stanislaus 23
Fresno 24
San Joaquin 20
Kern 9
Kings 7
Merced 6
Madera 1
Total 118
2. Fringes are unincorporated county areas that are located adjacent to or within 1.5 miles of a
city’s geographical boundaries. Some fringes may be located within an adjacent city’s “sphere of
influence” which allows that city to exercise influence over how that unincorporated area develops. 4
Fringes that are outside the sphere of influence of a city may lie within the potential growth footprint
of that city within the next few years.
3. Hinterlands are unincorporated county areas that are located more than 1.5 miles beyond any
city’s geographical boundaries.
Each of these types of communities needs to be mapped, documented and understood in order to grasp
the nuanced policy circumstances of unincorporated communities in the Valley. Some circumstances
and strategies may be relevant to all, while others will be specific to one type.
Figure 1. Types of Unincorporated Communities

10
A combination of publicly available data sources, local government documents, online GIS databases,
and interviews with key informants was used to identify each of these types of communities for all the
eight counties in the San Joaquin Valley. Together, all of the communities identified constitute our
“Communities of Interest” and are what make up the total counts of unincorporated communities for
each county and the Valley as whole that we have identified to date in Table 2. below.
b. Identifying Fringe and Hinterland Communities Using Census Data
Data from the 2000 Census offered the primary means for identifying most of the fringe and hinterland
unincorporated communities analyzed in this report. As part of the 2000 Census, the U.S. Census
Bureau collected data on unincorporated communities that it identified in partnership with local county
governments. Known as Census Designated Places, or CDPs, these communities can range widely in
population size. Although 2000 Census data is now more than eight years old, it is the only publicly-
available data source with demographic and housing information specific to these communities.
c. Filtering Census-Designated Places to Identify Colonias
Some unincorporated communities have residents with high incomes and expensive homes. To focus our
research on communities that are most likely to face the infrastructure and service deficits of interest in
this report, it was necessary to filter the complete list of 122 Census Designated Places in the San
Joaquin Valley based upon a number of key characteristics.
In order to filter out more affluent CDPs from those that are less affluent, a simple index using five
indicators developed from 2000 Census data was used. On each indicator, all CDPs were compared to
their counties using the following questions:
1. Poverty: Is the CDP poverty level higher than the county?
2. Median Income: Is the CDP median household income lower than the county?
3. Home Value: Is the CDP median home value lower than the county?
4. Age of Housing Stock: Is the median year that CDP housing was built earlier than the median
for the county?
5. Proportion of Mobile Homes: Is the percentage of CDP housing that is mobile homes higher
than the percentage for the county?
Each CDP was assigned a score based upon how many answers to these questions were “yes” versus
“no”. Only those CDPs with three or more “yes” responses are included in our Communities of Interest
(COIs) and analyzed in this report. After applying these criteria, we were left with 83 CDPs that
11
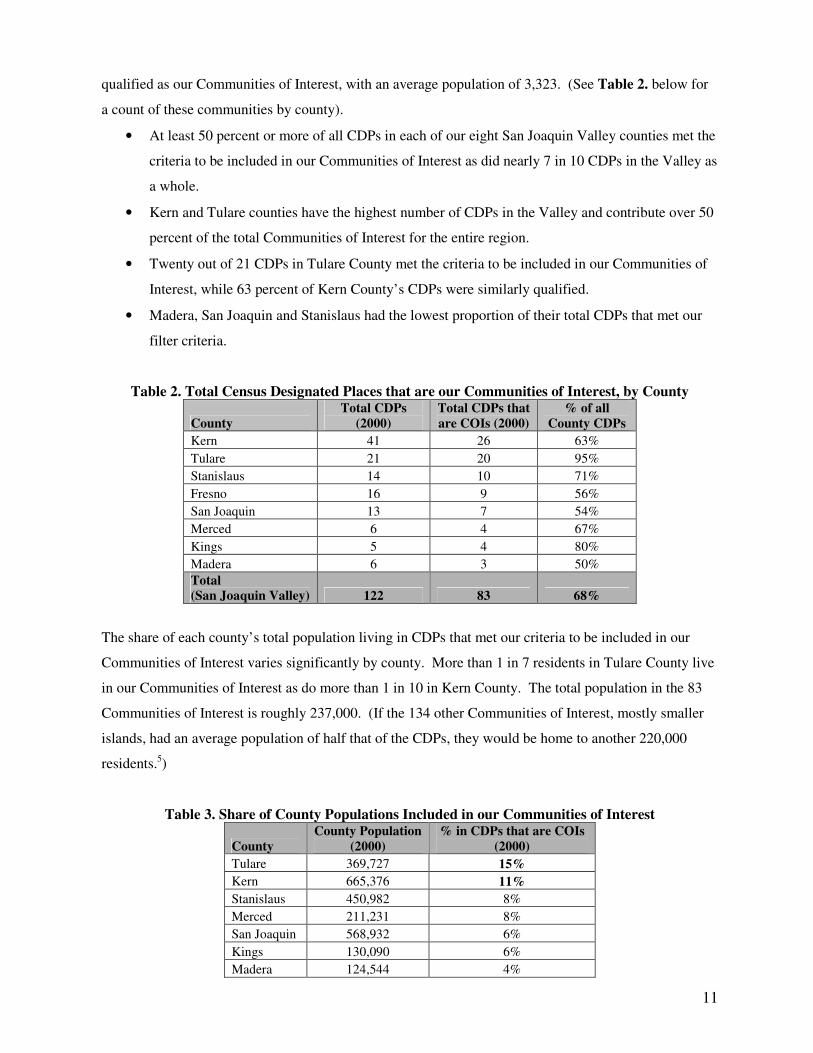
qualified as our Communities of Interest, with an average population of 3,323. (See Table 2. below for
a count of these communities by county).
• At least 50 percent or more of all CDPs in each of our eight San Joaquin Valley counties met the
criteria to be included in our Communities of Interest as did nearly 7 in 10 CDPs in the Valley as
a whole.
• Kern and Tulare counties have the highest number of CDPs in the Valley and contribute over 50
percent of the total Communities of Interest for the entire region.
• Twenty out of 21 CDPs in Tulare County met the criteria to be included in our Communities of
Interest, while 63 percent of Kern County’s CDPs were similarly qualified.
• Madera, San Joaquin and Stanislaus had the lowest proportion of their total CDPs that met our
filter criteria.
Table 2. Total Census Designated Places that are our Communities of Interest, by County
County
Total CDPs
(2000)
Total CDPs that
are COIs (2000)
% of all
County CDPs
Kern 41 26 63%
Tulare 21 20 95%
Stanislaus 14 10 71%
Fresno 16 9 56%
San Joaquin 13 7 54%
Merced 6 4 67%
Kings 5 4 80%
Madera 6 3 50%
Total (San Joaquin Valley) 122 83 68%
The share of each county’s total population living in CDPs that met our criteria to be included in our
Communities of Interest varies significantly by county. More than 1 in 7 residents in Tulare County live
in our Communities of Interest as do more than 1 in 10 in Kern County. The total population in the 83
Communities of Interest is roughly 237,000. (If the 134 other Communities of Interest, mostly smaller
islands, had an average population of half that of the CDPs, they would be home to another 220,000
residents.5)
Table 3. Share of County Populations Included in our Communities of Interest
County
County Population
(2000)
% in CDPs that are COIs
(2000)
Tulare 369,727 15%
Kern 665,376 11%
Stanislaus 450,982 8%
Merced 211,231 8%
San Joaquin 568,932 6%
Kings 130,090 6%
Madera 124,544 4%

12
County
County Population
(2000)
% in CDPs that are COIs
(2000)
Fresno 804,342 1%
d. Identifying Additional Unincorporated Communities with Public Documents and Key
Informant Interviews
For a number of reasons, the U.S. Census may fail to identify all unincorporated communities that are
known to exist. Therefore, we utilized public documents from local government agencies as well as
interviews with key informants who live or work in three of these counties.6 Utilizing all the research
methods described above for three of the counties, we have identified a total of 219 Communities of
Interest for the San Joaquin Valley, and a number of additional ones will likely be added once the public
documents and advisors in the five other counties have been utilized.
III. Spatial, Demographic & Housing Characteristics of Communities of Interest
The eight counties that make up the San Joaquin Valley show significant variation in the number of their
residents that live in unincorporated areas, the spatial distribution of those areas within the counties
themselves, and their demographic and housing characteristics. Because the Census Bureau does not
collect data on unincorporated areas other than officially recognized Census Designated Places (CDPs),
the demographic and housing data reported in this section only refers to the 83 CDPs identified in the
2000 Census. There is no publicly available data on islands or unincorporated fringe and hinterland
areas that were not recognized by the U.S. Census Bureau as of April 1999.
a. The Spatial Distribution of Unincorporated Communities within Counties
The number of Communities of Interest identified for each county in the Valley varied considerably,
from a high of 64 in Tulare to a low of 4 in Madera. Fresno, Kern, San Joaquin and Stanislaus (the four
most populous counties in the region) had the next highest number of Communities of Interest, ranging
from 27 to 35. (See Table 4. below).
Table 4. Total Communities of Interest by Spatial Geography: Island, Fringe and Hinterland County Islands Fringe COIs
(within an SOI)
Fringe COIs
(outside an SOI)
Hinterland
COIs
Total COIs
Fresno 24 * 4 7 35
Kern 9 2 5 19 35
Kings 7 N/A 2 2 11
Madera 1 N/A 2 1 4
Merced 6 * * 4 10
San Joaquin 20 6 * 1 27
Stanislaus 23 4 3 3 33
Tulare 28 * 7 29 64
Total
(San Joaquin Valley)
116 12 23 66 219

13
A more detailed county-by-county analysis will be available soon, but a few facts illustrate the
considerable variation:
• Tulare (29) had the highest number of Communities of Interest located in areas distant from
cities (hinterlands), followed by Kern (19) and Fresno (7).
• Tulare had the highest number of Communities of Interest (28) circumscribed within the
boundaries of cities (islands) followed by Fresno (24), Stanislaus (23) and San Joaquin (20).
• Given its total population size, Kern County has relatively few islands in its cities. Bakersfield
contains 6 of the county’s 9 total islands.
• Fresno’s unincorporated communities tend to be smaller on average than the communities in
other counties.
• The unincorporated communities are highly Latino, White or a mix of both. Although currently
African-American and Asian populations are relatively smaller percentages of these
communities, historically both groups have faced similar challenges in the San Joaquin Valley.
For example, in the early in the 20th Century Allensworth, a predominantly African-American
town faced significant discrimination in efforts to secure water. The unincorporated settlements
of Allensworth (Tulare)7, Home Garden (Kings)8, Fairmead (Madera), Easton (Fresno), all have
significant number of African American residents.
A summary of racial composition, income, housing and other demographic characteristics of the
colonias will be provided at the November 27th convening. A few more basic facts are outlined in the
following charts.
Table 5. Racial and Ethnic Composition County CDPs that are
COIs
Greater than
65% Latino
Greater than
65% White
Latino-White (neither
group over 65%)
Kern 26 4 19 2
Kings 4 2 0 2
Madera 3 2 1 0
Fresno 9 5 1 3
Merced 4 3 0 1
San Joaquin 7 1 0 4
Stanislaus 10 3 2 5
Tulare 20 15 2 3
Total
(San Joaquin Valley)
83 35 25 20

14
Table 6. CDP Poverty Rates, 2000 County CDPs that are
COIs
# CDPs with
Poverty Rates > County
CDPs with Poverty
Rates 150% County Rate
CDPs with Poverty
Rates 200% County Rate
Kern 26 9 5 1
Kings 4 4 2 2
Madera 3 2 1 1
Fresno 9 7 1 0
Merced 4 4 2 0
San Joaquin 7 5 4 2
Stanislaus 10 9 5 3
Tulare 20 19 10 1
Total
(San Joaquin Valley)
83 59 30 10
IV. Documenting Conditions in the Communities
It is easy to define the Communities of Interest as low-income, but more difficult to systematically
document the local conditions in which residents live. The responsibility for providing basic
infrastructure to these communities is divided among a great number of providers who have little
incentive to document the shortcomings of their services, or to contribute any data to a more
comprehensive assessment. Most reports commissioned to document the challenges faced and
responses to the variety of ills (e.g., high levels of poverty, poorer health, environmental problems, etc.)
facing the San Joaquin Valley do not include a specific focus on conditions in unincorporated
communities, especially our Communities of Interest. Though the broad social and economic disparities
that our Communities of Interest contend with, as well as the gaps in infrastructure provided to these
communities, are common knowledge among residents and public officials, the lack of comprehensive
data systematically documenting the state of Communities of Interest in the San Joaquin Valley, means
that from a policy standpoint the urgent needs of Communities of Interest are virtually invisible.
One exception to the dearth of systematic documentation of infrastructure deficits was the evidence
presented in the lawsuit CRLA and the Lawyers Committee for Civil Rights brought against the City of
Modesto, Stanislaus County, and the Stanislaus County Sherriff. Working with organized resident
leaders in unincorporated islands, the lawyers documented serious infrastructure deficits, including: the
lack of sidewalks and street lights, inadequate sewage disposal and storm drainage, lack of curbs and
gutters, poorly kept roads and inadequate traffic control mechanisms that have lead to increases in
incidents of pedestrian harm; and evidence of lower levels of municipal services including solid waste
and bulky garbage pick-up and spotty emergency service response. Another significant area of systemic
documentation and advocacy has been in the area of water in Tulare County – as sited in Section 4
below, on Water.

15
Almost all research on our Communities of Interest cites infrastructure and service deficits as consistent
challenges for colonias or unincorporated communities. [As Mukhija and Monkkonen wrote about the
border colonias, “another key, and easily apparent, deficiency in almost all the colonias is the lack of or
shortage of paved roads, sidewalks, gutters, storm drains, and streetlights.”9] Anecdotally, one can find
articles about specific roads, “blighted” neighborhoods, sewage overflows, garbage collection, etc., but
systematically, no data is available. We can infer trends from anecdotes, but real work needs to be done
to methodically collect and synthesize conditions information.
In the absence of a lot of place-specific government data or independent research that pertained to all
kinds of Communities of Interest, we began with a search of the press and other public sources of news
and information. A preliminary literature review of local news papers and research focused on key
social and economic challenges for the San Joaquin Valley has led to a sizeable collection of anecdotal
evidence that the Communities of Interest suffer major gaps in basic infrastructure supports (e.g., water,
sewage, solid waste disposal, housing, roads, and emergency response services, etc.). These are
summarized in the sections that follow, beginning with a few extended quotations about three places.
In Tulare:
“As the sun rose over the majestic Sierra Nevada mountain range, the radiant light
illuminated a long forgotten subdivision in southeast Porterville surrounded by decaying buildings, rotting infrastructure, and a deep-seated poverty. The subdivision, located
within the Porterville Redevelopment Project Area is at the physical core and economic fringe of the city, which had become a place known for drugs, crime, and vagrants. Property values continued to plummet as the area surrounding the subdivision, which is
bounded on the south by the Tule River, had become a dumping ground for refuse, drug paraphernalia, and a habitat for the homeless. 10”
In Fresno:
“Today, halfway between Hollywood and the Golden Gate Bridge, in the shadow of America's richest farms, their tarpaper shacks rise out of fields of salt and tumbleweed.
The old migrants and their children, a lost tribe of Black Okies, pass their last days in some of the worst poverty in the nation. Their broken piece of the promised land sits in exile from the rest of the state, a scattering of country churches and crooked huts that seem lifted straight out of the plantation South.11”
In Stanislaus:
“The gangs and the garbage heaped in yards persist, despite a decade-long campaign by
Martinez (resident) to better the neighborhood. The troublemakers are still around, as are vicious-looking dogs. 12”
“The tiny, run-down downtown Salida house Carla Morgan inherited from her mother
put a roof over her head, but not much more. “We haven't had any heat for three years”…
“We turn on burners on top of the stove to heat up the house.” The 1945-vintage two-bedroom, one-bath home is too dilapidated to repair, and it's considered a fire hazard.

16
Electrical wiring in the 800-square-foot house is antiquated. Cabinets are coming off the walls, and the garage burned down a few years ago.13”
“They come to school with very poor shoes – hand-me-downs that are a size too small or
two sizes too big,” (Principal) Dittman said of the 500 students in his school. “Whatever is handy.14”
a. Economic Status
Poverty in the San Joaquin Valley can be so extreme that it is often compared to that in the Appalachian
region.15 Although the media coverage/research of conditions in the San Joaquin Valley is far less
extensive than that in Appalachia, the poverty is greater; a Congressional Research Service Report in
2005 found that per capita income in San Joaquin Valley was lower than in the 68-county Central
Appalachia region.16 The root of this kind of poverty in the Valley is said to be “high unemployment,
low wages and an undereducated work force.”17 Statistics on unemployment in parts of the Valley are
staggering; the juxtaposition of incorporated to unincorporated communities shows an unmistakable
disparity to which only numbers do justice. While the unemployment rates for Tulare County’s three
largest cities in June 2007 remained between 5.2 percent and 7.8 percent, in remote or unincorporated
parts of the county, in Alpaugh, Cutler, Earlimart and Strathmore, unemployment averaged between 22
to 25 percent.18
Youth in the San Joaquin Valley fair no better, as the Valley sends “far more of their juvenile
delinquents per capita to the California Youth Authority than other California counties,” due to counties’
lack of financial ability and capacity to create effective juvenile justice systems.19 Twelve percent of
youth age 16-19 the San Joaquin Valley are unemployed and not in school, compared to 10%
statewide.20 Children in the San Joaquin Valley are least likely in the Central Valley to attend preschool
and have the largest average class sizes.21 According to a 1999 Fresno County study on child-care
needs:
“The unincorporated community of Biola looks like a model for much of rural Fresno County when it comes to child care: The demand is high. The supply is limited. “We have so many parents that work in the fields, so many that need day care.” The problem is pervasive, according to a 1999 Fresno County study on child-care needs: “Lack of facilities and providers as well as lack of transportation contribute to the limited accessibility to child care in rural and unincorporated areas.”22
b. Infrastructure Deficits and Service Disparities
1. Gutters, Drainage, Sidewalks, Curbs
In 2005, the Fresno Bee documented that certain streets in Calwa (fringe), in Fresno County flooded 6-8
inches when it rained, due to lack of sidewalks, curbs and gutters. Although residents were able to
fundraise and receive grants for some sidewalks, they are anomalies in this unincorporated area.
“Vanessa Cortez, 11, said she is excited that Kaviland Street is finally going to have sidewalks and

17
curbs. She said she doesn't like walking to school on rainy days because ... the street has a lot of puddles
and they're really big,” said Vanessa, a sixth-grader at Calwa Elementary School.”23
Standing Pools of Water
Stagnant pools of water caused by the absence of gutters and curbs, or because generally vacant property
has gone wild, are all too common in Porterville, Tulare County. (The example comes from an island
only recently annexed into the city.) The fear of contracting West Nile virus – generally contracted
through mosquito bites – is heightened because mosquitoes are attracted to the pools of stagnant water
and there is little mosquito abatement in Porterville.24
2. Street Lighting
In many unincorporated communities, adding street lighting is viewed as a way to reduce residents’ fear
of crime in their neighborhoods. In southwest Modesto’s Paradise South (island or fringe), an area of
higher crime, residents believe that if streetlights were installed it would prevent criminals from
“lurking,” aid traffic safety and increase pedestrian traffic.25 The lack of street lighting has been
identified as a built environment barrier to health, as it decreases the likelihood that residents will be able
to walk and engage in other forms of exercise in the evening after work. .
Residents can sometimes opt to pay for street lights on their streets, when feasible, but still do not always
receive adequate maintenance services. Residents have paid taxes to install and maintain streetlights in
the high-crime Franklin-Beachwood area (unsure of location, but a CDP) of Merced County, but one
resident claims that the county has failed to regularly change light bulbs (less than once per year) and he
“feels like the county has forgotten about his neighborhood” through its negligence. 26
3. Roads
Unsafe, smaller roads and inadequate traffic enforcement for both speeding and driving under the
influence of alcohol and drugs plague rural roads in unincorporated parts of the San Joaquin Valley.27 In
some areas of Fresno County high-growth “traffic levels exceed what the roads were built to handle” and
two lane roads with no medians make head-on collisions more likely.28 Narrow, poorly constructed
roads in unincorporated areas “that don’t meet safety standards and (have) limited traffic enforcement,”
lead to dozens of fatal car crashes per year.29
In Tulare County heavily-traveled, pothole-littered roads in “many of these unincorporated communities
have not seen a road grater for 40 years” as stated by Chairman Allen Ishida of County’s Board of
Supervisors.30 It will take an estimated 30 years to improve these sorts of roads in Tulare County.31

18
Porterville’s, South Indiana Street (was an island), “populated by potholes and alligator-striped concrete”
has only recently been annexed into the City of Porterville. However, the City doesn’t have the funding
to complete this road project despite Mayor Hamilton’s statement that it is a “really bad street. On a
scale of 1 to 10, I’d give it a good 8.”32
4. Water
Potability / Access to Drinking Water
Water access and potability are areas that have the most data in the San Joaquin Valley – whether due to
pesticide runoff, proximity to dairies and nitrate contamination, or simple fact that most of the residential
water is supplied through groundwater. The water issue has been the most extensively studied, due in
large part to non-profit water activists’ concern about drinking water (See Community Water Center,
Environmental Justice Coalition for Water), agribusiness/farmers’ water concerns (See Great Valley
Center, California Farm Water Coalition), and more broadly, droughts and global warming. Thus, we
will not try to replicate their work, but rather give a snippet of the picture.
Laurel Firestone and Susana De Anda began the Community Water Center in 2004 as an outgrowth of
work begun by the Rural Poverty Water Project at the Center on Race, Poverty & the Environment
(CRPE).33 In Tulare County, various unincorporated communities, like Cutler-Orosi, Tonyville, and
Alpaugh) deal with toxic levels of nitrates, arsenic, and spill-over sewage in their residential water. This
is due to the fact that over 90% of the communities in the Central Valley rely on groundwater for
drinking water and 73% of the nitrate drinking water violations in the state are in the Southern San
Joaquin Valley, which is also home to the same percentage of the state’s dairy cows.34 “Nitrates can
come from fertilizers, septic systems and animals, and can occur naturally” and they all exist in the
unincorporated areas in Tulare.35 The groundwater in some of these communities is unsafe to drink and
“residents drive 30 to 50 miles each week just to buy bottled water, effectively doubling the price for this
basic need.”36 This is not unique to Tulare; in Fresno County, an ordinance dealing with the proximity
of dairies to cities and unincorporated areas has raised public health concerns about the inadequacy of
buffer zones.37 And, although non-profit organizations like Self Help Enterprises38 do important
advocacy work and help update and replace water infrastructure components, the systemic issues remain
deeply rooted.
5. Sewage
Many communities in unincorporated California have private septic tanks instead of connections to
sewer lines.39 When septic tanks overflow, due to poorly maintained structures, high levels of rain, etc.
the overflow of waste invades homes, streets and neighborhoods with health hazardous, foul smelling
matter.40 Although the court did not agree that there was evidence of discrimination in Committee

19
Concerning Community Improvement v. Modesto, U.S. District Judge Lawrence O'Neill stated that:
“Plaintiffs do live in poor conditions, including failing septic tanks. The county and the city have put
unincorporated islands in a difficult situation. ... It is further undisputed that most of Rouse-Colorado and
Hatch-Midway (neighborhoods) are in need of new or upgraded sewer systems.”41 Residents believe
that linking the sewer system should be the top priority for Stanislaus County.42
6. Garbage Collection
Illegal dumping of large items in unincorporated areas has been a highly publicized problem. But the
problem is rooted in the services provided/absent and the cost of those services. In Fresno County,
residents and officials say that “people who illegally dump their trash typically can't or won't pay for
garbage service,” that the difficulty of disposing of bulky items contributes to the problem, and that in
the past two years “the rates in some of the unincorporated areas have nearly doubled.”43 In Stanislaus
County, unincorporated community residents are considering paying a fee to have a biannual bulk trash
pick up – although certain types of bulk trash will still need to be dumped at a special site.44 On a
different scale, in South Modesto (island or fringe) , Stanislaus County, residents and the Neighborhood
Watch Group collect garbage – tires, broken furniture, etc. – to help instill a sense of pride and
community in their neighborhood.45 Although the problem is larger than the physical landscape,
residents see the clean-up as a “first step toward eliminating the crime plaguing (the) neighborhood,” but
that residents “must do it ‘on (their) own.’”46
7. Crime (See also: Street Lighting and Roads)
Neighborhood Watch groups, like that mentioned in the previous section on Garbage are not uncommon
throughout the state. But the South Modesto Neighborhood Watch patrols along with the sheriff’s
department, as there are too few deputies overall in the county, leaving even fewer for the
unincorporated areas.47 Fearing an increase in the number and violence of the crime in South Modesto,
residents hesitantly join the Neighborhood Watch, despite their fears of retribution from gangs and other
criminals.48 In terms of domestic violence crimes, Fresno County had “5,641 (calls to the domestic
violence hotline) in the city of Fresno…and 927 in the unincorporated areas of the county,”49 – showing
another form that violence takes in some unincorporated communities.
8. Fire
In unincorporated areas of Fresno County, fire stations are located “farther apart from one another, (than
in the cities) increasing response times” and increasing the cost of home insurance due to reduced fire
coverage.50 Parallel circumstances are found in Stanislaus’ unincorporated areas of rural land on the
fringes of the county boundaries. Residents “can't expect timely responses to fires” and “most

20
departments have substandard stations and equipment, including engines and trucks.” In Stanislaus, the
disparity is between the urban areas (largely incorporated) and rural areas (largely unincorporated).51 In
Tulare, the Fire Department has an agreement with the County to deal with some of the fires in
unincorporated areas. However, responses to these calls take much longer than in the incorporated parts
of the county.52 In terms of ambulance services, Board of Supervisors Chairman Allen Ishida of
Lindsay, Tulare County “said his concern is the unincorporated county territory and smaller cities that
don't have on-the-spot (on-site emergency) ambulance service” and the community wants to get services
to some areas that don’t have any currently.53
In a conclusion to this section, it is critical to underscore the importance of developing a strategy to
assess and document current conditions has surfaced as key objective for any new advocacy strategy to
improve the basic infrastructure of Communities of Interest in the San Joaquin Valley. As noted earlier,
good data and research about social and economic disparities facing different racial and ethnic groups in
the San Joaquin Valley; however this data is rarely organized to illustrate the spatial/geographic
dimensions of poverty. Fifty-nine of the 83 Communities of Interest we identified through this research
have considerable higher rates of poverty than the counties in which they sit. Meanwhile, the rate of
poverty in 30 of the Communities of Interest are 150% and 10 are 200% higher than overall poverty rates
in their respective counties.
We believe that our advocacy efforts would benefit greatly from meta-analysis research that would
combine relevant findings in existing research with a place based assessment of the relationship between
higher levels of poverty and the infrastructure deficits in Communities of Interest as a whole. The
perspectives shared by the Community Advisory Committee through this project could prove to be an
invaluable in first step in an effort to more systematically describe the state of infrastructure in the San
Joaquin Valley’s colonias. The strategy used in counties like Imperial that are able to tap Federal grant
dollars designated for Colonias could be used to develop a baseline picture of needs. In 2002 Imperial
County used a State of California Community Development Block Grant (CDBG) grant to develop a
Colonia Master Plan54 that includes a description of needs, estimated costs and timetables for
recommended improvements related to infrastructure, services and supportive community issues.
Imperial County drew on quantitative (GIS and Census) and qualitative research methods (e.g.,
interviews with residents and staff of key agencies) to inform the plan. The Colonia Master Plan
addressed the following specific areas for each colonia: water, sewer, refuse/solid waste, electrical
service, natural gas, street lighting, telephone, cable, streets/roads/bridges, safety services, schools,
parks, housing, retail/commercial, and social services.

21
V. Identifying Approaches for Combined Action, Targets for Engaging the System
of Governance & Public Finance in Support of Infrastructure Improvements
The challenges facing residents in our Communities of Interests are deeply entrenched and complex.
Tackling them will require effective and sustained advocacy to make the infrastructure needs of our
colonias a priority in decision-making bodies at the local, regional, and state levels. The starting point
for developing an effective advocacy strategy is getting clarity on:
• the problems or barriers we seek to address
• the policy and institutional practices that can be changed or harnessed to help us achieve our
goals
• the resources and allies we can count on to advance our advocacy efforts, and
• the opportunities and challenges that are likely to affect our chances of success.
In the previous sections of this paper we sought to begin defining the barriers and problems that severely
limit the quality of life in our Communities of Interests. The principal purpose of this section is to
present the project participants with an “initial cut” of the challenges and opportunities we are likely to
encounter as we advocate for strengthening infrastructure supports in unincorporated islands, fringe, and
hinterland communities.
Apart from a host of organizational and tactical questions that will need to be taken up by resident
leaders and their allies (e.g., what form the advocacy group will take and from what tools, litigation,
grassroots organizing, community development, it will draw on), our initial policy analysis has surfaced
two inter-related structural challenges, regardless of the infrastructure deficits we seek to address (water,
sewage, energy, roads, storm drainage, housing, and etc.). They are very basic – governance and
money.
a. The Structure of Government: Barriers & Challenges:
As grassroots leaders and civil rights lawyers can attest, the current maze of governmental agencies with
responsibility for providing basic services in Communities of Interest make it difficult to determine what
agency(ies) to hold accountable for addressing infrastructure deficit(s). In the language of community
organizing, who is the “target,” the decision-maker(s) who can give us what we demand? All other
agencies and services aside, according to our research, as of 2000 there were a total of 586 special
districts providing basic infrastructure services to the eight counties in the San Joaquin Valley. Special
district services include sewage, water, fire protection, pest abatement or cemetery management,
etc.55 In 2004-2005, 57 multi-functional or specialized service districts were providing infrastructure

22
services to Communities of Interest in just the three counties that we examined in more detail (14 in
Stanislaus, 16 in Fresno, and 27 in Tulare). Among these 57 agencies were eleven different types of
service districts.
Given the large number of possible “targets” (each with their unique histories, governance structures,
and leadership) that would need to be engaged, it is not surprising that advocacy and litigation strategies
to improve infrastructure supports have focused on multiple targets. For example, the recent lawsuit on
behalf of residents in unincorporated Stanislaus County focused on three providers—the County, the
City of Modesto, and the County Sherriff—that lawyers argued were principally responsible for
providing services to residents. Meanwhile, the community-lead campaign to restore safe drinking water
to Alpaugh at the beginning of the decade required the engagement of the two special districts that
provide water services, the state, and several other local institutions.
According to leading researchers (Olmstead56 and Ward57) money is a key factor in the enduring
infrastructure deficits in colonias. More specifically, city governments are reluctant to annex
neighborhoods whose infrastructure and municipal service needs exceed the resources that can be
collected through property taxes and other levies (e.g., special assessments). If this is true, it will be
difficult to use annexation as a strategy to improve infrastructure support for Communities of Interest
because the LAFCO processes give cities and counties virtual veto power over decisions about
annexation and incorporation. For example, before the LAFCO’s executive officer will issue a
certificate of filing (for special election on annexation) proponents must negotiate the allocation of
property tax revenues with the city, county, and affected special districts involved. An agreement among
these parties is a precondition to a LAFCO hearing on an application for annexation. As a result,
although only residents of the proposed territory have a right to vote in the special election on the issue
of annexation, the steps leading to this election are stacked against the residents. These policies have
made it possible to block annexation proposals from unincorporated neighborhoods that are viewed as
revenue drainers rather than revenue producers.
The situation with incorporation would require residents in our Communities of Interest to overcome
similar hurdles, because any strategy to use incorporation presumes that the residents of the residents
have the resources to support the new city’s various municipal service functions. This seems less likely,
or at least less widely applicable, as an option. In fact, much of the haggling that takes place in an
incorporation process is between proponents of the new city and the county that is reluctant to give up
the tax revenues of an unincorporated territory made up of fairly wealthy homeowners. The requirement
that incorporation of a new city be revenue neutral for the county involved provides considerable
leverage to counties.
23
Special districts are also reluctant to take on costly projects for small areas. This is because securing
bond financing hinges on the ability of rate payers (low-income residents in the Communities of Interest)
to accommodate substantially higher rates in order to pay debt service on the bonds that would fund the
infrastructure improvement projects. According to Olmstead, who has studied the factors that determine
who gets access to water service in the border colonias, “for every $1000 increase in per capita income, a
colonia’s probability of water service increases by 2.3%.”58 Olmstead also found that service providers
who were not subject to rate regulations (designed to keep rates low) are more “proactive in providing
water services to colonias” than municipalities and counties.59 Finally, Olmstead found that price
regulations reduce the likelihood of obtaining services by 27% in colonias.60
Given these formidable structural challenges, what are the strategies for finding new public capital and
operating funds for unincorporated communities, and how can we emphasize solutions that are more
than a “zero-sum game” within local governments? The Alpaugh case demonstrates the value of looking
beyond the immediate governance and special district structures to engage state and other public
agencies. Focusing organized community leadership on the goal of leveraging new resources from the
state, and collaboration among small service districts toward this end, may be important avenues to
pursue.
b. Policy Strategies & Levers:
Because of the public finance challenges and the extreme fragmentation of local government authority
and decision-making with regard to unincorporated communities in the San Joaquin Valley, the policy
responses to infrastructure and service deficits will differ for communities with different structural
characteristics and for communities with different political/historical circumstances.
Our research and discussions with policy experts suggest a number of possible levers for change in the
system of governance. Some of these have been addressed by recent research, lawsuits, legislation or
organizing campaigns, but to our knowledge there has not been a comprehensive or widely shared
discussion of their future prospects. Some may pertain only to certain types of communities, or to a
limited number of counties, while others may be relevant to a state-level strategy. At least nine broad
categories of areas for action have already been raised in the early months of this project. We
summarize these approaches along with key questions as inputs for the strategic discussion on November
27th:
1. Annexation and Incorporation, to provide the services of city government to unincorporated
areas. What are the prospects of developing a viable advocacy strategy to remove the built-in
barriers to annexation or incorporation of Communities of Interest? Would our approach be to
24
use a litigation as a tool to challenge LAFCO actions that limit the percentage of annexation
elections in unincorporated neighborhoods that are predominantly low-income vs. those that are
wealthy; or is it best to use the racial make up of the neighborhoods as the key consideration?
Are there other leverage points that are further upstream that we can exploit? For example, in
addition to serving as the key regulatory body on the annexation process, LAFCOs are charged
with the task of establishing the “spheres of influence” that serve to define the primary area in
which a city will encourage urban development. Can leaders and allies of our Communities of
Interest work with local smart growth advocates or those who oppose sprawl to encourage
LAFCO’s to prioritize the annexation of island and fringe Communities of Interest as a strategy
to preserve agriculture and open-space lands (one of the key points that is considered in “sphere
of influence” determinations).
2. Improvement of the practices, performance and accountability of community service
districts and special districts. What advocacy strategies could we use to ensure infrastructure
and services CSDs and other special districts provide Communities of Interest with the
basic/minimum standards in charters or service goals set by governing bodies? How might a
litigation strategy be enhanced by including additional deep pockets as parties to lawsuits against
service districts? For example, would including agricultural interests who are largely
responsible for contamination of ground and surface water in Communities of Interest adjacent
to farm land in lawsuits related to water services be a viable option (especially given the fact that
some local farmers are members of the governing boards of the special districts?)
3. Taking a different tactic, are there new approaches to address the public finance challenges
faced by Community Service Districts? Could regional CSA’s that include several or all
unincorporated communities in the pool of rate payers Wall Street financers used to determine
the viability of a bond deal to finance infrastructure improvement projects make a difference?
Could the adoption of variable rates based on usage in CSDs that serve residents in Communities
of Interest and agribusiness help to raise enough revenue to qualify for the bond financing
needed to complete water related infrastructure projects? What advocacy strategies could be
used to leverage new public capital and operating funds for unincorporated communities; and
how can we emphasize solutions that are more than a “zero-sum game” within local
governments?
4. Improvement of the practices, performance and accountability of the agencies of county
government. Although this paper has emphasized the complexity of determining what public
entity to hold accountable for various infrastructure deficits in Communities of Interest, the

25
County Board of Supervisors are responsible for overseeing services to county residents in cities
and in unincorporated areas alike. What advocacy approaches could be used to secure a
commitment to improve services provided to Communities of Interest by county government?
5. Using local and county general plans, as well as plans for housing, transportation and
capital improvements, as vehicles for securing adequate infrastructure for unincorporated
areas. Although existing Community Development Block Grant money could be used to fund
infrastructure improvements in our Communities of Interest, at the present moment resident
leaders do not have enough power to successfully compete with other interests groups that are
vying for these resources. What new framing and advocacy messages could help the build
alliances needed to impact planning and decision-making? For example, could connecting the
infrastructure needs of island and fringe Communities of Interest to the advocacy agenda of
anti-sprawl and smart growth advocates through a “fix it first” strategy in general plan
discussions about growth work? Would emphasizing the threat posed by the high percentage of
Communities of Interest residents that rely on aging and leaking septic tanks to ground water
that supplies all city and county residents (and the greater costs associated with cleaning up
contamination) help to broaden support proposals to spend city and county funds to connect
Communities of Interest to the municipal sewer system?
6. Using existing federal and state civil rights laws to document patterns of disparate inputs
and outputs in Communities of Interest that have higher populations of color than the
region as a whole. What additional documentation would we need to support litigation or
legislative advocacy on disparate access to basic infrastructure supports?
7. Using regional planning and governance entities to address the needs of low-income
unincorporated communities. Our research and discussion with policy experts surfaced a
number of regional planning efforts aimed at improving social and economic conditions in the
San Joaquin Valley. Some of these are led by government agencies; while others feature
collaboration between government, business, and community leaders. For example, the
California Partnership for the San Joaquin Valley’s Land Use, Agricultural and Housing Work
Group presented a Strategic Action Proposal that was adopted in September 2006; this proposal
included Principles for a Sustainable San Joaquin Valley that specifically called for “new growth
to be located in or adjacent to existing communities whenever possible.” What advocacy and
partnership strategies could be used to put the infrastructure needs of Communities of Interest on
the radar screen of these efforts? What would it take to enlist the leadership and support of these

26
regional planning and leadership bodies in our efforts to improve infrastructure supports in
island, fringe, and hinterland Communities of Interest?
Since its inception, the Inter-Agency Taskforce for the Economic Development of the San
Joaquin Valley has secured $150 million, over and above regular, formula, and state pass-
through funds for these initiatives. After conducting listening sessions with economic
development leaders in seven counties, the Taskforce adopted a Strategic Plan with four
initiatives: 1) Jobs/Business Development, 2) Clean Air/Clean Energy, 3) Asset Development,
and 4) Rural Infrastructure. The Taskforce had on its drawing board in 2005 a pilot program to
improve funding for water-related infrastructure by organizing rural water districts through joint
powers agreements. What are the prospects for full realization of this objective, and how much
of the problem would it solve? What would be the best vehicle for the long-term implementation
of the Taskforce’s other plans?
Finally, San Joaquin Valley agricultural interests are using regional organizing and advocacy
strategies to ensure their water needs are addressed by the State. For example, the California
Rural Water Association, the San Joaquin Valley Water Coalition, and several major water
districts (e.g., the Westlands Water District) have played key roles in garnering support for the
2006 water bonds and are working with the Governor to secure a new State water policy that
will ensure Central Valley agribusiness’s water needs are met. What lessons can infrastructure
equity advocates learn from these successful efforts? What new opportunities for forming
unusual bedfellows alliances with these water coalitions, given the challenges Central Valley
Agricultural interests will face in securing a majority in a Democratically controlled legislature.
What role could the Latino Caucus, with strongholds across the state, play in positioning the
infrastructure needs of Colonias in the policy deliberations to develop a statewide water policy?
8. Accessing additional state funding for infrastructure and other aspects of capital
development. In 2006, voters approved close to $43 Billion worth of bonds to address
infrastructure needs ranging from: housing, transportation, school facilities, parks, water and
flood protection, and disaster preparedness. What advocacy strategies could be used and what
decision-making bodies would we need to target to tap portions of these bond dollars for
critically needed infrastructure improvement projects in Communities of Interest? Proposition
84, for example, contains: $10 million for grants to fund emergency grants to provide alternative
water supplies where necessary to protect public health, $60 million to make grants and loans for
projects to reduce contamination of groundwater that serves as a source for drinking water, and
$180 million for grants for small community drinking water infrastructure improvements.

27
Administration of these grant and loan programs has been given to the State Department of
Health Services. What advocacy and partnership strategies could be used to facilitate access to
these resources among the special districts and municipal infrastructure service providers in
Communities of Interest? Similarly, in what ways could an expanded alliance dedicated to
improvement of infrastructure supports in Communities of Interest help to channel bond dollars
for housing, parks, school facilities, roads, and etc toward this goal?
9. Exploring the advantages of pursuing some form of state or federal designation as colonias,
for purposes of funding, other support, special development regulations, or other policies. As
noted earlier in this report, the ability to leverage federal and state resources has made it possible
for counties that are within 150 miles of the border to launch and sustain Colonia improvement
projects. Would a state designation of “Colonias” in the San Joaquin Valley help counties and
special districts leverage additional state dollars to launch and sustain similar projects? What
other opportunities would emerge from this strategy? For example, how might new state
resources help non-profit housing developers leverage municipal and private dollars needed to
finance infrastructure improvements in Communities of Interest?
If the convening on November 27th makes progress on many of these questions and opportunities for
action, or raises others of equal or greater importance and relevance to the participants, it will have
been a major step in the movement to improve the lives of residents of these communities.

28
Endnotes
1 Mukhija, V., Monkkonen, P., What’s in a Name? A Critique of “Colonias” in the United States, International Journal of Urban and Regional Research, June, 2007. 2 State of California, Department of Finance, E-1 Population Estimates for Cities, Counties and the State with
Annual Percent Change — January 1, 2006 and 2007, Sacramento, California, May 2007. 3 The only method for identifying islands within our 8 San Joaquin Valley counties is through reviewing public documents and publicly available GIS maps including: Local Area Formation Commission (LAFCO) maps of current city boundaries; maps available from city and county planning or public works departments; city and county web-based GIS systems; and the U.S. Census Bureaus website, www.factfinder.census.gov. All islands identified to be located within a county are included as potential Communities of Interest in this analysis. Because islands are often very small and only partially overlapped by Census Block Groups, it is not possible to summarize in any systematic way their demographic and housing characteristics using data from the 2000 Census. Therefore
any ensuing reference to demographic or housing characteristics of unincorporated communities in this report
excludes all county islands. 4 Spheres of influence are created by county Local Agency Formation Commissions (LAFCO’s) typically based upon a petition by a local government agency, including special districts. As described in the California Government Code Section 56076, a sphere is a “plan for the probable physical boundaries and service area of a local government agency.” Once approved by a LAFCO, and depending on local rules and practice, a city may exercise influence over how development occurs in areas located within its sphere. This may entail reviewing building permits issued by the county for areas within the sphere, coordinating land use planning and collaborating on the creation of regulatory standards. 5 The exact population of each island has not yet been calculated, but it is clear that they are, on average, smaller than the CDPs. 6 Public Documents: Documents available from County LAFCOs as well as city and county planning departments were used to identify additional unincorporated communities missed in the 2000 Census. These additional unincorporated communities were only identified for Fresno, Tulare and Stanislaus counties. The primary communities identified through this method are those served by County Service Areas or Community Service Districts in Fresno and Tulare counties. Advisory Committee Informants: Advisory committee members who have helped guide and support this project identified local unincorporated communities that have recently emerged or have been missed in both Census data as well as local government documents. A total of 7 of these communities, all located in Tulare County, were identified through interviews with key informants. 7 The New York Times, March 7, 2007, A Piece of History Lands in a Contemporary Fight, Patricia Leigh Brown. 8 A. Gonzalez, M. Bengiamin, J., Home Garden Community Assessment, Central Valley Health Policy Institute, May, 2007. 9 Mukhija, V., Monkkonen, P., Federal Colonias Policy in California: Too Broad and Too Narrow, Housing Policy Debate Volume 17 Issue 4, 2006, Fannie Mae Foundation, p769. 10 Porterville Redevelopment Agency, www.calredevelop.org/AM/Template.cfm?Section=Home&CONTENTID=3706&TEMPLATE=/CM/ContentDisplay.cfm *Although Porterville was annexed recently and making improvements through the redevelopment agency since 2004, these extreme conditions still exist there and in other Communities of Interest. 11 Los Angeles Times, August 25, 2002, The Black Okies; A Lost Tribe's Journey to a Land of Broken Promises;
'Going to California' was the rally cry of black sharecroppers who traded one hardscrabble life for another in the
San Joaquin Valley, Mark Arax. 12 Modesto Bee, January 22, 2006, A Watchful Eye Focuses on Riverdale; Martinez and Company Reversed
Neighborhood’s Slide into Crime, Inga Miller. 13 Modesto Bee, February 24, 2006, Tapping Financial Resources; Funds Help Low-Income Families Build New
Homes or Repair Old Ones, J.N. Sbranti. 14 ***Quoted from Principal Bob Dittman of Empire Elementary, “a school where 85 percent of the students come from families living below the poverty level.”
29
Modesto Bee, October 1, 2005, Jumping Feet First Into Generosity for 4
th-Graders, Lorena Anderson.
15 “Appalachia, as defined in the legislation from which the Appalachian Regional Commission derives its authority, is a 200,000-square-mile region that follows the spine of the Appalachian Mountains from southern New York to northern Mississippi. It includes all of West Virginia and parts of 12 other states: Alabama, Georgia, Kentucky, Maryland, Mississippi, New York, North Carolina, Ohio, Pennsylvania, South Carolina, Tennessee, and Virginia.” http://www.arc.gov/index.do?nodeId=2 16 California’s San Joaquin Valley: A Region in Transition, December 12, 2005, Tadlock Cowan, Congressional Research Service. 17 The Modesto Bee, December 8, 2006, Suburbs among U.S. poorest: Sixth-worst ranking seen as in the making
for years, Garth Stapley. 18 Tulare Advance-Register, July 21, 2007, Jobless rate holds steady, George Lurie 19 Out of Sight Out of Mind: Central San Joaquin Valley Delinquents and the California Youth Authority, Nancy M. Richardson, 2001. 20 Assessing the Region Via Indicators: Education and Youth Preparedness, The State of the Great Central Valley
of California, Great Valley Center, February, 2004. http://www.greatvalley.org/pub_documents/2004_5_28_0_23_43_indicators_edu_report.pdf 21 Ibid. 22 Fresno Bee, May 21, 2001, Waiting for Care Rural Fresno County towns and cities open centers to ease limited
child-care options, Donald E. Coleman. 23 Fresno Bee, November 22, 2005, Calwa street gets improvements; Grant money will add sidewalks, gutters and
curbs to Kaviland, Kerri Ginis. 24 The Porterville Recorder, July 21, 2007, Pool breeds mosquitoes, fear of West Nile Virus, Sarah Elizabeth Villicana. The Porterville Recorder, August 4, 2007, West Nile virus on the Rise, Fear, Too Toll, Sarah Elizabeth Villicana. 25 Modesto Bee, November 26, 2005, Neighborhood Wants to End the Dark –Southwest Modesto Trying to Get
Streetlights Installed, Tim Moran. 26 The Merced Sun-Star, April 12, 2007, Merced Sun-Star Tip List: Residents weary of footing the bill for burned
out streetlights. 27 Fresno Bee, October 28, 2007, Rural Danger; Bee analysis finds most fatal crashes occur on narrower county
roads, Brad Branan. 28 Ibid. 29 Ibid. 30 The Porterville Recorder, July 17, 2007, Measure R funds break ground in Tulare: Project: Stretch of Road 96
the first to benefit, Sarah Elizabeth Villicana. 31 Ibid. 32 The Porterville Recorder, May 24, 2007, Residents decry condition of South Indiana Street, Aaron Burgin. 33 From www.communitywatercenter.org/our_history.html (accessed October 2007) 34 From www.communitywatercenter.org/The_Communities.html (accessed October 2007) 35 Visalia Times-Delta, August 5, 2006, Water woes plague rural areas, Jed Chernabaeff. 36 From http://www.communitywatercenter.org/files/On_Water_SF_op-ed.doc (accessed October 2007) 37 The Fresno Bee, September 21, 2007, Fresno County plan panel OKs new dairy rules, Dennis Pollock. 38 http://www.selfhelpenterprises.org/ 39 Mukhija, V., Monkkonen, P., Federal Colonias Policy in California: Too Broad and Too Narrow, Housing Policy Debate Volume 17 Issue 4, 2006, Fannie Mae Foundation, p768. 40 Ibid, p768-769. 41 Modesto Bee, May 28, 2007, Neighborhoods' History Factors In Lawsuit Ruling. ***The County is in the process of making improvements – but it seems only in response to the suit. 42 Modesto Bee, June 19, 2007, Lawsuit Questions County’s Priorities; Connecting Modesto Sewers Should Be
First, Latinos Say, Adam Ashton. 43 Fresno Bee, July 30, 2006, Down in the dumps; Fresno County hopes to cut back its mounting piles of illegally
abandoned trash with more enforcement and better disposal options, Kerri Ginis. 44 The Modesto Bee, July 16, 2007, Stanislaus mulls bulk pickup: Environmental chief says service is most
requested, Tim Moran. 45 Modesto Bee, September 30, 2007, South Modesto sharpens its law enforcement 'tool': Deputy: Tackle blight
and add folks to neighborhood Watch, Rosalio Ahumada. 46 Ibid. 47 Ibid. 48 Ibid.

30
49 Fresno Bee, August 16, 2007, Chilling news reports remind of domestic violence's impact; Even when number of
cases declines, we must be alert to dangers. 50 Fresno Bee, June 10, 2007, Playing With Fire; Overtaxed fire departments in Fresno Co. – particularly in rural
areas – are failing to meet the national standard for response time, Brad Branan. **“The main reason for getting an engine to a fire within five minutes is to try to prevent “flashover,” when a fire expands and ignites nearly everything in the room where it started, Coleman said. Fires contained to the room of origin are about 10 times less likely to kill than fires that escape to other rooms, the NFPA has concluded.”
51 Modesto Bee, August 31, 2006, Fire Agencies Faulted; Report Notes Spotty Coverage, Urges Mergers;
Inefficiency, Low Revenue, Slow Rural Response Cites, Garth Stapley. ***Several departments ranked moderately for urban areas but poorly in their unincorporated areas. For example, Oakdale Rural and Salida fire districts have a rating of 4 in town but fall to 9 in the country. Others with rural 9 ratings are Stanislaus Consolidated, Denair, Keyes and Mountain View. West Stanislaus' rural rating is 10. 52 Tulare Advance-Register, March 6, 2007, Fire calls rise in 2006, Luis Hernandez. 53 The Fresno Bee, August 19, 2007, Tulare Co. diagnoses ambulance need: Some officials want to see a single
provider for a county with nine services and sometimes spotty response, Tim Sheehan. 54 From http://www.icced.com/edp_pic/Introduction.pdf, http://www.icced.com/edp_pic/PoeColoniaMASTERPLAN.pdf (accessed October 2007) 55 http://www.csda.net/spcldist.htm 56 Olmstead, S.M., Thirsty Colonias: Rate Regulation and the Provision of Water Services, Land Economics, 2004, 80(1):136-150. 57 Ward, P.M., Colonias and Public Policy in Texas and Mexico: Urbanization by Stealth, Austin: University of Texas Press, 1999. 58 Olmstead, S.M., Thirsty Colonias: Rate Regulation and the Provision of Water Services, Land Economics, 2004, 80(1):136-150. 59 Ibid. 60 Ibid.