TRANSCRIPT

Trade, Import Competition and Productivity Growth In the Food Industry
Alessandro Olper, Lucia Pacca and Daniele Curzi University of Milan, Italy
and Centre for Institution and Economic Performance,
Catholic University of Leuven (A. Olper)
Slides prepared for presentation at the International Agricultural Trade Research
Consortium’s (IATRC’s) 2013 Symposium: Productivity and Its Impacts on Global
Trade, June 2-4, 2013, Seville, Spain

Trade, Import Competition and
Productivity Growth in the Food Industry
Alessandro Olper, Lucia Pacca and Daniele Curzi
Università degli Studi di Milano
UNIVERSITA’ DEGLI STUDI DI MILANO Dipartimento di Economia, Management e
Metodi Quantitativi
IATRC 2013 Symposium Cremona, 15 Maggio 2013

Objective
• Basing on the firm-heterogeneity model by Melitz and Ottaviano (2008), we test the pro-competitive effect of trade liberalization
‒ Effect of import penetration growth on productivity growth within the EU food industry
‒ Does this effect changes if we consider import penetration from different origins (EU15, New Member States, OECD non-EU, BRICs)?
‒ Is the effect stronger for intermediate or final goods?
UN
IVER
SITA
’ DEG
LI S
TUD
I DI M
ILA
NO
D
epar
tmen
t o
f Ec
on
om
ics,
Man
agem
en
t an
d
Qu
anti
tati
ve M
eth
od
s

Main Results
• Growth in import penetration leads to significant productivity growth in EU food sector
– This positive relation is almost exclusively due to import competition coming from
• Developed (especially EU) countries
• Final products
— The effect is robust to several controls and to endogeneity issues
UN
IVER
SITA
’ DEG
LI S
TUD
I DI M
ILA
NO
D
epar
tmen
t o
f Ec
on
om
ics,
Man
agem
en
t an
d
Qu
anti
tati
ve M
eth
od
s

Outline
Motivation and research questions
Theoretical considerations
Empirical specification
Data
Main results
Conclusions and implications
UN
IVER
SITA
’ DEG
LI S
TUD
I DI M
ILA
NO
D
epar
tmen
t o
f Ec
on
om
ics,
Man
agem
en
t an
d
Qu
anti
tati
ve M
eth
od
s

Motivation and research questions
• In the last decades, the EU food market has been experiencing
‒ Strong growth in Import Penetration ratio: from 16% (1995) to 42% (2008)
‒ Slow down in total factor productivity growth
• 7 out of 27 EU members have been affected by a negative TFP growth in the food sector
• Is trade liberalization responsible for this slowdown in productivity?
• The EU public opinion tends to have a negative perception of globalization
UN
IVER
SITA
’ DEG
LI S
TUD
I DI M
ILA
NO
D
epar
tmen
t o
f Ec
on
om
ics,
Man
agem
en
t an
d
Qu
anti
tati
ve M
eth
od
s

Motivation and research questions
• Evidence from the literature for a positive relation between trade liberalization and productivity growth, at
– Theoretical level (e.g. Krugman, 1980; Melitz, 2003; Melitz and Ottaviano, 2008, and many others)
– Empirical level
• Industry level (e.g. Trefler, 2004; Chen et al. 2009 ...)
• Firm level (e.g. Pavcnik, 2002; Aghion et al., 2006 ...)
• Until now, little evidence on the food industry (Gopinath and Ruan, 2008)
• However, this sector represents an ideal case study
– Despite its recent liberalization, it still remains the most protected manufacturing sector
– Thus potentially interesting policy implications
UN
IVER
SITA
’ DEG
LI S
TUD
I DI M
ILA
NO
D
epar
tmen
t o
f Ec
on
om
ics,
Man
agem
en
t an
d
Qu
anti
tati
ve M
eth
od
s

Outline
Motivation and research questions
Theoretical considerations
Empirical specification
Data
Main results
Conclusions and implications
UN
IVER
SITA
’ DEG
LI S
TUD
I DI M
ILA
NO
D
epar
tmen
t o
f Ec
on
om
ics,
Man
agem
en
t an
d
Qu
anti
tati
ve M
eth
od
s
Theoretical Considerations
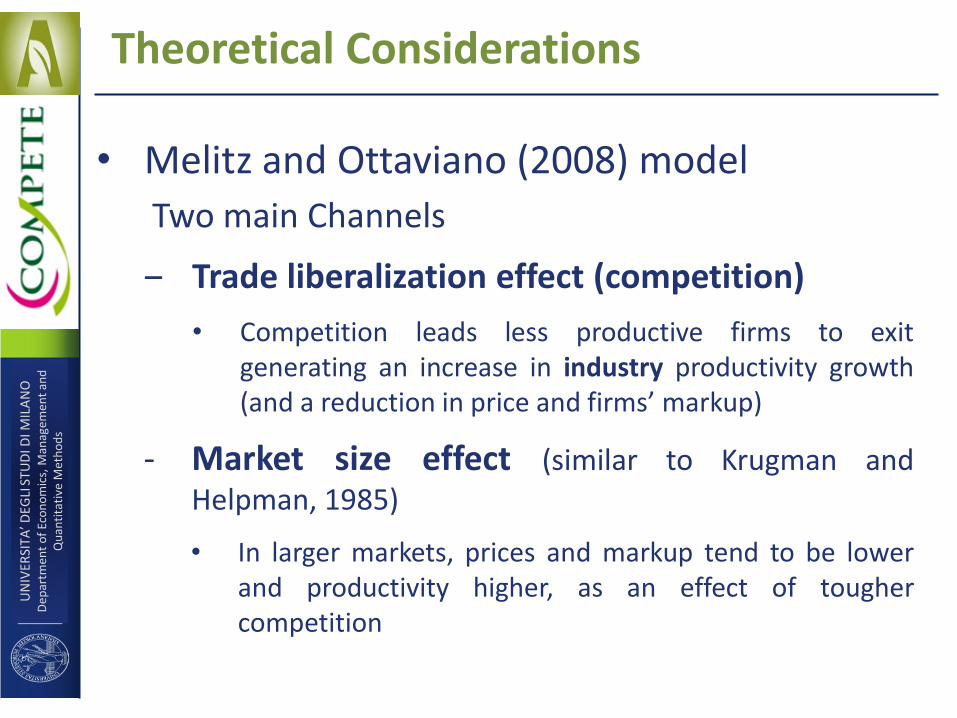
• Melitz and Ottaviano (2008) model
Two main Channels
‒ Trade liberalization effect (competition)
• Competition leads less productive firms to exit generating an increase in industry productivity growth (and a reduction in price and firms’ markup)
‐ Market size effect (similar to Krugman and Helpman, 1985)
• In larger markets, prices and markup tend to be lower and productivity higher, as an effect of tougher competition
UN
IVER
SITA
’ DEG
LI S
TUD
I DI M
ILA
NO
D
epar
tmen
t o
f Ec
on
om
ics,
Man
agem
en
t an
d
Qu
anti
tati
ve M
eth
od
s
Theoretical Considerations
D
Quantity
D’ More competition
(market size fixed)
Combined effects: bigger market
size and more competition
Operating profit
Winners Losers
c*
c*’ MC
Exit
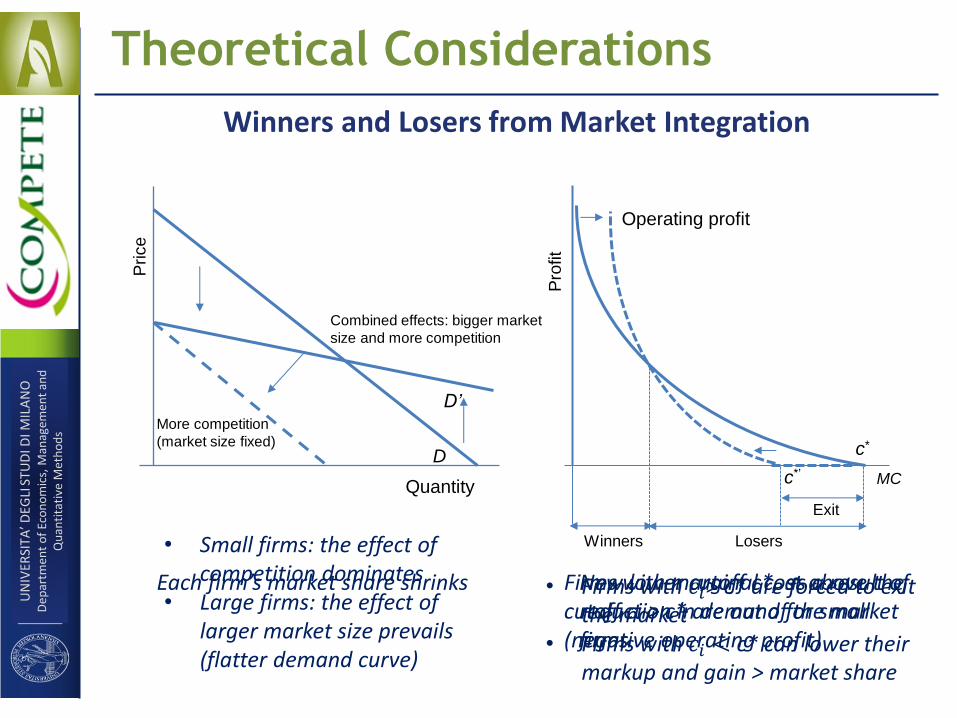
Each firm’s market share shrinks Firms with marginal cost above the cutoff ci > c* are out of the market (negative operating profit)
• Small firms: the effect of competition dominates
• Large firms: the effect of larger market size prevails (flatter demand curve)
New lower cutoff c*, as a result of reduction in demand for small firms
• Firms with 𝑐𝑖> c* are forced to exit the market
• Firms with 𝑐𝑖 < c* can lower their markup and gain > market share
Winners and Losers from Market Integration P
rice
Pro
fit
UN
IVER
SITA
’ DEG
LI S
TUD
I DI M
ILA
NO
D
epar
tmen
t o
f Ec
on
om
ics,
Man
agem
en
t an
d
Qu
anti
tati
ve M
eth
od
s

Outline
Motivation and research questions
Theoretical considerations
Empirical specification
Data
Main results
Conclusions and implications
UN
IVER
SITA
’ DEG
LI S
TUD
I DI M
ILA
NO
D
epar
tmen
t o
f Ec
on
om
ics,
Man
agem
en
t an
d
Qu
anti
tati
ve M
eth
od
s

Theoretical Considerations
• Baseline growth model specification
ycit = Productivity growth
lnycit-1 = Convergence term
IPcit-1 = import penetration growth
Xcit-1 = other controls
• Average firm size • GDP (real) • Business conditions
cit = c + it + cit
∆𝑦𝑐𝑖𝑡 = 𝛽0 + 𝛽1𝑙𝑛𝑦𝑐𝑖𝑡−1 + 𝛽2∆𝐼𝑃𝑐𝑖𝑡−1 + 𝛾𝑋𝑐𝑖𝑡−1 + 𝜀𝑐𝑖𝑡
UN
IVER
SITA
’ DEG
LI S
TUD
I DI M
ILA
NO
D
epar
tmen
t o
f Ec
on
om
ics,
Man
agem
en
t an
d
Qu
anti
tati
ve M
eth
od
s

Empirical Specification
• Identification issues:
‐ Measurement error in the dependent variable
Due to the lack of specific deflators for value added and capital
‐ Endogeneity of Import Penetration
i.e. less productive firms may lobby for protectionism
• How do we address these issues?
‐ Use of industry-year fixed effects (Rodrik, 2013)
‐ Instrumenting IP through SYS-GMM estimator (Blundell and Bond, 1998), that also accounts for the dynamic panel bias
UN
IVER
SITA
’ DEG
LI S
TUD
I DI M
ILA
NO
D
epar
tmen
t o
f Ec
on
om
ics,
Man
agem
en
t an
d
Qu
anti
tati
ve M
eth
od
s

Outline
Motivation and research questions
Theoretical considerations
Empirical specification
Data
Main results
Conclusions and implications
UN
IVER
SITA
’ DEG
LI S
TUD
I DI M
ILA
NO
D
epar
tmen
t o
f Ec
on
om
ics,
Man
agem
en
t an
d
Qu
anti
tati
ve M
eth
od
s

Data
• Panel of more than 1600 observations (25 EU countries, 9 food industries at NACE 3-digit)
• Dependent variables
‐ Labour Productivity • Data from Eurostat SBS
‐ Total Factor Productivity • Estimated from a Cobb-Douglas production function
• Import Penetration
‐ Import value weighted by apparent consumption • Data from Eurostat SBS (production) and Eurostat
COMEXT(import and export)
UN
IVER
SITA
’ DEG
LI S
TUD
I DI M
ILA
NO
D
epar
tmen
t o
f Ec
on
om
ics,
Man
agem
en
t an
d
Qu
anti
tati
ve M
eth
od
s

Data
Import Penetration across food sectors and time
UN
IVER
SITA
’ DEG
LI S
TUD
I DI M
ILA
NO
D
epar
tmen
t o
f Ec
on
om
ics,
Man
agem
en
t an
d
Qu
anti
tati
ve M
eth
od
s

Data
• Other covariates
‐ Average firm size (turnover/No. of firms)
• Data from Eurostat SBS
‐ Real GDP
• Data from Eurostat National Accounts
‐ Business Conditions (Trefler, 2004)
• Generated by estimating the (country) industry-specific predictions of the effect of GDP and Real Exchange Rate growth on productivity.
• Data on GDP and RER from Eurostat, National Accounts
• Deflators
‐ Price indices from Eurostat, National Accounts
UN
IVER
SITA
’ DEG
LI S
TUD
I DI M
ILA
NO
D
epar
tmen
t o
f Ec
on
om
ics,
Man
agem
en
t an
d
Qu
anti
tati
ve M
eth
od
s

Outline
Motivation and research questions
Theoretical considerations
Empirical specification
Data
Main results
Conclusions and implications
UN
IVER
SITA
’ DEG
LI S
TUD
I DI M
ILA
NO
D
epar
tmen
t o
f Ec
on
om
ics,
Man
agem
en
t an
d
Qu
anti
tati
ve M
eth
od
s

(1) (2) (3) (4) (5) (6)
LP TFP LP TFP LP TFP
Lagged LP (TFP) -0.040*** -0.056*** -0.046*** -0.061*** -0.323*** -0.361***
(0.009) (0.012) (0.010) (0.013) (0.070) (0.071)
World import penetration (t-1) 0.108*** 0.097** 0.110*** 0.101***
(0.030) (0.030) (0.028) (0.028)
Lagged avg. firm size 0.030** 0.030**
(0.012) (0.011)
Lagged real GDP 0.149 0.206**
(0.085) (0.082)
Lagged Business conditions 0.097 0.072
(0.085) (0.091)
Country F.E. No No No No Yes Yes
Industry-year F.E. No No No No Yes Yes
# Obs. 2334 2110 1770 1638 1598 1587
R-square 0.039 0.057 0.059 0.078 0.291 0.314
Results - 1
Import competition and productivity growth: basic regressions
UN
IVER
SITA
’ DEG
LI S
TUD
I DI M
ILA
NO
D
epar
tmen
t o
f Ec
on
om
ics,
Man
agem
en
t an
d
Qu
anti
tati
ve M
eth
od
s
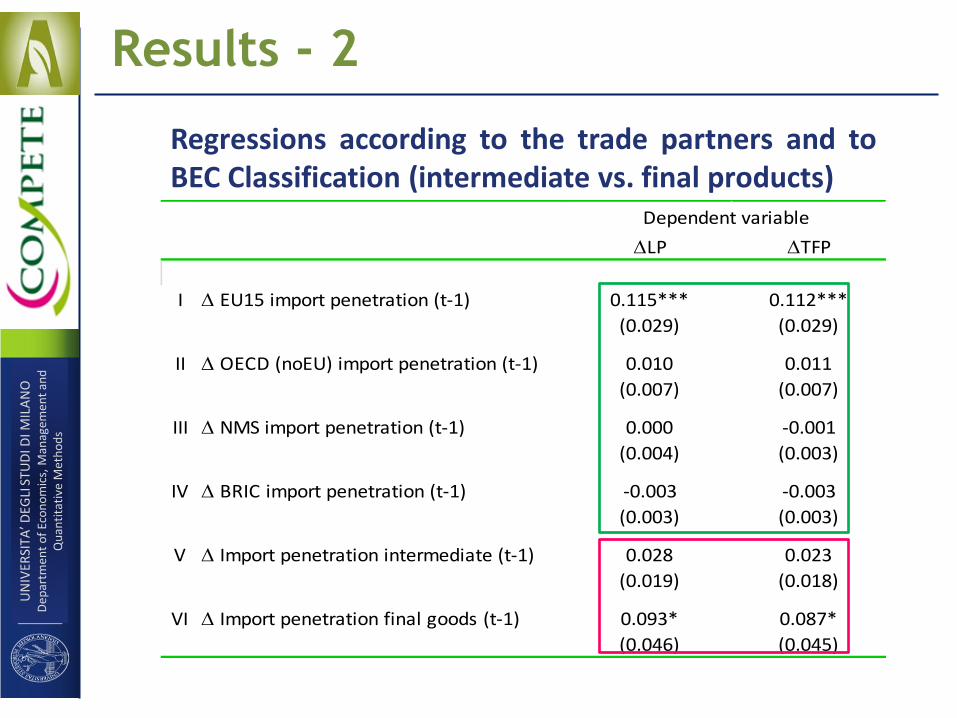
Results - 2
LP TFP
I EU15 import penetration (t-1) 0.115*** 0.112***
(0.029) (0.029)
II OECD (noEU) import penetration (t-1) 0.010 0.011
(0.007) (0.007)
III NMS import penetration (t-1) 0.000 -0.001
(0.004) (0.003)
IV BRIC import penetration (t-1) -0.003 -0.003
(0.003) (0.003)
V Import penetration intermediate (t-1) 0.028 0.023
(0.019) (0.018)
VI Import penetration final goods (t-1) 0.093* 0.087*
(0.046) (0.045)
Dependent variable
Regressions according to the trade partners and to BEC Classification (intermediate vs. final products)
UN
IVER
SITA
’ DEG
LI S
TUD
I DI M
ILA
NO
D
epar
tmen
t o
f Ec
on
om
ics,
Man
agem
en
t an
d
Qu
anti
tati
ve M
eth
od
s

Results – 3 Robustness checks
(1) (2) (3) (4) (5) (6) (7) (8)
LP TFP LP TFP LP TFP LP TFP
Lagged LP (TFP) -0.106*** -0.218*** -0.101*** -0.218*** -0.104*** -0.238*** -0.101*** -0.225***
(0.026) (0.041) (0.023) (0.040) (0.028) (0.048) (0.026) (0.044)
World import penetration (t-1) 0.115*** 0.098**
(0.044) (0.038)
OECD (noEU) import penetration (t-1) 0.013* 0.014**
(0.007) (0.006)
Import penetration intermediate (t-1) 0.026 0.026
(0.021) (0.020)
Import penetration final goods (t-1) 0.136*** 0.105**
(0.043) (0.042)
Controls YES YES YES YES YES YES YES YES
AR1 0.000 0.000 0.000 0.000 0.000 0.000 0.000 0.000
AR2 0.136 0.216 0.095 0.160 0.112 0.189 0.155 0.254
Hansen 0.276 0.183 0.286 0.245 0.256 0.198 0.366 0.330
No. Of Obs. 1598 1587 1592 1581 1597 1586 1598 1587
No. Of groups 206 206 206 206 206 206 206 206
No. Of instruments 193 193 193 193 193 193 193 193
SYS-GMM regressions treating IP as endogenous
UN
IVER
SITA
’ DEG
LI S
TUD
I DI M
ILA
NO
D
epar
tmen
t o
f Ec
on
om
ics,
Man
agem
en
t an
d
Qu
anti
tati
ve M
eth
od
s

Outline
Motivation and research questions
Theoretical considerations
Empirical specification
Data
Main results
Conclusions

Conclusions and implications
• Strong support for the pro-competitive effects of import penetration (Melitz and Ottaviano, 2008)
‒ 1% increase in IP ratio would result in a 0.09-0.14% increase in productivity growth
‒ The effect of import penetration accounts for more than 20% of the TFP growth in the observed period
• This relation is mainly due to final food products coming from EU countries

Conclusions
• Main possible implications
‒ A further trade liberalization can be beneficial for the EU food industry productivity (at least in the short run)
‒ Moreover the EU should not worry too much about competition coming from developing countries
‒ This is because, until now, their quality competition appears still weak in many sectors
• What next
‒ Employments effects ??
‒ Firm-level productivity effects ??
UN
IVER
SITA
’ DEG
LI S
TUD
I DI M
ILA
NO
D
epar
tmen
t o
f Ec
on
om
ics,
Man
agem
en
t an
d
Qu
anti
tati
ve M
eth
od
s

UN
IVER
SITA
’ DEG
LI S
TUD
I DI M
ILA
NO
D
epar
tmen
t o
f Ec
on
om
ics,
Man
agem
en
t an
d
Qu
anti
tati
ve M
eth
od
s
Thank you!