unification of lower and upper critical solution
TRANSCRIPT

2128 | Soft Matter, 2020, 16, 2128--2134 This journal is©The Royal Society of Chemistry 2020
Cite this: SoftMatter, 2020,
16, 2128
Unification of lower and upper critical solutiontemperature phase behavior of globular proteinsolutions in the presence of multivalent cations†
Nafisa Begam, *a Olga Matsarskaia, ‡a Michael Sztucki,b Fajun Zhang *a andFrank Schreiber a
In globular protein systems, upper critical solution temperature (UCST) behavior is common, but lower
critical solution temperature (LCST) phase transitions are rare. In addition, the temperature sensitivity of
such systems is usually difficult to tune. Here we demonstrate that the charge state of globular proteins
in aqueous solutions can alter their temperature-dependent phase behavior. We show a universal way to
tune the effective protein interactions and induce both UCST and LCST-type transitions in the system
using trivalent salts. We provide a phase diagram identifying LCST and UCST regimes as a function of
protein and salt concentrations. We further propose a model based on an entropy-driven cation binding
mechanism to explain the experimental observations.
1 Introduction
Understanding protein phase behavior is important in severalareas such as medicine or biotechnology. As an example, theformation of a dense phase after protein phase separationunderlies several human pathologies. A case in point is sickle-cell anemia, where phase separation plays a crucial role in thedeformation of erythrocytes.1 In the context of material science,protein engineering opens up new opportunities for the develop-ment of biomaterials. Stimulus-triggered changes in water solubilitycausing phase separation of protein solutions are important aspectsin this field.2–4 Such stimuli include temperature, pH, and ionicstrength.4–8 Therefore, studying the influence of these parameterscan help elucidate the phase behavior of protein solutions andpropel the understanding of biological processes includingtransport, catalysis, and supramolecular organization of cellulartissues.9,10 In particular, studies of thermoresponsive proteinsdrive innovations in their application as scaffolds for bioactivecompounds and drug delivery vehicles.11–13
In the case of synthetic polymers, thermoresponsivity hasbeen shown to be able to lead to phase separation above (lowercritical solution temperature, LCST)14 as well as below a criticaltemperature (upper critical solution temperature, UCST)15,16
depending on the exact balance of the interaction energies andentropic contributions. Importantly, some polymers exhibittunable phase transitions with both UCST and LCST.17–19 Theclassical Flory–Huggins theory has successfully described theUCST phase behavior based on the framework of entropy andenthalpy of mixing/demixing.20,21 On the other hand, the gainin entropy caused by a release of bound water molecules wasdescribed as a thermodynamic driving force behind LCST.22,23
Theoretical works predict that the enthalpy of mixing changesfrom positive near UCST to negative near LCST.24,25 In addition,the volume change upon mixing is negative near LCST, andeither negative or positive near UCST.24,25 In the case of block-copolymers, the behavior was found to be strongly dependenton the fraction of copolymers. Wu et al. have shown a transitionfrom an LCST to a UCST by changing the chain length ofpoly(vinyl alcohol) grafted on poly(p-dioxanone).18 Zhu et al.designed poly(2-vinyl-4,4-dimethylazlactone) with either UCSTor LCST or both by making the lactones react with sulfo-propylbetaine (SPB) amine, sulfobutylbetaine (SBB) amine,tetrahydrofurfurylamine (THF amine) and other molecules.26
In addition, LCST and UCST phase behavior determined by thecharge state of the side chains of polypeptoids has beenstudied.27 Similarly, the existence of both UCST and LCST iswell known in resilin elastic proteins due to three competingfactors: the attractive protein–protein interaction, the formationof hydrogen bonds and the entropy of mixing.22,28,29 In line withthis concept, Quiroz et al. demonstrated that the amino acidsequence of elastins controls the phase transition and designedamino acid sequences encoding tunable LCST and UCST.30,31
However, such investigations on globular proteins have not
a Institut fur Angewandte Physik, Universitat Tubingen, 72076 Tubingen, Germany.
E-mail: [email protected], [email protected] ESRF – The European Synchrotron, 71 Avenue des Martyrs, 38000 Grenoble,
France
† Electronic supplementary information (ESI) available. See DOI: 10.1039/c9sm02329a‡ Present address: Institut Laue-Langevin, 71 Avenue des Martyrs, 38042 Grenoble,France.
Received 26th November 2019,Accepted 27th January 2020
DOI: 10.1039/c9sm02329a
rsc.li/soft-matter-journal
Soft Matter
PAPER
Publ
ishe
d on
28
Janu
ary
2020
. Dow
nloa
ded
by U
NIV
ER
SIT
AE
T T
UE
BIN
GE
N o
n 3/
2/20
20 1
1:38
:21
AM
.
View Article OnlineView Journal | View Issue

This journal is©The Royal Society of Chemistry 2020 Soft Matter, 2020, 16, 2128--2134 | 2129
been reported so far. While UCST is common in globularproteins,5,32–36 LCST is rare.7,37,38 In addition, one of the mainbottlenecks is that the temperature-sensitive properties of proteinsare rarely tunable. Along these lines, a broader goal is to be able torecognize the conditions that lead to LCST and/or UCST in aglobular protein system.
The globular proteins b-lactoglobulin (BLG) and bovineserum albumin (BSA) have been reported to exhibit re-entrantcondensation phase behavior in the presence of yttrium chloride(YCl3).7,36 The phase diagram of these systems indicates twocritical concentrations of YCl3, c* and c**, within which such aphase transition occurs. BLG-YCl3 showed a usual UCST phasebehavior near c**.36 On the other hand, BSA has been proven toshow an unusual LCST phase behavior with liquid–liquid phaseseparation (LLPS) for YCl3 concentrations between c* and c**.7
These studies give rise to the question whether a particularsystem, consisting of globular proteins with their differentconfigurations and inhomogeneous surface charges, can exhibitboth LCST and UCST.
In order to contribute to the answer of the above question,here we show a universal way to tune the interactions andhence UCST and LCST behavior using trivalent salts in aqueoussolutions of the proteins BLG and BSA. We observe the existenceof both transitions in one system over a wide range of proteinconcentrations. This study suggests that an entropy-drivencation binding to the protein surface selectively leads to eitherUCST or LCST. We establish a phase diagram identifying bothLCST and UCST regimes as a function of protein and saltconcentrations for the protein BLG. Our findings contributeto the physical understanding of protein phase behavior inresponse to the temperature in aqueous environments.
2 Experimental details
BLG (product no. L3908, Merck, Germany) from bovine milk andBSA (product no. A7906, Merck, Germany) from bovine bloodwere used for this study as received. BLG is a globular proteinwith a molecular weight of 18.4 kDa and contains 162 aminoacids. BSA is also globular with an approximately ellipsoidalshape and consists 583 amino acids (molecular weight of66.5 kDa). In the following we will refer to the protein concentrationas cp. BLG was dissolved in de-gassed de-ionized H2O (resistivity of18.2 MO cm, Milli-Q, Merck, Germany) and left at 4 1C for 1 day tohomogenize the solution. The concentration of the solution wasdetermined using ultraviolet-visible (UV-Vis) absorption spectro-scopy (absorption at 280 nm).37 YCl3 (product no. 451363, Merck,Germany) was dissolved in de-gassed H2O, equilibrated at roomtemperature for approximately 12 h and filtered using 0.2 mmmembrane filters (Whatman Cellulose Filters, Merck, Germany).Samples were made by mixing YCl3 and BLG solutions at roomtemperature. The concentration of BLG, cp (in mg ml�1), in the finalsolutions was varied from 3.5 to 40 mg ml�1. The same procedurewas followed to make BSA-YCl3 solutions in water (prepared atroom temperature). The extinction coefficients of the BLG andBSA solutions used for the concentration determinations are
0.966 and 0.667 mg�1 ml cm�1, respectively (ref. 36 and 37). Inthe final solutions, cp was kept constant at 100 mg ml�1 and theconcentration of YCl3, cs (mM) was varied for BSA-YCl3 solutions.The samples that were turbid at room temperature due to phaseseparation in Regime II were kept at 21 1C for a short timefollowed by centrifugation and only the supernatants were usedfor further measurements.7
To determine the transition temperatures (Ttrans) of thesamples, we performed turbidity measurements using a UV-Visspectrometer equipped with a water bath for temperature control(Haake A10B and SC 150, Thermo Fisher Scientific Inc., Germany)by measuring the optical turbidity of the samples over a wave-length range of 400 to 800 nm as a function of temperature. Thesample was heated/cooled at a rate of 0.5 1C minute�1. To identifythe condensed state we used an optical microscope (AxioScope A1from Carl Zeiss, Germany) with a 50� magnification. A heating/cooling stage (Linkam Scientific Instruments Ltd, UK) was usedto control the sample temperature with an accuracy of 0.1 1Cusing liquid nitrogen flow.
To quantify the protein interactions in the BLG-YCl3 andBSA-YCl3 systems, we have performed small angle X-ray scattering(SAXS) using a laboratory X-ray source (Xeuss 2.0, Xenocs, France,with l = 1.54 Å) as well as beamline ID02 of the ESRF (Grenoble,France, with l = 0.998 Å)39 on these samples as a function oftemperature. The protein solutions were filled into quartz capil-lary tubes with a diameter of 1.5 mm (and of 1 mm diameter inthe case of ID02) and mounted on the sample stage equippedwith a heating stage and a temperature controller (LinkamScientific Instruments Ltd, UK). The sample to detector distancewas 30.7 m at beamline ID02, and 1 m in the laboratory X-raysetup. In this configuration, the q range available, where q is the
wave vector transfer (¼ 4p sin yl
, with 2y being the scattering
angle) is 1 � 10�4 to 7 � 10�3 �1 at ID02 and 0.007 to 0.23 �1
at the laboratory X-ray setup.
3 Results3.1 Temperature sensitivity of BLG-YCl3
We first present an example experiment to demonstrate theexistence of both LCST and UCST behavior in the BLG-YCl3
system by varying cs. Fig. 1(a and b) show that the supernatantof the solution with cp = 40 mg ml�1 and cs = 10 mM (the leftsample) is clear in a hot water bath but turbid in a cold bath.Thus, it shows a UCST. This behavior of BLG-YCl3 systems wasobserved earlier.36 Nevertheless, the supernatant of a solutionwith cp = 40 mg ml�1 and a low cs = 4 mM (the right sample) isturbid at high temperature and clear at a low temperature, thusexhibiting LCST.7,37 Both transitions are observed to be reversible.A globular protein solution showing both transitions has rarelybeen observed.30 Our experiments clearly indicate that a globularprotein solution can exhibit both LCST and UCST depending on cs
(see Video S1, ESI†).We further investigated the samples using optical micro-
scopy during the phase separation process. Micrographs for theBLG-YCl3 samples with cp = 40 mg ml�1 and cs = 4 mM (LCST)
Paper Soft Matter
Publ
ishe
d on
28
Janu
ary
2020
. Dow
nloa
ded
by U
NIV
ER
SIT
AE
T T
UE
BIN
GE
N o
n 3/
2/20
20 1
1:38
:21
AM
. View Article Online

2130 | Soft Matter, 2020, 16, 2128--2134 This journal is©The Royal Society of Chemistry 2020
and 10 mM (UCST) are shown in Fig. 1(c–e) and (f–h), respectively,at different times during the phase separation. In both cases ofLCST and UCST, the dense domains are initially formed onheating above or cooling below the transition temperatures.However, the domains do not continue to grow as is expected foran LLPS (see Videos S2 for LCST and S3 for UCST, ESI†). Thedomain size reaches a certain value and then remains almostconstant with time. After several hours (B3–4 hours) the sampleshows a white precipitate which starts to crystallize upon furtherwaiting (over a time span of B8–12 hours).
Next, we present systematic temperature-dependent turbidity-based experimental results indicating both UCST and LCST fortwo cp values in a broad range of cs. The turbidity of the solution,averaged over the entire wavelength range, is plotted (see Fig. 2)as a function of temperature. Fig. 2(a) shows a sharp transitionfrom clear to turbid on heating above a critical temperature for cp
= 15 mg ml�1 and cs ranging from 1.3 to 1.8 mM indicating a
typical LCST behavior. Fig. 2(b) illustrates a different behaviorwith increasing cs (for the same cp of 15 mg ml�1). Here a sharptransition from clear to turbid on cooling below a criticaltemperature is observed (UCST-type behavior). Similarly, bothLCST-type (at low cs) and UCST-type (at high cs) behaviors areobserved for samples with cp = 7.5 mg ml�1 as we can see inFig. 2(c and d). Such an observation of an LCST behavior at low cs
and a UCST behavior at high cs provides a hint that protein phasebehavior can be manipulated by tuning the charge state of theprotein solution mediated by the salt used. The inflection pointof the turbidity vs. temperature plot corresponds to the transitiontemperature. Fig. 2(a–d) also indicates that Ttrans shifts to lowervalues with increasing cs. In addition, in the case of UCST, thetransition seems to be sharper than that in the case of LCST. Ttrans
values of all samples were determined from the temperaturedependent turbidity data by fitting them with a sigmoidalfunction. Ttrans values for two different cp values are summarizedin Fig. 2e. An overall decrease of Ttrans with increasing cp isobserved for both UCST36 (shown on a magenta background) andLCST (shown on a cyan background) which is consistent withprevious reports36 (this is discussed in Section 4).
In order to study the interactions of the proteins, weperformed SAXS with varying temperature on the supernatantof a sample with cp of 6.6 mg ml�1 and cs of 2.5 mM exhibitingUCST. The sample was cooled down from 21 to 7 1C and then
Fig. 1 Experimental demonstration of temperature sensitivity of the BLG-YCl3 solutions using cold and hot water baths. The solution (a) with low cs
(4 mM, the right sample in both (a) and (b)) becomes turbid at a hightemperature (LCST) and the solution (b) with high cs (10 mM, the leftsample in both (a) and (b)) becomes turbid at a low temperature (UCST),thus showing a rather unusual combination of both types of criticaltemperatures in globular proteins. Light micrographs of the uniformsolution (c), the sample at 45 1C for 30 s (d) and after 2 min (e) for thesample with LCST behavior, and micrographs for the sample with UCSTbehavior when uniform (f), at 5 1C for 120 s (g), and after 4 min (h).
Fig. 2 Optical turbidity as a function of temperature to determine thephase behavior and transition temperatures for BLG-YCl3 systems with (aand b) cp = 15 mg ml�1 and varying cs (in mM) as indicated in the legends,and (c and d) cp = 7.5 mg ml�1 (lines are a guide to the eye). Part (e) shows asummary of Ttrans as a function of cs in the BLG-YCl3 system at twodifferent cp (7.5 and 15 mg ml�1) indicating an overall decrease in Ttrans withincreasing cs. The two phase regime is indicated by the area between thetwo dashed lines.
Soft Matter Paper
Publ
ishe
d on
28
Janu
ary
2020
. Dow
nloa
ded
by U
NIV
ER
SIT
AE
T T
UE
BIN
GE
N o
n 3/
2/20
20 1
1:38
:21
AM
. View Article Online

This journal is©The Royal Society of Chemistry 2020 Soft Matter, 2020, 16, 2128--2134 | 2131
heated to 21 1C again. The corresponding scattering intensityprofiles, I(q) are shown in Fig. 3. Water scattering was used forthe background correction. As can be seen from Fig. 3, theintensity at low q (I(q - 0)) significantly increases at temperaturesbelow 13 1C which is indicative of a reduction in surface charge-induced repulsion and dominating attractive interactions.40 At thisstage, the solution starts to phase-separate. The intensity revertsback to the previous value when the sample is heated back toB21 1C, implying a reversible phase separation.
To investigate the effective interactions we have plottedI(q - 0) as a function of temperature (inset of Fig. 3). Herewe have taken the average intensity of the 1st to the 5th datapoints (q range corresponds to 6.4 � 10�4–9.8 � 10�4 Å�1) andplotted this value as a function of temperature. In the regime ofthe phase diagram without LLPS, it has been shown, for asimilar protein-trivalent salt system, that the inverse of I(q - 0)exhibits the same behavior as the second virial coefficientwhich is a measure of the strength of attraction/repulsion.41,42
In the current study, I(q - 0) increases when the sample iscooled from 21 to 7 1C (Fig. 3). This indicates an increase inprotein–protein attraction.40,43 In our case, such an increase inprotein–protein attraction with decreasing temperature leads tothe phase separation observed at low temperatures (UCST). Anestimation of the reduced second virial coefficient, B2/BHS
2 fromthe SAXS data using a sticky hard sphere model (SHS) combinedwith an ellipsoidal form factor indicates a similar increase inattraction with decreasing temperature (Fig. S2 in the ESI†).
Based on all BLG samples investigated over a large range of cp
and corresponding cs, the overall phase behavior is summarized inFig. 4 in a cs–cp diagram. A diagram showing three distinct regimesof phase behavior of the BLG system at room temperature dividedby c* and c** has been reported earlier.36 Herein, we identify theregimes with different thermal responsivities of the BLG solutionsin a similar phase diagram. The closed symbols (high cs) indicate
UCST and the open symbols (low cs) indicate LCST phasetransitions of the solutions. These two regimes of UCST andLCST are shaded in blue and pink, respectively. Interestingly,the intermediate regime (red crosses), where cs is smaller thanthat in the UCST regime and higher than that in the LCSTregime, does not seem to show any temperature sensitivitywithin the temperature range studied (0 to 45 1C). Moreover,we observe that the turbid samples (without centrifugation)in the condensed regime do not show pronounced thermo-responsivity, either. The turbid appearance does not becomeclear by heating beyond or cooling below any temperaturewithin the temperature range of 0 to 45 1C. This behaviorremains the same if the sample is prepared at low temperature.It is therefore possible that the as-prepared turbid samples, (inthe condensed regime) have a transition temperature which isnot inside the measurement temperature regime, or do notexhibit any thermoresponsivity.
The re-entrant phase behavior of this system observed betweenc* and c** has been understood in terms of a short-rangedattractive potential between the protein molecules where therange and strength of the attraction is tunable by varying themultivalent ions added to the solution.36,42,44 Our previous workshowing a UCST behavior of BLG-YCl3 near c** indicated that thesystem behaves differently away from c** (within the condensedregime).36 Consistent with these findings, the current study alsoreveals a UCST phase behavior near c** and an LCST phasebehavior away from c** (near c*). Moreover, we observe that theLCST and UCST behaviors are not confined to the condensedregime. The LCST regime is extended below c* and the UCSTregime is extended above c** which can be seen in Fig. 4.
3.2 Temperature sensitivity of BSA-YCl3
We extended our investigation to another system, namely BSA-YCl3. Our previous work has shown that this system exhibits arobust LCST behavior in a certain range of cs.
7,37,45 A similarbehavior of BSA is observed in the present study as well, which
Fig. 3 SAXS intensity profiles collected during a temperature cycle(decrease from 21–7 1C and then increase from 7–21 1C) on BLG-YCl3with cp = 6.6 mg ml�1 and cs = 2.5 mM (UCST behavior). The data shows areversibility of the cooling-induced structural change when the sample isheated back to 21 1C. The colorcode added here is to emphasize theintensity change in different q regions. The inset shows a decrease in I(q -
0) with increasing temperature reflecting a UCST phase transition.
Fig. 4 cs–cp phase diagram showing the LCST (open symbols) and UCST(close symbols) regimes. The red cross symbols represent the samples thatdo not exhibit any temperature sensitivity within the temperature rangeinvestigated (0 to 45 1C). The dashed lines represent the two critical cs
values of re-entrant condensation of these samples, c* and c**.36,40
Paper Soft Matter
Publ
ishe
d on
28
Janu
ary
2020
. Dow
nloa
ded
by U
NIV
ER
SIT
AE
T T
UE
BIN
GE
N o
n 3/
2/20
20 1
1:38
:21
AM
. View Article Online

2132 | Soft Matter, 2020, 16, 2128--2134 This journal is©The Royal Society of Chemistry 2020
can be seen in Fig. 5(a) for cs 15 mM (cp = 100 mg ml�1) wherethe turbidity shows a sharp transition from clear to turbid onheating above the critical temperature, exhibiting an LCST-typebehavior. Interestingly, at high cs (B40 mM and above, i.e. near c**),the solution does not show any macroscopic phase transition in thetemperature range of 0–45 1C. In order to understand the under-lying reason behind such a different temperature sensitivity withvarying cs, we have performed SAXS measurements on the solutionswith a constant cp (100 mg ml�1) and at different cs with varyingtemperature using our laboratory X-ray source.
SAXS intensity profiles as a function of q at differenttemperatures are shown in Fig. 5(b) for a sample with cs = 10 mM(cs o c*). Water is used for background correction. The intensity atlow q increases with increasing temperature (as indicated by theblack arrow). An increase in I(q - 0) indicates strongerattraction40,43 at high temperatures. A slight increase of cs to15 mM results in a clear LCST transition (Fig. 5(a)) due to suchan increase in attraction. The intensity at q - 0 normalized tothat at 5 1C (I(q - 0)/I5(q - 0)) is shown in Fig. 5(c). In thissetup (laboratory X-ray setup), the intensity was also averagedover the 1st to the 5th data points (corresponding q range is0.008–0.0097 Å�1).
Upon further increase of cs (40 mM and above) the intensityat low q decreases with increasing temperature as indicated bythe red arrow in Fig. 6(a). This behavior becomes more pronouncedwhen cs is increased (up to B100 mM) (Fig. 6(b and c)). The resultsfor high cs for BSA samples (cp = 100 mg ml�1) are summarized inFig. 6(d). A decrease in (I(q - 0)/I5(q - 0)) with increasingtemperature suggests that the inter-protein attraction decreaseswith increasing temperature, which is similar to the observationon the BLG-YCl3 system in the UCST regime (inset of Fig. 3).B2/BHS
2 obtained from the SAXS data using the SHS model incombination with an ellipsoidal form factor also supports thetrends of I(q - 0) as a function of temperature in both cases oflow and high cs (see Fig. S3 in the ESI†). The inter-proteininteraction seen by SAXS, thus, indicates the possibility of aUCST in BSA system at high cs in addition to the LCST behavior
already reported earlier.7,37 We speculate that the attraction inthe temperature range of 0–45 1C is possibly not strong enoughto cause macroscopically visible UCST.
4 Discussion
UCST for globular protein solutions has been reported byseveral groups4,5 which can be described by a reduction ofthe system enthalpy dominating the entropy loss upon phaseseparation at low temperatures.46,47 However, LCST has rarelybeen observed in the case of globular proteins. Nevertheless,several reports have recently demonstrated a systematic LCSTphase behavior in BSA-based systems.7,37,42,45 The mechanismbehind such a phase behavior of globular protein systems wasrationalized in ref. 7 and 48 using a concept of ion-activatedattractive patches on the protein surface. Multidentate coordinativebonds between cations (e.g. Y3+ ions in the current study) and thecarboxylic side chains of the protein surface eventually bridge theprotein molecules. Such ion bridges between the protein moleculesare analogous to attractive patches. This implies that such attractivepatches activated by the ions can be tuned to alter the interactionsand hence the phase behavior of globular proteins. Cation bindingand bridging in the case of a negatively charged globular proteinleads to a release of water molecules. This implies an entropy gainsince the carboxylic binding sites of proteins as well as the cationsare generally surrounded by hydration shells.49–51 Therefore, thetemperature increase of the system is expected to enhance thisbridging and make the protein–protein interaction stronger.7 Theentropically favorable high bridging probability of the system athigh temperatures causes phase separation upon heating andhence the system exhibits an LCST.
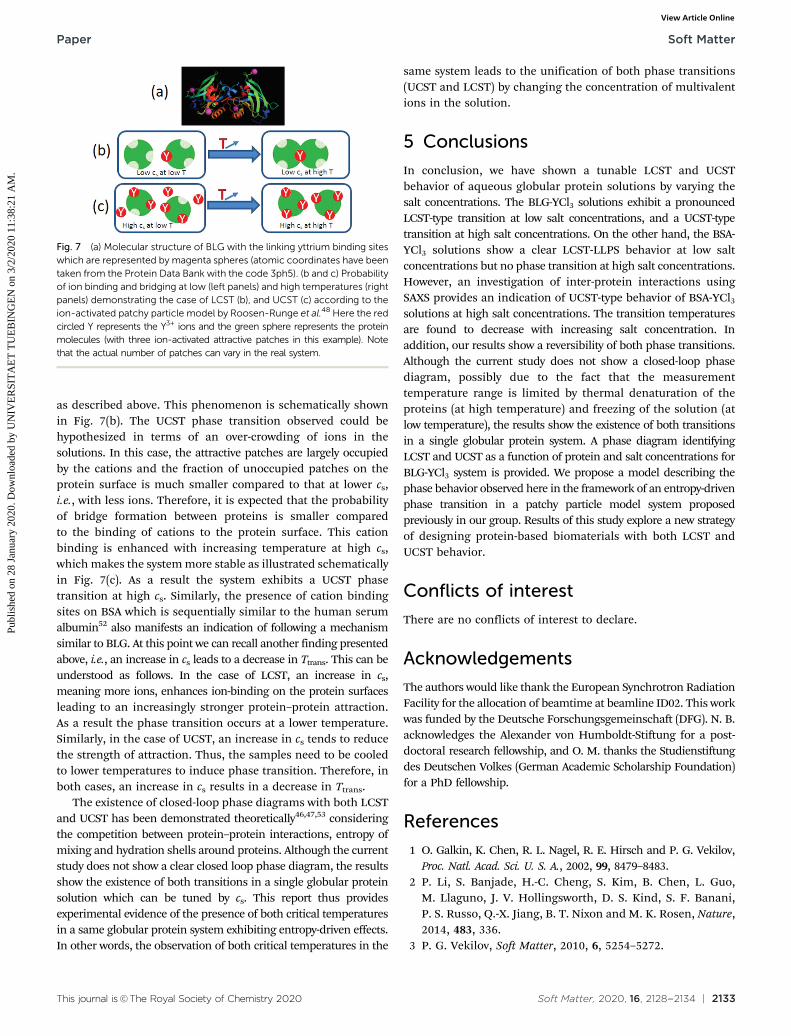
Yttrium binding sites present on protein surfaces, especiallyon the BLG surface (Fig. 7(a)), suggest that the LCST phasetransition observed here at lower cs in the BLG-YCl3 systemcould be based on principles similar to the entropy-driven LCST
Fig. 5 (a) LCST phase transition for a BSA-YCl3 sample with cs = 15 mMand cp = 100 mg ml�1; the sample changes from clear to turbid withincreasing temperature, (b) SAXS intensity profiles collected at differenttemperatures (legend indicates the temperatures) for a BSA-YCl3 samplewith cp = 100 mg ml�1 and cs = 10 mM, and (c) I(q - 0) as a function oftemperature normalized to that at 5 1C (I(q - 0)/I5(q - 0)) showing anincrease with increasing temperature (lines are a guide to the eye). All ofthese measurements indicate LCST.
Fig. 6 SAXS intensity profiles for BSA-YCl3 samples with cp = 100 mg ml�1
and (a) cs = 40, (b) 50, (c) 100 mM, (d) I(q - 0)/I5(q - 0) as a function oftemperature showing a decrease with increasing temperature for all thesamples which is similar to that in the inset of Fig. 3 indicating a UCST-typebehavior (as opposed to Fig. 5). Lines are a guide to the eye.
Soft Matter Paper
Publ
ishe
d on
28
Janu
ary
2020
. Dow
nloa
ded
by U
NIV
ER
SIT
AE
T T
UE
BIN
GE
N o
n 3/
2/20
20 1
1:38
:21
AM
. View Article Online
This journal is©The Royal Society of Chemistry 2020 Soft Matter, 2020, 16, 2128--2134 | 2133
as described above. This phenomenon is schematically shownin Fig. 7(b). The UCST phase transition observed could behypothesized in terms of an over-crowding of ions in thesolutions. In this case, the attractive patches are largely occupiedby the cations and the fraction of unoccupied patches on theprotein surface is much smaller compared to that at lower cs,i.e., with less ions. Therefore, it is expected that the probabilityof bridge formation between proteins is smaller comparedto the binding of cations to the protein surface. This cationbinding is enhanced with increasing temperature at high cs,which makes the system more stable as illustrated schematicallyin Fig. 7(c). As a result the system exhibits a UCST phasetransition at high cs. Similarly, the presence of cation bindingsites on BSA which is sequentially similar to the human serumalbumin52 also manifests an indication of following a mechanismsimilar to BLG. At this point we can recall another finding presentedabove, i.e., an increase in cs leads to a decrease in Ttrans. This can beunderstood as follows. In the case of LCST, an increase in cs,meaning more ions, enhances ion-binding on the protein surfacesleading to an increasingly stronger protein–protein attraction.As a result the phase transition occurs at a lower temperature.Similarly, in the case of UCST, an increase in cs tends to reducethe strength of attraction. Thus, the samples need to be cooledto lower temperatures to induce phase transition. Therefore, inboth cases, an increase in cs results in a decrease in Ttrans.
The existence of closed-loop phase diagrams with both LCSTand UCST has been demonstrated theoretically46,47,53 consideringthe competition between protein–protein interactions, entropy ofmixing and hydration shells around proteins. Although the currentstudy does not show a clear closed loop phase diagram, the resultsshow the existence of both transitions in a single globular proteinsolution which can be tuned by cs. This report thus providesexperimental evidence of the presence of both critical temperaturesin a same globular protein system exhibiting entropy-driven effects.In other words, the observation of both critical temperatures in the
same system leads to the unification of both phase transitions(UCST and LCST) by changing the concentration of multivalentions in the solution.
5 Conclusions
In conclusion, we have shown a tunable LCST and UCSTbehavior of aqueous globular protein solutions by varying thesalt concentrations. The BLG-YCl3 solutions exhibit a pronouncedLCST-type transition at low salt concentrations, and a UCST-typetransition at high salt concentrations. On the other hand, the BSA-YCl3 solutions show a clear LCST-LLPS behavior at low saltconcentrations but no phase transition at high salt concentrations.However, an investigation of inter-protein interactions usingSAXS provides an indication of UCST-type behavior of BSA-YCl3
solutions at high salt concentrations. The transition temperaturesare found to decrease with increasing salt concentration. Inaddition, our results show a reversibility of both phase transitions.Although the current study does not show a closed-loop phasediagram, possibly due to the fact that the measurementtemperature range is limited by thermal denaturation of theproteins (at high temperature) and freezing of the solution (atlow temperature), the results show the existence of both transitionsin a single globular protein system. A phase diagram identifyingLCST and UCST as a function of protein and salt concentrations forBLG-YCl3 system is provided. We propose a model describing thephase behavior observed here in the framework of an entropy-drivenphase transition in a patchy particle model system proposedpreviously in our group. Results of this study explore a new strategyof designing protein-based biomaterials with both LCST andUCST behavior.
Conflicts of interest
There are no conflicts of interest to declare.
Acknowledgements
The authors would like thank the European Synchrotron RadiationFacility for the allocation of beamtime at beamline ID02. This workwas funded by the Deutsche Forschungsgemeinschaft (DFG). N. B.acknowledges the Alexander von Humboldt-Stiftung for a post-doctoral research fellowship, and O. M. thanks the Studienstiftungdes Deutschen Volkes (German Academic Scholarship Foundation)for a PhD fellowship.
References
1 O. Galkin, K. Chen, R. L. Nagel, R. E. Hirsch and P. G. Vekilov,Proc. Natl. Acad. Sci. U. S. A., 2002, 99, 8479–8483.
2 P. Li, S. Banjade, H.-C. Cheng, S. Kim, B. Chen, L. Guo,M. Llaguno, J. V. Hollingsworth, D. S. Kind, S. F. Banani,P. S. Russo, Q.-X. Jiang, B. T. Nixon and M. K. Rosen, Nature,2014, 483, 336.
3 P. G. Vekilov, Soft Matter, 2010, 6, 5254–5272.
Fig. 7 (a) Molecular structure of BLG with the linking yttrium binding siteswhich are represented by magenta spheres (atomic coordinates have beentaken from the Protein Data Bank with the code 3ph5). (b and c) Probabilityof ion binding and bridging at low (left panels) and high temperatures (rightpanels) demonstrating the case of LCST (b), and UCST (c) according to theion-activated patchy particle model by Roosen-Runge et al.48 Here the redcircled Y represents the Y3+ ions and the green sphere represents the proteinmolecules (with three ion-activated attractive patches in this example). Notethat the actual number of patches can vary in the real system.
Paper Soft Matter
Publ
ishe
d on
28
Janu
ary
2020
. Dow
nloa
ded
by U
NIV
ER
SIT
AE
T T
UE
BIN
GE
N o
n 3/
2/20
20 1
1:38
:21
AM
. View Article Online

2134 | Soft Matter, 2020, 16, 2128--2134 This journal is©The Royal Society of Chemistry 2020
4 J. A. Thomson, P. Schurtenberger, G. M. Thurston and G. B.Benedek, Proc. Natl. Acad. Sci. U. S. A., 1987, 84, 7079–7083.
5 F. Cardinaux, T. Gibaud, A. Stradner and P. Schurtenberger,Phys. Rev. Lett., 2007, 99, 118301.
6 S. Bucciarelli, L. a. Casal-Dujat, C. De Michele, F. Sciortino,J. Dhont, J. Bergenholtz, B. Farago, P. Schurtenberger andA. Stradner, J. Phys. Chem. Lett., 2015, 6, 4470–4474.
7 O. Matsarskaia, M. K. Braun, F. Roosen-Runge, M. Wolf,F. Zhang, R. Roth and F. Schreiber, J. Phys. Chem. B, 2016,120, 7731–7736.
8 D. Durand, J. C. Gimel and T. Nicolai, Phys. A, 2002, 304,253–265.
9 W. R. Harris, Coord. Chem. Rev., 1996, 149, 347–365.10 W. J. Ray and C. Bracker, J. Cryst. Growth, 1986, 76, 562–576.11 S. R. MacEwan and A. Chilkoti, Nano Lett., 2012, 12, 3322–3328.12 J. A. MacKay, M. Chen, J. R. McDaniel, W. Liu, A. J. Simnick
and A. Chilkoti, Nat. Mater., 2009, 8, 993.13 D. E. Meyer and A. Chilkoti, Biomacromolecules, 2002, 3,
357–367.14 I. Dimitrov, B. Trzebicka, A. H. E. Muller, A. Dworak and
C. B. Tsvetanov, Prog. Polym. Sci., 2007, 32, 1275–1343.15 E. Karjalainen, V. Aseyev and H. Tenhu, Macromolecules,
2014, 47, 7581–7587.16 Q. Zhang and R. Hoogenboom, Prog. Polym. Sci., 2015, 48,
122–142.17 S. Saeki, N. Kuwahara, S. Konno and M. Kaneko, Macro-
molecules, 1973, 6, 246–250.18 G. Wu, S.-C. Chen, Q. Zhan and Y.-Z. Wang, Macromolecules,
2011, 44, 999–1008.19 F. A. Plamper, M. Ballauff and A. H. E. Muller, J. Am. Chem.
Soc., 2007, 129, 14538–14539.20 P. J. Flory, J. Chem. Phys., 1942, 10, 51–61.21 M. L. Huggins, J. Chem. Phys., 1941, 9, 440.22 J. Li, R. Rajagopalan and J. Jiang, J. Chem. Phys., 2008,
128, 06B616.23 H. G. Schild and D. A. Tirrell, J. Phys. Chem., 1990, 94, 4352–4356.24 C. Baker, W. Brown, G. Gee, J. Rowlinson, D. Stubley and
R. Yeadon, Polymer, 1962, 3, 215–230.25 E. A. Clark and J. E. G. Lipson, Polymer, 2012, 53, 536–545.26 Y. Zhu, R. Batchelor, A. B. Lowe and P. J. Roth, Macromole-
cules, 2016, 49, 672–680.27 C. Xing, Z. Shi, J. Tian, J. Sun and Z. Li, Biomacromolecules,
2018, 19, 2109–2116.28 N. K. Dutta, M. Y. Truong, S. Mayavan, N. Roy Choudhury,
C. M. Elvin, M. Kim, R. Knott, K. M. Nairn and A. J. Hill,Angew. Chem., 2011, 123, 4520–4523.
29 F. G. Quiroz, N. K. Li, S. Roberts, P. Weber, M. Dzuricky,I. Weitzhandler, Y. G. Yingling and A. Chilkoti, Sci. Adv.,2019, 5, eaax5177.
30 F. G. Quiroz and A. Chilkoti, Nat. Mater., 2015, 14, 1164.31 A. S. Holehouse and R. V. Pappu, Nat. Mater., 2015, 14, 1083.
32 S. Da Vela, F. Roosen-Runge, M. W. A. Skoda, R. M. J. Jacobs,T. Seydel, H. Frielinghaus, M. Sztucki, R. Schweins, F. Zhangand F. Schreiber, J. Phys. Chem. B, 2017, 121, 5759–5769.
33 F. Platten, J. Hansen, D. Wagner and S. U. Egelhaaf, J. Phys.Chem. Lett., 2016, 7, 4008–4014.
34 A. C. Dumetz, A. M. Chockla, E. W. Kaler and A. M. Lenhoff,Biophys. J., 2008, 94, 570–583.
35 T. Gibaud and P. Schurtenberger, J. Phys.: Condens. Matter,2009, 21, 322201.
36 F. Zhang, G. Zocher, A. Sauter, T. Stehle and F. Schreiber,J. Appl. Crystallogr., 2011, 44, 755–762.
37 S. Da Vela, M. K. Braun, A. Dorr, A. Greco, J. Moller, Z. Fu,F. Zhang and F. Schreiber, Soft Matter, 2016, 12, 9334–9341.
38 O. Matsarskaia, S. Da Vela, A. Mariani, Z. Fu, F. Zhang andF. Schreiber, J. Phys. Chem. B, 2019, 123, 1913–1919.
39 T. Narayanan, M. Sztucki, P. Van Vaerenbergh, J. Leonardon,J. Gorini, L. Claustre, F. Sever, J. Morse and P. Boesecke,J. Appl. Crystallogr., 2018, 51, 1511–1524.
40 F. Zhang, M. W. A. Skoda, R. M. J. Jacobs, S. Zorn, R. A.Martin, C. M. Martin, G. F. Clark, S. Weggler, A. Hildebrandt,O. Kohlbacher and F. Schreiber, Phys. Rev. Lett., 2008, 101,148101.
41 M. K. Braun, A. Sauter, O. Matsarskaia, M. Wolf, F. Roosen-Runge, M. Sztucki, R. Roth, F. Zhang and F. Schreiber,J. Phys. Chem. B, 2018, 122, 11978–11985.
42 O. Matsarskaia, F. Roosen-Runge, G. Lotze, J. Moller,A. Mariani, F. Zhang and F. Schreiber, Phys. Chem. Chem.Phys., 2018, 20, 27214–27225.
43 O. Glatter and O. Kratky, Small angle X-ray scattering, Aca-demic Press, London, USA, Edition New York, 1982.
44 F. Zhang, F. Roosen-Runge, A. Sauter, M. Wolf, R. M. J.Jacobs and F. Schreiber, Pure Appl. Chem., 2014, 86, 191–202.
45 M. K. Braun, M. Wolf, O. Matsarskaia, S. Da Vela, F. Roosen-Runge, M. Sztucki, R. Roth, F. Zhang and F. Schreiber,J. Phys. Chem. B, 2017, 121, 1731–1739.
46 A. Shiryayev, D. L. Pagan, J. D. Gunton, D. S. Rhen, A. Saxenaand T. Lookman, J. Chem. Phys., 2005, 122, 234911.
47 J. Li, R. Rajagopalan and J. Jiang, J. Chem. Phys., 2008, 128, 05B621.48 F. Roosen-Runge, F. Zhang, F. Schreiber and R. Roth, Sci.
Rep., 2014, 4, 7016.49 G. A. Jeffrey, Hydrogen Bonding in Biological Structures,
Springer-Verlag, Berlin, Heidelberg, 1991.50 K. V. Ragnarsdottir, E. H. Oelkers, D. M. Sherman and
C. R. Collins, Chem. Geol., 1998, 151, 29–39.51 P. Lindqvist-Reis, K. Lamble, S. Pattanaik, I. Persson and
M. Sandstrom, J. Phys. Chem. B, 2000, 104, 402–408.52 R. Maier, A. Sauter, G. Zocher, S. Da Vela, O. Matsarskaia,
R. Schweins, M. Sztucki, F. Zhang, T. Stehle and F. Schreiber,2020, in preperation.
53 S. Moelbert and P. De Los Rios, Macromolecules, 2003, 36,5845–5853.
Soft Matter Paper
Publ
ishe
d on
28
Janu
ary
2020
. Dow
nloa
ded
by U
NIV
ER
SIT
AE
T T
UE
BIN
GE
N o
n 3/
2/20
20 1
1:38
:21
AM
. View Article Online