unicredit: transform first year … · 1 | p a g e 4q17 and fy17 group results press release milan,...
TRANSCRIPT

1 | P a g e
4Q17 and FY17 Group Results Press Release
MILAN, 8 FEBRUARY 2018
UNICREDIT: TRANSFORM 2019 FIRST YEAR SUCCESSFULLY
COMPLETED, ALL TARGETS ACHIEVED
STRONG UNDERLYING 2017 PERFORMANCE
4Q17 AND FINANCIAL YEAR 2017 GROUP RESULTS
GROUP UNDERLYING FINANCIAL PERFORMANCE STRONG WITH NET OPERATING PROFIT AT €5.7 BN UP 74 PER CENT FY/FY. ADJUSTED
NET PROFIT1 OF €3.7 BN. FY17 ADJUSTED ROTE1
AT 7.2 PER CENT. FY19 ROTE TARGET ABOVE 9 PER CENT CONFIRMED
CORE BANK PERFORMED VERY WELL WITH GROUP CORE ADJUSTED ROTE1 AT 9.1 PER CENT, 1.9 P.P. HIGHER THAN GROUP
ADJUSTED ROTE. FY17 GROUP CORE GROSS NPE RATIO SIGNIFICANTLY IMPROVED BY 73 BPS Y/Y TO 4.9 PER CENT
RESILIENT FY17 GROUP NII AT €10.3 BN. STRONG FY17 COMMERCIAL DYNAMICS WITH NUMBER OF CLIENTS UP 629,0002,
AUM UP €21.4 BN (+10.9 PER CENT Y/Y) AND FEES UP €445 M (+7.1 PER CENT FY/FY)
TRANSFORM 2019 IS AHEAD OF SCHEDULE AND DELIVERING TANGIBLE RESULTS. FY17 COST PERFORMANCE VERY GOOD
WITH COSTS DOWN 4.0 PER CENT AT €11.4 BN, SUPPORTED BY BRANCH CLOSURES AND FTE REDUCTIONS. FY18 AND
FY19 COST TARGETS CONFIRMED AT €11.0 BN AND €10.6 BN, RESPECTIVELY
CONTINUED DE-RISKING WITH FINO PHASE 1 CLOSED IN JULY 2017AND FINO PHASE 2 CLOSED IN JANUARY 2018.
FY17 GROSS NPE RATIO DOWN TO 10.2 PER CENT AND COR AT 58 BPS, IN LINE WITH GUIDANCE. FY19 COR
TARGET OF 55 BPS CONFIRMED
FULLY LOADED CET1 RATIO AT 13.60 PER CENT3, 13.02 PER CENT PRO FORMA OF IFRS94
AND FINO5
ROBUST 4Q17 THANKS TO STRONG COMMERCIAL DYNAMICS IN ALL DIVISIONS. STATED 4Q17 NET PROFIT OF €801 M,
ADJUSTED NET PROFIT OF €708 M
PROPOSED CASH DIVIDEND OF €0.32 PER SHARE EQUAL TO €0.7 BN, EQUIVALENT TO 20 PER CENT PAYOUT RATIO ON
NORMALISED EARNINGS
Note: please consider that in this document, all comments related to 4Q16 and FY16 Group results are related to adjusted figures (as shown on page 20). Therefore Y/Y and FY/FY Group figures changes were calculated vs 4Q16 and FY16 Group adjusted numbers. 4Q16 and FY16 division figures were not adjusted. 1Group adjusted net profit and adjusted Return on Tangible Equity (RoTE) exclude (i) the negative FX reserve impact related to Bank Pekao disposal (-€310 m in 2Q17), (ii) the positive net impact from Bank Pekao and Pioneer disposals (+€2.1 bn in 3Q17 and +€93 m in 4Q17), and (iii) a negative one-off charge related to FINO booked in Non Core (-€80 m in 3Q17). Group Core adjusted net profit and adjusted RoTE exclude (i) and (ii) as well, but do not exclude (iii) being booked in the Non Core. RoTE calculated at Capital Markets Day perimeter, considering also the capital increase and Bank Pekao and Pioneer disposals as of January 1, 2017. Adjusted RoTE: adjusted annualised net income / adjusted average tangible equity (excluding AT1 and intangible assets). 2Calculated as difference between number of clients at beginning and end of period. 3Assuming dividends equal to 20 per cent payout ratio on normalised earnings, excluding the net impact of Bank Pekao and Pioneer disposals (+€2.1 bn in 3Q17, +€93 m in 4Q17) and -€310 m FX reserve in 2Q17 related to Bank Pekao. 4IFRS9 first-time adoption (FTA) on 1 January 2018 estimated at -75 bps. The overall "net impact" on the fully loaded CET1 ratio is expected at ca.-40 bps, as the FTA will be partially compensated by tax effects and lower shortfall over the course of FY18. 5The completion of FINO phase 2 in January 2018 and the Significant Risk Transfer (SRT) of the FINO portfolio, for which UniCredit has notified the European Central Bank of its intention to proceed in accordance to regulation, will result in a +17 bps fully loaded CET1 ratio impact in 1Q18. The overall net impact on the fully loaded CET1 ratio will be c.+10 bps, as previously stated in the 17 July 2017 press release, since the SRT positive impact is partially offset by the higher RWA of the underlying FINO portfolio at end of 2017.

2 | P a g e
4Q17 and FY17 Group Results Press Release
UNICREDIT GROUP
FY17
HIGHLIGHTS
REVENUES INCREASED TO €19.6 BN (+1.7 PER CENT FY/FY) WITH NII RESILIENT AT €10.3 BN IN LINE
WITH GUIDANCE. STRONG FEE GENERATION OF €6.7 BN (+7.1 PER CENT FY/FY) THANKS TO
INCREASINGLY POSITIVE COMMERCIAL DYNAMICS. TRADING INCOME AT €1.8 BN (+3.5 PER CENT
FY/FY)
OPERATING EXPENSES DOWN 4.0 PER CENT FY/FY AT €11.4 BN. COST/INCOME (C/I) RATIO LOWER
AT 57.9 PER CENT DOWN FROM 61.3 PER CENT IN FY16
LLPS REDUCED TO €2.6 BN (-38.1 PER CENT FY/FY) WITH COST OF RISK (COR) AT 58 BPS IN LINE
WITH GUIDANCE AND INCLUDING 5 BPS MODELS IMPACT
ADJUSTED NET PROFIT AT €3.7 BN IN FY17. STATED NET PROFIT AT €5.5 BN
ADJUSTED ROTE IMPROVED TO 7.2 PER CENT IN FY17 VS 2.0 PER CENT IN FY16
4Q17
HIGHLIGHTS
REVENUES AT €4.8 BN (+4.2 PER CENT Q/Q, +7.4 PER CENT Y/Y). MAIN DRIVERS WERE RESILIENT
NII AT €2.6 BN AND STRONG FEES UP 12.3 PER CENT Y/Y AT €1.7 BN
OPERATING EXPENSES AT €2.8 BN (-0.7 PER CENT Q/Q, -4.6 PER CENT Y/Y) DRIVEN BY LOWER HR
AND NON-HR COSTS (-0.2 PER CENT AND -1.4 PER CENT Q/Q, RESPECTIVELY). NO SEASONAL INCREASE
IN CONTRAST TO PREVIOUS YEARS, SUPPORTED BY EXPENSE RECOVERIES FROM WORKOUT. C/I RATIO AT
57.7 PER CENT (-2.9 P.P. Q/Q, -7.3 P.P. Y/Y)
GROSS OPERATING PROFIT AT €2.0 BN, UP 11.8 PER CENT Q/Q AND 29.7 PER CENT Y/Y
LLPS AT €772 M, UP 29.1 PER CENT Q/Q DUE TO MODELS IMPACT BUT DECREASED 48.1 PER CENT
Y/Y. COR AT 69 BPS INCLUDING 15 BPS MODELS IMPACT
ADJUSTED NET PROFIT AT €708 M. STATED NET PROFIT AT €801 M
ADJUSTED ROTE AT 5.5 PER CENT
CEE, CIB AND COMMERCIAL BANKING ITALY MAIN CONTRIBUTORS TO NET PROFIT
CAPITAL
FULLY LOADED CET1 RATIO AT 13.60 PER CENT, 13.02 PER CENT PRO FORMA OF IFRS9 AND FINO
4Q17 CAPITAL IMPACT OF REGULATION, MODELS AND PROCYCLICALITY OF -24BPS ON FULLY LOADED
CET1 RATIO
FULLY LOADED LEVERAGE RATIO AT 5.55 PER CENT IN 4Q17
ASSET
QUALITY
GROUP GROSS NPE6 RATIO DOWN TO 10.2 PER CENT IN FY17 FROM 11.8 PER CENT IN FY16,
UNDERPINNED BY €4.4 BN ADDITIONAL DISPOSALS IN FY17. GROUP NET NPE RATIO AT 4.7 PER CENT
IN FY17 DOWN FROM 5.6 PER CENT IN FY16
SOLID GROUP NPE COVERAGE RATIO UP, 56.2 PER CENT IN 4Q17 COMPARED TO 55.6 PER CENT
IN 4Q16
GROUP CORE GROSS NPE RATIO DOWN 73 BPS Y/Y TO 4.9 PER CENT IN 4Q17 WITH COVERAGE
RATIO REMAINING STABLE AT 55.4 PER CENT
NON CORE GROSS NPE AT €26.5 BN IN 4Q17 ON TRACK TO REACH 2019 TARGET OF €17.2 BN
TRANSFORM
2019 UPDATE
ALL CAPITAL ACTIONS SUCCESSFULLY COMPLETED WITH A FULLY LOADED CET1 RATIO AT 13.60 PER
CENT AT THE END OF DECEMBER 2017, 13.02 PER CENT PRO FORMA OF IFRS9 AND FINO
THE SUCCESSFUL EXECUTION OF TRANSFORM 2019 WAS CONFIRMED BY MOODY’S UPGRADE OF
UNICREDIT S.P.A.’S OUTLOOK AT THE BEGINNING OF JANUARY FROM STABLE TO POSITIVE
FINO PHASE 2 SUCCESSFULLY CLOSED IN JANUARY 2018
DISPOSAL OF €4.4 BN NPES IN FY17 OF WHICH €2.0 BN IN 4Q17
OPERATING MODEL TRANSFORMATION PROGRESSING WELL (72 PER CENT OF PLANNED BRANCH
6NPEs: Non Performing Exposures. The perimeter of Non-Performing Loans is equivalent to the perimeter of EBA non performing exposures. NPEs are broken down in bad exposures, unlikely-to-pay and past due.

3 | P a g e
4Q17 and FY17 Group Results Press Release
CLOSURES AND 64 PER CENT OF FTE REDUCTION TARGETS ACHIEVED)
SIMPLIFICATION OF IT COMPLEXITY DRIVEN BY THE DECOMMISSIONING OF 921 APPLICATIONS, ACHIEVING 84 PER CENT OF 2019 TARGET
FY17 ASSET UNDER MANAGEMENT (AUM) NET SALES AT €11 BN IN COMMERCIAL BANKING ITALY, THREE TIMES HIGHER THAN IN FY16, WITH AUM-RELATED COMMISSIONS UP 28 PER CENT FY/FY
WEIGHT OF GROUP CORPORATE CENTRE ON GROUP TOTAL COSTS DOWN 0.3 P.P. FY/FY AT 4.1
PER CENT IN FY17 VERSUS 5.1 PER CENT IN DECEMBER 2015
Milan, 8 February 2018: on 7 February 2018, the Board of Directors of UniCredit S.p.A. approved the Group’s 4Q17 and FY17 consolidated financial accounts as of December 31, 2017.
Jean Pierre Mustier, Chief Executive Officer of UniCredit S.p.A., commenting on the 4Q17 and FY17 results:
“2017 was a pivotal year for UniCredit. We launched the Transform 2019 plan, which is already yielding tangible results, leading to a much improved financial performance and laying the foundations for the future growth and success of UniCredit. We significantly strengthened our capital thanks to our fully subscribed 13 billion euro rights issue and took decisive actions de-risking the balance sheet through an unprecedented 17.7 billion euro transaction on Non Performing Loans, FINO, the second tranche of which closed in January this year. In December we announced that the Non Core division will be completely rundown by 2025, fully self-funded. We also trimmed our perimeter with the disposals of Pekao and Pioneer, and can now wholly focus on our core strategic assets and on strengthening our position as a simple pan European commercial bank with a fully plugged in CIB, delivering our unique Western, Central and Eastern European network to our extensive and growing client franchise. I want to thank all UniCredit colleagues for their long term commitment to the successful transformation of the bank and our shareholders, for their trust and support at this crucial time.
I am also very pleased with the 2017 financial results, which show improvement in all areas and are driven by increasingly strong commercial dynamics across the Group, underpinned by the revamped commercial banking networks, particularly in Italy. Net operating profit for the full year was 5.7 billion, up 74 per cent full year on full year, with adjusted net profit at 3.7 billion and adjusted RoTE at 7.2 per cent. In addition, our stated fourth quarter net profit of 801 million, was our very best fourth quarter in the past decade. Transform 2019 is ahead of schedule and costs were down 4 per cent in the year, cost of risk came to 58 basis points, in line with guidance and our CET1 ratio stood at 13.02 per cent pro forma of the first-time implementation of IFRS9 and the positive impact of the FINO transaction. All in all, a very encouraging year which bode well for the continued implementation of Transform 2019. All the 2019 targets have been confirmed, and we are on track to make UniCredit one of the pan European winners.”

4 | P a g e
4Q17 and FY17 Group Results Press Release
TRANSFORM 2019 UPDATE
Transform 2019 is ahead of schedule and is yielding tangible results:
Strengthen and optimise capital: all decisive actions to strengthen and optimise capital were successfully completed during FY17, thanks to the fully subscribed €13 bn rights issue and the disposals of Bank Pekao and Pioneer. FY17 fully loaded CET1 ratio reached 13.60 per cent, 13.02 per cent pro forma of IFRS9 and FINO.
In addition, the issuances of €2.25 bn Additional Tier 1 notes7 in 2017 (€1.25 bn in May and €1 bn in December 2017) and the inaugural €1.5 bn Senior Non Preferred bond in January 2018 were underpinned by very strong investor demand.
The successful execution of Transform 2019 was confirmed by Moody’s upgrade of UniCredit S.p.A.’s outlook at the beginning of January from stable to positive.
Improve asset quality: the Group balance sheet de-risking continued in 4Q17 with gross NPE further down to €48.4 bn in 4Q17 from €51.3 bn in 3Q17. The risk profile of the Group improved, with gross NPE ratio reduced to 10.2 per cent in 4Q17 (-49 bps Q/Q, -163 bps Y/Y). The coverage ratio remained solid at 56.2 per cent in 4Q17. Gross NPE disposals progressed in 4Q17, achieving €4.4 bn in FY17 of which €2.0 bn in 4Q17. Net NPE decreased to €21.2 bn (-5.1 per cent Q/Q, -15.2 per cent Y/Y) and net NPE ratio dropped to 4.7 per cent in 4Q17 (-22 bps Q/Q, -89 bps Y/Y).
Group Core gross NPE dropped to €22.0 bn with gross NPE ratio down 9 bps Q/Q and 73 bps Y/Y to 4.9 per cent in 4Q17. The coverage ratio remained solid at 55.4 per cent.
Non Core gross NPEs further down to 26.5 bn, on track to reach the €17.2 bn 2019 target.
FINO phase 2 transaction was successfully closed in January 2018, completing the sell down of UniCredit’s stake in FINO to below 20 per cent. Thanks to this successful milestone, and as already communicated on 12 December 2017, UniCredit has notified the European Central Bank (ECB) of the intention to recognise the Significant Risk Transfer (SRT) as of 31 March 2018. The necessary documentation is being finalised in accordance with its regulation and procedures.
Transform operating model: the transformation of the operating model is ahead of plan. Since December 2015 branch closures have progressed well with 682 branches closed in Western Europe, corresponding to 72 per cent of 944 planned closures by 20198.
There was an additional Q/Q reduction of 2,113 FTEs9, corresponding to a decrease of about 9,000 FTEs since December 2015, 64 per cent of the 14,000 planned reductions by 2019.
In addition, the simplification of IT complexity is progressing with the decommissioning of 921 applications, 84 per cent compared to 2019 target.
Maximise commercial bank value: commercial initiatives are in place across the Group, delivering
tangible results. In particular during 2017:
AuM net sales in Commercial Banking Italy reached €11 bn at the end of December, three times higher than FY16, with AuM-related commissions up 28 per cent FY/FY;
new "Smart" or "Cashless" branch formats with a higher degree of automation were implemented in 441 retail branches in Italy out of 800 targeted by 2019, improving customer service;
7Nominal value. 8Retail branches in Italy, Germany and Austria as indicated during the Capital Markets Day. 9Full Time Equivalent.
5 | P a g e
4Q17 and FY17 Group Results Press Release
new service models were implemented in Italy for the affluent and small business client segments and in Germany for small-medium enterprises.
In FY17, UniCredit ranked #1 in “Syndicated Loans in EUR” in Italy, Germany, Austria and CEE as well as in “EMEA Covered Bonds”, #1 by number of transactions in “EMEA Bonds in EUR” and “Combined EMEA Bonds and Loans in EUR”, #1 in IPO in Italy and #2 in IPO in Germany10.
Moreover, CIB won a number of prestigious awards across many products and geography: Best Global Trade Finance Provider for "All Services", "Products/Payments" and "Overall Executions" in Euromoney Trade Finance Survey 2018.
Recently, UniCredit received the “Financing Package 2017” IFR Award thanks to the Transform 2019 recapitalisation/project, as well as “EMEA Secondary Equity Issue” for its €13 bn rights issue completed in 2017.
Adopt a lean but steering Group Corporate Centre (GCC): since December 2015, GCC FTEs were down 12.4 per cent (-2,200 FTEs), a trend confirmed both in 4Q17 and in the FY17. The ratio of GCC costs to Group total costs was 4.1 per cent in FY17, down by 0.3 bps FY/FY (5.1 per cent as at December 2015) versus the 2019 target of 3.5 per cent.
The Group has taken decisive actions to strengthen its corporate governance to align it with international best practices. At the Extraordinary General Meeting held on 4 December 2017, resolutions adopted included: empower the Board of Directors to present its own list of candidates for the renewal of the Board for
the period 2018 to 202111; allow for one additional appointment from the minority to two, in the context of the recommendation
by the Board of Directors to reduce the number of Board members from 17 to 1512; remove the 5 per cent voting rights limits. The 5 per cent limits removal was effective as of 22 January
2018; simplify the share capital structure by converting saving shares into ordinary shares.
On 8 November 2017, the Board of Directors unanimously decided to co-opt Mr. Saccomanni as a non-executive director with a mandate until the Annual General Meeting of 2018 to approve the 2017 financial statements, at which time Mr. Saccomanni and the full Board will stand for election. Considering Mr. Saccomanni's professional background and status, the Board of Directors has concluded that he is the best candidate for the position as chairman of UniCredit for the next Board term.
10All league tables were based on Dealogic source as at 5 January 2018. Period: 1 Jan. – 31 Dec. 2017. Rankings by volume unless otherwise stated. 11During the Extraordinary General Meeting held on 4 December 2017, shareholders approved a motion to allow the Board of Directors to present its own list of candidates for the renewal of the Board for the 2018-21 period. 12In December 2016 the Board of Directors approved to disclose a recommendation for shareholders to consider the reduction of Board members for the next Board renewal in 2018.

6 | P a g e
4Q17 and FY17 Group Results Press Release
UNICREDIT GROUP CONSOLIDATED RESULTS
*Stated fully loaded CET1 ratio in FY16 and 4Q16.
Revenues totalled €19.6 bn in FY17 (+1.7 per cent FY/FY) sustained by resilient NII at €10.3 bn and strong performance in fees at €6.7 bn. Main contributions to revenues came from Commercial Banking Italy, CEE and CIB. Total revenues amounted to €4.8 bn in 4Q17 (+4.2 per cent Q/Q, +7.4 per cent Y/Y).
Strong commercial dynamics were registered across all divisions. In FY17, the number of clients increased by 629,000 from the end of December 2016.
Net interest income (NII)13 was resilient at €10.3 bn in FY17, in line with guidance. NII was almost flat FY/FY (-0.1 per cent) with customer spread compression compensated by lower funding costs. NII totalled €2.6 bn in 4Q17 (+3.3 per cent Q/Q, +7.0 per cent Y/Y). In particular, Q/Q positive commercial dynamics of €47 m was mainly sustained by lower term funding (+€41 m), reduced cost of deposit rates (+€8 m) and TLTRO benefit (+€8 m), partially offset by pressure on customer loan rates (-€8 m). Moreover the positive quarterly trend of NII in 4Q17 benefitted also from €36 m investment portfolio and markets/treasury activities.
Net interest margin14 increased from 1.35 per cent in 3Q17 to 1.39 per cent in 4Q17.
Group customer loans15 were €421.8 bn in 4Q17 (+0.2 per cent Q/Q, +1.0 per cent Y/Y). Group Core customer loans increased to €407.6 bn in 4Q17 up €8.6 bn Y/Y and up €9.6 bn Y/Y before the reclassification to held for sale of €1.0 bn loans in Commercial Banking Germany in 3Q17.
Group customer deposits16 totalled €413.8 bn in 4Q17 (+3.8 per cent Q/Q, +4.5 per cent Y/Y) with the highest contributions coming from Commercial Banking Italy with €142.0 bn (+3.1 per cent Q/Q, +5.6 per cent Y/Y), Commercial Banking Germany with €91.6 bn (+6.1 per cent Q/Q, +6.4 per cent Y/Y) and CEE with €62.4 bn (+3.1 per cent Q/Q and +5.6 per cent Y/Y at constant FX).
Customer spreads17 were flat Q/Q at 2.5 per cent in 4Q17, stabilising across all divisions and down 4 bps Y/Y.
Dividends and other income18 totalled €638 m in FY17 (-21.9 per cent FY/FY) and decreased to €120 m in 4Q17 (-27.5 per cent Q/Q, -19.1 per cent Y/Y). Turkey’s contribution was flat at €311 m in FY17 at constant FX (-17.7 per cent FY/FY at current FX), driven by positive trend of NII sustained by volumes and higher fees thanks
13Net contribution from hedging strategy of non-maturity deposits in FY17 at €1.5 bn and in 4Q17 at €380 m. 14Net interest margin calculated as interest income divided by interest earning assets minus interest expenses divided by interest bearing liabilities. 15End of period accounting volumes calculated excluding repos and, for divisions, excluding also intercompany items. Accounting customer loans including repos amounted to €447.7 bn as at end December 2017 (-0.6 per cent Q/Q, +0.7 per cent Y/Y). 16End of period accounting volumes calculated excluding repos and for divisions, excluding also intercompany items. Accounting customer deposits including repos amounted to €462.9 bn as at end December 2017 (+5.6 per cent Q/Q, +2.3 per cent Y/Y). 17Customer spreads defined as the difference between rate on customer loans and rate on customer deposits. 18Include dividends and equity investments. Turkey is valued at equity method and contributes to the dividend line to the Group P&L based on managerial view.
(€ million) FY16 adj. FY17 FY/FY 4Q16 adj. 3Q17 4Q17 Y/Y Q/QTotal Revenues 19,295 19,619 +1.7% 4,509 4,646 4,842 +7.4% +4.2%
Operating costs -11,827 -11,350 -4.0% -2,930 -2,813 -2,794 -4.6% -0.7%
LLP -4,207 -2,605 -38.1% -1,486 -598 -772 -48.1% +29.1%
Net profit n.m. 5,473 n.m. n.m. 2,820 801 n.m. -71.6%
Adjusted net profit 1,297 3,708 n.m. -352 838 708 n.m. -15.5%
Fully loaded CET1 ratio* 7.54% 13.60% +6.1pp 7.54% 13.81% 13.60% +6.1pp -0.2pp
Adjusted RoTE 2.0% 7.2% +5.2pp n.m. 6.8% 5.5% n.m. -1.3pp
Loans (excl. repos) - bn 418 422 +1.0% 418 421 422 1.0% +0.2%
Gross NPE - bn 56 48 -14.0% 56 51 48 -14.0% -5.6%
Deposits (excl. repos)- bn 396 414 +4.5% 396 399 414 +4.5% +3.8%
Cost/income 61.3% 57.9% -3.4pp 65.0% 60.5% 57.7% -7.3pp -2.9pp
Cost of risk (bps) 93 58 -35 132 53 69 -64 +16

7 | P a g e
4Q17 and FY17 Group Results Press Release
to increasing clients. Turkey’s contribution amounted to €49 m in 4Q17 (-34.7 per cent Q/Q and +7.5 per cent Y/Y at constant FX). Other dividends were down 25.5 per cent FY/FY to €327 m, mainly due to non-recurring dividends from non-strategic participations in FY16 (e.g. Bank of Italy).
Fees and commissions19 grew by 7.1 per cent FY/FY to €6.7 bn in FY17 thanks to strong commercial dynamics. In 4Q17, fees increased to €1.7 bn (+5.7 per cent Q/Q, +12.3 per cent Y/Y). In particular: the contribution from investment services fees reached €2.8 bn in FY17 (+15.8 per cent FY/FY) and €709
m in 4Q17, up 11.2 per cent compared to the previous quarter and 27.0 per cent Y/Y thanks to continuous transformation of customers liquidity into AuMs, supported by the partnership with Amundi and by the decision to stop the distribution of network bonds in retail Italy.
Financing services fees was €1.7 bn in FY17 (-3.7 per cent FY/FY) and €414 m in 4Q17, up 4.6 per cent Q/Q and 4.3 per cent Y/Y, sustained by intense capital markets and structured finance activities despite the competitive environment.
Transactional fees amounted to €2.2 bn in FY17 (+6.3 per cent FY/FY) and to €560 m in 4Q17, flat Q/Q and up 3.0 per cent Y/Y sustained by collections and payment services.
Total Financial Assets (TFA)20 rose €20.1 bn in the quarter reaching €824.0 bn as at 31 December 2017 (+2.5 per cent Q/Q, +4.1 per cent Y/Y). In particular: AuM amounted to €218.4 bn in 4Q17, up €7.0 bn Q/Q and €21.4 bn Y/Y sustained by strong commercial
dynamics mainly in Commercial Banking Italy and Germany. In particular, the AuM/TFA ratio in Commercial Banking Italy increased to 36.9 per cent as at December 2017, up 2.7 p.p. Y/Y. Net sales amounted to €19.1 bn in FY17 up €12.4 bn FY/FY.
Assets under Custody (AuC) went down to €202.0 bn in 4Q17 (-€1.4 bn Q/Q, -€8.5 bn Y/Y), mainly in Commercial Banking Italy.
Leveraging on UniCredit’s unique commercial network, deposits were €403.6 bn in 4Q17, up €14.6 bn Q/Q sustained by positive dynamics mainly in Commercial Banking Germany, Commercial Banking Italy and CIB and up €19.8 bn Y/Y.
Trading income totalled €1.8 bn in FY17, up 3.5 per cent FY/FY and €384 m in 4Q17 (+0.8 per cent Q/Q and +39.4 per cent Q/Q adjusted for non-recurring capital gains21, -16.4 per cent Y/Y). Client driven activities increased to 71.4 per cent in 4Q17 (+18.4 p.p. Q/Q).
Operating costs were well managed, at €11.4 bn in FY17 (-4.0 per cent FY/FY), ahead of schedule, thanks to disciplined cost control. In particular: HR expenses were down to €6.9 bn in FY17, decreasing 3.1 per cent FY/FY, and Non-HR costs22 decreased to €4.4 bn in FY17 (-5.5 per cent FY/FY), mainly in real estate, consulting and
depreciation.
The number of employees reached 91,952 in 4Q17, down by 6,352 FTEs FY/FY and down about 9,000 FTEs since December 2015, 64 per cent of the 14,000 planned reductions by 2019. Branch closures were ahead of schedule, decreased 517 units in FY17 to 4,820 (of which 3,127 in Western Europe and 1,693 in CEE)23. Since December 2015, branch closures in Western Europe progressed well with 682 branches closed, corresponding to 72 per cent of 944 planned closures by 2019. C/I ratio was down 3.4 p.p. FY/FY to 57.9 per cent and 57.7 per cent in 4Q17 (-2.9 p.p. Q/Q, -7.3 p.p. Y/Y).
19All 2016 and 2017 figures have been restated for the consolidation effects arising from the intercompany fees relating to Bank Pekao and Pioneer, which until 2Q17 were classified as held for sale, in accordance to IFRS5 principle. 20It refers to Group Commercial TFA. Non-commercial elements, e.g. Group Corporate Centre, Non-Core, Leasing/Factoring and Market Counterparts, are excluded. Managerial figures. 21Non-recurring capital gains pre-tax: (i) in 3Q17 equal to +€87 m in CIB and +€39 m in Commercial Banking Germany, (ii) in 4Q17 equal to +€28 m in Commercial Banking Germany. 22Non HR costs include “other administrative expenses”, “recovery of expenses” and “amortisation, depreciation and impairment losses on intangible and tangible assets”. 23Branches at Capital Markets Day perimeter. For branches number at regulatory perimeter please see “UniCredit Group: staff and branches” table included in this document.

8 | P a g e
4Q17 and FY17 Group Results Press Release
Total expenses declined to €2.8 bn in 4Q17 (-0.7 per cent Q/Q, -4.6 per cent Y/Y), with HR costs amounting to €1.7 bn almost flat Q/Q and up 2.2 per cent Y/Y impacted by resumed bonus accruals (4Q16 benefitted from €100 m lower accruals of variable compensation) and FTE exits skewed towards the end of the quarter. Non-HR costs stood at €1.1 bn (-1.4 per cent Q/Q, -13.6 per cent Y/Y). No seasonal increase in Non HR costs in 4Q17 in contrast to previous years, thanks to expense recoveries from workout (mainly in Non Core).
FY18 and FY19 total cost targets are confirmed at €11.0 bn and at €10.6 bn.
Gross operating profit totalled €8.3 bn in FY17 (+10.7 per cent FY/FY) and reached €2.0 bn in 4Q17 (+11.8 per cent Q/Q, +29.7 per cent Y/Y).
LLPs amounted to €2.6 bn in FY17 (-38.1 per cent FY/FY) and to €772 m in 4Q17 (+29.1 per cent Q/Q, -48.1 per cent Y/Y). Quarterly CoR came to 69 bps (+16 bps Q/Q, -64 bps Y/Y), including 15 bps models impact, and 58 bps in FY17, including 5 bps models impact. FY17 CoR in line with guidance. FY19 CoR target of 55 bps confirmed.
Net operating profit up 73.7 per cent FY/FY at €5.7 bn in FY17 thanks to strong underlying commercial performance and strict cost and risk discipline. Net operating profit increased to €1.3 bn in 4Q17 (+3.4 per cent Q/Q, n.m. Y/Y), confirming the strong underlying business momentum.
Other charges and provisions amounted to €1.1 bn in FY17 down 12.6 per cent FY/FY. Systemic charges down 17.3 per cent to €588 m in FY17. In 4Q17, other charges and provisions decreased to €193 m (-29.2 per cent Q/Q, -20.9 per cent Y/Y).
Income tax was €609 m in FY17 (-24.4 per cent FY/FY) and at €66 m in 4Q17 (-63.8 per cent Q/Q, -22.3 per cent Y/Y). In 4Q17, the tax rate was low and the good performance across all divisions resulted in some DTA write-ups, almost fully compensating the negative impact of non-operating items.
Profit from discontinued operations increased to €2.3 bn in FY17 and included the net effect of Bank Pekao and Pioneer disposals. Profit from discontinued operations came to €96 m in 4Q17.
The good performance across all business divisions led to an adjusted Group net profit at €3.7 bn in FY17 excluding the impacts from Bank Pekao and Pioneer disposals and the negative impact from a one-off charge booked in Non Core in 3Q17. Adjusted RoTE was 7.2 per cent in FY17. Stated Group net profit came to €5.5 bn in FY17. Positive operating performance was registered across all divisions, with CEE, CIB and Commercial Banking Italy as main contributors to the earnings generation (net profit of €1.6 bn, €1.4 bn and €1.2 bn respectively, in FY17).
In 4Q17, adjusted net profit was €708 m and the adjusted RoTE at 5.5 per cent. Stated net profit was €801 m in 4Q17.
9 | P a g e
4Q17 and FY17 Group Results Press Release
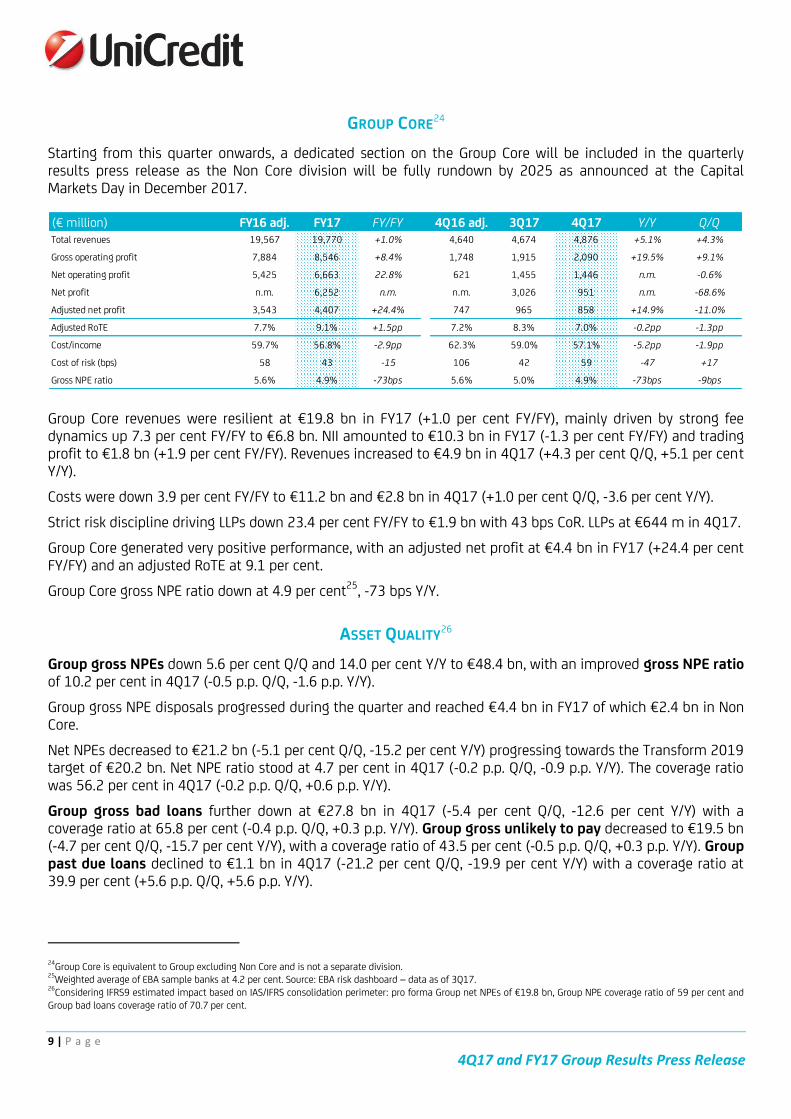
GROUP CORE24
Starting from this quarter onwards, a dedicated section on the Group Core will be included in the quarterly results press release as the Non Core division will be fully rundown by 2025 as announced at the Capital Markets Day in December 2017.
Group Core revenues were resilient at €19.8 bn in FY17 (+1.0 per cent FY/FY), mainly driven by strong fee dynamics up 7.3 per cent FY/FY to €6.8 bn. NII amounted to €10.3 bn in FY17 (-1.3 per cent FY/FY) and trading profit to €1.8 bn (+1.9 per cent FY/FY). Revenues increased to €4.9 bn in 4Q17 (+4.3 per cent Q/Q, +5.1 per cent Y/Y).
Costs were down 3.9 per cent FY/FY to €11.2 bn and €2.8 bn in 4Q17 (+1.0 per cent Q/Q, -3.6 per cent Y/Y).
Strict risk discipline driving LLPs down 23.4 per cent FY/FY to €1.9 bn with 43 bps CoR. LLPs at €644 m in 4Q17.
Group Core generated very positive performance, with an adjusted net profit at €4.4 bn in FY17 (+24.4 per cent FY/FY) and an adjusted RoTE at 9.1 per cent.
Group Core gross NPE ratio down at 4.9 per cent25, -73 bps Y/Y.
ASSET QUALITY26
Group gross NPEs down 5.6 per cent Q/Q and 14.0 per cent Y/Y to €48.4 bn, with an improved gross NPE ratio of 10.2 per cent in 4Q17 (-0.5 p.p. Q/Q, -1.6 p.p. Y/Y).
Group gross NPE disposals progressed during the quarter and reached €4.4 bn in FY17 of which €2.4 bn in Non Core.
Net NPEs decreased to €21.2 bn (-5.1 per cent Q/Q, -15.2 per cent Y/Y) progressing towards the Transform 2019 target of €20.2 bn. Net NPE ratio stood at 4.7 per cent in 4Q17 (-0.2 p.p. Q/Q, -0.9 p.p. Y/Y). The coverage ratio was 56.2 per cent in 4Q17 (-0.2 p.p. Q/Q, +0.6 p.p. Y/Y).
Group gross bad loans further down at €27.8 bn in 4Q17 (-5.4 per cent Q/Q, -12.6 per cent Y/Y) with a coverage ratio at 65.8 per cent (-0.4 p.p. Q/Q, +0.3 p.p. Y/Y). Group gross unlikely to pay decreased to €19.5 bn (-4.7 per cent Q/Q, -15.7 per cent Y/Y), with a coverage ratio of 43.5 per cent (-0.5 p.p. Q/Q, +0.3 p.p. Y/Y). Group past due loans declined to €1.1 bn in 4Q17 (-21.2 per cent Q/Q, -19.9 per cent Y/Y) with a coverage ratio at 39.9 per cent (+5.6 p.p. Q/Q, +5.6 p.p. Y/Y).
24Group Core is equivalent to Group excluding Non Core and is not a separate division. 25Weighted average of EBA sample banks at 4.2 per cent. Source: EBA risk dashboard – data as of 3Q17. 26Considering IFRS9 estimated impact based on IAS/IFRS consolidation perimeter: pro forma Group net NPEs of €19.8 bn, Group NPE coverage ratio of 59 per cent and Group bad loans coverage ratio of 70.7 per cent.
(€ million) FY16 adj. FY17 FY/FY 4Q16 adj. 3Q17 4Q17 Y/Y Q/QTotal revenues 19,567 19,770 +1.0% 4,640 4,674 4,876 +5.1% +4.3%
Gross operating profit 7,884 8,546 +8.4% 1,748 1,915 2,090 +19.5% +9.1%
Net operating profit 5,425 6,663 22.8% 621 1,455 1,446 n.m. -0.6%
Net profit n.m. 6,252 n.m. n.m. 3,026 951 n.m. -68.6%
Adjusted net profit 3,543 4,407 +24.4% 747 965 858 +14.9% -11.0%
Adjusted RoTE 7.7% 9.1% +1.5pp 7.2% 8.3% 7.0% -0.2pp -1.3pp
Cost/income 59.7% 56.8% -2.9pp 62.3% 59.0% 57.1% -5.2pp -1.9pp
Cost of risk (bps) 58 43 -15 106 42 59 -47 +17
Gross NPE ratio 5.6% 4.9% -73bps 5.6% 5.0% 4.9% -73bps -9bps

10 | P a g e
4Q17 and FY17 Group Results Press Release
Ongoing de-risking in Group Core with gross NPEs down to €22.0 bn in 4Q17 and gross NPE ratio dropped to 4.9 per cent (-73 bps Y/Y). Coverage ratio was 55.4 per cent. Gross bad loans further decreased to €10.7 bn in 4Q17 (-15.7 per cent Y/Y) with a coverage ratio of 68.4 per cent. Gross unlikely to pay amounted to €10.2 bn in 4Q17 (-6.5 per cent Y/Y) with a coverage ratio of 43.3 per cent.
Inflows from performing loans to NPEs amounted to €1.8 bn in 4Q17 impacted by seasonality and some single names. The default rate stood at 1.8 per cent in 4Q17 down from 2.0 per cent in 4Q16. The cure rate27 amounted to 6.8 per cent in 4Q17 (-0.2 p.p. Q/Q). Unlikely-to-pay migrating to bad loans significantly reduced to €202 m in 4Q17, improving from €438 m in 3Q17.
Commercial Banking Italy gross NPEs stood at €9.6 bn in 4Q17 (-0.7 per cent Q/Q), with a gross NPE ratio at 6.6 per cent (-1.1 p.p. Q/Q, -2.0 p.p. Y/Y) and a coverage ratio at 52.2 per cent. Net NPEs at €4.6 bn with a net NPE ratio down to 3.3 per cent in 4Q17. Gross bad loans down to €4.5 bn (-4.1 per cent Q/Q, -0.6 per cent Y/Y) with a coverage ratio of 65.7 per cent in 4Q17. Gross unlikely to pay up to €4.6 bn (+5.3 per cent Q/Q, +2.5 per cent Y/Y) with an increased coverage ratio of 41.2 per cent in 4Q17.
Inflows to NPEs in Commercial Banking Italy amounted to €776 m in 4Q17 with a default rate at 2.4 per cent in 4Q17 down from 3.1 per cent in 4Q16. Unlikely-to-pay migrating to bad loans continued to slow down (20.1 per cent in 4Q17 vs 21.5 per cent in 3Q17 and 49.5 per cent in 4Q16).
The rundown of the Non Core progressed in the quarter with gross loans down to €29.8 bn in 4Q17 (-€2.7 bn Q/Q, -€7.3 bn Y/Y), on track to reach the target of €17.2 bn in 2019 and the fully self-funded rundown in 2025. The improvement in the Non Core was supported by: i) back to Core (€0.5 bn, mainly driven by corporates), ii) repayments (€0.2 bn), iii) recoveries (€0.4 bn), iv) write-offs (€0.4 bn) and v) disposals (€1.2 bn). Gross NPE decreased to €26.5 bn in 4Q17 (-8.1 per cent Q/Q, -15.9 per cent Y/Y). Net NPE down to €11.4 bn in 4Q17 (-7.7 per cent Q/Q, -17.0 per cent Y/Y) in line with 2017 target. NPE coverage ratio stood at 56.9 per cent in 4Q17 (-0.2 p.p. Q/Q, +0.6 p.p. Y/Y).
FINO phase 2 transaction was successfully closed in January 2018, completing the sell down of UniCredit’s stake in FINO to below 20 per cent. Thanks to this successful milestone, and as already communicated on 12 December 2017, UniCredit has notified the ECB of intention to recognise the SRT as of 31 March 2018. The necessary documentation is being finalised in accordance with its regulation and procedures.
CAPITAL & FUNDING
The decisive actions included in the Transform 2019 plan combined with the positive results at Group level contributed to strengthening the fully loaded CET1 ratio to 13.60 per cent in 4Q17, including 24 bps of negative impact from regulation, models and procyclicality in the quarter. CET1 ratio was 13.02 per cent pro forma of the first-time adoption impact of IFRS928 and the closing of FINO29.
CET1 benefitted from the positive contribution of 4Q17 earnings generation (+23 bps Q/Q) offset by higher RWA (-24 bps), dividend accrual and AT1 coupon payments30 (-7 bps Q/Q), the reserves negative dynamics (-5 bps Q/Q) and other (-8 bps Q/Q).
FY18 fully loaded CET1 ratio confirmed between 12.2 per cent and 12.7 per cent.
27Back to performing. 28The effects arising from IFRS9 adoption in terms of impairment can be preliminarily estimated around -78 bps on fully loaded CET1 ratio (gross of tax) which is equivalent to ca. €-2.9bn. This effect is mostly driven by the introduction of disposal scenarios in the level of impairment measurement of Stage 3 credit exposures so to reflect the Group NPL asset strategy as well as the lifetime expected credit loss on credit exposures allocated to Stage 2. The effect arising from changes in classification categories can be preliminarily estimated around +3 bps on fully loaded CET1 ratio (gross of tax) which is equivalent to about €0.1 bn. Overall adjustments to the carrying value of financial instruments due to IFRS9 transition can be estimated around -75 bps on fully loaded CET1 ratio (gross of tax) which is equivalent to ca. -€2.8 bn. The overall "net impact" on the fully loaded CET1 ratio is expected at ca.-40 bps as the FTA will be partially compensated by tax effects and lower shortfall over the course of FY18. 29Please refer to footnote n.5. 30Coupons on AT1 instruments paid in 4Q17 equal to €109 m before tax.

11 | P a g e
4Q17 and FY17 Group Results Press Release
The proposed cash dividend is €0.32 per share equal to €0.7 bn, equivalent to 20 per cent payout ratio on normalised31 earnings.
In 4Q17, transitional CET1 ratio was 13.73 per cent, transitional Tier 1 ratio stood at 15.36 per cent and transitional total capital ratio at 18.10 per cent. All ratios are confirmed well above capital requirements32.
RWA transitional totalled €356.1 bn in 4Q17 increasing by €6.1 bn since September 2017. In particular, credit RWA33 were up €9.1 bn in the quarter mainly affected by business evolution (+€3.6 bn Q/Q, reflecting seasonal business growth), regulation, procyclicality & models (+€6.0 bn) and business actions & other credit risk (+€0.6 bn Q/Q). These items were partially offset by FX effect (-€1.1 bn Q/Q) mainly due to depreciation of Turkish Lira. Market RWA were up €1.9 bn Q/Q due to higher intensity of market making activity. Operational RWA dropped to €4.9 bn Q/Q.
Fully loaded leverage ratio increased to 5.55 per cent in 4Q17 (+13 bps Q/Q, +89 bps Y/Y34). Transitional leverage ratio rose to 5.73 per cent in 4Q17 (+13 bps Q/Q, +79 bps Y/Y34).
Funding plan 2017 was executed for €22.0 bn by the end of December. TLTRO II overall outstanding amount is equal to €51.2 bn on a consolidated basis35.
31Normalised earnings exclude the net impact of Bank Pekao and Pioneer and disposals (+€2.1 bn in 3Q17, +€93 m in 4Q17) and -€310 m FX reserve in 2Q17 related to Bank Pekao. 32Transitional capital requirements and buffers for UniCredit Group as at 31 December 2017: 8.78 per cent CET1 ratio (4.5 per cent P1 + 2.5 per cent P2 + 1.78 per cent combined capital buffer); 10.28 per cent T1 ratio (6 per cent P1 + 2.5 per cent P2 + 1.78 per cent combined capital buffer); 12.28 per cent Total Capital ratio (8 per cent P1 + 2.5 per cent P2 + 1.78 per cent combined capital buffer). For 2018, SREP P2 requirement was reduced by 50 bps to 200 bps. 33Business evolution: changes related to loan evolution. Business actions: initiatives to proactively decrease RWA (e.g. securitisations, changes in collaterals). Models: methodological changes to existing or new models. Procyclicality: change in macro-economic framework or client's credit worthiness. Regulation: changes in regulation (e.g. CRR or CRD). FX: : impact from other exposures in foreign currencies. 34In 4Q16, leverage ratio includes the benefit of capital increase and the reversal of thresholds related to financial participations and DTA. 35Breakdown by country: €33.6 bn have been taken in Italy, €12.6 bn in Germany, €4.0 bn in Austria, €0.9 bn in CEE.
12 | P a g e
4Q17 and FY17 Group Results Press Release
DIVISIONAL QUARTERLY HIGHLIGHTS36
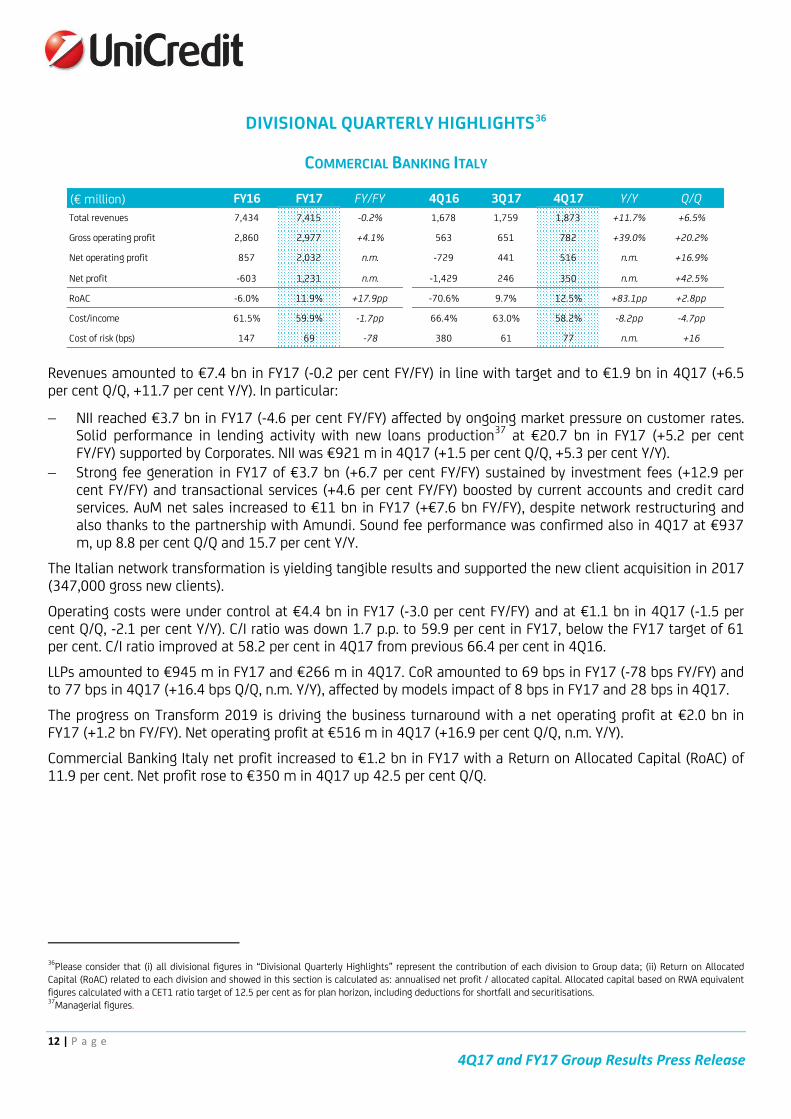
COMMERCIAL BANKING ITALY
Revenues amounted to €7.4 bn in FY17 (-0.2 per cent FY/FY) in line with target and to €1.9 bn in 4Q17 (+6.5 per cent Q/Q, +11.7 per cent Y/Y). In particular:
NII reached €3.7 bn in FY17 (-4.6 per cent FY/FY) affected by ongoing market pressure on customer rates. Solid performance in lending activity with new loans production37 at €20.7 bn in FY17 (+5.2 per cent FY/FY) supported by Corporates. NII was €921 m in 4Q17 (+1.5 per cent Q/Q, +5.3 per cent Y/Y).
Strong fee generation in FY17 of €3.7 bn (+6.7 per cent FY/FY) sustained by investment fees (+12.9 per cent FY/FY) and transactional services (+4.6 per cent FY/FY) boosted by current accounts and credit card services. AuM net sales increased to €11 bn in FY17 (+€7.6 bn FY/FY), despite network restructuring and also thanks to the partnership with Amundi. Sound fee performance was confirmed also in 4Q17 at €937 m, up 8.8 per cent Q/Q and 15.7 per cent Y/Y.
The Italian network transformation is yielding tangible results and supported the new client acquisition in 2017 (347,000 gross new clients).
Operating costs were under control at €4.4 bn in FY17 (-3.0 per cent FY/FY) and at €1.1 bn in 4Q17 (-1.5 per cent Q/Q, -2.1 per cent Y/Y). C/I ratio was down 1.7 p.p. to 59.9 per cent in FY17, below the FY17 target of 61 per cent. C/I ratio improved at 58.2 per cent in 4Q17 from previous 66.4 per cent in 4Q16.
LLPs amounted to €945 m in FY17 and €266 m in 4Q17. CoR amounted to 69 bps in FY17 (-78 bps FY/FY) and to 77 bps in 4Q17 (+16.4 bps Q/Q, n.m. Y/Y), affected by models impact of 8 bps in FY17 and 28 bps in 4Q17.
The progress on Transform 2019 is driving the business turnaround with a net operating profit at €2.0 bn in FY17 (+1.2 bn FY/FY). Net operating profit at €516 m in 4Q17 (+16.9 per cent Q/Q, n.m. Y/Y).
Commercial Banking Italy net profit increased to €1.2 bn in FY17 with a Return on Allocated Capital (RoAC) of 11.9 per cent. Net profit rose to €350 m in 4Q17 up 42.5 per cent Q/Q.
36Please consider that (i) all divisional figures in “Divisional Quarterly Highlights” represent the contribution of each division to Group data; (ii) Return on Allocated Capital (RoAC) related to each division and showed in this section is calculated as: annualised net profit / allocated capital. Allocated capital based on RWA equivalent figures calculated with a CET1 ratio target of 12.5 per cent as for plan horizon, including deductions for shortfall and securitisations. 37Managerial figures.
(€ million) FY16 FY17 FY/FY 4Q16 3Q17 4Q17 Y/Y Q/Q
Total revenues 7,434 7,415 -0.2% 1,678 1,759 1,873 +11.7% +6.5%
Gross operating profit 2,860 2,977 +4.1% 563 651 782 +39.0% +20.2%
Net operating profit 857 2,032 n.m. -729 441 516 n.m. +16.9%
Net profit -603 1,231 n.m. -1,429 246 350 n.m. +42.5%
RoAC -6.0% 11.9% +17.9pp -70.6% 9.7% 12.5% +83.1pp +2.8pp
Cost/income 61.5% 59.9% -1.7pp 66.4% 63.0% 58.2% -8.2pp -4.7pp
Cost of risk (bps) 147 69 -78 380 61 77 n.m. +16
13 | P a g e
4Q17 and FY17 Group Results Press Release
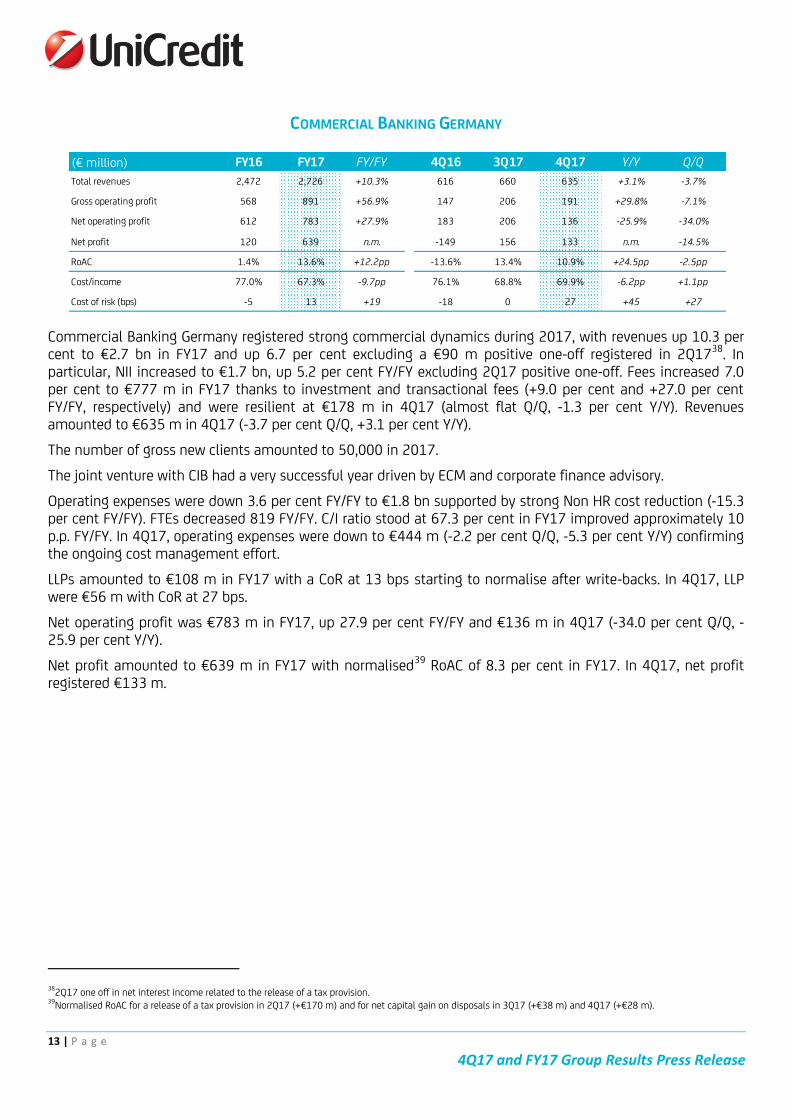
COMMERCIAL BANKING GERMANY
Commercial Banking Germany registered strong commercial dynamics during 2017, with revenues up 10.3 per cent to €2.7 bn in FY17 and up 6.7 per cent excluding a €90 m positive one-off registered in 2Q1738. In particular, NII increased to €1.7 bn, up 5.2 per cent FY/FY excluding 2Q17 positive one-off. Fees increased 7.0 per cent to €777 m in FY17 thanks to investment and transactional fees (+9.0 per cent and +27.0 per cent FY/FY, respectively) and were resilient at €178 m in 4Q17 (almost flat Q/Q, -1.3 per cent Y/Y). Revenues amounted to €635 m in 4Q17 (-3.7 per cent Q/Q, +3.1 per cent Y/Y).
The number of gross new clients amounted to 50,000 in 2017.
The joint venture with CIB had a very successful year driven by ECM and corporate finance advisory.
Operating expenses were down 3.6 per cent FY/FY to €1.8 bn supported by strong Non HR cost reduction (-15.3 per cent FY/FY). FTEs decreased 819 FY/FY. C/I ratio stood at 67.3 per cent in FY17 improved approximately 10 p.p. FY/FY. In 4Q17, operating expenses were down to €444 m (-2.2 per cent Q/Q, -5.3 per cent Y/Y) confirming the ongoing cost management effort.
LLPs amounted to €108 m in FY17 with a CoR at 13 bps starting to normalise after write-backs. In 4Q17, LLP were €56 m with CoR at 27 bps.
Net operating profit was €783 m in FY17, up 27.9 per cent FY/FY and €136 m in 4Q17 (-34.0 per cent Q/Q, -25.9 per cent Y/Y).
Net profit amounted to €639 m in FY17 with normalised39 RoAC of 8.3 per cent in FY17. In 4Q17, net profit registered €133 m.
382Q17 one off in net interest income related to the release of a tax provision. 39Normalised RoAC for a release of a tax provision in 2Q17 (+€170 m) and for net capital gain on disposals in 3Q17 (+€38 m) and 4Q17 (+€28 m).
(€ million) FY16 FY17 FY/FY 4Q16 3Q17 4Q17 Y/Y Q/Q
Total revenues 2,472 2,726 +10.3% 616 660 635 +3.1% -3.7%
Gross operating profit 568 891 +56.9% 147 206 191 +29.8% -7.1%
Net operating profit 612 783 +27.9% 183 206 136 -25.9% -34.0%
Net profit 120 639 n.m. -149 156 133 n.m. -14.5%
RoAC 1.4% 13.6% +12.2pp -13.6% 13.4% 10.9% +24.5pp -2.5pp
Cost/income 77.0% 67.3% -9.7pp 76.1% 68.8% 69.9% -6.2pp +1.1pp
Cost of risk (bps) -5 13 +19 -18 0 27 +45 +27

14 | P a g e
4Q17 and FY17 Group Results Press Release
COMMERCIAL BANKING AUSTRIA
Revenues amounted to €1.6 bn in FY17, down 5.4 per cent FY/FY due to the positive 2016 Visa Europe sale impact. In particular, NII was down 10.5 per cent FY/FY at €691 m affected by a persisting negative rate environment. New loans production40 was stable at €6.7 bn in FY17. Fee generation was up 4.8 per cent FY/FY to €623 m mainly driven by investment services (+5.8 per cent FY/FY) sustained by AuM volume growth of 4.3 per cent FY/FY at €23.1 bn. In 4Q17 revenues increased to €397 m (+3.3 per cent Q/Q, -0.8 per cent Y/Y).
Number of gross new clients were 51,000 in 2017.
In FY17, the organisational streamlining was almost completed. Total expenses decreased 12.2 per cent FY/FY to €1.1 bn thanks to a reduction both in terms of HR costs (-9.7 per cent FY/FY) and Non HR costs (-14.9 per cent FY/FY). In 4Q17, total expenses came to €269 m (+3.2 per cent Q/Q, -12.8 per cent Y/Y). C/I ratio was down 70.0 per cent in FY17, 5.4 p.p lower than previous year and was 67.7 per cent in 4Q17, in line with the previous quarter and improving 9.3 p.p. Y/Y.
Some write backs of LLPs were booked in 2017, leading to a net release of LLPs of €32 m at the end of the year; €35 m of LLPs were booked in 4Q17 with a CoR at 31 bps (+19 bps Q/Q, -19 bps Y/Y).
Net operating profit was up 34.0 per cent FY/FY at €497 m in FY17 thanks to cost reduction and net write-backs. Net operating profit at €93 m in 4Q17 (-15.4 per cent Q/Q).
Net profit increased to €557 m in FY17 with a normalised41 RoAC of 16.7 per cent. Net profit was €96 m in 4Q17 (-48.8 per cent Q/Q).
40Managerial figures. 41Normalised RoAC for real estate disposals (+€65 m) and tax effects (+€17 m) in 3Q17.
(€ million) FY16 FY17 FY/FY 4Q16 3Q17 4Q17 Y/Y Q/Q
Total revenues 1,639 1,550 -5.4% 401 385 397 -0.8% +3.3%
Gross operating profit 403 465 +15.4% 92 124 128 +39.4% +3.4%
Net operating profit 371 497 +34.0% 32 110 93 n.m. -15.4%
Net profit -384 557 n.m. -364 188 96 n.m. -48.8%
RoAC -13.6% 19.6% +33.2pp -50.9% 26.7% 14.4% +65.3pp -12.3pp
Cost/income 75.4% 70.0% -5.4pp 77.0% 67.7% 67.7% -9.3pp -0.0pp
Cost of risk (bps) 7 -7 -13 49 12 31 -19 +19
15 | P a g e
4Q17 and FY17 Group Results Press Release
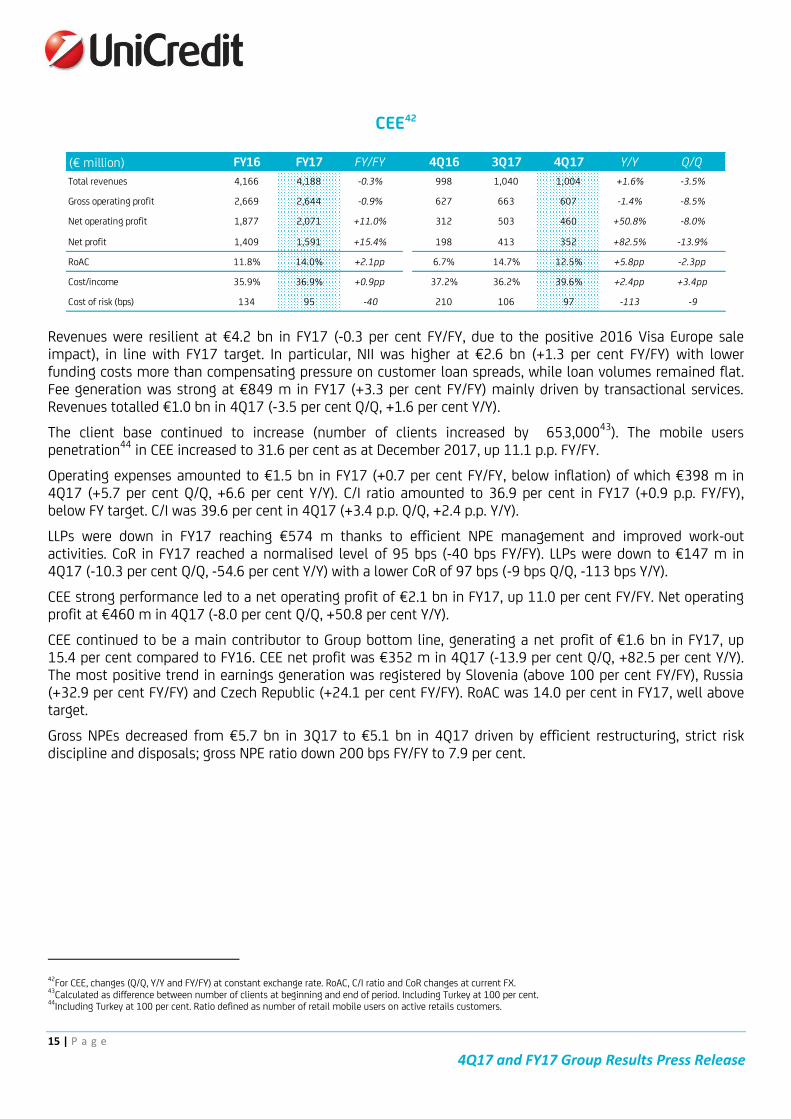
CEE42
Revenues were resilient at €4.2 bn in FY17 (-0.3 per cent FY/FY, due to the positive 2016 Visa Europe sale impact), in line with FY17 target. In particular, NII was higher at €2.6 bn (+1.3 per cent FY/FY) with lower funding costs more than compensating pressure on customer loan spreads, while loan volumes remained flat. Fee generation was strong at €849 m in FY17 (+3.3 per cent FY/FY) mainly driven by transactional services. Revenues totalled €1.0 bn in 4Q17 (-3.5 per cent Q/Q, +1.6 per cent Y/Y).
The client base continued to increase (number of clients increased by 653,00043). The mobile users penetration44 in CEE increased to 31.6 per cent as at December 2017, up 11.1 p.p. FY/FY.
Operating expenses amounted to €1.5 bn in FY17 (+0.7 per cent FY/FY, below inflation) of which €398 m in 4Q17 (+5.7 per cent Q/Q, +6.6 per cent Y/Y). C/I ratio amounted to 36.9 per cent in FY17 (+0.9 p.p. FY/FY), below FY target. C/I was 39.6 per cent in 4Q17 (+3.4 p.p. Q/Q, +2.4 p.p. Y/Y).
LLPs were down in FY17 reaching €574 m thanks to efficient NPE management and improved work-out activities. CoR in FY17 reached a normalised level of 95 bps (-40 bps FY/FY). LLPs were down to €147 m in 4Q17 (-10.3 per cent Q/Q, -54.6 per cent Y/Y) with a lower CoR of 97 bps (-9 bps Q/Q, -113 bps Y/Y).
CEE strong performance led to a net operating profit of €2.1 bn in FY17, up 11.0 per cent FY/FY. Net operating profit at €460 m in 4Q17 (-8.0 per cent Q/Q, +50.8 per cent Y/Y).
CEE continued to be a main contributor to Group bottom line, generating a net profit of €1.6 bn in FY17, up 15.4 per cent compared to FY16. CEE net profit was €352 m in 4Q17 (-13.9 per cent Q/Q, +82.5 per cent Y/Y). The most positive trend in earnings generation was registered by Slovenia (above 100 per cent FY/FY), Russia (+32.9 per cent FY/FY) and Czech Republic (+24.1 per cent FY/FY). RoAC was 14.0 per cent in FY17, well above target.
Gross NPEs decreased from €5.7 bn in 3Q17 to €5.1 bn in 4Q17 driven by efficient restructuring, strict risk discipline and disposals; gross NPE ratio down 200 bps FY/FY to 7.9 per cent.
42For CEE, changes (Q/Q, Y/Y and FY/FY) at constant exchange rate. RoAC, C/I ratio and CoR changes at current FX. 43Calculated as difference between number of clients at beginning and end of period. Including Turkey at 100 per cent. 44Including Turkey at 100 per cent. Ratio defined as number of retail mobile users on active retails customers.
(€ million) FY16 FY17 FY/FY 4Q16 3Q17 4Q17 Y/Y Q/Q
Total revenues 4,166 4,188 -0.3% 998 1,040 1,004 +1.6% -3.5%
Gross operating profit 2,669 2,644 -0.9% 627 663 607 -1.4% -8.5%
Net operating profit 1,877 2,071 +11.0% 312 503 460 +50.8% -8.0%
Net profit 1,409 1,591 +15.4% 198 413 352 +82.5% -13.9%
RoAC 11.8% 14.0% +2.1pp 6.7% 14.7% 12.5% +5.8pp -2.3pp
Cost/income 35.9% 36.9% +0.9pp 37.2% 36.2% 39.6% +2.4pp +3.4pp
Cost of risk (bps) 134 95 -40 210 106 97 -113 -9
16 | P a g e
4Q17 and FY17 Group Results Press Release
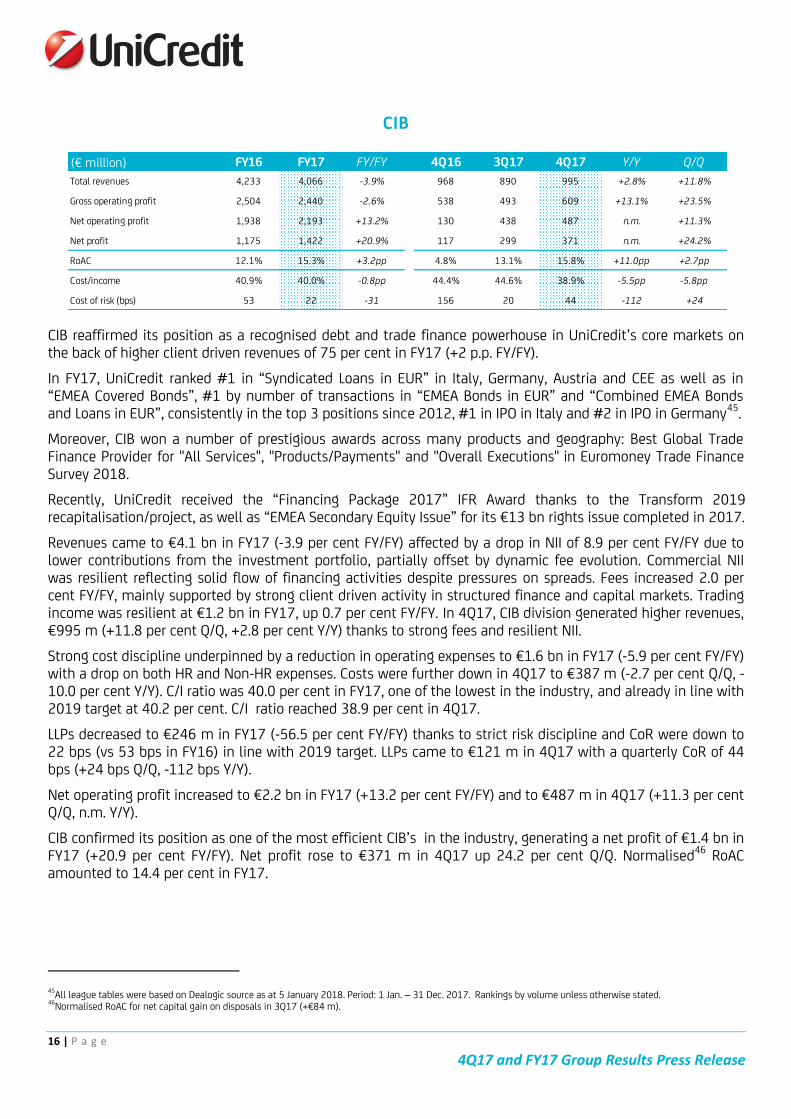
CIB
CIB reaffirmed its position as a recognised debt and trade finance powerhouse in UniCredit’s core markets on the back of higher client driven revenues of 75 per cent in FY17 (+2 p.p. FY/FY).
In FY17, UniCredit ranked #1 in “Syndicated Loans in EUR” in Italy, Germany, Austria and CEE as well as in “EMEA Covered Bonds”, #1 by number of transactions in “EMEA Bonds in EUR” and “Combined EMEA Bonds and Loans in EUR”, consistently in the top 3 positions since 2012, #1 in IPO in Italy and #2 in IPO in Germany45.
Moreover, CIB won a number of prestigious awards across many products and geography: Best Global Trade Finance Provider for "All Services", "Products/Payments" and "Overall Executions" in Euromoney Trade Finance Survey 2018.
Recently, UniCredit received the “Financing Package 2017” IFR Award thanks to the Transform 2019 recapitalisation/project, as well as “EMEA Secondary Equity Issue” for its €13 bn rights issue completed in 2017.
Revenues came to €4.1 bn in FY17 (-3.9 per cent FY/FY) affected by a drop in NII of 8.9 per cent FY/FY due to lower contributions from the investment portfolio, partially offset by dynamic fee evolution. Commercial NII was resilient reflecting solid flow of financing activities despite pressures on spreads. Fees increased 2.0 per cent FY/FY, mainly supported by strong client driven activity in structured finance and capital markets. Trading income was resilient at €1.2 bn in FY17, up 0.7 per cent FY/FY. In 4Q17, CIB division generated higher revenues, €995 m (+11.8 per cent Q/Q, +2.8 per cent Y/Y) thanks to strong fees and resilient NII.
Strong cost discipline underpinned by a reduction in operating expenses to €1.6 bn in FY17 (-5.9 per cent FY/FY) with a drop on both HR and Non-HR expenses. Costs were further down in 4Q17 to €387 m (-2.7 per cent Q/Q, -10.0 per cent Y/Y). C/I ratio was 40.0 per cent in FY17, one of the lowest in the industry, and already in line with 2019 target at 40.2 per cent. C/I ratio reached 38.9 per cent in 4Q17.
LLPs decreased to €246 m in FY17 (-56.5 per cent FY/FY) thanks to strict risk discipline and CoR were down to 22 bps (vs 53 bps in FY16) in line with 2019 target. LLPs came to €121 m in 4Q17 with a quarterly CoR of 44 bps (+24 bps Q/Q, -112 bps Y/Y).
Net operating profit increased to €2.2 bn in FY17 (+13.2 per cent FY/FY) and to €487 m in 4Q17 (+11.3 per cent Q/Q, n.m. Y/Y).
CIB confirmed its position as one of the most efficient CIB’s in the industry, generating a net profit of €1.4 bn in FY17 (+20.9 per cent FY/FY). Net profit rose to €371 m in 4Q17 up 24.2 per cent Q/Q. Normalised46 RoAC amounted to 14.4 per cent in FY17.
45All league tables were based on Dealogic source as at 5 January 2018. Period: 1 Jan. – 31 Dec. 2017. Rankings by volume unless otherwise stated. 46Normalised RoAC for net capital gain on disposals in 3Q17 (+€84 m).
(€ million) FY16 FY17 FY/FY 4Q16 3Q17 4Q17 Y/Y Q/Q
Total revenues 4,233 4,066 -3.9% 968 890 995 +2.8% +11.8%
Gross operating profit 2,504 2,440 -2.6% 538 493 609 +13.1% +23.5%
Net operating profit 1,938 2,193 +13.2% 130 438 487 n.m. +11.3%
Net profit 1,175 1,422 +20.9% 117 299 371 n.m. +24.2%
RoAC 12.1% 15.3% +3.2pp 4.8% 13.1% 15.8% +11.0pp +2.7pp
Cost/income 40.9% 40.0% -0.8pp 44.4% 44.6% 38.9% -5.5pp -5.8pp
Cost of risk (bps) 53 22 -31 156 20 44 -112 +24
17 | P a g e
4Q17 and FY17 Group Results Press Release
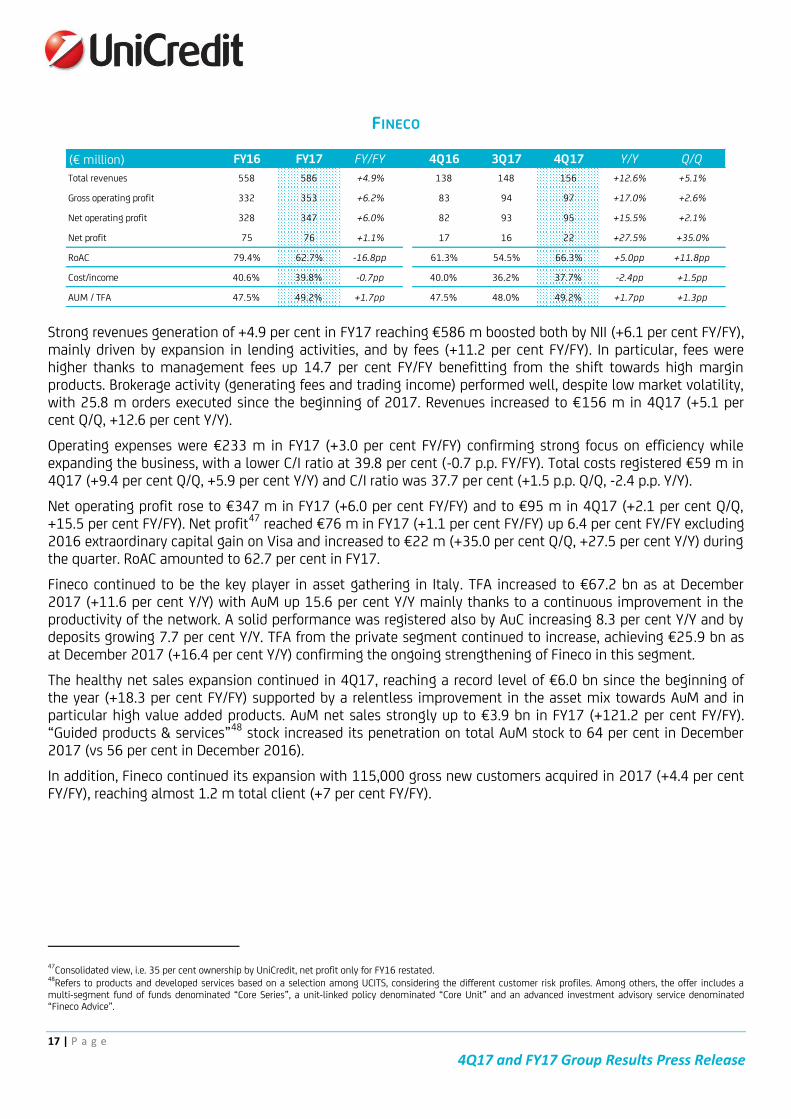
FINECO
Strong revenues generation of +4.9 per cent in FY17 reaching €586 m boosted both by NII (+6.1 per cent FY/FY), mainly driven by expansion in lending activities, and by fees (+11.2 per cent FY/FY). In particular, fees were higher thanks to management fees up 14.7 per cent FY/FY benefitting from the shift towards high margin products. Brokerage activity (generating fees and trading income) performed well, despite low market volatility, with 25.8 m orders executed since the beginning of 2017. Revenues increased to €156 m in 4Q17 (+5.1 per cent Q/Q, +12.6 per cent Y/Y).
Operating expenses were €233 m in FY17 (+3.0 per cent FY/FY) confirming strong focus on efficiency while expanding the business, with a lower C/I ratio at 39.8 per cent (-0.7 p.p. FY/FY). Total costs registered €59 m in 4Q17 (+9.4 per cent Q/Q, +5.9 per cent Y/Y) and C/I ratio was 37.7 per cent (+1.5 p.p. Q/Q, -2.4 p.p. Y/Y).
Net operating profit rose to €347 m in FY17 (+6.0 per cent FY/FY) and to €95 m in 4Q17 (+2.1 per cent Q/Q, +15.5 per cent FY/FY). Net profit47 reached €76 m in FY17 (+1.1 per cent FY/FY) up 6.4 per cent FY/FY excluding 2016 extraordinary capital gain on Visa and increased to €22 m (+35.0 per cent Q/Q, +27.5 per cent Y/Y) during the quarter. RoAC amounted to 62.7 per cent in FY17.
Fineco continued to be the key player in asset gathering in Italy. TFA increased to €67.2 bn as at December 2017 (+11.6 per cent Y/Y) with AuM up 15.6 per cent Y/Y mainly thanks to a continuous improvement in the productivity of the network. A solid performance was registered also by AuC increasing 8.3 per cent Y/Y and by deposits growing 7.7 per cent Y/Y. TFA from the private segment continued to increase, achieving €25.9 bn as at December 2017 (+16.4 per cent Y/Y) confirming the ongoing strengthening of Fineco in this segment.
The healthy net sales expansion continued in 4Q17, reaching a record level of €6.0 bn since the beginning of the year (+18.3 per cent FY/FY) supported by a relentless improvement in the asset mix towards AuM and in particular high value added products. AuM net sales strongly up to €3.9 bn in FY17 (+121.2 per cent FY/FY). “Guided products & services”48 stock increased its penetration on total AuM stock to 64 per cent in December 2017 (vs 56 per cent in December 2016).
In addition, Fineco continued its expansion with 115,000 gross new customers acquired in 2017 (+4.4 per cent FY/FY), reaching almost 1.2 m total client (+7 per cent FY/FY).
47Consolidated view, i.e. 35 per cent ownership by UniCredit, net profit only for FY16 restated. 48Refers to products and developed services based on a selection among UCITS, considering the different customer risk profiles. Among others, the offer includes a multi-segment fund of funds denominated “Core Series”, a unit-linked policy denominated “Core Unit” and an advanced investment advisory service denominated “Fineco Advice”.
(€ million) FY16 FY17 FY/FY 4Q16 3Q17 4Q17 Y/Y Q/Q
Total revenues 558 586 +4.9% 138 148 156 +12.6% +5.1%
Gross operating profit 332 353 +6.2% 83 94 97 +17.0% +2.6%
Net operating profit 328 347 +6.0% 82 93 95 +15.5% +2.1%
Net profit 75 76 +1.1% 17 16 22 +27.5% +35.0%
RoAC 79.4% 62.7% -16.8pp 61.3% 54.5% 66.3% +5.0pp +11.8pp
Cost/income 40.6% 39.8% -0.7pp 40.0% 36.2% 37.7% -2.4pp +1.5pp
AUM / TFA 47.5% 49.2% +1.7pp 47.5% 48.0% 49.2% +1.7pp +1.3pp
18 | P a g e
4Q17 and FY17 Group Results Press Release
GROUP CORPORATE CENTRE (GCC)
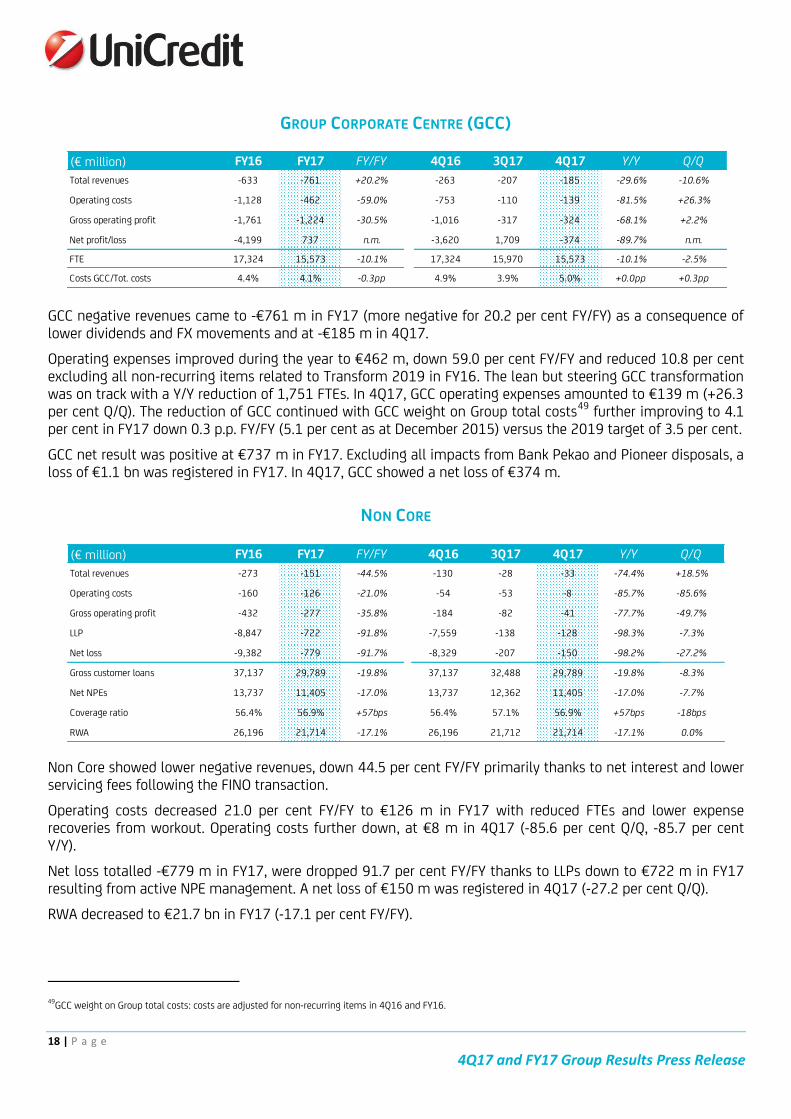
GCC negative revenues came to -€761 m in FY17 (more negative for 20.2 per cent FY/FY) as a consequence of lower dividends and FX movements and at -€185 m in 4Q17.
Operating expenses improved during the year to €462 m, down 59.0 per cent FY/FY and reduced 10.8 per cent excluding all non-recurring items related to Transform 2019 in FY16. The lean but steering GCC transformation was on track with a Y/Y reduction of 1,751 FTEs. In 4Q17, GCC operating expenses amounted to €139 m (+26.3 per cent Q/Q). The reduction of GCC continued with GCC weight on Group total costs49 further improving to 4.1 per cent in FY17 down 0.3 p.p. FY/FY (5.1 per cent as at December 2015) versus the 2019 target of 3.5 per cent.
GCC net result was positive at €737 m in FY17. Excluding all impacts from Bank Pekao and Pioneer disposals, a loss of €1.1 bn was registered in FY17. In 4Q17, GCC showed a net loss of €374 m.
NON CORE
Non Core showed lower negative revenues, down 44.5 per cent FY/FY primarily thanks to net interest and lower servicing fees following the FINO transaction.
Operating costs decreased 21.0 per cent FY/FY to €126 m in FY17 with reduced FTEs and lower expense recoveries from workout. Operating costs further down, at €8 m in 4Q17 (-85.6 per cent Q/Q, -85.7 per cent Y/Y).
Net loss totalled -€779 m in FY17, were dropped 91.7 per cent FY/FY thanks to LLPs down to €722 m in FY17 resulting from active NPE management. A net loss of €150 m was registered in 4Q17 (-27.2 per cent Q/Q).
RWA decreased to €21.7 bn in FY17 (-17.1 per cent FY/FY).
49GCC weight on Group total costs: costs are adjusted for non-recurring items in 4Q16 and FY16.
(€ million) FY16 FY17 FY/FY 4Q16 3Q17 4Q17 Y/Y Q/Q
Total revenues -633 -761 +20.2% -263 -207 -185 -29.6% -10.6%
Operating costs -1,128 -462 -59.0% -753 -110 -139 -81.5% +26.3%
Gross operating profit -1,761 -1,224 -30.5% -1,016 -317 -324 -68.1% +2.2%
Net profit/loss -4,199 737 n.m. -3,620 1,709 -374 -89.7% n.m.
FTE 17,324 15,573 -10.1% 17,324 15,970 15,573 -10.1% -2.5%
Costs GCC/Tot. costs 4.4% 4.1% -0.3pp 4.9% 3.9% 5.0% +0.0pp +0.3pp
(€ million) FY16 FY17 FY/FY 4Q16 3Q17 4Q17 Y/Y Q/Q
Total revenues -273 -151 -44.5% -130 -28 -33 -74.4% +18.5%
Operating costs -160 -126 -21.0% -54 -53 -8 -85.7% -85.6%
Gross operating profit -432 -277 -35.8% -184 -82 -41 -77.7% -49.7%
LLP -8,847 -722 -91.8% -7,559 -138 -128 -98.3% -7.3%
Net loss -9,382 -779 -91.7% -8,329 -207 -150 -98.2% -27.2%
Gross customer loans 37,137 29,789 -19.8% 37,137 32,488 29,789 -19.8% -8.3%
Net NPEs 13,737 11,405 -17.0% 13,737 12,362 11,405 -17.0% -7.7%
Coverage ratio 56.4% 56.9% +57bps 56.4% 57.1% 56.9% +57bps -18bps
RWA 26,196 21,714 -17.1% 26,196 21,712 21,714 -17.1% 0.0%

19 | P a g e
4Q17 and FY17 Group Results Press Release
GROUP TABLES
UNICREDIT GROUP: RECLASSIFIED INCOME STATEMENT
Note: starting from 30 September 2017, the following items have been reclassified:
the consolidation effects arising from the intercompany commissions versus Bank Pekao S.A., Pioneer Global Asset Management S.p.A. and their subgroups’ companies from item “Net fees and commissions” and "Income tax for the period" in item “Profit (Loss) from non-current assets held for sale, after tax";
indemnities recognised for resolution of non-performing loans management from item "Net fees and commissions" to item "Net other expenses/income".
The previous periods have been restated accordingly to ensure the comparability.
(€ million) FY16 FY17 FY/FY% 4Q16 3Q17 4Q17 Y/Y % Q/Q %
Net interest 10,307 10,299 -0.1% 2,415 2,500 2,583 +7.0% +3.3%
Dividends and other income from equity investments 844 638 -24.4% 148 165 120 -19.1% -27.5%
Net fees and commissions 6,263 6,708 +7.1% 1,499 1,592 1,683 +12.3% +5.7%
Net trading, hedging and fair value income 2,080 1,818 -12.6% 405 381 384 -5.2% +0.8%
Net other expenses/income 102 156 +53.7% (62) 7 73 n.m. n.m.
OPERATING INCOME 19,595 19,619 +0.1% 4,405 4,646 4,842 +9.9% +4.2%
Staff expenses (7,124) (6,905) -3.1% (1,665) (1,704) (1,701) +2.2% -0.2%
Other administrative expenses (4,900) (4,398) -10.3% (1,561) (1,078) (1,124) -28.0% +4.3%
Recovery of expenses 768 760 -1.0% 207 171 246 +18.6% +44.0%
Amort. deprec. and imp. losses on intang. & tang. assets (1,196) (807) -32.5% (536) (201) (214) -60.1% +6.5%
OPERATING COSTS (12,453) (11,350) -8.9% (3,555) (2,813) (2,794) -21.4% -0.7%
OPERATING PROFIT (LOSS) 7,143 8,268 +15.8% 850 1,833 2,049 n.m. +11.8%
Net write-downs on loans and provisions (12,207) (2,605) -78.7% (9,586) (598) (772) -91.9% +29.1%
NET OPERATING PROFIT (LOSS) (5,064) 5,664 n.m. (8,736) 1,235 1,277 n.m. +3.4%
Other charges and provisions (2,078) (1,064) -48.8% (973) (273) (193) -80.2% -29.2%
Integration costs (2,132) (147) -93.1% (1,771) (31) (103) -94.2% n.m.
Net income from investments (910) (305) -66.5% (885) (5) (151) -82.9% n.m.
PROFIT (LOSS) BEFORE TAX (10,183) 4,148 n.m. (12,364) 926 830 n.m. -10.4%
Income tax for the period (734) (609) -17.0% (103) (181) (66) -36.4% -63.8%
NET PROFIT (LOSS) (10,917) 3,539 n.m. (12,468) 745 764 n.m. +2.6%
Profit (Loss) from non-current assets held for sale, after tax (144) 2,251 n.m. (707) 2,126 96 n.m. -95.5%
PROFIT (LOSS) FOR THE PERIOD (11,061) 5,790 n.m. (13,175) 2,871 860 n.m. -70.1%
Minorities (464) (313) -32.6% (121) (50) (58) -51.7% +16.3%
NET PROFIT (LOSS) ATTRIBUTABLE TO THE GROUP BEFORE PPA (11,524) 5,477 n.m. (13,296) 2,821 802 n.m. -71.6%
Purchase Price Allocation effect (5) (4) -20.0% (2) (1) (1) -62.3% -13.9%
Goodwill impairment (261) - n.m. (261) - - n.m. n.m.
NET PROFIT (LOSS) ATTRIBUTABLE TO THE GROUP (11,790) 5,473 n.m. (13,558) 2,820 801 n.m. -71.6%

20 | P a g e
4Q17 and FY17 Group Results Press Release
UNICREDIT GROUP: RECLASSIFIED INCOME STATEMENT OF 4Q16 AND FY16 ADJUSTED FIGURES
Note: please consider that:
1Q16 net profit was adjusted for the net additional impact of Defined Benefit Obligation (DBO) in Austria and integration costs in Italy (total impact of -€0.2 bn post tax);
2Q16 net profit was adjusted for BTP trading gain, LLP release, DTA fee and Visa Europe capital gain (total impact of +€0.3 bn post tax);
4Q16 was adjusted for non-recurring items related to Transform 2019 (total impact of -€13.2 bn).
(€ million) 4Q16 4Q16 adj. FY16 FY16 adj.Net Interest 2,415 2,415 10,307 10,307
Dividends and other income from equity investments 148 148 844 817
Net fees and commissions 1,499 1,499 6,263 6,263
Trading profit, hedging and fair value income 405 459 2,080 1,756
Net other expenses/income (62) (12) 102 152
OPERATING INCOME 4,405 4,509 19,595 19,295
Staff expenses (1,665) (1,665) (7,124) (7,124)
Other administrative expenses, revecovery of ex., amor. deprec. and other (1,890) (1,265) (5,328) (4,703)
OPERATING COSTS (3,555) (2,930) (12,453) (11,827)
OPERATING PROFIT (LOSS) 850 1,580 7,143 7,468
Net write-downs on loans and provisions (9,586) (1,486) (12,207) (4,207)
NET OPERATING PROFIT (LOSS) (8,736) 94 (5,064) 3,261
Other charges and provisions (973) (244) (2,078) (1,217)
Integration Costs (1,771) (23) (2,132) (53)
Net income from investments (885) (154) (910) (179)
PROFIT (LOSS) BEFORE TAX (12,364) (327) (10,183) 1,811
Income taxes for the period (103) (85) (734) (805)
Profit (loss) from non -current assets helf for sale, after tax (707) 182 (144) 695
Minorities (121) (121) (464) (399)
Purchase Price Allocation effect (2) (2) (5) (5)
Goodwill impairment (261) 0 (261) 0
NET PROFIT (LOSS) ATTRIBUTABLE TO THE GROUP (13,558) (352) (11,790) 1,297
21 | P a g e
4Q17 and FY17 Group Results Press Release
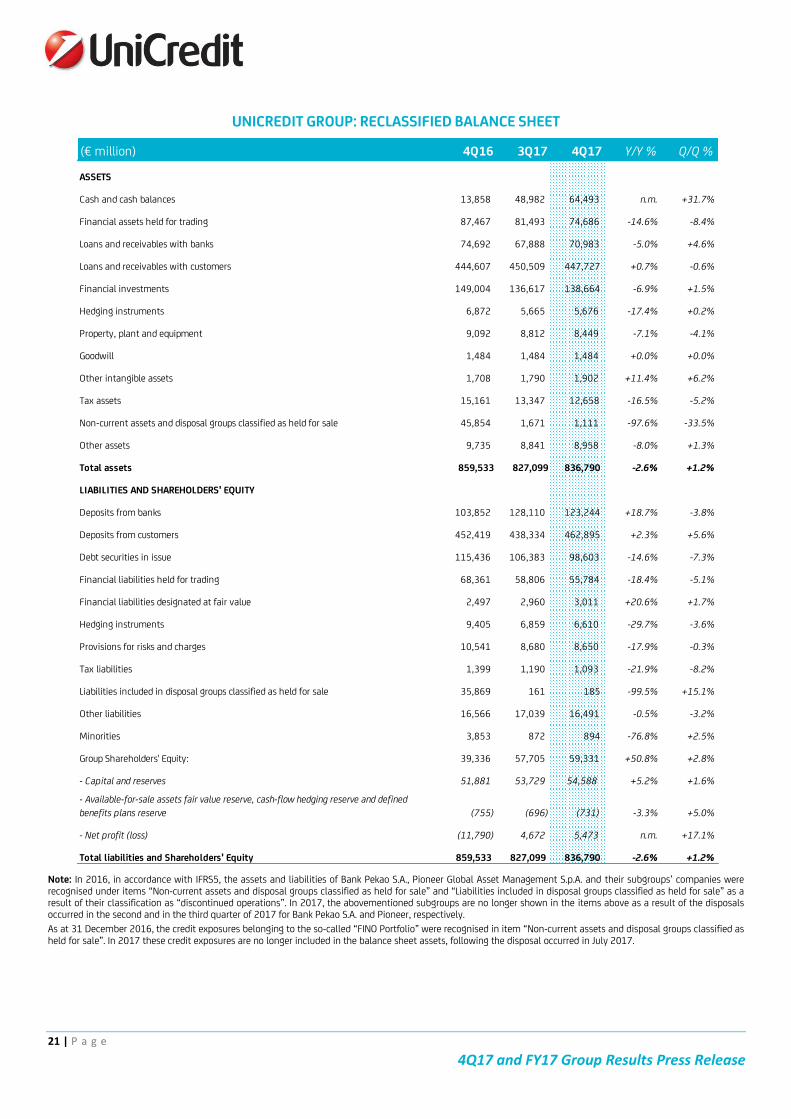
UNICREDIT GROUP: RECLASSIFIED BALANCE SHEET
Note: In 2016, in accordance with IFRS5, the assets and liabilities of Bank Pekao S.A., Pioneer Global Asset Management S.p.A. and their subgroups’ companies were recognised under items “Non-current assets and disposal groups classified as held for sale” and “Liabilities included in disposal groups classified as held for sale” as a result of their classification as “discontinued operations”. In 2017, the abovementioned subgroups are no longer shown in the items above as a result of the disposals occurred in the second and in the third quarter of 2017 for Bank Pekao S.A. and Pioneer, respectively.
As at 31 December 2016, the credit exposures belonging to the so-called “FINO Portfolio” were recognised in item “Non-current assets and disposal groups classified as held for sale”. In 2017 these credit exposures are no longer included in the balance sheet assets, following the disposal occurred in July 2017.
(€ million) 4Q16 3Q17 4Q17 Y/Y % Q/Q %
ASSETS
Cash and cash balances 13,858 48,982 64,493 n.m. +31.7%
Financial assets held for trading 87,467 81,493 74,686 -14.6% -8.4%
Loans and receivables with banks 74,692 67,888 70,983 -5.0% +4.6%
Loans and receivables with customers 444,607 450,509 447,727 +0.7% -0.6%
Financial investments 149,004 136,617 138,664 -6.9% +1.5%
Hedging instruments 6,872 5,665 5,676 -17.4% +0.2%
Property, plant and equipment 9,092 8,812 8,449 -7.1% -4.1%
Goodwill 1,484 1,484 1,484 +0.0% +0.0%
Other intangible assets 1,708 1,790 1,902 +11.4% +6.2%
Tax assets 15,161 13,347 12,658 -16.5% -5.2%
Non-current assets and disposal groups classified as held for sale 45,854 1,671 1,111 -97.6% -33.5%
Other assets 9,735 8,841 8,958 -8.0% +1.3%
Total assets 859,533 827,099 836,790 -2.6% +1.2%
LIABILITIES AND SHAREHOLDERS' EQUITY
Deposits from banks 103,852 128,110 123,244 +18.7% -3.8%
Deposits from customers 452,419 438,334 462,895 +2.3% +5.6%
Debt securities in issue 115,436 106,383 98,603 -14.6% -7.3%
Financial liabilities held for trading 68,361 58,806 55,784 -18.4% -5.1%
Financial liabilities designated at fair value 2,497 2,960 3,011 +20.6% +1.7%
Hedging instruments 9,405 6,859 6,610 -29.7% -3.6%
Provisions for risks and charges 10,541 8,680 8,650 -17.9% -0.3%
Tax liabilities 1,399 1,190 1,093 -21.9% -8.2%
Liabilities included in disposal groups classified as held for sale 35,869 161 185 -99.5% +15.1%
Other liabilities 16,566 17,039 16,491 -0.5% -3.2%
Minorities 3,853 872 894 -76.8% +2.5%
Group Shareholders' Equity: 39,336 57,705 59,331 +50.8% +2.8%
- Capital and reserves 51,881 53,729 54,588 +5.2% +1.6%
- Available-for-sale assets fair value reserve, cash-flow hedging reserve and defined
benefits plans reserve (755) (696) (731) -3.3% +5.0%
- Net profit (loss) (11,790) 4,672 5,473 n.m. +17.1%
Total liabilities and Shareholders' Equity 859,533 827,099 836,790 -2.6% +1.2%

22 | P a g e
4Q17 and FY17 Group Results Press Release
UNICREDIT GROUP: STAFF AND BRANCHES
Note: (*) FTE data: number of employees counted for the rate of presence. Please consider that Group FTEs are shown excluding all companies that have been classified as "discontinued operations" under IFRS5 and Ocean Breeze. Figures as at 31 December 2016 were restated accordingly to increase comparability. (**) Figures do not include the branches of the Koç/Yapi Kredi group (Turkey). The decrease in number, compared to 31 December 2016, mainly depends on the exit of Bank Pekao from the Group, occurred in 2017.
UNICREDIT GROUP: RATINGS
Note: S&P: on 31 October 2017, S&P upgraded UniCredit S.p.A.’s medium and long term ratings to ‘BBB’ with stable outlook. Moody’s: following the update on Transform 2019, Moody’s changed UniCredit S.p.A’s outlook to positive from stable on 8 January 2018. Fitch: on 15 December 2017, Fitch has affirmed UniCredit SpA’s medium and long term ratings to ‘BBB’ with existing stable outlook.
(units) 4Q16 3Q17 4Q17 Y/Y Δ Q/Q Δ
Employees(*) 98,304 94,066 91,952 -6,352 -2,113
Branches (**) 6,221 4,920 4,778 -1,443 -142
- o/w, Italy 3,524 3,235 3,106 -418 -129
- o/w, other countries 2,697 1,685 1,672 -1,025 -13
SHORT-TERM MEDIUM AND STANDALONE
DEBT LONG-TERM RATING
Standard & Poor's A-2 BBB STABLE bbb
Moody's P-2 Baa1 POSITIVE ba1
Fitch Ratings F2 BBB STABLE bbb
OUTLOOK

23 | P a g e
4Q17 and FY17 Group Results Press Release
Declaration by the Manager charged with preparing the financial reports
The undersigned, Francesco Giordano, in his capacity as the Manager charged with preparing UniCredit S.p.A.’s financial reports
DECLARES
That, pursuant to Article 154 bis, paragraph 2, of the “Consolidated Law on Financial Intermediation” the information disclosed in this document corresponds to the accounting documents, books and records. Milan, 7 February 2018
Manager charged with preparing the financial reports
Investor Relations: Tel. +39-02-88624324; e-mail: [email protected] Media Relations: Tel. +39-02-88623569; e-mail: [email protected]
UNICREDIT 4Q17 and FY17 GROUP RESULTS – DETAILS OF CONFERENCE CALL
MILAN, 8 FEBRUARY 2018 – 10.00 CET
CONFERENCE CALL DIAL IN
ITALY: +39 02 805 88 11
UK: +44 1 212818003
USA: +1 718 7058794
THE CONFERENCE CALL WILL ALSO BE AVAILABLE VIA LIVE AUDIO WEBCAST AT
https://www.unicreditgroup.eu/en/investors/group-results.html, WHERE THE SLIDES WILL BE DOWNLOADABLE