unicredit german investment conference, munich
TRANSCRIPT

Staying on Track.UniCredit German Investment Conference, Munich.
24 September 2009
2
Disclaimer
This presentation contains forward-looking statements about Linde AG (“Linde”) and their respective subsidiaries and businesses. These include, without limitation, those concerning the strategy of an integrated group, future growth potential of markets and products, profitability in specific areas, synergies resulting from the merger between Linde and The BOC Group plc, post-merger integration, the future product portfolio, anti-trust risks, development of and competition in economies and markets of the combined group.
These forward looking statements involve known and unknown risks, uncertainties and other factors, many of which are outside of Linde’s control, are difficult to predict and may cause actual results to differ significantly from any future results expressed or implied in the forward-looking statements in this presentation.
While Linde believes that the assumptions made and the expectations reflected in this presentation are reasonable, no assurance can be given that such assumptions or expectations will prove to have been correct and complete and no guarantee of whatsoever nature is assumed in this respect. The uncertainties include, inter alia, synergies will not materialize or of a change in general economic conditions and government and regulatory actions. These known, unknown and uncertain factors are not exhaustive, and other factors, whether known, unknown or unpredictable, could cause the combined group’s actual results or ratings to differ materially from those assumed hereinafter. Linde undertakes no obligation to update or revise the forward-looking statements in this presentation whether as a result of new information, future events or otherwise.
3
Agenda
1. Operational Performance
2. Financial Position
3. Strategic Set-up and HPO
Appendix

4
Highlights
H1 operational performanceGroup sales of € 5.476 bn (-12.5%), Group operating profit of € 1.104 bn (-12.2%)Before restructuring charges, Group operating profit down 6.9% and adjusted EPS down 13.6% Ongoing strong cash flow generation: Operating cash flow increased to € 841 m (H1 08: € 816 m)
Strengthened profitability in difficult market circumstancesGroup operating margin before restructuring charges up 130 basis points to 21.4% (H1 08: 20.1%)Acceleration of HPO reflected in ramp-up of cost savings
Stable set-up in placeLong-term oriented financing: very well spread maturity profile with a strong liquidity reserveAlready more than 30% of Gases sales in emerging marketsDefensive growth set-up, serving mega-trends in energy, environment and healthcare
Outlook 2009Further recovery in the second half-year compared to the first half as the economic improvement takes holdSales and earnings level as in the record year 2008 no more attainable
5
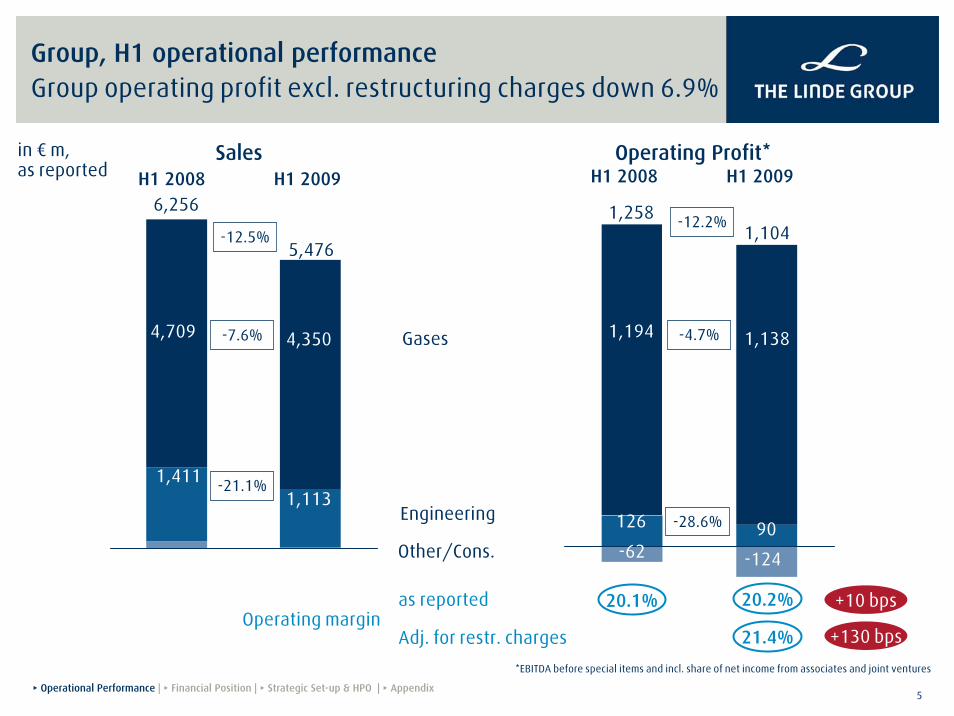
Group, H1 operational performanceGroup operating profit excl. restructuring charges down 6.9%
126 62Engineering
Other/Cons.
20.1% 20.2%Operating margin
1,194 1,138
90
-124
1,104
+10 bps
H1 2008 H1 2009
-12.2%
-4.7%
-28.6%
1,258
Gases
21.4% +130 bps
as reported
Adj. for restr. charges
*EBITDA before special items and incl. share of net income from associates and joint ventures
-62
▸ Operational Performance | ▸ Financial Position | ▸ Strategic Set-up & HPO | ▸ Appendix
4,709
1,411
6,256
4,350
5,476
in € m, as reported
-12.5%
-7.6%
-21.1%1,113
H1 2008 H1 2009Sales Operating Profit*

6
2,157 2,193
Q1/09 Q2/09
546 592
Q1/09 Q2/09
Gases Division, quarterly focusSequential improvement in Q2 2009
Sales Operating profit
+1.7%
-8.9%
+8.4%
Return to sequential growth
— Slight sales increase from Q1 09
— Driven by first recovery steps in Emerging Markets
— Stabilisation of sales run rates in mature economies
Strong margin improvement
— Driven by acceleration of HPO
— Margin increase in all operating segments
— Excl. natural gas price effect margin up by 80 bps
Q1/09 Q2/09
Operating margin
25.3%27.0%
+170 bps
2,4082,193
Q2/08 Q2/09
608 592
Q2/08 Q2/09Sales Operating profit
Q2/08 Q2/09Operating margin
25.2%27.0%
+180 bps-2.6%
Q2 09 vs Q2 08 (€ m)
Q2 09 vs Q1 09 (€ m)
▸ Operational Performance | ▸ Financial Position | ▸ Strategic Set-up & HPO | ▸ Appendix

7
871 908
536 538
499 490
251 257
Q1 2009 Q2 2009
1,956 1,779
1,1811,074
1,046
989
481
508
H1 2008 H1 2009
in € m
Tonnage
Bulk
Cylinder
Healthcare
Gases Division, sales by product areas (consolidated)Sequential improvement in Q2 2009
+5.6%
-5.4%
-9.1%
-9.0%
4,664*4,350
-6.7%
+2.4%
-1.8%
+0.4%
+4.2%
+1.7%
*comparable: excluding currency, natural gas price and consolidation effect
2,1932,157
▸ Operational Performance | ▸ Financial Position | ▸ Strategic Set-up & HPO | ▸ Appendix

8
Western Europe
935 914
Q1/09 Q2/09
26.4% 28.3%
Q1/09 Q2/09
Gases Division, Q2 performance by operating segmentSequential improvement driven by emerging market regions
Sales (€ m) Operating margin
-2.2% +190 bps
Americas
501 492
Q1/09 Q2/09
20.8%21.5%
Q1/09 Q2/09
Sales (€ m) Operating margin
-1.8% +70 bps
Asia & Eastern Europe
428 449
Q1/09 Q2/09
30.1% 30.5%
Q1/09 Q2/09
Sales (€ m) Operating margin
+4.9% +40 bps
South Pacific & Africa
309357
Q1/09 Q2/09
21.4%25.2%
Q1/09 Q2/09
Sales (€ m) Operating margin
+15.5% +380 bps
▸ Operational Performance | ▸ Financial Position | ▸ Strategic Set-up & HPO | ▸ Appendix

9
E. Europe /M. East
S. America
Africa
Asia
Gases Division, emerging market set-upAlready more than 30% of sales in emerging markets
<70% >30%
Non EmergingMarkets
EmergingMarkets
Total Gases Sales Emerging Market Sales by region(excl. JVs and Embedded Finance Lease)
H1 09: € 4.35 bn
▸ Operational Performance | ▸ Financial Position | ▸ Strategic Set-up & HPO | ▸ Appendix

10
— Total project number unchanged: 64 start-ups by 2011 (incl. JVs)
— Overall still lower activity in new contract signings, but the structural growth potential remains strong, especially in Emerging Markets and energy applications
Americas
12WesternEurope
13Eastern Europe / MEChina / South and East Asia
33
Africa /South Pacific
6
7
17 17
23
2008 2009 2010 2011
Gases Division, project pipelineStable customer commitment
▸ Operational Performance | ▸ Financial Position | ▸ Strategic Set-up & HPO | ▸ Appendix

11
Group, business synergies between Gases and Engineering Leverage common customer relationships
ADNOC (Abu Dhabi National Oil Corporation) - customer relationship in Gases and Engineering:
ADNOC - long-term customer of our Engineering Division
Ethylene plant (Ruwais 1) signed in 1998 Ethylene plant (Ruwais 2) signed in 2006Ethylene plant (Ruwais 3) signed in June 2009
JV ADNOC/Gases Division (founded in December 2007)
First contract: ASU in the Ruwais clusterServing Ethylene cracker (Ruwais 2) with nitrogenLinde gets 100% of liquid product to serve local Merchant Markets
Second contract: Enhanced Gas Recovery scheme in Habshan2 large air separation units going on-stream at the end of 2010Capacity of 670,000 standard cubic metres of nitrogen per hourTotal investment costs of appx. USD 800 m
Engineering – strong footprint on the Arabian Peninsula:
▸ Operational Performance | ▸ Financial Position | ▸ Strategic Set-up & HPO | ▸ Appendix
Oman
Muscat
Yemen
Kuwait
Ruwais
Asab.U.A.E.
SharjahYanbu
Rabigh
Al Jubail
Ras TanuraBahrain
Saudi Arabia
Riyadh
Buraydah
Jeddah
Al Khobar
Al Kharj
Qatar
Air separation unitsHydrogen and synthesis gas plantsGas processing plantsNatural gas plantsPetrochemical plants

12
2,750
Engineering Division, financial track recordLeading market position in all segments
Air Separation Plants Hydrogen and Synthesis Gas Plants
Main competitors:Air Liquide, Air Products, Praxair
Top 1Products:
— Oxygen— Nitrogen— Rare gases
Main competitors:Technip, Haldor Topsoe, Lurgi, Uhde
Top 2Products:
— H2/CO/Syngas— Ammonia— Gas removal— Gas purification
Top 2Products:
— Ethylene— Propylene— Butadiene— Aromatics— Polymers
Olefin Plants
Main competitors:Technip, ABB Lummus, Stone & Webster, KBR, Toyo
Top 3Products:
— LNG— NGL— LPG— Helium
Main competitors:Chiyoda, Bechtel, JGC, KBR, Technip, Snam, Air Products
Natural Gas Plants
H1 09 order intake by segmentOrder intake, € bn
Order backlog, € bn
1.2991.557
4.436 4.381
H1 09H1 08
30/06/0931/12/08
Sales, € bn
1.11390
1261.411
H1 08 H1 09 H1 08 H1 09
Operating Profit, € m
Track record: Sales and EBITDA margin
Nat. Gas6%
Others6%
Olefin72%
ASU9%
HyCo6%
Nat. Gas7%
€ 1.299 bn
909
3,016
9041,117 1,047 1,036
1,270
1,581 1,623
1,958
0
500
1000
1500
2000
2500
3000
1998 1999 2000 2001 2002 2003 2004 2005 2006 20080%
1%
2%
3%
4%
5%
6%
7%
8%
9%
10%
Sales EBITDA margin
2007
in € bn
▸ Operational Performance | ▸ Financial Position | ▸ Strategic Set-up & HPO | ▸ Appendix
13
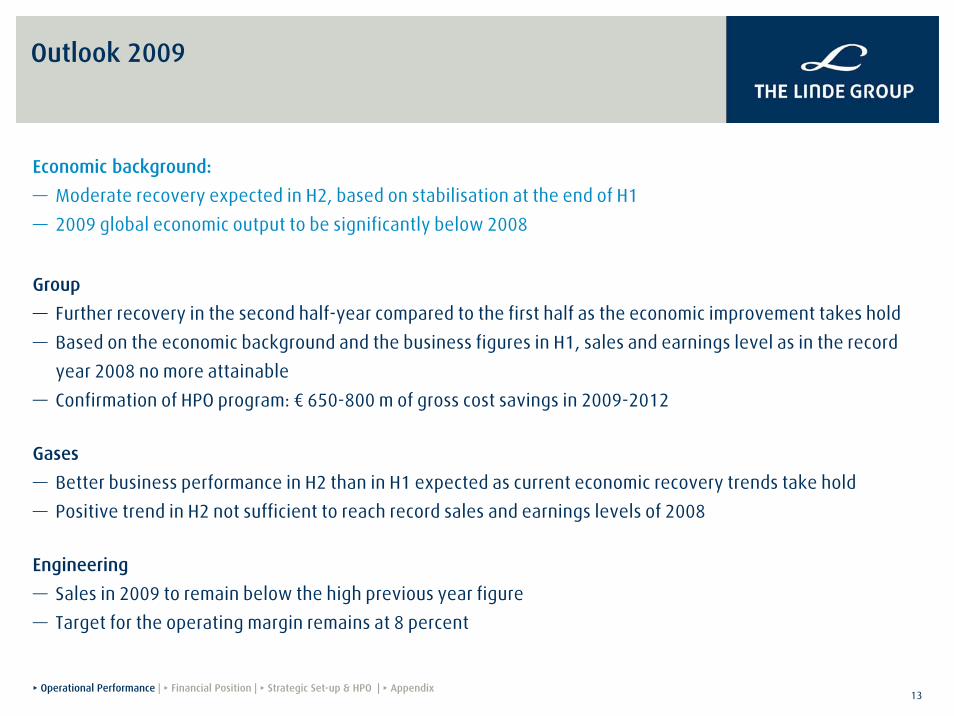
Outlook 2009
Economic background:
— Moderate recovery expected in H2, based on stabilisation at the end of H1
— 2009 global economic output to be significantly below 2008
Group
— Further recovery in the second half-year compared to the first half as the economic improvement takes hold
— Based on the economic background and the business figures in H1, sales and earnings level as in the record
year 2008 no more attainable
— Confirmation of HPO program: € 650-800 m of gross cost savings in 2009-2012
Gases
— Better business performance in H2 than in H1 expected as current economic recovery trends take hold
— Positive trend in H2 not sufficient to reach record sales and earnings levels of 2008
Engineering
— Sales in 2009 to remain below the high previous year figure
— Target for the operating margin remains at 8 percent
▸ Operational Performance | ▸ Financial Position | ▸ Strategic Set-up & HPO | ▸ Appendix

14
Agenda
1. Operational Performance
2. Financial Position
3. Strategic Set-up and HPO
Appendix

15
H1 08 H1 091,258 1,104
10
-273841
-543-6976
Investment Cash Flow -424 -536305
-182
-260816
Investment in tangibles/ intangibles -569Acquisitions -54Other 199
Free Cash Flow before Financing 392
Operating Profit
Change in Working Capital
Operating Cash FlowOther changes
Group, cash flow statementContinued strong cash flow generation
in € million
▸ Operational Performance | ▸ Financial Position | ▸ Strategic Set-up & HPO | ▸ Appendix

16
Cash position & credit facility cover all financial maturities until end of 2010
1.5562.000
Short-termFinancial debt
30/06/09
Cash30/06/09
Liquidity reserveCredit Facility
in € bn
€ 2 bn credit facility available until March 2011::— Committed with more than 50 banks— No financial covenants— Fully undrawn
-1.310 866
Financial debt: more than 80% due beyond 2010
Group, financial positionWell spread maturity profile with strong liquidity reserve
Net debt, in € bnNet debt/EBITDA of 2.5x in FY 2008 within target range of 2-3x
€ 1.6 bn forward start credit facility – liquidity profile furtherstrengthened until 2013
20072006 200830/9/06 30/06/09
6.427
9.933
6.423
12.815
6.796
Financial debt, by instrumentSolid maturity profile (in € bn)
Subordinated Bonds (*callable in 2013/2016) Senior Bonds Commercial Paper Bank Loans
18%
11%
52%
19%31/12/2008
30/06/2009
long-term
6.155
current
1.3101.290
6.375— € 1.6 bn forward start revolving credit facility signed in June 2009
— Available from March 2011 - March 2013
— Self arranged deal further strengthens financing flexibility
— More than 20 of our core national and international banks participating
— Very good reception: increased facility amount still closed oversubscribed
— No financial covenants*
* within investment grade rating
▸ Operational Performance | ▸ Financial Position | ▸ Strategic Set-up & HPO | ▸ Appendix

17
Agenda
1. Operational Performance
2. Financial Position
3. Strategic Set-up and HPO
Appendix

18
Integration Synergies HPO
The Linde Group
— New operating model
— One culture
— One vision
Direct merger savings
— G&A
— Procurement / R&D
— Supply management / production
Continuous improvement
— Process excellence
— Productivity improvement
— People excellence
€250 million net cost savings
First full-year contribution in FY 2009
4-year period: 2009-2012
€650-800 million gross cost reduction
BOC Acquisition
Transformation
— Pure play
— Portfolio optimisation
— Track record in efficiencyimprovement
Acceleration of HPO: € 200 m gross savings already in 2009
▸ Operational Performance | ▸ Financial Position | ▸ Strategic Set-up & HPO | ▸ Appendix
High Performance Organisation (HPO)Implementing the next step of our continuous optimisation

19
Gases Division, customer industriesStability driven by a broad customer base
2008: Split by end-customer groups
Others7%
Retail11%
Electronics5%
Metallurgy & Glass16%
Healthcare11%
Food & Beverages
8%
Manufacturing21%
Chemistry & Energy
22%
▸ Operational Performance | ▸ Financial Position | ▸ Strategic Set-up & HPO | ▸ Appendix

20
Gases Division, customer industries Stability driven by a broad customer base
2008: Split of product areas by major end-customer groups
Electronics
Metallurgy & Glass
Chemistry & Energy
Food & Beverages
Homecare
Hospital Care
Other
Retail
Retail Other Electronics
Manufacturing
Metallurgy & Glass
Chemistry & Energy
Electronics
Other
Food & Beverages
Chemistry & Energy
Metallurgy & Glass
Manufacturing
Cylinder
TonnageBulk
Healthcare
▸ Operational Performance | ▸ Financial Position | ▸ Strategic Set-up & HPO | ▸ Appendix

21
In bulk & cylinder: >70% of revenues from >30% market share positions
Sales split by market shares Market leader in 46 of the 70 major countries, #2 Player in another 10
<30%
≥ 60%
≥ 40%
≥ 30%
€9.5 bn
70%
Market Leader
#2 Player
Others
▸ Operational Performance | ▸ Financial Position | ▸ Strategic Set-up & HPO | ▸ Appendix
Gases Division, local business model 70% of revenues come from a leading market position
22
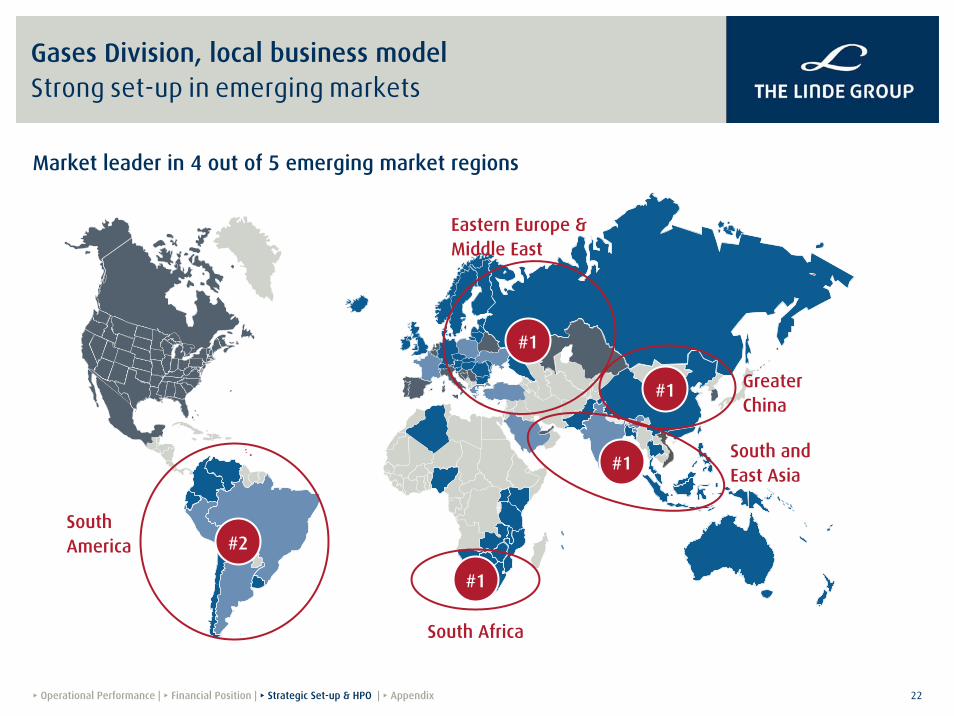
Gases Division, local business model Strong set-up in emerging markets
#1
#1
#1
#1
South Africa
South and East Asia
GreaterChina
Eastern Europe & Middle East
South America #2
▸ Operational Performance | ▸ Financial Position | ▸ Strategic Set-up & HPO | ▸ Appendix
Market leader in 4 out of 5 emerging market regions

23
Overproportionate growth in emerging markets, driven by increasing standard of living, resources & applicationsCAGR* (1999-2006): e.g. Eastern Europe +12%, South & East Asia +11%
But also ongoing growth in more mature markets driven by continuous flow of new applicationsCAGR* (1999-2006): e.g. Western Europe +5%, USA +6%
South Africa: $13
South America: $13
Eastern Europe: $16
China: $2
South and East Asia: $3
Gases market per capita
Industrial gases market, consumption by region Wide diversity between mature and developing markets
Source: Spiritus Consulting/Ifo(* in local currency)
USA: $49 Western Europe: $38
Australia: $42
▸ Operational Performance | ▸ Financial Position | ▸ Strategic Set-up & HPO | ▸ Appendix

24
Taiwan
Kaohsiung
Mai Liao
Taipei
Taichung
Heilongjiang
Jilin
Beijing
Tianjin
ShandongShanxi
Ningxia
HenanGansu Shaanxi
Sichuan
HunanJiangxi
Fujian
Zhejiang
Jiangsu
Shanghai
Guangdong
Haikou
Xinjiang
Guizhou
Anhui
Dalian
Hubei
Liaoning
Yunnan
Air separation units
Hydrogen and synthesis gas plants
Gas processing plants
Natural gas plants
Petrochemical plants
Engineering Division, footprint in ChinaStrong established customer base
▸ Operational Performance | ▸ Financial Position | ▸ Strategic Set-up & HPO | ▸ Appendix

25
Long term growth drivers remain intactEnergy/Environmental Mega-Trend
Our Gases & Engineering solutions address structural challenges:
Higher returns on existing fields
Sourer crude / lower emissions
Diversification of energy sources — Natural gas
— Cleaner coal
— Renewables
Lower energy consumption of industrial processes
Cleaner waters
Enhanced Oil & Gas recovery
Refinery fuel upgrades
LNG/GTL
Coal gasification/CCS
Photovoltaics/Biofuels
Oxy-combustion
Waste-water treatment
Nitrogen/CO2
Hydrogen
Oxygen
Oxygen/CO2
Electronic Gases/Specialty Gases/NitrogenOxygen
Oxygen
Lim
ited
reso
urce
s /
envi
ronm
enta
l pr
otec
tion
Long-term potential for our Gases & Engineering portfolio▸ Operational Performance | ▸ Financial Position | ▸ Strategic Set-up & HPO | ▸ Appendix

26
Long term growth drivers remain intactHealthcare Mega-Trend
Global healthcare systems face structural trends:
— MORE patients(ageing population)
— HIGHER expectations(quality of life)
— LESS financial resources(health budget pressures)
Long-term potential for healthcare gases and related services
*Chronic Obstructive Pulmonary Disease
Increasing consumption oftraditional healthcare gases
New diagnostics & therapies
Improved patient mobility
Reduce Hospital time
f.ex. COPD*,Sleep therapy
Homecare
Hospital Care
Homecare/ Middle Care
▸ Operational Performance | ▸ Financial Position | ▸ Strategic Set-up & HPO | ▸ Appendix

27
Summary
H1 operational performance relatively stable
Profitability strengthened in difficult market environment, ongoing strong cash flow generation
Competitive set-up in an uncertain market environment in 2009
Focus on Gases & Engineering business model, supported by structural mega-trends
Financial position: sustainable cash flow generation, long-term financing in place
Acceleration into HPO
Performance culture more important than ever: continuous improvement
Quickly adapting cost structure to market environment, intensifying durable productivity measures
Long-term commitment to profitable growth: manage cost and returns to stay ready for growth
28
Agenda
1. Operational Performance
2. Financial Position
3. Strategic Set-up and HPO
Appendix
29
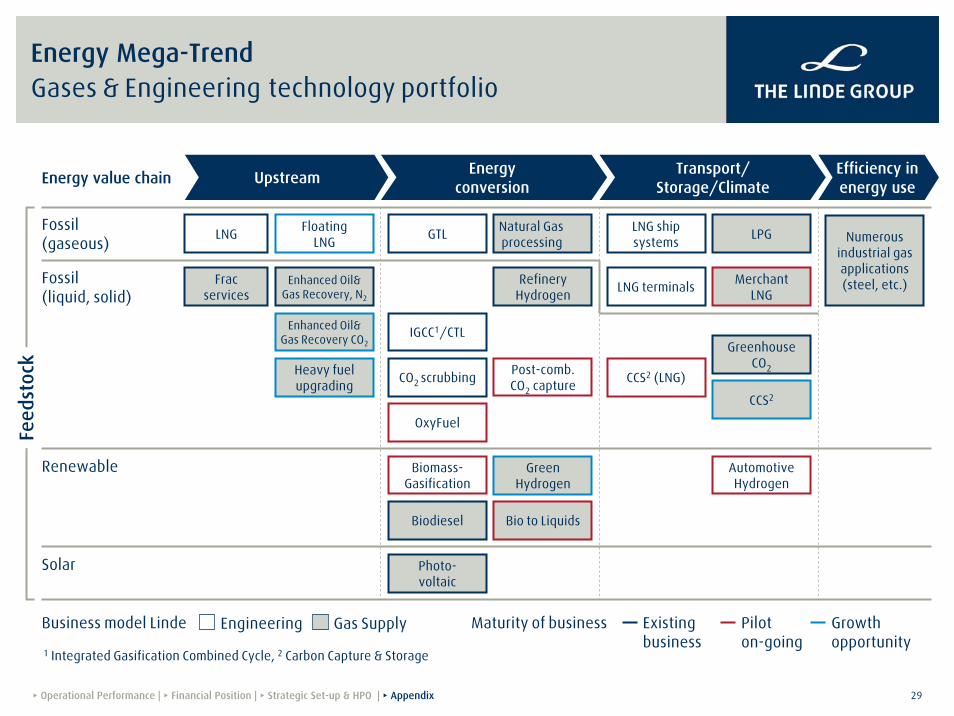
Energy Mega-TrendGases & Engineering technology portfolio
AutomotiveHydrogen
Photo-voltaic
IGCC1/CTL
Enhanced Oil& Gas Recovery, N2
Fossil (gaseous)
Solar
LNG
OxyFuel
FloatingLNG
Bio to Liquids
Refinery Hydrogen
Biodiesel
Biomass-Gasification
GreenHydrogen
Renewable
Enhanced Oil& Gas Recovery CO2
MerchantLNG
LPG
Fracservices
Natural Gasprocessing
CO2 scrubbing
LNG terminals
GTL
Fossil (liquid, solid)
Heavy fuel upgrading
Post-comb.CO2 capture CCS2 (LNG)
GreenhouseCO2
CCS2
LNG ship systems Numerous
industrial gas applications (steel, etc.)
1 Integrated Gasification Combined Cycle, 2 Carbon Capture & Storage
Energy value chain Upstream Energy conversion
Transport/Storage/Climate
Efficiency in energy use
Business model Linde Engineering Gas Supply Maturity of business Existing business
Pilot on-going
Growthopportunity
Feed
stoc
k
▸ Operational Performance | ▸ Financial Position | ▸ Strategic Set-up & HPO | ▸ Appendix

30
H1 08 H1 09 ∆ in %5,476 -12.5
-12.2
+10 bp
Operating profit excluding restructuring charges 1,258 1,171 -6.9
Margin 20,1 21,4 +130 bp
-20.5
-
-
-27.0
-
Net income – Part of shareholders Linde AG 375 248 -33.9
-23.7
Operating profit 1,258 1,104
EBIT 716 523
Financial Result -172 -158
Taxes 142 91
20,2
669
0
-146
347
Sales 6,256
Margin 20,1
EBIT before special items and PPA depreciation 842
Special items 59
PPA depreciation -185
Net income adjusted – Part of shareholders Linde AG 455
in € million
Group Financial Highlights
▸ Operational Performance | ▸ Financial Position | ▸ Strategic Set-up & HPO | ▸ Appendix

31
H1 08 H1 09 ∆ in %248 -33.9
- net of tax -46 -47
+ net of tax - -18
Average outstanding shares 167,136 168,500
EPS 2.24 1.47 -34.4
Adjusted EPS 2.72 2.06 -24.3
Adjusted EPS excl. restructuring costs 2.72 2.35 -13.6
-23.7
-13.0
+ depreciation/amortisation from purchase price allocation +185 146
-
347
+67
396
Net income - Part of shareholders Linde AG 375
+ special items -59
Adjusted Net Income 455
- Restructuring costs -
Adjusted Net Income (excl. restructuring costs) 455
in € million
Group Financial Highlights
▸ Operational Performance | ▸ Financial Position | ▸ Strategic Set-up & HPO | ▸ Appendix

32
Gases Division, operating segmentsWestern Europe
-12.0%-11.2% 27.6%
H1 2008
27.4%
H1 2009
Operating MarginOperating ProfitSales
-20 bps
in € million, as reported
H1 2008 H1 2009H1 2008 H1 2009
2,083 1,849575
506
▸ Operational Performance | ▸ Financial Position | ▸ Strategic Set-up & HPO | ▸ Appendix
H1 highlights
— Comparable sales development of -6.0%, continued currency effect from GBP weakness
— No major turnaround in volumes in our major markets, pricing remains supportive
— Sales run rates stable in Q2 from Q1, but base effect in y-o-y comparison
— Ongoing sales growth in healthcare
— Margin stays strong in spite of lower volumes, supported by our HPO measures

33
9931,082
Gases Division, operating segmentsAmericas
+1.9%206 210-8.2% 19.0%
H1 2008
21.1%
H1 2009
Operating MarginOperating ProfitSales
+210 bps
in € million, as reported
H1 2008 H1 2009 H1 2008 H1 2009
▸ Operational Performance | ▸ Financial Position | ▸ Strategic Set-up & HPO | ▸ Appendix
H1 highlights
— Comparable sales development of -8.4%
— Stabilisation but no recovery of sales run-rates in Q2 from Q1
— Volumes remain well below previous year levels in North America, partly offset by pricing
— South America holding up quite well with underlying sales growth in cylinder and healthcare
— Substantial margin improvement supported by early capacity adjustments and HPO initiatives

34
945 877
Gases Division, operating segmentsAsia & Eastern Europe
-1.1%269 266-7.2% 28.5%
H1 2008
30.3%
H1 2009
+180 bps
Operating MarginOperating ProfitSales
in € million, as reported
H1 2008 H1 2009 H1 2008 H1 2009
▸ Operational Performance | ▸ Financial Position | ▸ Strategic Set-up & HPO | ▸ Appendix
H1 highlights
— Comparable sales development of -7.4%
— First indications of a slight recovery in sales run rates towards the end of H1
— Eastern Europe has stabilised, but IP and hence volumes still well below previous year
— Improving trends in tonnage capacity usage levels, especially in China
— Strong set-up to benefit from a potential upturn in economic conditions
— Margin further up, supported by accelerated productivity measures and JV contribution
35
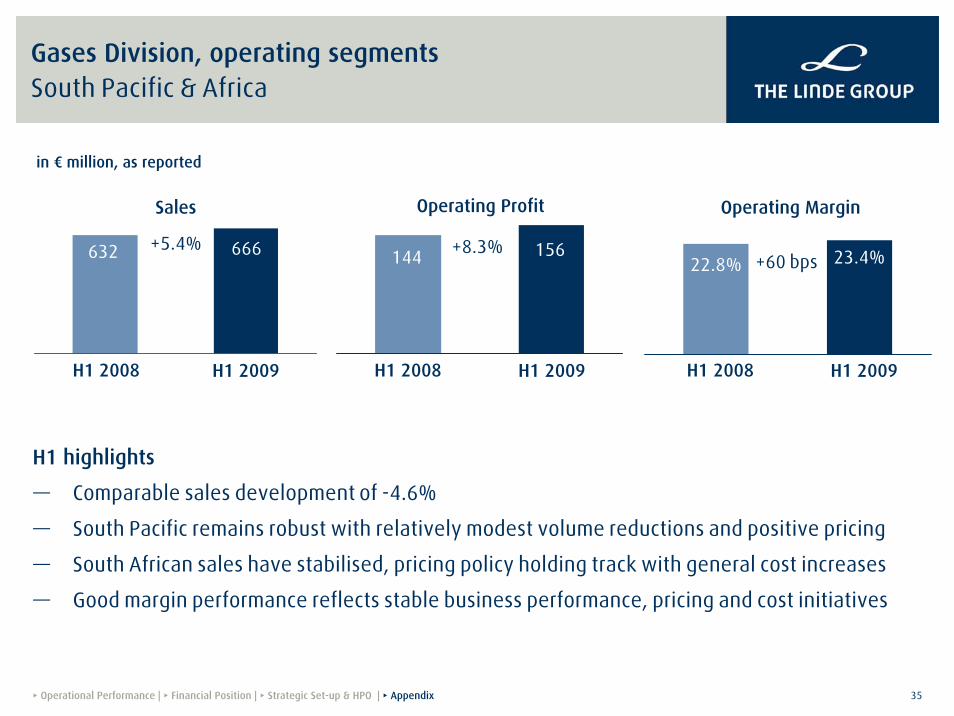
632 666
Gases Division, operating segmentsSouth Pacific & Africa
+8.3%144 156+5.4%22.8%
H1 2008
23.4%
H1 2009
+60 bps
Operating MarginOperating ProfitSales
in € million, as reported
H1 2008 H1 2009 H1 2008 H1 2009
▸ Operational Performance | ▸ Financial Position | ▸ Strategic Set-up & HPO | ▸ Appendix
H1 highlights
— Comparable sales development of -4.6%
— South Pacific remains robust with relatively modest volume reductions and positive pricing
— South African sales have stabilised, pricing policy holding track with general cost increases
— Good margin performance reflects stable business performance, pricing and cost initiatives

36
4,709
4,350
H1 2008 Currency Natural Gas Price/VolumeConsolidation H1 2009
-6.7%+3.3% -1.4% -2.8%
Gases Division, sales bridgeSales -6.7% on comparable basis
in € million
▸ Operational Performance | ▸ Financial Position | ▸ Strategic Set-up & HPO | ▸ Appendix

37
Gases Division, Joint VenturesConsolidation effect, but strong operational performance
in € million
302
H1 2008
149
H1 2009
10
Proportionate Sales(not incl. in the Group top-line)
Share of Net Income(contribution to operating profit)
-50.7% +48.0%
H1 2008 H1 2009
25
37Reduction due to fullconsolidation of formerJV Elgas as of Oct 2, 2008
Driven by new plant start-ups, esp. in Asia
▸ Operational Performance | ▸ Financial Position | ▸ Strategic Set-up & HPO | ▸ Appendix

38
Engineering DivisionBacklog above € 4 bn, new olefin order in Abu Dhabi
— Order intake close to strong previous year level: USD 1.075 bnorder for new ethane cracker in Abu Dhabi from Borouge JV
— Order backlog of € 4.381 bn (year-end 2008: € 4.436 bn)
in € million H1 08 H1 09 ∆ yoy
Order intake 1,557
1,411
126
1,299
8.9%
-16.6%
-21.1%
-28.6%
1,113
-80 bps
90
8.1%
Sales
Operating profit*
Margin
*EBITDA before special items and incl. share of net income from associates and joint ventures
Nat. Gas12%
Others6%
Olefin 72%
ASU 9%
HyCo6%
Order intake H1 09
Nat. Gas
7%
▸ Operational Performance | ▸ Financial Position | ▸ Strategic Set-up & HPO | ▸ Appendix

39
Group, FY 2008 Key P&L items
--230-379Taxes
--385-377Financial Result
-1,3911,752EBIT
+12.7917814Net income adjusted
+5.42,5552,424Operating profit
5.46
4.27
717
-371
59
1,703
20.2%
12,663
2008
-607Special items
--446PPA depreciation
+8.85.02EPS in € adjusted
-5.87EPS in €
+7.01,591EBIT before special items and PPA depreciation
-952Net income – Part of shareholders Linde AG
+50bps19.7%Margin
+2.912,306Sales
Δ in %2007in € million
▸ Operational Performance | ▸ Financial Position | ▸ Strategic Set-up & HPO | ▸ Appendix

40
€5.46
€4.66
€5.02
2006 2007 2008
Group, FY 2008 Financial key indicators
Further improvement in all our three key financial indicators
Profitable growth for our shareholders: adjusted EPS increase of 8.8%
Further improvement in capital returns: ROCE improvement of 210 bps
Strong cash flow generation maintained in weakening environment: OCF up by 7.7%
1,876
1,227
1,742
2006 2007 2008
12.4%
10.3%
11.4%
2006 2007 2008
Adjusted EPS Adjusted ROCE Operating Cash FlowIn € m, as reported
8.2% excl. KION
▸ Operational Performance | ▸ Financial Position | ▸ Strategic Set-up & HPO | ▸ Appendix

41
7,878
7,445
-824 -712
-903
403
7,116
7,330
+ Net pension obligation
- Cash
Adj. Equity
- Net financial services
+ Financial debt
681
-1,022
Adj. EBITAvg. CE
15,490
1,591
1,703
13,696
2007 2008 2007 2008
Group, FY 2008Adjusted ROCE
Capital Employed(B/S date)
13,88413,508
Adj. ROCE10.3%
Adj. ROCE12.4%
in € million
▸ Operational Performance | ▸ Financial Position | ▸ Strategic Set-up & HPO | ▸ Appendix

42
in € million Q1/08 Q2/08 Q3/08 Q4/08 2008 2007602 2,555
-1972,358
-229
-253
1,876153
-213-1.212
Investment Cash flow -223 -201 -292 -556 -1,272 2,086604
-1992,424
-1142,310
-336
-232
1,7423,533
-576-871
Funds from operations 403 673 593 689
3,828
-38
-28
33738
0-261
114
64544
-28
-86
57522
-139Net investments -240 -272 -439
19
65617
-77
-117
479Disposals 93 0Acquisitions -54 -20
Operating Profit
278
652-59
-86
-22
Operating Cash flow 485
193
Change in Working Capital
Paid taxes
Other changes
Free Cashflow before financing
Group, FY 2008Cash flow statement
▸ Operational Performance | ▸ Financial Position | ▸ Strategic Set-up & HPO | ▸ Appendix

43
Group, FY 2008Free cash flow after investments
575
485
479
337
604
19
193
280
112
1,876Total
Free Cash flow
Operating Cash flow
Q4
Q3
Q2
Q1
— Strong development of operating CF in Q4
— High investment activties in Q4 for bolt-on acquistion and on-site projects
-225
-199
-292
-556
-1,272
Cash Flow frominvesting activities
in € million
▸ Operational Performance | ▸ Financial Position | ▸ Strategic Set-up & HPO | ▸ Appendix

44
Group, FY 2008Capital expenditure and acquisitions
2008
CAPEX/Acquisitions
Other*
Proceeds
-1,611
-21
3,781
2007
-1,683
-31
442
-1,272
-34
576
213
53
1,470
Gases
Engineering
Other
42.0%
1,062
46-73
1,035
1,451
2,086
Cash Flow from investing activities CAPEX Acquisitions
+36.6%
+15.2%
2007 2008 2007 2008* Includes payments for investments in current financial assets; and reconciliation of posted capex and the cash out for capex
in € million
▸ Operational Performance | ▸ Financial Position | ▸ Strategic Set-up & HPO | ▸ Appendix

45
377
213
334
138
1,062
2007
506
295
505
145
1,451
2008
Western Europe
Americas
Asia & Eastern Europe
South Pacific & Africa +5.1%
+51.2%
+38.5%
+34.2%
+36.6%
213
Gases Division, FY 2008Capital expenditure
in € million
▸ Operational Performance | ▸ Financial Position | ▸ Strategic Set-up & HPO | ▸ Appendix

46
— Post-acquisition restructuring fully effective in 2008
— Positive impact of tax rate changes
— Strong performance of the Group in countries with lower tax rates
27.6%
20072006
22.9%
39.7%
2008
GroupTax rate
2009 targetRange: 25–27%
▸ Operational Performance | ▸ Financial Position | ▸ Strategic Set-up & HPO | ▸ Appendix

47
€1.50
€1.70
€1.80
+13.3%
2006 2007 2008
+5.9%
GroupDividend
Consistent dividend policy: dividend development in line with growth of operating profit
▸ Operational Performance | ▸ Financial Position | ▸ Strategic Set-up & HPO | ▸ Appendix

48
Other
Shares
Fixed-interest securities
PropertyInsurance
Group, FY 2008Pensions
Net obligation increases due to actuarial gains/losses
Further actuarial losses of approx. € 400 m avoided due to early optimization of the plan assets portfolio structure
7% 4%
38%
59%
45% 28%
1% 2%7%
9%
2007 2008
DBO Plan asset
Net obligation
01.01.2008 339
106
–24
447
–217
FX –714 –701 –13
Other 23 17 6
31.12.2008 4,097 3,453 644
Service costs
Net financing
Actuarial gains/losses
Contributions/payments
4,813
296
–947
–25
5,152
106
272
–500
–242
in € million
▸ Operational Performance | ▸ Financial Position | ▸ Strategic Set-up & HPO | ▸ Appendix

49
Group, Purchase Price Allocation Expected depreciation & amortisation
Development of depreciation and amortisation (in € million)
Impact in 2008: € 371 million
Expected range
2009 > 275 – 325
2010 > 200 – 250
2011 > 175 – 225
…
2022 < 100
0
100
200
300
400
500
2007
2009
2011
2015
2021
▸ Operational Performance | ▸ Financial Position | ▸ Strategic Set-up & HPO | ▸ Appendix

50
Accounting considerations Impact of PPA and EFL
Purchase Price Allocation (PPA)
Impact in H1 2009: € 146 m (H1 08: € 185 m)Expected impact FY 2009: € 275-325 m
Background:
— The difference between the purchase cost of BOC and related acquisitions in Asia and their net asset value has been allocated to assets on the Linde balance sheet (for BOC, see Linde 2007 annual report, p. 99).
— The revaluation of these assets leads to additional depreciation and amortisation charges according to the useful life of the assets.
— Goodwill is not amortised but subject to a yearly impairment test.
— Depreciation & Amortisation from PPA is excluded from the calculation of Adjusted EPS.
IFRIC 4: Embedded Finance Lease (EFL)
Impact* in H1 2009: € -63 m (H1 08: € -64 m)Expected impact* FY 2009: €-118 m *(on Sales and EBITDA)
Background:
— Tonnage contracts dedicated to one single customer (> 95% of sales), who covers all major market risks, have to be treated under IFRS like an embedded finance lease.
— The related cash flow streams are therefore no more booked as sales and operating profit but recognised as amortisation of financial receivables in the balance sheet and financial income in the P&L.
— EBITDA multiple comparison with peers needs to be adjusted for IFRIC 4
— Very minor impact on EPS, no impact on Free Cash Flow
▸ Operational Performance | ▸ Financial Position | ▸ Strategic Set-up & HPO | ▸ Appendix

51
GroupDefinition of financial key indicators
adjustedROCE
adjustedEPS
OperatingProfit
Return Operating profit- depreciation / amortisationexcl. depreciation/amortization from purchase price allocation
Average Capital Employed
Return
Shares
equity (incl. minorities)+ financial debt+ liabilities from financial services+ net pension obligations- cash and cash equivalents- receivables from financial services
Return
earnings after tax and minority interests+ depreciation/amortization from purchase price allocation+/- special items
average outstanding shares
EBITDA (incl. IFRIC 4 adjustment)excl. finance costs for pensionsexcl. special itemsincl. share of net income from associates and joint ventures
▸ Operational Performance | ▸ Financial Position | ▸ Strategic Set-up & HPO | ▸ Appendix
52
Investor Relations Contacts
Thomas Eisenlohr, Head of Investor RelationsPhone [email protected]
Robert SchneiderPhone [email protected]