unicef water, sanitation and hygiene annual report · pdf fileunicef water, sanitation and...
TRANSCRIPT
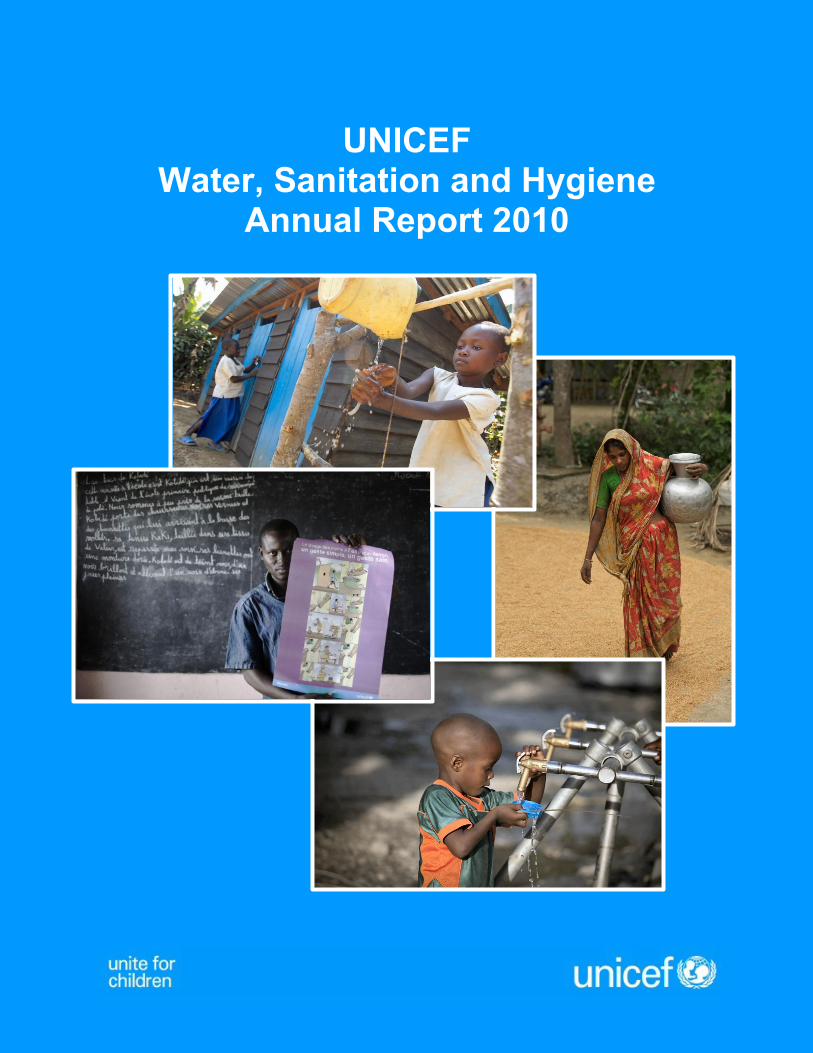
UNICEF Water, Sanitation and Hygiene
Annual Report 2010
UNICEF Water, Sanitation and Hygiene Annual Report 2010
UNICEF WASH Section
Programmes
UNICEF New York
May 2011
Cover photos: scenes from the 2010 UNICEF WASH programme (clockwise from top):
Sanitation and handwashing, South Kivu, DR Congo (UNICEF/ NYHQ2010-1996/Asselin)
Collecting water, Shariatpur, Bangladesh (UNICEF/ BANA2010-01219/Bashir Ahmed Sujan)
Emergency water supply, Port-au-Prince, Haiti (UNICEF/ NYHQ2010-1295/Ramoneda)
School hygiene session, Adjohoun, Benin (UNICEF/ NYHQ2010-2829/Sautereau)
UNICEF WASH Annual Report 2010 i
Executive Summary
Sector Developments
Progress in water and sanitation has been mixed. Through the efforts of governments, support agencies
and other stakeholders, an additional 1.3 billion people are using improved sanitation facilities and 1.8
billion are using improved drinking water systems since 1990 (the MDG baseline year). However, 2.6
billion people around the world still do not have adequate sanitation and 884 million are without
improved sources of drinking water. While the world as a whole is on track to meet the MDG drinking
water target, most countries in Sub-Saharan Africa are not. The majority of countries in Asia and Sub-
Saharan Africa – and the world as whole – are not on track to meet the sanitation target.
Diarrhoea – which is caused mainly by poor water, sanitation and hygiene – is still the second largest
single cause of under-five child mortality worldwide, killing more children under five than AIDS, malaria
and measles combined. Poor WASH is also a financial drain on families and on national economies. It
compromises gains made in education, and it impedes progress towards the goal of gender equality. At
the same time, gains in the WASH sector are threatened by climate change, by rapid urbanization, by
emergencies (such as in Haiti and Pakistan in 2010) and by the continuing economic crisis that is eroding
developing countries‟ ability to maintain and invest in new WASH services.
It is also increasingly clear that progress is inequitable. There continue to be many disparities in WASH
coverage: between middle-income and low-income countries, between urban and rural communities, and
between rich and poor households. Ethnic minorities and other marginalized groups have lower levels of
access, and women continue to be disproportionately affected by poor WASH services. The 2010 UN-
Water Global Annual Assessment of Sanitation and Drinking Water (GLAAS) report shows that sector
disparities are due in part to problems related to the targeting of aid.
A major study carried out by UNICEF in 2010 argues that inequitable patterns of support are not just
unfair; they also act as a brake on overall progress towards meeting the MDGs. The study, „Narrowing the
Gaps to Meet the Goals‟, shows that focusing support on the world‟s poorest is the most practical and
cost-effective way of reaching MDGs 4 and 5 (reducing child and maternal mortality).
The Sanitation and Water for All (SWA) partnership – formally launched in 2010 – encourages
governments and other stakeholders not only to prioritize basic water and sanitation interventions, but to
ensure that resources are targeted towards countries that are most off-track to meet the MDG water and
sanitation targets and that the focus is squarely on marginalized populations within countries.
The UNICEF WASH Programme
The UNICEF WASH programme continues to expand. In 2010 UNICEF supported WASH activities in
106 countries, the most ever, and raised its expenditure level to $393 million, the highest ever. By some
measures the UNICEF WASH programme is the largest of any single support agency operating in the
sector. It has more WASH professionals operating in more countries than any other external support
agency. It is not the largest in terms of funding, but the combined total of the UNICEF WASH core and
flow-through budgets is larger than all but a handful of the large bilateral agencies and the World Bank.
The UNICEF WASH programme is soundly country-focused. Over 98 per cent of expenditure is for
country programmes, and 94 per cent of professional staff members are posted at the national or sub-
national level. The largest programmes are in UNICEF‟s 60 WASH priority countries (those countries
with the greatest need in terms of WASH and child survival and development indicators). In all countries
UNICEF works „upstream‟ to help prioritize and improve the effectiveness of national WASH
programmes through direct engagement with government partners and through other mechanisms
including the new Sanitation and Water for All partnership. Yet UNICEF continues to work extensively at
UNICEF WASH Annual Report 2010 ii
the field level, ensuring that its efforts to help build enabling environments for WASH are centred in the
realities on the ground.
The WASH programme reached millions of children and their families in 2010, registering significant
results in many programme areas. These outcomes include:
In 2010 UNICEF provided WASH humanitarian support in multiple emergencies in 60 countries,
including the devastating earthquake in Haiti and the floods in Pakistan. In 55 of these countries,
UNICEF led or co-led the WASH cluster or similar coordination mechanism: it is now rare for
UNICEF not to have a leadership role in WASH humanitarian interventions in developing countries.
Through both emergency and development programmes of support, in 2010 UNICEF helped an
estimated 3.8 million households gain access to an improved drinking water source and more than 2.4
million gain access to improved sanitation facilities.
The alliances formed and commitments made at the Sanitation and Water for All High Level Meeting
have already begun to have an impact. In Ghana, for example, the new „SWA Compact‟ sets out a
single „actionable‟ national plan for meeting MDG targets, defines stakeholder responsibilities and
guarantees a minimum annual outlay of $350 million for WASH.
The „Call to Action for WASH in Schools‟ campaign was formally launched in 2010, generating
considerable interest among stakeholders and contributing to new resource allocations and new
programming initiatives for WASH in Schools (WinS). UNICEF sponsored WinS activities in 94
countries in 2010, the most ever.
UNICEF continued to lead efforts to encourage household water treatment and safe storage of water
in emergency and development programmes, contributing to an estimated 22 million households
reached with chlorine-based treatment and to 213,000 households installing low-cost filters.
The application of the Code of Practice for Cost-Effective Boreholes and related efforts are helping to
reduce drilling costs, especially in Sub-Saharan Africa, where costs are highest and where most
countries are not on track to meet the MDG water target.
The number of countries that are applying Community Approaches to Total Sanitation (CATS)
continues to grow, especially in Africa. CATS is now the dominant model for UNICEF sanitation
programming support.
Media campaigns supported by UNICEF – including those related to Global Handwashing Day –
reached almost half a billion people in 2010. An estimated 42 million were reached directly through
community hygiene promoters, school-based education and other mechanisms.
UNICEF profiled climate change-related WASH sustainability in 22 of its WASH programmes in
2010, with 43 programmes in 2010 supporting initiatives that adapt for climate change and/or
promote environmental sustainability.
Successes from UNICEF‟s continuing promotion of gender-aware programming approaches in 2010
included improved representation of women within WASH-related institutions and an expansion in
support activities related to improving menstrual hygiene management for women and girls.
Many challenges remain, starting with the need to further accelerate progress towards meeting the MDG
water and sanitation targets equitably and sustainably. In 2011 UNICEF will also emphasize a specific set
of challenges, including a re-focusing of its programmes on equity-based approaches, reducing costs and
improving the sustainability of water systems, further expanding CATS and efforts to promote
handwashing with soap, improving the monitoring of WASH in schools, and continuing to improve
emergency response and coordination efforts.
UNICEF WASH Annual Report 2010 iii
Table of Contents
EXECUTIVE SUMMARY ............................................................................................................................................. I
TABLE OF CONTENTS ............................................................................................................................................. III
FIGURES, TABLES AND BOXES ............................................................................................................................. IV
ABBREVIATIONS AND ACRONYMS .......................................................................................................................V
1 SECTOR ANALYSIS .................................................................................................................................................. 1
1.1 THE CHALLENGE: INCREASING COVERAGE WHILE REDUCING INEQUITY ............................................................ 1 1.2 TOWARDS MORE EQUITABLE AND EFFICIENT MODELS OF SUPPORT ................................................................... 3
2 UNICEF WASH PROGRAMME OVERVIEW ....................................................................................................... 4
2.1 SANITATION AND WATER FOR ALL ..................................................................................................................... 4 2.2 WASH PROGRAMME SCOPE AND STRUCTURE .................................................................................................... 5 2.3 PROGRAMME HIGHLIGHTS .................................................................................................................................. 7 2.4 BENEFICIARIES .................................................................................................................................................. 10
3 PROGRESS IN 2010 ................................................................................................................................................. 12
3.1 BUILDING ENABLING ENVIRONMENTS .............................................................................................................. 12 3.2 HYGIENE AND SANITATION PROMOTION ........................................................................................................... 13 3.3 WATER SUPPLY AND WATER QUALITY ............................................................................................................. 17 3.4 WASH IN SCHOOLS .......................................................................................................................................... 20
4 EMERGENCY COORDINATION AND RESPONSE .......................................................................................... 24
4.1 THE GROWING NEED FOR UNICEF WASH IN EMERGENCIES ........................................................................... 24 4.2 EMERGENCY RESPONSE .................................................................................................................................... 25 4.3 EMERGENCY COORDINATION AND CAPACITY BUILDING .................................................................................. 27
5 WASH, THE ENVIRONMENT AND CLIMATE CHANGE ............................................................................... 29
6 GENDER AND WASH ............................................................................................................................................. 30
7 SECTOR MONITORING ........................................................................................................................................ 32
8 PARTNERSHIPS ...................................................................................................................................................... 33
9 UNICEF EXPENDITURE FOR WASH ................................................................................................................. 34
9.1 EXPENDITURE PATTERNS AND FUNDING STATUS .............................................................................................. 34 9.2 FUNDING SOURCES ........................................................................................................................................... 36
10 CHALLENGES FOR 2011 AND BEYOND .......................................................................................................... 37
ANNEX I: UNICEF WASH PRIORITY COUNTRIES ........................................................................................... 39
ANNEX II: SANITATION AND WATER FOR ALL PARTNERS ........................................................................ 40
UNICEF WASH Annual Report 2010 iv
Figures, Tables and Boxes
Figures
Figure 1: Causes of Under Five Child Mortality, Global, 2008
Figure 2: Global Sanitation and Drinking Water Coverage Inequities, 2008
Figure 3: Predicted Impact of Equity-focused Strategic Model on Under-Five Mortality
Figure 4: 106 Countries (priority + other) with WASH activities in 2010
Figure 5: Development programme balance by expenditure, 2010
Figure 6: Countries with a national handwashing with soap promotion programmes
Figure 7: Programme Countries with UNICEF-supported Programmes Based on the CATS model
Figure 8: Percentage of Countries with National HWTS Programmes, 2010
Figure 9: Reducing Drilling Costs, Mozambique and Zambia
Figure 10: Countries with UNICEF WASH in Schools Activities, 2002 – 2010
Figure 11: Water and Sanitation Facilities in Primary Schools
Figure 12: Countries Providing WinS Monitoring Data, 2008-2010
Figure 13: UNICEF Emergency WASH Expenditure, 1990 – 2010
Figure 14: UNICEF Emergency WASH Interventions by Region, 2010 (child beneficiaries and number of
countries)
Figure 15: Country level emergency response and coordination, 2010
Figure 16: Emergency Placements in the field under UNICEF Standby Arrangements with Partners
Figure 17: Climate Change Hazards (extract from the China Country Profile)
Figure 18: Total UNICEF WASH expenditure, 1990 – 2010
Figure 19: WASH Expenditure by Region, 2010
Figure 20: Funding sources, 2010
Tables
Table 1: SWA Commitment Examples
Table 2: UNICEF Webinar Training Session Subjects, 2010
Table 3: ESTIMATED beneficiaries from UNICEF-supported community and school WASH programmes,
2010
Table 4: CATS: changing social norms (from a CATS+2 presentation)
Table 5: UNICEF Emergency Response in Haiti
Table 6: UNICEF Emergency Response in Pakistan
Table 7: Countries in which UNICEF emergency expenditure exceeded $1 million in 2010
Table 8: Gender balance of UNICEF professional WASH officers
Table 9: Top ten countries by WASH expenditure, 2007 to 2010 (millions of US$)
Table 10: Top ten donors by total WASH expenditure, 2006 to 2010 (descending order by size of total
contribution – EOR plus ORR)
Table 11: Top ten donors by emergency and development programme expenditure (millions of US$)
Boxes
Box 1: Sanitation and Water For All Constituency Partners
Box 2: Selected UNICEF-supported WASH technical and capacity building publications, 2010
Box 3: Assumptions and Notes for Beneficiary Figures
Box 4: Key Findings from the WCAR Regional CLTS Evaluation
Box 5: Call to Action for WASH in Schools Action Points
Box 7: JMP 2010 Publications
Box 8: Key Global WASH Partnership Frameworks
UNICEF WASH Annual Report 2010 v
Abbreviations and Acronyms
$ US$
ACF Action Contre la Faim
ACSD Accelerated Child Survival and Development
ADB Asian Development Bank
AED Academy for Educational Development
AfDB African Development Bank
AMCOW African Ministers' Council on Water
CATS Community Approaches to Total Sanitation
CCCs Core Commitments for Children
CEE/CIS Central and Eastern Europe and the Commonwealth of Independent States
CFS Child-Friendly School
CHERG Child Health Epidemiology Reference Group
CLTS Community Led Total Sanitation
CREPA Centre Régional pour l'Eau Potable et l'Assainissement à faible coût
CSO Country Status Overview
DEWATS Decentralised Wastewater Treatment System
DFID Department for International Development (UK) (or UKaid)
DGIS Directorate-General for International Cooperation (Government of the Netherlands)
DHS Demographic and Health Survey
DRR Disaster Risk Reduction
EAPR East Asia and the Pacific Region
EC European Commission
ECHO European Commission Humanitarian Aid Office
EMIS Education Management Information Systems
EOR Emergency Other Resources (sometimes also written as ORE)
ESAR Eastern and Southern Africa Region
EU European Union
GHD Global Handwashing Day
GLAAS UN-Water Global Annual Assessment of Sanitation and Drinking-Water
HWTS Household Water Treatment and Safe Storage
IASC Inter-Agency Standing Committee
IDP Internally Displaced Persons
IDS Institute of Development Studies
ILE International Learning Exchange
IRC International Water and Sanitation Centre
IYS International Year of Sanitation
LAC Latin America and the Caribbean
JMP Joint Monitoring Programme for Water Supply and Sanitation
LSHTM London School of Hygiene & Tropical Medicine
MDG Millennium Development Goal
MDG-F MDG Achievement Fund
MENA Middle East and North Africa
UNICEF WASH Annual Report 2010 vi
MICS Multiple Indicator Cluster Survey
MSB Swedish Civil Contingencies Agency
MTSP Medium-Term Strategic Plan
NatCom National Committee
NGO Non-governmental Organization
NRC Norwegian Refugee Council
ODA Official Development Assistance
ODF open defecation free
OECD Organisation for Economic Co-operation and Development
OFDA Office of U.S. Foreign Disaster Assistance
ORR other resources, regular
PLoS Public Library of Science
PPP Public-Private Partnership
PPPHW Global Public-Private Partnership for Handwashing with Soap
PRSP Poverty Reduction Strategy Paper
PSI Population Services International
RR regular resources
RRT Rapid Response Team
RWSN Rural Water Supply Network
SA South Asia
SACOSAN South Asian Conference on Sanitation
SANDEC Department of Water and Sanitation in Developing Countries, in the Swiss Federal
Institute of Aquatic Science and Technology (EAWAG)
SDC Swiss Agency for Development and Cooperation
SIDA Swedish International Development Agency
SLTS School Led Total Sanitation
SWA Sanitation and Water for All
SWAP Sector-Wide Approaches to Programming
UNDAF United Nations Development Assistance Framework
USAID United States Agency for International Development
WASH Water, Sanitation and Hygiene
WCAR West and Central Africa Region
WEDC Water, Engineering and Development Centre
WinS WASH in Schools
WHO World Health Organization
WSMP Water and Sanitation Monitoring Platform
WSP Water and Sanitation Program (World Bank administered)
YCSD Young Child Survival and Development
UNICEF WASH Annual Report 2010 1
1 Sector Analysis
1.1 The Challenge: Increasing Coverage while Reducing Inequity
Good, but still Insufficient Progress
Between 1990 (the MDG baseline year) and 2008 (the latest available data year), efforts by governments,
support agencies and people themselves resulted in additional 1.3 billion people using improved
sanitation facilities and 1.8 billion improved drinking water systems. In that same period, the proportion
of people using improved sanitation rose from 54 to 61 per cent and drinking water from 77 to 87 per
cent.1 As a result, the world as a whole is on track to meet the MDG drinking water target and some
regions will meet the sanitation target.
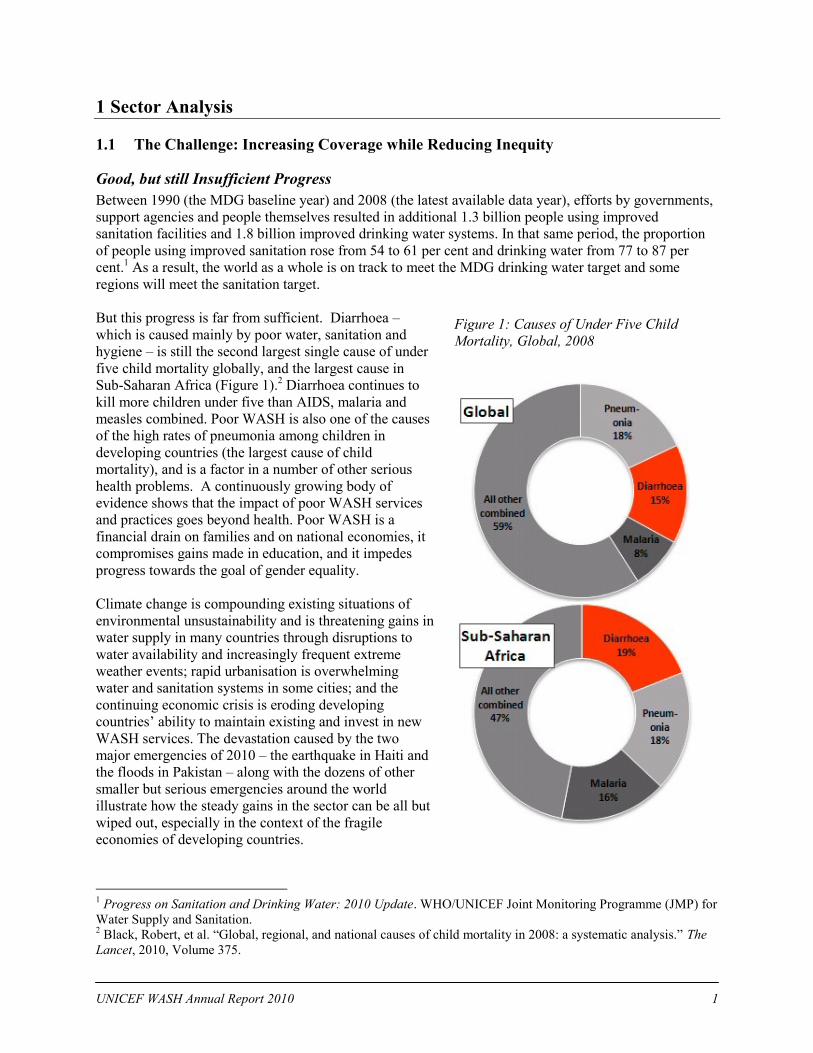
But this progress is far from sufficient. Diarrhoea –
which is caused mainly by poor water, sanitation and
hygiene – is still the second largest single cause of under
five child mortality globally, and the largest cause in
Sub-Saharan Africa (Figure 1).2 Diarrhoea continues to
kill more children under five than AIDS, malaria and
measles combined. Poor WASH is also one of the causes
of the high rates of pneumonia among children in
developing countries (the largest cause of child
mortality), and is a factor in a number of other serious
health problems. A continuously growing body of
evidence shows that the impact of poor WASH services
and practices goes beyond health. Poor WASH is a
financial drain on families and on national economies, it
compromises gains made in education, and it impedes
progress towards the goal of gender equality.
Climate change is compounding existing situations of
environmental unsustainability and is threatening gains in
water supply in many countries through disruptions to
water availability and increasingly frequent extreme
weather events; rapid urbanisation is overwhelming
water and sanitation systems in some cities; and the
continuing economic crisis is eroding developing
countries‟ ability to maintain existing and invest in new
WASH services. The devastation caused by the two
major emergencies of 2010 – the earthquake in Haiti and
the floods in Pakistan – along with the dozens of other
smaller but serious emergencies around the world
illustrate how the steady gains in the sector can be all but
wiped out, especially in the context of the fragile
economies of developing countries.
1 Progress on Sanitation and Drinking Water: 2010 Update. WHO/UNICEF Joint Monitoring Programme (JMP) for
Water Supply and Sanitation. 2 Black, Robert, et al. “Global, regional, and national causes of child mortality in 2008: a systematic analysis.” The
Lancet, 2010, Volume 375.
Figure 1: Causes of Under Five Child
Mortality, Global, 2008
UNICEF WASH Annual Report 2010 2
Inequitable Coverage
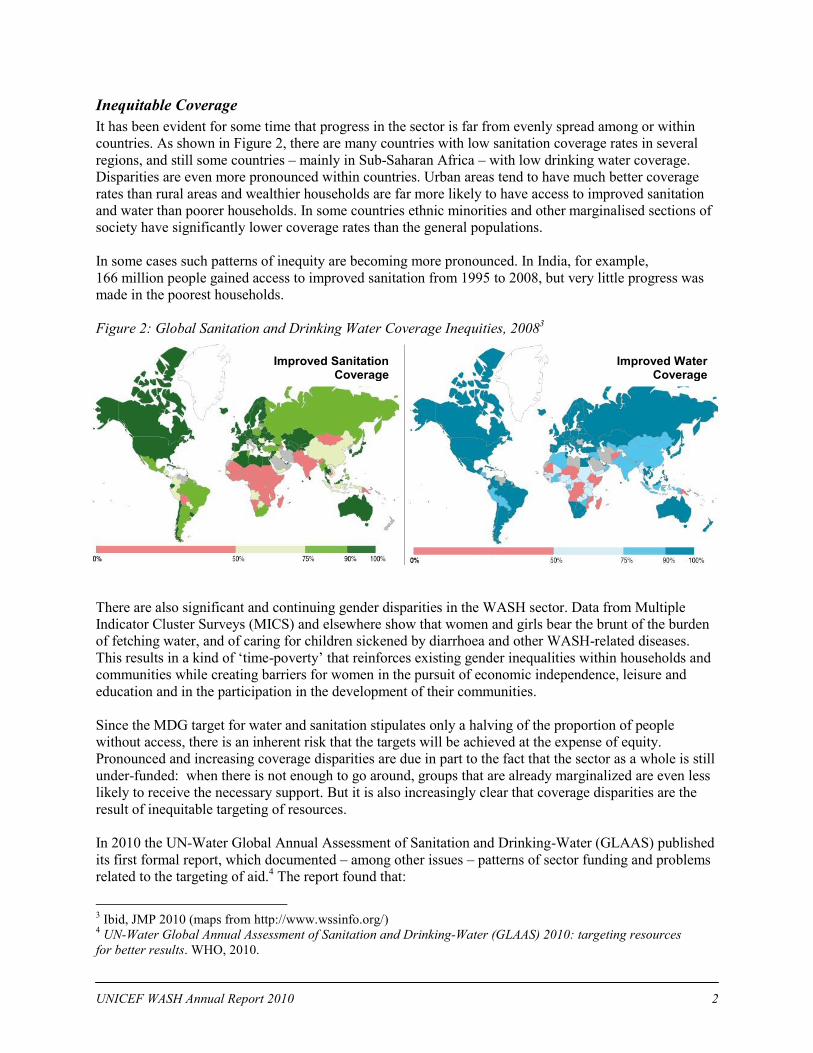
It has been evident for some time that progress in the sector is far from evenly spread among or within
countries. As shown in Figure 2, there are many countries with low sanitation coverage rates in several
regions, and still some countries – mainly in Sub-Saharan Africa – with low drinking water coverage.
Disparities are even more pronounced within countries. Urban areas tend to have much better coverage
rates than rural areas and wealthier households are far more likely to have access to improved sanitation
and water than poorer households. In some countries ethnic minorities and other marginalised sections of
society have significantly lower coverage rates than the general populations.
In some cases such patterns of inequity are becoming more pronounced. In India, for example,
166 million people gained access to improved sanitation from 1995 to 2008, but very little progress was
made in the poorest households.
Figure 2: Global Sanitation and Drinking Water Coverage Inequities, 20083
There are also significant and continuing gender disparities in the WASH sector. Data from Multiple
Indicator Cluster Surveys (MICS) and elsewhere show that women and girls bear the brunt of the burden
of fetching water, and of caring for children sickened by diarrhoea and other WASH-related diseases.
This results in a kind of „time-poverty‟ that reinforces existing gender inequalities within households and
communities while creating barriers for women in the pursuit of economic independence, leisure and
education and in the participation in the development of their communities.
Since the MDG target for water and sanitation stipulates only a halving of the proportion of people
without access, there is an inherent risk that the targets will be achieved at the expense of equity.
Pronounced and increasing coverage disparities are due in part to the fact that the sector as a whole is still
under-funded: when there is not enough to go around, groups that are already marginalized are even less
likely to receive the necessary support. But it is also increasingly clear that coverage disparities are the
result of inequitable targeting of resources.
In 2010 the UN-Water Global Annual Assessment of Sanitation and Drinking-Water (GLAAS) published
its first formal report, which documented – among other issues – patterns of sector funding and problems
related to the targeting of aid.4 The report found that:
3 Ibid, JMP 2010 (maps from http://www.wssinfo.org/)
4 UN-Water Global Annual Assessment of Sanitation and Drinking-Water (GLAAS) 2010: targeting resources
for better results. WHO, 2010.
Improved Sanitation Coverage
Improved Water Coverage
UNICEF WASH Annual Report 2010 3
Developing country government spending in the sector is inadequate: the median reported
government spending on sanitation and drinking-water is only 0.48% of GDP (based on a sample
of 20 countries);
donor allocations to the sector are inadequate: while overall aid commitments have risen, the
sanitation and drinking water share of development aid has decreased relative to other sectors
over the period 1998–2008;
development aid for drinking-water and sanitation is not targeted at poor countries: low-income
countries receive only 42% of the total aid for the sector;
development aid is not allocated to the neediest within countries: aid for basic sanitation and
drinking water services decreased from 27% to 16% over the period 2003–2008.
1.2 Towards more Equitable and Efficient Models of Support
Equitable Approaches are the Most
Effective
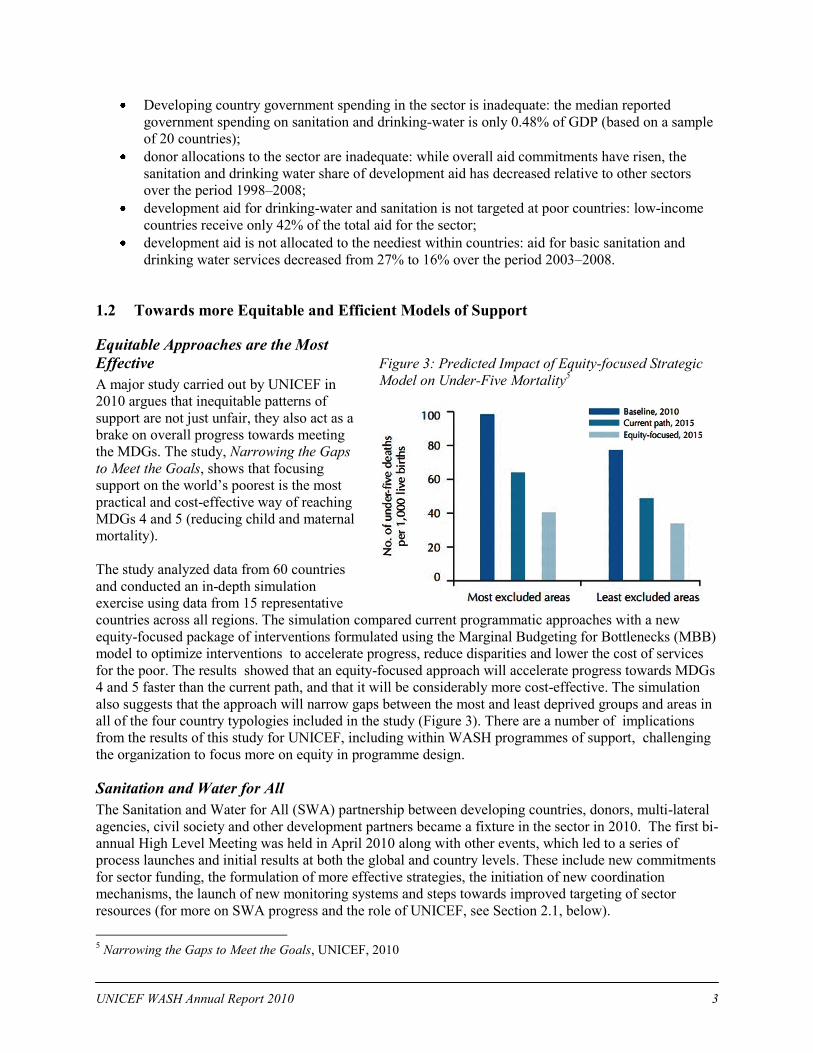
A major study carried out by UNICEF in
2010 argues that inequitable patterns of
support are not just unfair, they also act as a
brake on overall progress towards meeting
the MDGs. The study, Narrowing the Gaps
to Meet the Goals, shows that focusing
support on the world‟s poorest is the most
practical and cost-effective way of reaching
MDGs 4 and 5 (reducing child and maternal
mortality).
The study analyzed data from 60 countries
and conducted an in-depth simulation
exercise using data from 15 representative
countries across all regions. The simulation compared current programmatic approaches with a new
equity-focused package of interventions formulated using the Marginal Budgeting for Bottlenecks (MBB)
model to optimize interventions to accelerate progress, reduce disparities and lower the cost of services
for the poor. The results showed that an equity-focused approach will accelerate progress towards MDGs
4 and 5 faster than the current path, and that it will be considerably more cost-effective. The simulation
also suggests that the approach will narrow gaps between the most and least deprived groups and areas in
all of the four country typologies included in the study (Figure 3). There are a number of implications
from the results of this study for UNICEF, including within WASH programmes of support, challenging
the organization to focus more on equity in programme design.
Sanitation and Water for All
The Sanitation and Water for All (SWA) partnership between developing countries, donors, multi-lateral
agencies, civil society and other development partners became a fixture in the sector in 2010. The first bi-
annual High Level Meeting was held in April 2010 along with other events, which led to a series of
process launches and initial results at both the global and country levels. These include new commitments
for sector funding, the formulation of more effective strategies, the initiation of new coordination
mechanisms, the launch of new monitoring systems and steps towards improved targeting of sector
resources (for more on SWA progress and the role of UNICEF, see Section 2.1, below).
5 Narrowing the Gaps to Meet the Goals, UNICEF, 2010
Figure 3: Predicted Impact of Equity-focused Strategic
Model on Under-Five Mortality5
UNICEF WASH Annual Report 2010 4
The core SWA principles are underpinned by equitable approaches to funding in the sector at both the
national and global levels. The SWA encourages governments and other stakeholders not only to
prioritize basic water and sanitation interventions, but also to ensure that new and existing resources are
targeted towards countries that are most off-track to meet the MDG water and sanitation targets and that
the focus is squarely on marginalised populations within countries. At national level, the SWA
emphasizes the creation of stronger national monitoring mechanisms to enable equitable resource
targeting, which are in turn linked to improved and more transparent systems for accountability. At the
global level, the SWA encourages transparency and accountability among donor stakeholders through the
use of GLAAS and other mechanisms.
2 UNICEF WASH Programme Overview
2.1 Sanitation and Water for All
Support to the Sanitation and Water for All partnership
was a continuing priority for UNICEF in 2010 at both
the global and national levels. Building on preparatory
work in 2008 and 2009, the partnership was firmly
established in 2010 as a key coordination, planning,
advocacy and accountability mechanism for the sector.
As of January 2011, SWA included 66 partners.
Participants at first High Level Meeting of the SWA
included finance ministers and water and sanitation
ministers from 17 countries along with representatives
from donor countries, UN agencies, civil society groups
and other stakeholders. The meeting focused on building
buy-in for the SWA principals of sector prioritisation,
equitable targeting of resources, enhanced donor coordination, mutual accountability and the development
of improved planning and monitoring mechanisms. The participation of representatives of funding
agencies (finance ministers and donors) along with sector professionals and stakeholder agencies
provided a unique opportunity for moving forward quickly on partnership priorities. Immediate results
from the meeting included:
six countries committing to increase their domestic spending on the water and sanitation sector;
eight governments announcing specific measures aimed at improving co-ordination between
different sectors of their governments;
ten countries using coverage data to ensure that they were targeting unserved populations, and
seven governments outlining specific measures they were taking to improve their national
monitoring systems.;
donor participants agreeing to support the partnership by attending future meetings and by
aligning their strategies with country processes;
donors reiterating their commitments to mobilize resources to increase access to water and
sanitation.
Sanitation and Water For All
Constituency Partners
As of January 2011, the SWA is comprised of 66
partners including:
Developing countries (32)
Donors (6)
Multilateral agencies (8)
Regional development bank (1)
Civil society partners (3)
Other sector partners (16)
(see Annex II for full listing of partners)
UNICEF WASH Annual Report 2010 5
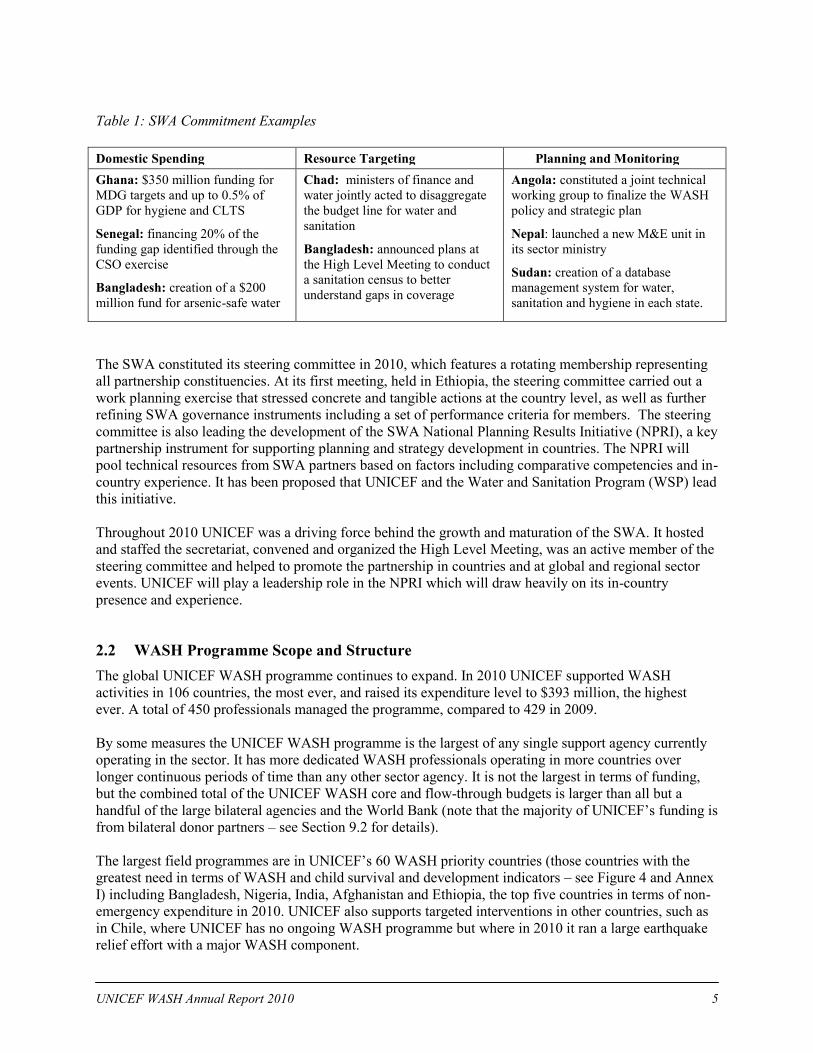
Table 1: SWA Commitment Examples
Domestic Spending Resource Targeting Planning and Monitoring
Ghana: $350 million funding for
MDG targets and up to 0.5% of
GDP for hygiene and CLTS
Senegal: financing 20% of the
funding gap identified through the
CSO exercise
Bangladesh: creation of a $200
million fund for arsenic-safe water
Chad: ministers of finance and
water jointly acted to disaggregate
the budget line for water and
sanitation
Bangladesh: announced plans at
the High Level Meeting to conduct
a sanitation census to better
understand gaps in coverage
Angola: constituted a joint technical
working group to finalize the WASH
policy and strategic plan
Nepal: launched a new M&E unit in
its sector ministry
Sudan: creation of a database
management system for water,
sanitation and hygiene in each state.
The SWA constituted its steering committee in 2010, which features a rotating membership representing
all partnership constituencies. At its first meeting, held in Ethiopia, the steering committee carried out a
work planning exercise that stressed concrete and tangible actions at the country level, as well as further
refining SWA governance instruments including a set of performance criteria for members. The steering
committee is also leading the development of the SWA National Planning Results Initiative (NPRI), a key
partnership instrument for supporting planning and strategy development in countries. The NPRI will
pool technical resources from SWA partners based on factors including comparative competencies and in-
country experience. It has been proposed that UNICEF and the Water and Sanitation Program (WSP) lead
this initiative.
Throughout 2010 UNICEF was a driving force behind the growth and maturation of the SWA. It hosted
and staffed the secretariat, convened and organized the High Level Meeting, was an active member of the
steering committee and helped to promote the partnership in countries and at global and regional sector
events. UNICEF will play a leadership role in the NPRI which will draw heavily on its in-country
presence and experience.
2.2 WASH Programme Scope and Structure
The global UNICEF WASH programme continues to expand. In 2010 UNICEF supported WASH
activities in 106 countries, the most ever, and raised its expenditure level to $393 million, the highest
ever. A total of 450 professionals managed the programme, compared to 429 in 2009.
By some measures the UNICEF WASH programme is the largest of any single support agency currently
operating in the sector. It has more dedicated WASH professionals operating in more countries over
longer continuous periods of time than any other sector agency. It is not the largest in terms of funding,
but the combined total of the UNICEF WASH core and flow-through budgets is larger than all but a
handful of the large bilateral agencies and the World Bank (note that the majority of UNICEF‟s funding is
from bilateral donor partners – see Section 9.2 for details).
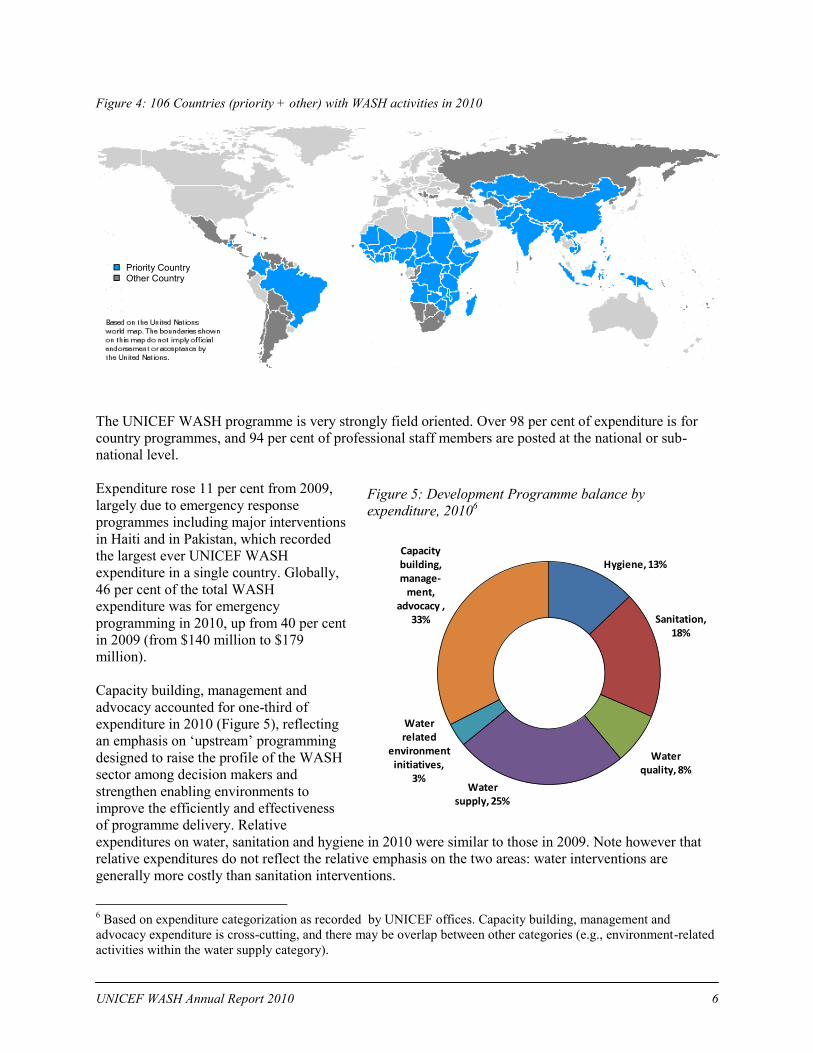
The largest field programmes are in UNICEF‟s 60 WASH priority countries (those countries with the
greatest need in terms of WASH and child survival and development indicators – see Figure 4 and Annex
I) including Bangladesh, Nigeria, India, Afghanistan and Ethiopia, the top five countries in terms of non-
emergency expenditure in 2010. UNICEF also supports targeted interventions in other countries, such as
in Chile, where UNICEF has no ongoing WASH programme but where in 2010 it ran a large earthquake
relief effort with a major WASH component.
UNICEF WASH Annual Report 2010 6
Figure 4: 106 Countries (priority + other) with WASH activities in 2010
The UNICEF WASH programme is very strongly field oriented. Over 98 per cent of expenditure is for
country programmes, and 94 per cent of professional staff members are posted at the national or sub-
national level.
Expenditure rose 11 per cent from 2009,
largely due to emergency response
programmes including major interventions
in Haiti and in Pakistan, which recorded
the largest ever UNICEF WASH
expenditure in a single country. Globally,
46 per cent of the total WASH
expenditure was for emergency
programming in 2010, up from 40 per cent
in 2009 (from $140 million to $179
million).
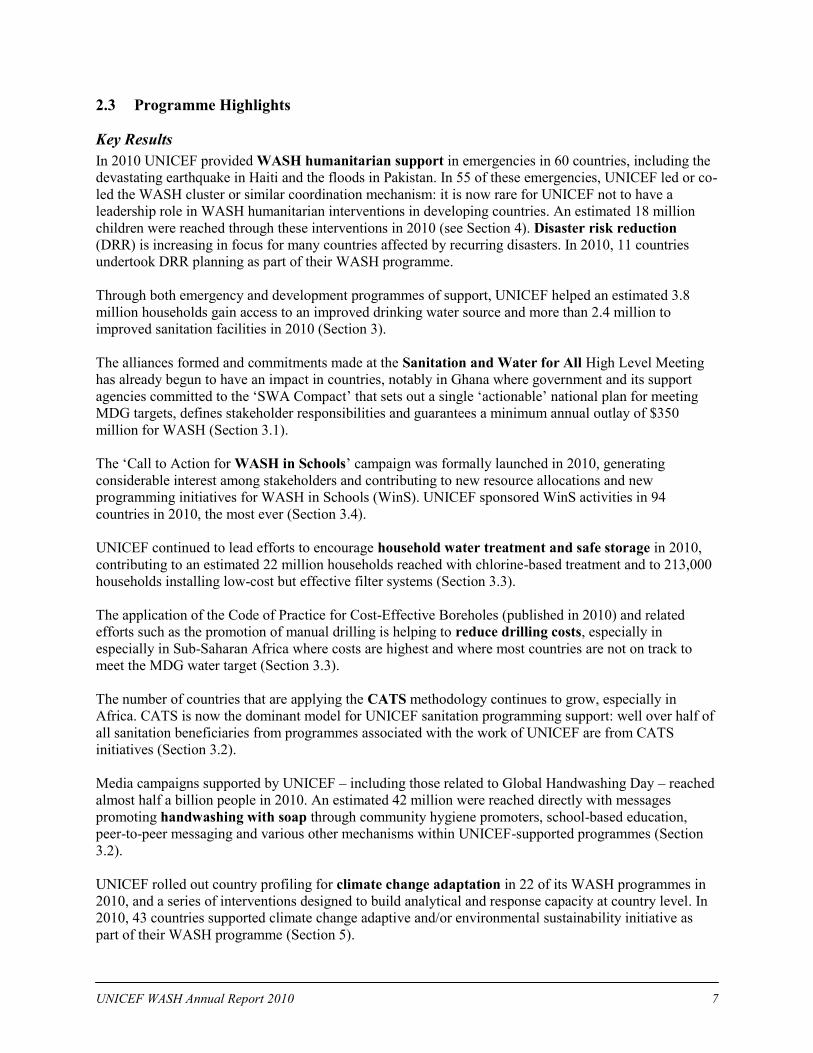
Capacity building, management and
advocacy accounted for one-third of
expenditure in 2010 (Figure 5), reflecting
an emphasis on „upstream‟ programming
designed to raise the profile of the WASH
sector among decision makers and
strengthen enabling environments to
improve the efficiently and effectiveness
of programme delivery. Relative
expenditures on water, sanitation and hygiene in 2010 were similar to those in 2009. Note however that
relative expenditures do not reflect the relative emphasis on the two areas: water interventions are
generally more costly than sanitation interventions.
6 Based on expenditure categorization as recorded by UNICEF offices. Capacity building, management and
advocacy expenditure is cross-cutting, and there may be overlap between other categories (e.g., environment-related
activities within the water supply category).
Figure 5: Development Programme balance by
expenditure, 20106
Hygiene, 13%
Sanitation, 18%
Water quality, 8%
Water supply, 25%
Water related
environment initiatives,
3%
Capacity building, manage-
ment, advocacy ,
33%
Priority Country Other Country
UNICEF WASH Annual Report 2010 7
2.3 Programme Highlights
Key Results
In 2010 UNICEF provided WASH humanitarian support in emergencies in 60 countries, including the
devastating earthquake in Haiti and the floods in Pakistan. In 55 of these emergencies, UNICEF led or co-
led the WASH cluster or similar coordination mechanism: it is now rare for UNICEF not to have a
leadership role in WASH humanitarian interventions in developing countries. An estimated 18 million
children were reached through these interventions in 2010 (see Section 4). Disaster risk reduction
(DRR) is increasing in focus for many countries affected by recurring disasters. In 2010, 11 countries
undertook DRR planning as part of their WASH programme.
Through both emergency and development programmes of support, UNICEF helped an estimated 3.8
million households gain access to an improved drinking water source and more than 2.4 million to
improved sanitation facilities in 2010 (Section 3).
The alliances formed and commitments made at the Sanitation and Water for All High Level Meeting
has already begun to have an impact in countries, notably in Ghana where government and its support
agencies committed to the „SWA Compact‟ that sets out a single „actionable‟ national plan for meeting
MDG targets, defines stakeholder responsibilities and guarantees a minimum annual outlay of $350
million for WASH (Section 3.1).
The „Call to Action for WASH in Schools‟ campaign was formally launched in 2010, generating
considerable interest among stakeholders and contributing to new resource allocations and new
programming initiatives for WASH in Schools (WinS). UNICEF sponsored WinS activities in 94
countries in 2010, the most ever (Section 3.4).
UNICEF continued to lead efforts to encourage household water treatment and safe storage in 2010,
contributing to an estimated 22 million households reached with chlorine-based treatment and to 213,000
households installing low-cost but effective filter systems (Section 3.3).
The application of the Code of Practice for Cost-Effective Boreholes (published in 2010) and related
efforts such as the promotion of manual drilling is helping to reduce drilling costs, especially in
especially in Sub-Saharan Africa where costs are highest and where most countries are not on track to
meet the MDG water target (Section 3.3).
The number of countries that are applying the CATS methodology continues to grow, especially in
Africa. CATS is now the dominant model for UNICEF sanitation programming support: well over half of
all sanitation beneficiaries from programmes associated with the work of UNICEF are from CATS
initiatives (Section 3.2).
Media campaigns supported by UNICEF – including those related to Global Handwashing Day – reached
almost half a billion people in 2010. An estimated 42 million were reached directly with messages
promoting handwashing with soap through community hygiene promoters, school-based education,
peer-to-peer messaging and various other mechanisms within UNICEF-supported programmes (Section
3.2).
UNICEF rolled out country profiling for climate change adaptation in 22 of its WASH programmes in
2010, and a series of interventions designed to build analytical and response capacity at country level. In
2010, 43 countries supported climate change adaptive and/or environmental sustainability initiative as
part of their WASH programme (Section 5).
UNICEF WASH Annual Report 2010 8
Successes from UNICEF‟s continuing promotion of gender-aware programming approaches included
improved representation of women within WASH-related institutions in some countries, an expansion in
support activities related to menstrual hygiene management for women and girls, and the development of
a gender guidance document for programming for child survival and development.
Building the Evidence Base in WASH
A key UNICEF contribution towards efforts to build knowledge in the sector is its long running
partnership with WHO on the JMP. Not only does the JMP provide the basic coverage data needed to
monitor the MDG water and sanitation targets, it also yields a complimentary dataset that is increasingly
relied upon by sector stakeholders to design strategies, set priorities and re-focus programmes. One
example is information on the significant disparities in coverage between poor and richer households that
are now evident in many countries; another is new data on hygiene practices. Some of this secondary data
does not appear in the main JMP report, but it is used by JMP and others in many different ways. For
example, a study on household water treatment practices published by the London School of Hygiene and
Tropical Medicine in 2010 relies entirely on data gathered through the same household surveys used by
the JMP (see Section 3.3 for information on the results of the study). While the JMP does not sponsor its
own country level surveys, it is instrumental in raising the quality of the surveys and standardising
indicators across the surveys.7
In 2010 UNICEF also continued to work with partners on a variety of sector-related studies at the global
and regional level. One area of continued interest is research into the links between WASH and child
health and development: in this area UNICEF supports multi-sectoral studies (such as the Lancet series on
child health). UNICEF contributed to the 2010 PLoS Medicine series on water and sanitation, co-
authoring one paper8. UNICEF also supported a new Cochrane Review paper on the links between
excreta disposal and diarrhoeal disease.9
UNICEF carried out a regional evaluation of CLTS programming in the West and Central Africa region
(WCAR) in 2010 to assess the effectiveness of the roll-out process, and to provide guidance on
methodologies for taking the approach to scale. The evaluation documented the success of the approach
in the region (where over a million people now live in ODF communities) and identified key lessons in
the areas of national coordination, policy development and the need for follow-up in „triggered‟
communities.
UNICEF provided significant support to the second round of the African Ministers‟ Council on Water
(AMCOW) and the World Bank-supported Country Status Overview (CSO) assessment process which
eventually covered 32 sub-Saharan African countries. CSO reports provide extensive information on
institutional, financial and capacity issues that influence progress towards the MDG targets, and are an
important input into global monitoring and national planning processes linked to the Sanitation and Water
for All initiative.
In 2010 UNICEF supported two studies on HWTS in emergency settings. The first of these looked at the
role of HWTS in emergencies and the factors for its successful implementation, while the second assessed
the sustained uptake of HWTS in emergency and post-emergency situations. The findings from these
studies will help guide future HWTS interventions for maximum impact in emergencies and their
7 The JMP uses the UNICEF-sponsored Multiple Indicator Cluster Surveys (MICS), the USAID-financed
Demographic Health Surveys (DHS) and other national household surveys that meet quality criteria. 8 Cairncross S, Bartram J, Cumming O, Brocklehurst C, 2010 “Hygiene, Sanitation, and Water: What Needs to Be
Done?”, PLoS Med 7(11): e1000365. 9 Clasen et al. 2010. “Interventions to improve disposal of human excreta for preventing diarrhoea”.
Cochrane Database of Systematic Reviews 2010, Issue 6. Art. No.: CD007180.
UNICEF WASH Annual Report 2010 9
aftermath. To follow up on this work UNICEF plans to support research to identify barriers and levers in
advancing HWTS to scale.
At the country level, UNICEF continued to sponsor a large number and range of WASH-related studies,
such as the following samples from 2010: research on hygiene practices in homes and schools in
Bangladesh, an assessment of shock chlorination for cholera control in Sierra Leone, a study on school
urinals in Kenya, a study on groundwater use in IDP camps in Uganda, a capacity review of the WASH
sector in Zambia, an assessment of WASH service delivery in urban areas in Madagascar, an evaluation
of the Decentralized Wastewater Treatment System (DEWATS) pilot in DPR Korea, a study on the
economic impacts of poor sanitation in Mongolia, a study on menstrual hygiene management in schools
in Pakistan, a rapid assessment on home use of chlorination tablets in Haiti, a benchmarking study of
water self supply in Ethiopia, and many others.
Such studies are used by UNICEF and its partners to build national evidence bases and backstop
advocacy efforts, and also to inform WASH programme design. In Bangladesh, for example, research on
handwashing practices in homes and in schools carried out by the London School of Hygiene and
Tropical Medicine led to a revamped hygiene promotion package to improve the effectiveness and impact
of UNICEF supported software interventions (and a new way of monitoring hygiene practices – see
Section 3.2).
Every year there are also a number of evaluations of programmes funded by donor partners, including, in
2010, assessments of large UNICEF WASH partnership programmes with the Netherlands and the
European Community in Ethiopia and Mozambique. These and other evaluations provide valuable lessons
to further improve programming.
Capacity Building
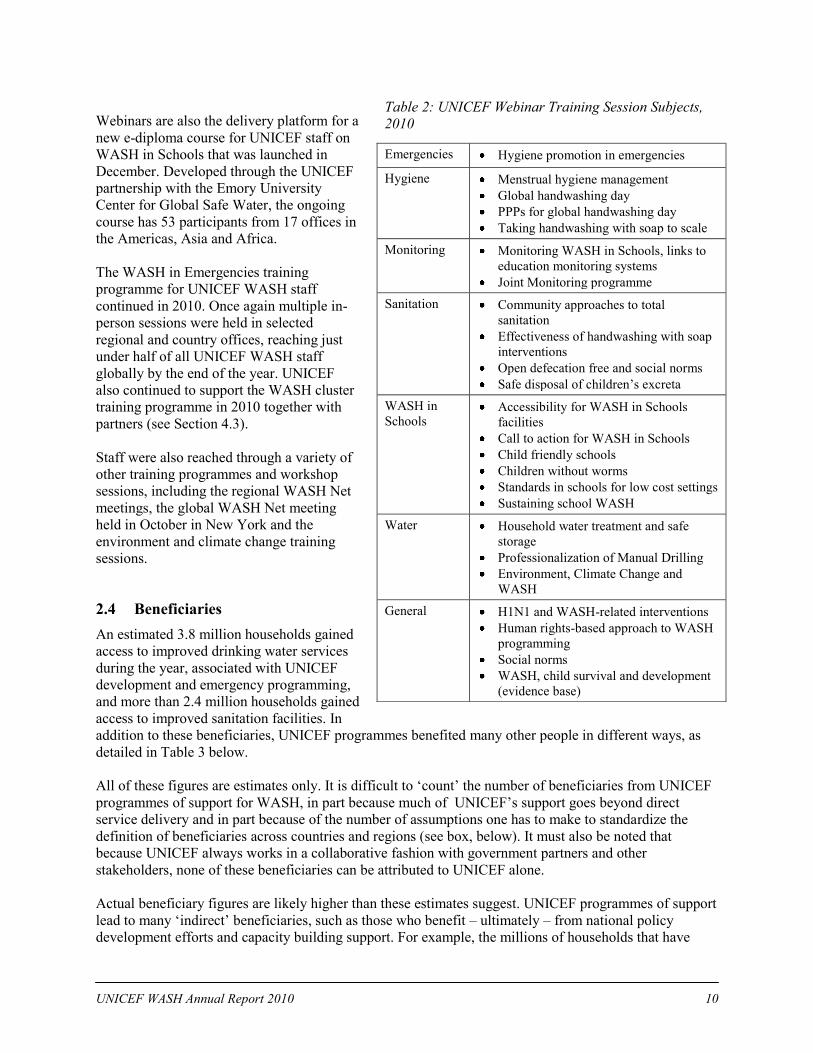
Internet based tools such as webinars have proven to be an extremely effective way of reaching
UNICEF‟s far-flung WASH cadre of 450 professionals. Responding to demand from staff and the
requirements of the expanding programme, UNICEF tripled the number of webinar training sessions from
21 in 2009 to 60 in 2010. The participatory sessions were developed and delivered using mainly in-house
expertise (UNICEF staff from headquarters, regional offices and in some cases country offices) along
with some guest lecturers. As detailed in Table 2, they covered a variety of programming subjects and
sub-sectoral areas.
Selected UNICEF-supported WASH technical and capacity building publications, 2010 (including UNICEF publications, co-publications with partners, and publications financed by UNICEF)
Assessing the Sustained Uptake of Selected Point-
of-Use Water Treatment Methods in Emergency
Settings
Code of Practice for Cost-Effective Boreholes
JMP 2010 Report: Progress on Sanitation and
Drinking Water
JMP regional snapshots (see Section 7)
Global Handwashing Day: Assessing the impact
of GHD activities
Global Handwashing Day: 100 school survey
Global Handwashing Day: Resource disk
Household Water Treatment and Safe Storage: Field
Note
Raising Clean Hands: Call to Action for WASH in
Schools
Raising Clean Hands: Communication strategy
Smart Hygiene Solutions
Soap Stories and Toilet Tales (GHD Edition)
Tales of shit: Community-Led total Sanitation in
Africa
Toolkit for Professionalization of Manual Drilling in
Africa
UNICEF WASH Annual Report 2010 10
Webinars are also the delivery platform for a
new e-diploma course for UNICEF staff on
WASH in Schools that was launched in
December. Developed through the UNICEF
partnership with the Emory University
Center for Global Safe Water, the ongoing
course has 53 participants from 17 offices in
the Americas, Asia and Africa.
The WASH in Emergencies training
programme for UNICEF WASH staff
continued in 2010. Once again multiple in-
person sessions were held in selected
regional and country offices, reaching just
under half of all UNICEF WASH staff
globally by the end of the year. UNICEF
also continued to support the WASH cluster
training programme in 2010 together with
partners (see Section 4.3).
Staff were also reached through a variety of
other training programmes and workshop
sessions, including the regional WASH Net
meetings, the global WASH Net meeting
held in October in New York and the
environment and climate change training
sessions.
2.4 Beneficiaries
An estimated 3.8 million households gained
access to improved drinking water services
during the year, associated with UNICEF
development and emergency programming,
and more than 2.4 million households gained
access to improved sanitation facilities. In
addition to these beneficiaries, UNICEF programmes benefited many other people in different ways, as
detailed in Table 3 below.
All of these figures are estimates only. It is difficult to „count‟ the number of beneficiaries from UNICEF
programmes of support for WASH, in part because much of UNICEF‟s support goes beyond direct
service delivery and in part because of the number of assumptions one has to make to standardize the
definition of beneficiaries across countries and regions (see box, below). It must also be noted that
because UNICEF always works in a collaborative fashion with government partners and other
stakeholders, none of these beneficiaries can be attributed to UNICEF alone.
Actual beneficiary figures are likely higher than these estimates suggest. UNICEF programmes of support
lead to many „indirect‟ beneficiaries, such as those who benefit – ultimately – from national policy
development efforts and capacity building support. For example, the millions of households that have
Table 2: UNICEF Webinar Training Session Subjects,
2010
Emergencies Hygiene promotion in emergencies
Hygiene Menstrual hygiene management
Global handwashing day
PPPs for global handwashing day
Taking handwashing with soap to scale
Monitoring Monitoring WASH in Schools, links to
education monitoring systems
Joint Monitoring programme
Sanitation Community approaches to total
sanitation
Effectiveness of handwashing with soap
interventions
Open defecation free and social norms
Safe disposal of children‟s excreta
WASH in
Schools Accessibility for WASH in Schools
facilities
Call to action for WASH in Schools
Child friendly schools
Children without worms
Standards in schools for low cost settings
Sustaining school WASH
Water Household water treatment and safe
storage
Professionalization of Manual Drilling
Environment, Climate Change and
WASH
General H1N1 and WASH-related interventions
Human rights-based approach to WASH
programming
Social norms
WASH, child survival and development
(evidence base)
UNICEF WASH Annual Report 2010 11
gained access to sanitation through the Government of India‟s Total Sanitation campaign are not reflected
in these figures, even though UNICEF is very active in national and state processes that support the
campaign. . It is also not possible to fully account for the rapidly increasing number of households that are
building their own toilets through CATS programmes, since they are not subsidised by UNICEF or its
partners.
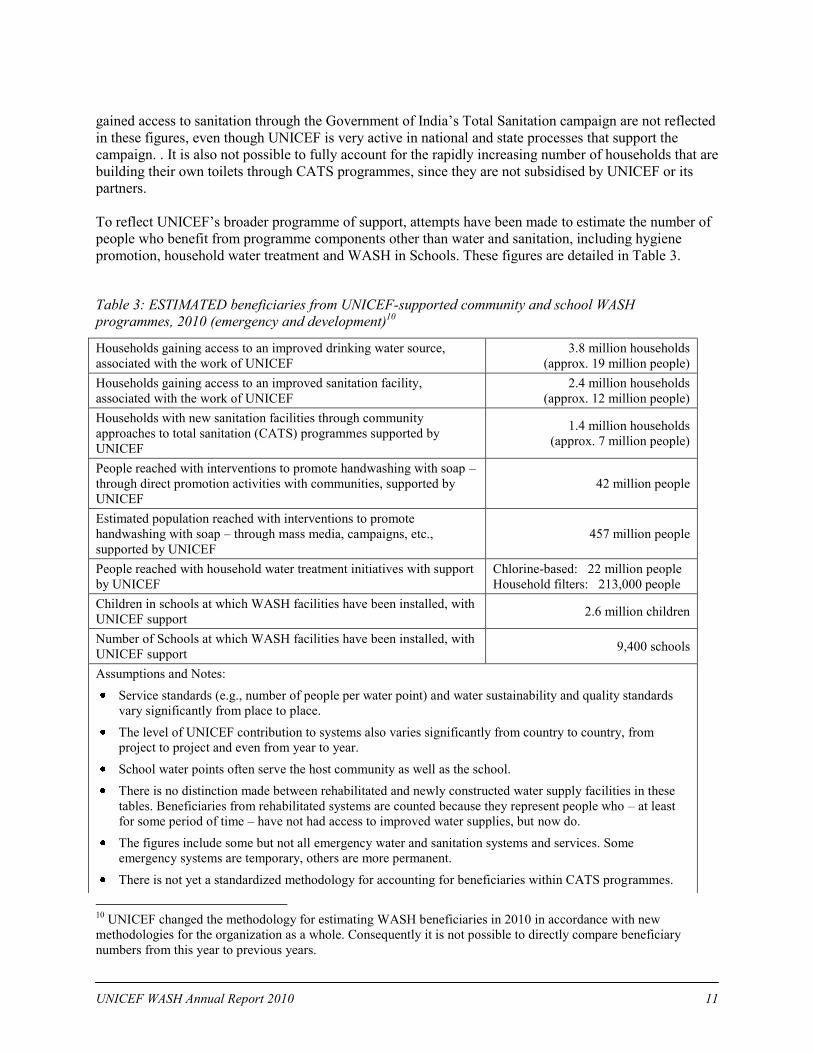
To reflect UNICEF‟s broader programme of support, attempts have been made to estimate the number of
people who benefit from programme components other than water and sanitation, including hygiene
promotion, household water treatment and WASH in Schools. These figures are detailed in Table 3.
10
UNICEF changed the methodology for estimating WASH beneficiaries in 2010 in accordance with new
methodologies for the organization as a whole. Consequently it is not possible to directly compare beneficiary
numbers from this year to previous years.
Table 3: ESTIMATED beneficiaries from UNICEF-supported community and school WASH
programmes, 2010 (emergency and development)10
Households gaining access to an improved drinking water source,
associated with the work of UNICEF
3.8 million households
(approx. 19 million people)
Households gaining access to an improved sanitation facility,
associated with the work of UNICEF
2.4 million households
(approx. 12 million people)
Households with new sanitation facilities through community
approaches to total sanitation (CATS) programmes supported by
UNICEF
1.4 million households
(approx. 7 million people)
People reached with interventions to promote handwashing with soap –
through direct promotion activities with communities, supported by
UNICEF
42 million people
Estimated population reached with interventions to promote
handwashing with soap – through mass media, campaigns, etc.,
supported by UNICEF
457 million people
People reached with household water treatment initiatives with support
by UNICEF
Chlorine-based: 22 million people
Household filters: 213,000 people
Children in schools at which WASH facilities have been installed, with
UNICEF support 2.6 million children
Number of Schools at which WASH facilities have been installed, with
UNICEF support 9,400 schools
Assumptions and Notes:
Service standards (e.g., number of people per water point) and water sustainability and quality standards
vary significantly from place to place.
The level of UNICEF contribution to systems also varies significantly from country to country, from
project to project and even from year to year.
School water points often serve the host community as well as the school.
There is no distinction made between rehabilitated and newly constructed water supply facilities in these
tables. Beneficiaries from rehabilitated systems are counted because they represent people who – at least
for some period of time – have not had access to improved water supplies, but now do.
The figures include some but not all emergency water and sanitation systems and services. Some
emergency systems are temporary, others are more permanent.
There is not yet a standardized methodology for accounting for beneficiaries within CATS programmes.
UNICEF WASH Annual Report 2010 12
3 Progress in 2010
3.1 Building Enabling Environments
UNICEF provided support to national-level processes linked to the Sanitation and Water for All
partnership in a number of countries in 2010, building on commitments made during the High Level
Meeting in April. Progress is still limited given that SWA mechanisms are still being established, but
significant steps were taken in a number of countries, including in Sierra Leone, Nepal and Bangladesh.
The most progress was in Ghana where government and its support agencies committed to the „SWA
Compact‟ that sets out a single actionable national plan for meeting MDG targets , defines stakeholder
responsibilities and guarantees a minimum annual outlay of $350 million for WASH.
UNICEF also continued to engage with government partners and other stakeholders in many countries on
furthering the enabling environment for WASH through the development of policies, strategies and
planning instruments for the sector. As a result of this engagement, new or revised national WASH
policies were completed and issued in Burundi, Colombia, Eritrea, Rwanda, Sudan and Timor-Leste and
elsewhere in 2010. In other countries UNICEF continued to support efforts to improve the
implementation of policies. One area of focus is decentralisation: in countries where sector reform efforts
have led to the devolution of funding, UNICEF uses its field presence to build the implementation
capacity of its partners at sub-national level. In Pakistan, for example, UNICEF is helping to re-align
provincial policy instruments to the national policy, in DR Congo UNICEF is working with sectoral
partners in its focus regions to prepare for the Decentralisation Act, and in Sierra Leone UNICEF is
helping to set up and equip new WASH offices at the district level.
In Uganda, a new national gender strategy for the WASH sector was launched in 2010 that stresses
gender mainstreaming within the sector at all levels. The strategy contains specific targets for increasing
the number of women in managerial positions in both rural WASH committees and in urban WASH
boards; it stipulates an increase in gender disaggregated data in government monitoring systems; it
establishes a sexual harassment mechanism within the water ministry and it includes studies to assess
progress in implementing the strategy at two-year intervals. In 2010, AMCOW released a strategy for
mainstreaming gender in the WASH sector in Africa aimed at raising awareness and increasing
effectiveness of action.
DRR planning and environmental impact assessments are becoming increasingly recognised as an
important component of effective and sustainable programming and emergency intervention. In 2010, 11
UNICEF country programmes undertook some form of DRR planning and two countries, Pakistan and
Swaziland, undertook an EIA considering WASH related action.
Alternative financing and resource flow mechanisms are helping to leverage new resources for WASH in
several countries. This includes the SWA-linked initiatives as well as other initiatives including Kenya‟s
Water Services Trust Fund (a joint funding basket for new and rehabilitated water schemes), Ethiopia‟s
WASH Community Development Fund (a partnership between UNICEF and the Government of Finland)
and a new multi-agency partnership in Lao PDR that focuses new resources on remote rural areas.
UNICEF is a member of WASH SWAps in Mozambique, Nicaragua and Uganda.
UNICEF country offices worked with government partners to reflect WASH priorities in new PRSPs in a
number of countries in 2010, including in Mauritania, Guinea Bissau and Mozambique. The community-
led total sanitation (CLTS) approach is now included as a strategic priority in Sierra Leone‟s second
PRSP.
UNICEF WASH Annual Report 2010 13
Sanitation and hygiene are the focus of UNICEF upstream engagement with partners in a number of
countries. In Nepal, for example, UNICEF was a key contributor to the new National Hygiene and
Sanitation Master Plan that provides clear guidance on harmonised approaches to hygiene and sanitation
promotion. In Bangladesh, UNICEF was the lead agency for the sanitation and hygiene components of
the new Water and Sanitation Sector Development Plan.
More examples of UNICEF‟s contributions to building enabling environments for WASH are contained
in the report sections below.
3.2 Hygiene and Sanitation Promotion
Hygiene Promotion
Global Handwashing Day (GHD)11
was again an important channel for the promotion of handwashing
with soap in 2010, with promotional activities reaching at least 200 million people and 700,000 schools in
countries around the world. Now in its third year, the campaign is maturing in a number of ways: in many
countries it is broadening its geographic scope, it is involving a wider range of partners and stakeholders,
and it is extending time frames to a week or even a month, such as in the China „More than just a Day‟
campaign.
In some countries the campaign expanded to reach new
audiences such as through events in health care facilities,
mosques, churches, refugee camps and through an
increasing use of SMS messaging and social media. In
Papua New Guinea UNICEF worked with prison
authorities to include juvenile inmates in GHD activities.
GHD has helped to re-invigorate existing national
handwashing with soap promotional programmes in some
countries and has led to the launch of new programmes in
others – which is a reason that the number of new national
programmes expanded rapidly from 2008 to 2009 and has
tapered off in 2010, as shown in
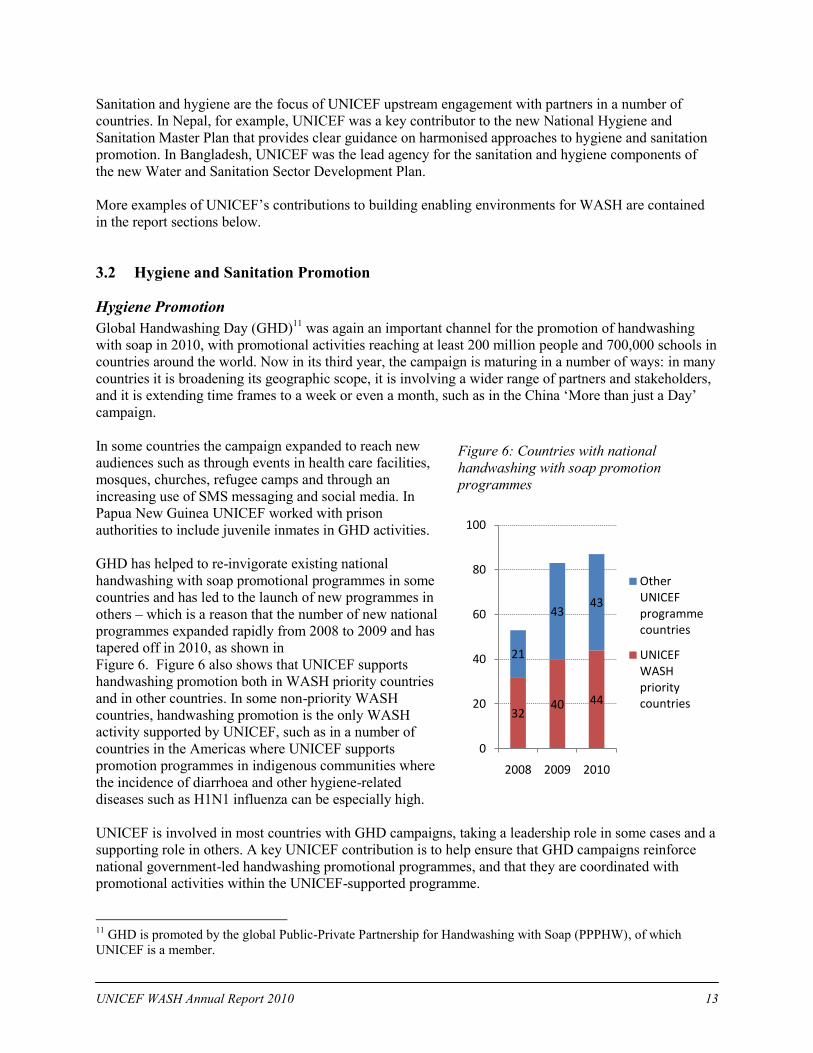
Figure 6. Figure 6 also shows that UNICEF supports
handwashing promotion both in WASH priority countries
and in other countries. In some non-priority WASH
countries, handwashing promotion is the only WASH
activity supported by UNICEF, such as in a number of
countries in the Americas where UNICEF supports
promotion programmes in indigenous communities where
the incidence of diarrhoea and other hygiene-related
diseases such as H1N1 influenza can be especially high.
UNICEF is involved in most countries with GHD campaigns, taking a leadership role in some cases and a
supporting role in others. A key UNICEF contribution is to help ensure that GHD campaigns reinforce
national government-led handwashing promotional programmes, and that they are coordinated with
promotional activities within the UNICEF-supported programme.
11
GHD is promoted by the global Public-Private Partnership for Handwashing with Soap (PPPHW), of which
UNICEF is a member.
Figure 6: Countries with national
handwashing with soap promotion
programmes
3240 44
21
4343
0
20
40
60
80
100
2008 2009 2010
Other UNICEF programme countries
UNICEF WASH priority countries
UNICEF WASH Annual Report 2010 14
Beyond GHD, UNICEF support to national handwashing promotion programmes takes many forms,
ranging from a full package of technical and financial support for government-led campaigns to more
discrete interventions centred in areas of geographic concentration. UNICEF country offices estimate that
national handwashing promotion programmes supported by UNICEF reached an audience of over 450
million people in 2010.12
National hygiene behaviour change programmes increasingly rely on
partnerships with the private sector through PPP mechanisms to increase programme reach. In 2010
UNICEF produced a set of guidelines for staff involved in the design and implementation of such
handwashing partnerships.
The promotion of handwashing with soap is an integral component of UNICEF-supported WASH
activities in the field. An estimated 42 million people were directly reached in 2010 by community
hygiene promoters, school-based education, peer-to-peer messaging and various other mechanisms within
UNICEF-supported programmes. These efforts focus on behaviour change, but also address the need for
handwashing facilities, water supplies and soap. In Kenya, Rwanda and other African countries, for
example, UNICEF encourages and supports the local manufacture of low-cost household handwashing
stations. In Zambia such an initiative reached 40,000 people in 2010.
Handwashing is increasingly promoted through UNICEF -supported sanitation programmes based on the
Community Approaches to Total Sanitation (CATS) model.13
The foremost priority of CATS is the
elimination of open defecation, but as programmes mature and communities become open defecation free
(ODF), the same community engagement mechanisms can be used to help change behaviour related to
hygiene practices. Given the fact that CATS programmes are rapidly accelerating (see below), this
handwashing promotion mechanism will quickly reach larger numbers of people.
In Bangladesh, formative research by the LSHTM led to a re-design of UNICEF‟s large hygiene
promotion programme. To improve impact, promotion efforts now focus on two principal audiences
(mothers of children under five years old and primary school students) while limiting the number of
critical messages delivered. The Bangladesh programme is also extending its reach into urban areas
through a network of 11,000 trained adolescent girl hygiene monitors.
UNICEF integrates the promotion of handwashing with soap into other sectoral programmes and
campaigns, including education programmes, health outreach programmes and large-scale immunization
and malaria campaigns. This type of programme convergence allows UNICEF to reach far more people
with handwashing promotion than would be possible through WASH programmes alone. Country reports
show that millions of people were reached through polio campaigns in DR Congo, India, Nepal, for
example, and millions more through child-and-mother health days, measles vaccination drives and anti-
malaria bednet distribution campaigns in other countries.
Sanitation
The focus of UNICEF sanitation programming continued to be the promotion of CATS as the most
effective way of eliminating open defecation and accelerating the use of improved sanitation facilities. As
a result, the number of countries that are applying the CATS methodology continues to grow, especially
in Africa (Figure 7). CATS is now the dominant model for UNICEF sanitation programming support:
well over half of all sanitation beneficiaries from programmes associated with the work of UNICEF are
12
Based on estimates of the reach of various communication channels employed – the figures are not verified
through audience surveys or other measures in most cases. 13
Community Approaches to Total Sanitation (CATS) is an umbrella term used by UNICEF that encompasses a
variety of community- and demand-led approaches, including Community Led Total Sanitation (CLTS), Total
Sanitation, School-Led Total Sanitation (SLTS) and related approaches.
UNICEF WASH Annual Report 2010 15
from CATS initiatives, and most of the other sanitation beneficiaries are from humanitarian interventions
or in countries where open defecation is not a major problem (and thus CATS is not promoted).14
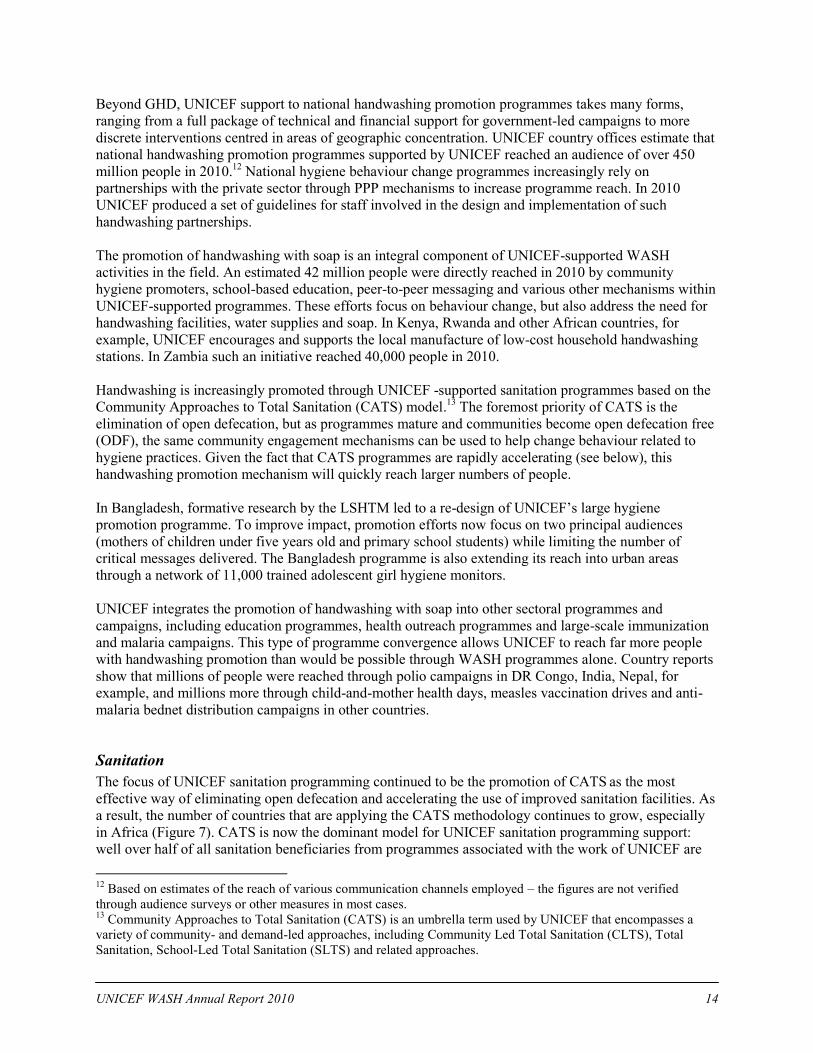
The CATS model is contributing to important
gains in sanitation coverage levels, which is
especially good news given that the developing
world is still not on track to meet the MDG
sanitation target. In India, for example, JMP
figures show that an estimated 22 million people
are abandoning open defecation annually due in
part to the UNICEF-supported government-led
Total Sanitation campaign. Numbers in African
countries are much smaller, but progress is
accelerating. In Sierra Leone more than a
thousand communities have been declared ODF,
and the approach has been rolled out in eight of the
country‟s 14 districts. In Ethiopia, over 270,000
households built new latrines and in Mozambique
277 communities were certified as ODF in 2010.
Multi-country estimates from both Eastern and
Southern Africa region (ESAR) and the West and
Central Africa region (WCAR) indicate that the
rate of annual progress from CATS projects has
increased by at least an order of magnitude over the last two years: from hundreds of thousands to
millions of beneficiaries.
However, as progress accelerates, more attention is being placed on refining CATS approaches to better
fit within national socio-economic contexts and to ensure that strategies and programme designs are of
high quality. To this end, UNICEF continued to assess and learn from existing programmes, to engage
with partners on dialogue around strategies and approaches, and to emphasize capacity building for staff
and national partners.
UNICEF‟s first ever regional evaluation
of the CLTS approach was carried out in
WCAR in 2010.15
This evaluation was a
priority due to the growth of CATS in
the region. The evaluation showed that
the approach has been a success, while
pointing the way towards important
region-specific programme adjustments
(see box). UNICEF also supported
national CATS evaluations in Cambodia,
Zambia (ongoing) and elsewhere in
2010. In India, UNICEF continued to
provide extensive support for improving
validation processes for the Nirmal
14
Country office estimates indicate that a total of more than 2.4 million households gained access to an improved
sanitation facility in 2010 through programmes associated with the work of UNICEF, of which approximately 1.4
million were through CATS related initiatives. See Section 2.4 for details on beneficiary estimates. 15
Roll-Out Evaluation of Community Led Total Sanitation in West and Central Africa, January 2011
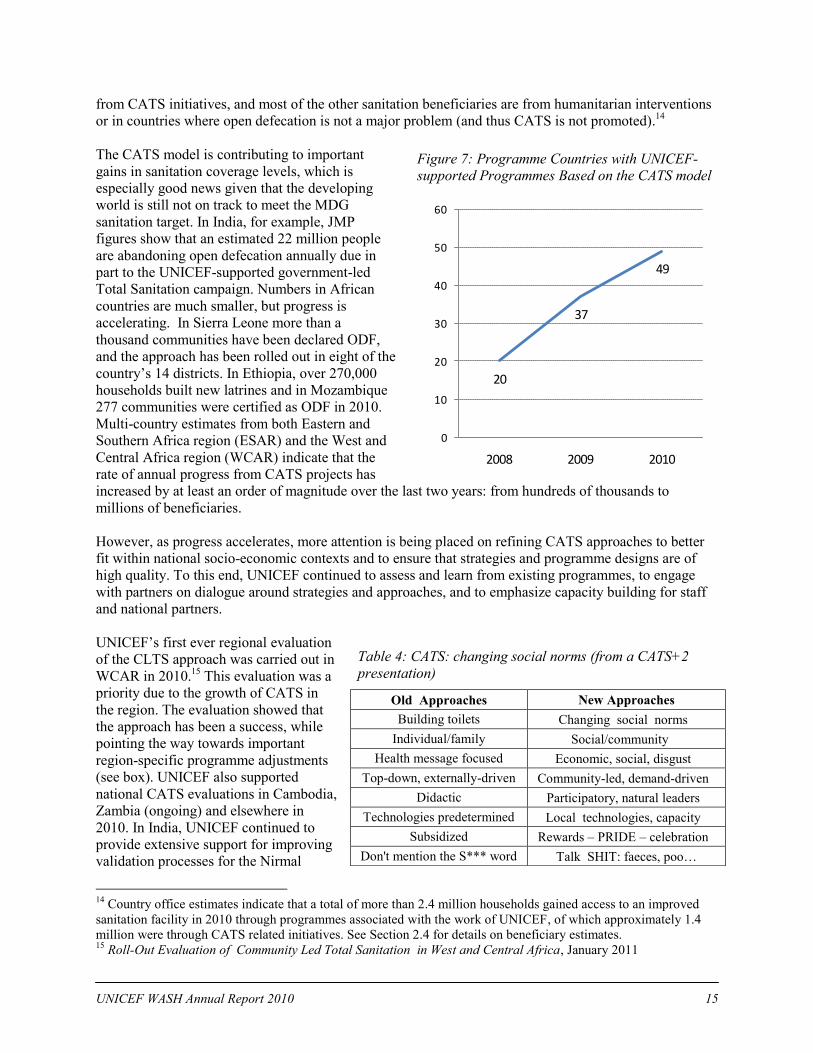
Table 4: CATS: changing social norms (from a CATS+2
presentation)
OldApproaches New Approaches
Building toilets Changingsocialnorms
Individual/family Social/community
Health message focused Economic, social, disgust
Top-down, externally-driven Community-led, demand-driven
Didactic Participatory, natural leaders
Technologies predetermined Localtechnologies, capacity
Subsidized Rewards – PRIDE – celebration
Don't mention the S*** word TalkSHIT: faeces, poo…
Figure 7: Programme Countries with UNICEF-
supported Programmes Based on the CATS model
20
37
49
0
10
20
30
40
50
60
2008 2009 2010
UNICEF WASH Annual Report 2010 16
Gram Pureskar (Clean Village Awards) system and improve monitoring mechanisms for the national
Total Sanitation Campaign.
The UNICEF-supported CLTS evaluation conducted
in Ghana in 2009 was the key driver behind the
adoption of CLTS by government as the national
strategy for the country in 2010. Governments in
several other West African countries formally
embraced the CATS model as policy in 2010. This
was also the case in Afghanistan as well as in Malawi
where new resource allocations were made and
national ODF targets were set. The Mozambique
CATS programme (supported by UNICEF and other
partners) won the 2010 African Ministers‟ Council for
Water sanitation award.
The CATS+2 consultation held in New York in
November 2010 was an opportunity for UNICEF staff
and partners to review and reflect on the experience
with CATS to date. The consultation resulted in a
general validation of the CATS principals and helped
to define the UNICEF role in promoting the sustained
use of improved sanitation, in helping households to move up the „sanitation ladder‟ and in ensuring
equity for poor households.
Equity is the central theme in ongoing UNICEF discussions, policy work and formative research on the
links between the CATS model and sanitation marketing approaches. Through this process UNICEF
hopes to develop a sanitation marketing model to help ensure that demand is created across all socio-
economic groups in a community, that sanitation options are available for the poor, and that the marketing
of sanitation products is consistent with the triggering mechanism at the heart of CATS methodologies.
Key Findings from the WCAR Regional
CLTS Evaluation
Approximately one million people are now
living in open-defecation free (ODF)
communities as a result of the programme.
Most governments have accepted the model
and some have prioritized it within national
policies and budgets.
CLTS strategies and tools were effective
within the African rural context, although
differing triggering-to-ODF success rates
indicate a need for more intensive follow-up.
A regional cadre of skilled trainers and
practioners is key to the future success of
CLTS.
UNICEF WASH Annual Report 2010 17
3.3 Water Supply and Water Quality
Water continues to be a central part of UNICEF‟s work in WASH in all regions, with a wide range of
programming support seen from country to country. In some countries UNICEF provides extensive
support for large-scale government-run water supply programmes, including in Mozambique, Nigeria,
Sudan and other countries. Elsewhere, UNICEF helps families and institutions regain access to water
supplies in humanitarian crises, such as in Haiti, Pakistan and Sri Lanka in 2010 (see Section 4 for more
information on UNICEF humanitarian WASH programmes). Altogether, these kinds of support
programmes helped over 3.8 million households gain (or regain) access to improved water supplies in
2010.
In many countries where UNICEF no longer supports water service delivery it remains invested in water-
related programming. This is mainly at the upstream level where UNICEF uses its global experience and
competencies to work with government partners and civil society within broad water sector reform
initiatives and to improve enabling environments. Equity is an underlying theme of such engagement –
UNICEF highlights disparities in access to water in dialogue with government partners and supports
initiatives that address these disparities. Other areas of special interest for UNICEF include water quality
(and household water treatment), cost effectiveness, governance and the operational and environmental
sustainability of water systems.
Water Quality
Water quality continues to be a key focus area for UNICEF, with a range of activities including support
for the development and dissemination of national water quality standards, water quality testing and
monitoring initiatives, the piloting of innovative approaches for mitigating water quality problems, and
support for Household Water Treatment and Safe Storage (HWTS) initiatives (as detailed below).
In several countries UNICEF supported work related to drinking water quality standards in 2010,
including in Bangladesh, Myanmar and in Pakistan where a plan of action for ensuring compliance was
developed. In these and many other countries UNICEF continued to provide support for water quality
monitoring including in India where a pilot district-level GIS water quality monitoring system has now
been formally adopted and taken to scale by the state government of Jharkhand. UNICEF also contributed
to efforts to integrate water quality monitoring into the JMP in 2010, as described in Section 7. UNICEF
continued to support water safety planning exercises in a number of countries including India, Kenya,
Pakistan and Viet Nam.
Arsenic mitigation efforts also continued in 2010, including in Cambodia, China, India, Myanmar and
Viet Nam. In Bangladesh UNICEF support included a pilot pay-for-use arsenic testing initiative
implemented by local government authorities and NGOs, which is helping to screen the many unregulated
private wells that had yet to be reached through the national testing programme, and is prompting a large
scale switch to safe sources.
Household Water Treatment and Safe Storage (HWTS)
UNICEF continued to promote the use of low-cost water treatment technologies and improve storage and
handling practices to improve the safety of drinking water in households. In an increasing number of
countries, UNICEF works with Population Services International (PSI) in promotion and demand creation
initiatives centred on the marketing of locally-manufactured chorine solution, including in Angola,
Burundi, Djibouti and Sudan. HWTS promotion is also linked to cholera prevention campaigns in some
countries, and promoted through UNICEF-supported health outreach campaigns. In addition to chlorine-
based water treatment options, UNICEF is also involved in the testing and promotion of other
technologies including ceramic filters, biosand filters and solar disinfection (SODIS). Country offices
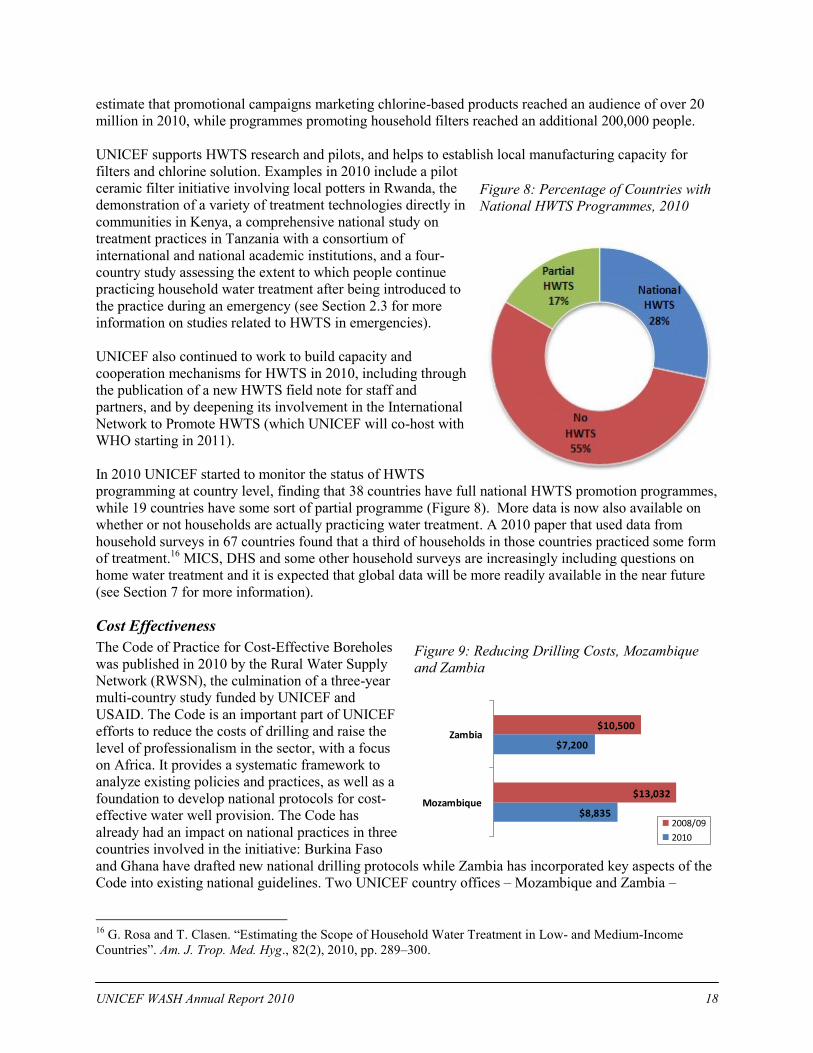
UNICEF WASH Annual Report 2010 18
estimate that promotional campaigns marketing chlorine-based products reached an audience of over 20
million in 2010, while programmes promoting household filters reached an additional 200,000 people.
UNICEF supports HWTS research and pilots, and helps to establish local manufacturing capacity for
filters and chlorine solution. Examples in 2010 include a pilot
ceramic filter initiative involving local potters in Rwanda, the
demonstration of a variety of treatment technologies directly in
communities in Kenya, a comprehensive national study on
treatment practices in Tanzania with a consortium of
international and national academic institutions, and a four-
country study assessing the extent to which people continue
practicing household water treatment after being introduced to
the practice during an emergency (see Section 2.3 for more
information on studies related to HWTS in emergencies).
UNICEF also continued to work to build capacity and
cooperation mechanisms for HWTS in 2010, including through
the publication of a new HWTS field note for staff and
partners, and by deepening its involvement in the International
Network to Promote HWTS (which UNICEF will co-host with
WHO starting in 2011).
In 2010 UNICEF started to monitor the status of HWTS
programming at country level, finding that 38 countries have full national HWTS promotion programmes,
while 19 countries have some sort of partial programme (Figure 8). More data is now also available on
whether or not households are actually practicing water treatment. A 2010 paper that used data from
household surveys in 67 countries found that a third of households in those countries practiced some form
of treatment.16
MICS, DHS and some other household surveys are increasingly including questions on
home water treatment and it is expected that global data will be more readily available in the near future
(see Section 7 for more information).
Cost Effectiveness
The Code of Practice for Cost-Effective Boreholes
was published in 2010 by the Rural Water Supply
Network (RWSN), the culmination of a three-year
multi-country study funded by UNICEF and
USAID. The Code is an important part of UNICEF
efforts to reduce the costs of drilling and raise the
level of professionalism in the sector, with a focus
on Africa. It provides a systematic framework to
analyze existing policies and practices, as well as a
foundation to develop national protocols for cost-
effective water well provision. The Code has
already had an impact on national practices in three
countries involved in the initiative: Burkina Faso
and Ghana have drafted new national drilling protocols while Zambia has incorporated key aspects of the
Code into existing national guidelines. Two UNICEF country offices – Mozambique and Zambia –
16
G. Rosa and T. Clasen. “Estimating the Scope of Household Water Treatment in Low- and Medium-Income
Countries”. Am. J. Trop. Med. Hyg., 82(2), 2010, pp. 289–300.
Figure 8: Percentage of Countries with
National HWTS Programmes, 2010
Figure 9: Reducing Drilling Costs, Mozambique
and Zambia
$8,835
$7,200
$13,032
$10,500
Mozambique
Zambia
2008/09
2010
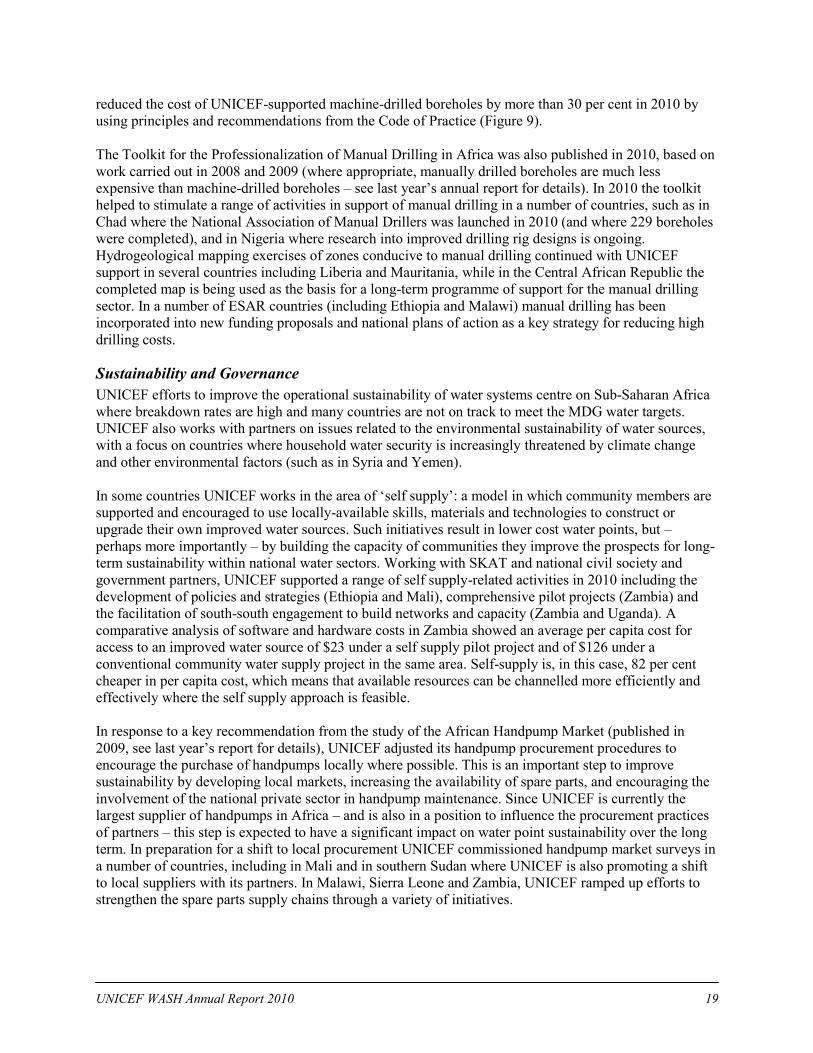
UNICEF WASH Annual Report 2010 19
reduced the cost of UNICEF-supported machine-drilled boreholes by more than 30 per cent in 2010 by
using principles and recommendations from the Code of Practice (Figure 9).
The Toolkit for the Professionalization of Manual Drilling in Africa was also published in 2010, based on
work carried out in 2008 and 2009 (where appropriate, manually drilled boreholes are much less
expensive than machine-drilled boreholes – see last year‟s annual report for details). In 2010 the toolkit
helped to stimulate a range of activities in support of manual drilling in a number of countries, such as in
Chad where the National Association of Manual Drillers was launched in 2010 (and where 229 boreholes
were completed), and in Nigeria where research into improved drilling rig designs is ongoing.
Hydrogeological mapping exercises of zones conducive to manual drilling continued with UNICEF
support in several countries including Liberia and Mauritania, while in the Central African Republic the
completed map is being used as the basis for a long-term programme of support for the manual drilling
sector. In a number of ESAR countries (including Ethiopia and Malawi) manual drilling has been
incorporated into new funding proposals and national plans of action as a key strategy for reducing high
drilling costs.
Sustainability and Governance
UNICEF efforts to improve the operational sustainability of water systems centre on Sub-Saharan Africa
where breakdown rates are high and many countries are not on track to meet the MDG water targets.
UNICEF also works with partners on issues related to the environmental sustainability of water sources,
with a focus on countries where household water security is increasingly threatened by climate change
and other environmental factors (such as in Syria and Yemen).
In some countries UNICEF works in the area of „self supply‟: a model in which community members are
supported and encouraged to use locally-available skills, materials and technologies to construct or
upgrade their own improved water sources. Such initiatives result in lower cost water points, but –
perhaps more importantly – by building the capacity of communities they improve the prospects for long-
term sustainability within national water sectors. Working with SKAT and national civil society and
government partners, UNICEF supported a range of self supply-related activities in 2010 including the
development of policies and strategies (Ethiopia and Mali), comprehensive pilot projects (Zambia) and
the facilitation of south-south engagement to build networks and capacity (Zambia and Uganda). A
comparative analysis of software and hardware costs in Zambia showed an average per capita cost for
access to an improved water source of $23 under a self supply pilot project and of $126 under a
conventional community water supply project in the same area. Self-supply is, in this case, 82 per cent
cheaper in per capita cost, which means that available resources can be channelled more efficiently and
effectively where the self supply approach is feasible.
In response to a key recommendation from the study of the African Handpump Market (published in
2009, see last year‟s report for details), UNICEF adjusted its handpump procurement procedures to
encourage the purchase of handpumps locally where possible. This is an important step to improve
sustainability by developing local markets, increasing the availability of spare parts, and encouraging the
involvement of the national private sector in handpump maintenance. Since UNICEF is currently the
largest supplier of handpumps in Africa – and is also in a position to influence the procurement practices
of partners – this step is expected to have a significant impact on water point sustainability over the long
term. In preparation for a shift to local procurement UNICEF commissioned handpump market surveys in
a number of countries, including in Mali and in southern Sudan where UNICEF is also promoting a shift
to local suppliers with its partners. In Malawi, Sierra Leone and Zambia, UNICEF ramped up efforts to
strengthen the spare parts supply chains through a variety of initiatives.
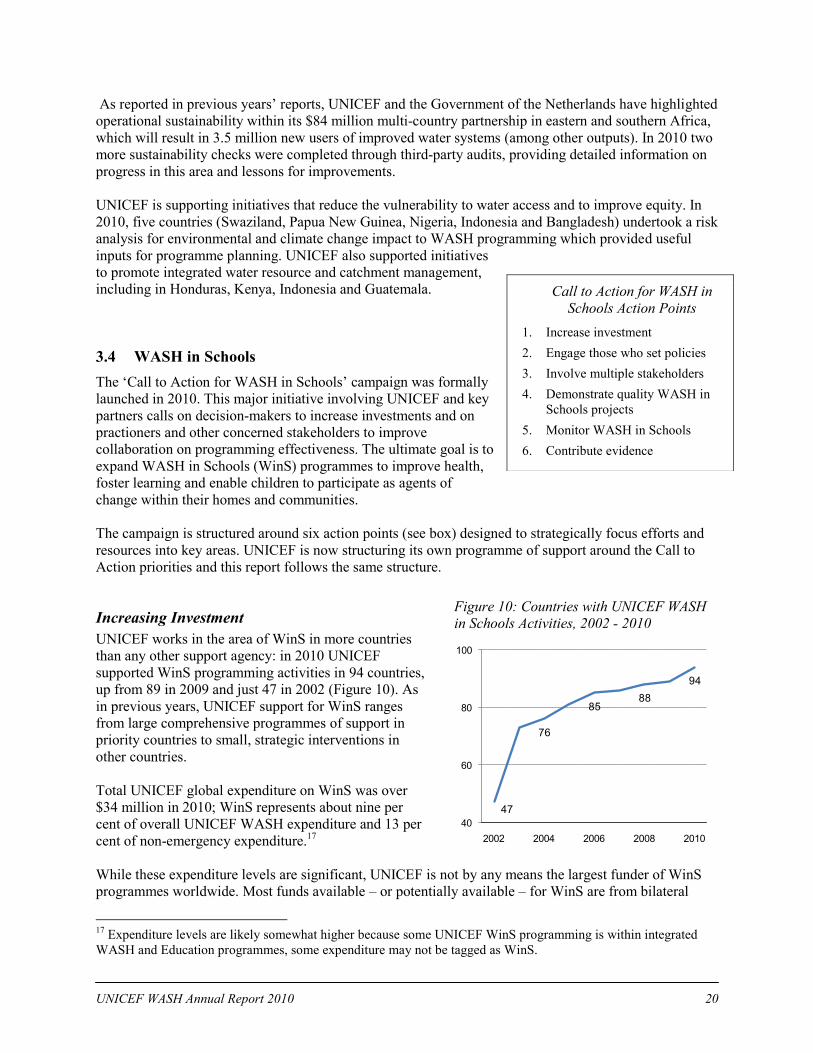
UNICEF WASH Annual Report 2010 20
As reported in previous years‟ reports, UNICEF and the Government of the Netherlands have highlighted
operational sustainability within its $84 million multi-country partnership in eastern and southern Africa,
which will result in 3.5 million new users of improved water systems (among other outputs). In 2010 two
more sustainability checks were completed through third-party audits, providing detailed information on
progress in this area and lessons for improvements.
UNICEF is supporting initiatives that reduce the vulnerability to water access and to improve equity. In
2010, five countries (Swaziland, Papua New Guinea, Nigeria, Indonesia and Bangladesh) undertook a risk
analysis for environmental and climate change impact to WASH programming which provided useful
inputs for programme planning. UNICEF also supported initiatives
to promote integrated water resource and catchment management,
including in Honduras, Kenya, Indonesia and Guatemala.
3.4 WASH in Schools
The „Call to Action for WASH in Schools‟ campaign was formally
launched in 2010. This major initiative involving UNICEF and key
partners calls on decision-makers to increase investments and on
practioners and other concerned stakeholders to improve
collaboration on programming effectiveness. The ultimate goal is to
expand WASH in Schools (WinS) programmes to improve health,
foster learning and enable children to participate as agents of
change within their homes and communities.
The campaign is structured around six action points (see box) designed to strategically focus efforts and
resources into key areas. UNICEF is now structuring its own programme of support around the Call to
Action priorities and this report follows the same structure.
Increasing Investment
UNICEF works in the area of WinS in more countries
than any other support agency: in 2010 UNICEF
supported WinS programming activities in 94 countries,
up from 89 in 2009 and just 47 in 2002 (Figure 10). As
in previous years, UNICEF support for WinS ranges
from large comprehensive programmes of support in
priority countries to small, strategic interventions in
other countries.
Total UNICEF global expenditure on WinS was over
$34 million in 2010; WinS represents about nine per
cent of overall UNICEF WASH expenditure and 13 per
cent of non-emergency expenditure.17
While these expenditure levels are significant, UNICEF is not by any means the largest funder of WinS
programmes worldwide. Most funds available – or potentially available – for WinS are from bilateral
17
Expenditure levels are likely somewhat higher because some UNICEF WinS programming is within integrated
WASH and Education programmes, some expenditure may not be tagged as WinS.
Call to Action for WASH in
Schools Action Points
1. Increase investment
2. Engage those who set policies
3. Involve multiple stakeholders
4. Demonstrate quality WASH in
Schools projects
5. Monitor WASH in Schools
6. Contribute evidence
Figure 10: Countries with UNICEF WASH
in Schools Activities, 2002 - 2010
47
76
8588
94
40
60
80
100
2002 2004 2006 2008 2010
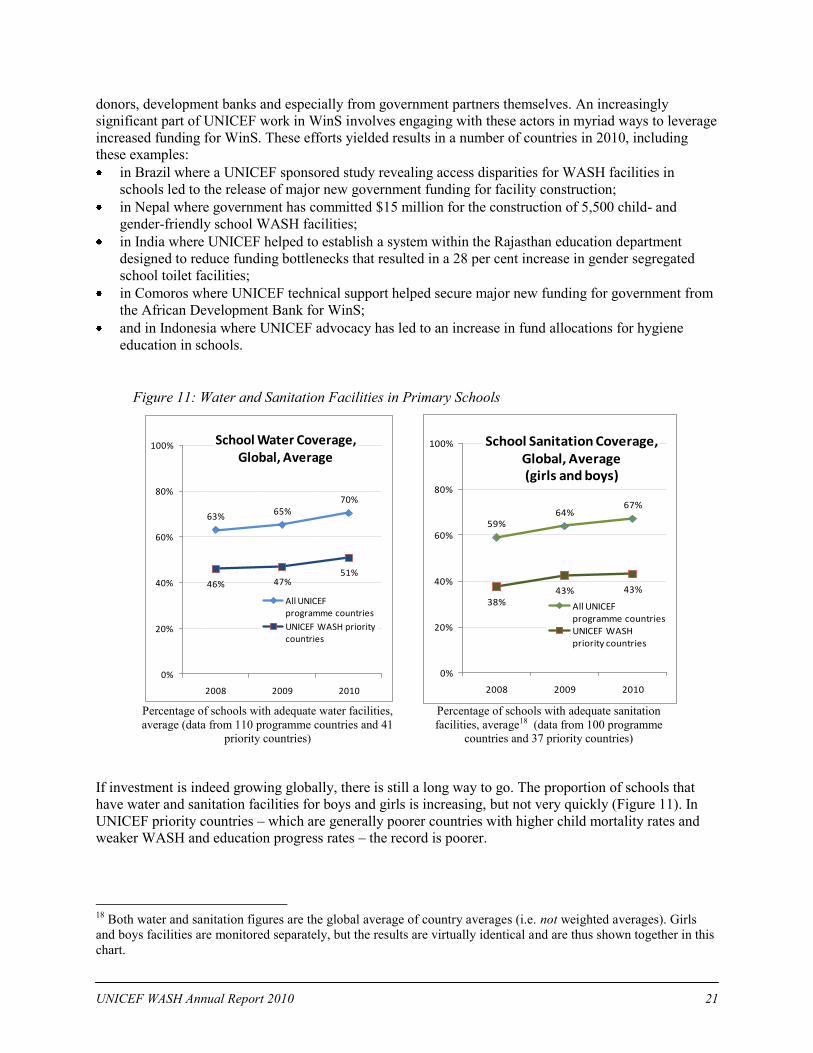
UNICEF WASH Annual Report 2010 21
donors, development banks and especially from government partners themselves. An increasingly
significant part of UNICEF work in WinS involves engaging with these actors in myriad ways to leverage
increased funding for WinS. These efforts yielded results in a number of countries in 2010, including
these examples:
in Brazil where a UNICEF sponsored study revealing access disparities for WASH facilities in
schools led to the release of major new government funding for facility construction;
in Nepal where government has committed $15 million for the construction of 5,500 child- and
gender-friendly school WASH facilities;
in India where UNICEF helped to establish a system within the Rajasthan education department
designed to reduce funding bottlenecks that resulted in a 28 per cent increase in gender segregated
school toilet facilities;
in Comoros where UNICEF technical support helped secure major new funding for government from
the African Development Bank for WinS;
and in Indonesia where UNICEF advocacy has led to an increase in fund allocations for hygiene
education in schools.
If investment is indeed growing globally, there is still a long way to go. The proportion of schools that
have water and sanitation facilities for boys and girls is increasing, but not very quickly (Figure 11). In
UNICEF priority countries – which are generally poorer countries with higher child mortality rates and
weaker WASH and education progress rates – the record is poorer.
18
Both water and sanitation figures are the global average of country averages (i.e. not weighted averages). Girls
and boys facilities are monitored separately, but the results are virtually identical and are thus shown together in this
chart.
Figure 11: Water and Sanitation Facilities in Primary Schools
Percentage of schools with adequate water facilities,
average (data from 110 programme countries and 41
priority countries)
Percentage of schools with adequate sanitation
facilities, average18 (data from 100 programme
countries and 37 priority countries)
63%65%
70%
46% 47%51%
0%
20%
40%
60%
80%
100%
2008 2009 2010
School Water Coverage,Global, Average
All UNICEF programme countries
UNICEF WASH priority countries
59%64%
67%
38%43% 43%
0%
20%
40%
60%
80%
100%
2008 2009 2010
School Sanitation Coverage, Global, Average(girls and boys)
All UNICEF programme countriesUNICEF WASH priority countries
UNICEF WASH Annual Report 2010 22
Policy Engagement
UNICEF upstream engagement with government partners in 2010 contributed to a number of results
strengthening enabling environments for WinS, including new national policies (e.g., in Ghana and
Tanzania), the mainstreaming and expansion of hygiene education within teacher training programmes
(Equatorial Guinea, Liberia, Papua New Guinea), and improved community-based school management
systems for WASH (Pakistan, Uganda).
Much of the UNICEF effort in this area centres on the development of improved national standards for
child-friendly facilities in schools and for hygiene education. These efforts are based on the 2009
WHO/UNICEF global WinS standards19
and carried out within the UNICEF‟s Child Friendly Schools
(CFS) framework, which includes a recommended set of
quality education standards for schools including standards
related to WinS. Monitoring by country offices show that the
proportion of programme countries that have mainstreamed
CFS (or similar) quality standards within the national
education system have gradually increased from 33 per cent of
countries in 2005 to 55 per cent in 2010. There were a number
of notable results from UNICEF technical support in this area
in large countries in 2010 including the adoption of new
national standards for WASH in schools in both Bangladesh
and Pakistan, the launch of new design manuals for child- and
girl-friendly WASH facilities in Ethiopia, Maldives and Sierra
Leone.
Involving stakeholders
UNICEF recognizes that it is only through collaborative
frameworks that sustainable progress can be made in WASH
in Schools, especially because of its multi-sectoral nature
involving health, education and WASH components. In all aspects of its WinS programme – from the
Call to Action campaign itself to project activities in communities – UNICEF endeavours to work with a
broad range of stakeholders from children and teachers to finance ministers and heads of agencies.
Call to Action partners are active at the country level, and in some countries new partnership frameworks
mirror the global alliance, such as in Mali where a major new WinS programme was launched involving
UNICEF, CARE, Save the Children, WaterAid and other partners with funding from Dubai Cares.
Similar alliances have been formed in other countries, such as in Tanzania where the School WASH
Group includes four line ministries and more than ten other partners. UNICEF works with a number
private sector companies for WinS, such as in Viet Nam where a new partnership with Procter and
Gamble was formed focusing on the provision of water and sanitation in schools in disadvantaged areas.
The most important relationship UNICEF has at country level continues to be with government, including
not only the health, education and WASH line ministries and their departments, but also with ministries
responsible for finance and communication, and a number of specialised agencies.
As described above, the UNICEF partnership with the Emory University Center for Global Safe Water
resulted in a new diploma course on WinS for UNICEF staff delivered entirely over the WebEx platform.
19
Water, Sanitation and Hygiene Standards for Schools in Low-cost Settings, WHO/UNICEF, 2009.
Call to Action for WASH in
Schools Partners
CARE
Dubai Cares
Emory University Center for Global
Safe Water
IRC International Water and
Sanitation Centre
Save the Children
UNICEF
the WASH Advocacy Initiative
WaterAid
Water For People
WHO
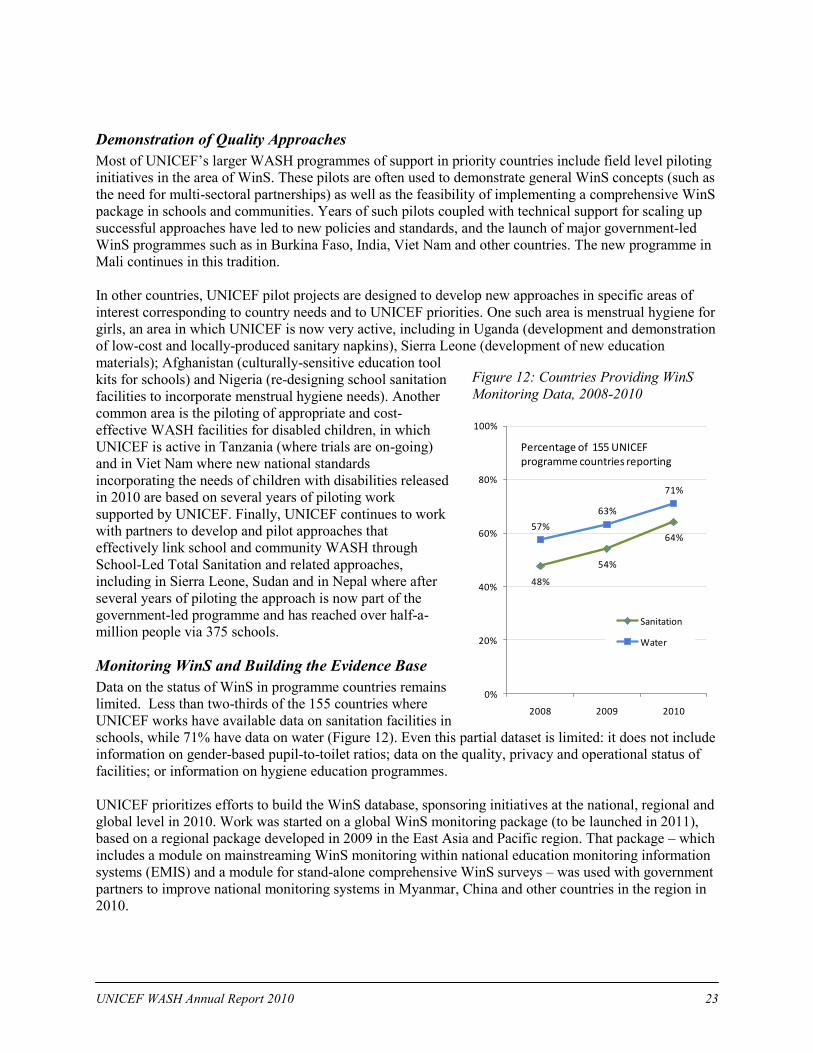
UNICEF WASH Annual Report 2010 23
Demonstration of Quality Approaches
Most of UNICEF‟s larger WASH programmes of support in priority countries include field level piloting
initiatives in the area of WinS. These pilots are often used to demonstrate general WinS concepts (such as
the need for multi-sectoral partnerships) as well as the feasibility of implementing a comprehensive WinS
package in schools and communities. Years of such pilots coupled with technical support for scaling up
successful approaches have led to new policies and standards, and the launch of major government-led
WinS programmes such as in Burkina Faso, India, Viet Nam and other countries. The new programme in
Mali continues in this tradition.
In other countries, UNICEF pilot projects are designed to develop new approaches in specific areas of
interest corresponding to country needs and to UNICEF priorities. One such area is menstrual hygiene for
girls, an area in which UNICEF is now very active, including in Uganda (development and demonstration
of low-cost and locally-produced sanitary napkins), Sierra Leone (development of new education
materials); Afghanistan (culturally-sensitive education tool
kits for schools) and Nigeria (re-designing school sanitation
facilities to incorporate menstrual hygiene needs). Another
common area is the piloting of appropriate and cost-
effective WASH facilities for disabled children, in which
UNICEF is active in Tanzania (where trials are on-going)
and in Viet Nam where new national standards
incorporating the needs of children with disabilities released
in 2010 are based on several years of piloting work
supported by UNICEF. Finally, UNICEF continues to work
with partners to develop and pilot approaches that
effectively link school and community WASH through
School-Led Total Sanitation and related approaches,
including in Sierra Leone, Sudan and in Nepal where after
several years of piloting the approach is now part of the
government-led programme and has reached over half-a-
million people via 375 schools.
Monitoring WinS and Building the Evidence Base
Data on the status of WinS in programme countries remains
limited. Less than two-thirds of the 155 countries where
UNICEF works have available data on sanitation facilities in
schools, while 71% have data on water (Figure 12). Even this partial dataset is limited: it does not include
information on gender-based pupil-to-toilet ratios; data on the quality, privacy and operational status of
facilities; or information on hygiene education programmes.
UNICEF prioritizes efforts to build the WinS database, sponsoring initiatives at the national, regional and
global level in 2010. Work was started on a global WinS monitoring package (to be launched in 2011),
based on a regional package developed in 2009 in the East Asia and Pacific region. That package – which
includes a module on mainstreaming WinS monitoring within national education monitoring information
systems (EMIS) and a module for stand-alone comprehensive WinS surveys – was used with government
partners to improve national monitoring systems in Myanmar, China and other countries in the region in
2010.
Figure 12: Countries Providing WinS
Monitoring Data, 2008-2010
48%
54%
64%57%
63%
71%
0%
20%
40%
60%
80%
100%
2008 2009 2010
Percentage of 155 UNICEF programme countries reporting
Sanitation
Water
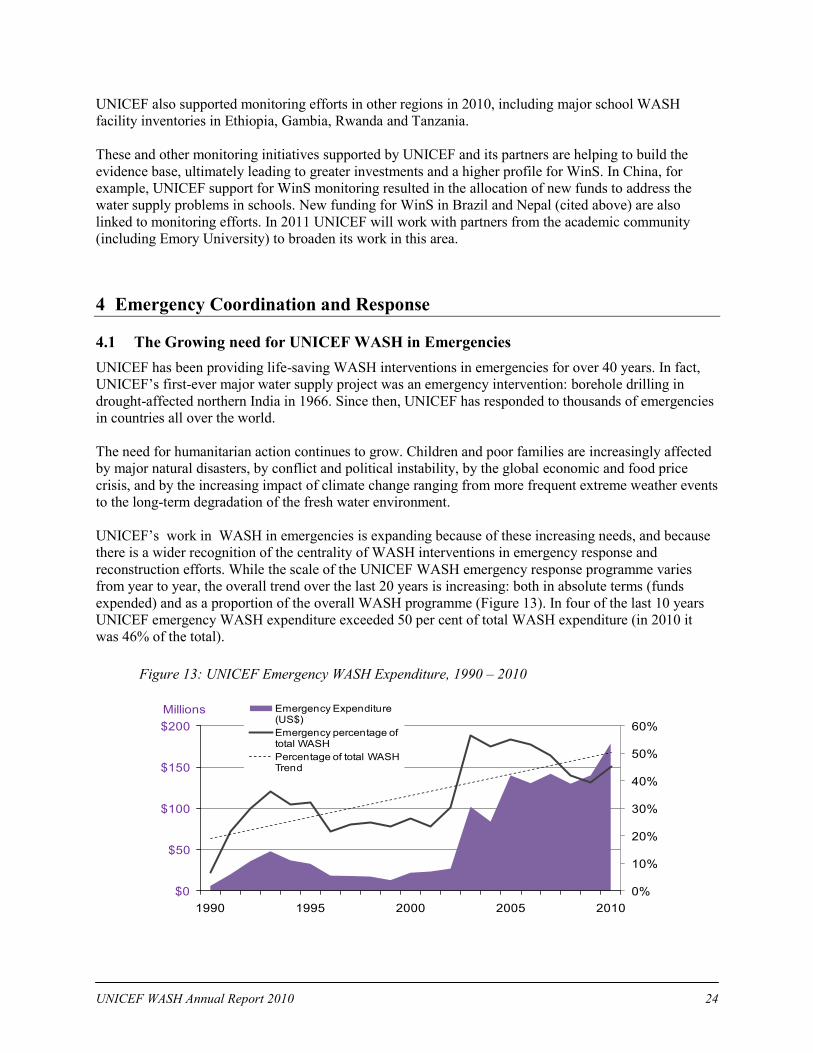
UNICEF WASH Annual Report 2010 24
UNICEF also supported monitoring efforts in other regions in 2010, including major school WASH
facility inventories in Ethiopia, Gambia, Rwanda and Tanzania.
These and other monitoring initiatives supported by UNICEF and its partners are helping to build the
evidence base, ultimately leading to greater investments and a higher profile for WinS. In China, for
example, UNICEF support for WinS monitoring resulted in the allocation of new funds to address the
water supply problems in schools. New funding for WinS in Brazil and Nepal (cited above) are also
linked to monitoring efforts. In 2011 UNICEF will work with partners from the academic community
(including Emory University) to broaden its work in this area.
4 Emergency Coordination and Response
4.1 The Growing need for UNICEF WASH in Emergencies
UNICEF has been providing life-saving WASH interventions in emergencies for over 40 years. In fact,
UNICEF‟s first-ever major water supply project was an emergency intervention: borehole drilling in
drought-affected northern India in 1966. Since then, UNICEF has responded to thousands of emergencies
in countries all over the world.
The need for humanitarian action continues to grow. Children and poor families are increasingly affected
by major natural disasters, by conflict and political instability, by the global economic and food price
crisis, and by the increasing impact of climate change ranging from more frequent extreme weather events
to the long-term degradation of the fresh water environment.
UNICEF‟s work in WASH in emergencies is expanding because of these increasing needs, and because
there is a wider recognition of the centrality of WASH interventions in emergency response and
reconstruction efforts. While the scale of the UNICEF WASH emergency response programme varies
from year to year, the overall trend over the last 20 years is increasing: both in absolute terms (funds
expended) and as a proportion of the overall WASH programme (Figure 13). In four of the last 10 years
UNICEF emergency WASH expenditure exceeded 50 per cent of total WASH expenditure (in 2010 it
was 46% of the total).
Figure 13: UNICEF Emergency WASH Expenditure, 1990 – 2010
0%
10%
20%
30%
40%
50%
60%
$0
$50
$100
$150
$200
1990 1995 2000 2005 2010
Millions Emergency Expenditure (US$)
Emergency percentage of total WASH
Percentage of total WASH Trend
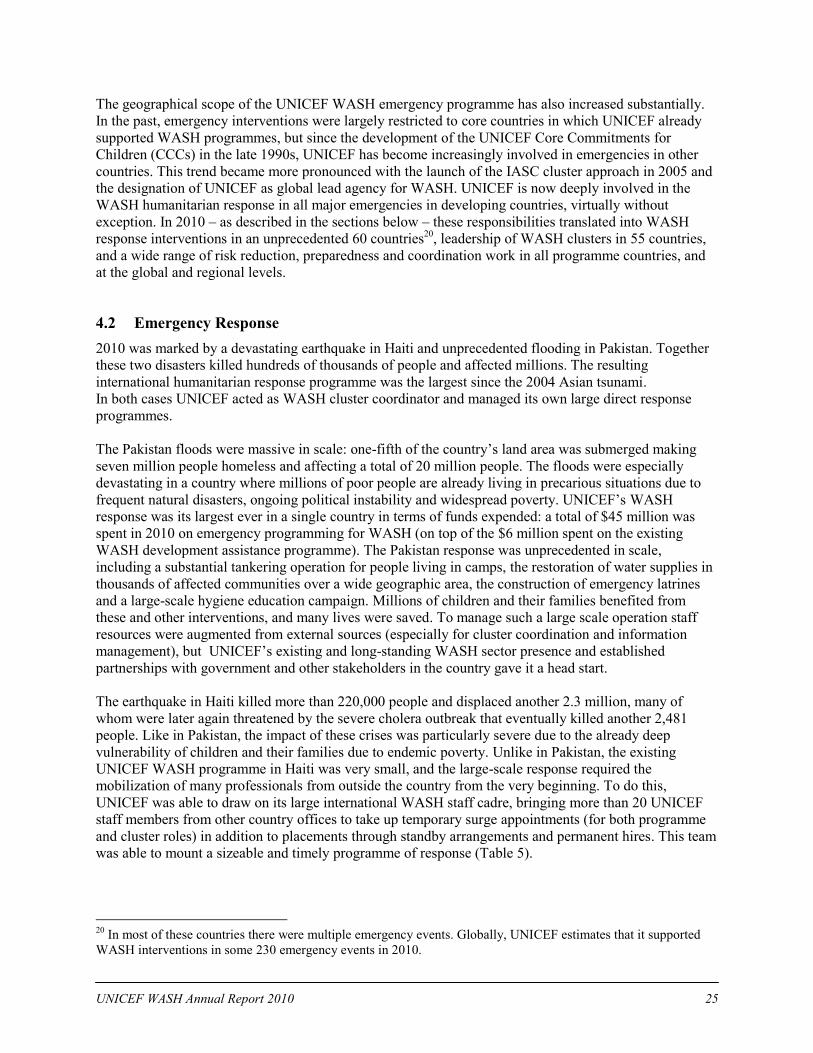
UNICEF WASH Annual Report 2010 25
The geographical scope of the UNICEF WASH emergency programme has also increased substantially.
In the past, emergency interventions were largely restricted to core countries in which UNICEF already
supported WASH programmes, but since the development of the UNICEF Core Commitments for
Children (CCCs) in the late 1990s, UNICEF has become increasingly involved in emergencies in other
countries. This trend became more pronounced with the launch of the IASC cluster approach in 2005 and
the designation of UNICEF as global lead agency for WASH. UNICEF is now deeply involved in the
WASH humanitarian response in all major emergencies in developing countries, virtually without
exception. In 2010 – as described in the sections below – these responsibilities translated into WASH
response interventions in an unprecedented 60 countries20
, leadership of WASH clusters in 55 countries,
and a wide range of risk reduction, preparedness and coordination work in all programme countries, and
at the global and regional levels.
4.2 Emergency Response
2010 was marked by a devastating earthquake in Haiti and unprecedented flooding in Pakistan. Together
these two disasters killed hundreds of thousands of people and affected millions. The resulting
international humanitarian response programme was the largest since the 2004 Asian tsunami.
In both cases UNICEF acted as WASH cluster coordinator and managed its own large direct response
programmes.
The Pakistan floods were massive in scale: one-fifth of the country‟s land area was submerged making
seven million people homeless and affecting a total of 20 million people. The floods were especially
devastating in a country where millions of poor people are already living in precarious situations due to
frequent natural disasters, ongoing political instability and widespread poverty. UNICEF‟s WASH
response was its largest ever in a single country in terms of funds expended: a total of $45 million was
spent in 2010 on emergency programming for WASH (on top of the $6 million spent on the existing
WASH development assistance programme). The Pakistan response was unprecedented in scale,
including a substantial tankering operation for people living in camps, the restoration of water supplies in
thousands of affected communities over a wide geographic area, the construction of emergency latrines
and a large-scale hygiene education campaign. Millions of children and their families benefited from
these and other interventions, and many lives were saved. To manage such a large scale operation staff
resources were augmented from external sources (especially for cluster coordination and information
management), but UNICEF‟s existing and long-standing WASH sector presence and established
partnerships with government and other stakeholders in the country gave it a head start.
The earthquake in Haiti killed more than 220,000 people and displaced another 2.3 million, many of
whom were later again threatened by the severe cholera outbreak that eventually killed another 2,481
people. Like in Pakistan, the impact of these crises was particularly severe due to the already deep
vulnerability of children and their families due to endemic poverty. Unlike in Pakistan, the existing
UNICEF WASH programme in Haiti was very small, and the large-scale response required the
mobilization of many professionals from outside the country from the very beginning. To do this,
UNICEF was able to draw on its large international WASH staff cadre, bringing more than 20 UNICEF
staff members from other country offices to take up temporary surge appointments (for both programme
and cluster roles) in addition to placements through standby arrangements and permanent hires. This team
was able to mount a sizeable and timely programme of response (Table 5).
20
In most of these countries there were multiple emergency events. Globally, UNICEF estimates that it supported
WASH interventions in some 230 emergency events in 2010.
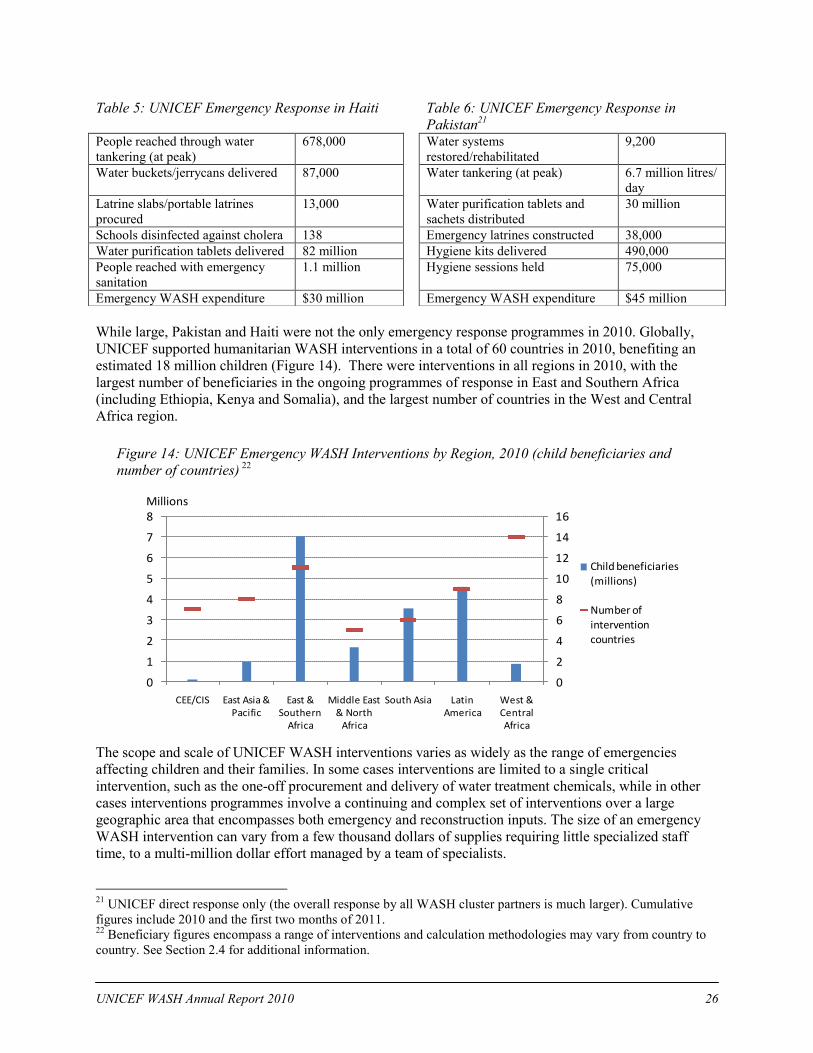
UNICEF WASH Annual Report 2010 26
While large, Pakistan and Haiti were not the only emergency response programmes in 2010. Globally,
UNICEF supported humanitarian WASH interventions in a total of 60 countries in 2010, benefiting an
estimated 18 million children (Figure 14). There were interventions in all regions in 2010, with the
largest number of beneficiaries in the ongoing programmes of response in East and Southern Africa
(including Ethiopia, Kenya and Somalia), and the largest number of countries in the West and Central
Africa region.
Figure 14: UNICEF Emergency WASH Interventions by Region, 2010 (child beneficiaries and
number of countries) 22
The scope and scale of UNICEF WASH interventions varies as widely as the range of emergencies
affecting children and their families. In some cases interventions are limited to a single critical
intervention, such as the one-off procurement and delivery of water treatment chemicals, while in other
cases interventions programmes involve a continuing and complex set of interventions over a large
geographic area that encompasses both emergency and reconstruction inputs. The size of an emergency
WASH intervention can vary from a few thousand dollars of supplies requiring little specialized staff
time, to a multi-million dollar effort managed by a team of specialists.
21
UNICEF direct response only (the overall response by all WASH cluster partners is much larger). Cumulative
figures include 2010 and the first two months of 2011. 22
Beneficiary figures encompass a range of interventions and calculation methodologies may vary from country to
country. See Section 2.4 for additional information.
0
2
4
6
8
10
12
14
16
0
1
2
3
4
5
6
7
8
CEE/CIS East Asia & Pacific
East & Southern
Africa
Middle East & North
Africa
South Asia Latin America
West & Central Africa
Millions
Child beneficiaries
(millions)
Number of
intervention countries
Table 5: UNICEF Emergency Response in Haiti Table 6: UNICEF Emergency Response in
Pakistan21
People reached through water
tankering (at peak)
678,000 Water systems
restored/rehabilitated
9,200
Water buckets/jerrycans delivered 87,000 Water tankering (at peak) 6.7 million litres/
day
Latrine slabs/portable latrines
procured
13,000 Water purification tablets and
sachets distributed
30 million
Schools disinfected against cholera 138 Emergency latrines constructed 38,000
Water purification tablets delivered 82 million Hygiene kits delivered 490,000
People reached with emergency
sanitation
1.1 million Hygiene sessions held 75,000
Emergency WASH expenditure $30 million Emergency WASH expenditure $45 million
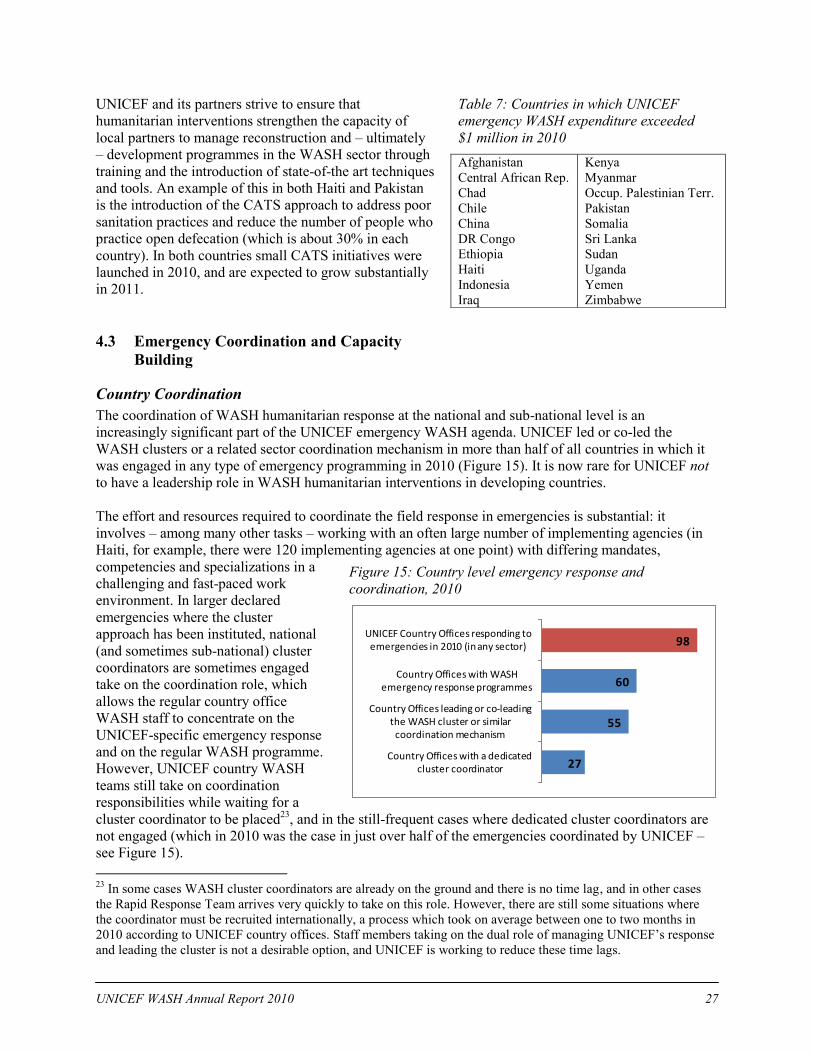
UNICEF WASH Annual Report 2010 27
UNICEF and its partners strive to ensure that
humanitarian interventions strengthen the capacity of
local partners to manage reconstruction and – ultimately
– development programmes in the WASH sector through
training and the introduction of state-of-the art techniques
and tools. An example of this in both Haiti and Pakistan
is the introduction of the CATS approach to address poor
sanitation practices and reduce the number of people who
practice open defecation (which is about 30% in each
country). In both countries small CATS initiatives were
launched in 2010, and are expected to grow substantially
in 2011.
4.3 Emergency Coordination and Capacity
Building
Country Coordination
The coordination of WASH humanitarian response at the national and sub-national level is an
increasingly significant part of the UNICEF emergency WASH agenda. UNICEF led or co-led the
WASH clusters or a related sector coordination mechanism in more than half of all countries in which it
was engaged in any type of emergency programming in 2010 (Figure 15). It is now rare for UNICEF not
to have a leadership role in WASH humanitarian interventions in developing countries.
The effort and resources required to coordinate the field response in emergencies is substantial: it
involves – among many other tasks – working with an often large number of implementing agencies (in
Haiti, for example, there were 120 implementing agencies at one point) with differing mandates,
competencies and specializations in a
challenging and fast-paced work
environment. In larger declared
emergencies where the cluster
approach has been instituted, national
(and sometimes sub-national) cluster
coordinators are sometimes engaged
take on the coordination role, which
allows the regular country office
WASH staff to concentrate on the
UNICEF-specific emergency response
and on the regular WASH programme.
However, UNICEF country WASH
teams still take on coordination
responsibilities while waiting for a
cluster coordinator to be placed23
, and in the still-frequent cases where dedicated cluster coordinators are
not engaged (which in 2010 was the case in just over half of the emergencies coordinated by UNICEF –
see Figure 15).
23
In some cases WASH cluster coordinators are already on the ground and there is no time lag, and in other cases
the Rapid Response Team arrives very quickly to take on this role. However, there are still some situations where
the coordinator must be recruited internationally, a process which took on average between one to two months in
2010 according to UNICEF country offices. Staff members taking on the dual role of managing UNICEF‟s response
and leading the cluster is not a desirable option, and UNICEF is working to reduce these time lags.
Table 7: Countries in which UNICEF
emergency WASH expenditure exceeded
$1 million in 2010
Afghanistan
Central African Rep.
Chad
Chile
China
DR Congo
Ethiopia
Haiti
Indonesia
Iraq
Kenya
Myanmar
Occup. Palestinian Terr.
Pakistan
Somalia
Sri Lanka
Sudan
Uganda
Yemen
Zimbabwe
Figure 15: Country level emergency response and
coordination, 2010
98
60
55
27
UNICEF Country Offices responding to emergencies in 2010 (in any sector)
Country Offices with WASH emergency response programmes
Country Offices leading or co-leading the WASH cluster or similar
coordination mechanism
Country Offices with a dedicated cluster coordinator
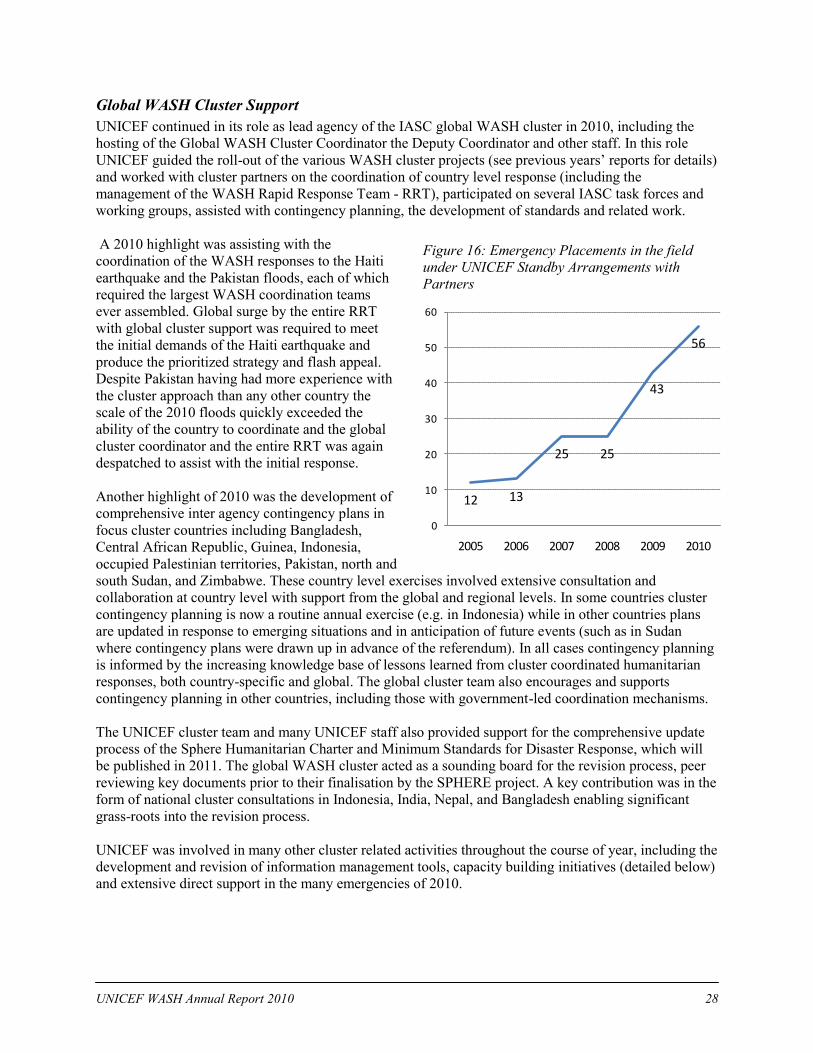
UNICEF WASH Annual Report 2010 28
Global WASH Cluster Support
UNICEF continued in its role as lead agency of the IASC global WASH cluster in 2010, including the
hosting of the Global WASH Cluster Coordinator the Deputy Coordinator and other staff. In this role
UNICEF guided the roll-out of the various WASH cluster projects (see previous years‟ reports for details)
and worked with cluster partners on the coordination of country level response (including the
management of the WASH Rapid Response Team - RRT), participated on several IASC task forces and
working groups, assisted with contingency planning, the development of standards and related work.
A 2010 highlight was assisting with the
coordination of the WASH responses to the Haiti
earthquake and the Pakistan floods, each of which
required the largest WASH coordination teams
ever assembled. Global surge by the entire RRT
with global cluster support was required to meet
the initial demands of the Haiti earthquake and
produce the prioritized strategy and flash appeal.
Despite Pakistan having had more experience with
the cluster approach than any other country the
scale of the 2010 floods quickly exceeded the
ability of the country to coordinate and the global
cluster coordinator and the entire RRT was again
despatched to assist with the initial response.
Another highlight of 2010 was the development of
comprehensive inter agency contingency plans in
focus cluster countries including Bangladesh,
Central African Republic, Guinea, Indonesia,
occupied Palestinian territories, Pakistan, north and
south Sudan, and Zimbabwe. These country level exercises involved extensive consultation and
collaboration at country level with support from the global and regional levels. In some countries cluster
contingency planning is now a routine annual exercise (e.g. in Indonesia) while in other countries plans
are updated in response to emerging situations and in anticipation of future events (such as in Sudan
where contingency plans were drawn up in advance of the referendum). In all cases contingency planning
is informed by the increasing knowledge base of lessons learned from cluster coordinated humanitarian
responses, both country-specific and global. The global cluster team also encourages and supports
contingency planning in other countries, including those with government-led coordination mechanisms.
The UNICEF cluster team and many UNICEF staff also provided support for the comprehensive update
process of the Sphere Humanitarian Charter and Minimum Standards for Disaster Response, which will
be published in 2011. The global WASH cluster acted as a sounding board for the revision process, peer
reviewing key documents prior to their finalisation by the SPHERE project. A key contribution was in the
form of national cluster consultations in Indonesia, India, Nepal, and Bangladesh enabling significant
grass-roots into the revision process.
UNICEF was involved in many other cluster related activities throughout the course of year, including the
development and revision of information management tools, capacity building initiatives (detailed below)
and extensive direct support in the many emergencies of 2010.
Figure 16: Emergency Placements in the field
under UNICEF Standby Arrangements with
Partners
12 13
25 25
43
56
0
10
20
30
40
50
60
2005 2006 2007 2008 2009 2010
UNICEF WASH Annual Report 2010 29
Capacity Building
As WASH cluster lead agency UNICEF continued to backstop the extensive ongoing cluster coordinator
training programme. In 2010 this included one high level international training event (held in Norway),
seven regional sessions (covering all UNICEF regions except for CEE/CIS) and an additional seven
national training sessions. UNICEF also provided support for the third annual regional tri-cluster
coordination training session in the MENA region, which involved 120 participants from the WASH,
nutrition and protection clusters and stressed inter-cluster coordination.
The roll out of the large-scale WASH in Emergencies training programme for UNICEF staff and partners
also continued in 2010. Launched in 2009, the training programme consists of a series of four-day courses
held in country and regional offices to build staff competencies on all aspects of UNICEF humanitarian
responsibilities in the WASH sector and encourages the mainstreaming of emergency within the WASH
programme. By the end of the year 195 UNICEF staff and an additional 85 professionals from partner
agencies, government counterparts and standby partners had completed the course. This capacity building
effort is one of UNICEF‟s largest ever for WASH staff – over 40% of staff have participated in the
courses to date.
The capacity of UNICEF to support cluster-based interventions continued to be backstopped by the
WASH RRT, which enhances UNICEF‟s ability to support cluster-based responses in a timely manner,
allowing for the recruitment of a dedicated replacement through normal UNICEF channels (RRT
members are deployed two to six days after the onset of an emergency). The RRT continued to be funded
by ECHO and DFID with ACF, OXFAM and CARE sharing implementing agency duties. Since its
inception in late 2008, the RRT has deployed 17 times in 13 countries for a total of 838 person-days.
Standby partners continued to contribute significant capacity to the UNICEF WASH response, both for
UNICEF direct response in accordance with the CCCs and for the fulfillment of obligations as global
cluster lead agency. In 2010 a total of 56 professionals from standby partners were in the field in a variety
of roles (Figure 16). The deployments were to a total of 14 countries seconded from ten partner
organizations.
5 WASH, the Environment and Climate Change
UNICEF rolled out its programme to support climate change adaptation and improve environment-related
sustainability of its WASH programmes in 2010 through a series of interventions designed to build
analytical and response capacity at country level. An important part of this programme was the
development of an approach for assessing the risk and implications of climate change for WASH in
programme countries, and existing capacities for adaptation. Using this approach, 22 country profiles
were profiled and disseminated in 2010 (Figure 17).
To further support strategic action planning at the country level, UNICEF developed a risk matrix to
identify areas of vulnerability (which often leads to inequity) and comparative advantages of sector actors
including UNICEF. Indonesia and Bangladesh participated in the piloting of this approach, the results of
which supported country programme planning. In both countries the assessments found multiple, serious
climate-related hazards (such as flooding, sea level rise and storm events) along with vulnerabilities in
response capacities. In Bangladesh the exercise was an important input for planning discussion for 2012-
2016 UNDAF, while in Indonesia the results were used to create a platform for cross sector programming
collaboration between the WASH and education sectors. Linked to this effort was the roll-out of a
training programme for country staff from both WASH and other sectors, including Health, Nutrition,
Social Policy and Emergency. Sessions were held in six regional office and 11 country offices in 2010.
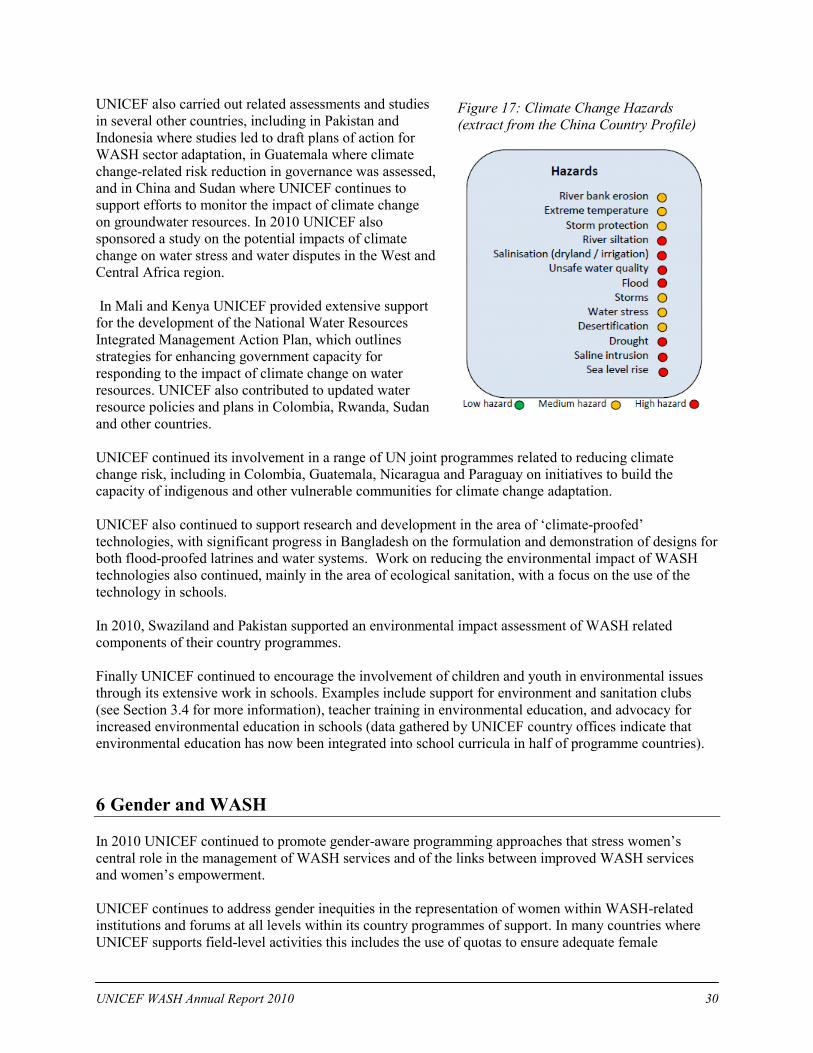
UNICEF WASH Annual Report 2010 30
UNICEF also carried out related assessments and studies
in several other countries, including in Pakistan and
Indonesia where studies led to draft plans of action for
WASH sector adaptation, in Guatemala where climate
change-related risk reduction in governance was assessed,
and in China and Sudan where UNICEF continues to
support efforts to monitor the impact of climate change
on groundwater resources. In 2010 UNICEF also
sponsored a study on the potential impacts of climate
change on water stress and water disputes in the West and
Central Africa region.
In Mali and Kenya UNICEF provided extensive support
for the development of the National Water Resources
Integrated Management Action Plan, which outlines
strategies for enhancing government capacity for
responding to the impact of climate change on water
resources. UNICEF also contributed to updated water
resource policies and plans in Colombia, Rwanda, Sudan
and other countries.
UNICEF continued its involvement in a range of UN joint programmes related to reducing climate
change risk, including in Colombia, Guatemala, Nicaragua and Paraguay on initiatives to build the
capacity of indigenous and other vulnerable communities for climate change adaptation.
UNICEF also continued to support research and development in the area of „climate-proofed‟
technologies, with significant progress in Bangladesh on the formulation and demonstration of designs for
both flood-proofed latrines and water systems. Work on reducing the environmental impact of WASH
technologies also continued, mainly in the area of ecological sanitation, with a focus on the use of the
technology in schools.
In 2010, Swaziland and Pakistan supported an environmental impact assessment of WASH related
components of their country programmes.
Finally UNICEF continued to encourage the involvement of children and youth in environmental issues
through its extensive work in schools. Examples include support for environment and sanitation clubs
(see Section 3.4 for more information), teacher training in environmental education, and advocacy for
increased environmental education in schools (data gathered by UNICEF country offices indicate that
environmental education has now been integrated into school curricula in half of programme countries).
6 Gender and WASH
In 2010 UNICEF continued to promote gender-aware programming approaches that stress women‟s
central role in the management of WASH services and of the links between improved WASH services
and women‟s empowerment.
UNICEF continues to address gender inequities in the representation of women within WASH-related
institutions and forums at all levels within its country programmes of support. In many countries where
UNICEF supports field-level activities this includes the use of quotas to ensure adequate female
Figure 17: Climate Change Hazards
(extract from the China Country Profile)
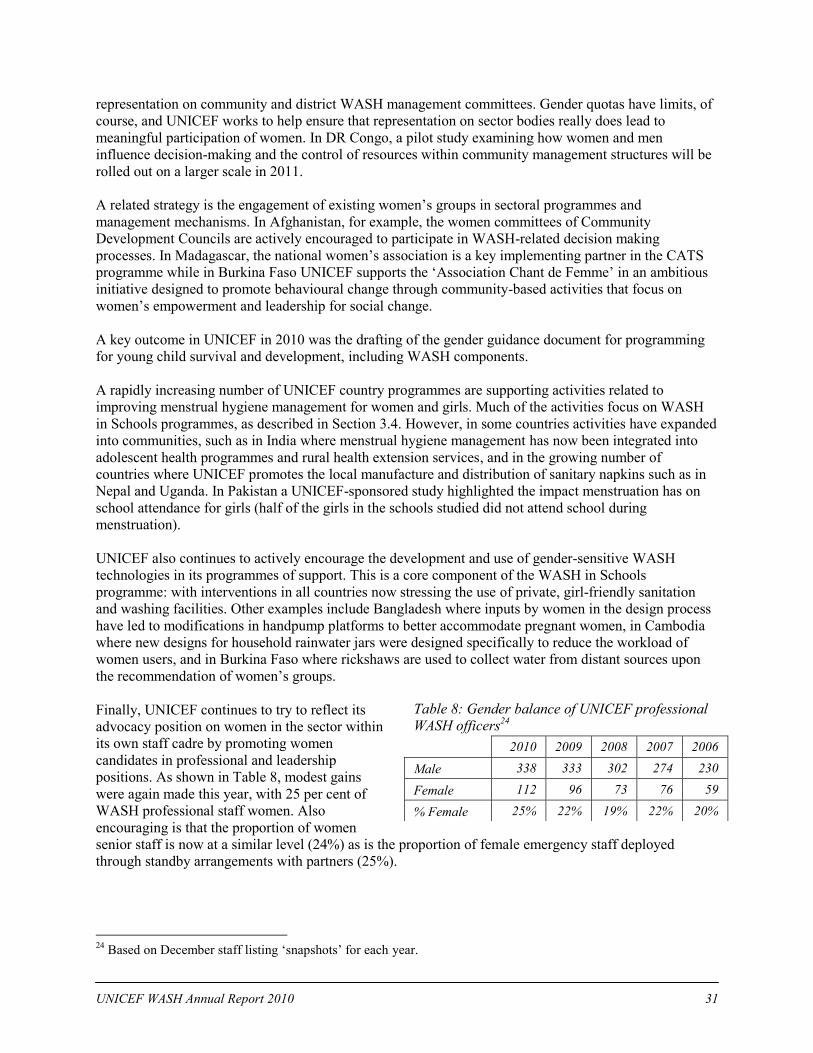
UNICEF WASH Annual Report 2010 31
representation on community and district WASH management committees. Gender quotas have limits, of
course, and UNICEF works to help ensure that representation on sector bodies really does lead to
meaningful participation of women. In DR Congo, a pilot study examining how women and men
influence decision-making and the control of resources within community management structures will be
rolled out on a larger scale in 2011.
A related strategy is the engagement of existing women‟s groups in sectoral programmes and
management mechanisms. In Afghanistan, for example, the women committees of Community
Development Councils are actively encouraged to participate in WASH-related decision making
processes. In Madagascar, the national women‟s association is a key implementing partner in the CATS
programme while in Burkina Faso UNICEF supports the „Association Chant de Femme‟ in an ambitious
initiative designed to promote behavioural change through community-based activities that focus on
women‟s empowerment and leadership for social change.
A key outcome in UNICEF in 2010 was the drafting of the gender guidance document for programming
for young child survival and development, including WASH components.
A rapidly increasing number of UNICEF country programmes are supporting activities related to
improving menstrual hygiene management for women and girls. Much of the activities focus on WASH
in Schools programmes, as described in Section 3.4. However, in some countries activities have expanded
into communities, such as in India where menstrual hygiene management has now been integrated into
adolescent health programmes and rural health extension services, and in the growing number of
countries where UNICEF promotes the local manufacture and distribution of sanitary napkins such as in
Nepal and Uganda. In Pakistan a UNICEF-sponsored study highlighted the impact menstruation has on
school attendance for girls (half of the girls in the schools studied did not attend school during
menstruation).
UNICEF also continues to actively encourage the development and use of gender-sensitive WASH
technologies in its programmes of support. This is a core component of the WASH in Schools
programme: with interventions in all countries now stressing the use of private, girl-friendly sanitation
and washing facilities. Other examples include Bangladesh where inputs by women in the design process
have led to modifications in handpump platforms to better accommodate pregnant women, in Cambodia
where new designs for household rainwater jars were designed specifically to reduce the workload of
women users, and in Burkina Faso where rickshaws are used to collect water from distant sources upon
the recommendation of women‟s groups.
Finally, UNICEF continues to try to reflect its
advocacy position on women in the sector within
its own staff cadre by promoting women
candidates in professional and leadership
positions. As shown in Table 8, modest gains
were again made this year, with 25 per cent of
WASH professional staff women. Also
encouraging is that the proportion of women
senior staff is now at a similar level (24%) as is the proportion of female emergency staff deployed
through standby arrangements with partners (25%).
24
Based on December staff listing „snapshots‟ for each year.
Table 8: Gender balance of UNICEF professional
WASH officers24
2010 2009 2008 2007 2006
Male 338 333 302 274 230
Female 112 96 73 76 59
% Female 25% 22% 19% 22% 20%
UNICEF WASH Annual Report 2010 32
7 Sector Monitoring
The publication of both the JMP and GLAAS reports in 2010 provided the most comprehensive snapshot
of the WASH sector ever compiled. Together the reports provide a complete picture of sector progress,
funding patterns and inequities while helping to point the way forward towards meeting the MDG water
and sanitation targets. The JMP and GLAAS mechanisms – combined with improving country level
information from the MICS and DHS household surveys and the Country Status Overview (CSO) reports
in Africa – are essential inputs for the maturing SWA partnership framework between donors and
countries.
UNICEF is a key contributor to all of these monitoring mechanisms: it co-publishes the JMP report with
WHO, it provided extensive inputs to the UN-Water GLAAS report, it funds and manages the MICS
surveys, it contributes to the design and implementation of DHS surveys, and it provides extensive
support to CSO reporting, including leading the
process in some countries.
UNICEF and WHO published a number of reports in
2010 in addition to the main global update report,
including regional snapshots and water quality
reports (see box). The regional snapshots are used as
key baseline inputs for regional WASH events, such
as for the second LatinoSan conference, the third
African Water Week and the second East Asia
Ministerial Conference on Sanitation and Hygiene
All, held in 2010.
Progress was made in 2010 on the monitoring of
water quality within the JMP mechanism. A technical
task force composed of members from key sectoral
institutes and agencies along with the academic
community concluded that advances in technologies
allow the measurement of water quality on a wide
enough scale to include it within the JMP mechanism
and that the indicator of choice for global monitoring
should be E. Coli (a proxy indicator for microbial
water quality).
This decision on water quality, together with the
2009 decision on standardized hygiene indicators25
and ongoing discussions in the sector on new
methodologies for monitoring sanitation progress will
lead to a more rigorous and useful global WASH
monitoring system.
UNICEF also continued to support a wide range of country level monitoring initiatives in 2010, both
through the JMP (which held a number of training sessions at regional and country level in 2010) and
through ongoing support by country programmes. Several countries developed and launched new
monitoring systems to improve budget and planning processes and to pinpoint coverage disparities. The
25
As discussed in last year‟s report, agreement was reached in 2009 on a standard set of proxy indicators for
handwashing with soap in the MICS and DHS household surveys. As a result of this agreement, data on hygiene that
is comparable across countries has already been gathered in about 15 countries.
JMP 2010 Publications
Progress on sanitation and drinking-water, 2010
update
A Snapshot of Drinking-water and Sanitation in
Africa – 2010 Update (special edition for
AMCOW)
A Snapshot of Drinking-water and Sanitation in
Sub-Saharan Africa
A Snapshot of Drinking-water and Sanitation in
the MDG region Latin-America & Caribbean –
2010 Update
A Snapshot of Drinking-water and Sanitation in
the MDG region South-eastern Asia – 2010
Update
A Snapshot of Drinking-water and Sanitation in
the MDG region Southern Asia – 2010 Update
A Snapshot of Drinking-water and Sanitation in
the MDG region Sub-Saharan Africa – 2010
Update
A Snapshot of Drinking-water and Sanitation in
the MDG region Western Asia – 2010 Update
Equity Fact Sheet: MDG7 – Ensure
Environmental Sustainability
Rapid Assessment on Drinking-water Quality
reports (five reports from the pilot countries)
UNICEF WASH Annual Report 2010 33
new Ethiopian WASH Inventory initiative, for example, is being used to prioritise interventions and
budgets in four regions and will be expanded to the national level in 2011. In other countries UNICEF
continued to develop mechanisms to monitor the sustainability of programme interventions, such as the
third party sustainability checks in ESAR countries (see Section 3.3) and new ways of monitoring the
sustainability of open defecation free status (such as Sierra Leone‟s use of „natural leaders‟ as monitoring
agents) and of hygiene practices (such as the large-scale volunteer community hygiene monitor initiative
in Bangladesh, see Section 3.2).
8 Partnerships
UNICEF is fully committed to working collaboratively within the WASH sector in recognition of the fact
that MDG water and sanitation targets will only be achieved through the joint efforts of all stakeholders,
from the largest donor agency to the smallest community based organization.
Sanitation and Water for All (SWA) is emerging as the key partnership for engagement at both the global
and national levels. As described in Sections 1.2, 2.1 and 3.1 the establishment of SWA collaboration
mechanisms and inclusive planning instruments at the country level has the potential to significantly
increase the level of resources available for WASH, to improve the effectiveness of donor support to the
sector, to instil a new climate of accountability, and to accelerate progress towards the MDG targets.
UNICEF continues to be an active participant in
many other partnership frameworks, including the
key global partnerships listed in the box at right. It
works with partners within all thematic sub-sectors
of the WASH programming environment and at all
levels: global, regional, national, sub-national,
community and school. It works with many types of
partners – governments, sister UN agencies,
academic institutions, NGOs, funding agencies,
private companies among others – with many
specific purposes, ranging from upstream work on
policy reform with political decision makers to
direct implementation with contractors in
communities. And for all of its funding, UNICEF
relies on donor partners: including governments,
UNICEF national committees, development banks,
aid foundations, other UN agencies and the private
sector.
The successful transfer of CATS to Africa is a good illustration of the power of partnerships. With its
relatively limited experience in the area UNICEF would not have been able to drive the expansion of
CATS without its partnerships with Plan International, the Institute of Development Studies (IDS),
WaterAid, the Water and Sanitation Program, and others. The synergy of UNICEF‟s extensive presence
in African countries and the experience of partners were instrumental in the introduction and scaling up of
CATS in Africa. This is also the case for HWTS, hygiene promotion and other programming areas.
UNICEF continues to leverage its own resources through partnerships with sister UN agencies in many
countries, within a number of thematic areas. For example, in China, Colombia, Mauritania and other
countries UNICEF is part of joint UN programmes on climate change adaptation, while in Guatemala and
Key Global WASH Partnership Frameworks
Sanitation and Water for All (SWA)
UN Water
IASC WASH cluster
WHO/UNICEF Joint Monitoring Programme
(JMP)
Water Supply and Sanitation Collaborative
Council (WSSCC)
Public-Private Partnership for Handwashing
with Soap (PPPHW)
Rural Water Supply Network (RWSN)
Global Network on Household Water Treatment
and Safe Storage Network (HWTS)
Call to Action for WASH in Schools
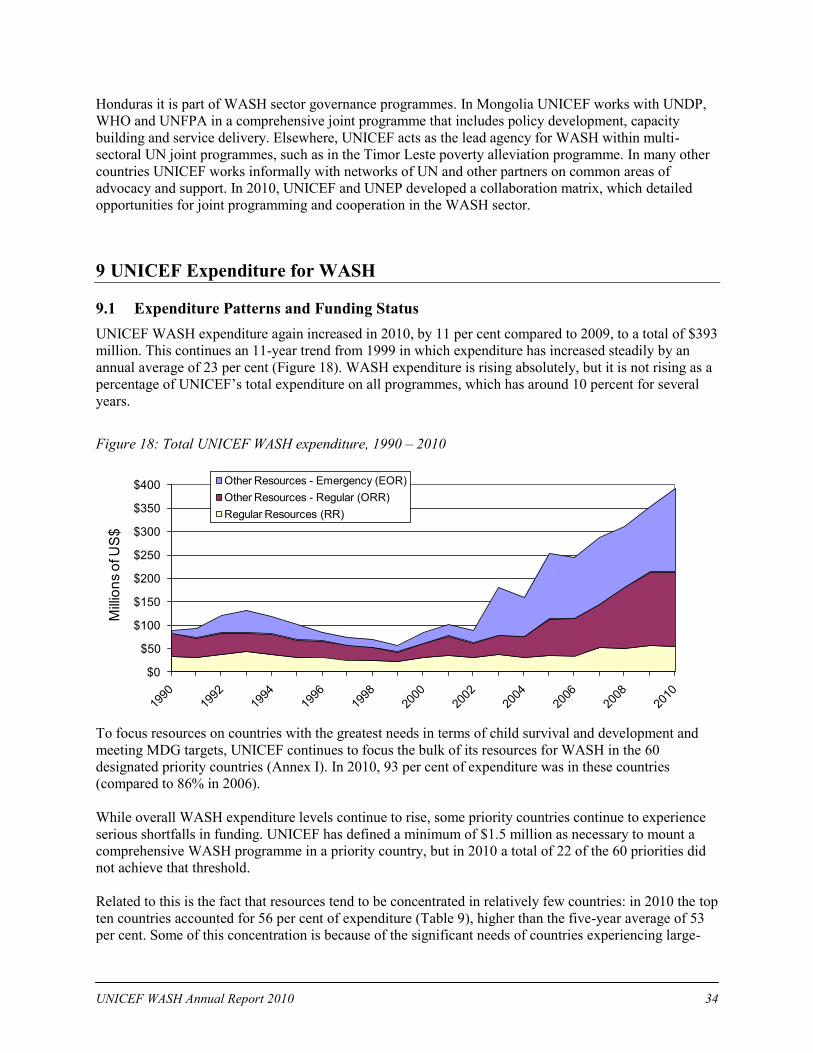
UNICEF WASH Annual Report 2010 34
Honduras it is part of WASH sector governance programmes. In Mongolia UNICEF works with UNDP,
WHO and UNFPA in a comprehensive joint programme that includes policy development, capacity
building and service delivery. Elsewhere, UNICEF acts as the lead agency for WASH within multi-
sectoral UN joint programmes, such as in the Timor Leste poverty alleviation programme. In many other
countries UNICEF works informally with networks of UN and other partners on common areas of
advocacy and support. In 2010, UNICEF and UNEP developed a collaboration matrix, which detailed
opportunities for joint programming and cooperation in the WASH sector.
9 UNICEF Expenditure for WASH
9.1 Expenditure Patterns and Funding Status
UNICEF WASH expenditure again increased in 2010, by 11 per cent compared to 2009, to a total of $393
million. This continues an 11-year trend from 1999 in which expenditure has increased steadily by an
annual average of 23 per cent (Figure 18). WASH expenditure is rising absolutely, but it is not rising as a
percentage of UNICEF‟s total expenditure on all programmes, which has around 10 percent for several
years.
To focus resources on countries with the greatest needs in terms of child survival and development and
meeting MDG targets, UNICEF continues to focus the bulk of its resources for WASH in the 60
designated priority countries (Annex I). In 2010, 93 per cent of expenditure was in these countries
(compared to 86% in 2006).
While overall WASH expenditure levels continue to rise, some priority countries continue to experience
serious shortfalls in funding. UNICEF has defined a minimum of $1.5 million as necessary to mount a
comprehensive WASH programme in a priority country, but in 2010 a total of 22 of the 60 priorities did
not achieve that threshold.
Related to this is the fact that resources tend to be concentrated in relatively few countries: in 2010 the top
ten countries accounted for 56 per cent of expenditure (Table 9), higher than the five-year average of 53
per cent. Some of this concentration is because of the significant needs of countries experiencing large-
Figure 18: Total UNICEF WASH expenditure, 1990 – 2010
$0
$50
$100
$150
$200
$250
$300
$350
$400
Mill
ion
s o
f U
S$
Other Resources - Emergency (EOR)
Other Resources - Regular (ORR)
Regular Resources (RR)
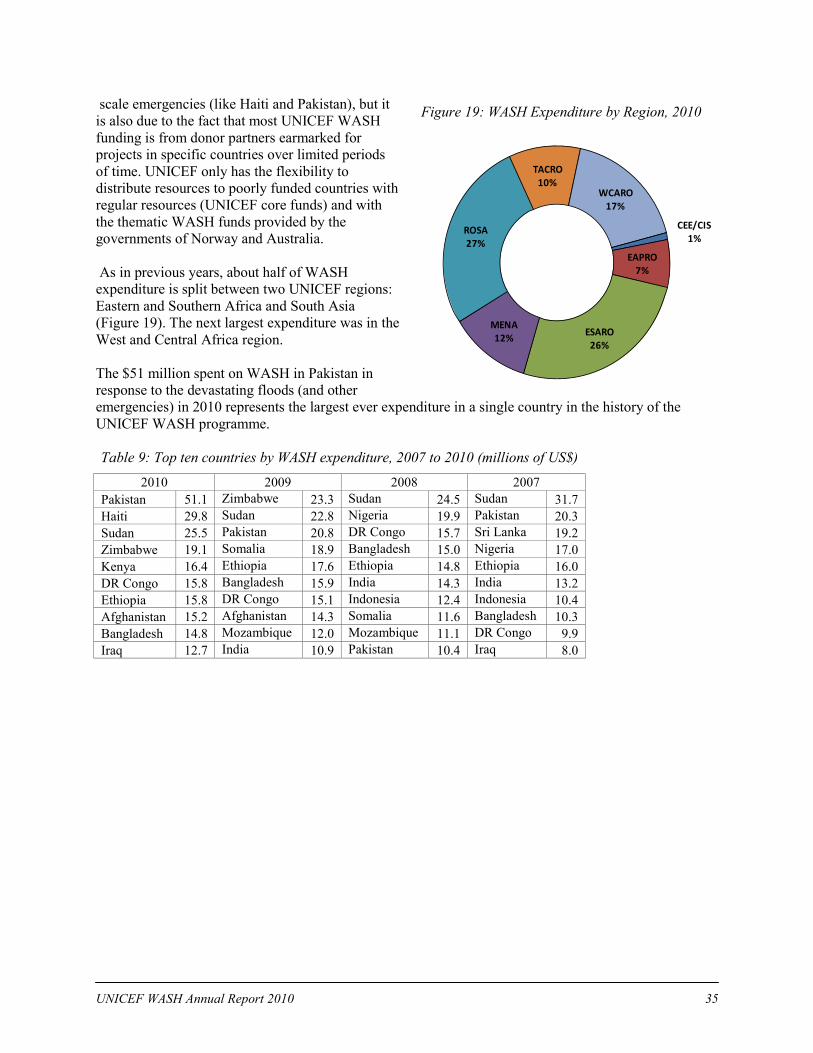
UNICEF WASH Annual Report 2010 35
scale emergencies (like Haiti and Pakistan), but it
is also due to the fact that most UNICEF WASH
funding is from donor partners earmarked for
projects in specific countries over limited periods
of time. UNICEF only has the flexibility to
distribute resources to poorly funded countries with
regular resources (UNICEF core funds) and with
the thematic WASH funds provided by the
governments of Norway and Australia.
As in previous years, about half of WASH
expenditure is split between two UNICEF regions:
Eastern and Southern Africa and South Asia
(Figure 19). The next largest expenditure was in the
West and Central Africa region.
The $51 million spent on WASH in Pakistan in
response to the devastating floods (and other
emergencies) in 2010 represents the largest ever expenditure in a single country in the history of the
UNICEF WASH programme.
Table 9: Top ten countries by WASH expenditure, 2007 to 2010 (millions of US$)
2010 2009 2008 2007
Pakistan 51.1 Zimbabwe 23.3 Sudan 24.5 Sudan 31.7
Haiti 29.8 Sudan 22.8 Nigeria 19.9 Pakistan 20.3
Sudan 25.5 Pakistan 20.8 DR Congo 15.7 Sri Lanka 19.2
Zimbabwe 19.1 Somalia 18.9 Bangladesh 15.0 Nigeria 17.0
Kenya 16.4 Ethiopia 17.6 Ethiopia 14.8 Ethiopia 16.0
DR Congo 15.8 Bangladesh 15.9 India 14.3 India 13.2
Ethiopia 15.8 DR Congo 15.1 Indonesia 12.4 Indonesia 10.4
Afghanistan 15.2 Afghanistan 14.3 Somalia 11.6 Bangladesh 10.3
Bangladesh 14.8 Mozambique 12.0 Mozambique 11.1 DR Congo 9.9
Iraq 12.7 India 10.9 Pakistan 10.4 Iraq 8.0
Figure 19: WASH Expenditure by Region, 2010
CEE/CIS1%
EAPRO7%
ESARO26%
MENA12%
ROSA27%
TACRO10%
WCARO17%
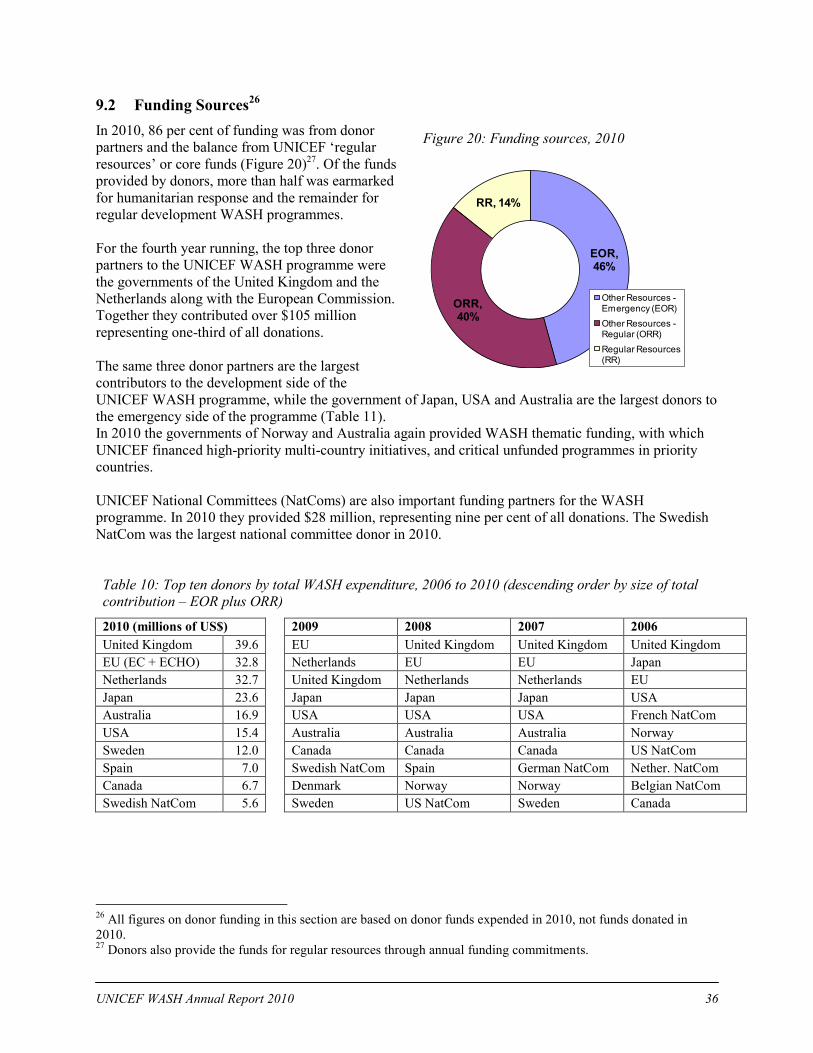
UNICEF WASH Annual Report 2010 36
9.2 Funding Sources26
In 2010, 86 per cent of funding was from donor
partners and the balance from UNICEF „regular
resources‟ or core funds (Figure 20)27
. Of the funds
provided by donors, more than half was earmarked
for humanitarian response and the remainder for
regular development WASH programmes.
For the fourth year running, the top three donor
partners to the UNICEF WASH programme were
the governments of the United Kingdom and the
Netherlands along with the European Commission.
Together they contributed over $105 million
representing one-third of all donations.
The same three donor partners are the largest
contributors to the development side of the
UNICEF WASH programme, while the government of Japan, USA and Australia are the largest donors to
the emergency side of the programme (Table 11).
In 2010 the governments of Norway and Australia again provided WASH thematic funding, with which
UNICEF financed high-priority multi-country initiatives, and critical unfunded programmes in priority
countries.
UNICEF National Committees (NatComs) are also important funding partners for the WASH
programme. In 2010 they provided $28 million, representing nine per cent of all donations. The Swedish
NatCom was the largest national committee donor in 2010.
Table 10: Top ten donors by total WASH expenditure, 2006 to 2010 (descending order by size of total
contribution – EOR plus ORR)
2010 (millions of US$) 2009 2008 2007 2006
United Kingdom 39.6 EU United Kingdom United Kingdom United Kingdom
EU (EC + ECHO) 32.8 Netherlands EU EU Japan
Netherlands 32.7 United Kingdom Netherlands Netherlands EU
Japan 23.6 Japan Japan Japan USA
Australia 16.9 USA USA USA French NatCom
USA 15.4 Australia Australia Australia Norway
Sweden 12.0 Canada Canada Canada US NatCom
Spain 7.0 Swedish NatCom Spain German NatCom Nether. NatCom
Canada 6.7 Denmark Norway Norway Belgian NatCom
Swedish NatCom 5.6 Sweden US NatCom Sweden Canada
26
All figures on donor funding in this section are based on donor funds expended in 2010, not funds donated in
2010. 27
Donors also provide the funds for regular resources through annual funding commitments.
Figure 20: Funding sources, 2010
EOR, 46%
ORR, 40%
RR, 14%
Other Resources -Emergency (EOR)
Other Resources -Regular (ORR)
Regular Resources (RR)
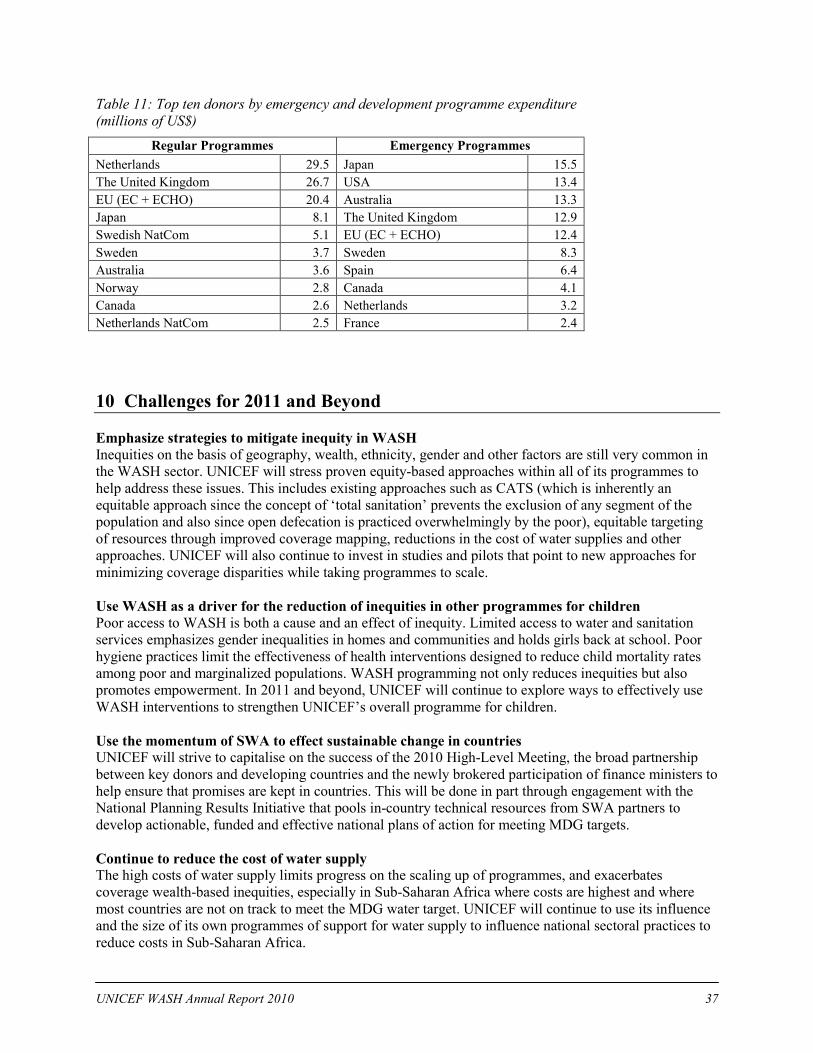
UNICEF WASH Annual Report 2010 37
Table 11: Top ten donors by emergency and development programme expenditure
(millions of US$)
Regular Programmes Emergency Programmes
Netherlands 29.5 Japan 15.5
The United Kingdom 26.7 USA 13.4
EU (EC + ECHO) 20.4 Australia 13.3
Japan 8.1 The United Kingdom 12.9
Swedish NatCom 5.1 EU (EC + ECHO) 12.4
Sweden 3.7 Sweden 8.3
Australia 3.6 Spain 6.4
Norway 2.8 Canada 4.1
Canada 2.6 Netherlands 3.2
Netherlands NatCom 2.5 France 2.4
10 Challenges for 2011 and Beyond
Emphasize strategies to mitigate inequity in WASH
Inequities on the basis of geography, wealth, ethnicity, gender and other factors are still very common in
the WASH sector. UNICEF will stress proven equity-based approaches within all of its programmes to
help address these issues. This includes existing approaches such as CATS (which is inherently an
equitable approach since the concept of „total sanitation‟ prevents the exclusion of any segment of the
population and also since open defecation is practiced overwhelmingly by the poor), equitable targeting
of resources through improved coverage mapping, reductions in the cost of water supplies and other
approaches. UNICEF will also continue to invest in studies and pilots that point to new approaches for
minimizing coverage disparities while taking programmes to scale.
Use WASH as a driver for the reduction of inequities in other programmes for children
Poor access to WASH is both a cause and an effect of inequity. Limited access to water and sanitation
services emphasizes gender inequalities in homes and communities and holds girls back at school. Poor
hygiene practices limit the effectiveness of health interventions designed to reduce child mortality rates
among poor and marginalized populations. WASH programming not only reduces inequities but also
promotes empowerment. In 2011 and beyond, UNICEF will continue to explore ways to effectively use
WASH interventions to strengthen UNICEF‟s overall programme for children.
Use the momentum of SWA to effect sustainable change in countries
UNICEF will strive to capitalise on the success of the 2010 High-Level Meeting, the broad partnership
between key donors and developing countries and the newly brokered participation of finance ministers to
help ensure that promises are kept in countries. This will be done in part through engagement with the
National Planning Results Initiative that pools in-country technical resources from SWA partners to
develop actionable, funded and effective national plans of action for meeting MDG targets.
Continue to reduce the cost of water supply
The high costs of water supply limits progress on the scaling up of programmes, and exacerbates
coverage wealth-based inequities, especially in Sub-Saharan Africa where costs are highest and where
most countries are not on track to meet the MDG water target. UNICEF will continue to use its influence
and the size of its own programmes of support for water supply to influence national sectoral practices to
reduce costs in Sub-Saharan Africa.
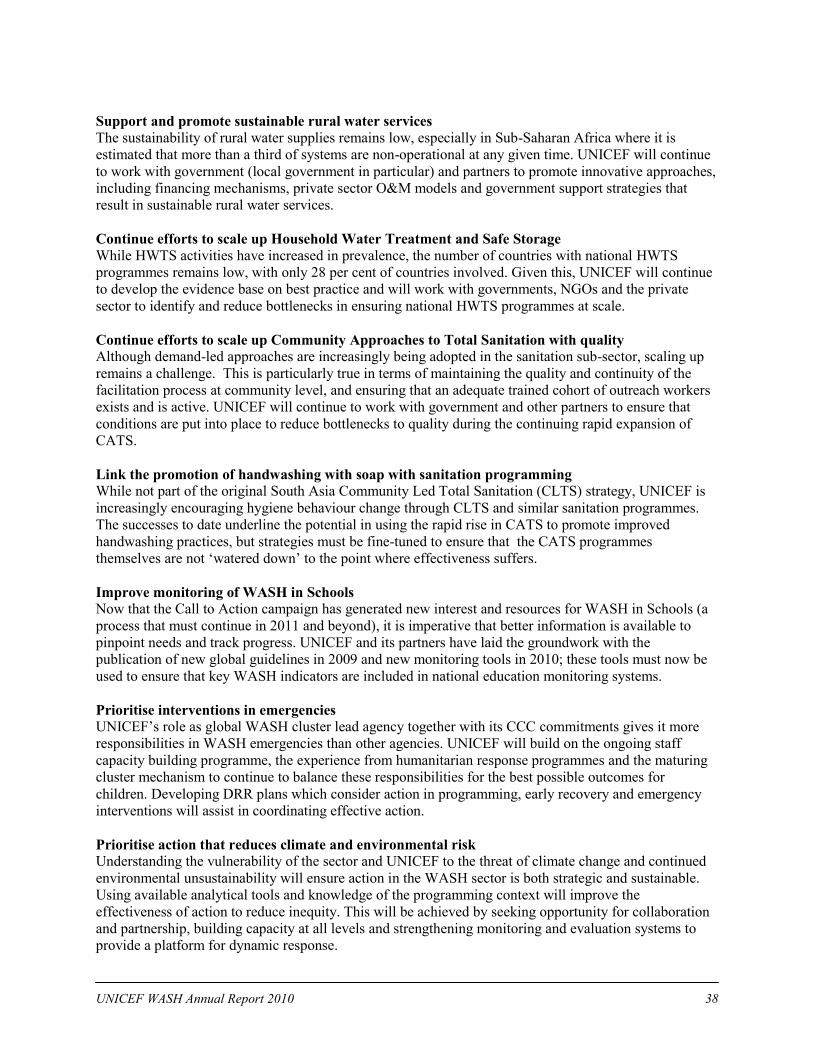
UNICEF WASH Annual Report 2010 38
Support and promote sustainable rural water services
The sustainability of rural water supplies remains low, especially in Sub-Saharan Africa where it is
estimated that more than a third of systems are non-operational at any given time. UNICEF will continue
to work with government (local government in particular) and partners to promote innovative approaches,
including financing mechanisms, private sector O&M models and government support strategies that
result in sustainable rural water services.
Continue efforts to scale up Household Water Treatment and Safe Storage
While HWTS activities have increased in prevalence, the number of countries with national HWTS
programmes remains low, with only 28 per cent of countries involved. Given this, UNICEF will continue
to develop the evidence base on best practice and will work with governments, NGOs and the private
sector to identify and reduce bottlenecks in ensuring national HWTS programmes at scale.
Continue efforts to scale up Community Approaches to Total Sanitation with quality
Although demand-led approaches are increasingly being adopted in the sanitation sub-sector, scaling up
remains a challenge. This is particularly true in terms of maintaining the quality and continuity of the
facilitation process at community level, and ensuring that an adequate trained cohort of outreach workers
exists and is active. UNICEF will continue to work with government and other partners to ensure that
conditions are put into place to reduce bottlenecks to quality during the continuing rapid expansion of
CATS.
Link the promotion of handwashing with soap with sanitation programming
While not part of the original South Asia Community Led Total Sanitation (CLTS) strategy, UNICEF is
increasingly encouraging hygiene behaviour change through CLTS and similar sanitation programmes.
The successes to date underline the potential in using the rapid rise in CATS to promote improved
handwashing practices, but strategies must be fine-tuned to ensure that the CATS programmes
themselves are not „watered down‟ to the point where effectiveness suffers.
Improve monitoring of WASH in Schools
Now that the Call to Action campaign has generated new interest and resources for WASH in Schools (a
process that must continue in 2011 and beyond), it is imperative that better information is available to
pinpoint needs and track progress. UNICEF and its partners have laid the groundwork with the
publication of new global guidelines in 2009 and new monitoring tools in 2010; these tools must now be
used to ensure that key WASH indicators are included in national education monitoring systems.
Prioritise interventions in emergencies
UNICEF‟s role as global WASH cluster lead agency together with its CCC commitments gives it more
responsibilities in WASH emergencies than other agencies. UNICEF will build on the ongoing staff
capacity building programme, the experience from humanitarian response programmes and the maturing
cluster mechanism to continue to balance these responsibilities for the best possible outcomes for
children. Developing DRR plans which consider action in programming, early recovery and emergency
interventions will assist in coordinating effective action.
Prioritise action that reduces climate and environmental risk
Understanding the vulnerability of the sector and UNICEF to the threat of climate change and continued
environmental unsustainability will ensure action in the WASH sector is both strategic and sustainable.
Using available analytical tools and knowledge of the programming context will improve the
effectiveness of action to reduce inequity. This will be achieved by seeking opportunity for collaboration
and partnership, building capacity at all levels and strengthening monitoring and evaluation systems to
provide a platform for dynamic response.
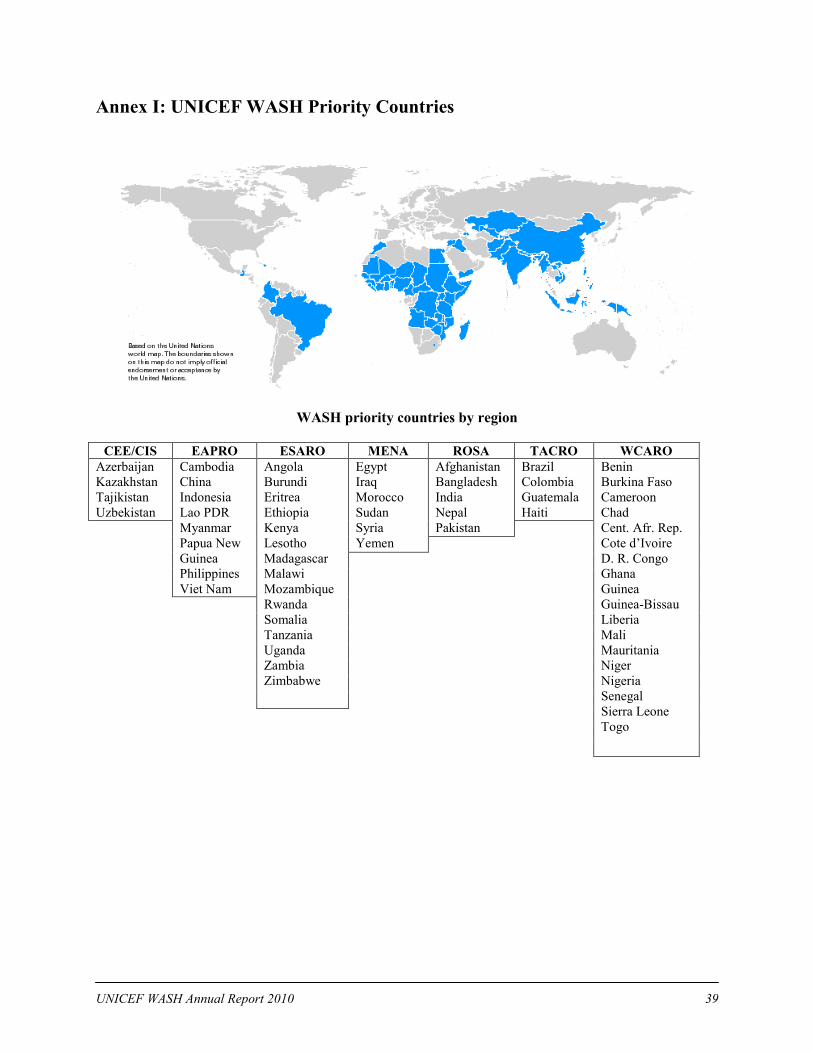
UNICEF WASH Annual Report 2010 39
Annex I: UNICEF WASH Priority Countries
WASH priority countries by region
CEE/CIS EAPRO ESARO MENA ROSA TACRO WCARO
Azerbaijan
Kazakhstan
Tajikistan
Uzbekistan
Cambodia
China
Indonesia
Lao PDR
Myanmar
Papua New
Guinea
Philippines
Viet Nam
Angola
Burundi
Eritrea
Ethiopia
Kenya
Lesotho
Madagascar
Malawi
Mozambique
Rwanda
Somalia
Tanzania
Uganda
Zambia
Zimbabwe
Egypt
Iraq
Morocco
Sudan
Syria
Yemen
Afghanistan
Bangladesh
India
Nepal
Pakistan
Brazil
Colombia
Guatemala
Haiti
Benin
Burkina Faso
Cameroon
Chad
Cent. Afr. Rep.
Cote d‟Ivoire
D. R. Congo
Ghana
Guinea
Guinea-Bissau
Liberia
Mali
Mauritania
Niger
Nigeria
Senegal
Sierra Leone
Togo
UNICEF WASH Annual Report 2010 40
Annex II: Sanitation and Water for All Partners
SWA Partners, as of January 2011
Developing countries
(32) 8 in Asia and the Middle East, 1 in the Americas and the balance in Africa,
along with the African Ministers' Council on Water (AMCOW)
Donors (6) Austria – Austrian Development Agency (ADA)
France– Ministry of Foreign and European Affairs (MAEE) and French
Development Agency (AFD)
Germany –Federal Ministry for Economic Development Cooperation (BMZ)
The Netherlands - Directorate General for International Cooperation (DGIS)
Switzerland - Swiss Agency for Development and Cooperation (SDC)
United Kingdom - Department for International Development (DFID)
Multilateral agencies
(8) Center for Environment and Development for the Arab Region and Europe
(CEDARE)
Centre for Low Cost Water supply and Sanitation (CREPA)
Global Water Partnership (GWP)
United Nations Children's Fund – (UNICEF)
United Nations Development Programme (UNDP)
United Nations Human Settlements Programme (UN-HABITAT)
United Nations University (UNU)
Water Supply and Sanitation Collaborative Council (WSSCC)
Regional development
bank (1) African Development Bank (AfDB)
Civil society partners
(3) African Civil Society Network on Water and Sanitation (ANEW)
End Water Poverty
Freshwater Action Network South Asia (FANSA)
Other sector partners
(16) African Water Association (AfWA)
AquaFed (International Federation of Private Water Operators)
CARE
Institute for Sustainable Futures, University of Technology Sydney (IFS-UTS)
International Water and Sanitation Centre (IRC)
International Water Association (IWA)
International WaterCentre (IWC)
Population Services International (PSI)
SKAT Foundation
Stockholm Environment Institute (SEI)
Stockholm International Water Institute (SIWI)
Swiss Federal Institute for Aquatic Science and Technology (EAWAG)
United Cities and Local Governments of Africa (UCLGA)
University of North Carolina (UNC)
WaterAid
Water, Engineering and Development Centre (WEDC)

UNICEF Water, Sanitation and Hygiene Annual Report 2010
UNICEF WASH Section
Programmes
UNICEF New York
May 2011