unhealthy behaviours: an international comparison
TRANSCRIPT

RESEARCH ARTICLE
Unhealthy Behaviours: An InternationalComparisonFabrizio Ferretti*
Department of Communication and Economics, School of Social Sciences, University of Modena and ReggioEmilia, Reggio Emilia, Italy
AbstractIn the current global economy, chronic non-communicable diseases (NCDs) have become
the leading cause of death and a major health concern for both developed and developing
countries. Among other factors, the worldwide spread of NCDs is driven by the globalisation
of unhealthy habits. The purpose of this paper is to develop a simple statistic to measure, at
the national level, the average population’s exposure to the main NCDs modifiable risk fac-
tors. The approach and methodology followed by the United Nations Development Pro-
gramme to compute the Human Development Index (HDI) is applied to four basic indicators
of NCD-related preventable risk factors (alcohol consumption, excess caloric intake, non-
balanced diet and tobacco use) in 112 countries worldwide in 2012–14. We obtain a sum-
mary composite index, which we call the Unhealthy Behaviour Index (UBI), which ranks
countries by the average level of the unhealthy habits (drinking, eating and smoking) of their
populations. We find that Belarus and Russian federation are the two countries with the
unhealthiest NCD-related lifestyle. With the exception of Canada, the first twenty popula-
tions more exposed to the main NCDs preventable risk factors all live in European coun-
tries, and mainly in countries of Eastern Europe. Overall, the UBI tends to increase along
with the level of human development. In medium, high and very high HDI countries, how-ever, the same level of human development may be associated with very different kinds of
NCD-related lifestyles. Finally, economic growth may push populations toward either more
unhealthy or healthy habits, depending on the countries’ level of development; the elasticity
of unhealthy habits with respect to income per capita is positive (but less than one: on aver-
age 0.6) until $30,000, decreases as income rises, and becomes negative (around -0.3) in
very high income countries.
IntroductionOnce considered ‘diseases of affluence’ that affected mostly elderly and wealthy people inWest-ern advanced countries, today, non-communicable diseases (NCDs) have become one of themajor global health concerns, as well as the leading cause of death worldwide [1]. According tothe latest World Health Organization (WHO) global report, NCDs: “. . .were responsible for 38
PLOSONE | DOI:10.1371/journal.pone.0141834 October 29, 2015 1 / 14
a11111
OPEN ACCESS
Citation: Ferretti F (2015) Unhealthy Behaviours: AnInternational Comparison. PLoS ONE 10(10):e0141834. doi:10.1371/journal.pone.0141834
Editor: Corinne Ida Lasmezas, The ScrippsResearch Institute Scripps Florida, UNITED STATES
Received: July 13, 2015
Accepted: October 13, 2015
Published: October 29, 2015
Copyright: © 2015 Fabrizio Ferretti. This is an openaccess article distributed under the terms of theCreative Commons Attribution License, which permitsunrestricted use, distribution, and reproduction in anymedium, provided the original author and source arecredited.
Data Availability Statement: All relevant data arewithin the paper and its Supporting Information files.
Funding: The authors have no support or funding toreport.
Competing Interests: The authors have declaredthat no competing interests exist.

million (68%) of the world’s 56 million deaths in 2012. More than 40% of them (16 million)were premature deaths under the age of 70 years. Almost three-quarters of all NCD deaths (28million) and the majority of premature deaths (82%) occur in low- and middle-income coun-tries” ([2], p. XI).
The increasing worldwide burden of NCDs is the result of complicated interactions betweenseveral demographic, economic and social structural changes [3], and is strongly associatedwith the globalisation of unhealthy lifestyles [4–6]. The leading four chronic NCDs—that is,cardiovascular diseases, chronic respiratory diseases, cancers, and diabetes [7]—are character-ised by a complex aetiology, but generally stem from a combination of non-modifiable risk fac-tors (e.g., sex, age and the inborn genetic characteristics of individuals), and a well-known setof modifiable risk factors: primarily, tobacco use, alcohol abuse, qualitative and quantitativeunhealthy nutrition, lack of physical activity, environmental pollution and chronic infection[8]. This is why epidemiological studies emphasise the role of primary prevention to tackleNCDs and suggest effective ways to drastically reduce the global incidence of NCDs by control-ling the main lifestyle-related risk factors in each country [9,10].
Recent developments in NCD epidemiology highlight the importance of measuring thecombined effects of multiple lifestyle risk behaviours on people’s health outcomes [11]. Todate, the research has helped to understand and explain this phenomenon at the individual(i.e., microeconomic) level [12]. The purpose of this paper is to develop a simple statistic inorder to measure the average population’s exposure to the main NCDmodifiable risk factors atthe country (i.e., macroeconomic) level. In what follows, the approach and methodology fol-lowed by the United Nations Development Programme (UNDP) to compute theHDI (HumanDevelopment Index) [13] is applied to four of the main preventable risk factors that underliethe leading NCDs (alcohol abuse, excess caloric intake, non-balanced diet, and tobacco use) in112 countries worldwide for the period 2012–14. The result is a summary composite index—that will be called the ‘Unhealthy Behaviour Index (UBI)’—which allows us to rank countriesby the average level of the unhealthy (drinking, eating and smoking) habits of their respectivepopulations.
Methods and DataIt is often useful to construct a composite indicator to summarise a wide range of indicators ofa multi-dimensional phenomenon in a single statistic [14]. In this paper, we construct the UBI,a summary measure of three fundamental dimensions of people’s health-related habits andbehaviours: drinking, eating and smoking (Fig 1). These key lifestyle factors are captured hereby four basic indicators of the main NCDmodifiable risk factors [15]: i.e. alcohol consumption(ALC), excess caloric intake (ECI), non-balanced diet (that is, a diet too rich in total fat andprotein, NBD) and tobacco use (TOB).
Each indicator is transformed into a corresponding normalised index (Ix) according to thestandard HDImethodology [16] as follows:
Ix ¼ actx �minx
maxx �minx
ð1Þ
where actx,minx andmaxx stand for the actual, minimum and maximum value of the underly-ing indicator. For the eating dimension, Eq 1 is applied to each of the two subcomponents (ECIand NBD). Then, a geometric mean of the resulting sub-indices (ECIX and NBDX) is created,and Eq 1 is applied again to the geometric mean of these two indices in order to obtain thenutrition dimension index (NUTX). Finally, UBI is computed as the geometric mean of thethree normalised dimension indices—that is, alcohol (ALCX), nutrition (NUTX), and tobacco
The Unhealthy Behaviour Index
PLOS ONE | DOI:10.1371/journal.pone.0141834 October 29, 2015 2 / 14
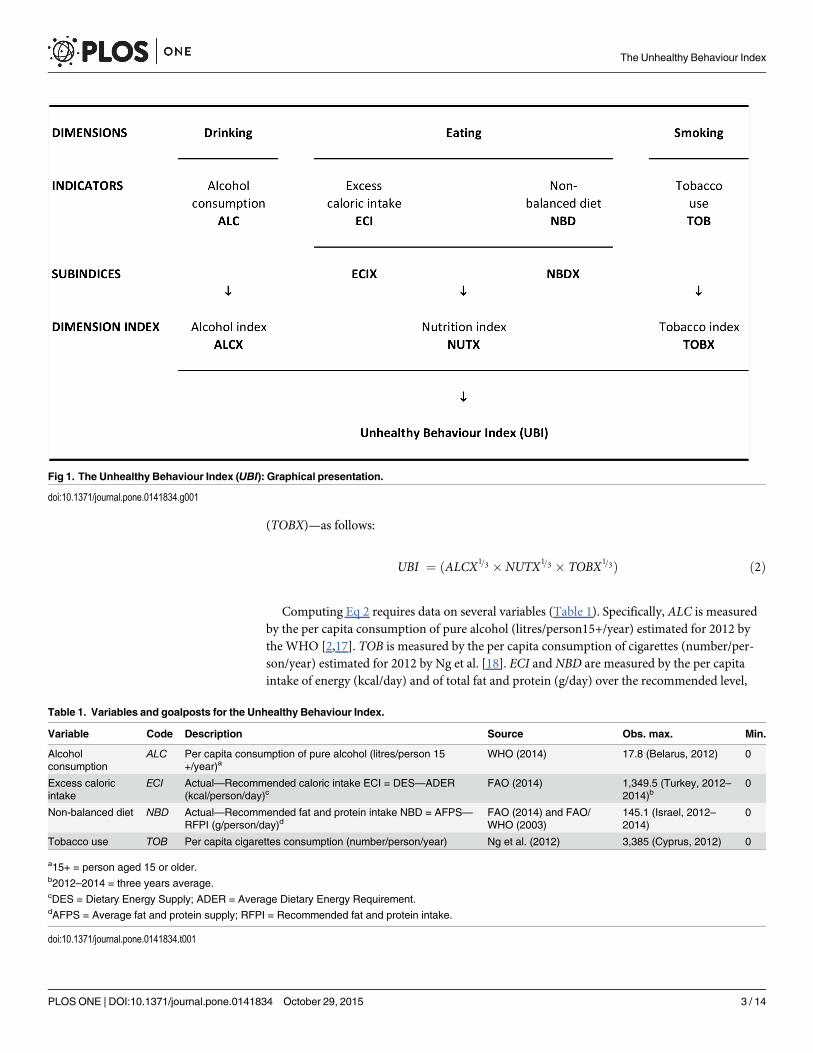
(TOBX)—as follows:
UBI ¼ ðALCX1=3 � NUTX1=3 � TOBX
1=3Þ ð2Þ
Computing Eq 2 requires data on several variables (Table 1). Specifically, ALC is measuredby the per capita consumption of pure alcohol (litres/person15+/year) estimated for 2012 bythe WHO [2,17]. TOB is measured by the per capita consumption of cigarettes (number/per-son/year) estimated for 2012 by Ng et al. [18]. ECI and NBD are measured by the per capitaintake of energy (kcal/day) and of total fat and protein (g/day) over the recommended level,
Fig 1. The Unhealthy Behaviour Index (UBI): Graphical presentation.
doi:10.1371/journal.pone.0141834.g001
Table 1. Variables and goalposts for the Unhealthy Behaviour Index.
Variable Code Description Source Obs. max. Min.
Alcoholconsumption
ALC Per capita consumption of pure alcohol (litres/person 15+/year)a
WHO (2014) 17.8 (Belarus, 2012) 0
Excess caloricintake
ECI Actual—Recommended caloric intake ECI = DES—ADER(kcal/person/day)c
FAO (2014) 1,349.5 (Turkey, 2012–2014)b
0
Non-balanced diet NBD Actual—Recommended fat and protein intake NBD = AFPS—RFPI (g/person/day)d
FAO (2014) and FAO/WHO (2003)
145.1 (Israel, 2012–2014)
0
Tobacco use TOB Per capita cigarettes consumption (number/person/year) Ng et al. (2012) 3,385 (Cyprus, 2012) 0
a15+ = person aged 15 or older.b2012–2014 = three years average.cDES = Dietary Energy Supply; ADER = Average Dietary Energy Requirement.dAFPS = Average fat and protein supply; RFPI = Recommended fat and protein intake.
doi:10.1371/journal.pone.0141834.t001
The Unhealthy Behaviour Index
PLOS ONE | DOI:10.1371/journal.pone.0141834 October 29, 2015 3 / 14
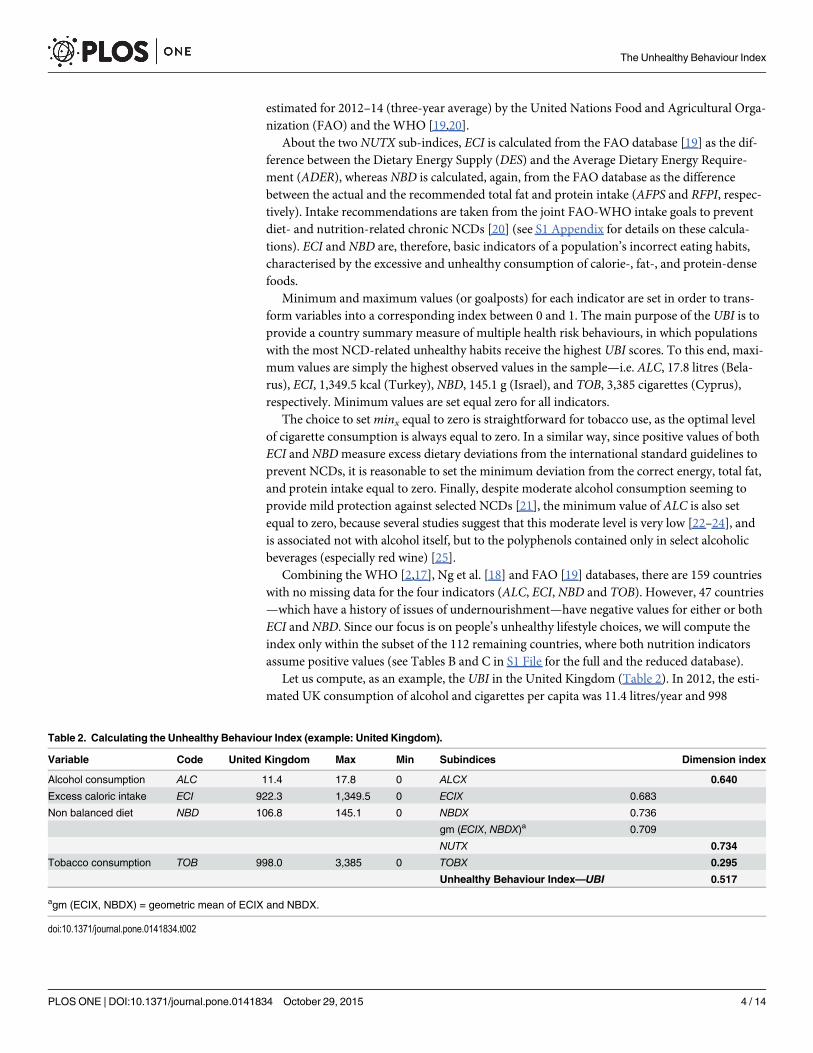
estimated for 2012–14 (three-year average) by the United Nations Food and Agricultural Orga-nization (FAO) and the WHO [19,20].
About the two NUTX sub-indices, ECI is calculated from the FAO database [19] as the dif-ference between the Dietary Energy Supply (DES) and the Average Dietary Energy Require-ment (ADER), whereas NBD is calculated, again, from the FAO database as the differencebetween the actual and the recommended total fat and protein intake (AFPS and RFPI, respec-tively). Intake recommendations are taken from the joint FAO-WHO intake goals to preventdiet- and nutrition-related chronic NCDs [20] (see S1 Appendix for details on these calcula-tions). ECI and NBD are, therefore, basic indicators of a population’s incorrect eating habits,characterised by the excessive and unhealthy consumption of calorie-, fat-, and protein-densefoods.
Minimum and maximum values (or goalposts) for each indicator are set in order to trans-form variables into a corresponding index between 0 and 1. The main purpose of the UBI is toprovide a country summary measure of multiple health risk behaviours, in which populationswith the most NCD-related unhealthy habits receive the highest UBI scores. To this end, maxi-mum values are simply the highest observed values in the sample—i.e. ALC, 17.8 litres (Bela-rus), ECI, 1,349.5 kcal (Turkey), NBD, 145.1 g (Israel), and TOB, 3,385 cigarettes (Cyprus),respectively. Minimum values are set equal zero for all indicators.
The choice to setminx equal to zero is straightforward for tobacco use, as the optimal levelof cigarette consumption is always equal to zero. In a similar way, since positive values of bothECI and NBDmeasure excess dietary deviations from the international standard guidelines toprevent NCDs, it is reasonable to set the minimum deviation from the correct energy, total fat,and protein intake equal to zero. Finally, despite moderate alcohol consumption seeming toprovide mild protection against selected NCDs [21], the minimum value of ALC is also setequal to zero, because several studies suggest that this moderate level is very low [22–24], andis associated not with alcohol itself, but to the polyphenols contained only in select alcoholicbeverages (especially red wine) [25].
Combining the WHO [2,17], Ng et al. [18] and FAO [19] databases, there are 159 countrieswith no missing data for the four indicators (ALC, ECI, NBD and TOB). However, 47 countries—which have a history of issues of undernourishment—have negative values for either or bothECI and NBD. Since our focus is on people’s unhealthy lifestyle choices, we will compute theindex only within the subset of the 112 remaining countries, where both nutrition indicatorsassume positive values (see Tables B and C in S1 File for the full and the reduced database).
Let us compute, as an example, the UBI in the United Kingdom (Table 2). In 2012, the esti-mated UK consumption of alcohol and cigarettes per capita was 11.4 litres/year and 998
Table 2. Calculating the Unhealthy Behaviour Index (example: United Kingdom).
Variable Code United Kingdom Max Min Subindices Dimension index
Alcohol consumption ALC 11.4 17.8 0 ALCX 0.640
Excess caloric intake ECI 922.3 1,349.5 0 ECIX 0.683
Non balanced diet NBD 106.8 145.1 0 NBDX 0.736
gm (ECIX, NBDX)a 0.709
NUTX 0.734
Tobacco consumption TOB 998.0 3,385 0 TOBX 0.295
Unhealthy Behaviour Index—UBI 0.517
agm (ECIX, NBDX) = geometric mean of ECIX and NBDX.
doi:10.1371/journal.pone.0141834.t002
The Unhealthy Behaviour Index
PLOS ONE | DOI:10.1371/journal.pone.0141834 October 29, 2015 4 / 14
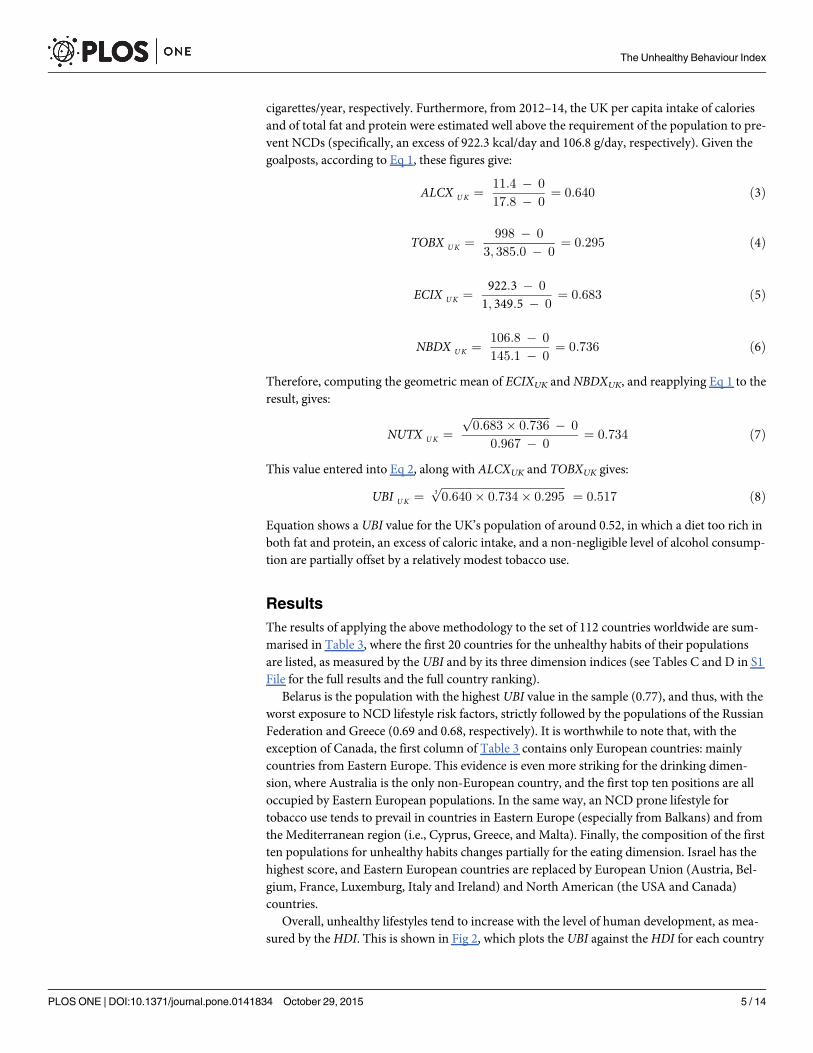
cigarettes/year, respectively. Furthermore, from 2012–14, the UK per capita intake of caloriesand of total fat and protein were estimated well above the requirement of the population to pre-vent NCDs (specifically, an excess of 922.3 kcal/day and 106.8 g/day, respectively). Given thegoalposts, according to Eq 1, these figures give:
ALCX UK ¼ 11:4 � 0
17:8 � 0¼ 0:640 ð3Þ
TOBX UK ¼ 998 � 0
3; 385:0 � 0¼ 0:295 ð4Þ
ECIX UK ¼ 922:3 � 0
1; 349:5 � 0¼ 0:683 ð5Þ
NBDX UK ¼ 106:8 � 0
145:1 � 0¼ 0:736 ð6Þ
Therefore, computing the geometric mean of ECIXUK and NBDXUK, and reapplying Eq 1 to theresult, gives:
NUTX UK ¼ffiffiffiffiffiffiffiffiffiffiffiffiffiffiffiffiffiffiffiffiffiffiffiffiffiffiffiffi
0:683� 0:736p � 0
0:967 � 0¼ 0:734 ð7Þ
This value entered into Eq 2, along with ALCXUK and TOBXUK gives:
UBI UK ¼ffiffiffiffiffiffiffiffiffiffiffiffiffiffiffiffiffiffiffiffiffiffiffiffiffiffiffiffiffiffiffiffiffiffiffiffiffiffiffiffiffiffiffiffiffi
0:640� 0:734� 0:2953p
¼ 0:517 ð8ÞEquation shows a UBI value for the UK’s population of around 0.52, in which a diet too rich inboth fat and protein, an excess of caloric intake, and a non-negligible level of alcohol consump-tion are partially offset by a relatively modest tobacco use.
ResultsThe results of applying the above methodology to the set of 112 countries worldwide are sum-marised in Table 3, where the first 20 countries for the unhealthy habits of their populationsare listed, as measured by the UBI and by its three dimension indices (see Tables C and D in S1File for the full results and the full country ranking).
Belarus is the population with the highest UBI value in the sample (0.77), and thus, with theworst exposure to NCD lifestyle risk factors, strictly followed by the populations of the RussianFederation and Greece (0.69 and 0.68, respectively). It is worthwhile to note that, with theexception of Canada, the first column of Table 3 contains only European countries: mainlycountries from Eastern Europe. This evidence is even more striking for the drinking dimen-sion, where Australia is the only non-European country, and the first top ten positions are alloccupied by Eastern European populations. In the same way, an NCD prone lifestyle fortobacco use tends to prevail in countries in Eastern Europe (especially from Balkans) and fromthe Mediterranean region (i.e., Cyprus, Greece, and Malta). Finally, the composition of the firstten populations for unhealthy habits changes partially for the eating dimension. Israel has thehighest score, and Eastern European countries are replaced by European Union (Austria, Bel-gium, France, Luxemburg, Italy and Ireland) and North American (the USA and Canada)countries.
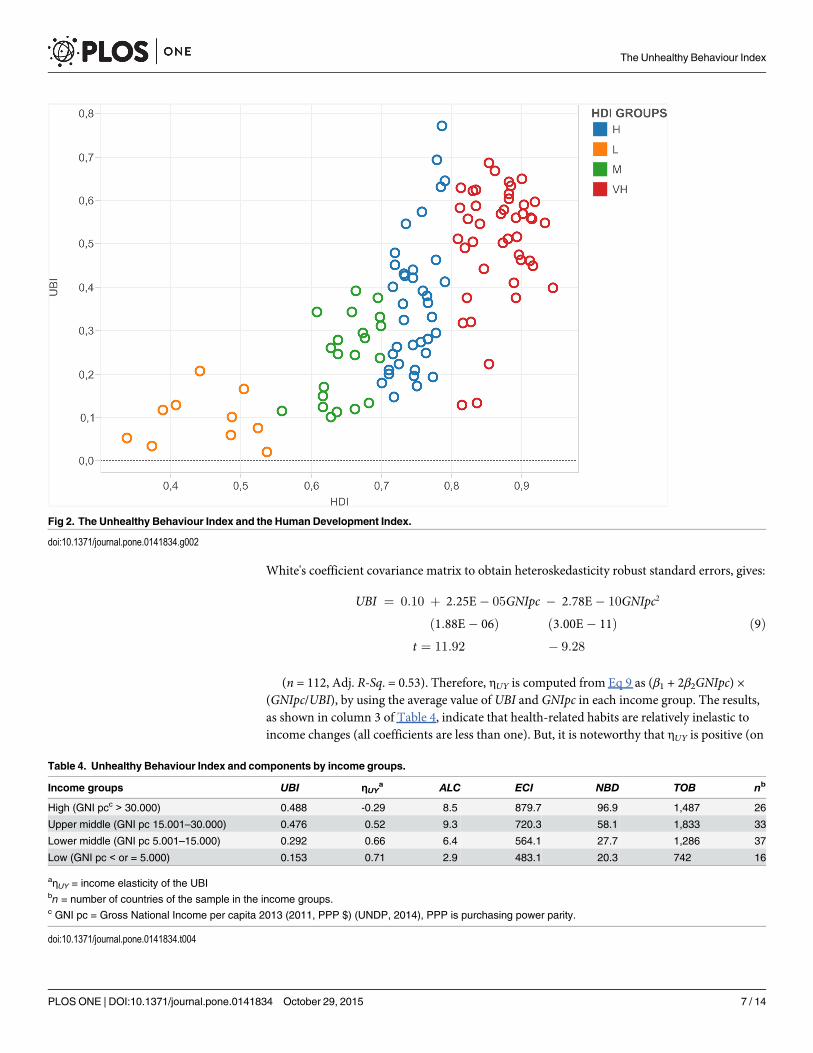
Overall, unhealthy lifestyles tend to increase with the level of human development, as mea-sured by theHDI. This is shown in Fig 2, which plots the UBI against theHDI for each country
The Unhealthy Behaviour Index
PLOS ONE | DOI:10.1371/journal.pone.0141834 October 29, 2015 5 / 14

in the sample. There is a clear positive relationship between the average levels of human devel-opment and unhealthy habits. However, by classifying countries according to their HDI intothe four main UNDP’s groups (i.e., very high, high, medium and lowHDI) [26], it is interestingto note that, in medium, and especially in high and very highHDI countries, the relationshipbetween UBI and HDI tends to become nearly vertical. In other words, the same level ofhuman development may be associated with very different kinds of NCD-related lifestyles.
A fundamental component of the HDI is the income per capita (Y), usually measured by theGross National Income per person (GNIpc, in PPP $ [26]). Table 4 shows the average value ofthe UBI and its components when countries are classified according to their per capita incomelevel. On average, the UBImore than triples in ‘rich’ countries (i.e., with a GNIpc greater than$30,000) with respect to the poorest one (where the GNIpc is less than $5,000): 0.48 and 0.15,respectively. However, the upper-middle (i.e., with a GNIpc between $15,001 and $30,000) andhigh-income countries show around the same unhealthy outcome, with better performance ofthe latter for the drinking and, especially, smoking dimensions. On the contrary, the excess ofboth energy and total fat-protein intake always increases from low to high income countries.
The relationship between economic development and unhealthy habits can be furtherexamined by computing the elasticity of the UBI with respect to income per capita—i.e. ηUY =(dUBI/dY) × (Y/UBI)—which measures the percentage change of the UBI when incomechanges by 1 percent. The result of the computation may help to understand and measure theimpact of economic growth on health-related lifestyles. To do this, we regress GNIpc on UBIwith a simple quadratic model (UBI = β0 + β1GNIpc + β2GNIpc
2 + ε) that, estimated using
Table 3. Ranking of the first ten countries byUBI and dimension indices.
Country UBI Country ALCX Country NUTX Country TOBX
1 Belarus 0.773 Belarus 1.000 Israel 1.000 Cyprus 1.000
2 Russian Fed. 0.694 Lithuania 0.949 Austria 0.954 Malta 0.961
3 Greece 0.687 Moldova 0.904 United States 0.919 Belarus 0.856
4 Czech Rep. 0.668 Russian Fed. 0.831 Belgium 0.917 Russian Fed. 0.838
5 Ireland 0.651 Czech Rep. 0.787 France 0.874 Croatia 0.819
6 Montenegro 0.647 Ukraine 0.787 Canada 0.837 Moldova 0.816
7 Austria 0.644 Romania 0.742 Luxembourg 0.827 Lebanon 0.804
8 France 0.634 Croatia 0.730 Montenegro 0.822 Greece 0.803
9 Romania 0.633 Slovakia 0.702 Italy 0.821 St. Vincenta 0.795
10 Croatia 0.630 Hungary 0.697 Ireland 0.800 Bosnia-Herz. 0.788
11 Lithuania 0.626 France 0.691 Greece 0.780 Macedonia 0.748
12 Malta 0.624 Serbia 0.691 Norway 0.776 Slovakia 0.716
13 Luxembourg 0.615 Portugal 0.685 Iceland 0.775 Montenegro 0.673
14 Belgium 0.606 Latvia 0.674 Turkey 0.772 Serbia 0.672
15 Switzerland 0.599 Australia 0.669 Germany 0.751 Armenia 0.664
16 Canada 0.590 Luxembourg 0.669 Portugal 0.746 Estonia 0.661
17 Poland 0.589 Finland 0.657 Switzerland 0.738 Korea Rep. 0.646
18 Latvia 0.584 Poland 0.652 United Kingdom 0.734 Czech Rep. 0.625
19 Slovenia 0.579 Germany 0.646 Australia 0.702 Uruguay 0.610
20 Kazakhstan 0.574 United Kingdom 0.640 Lithuania 0.695 Ireland 0.608
a Saint Vincent and the Grenadines
doi:10.1371/journal.pone.0141834.t003
The Unhealthy Behaviour Index
PLOS ONE | DOI:10.1371/journal.pone.0141834 October 29, 2015 6 / 14
White's coefficient covariance matrix to obtain heteroskedasticity robust standard errors, gives:
UBI ¼ 0:10 þ 2:25E� 05GNIpc � 2:78E� 10GNIpc2
ð1:88E� 06Þ ð3:00E� 11Þt ¼ 11:92 � 9:28
ð9Þ
(n = 112, Adj. R-Sq. = 0.53). Therefore, ηUY is computed from Eq 9 as (β1 + 2β2GNIpc) ×(GNIpc/UBI), by using the average value of UBI and GNIpc in each income group. The results,as shown in column 3 of Table 4, indicate that health-related habits are relatively inelastic toincome changes (all coefficients are less than one). But, it is noteworthy that ηUY is positive (on
Fig 2. The Unhealthy Behaviour Index and the Human Development Index.
doi:10.1371/journal.pone.0141834.g002
Table 4. Unhealthy Behaviour Index and components by income groups.
Income groups UBI ηUYa ALC ECI NBD TOB nb
High (GNI pcc > 30.000) 0.488 -0.29 8.5 879.7 96.9 1,487 26
Upper middle (GNI pc 15.001–30.000) 0.476 0.52 9.3 720.3 58.1 1,833 33
Lower middle (GNI pc 5.001–15.000) 0.292 0.66 6.4 564.1 27.7 1,286 37
Low (GNI pc < or = 5.000) 0.153 0.71 2.9 483.1 20.3 742 16
aηUY = income elasticity of the UBIbn = number of countries of the sample in the income groups.c GNI pc = Gross National Income per capita 2013 (2011, PPP $) (UNDP, 2014), PPP is purchasing power parity.
doi:10.1371/journal.pone.0141834.t004
The Unhealthy Behaviour Index
PLOS ONE | DOI:10.1371/journal.pone.0141834 October 29, 2015 7 / 14
average, 0.6) for populations with per capita income less than $30,000, decreases from 0.7 to0.5 as income rises from $5,000 to $30,000 per capita, and becomes negative (on average, -0.3)in high income countries. In other words, sustained increases in income per capita may pushpopulations toward more either unhealthy or healthy habits. However, both the direction andmagnitude of these changes depend on the country’s level of economic development. Finally,by setting the first derivative of Eq 9 equal to zero and solving for GNIpc, we can find anincome turning point of about $40,500. This is the threshold income level beyond which ηUYchanges its sign, and economic growth starts exerting a positive effect on people’s NCD-relatedlifestyles.
DiscussionWithin a simple model of consumer behaviour, these empirical findings may help to betterunderstand the channels through which economic growth and human development affect theincidence of NCDs in both advanced and emerging countries. Thus, in this section, we presentan economic framework to ground our empirical work and discuss its implications for the epi-demiology of NCDs.
In order to capture people’s exposure to lifestyle risk factors, one may consider an NCD-related consumption bundle in which each item is described by the list of its healthy andunhealthy characteristics. The whole set of these characteristics determines a more or a lessrisk prone lifestyle. To simplify, let us consider a representative market basket composed ofhealthy goods (h, such as fruits and vegetables) and unhealthy goods (u, such as high-fat andcalorie-dense foods) [27].
Both kinds of goods yield immediate satisfaction, but exert opposite effects on future healthoutcomes. A main feature of NCD epidemiology is the delay between illness onset and theexposure to risk factors. That is, today’s incidence rate is affected by yesterday’s exposure, andtoday’s exposure will affect tomorrow’s incidence rate. Consuming h and u increases today’sutility. However, utility from u comes at a price of a greater exposure to NCD risk factors, andthus, of a greater likelihood to develop one or more NCDs in the future (and vice versa for h,whose consumption gives utility today and protects from NCDs, providing future health bene-fits) [28].
At any given time, the individual’s preferences for h and u can be usefully described by anindifference map (as shown in Fig 3). Each indifference curve (I1, I2, I3 and I4) represents allcombinations of h and u that yields the same level of ‘today’s utility’ (i.e., satisfaction in the cur-rent period). Because both more h and umake the individual better off today, indifferencecurves are downward sloping, and the further the curves are from the origin, the greater is thelevel of satisfaction that they represent [27].
At a low level of utility, however, indifference curves (such as I1) are nearly right angles; thatis, people are ‘too poor’ to be able to choose between h and u. In these contexts, where a con-sumption bundle, such as E, is the one that is affordable to the majority of the population, ana-lysing unhealthy behaviours is somewhat inappropriate. This is why the UBI is computed bydeleting all the poorest countries from the sample. In other words, our analysis applies to socie-ties with medium, high or very high levels of human development. Indeed, in each subset ofthese countries (as clearly shown in Fig 2), the same level of human development is associatedwith very different UBI values. This means that, moving away from the origin in Fig 3, indiffer-ence curves become flatter (such as I2 or I3), and people may exert some degree of freedom ontheir health-related habits. At these corresponding level of utility, consumers are relatively freeto choose between different consumption bundles (such as F or G, on I3), all of which representa more healthy or unhealthy lifestyle, respectively.
The Unhealthy Behaviour Index
PLOS ONE | DOI:10.1371/journal.pone.0141834 October 29, 2015 8 / 14

In this simplified model, people’s exposure to NCD lifestyle risk factors depends on con-sumption choices of h and u. These kinds of choices, in turn, depend not only on preferences,but also on budget constraints, i.e. on average income (Y) and goods prices (ph and pu). This isshown in Fig 4, where each straight line (B2, B3 and B4) indicates which consumption bundlesare affordable at different income levels. If Y = Y2, for example, B2 shows all feasible quantitiesof h and u for which—given ph and pu—total expenditure equals a consumer’s income (i.e., phh+ puu = Y2 or, rearranging, h = (Y2/ph)—(pu/ph)×u).
With a limited purchasing power, the consumer’s optimal bundle is the result of a con-strained optimisation problem: choosing the combination of h and u that yields the highestutility, given the restrictions imposed by income and prices. For a given constraint, such as B2in Fig 4, the optimal bundle (h2, u2)—and thus, the more or less risk prone lifestyle—occurs atthe tangency between the budget line and the highest (i.e., further from the origin) indifferencecurve (point R).
The diminishing value of ηUY, reported in Table 4, finds a straightforward explanation inFig 4. Consumption patterns are characterised by a hierarchical structure, determined by theinterplay between biological, economic and social factors. Therefore, the demand for goods,such as h and u, does not expand proportionally with economic growth and human
Fig 3. Indifference curves for u and h.
doi:10.1371/journal.pone.0141834.g003
The Unhealthy Behaviour Index
PLOS ONE | DOI:10.1371/journal.pone.0141834 October 29, 2015 9 / 14

development. Above threshold levels of disposable income (such as Y3 or Y4, in Fig 4), peoplestart following new lifestyles, modifying accordingly their consumption patterns [29,30]. Spe-cifically, as income increases (for example, from Y2 to Y4), the budget constraint shifts outward(from B2 to B4). Consumers can reach indifference curves further from the origin and choosebetter (i.e., higher utility) consumption bundles such as (h3, u3) or (h4, u4).
The path connecting the utility-maximising bundles (points R, S, P in Fig 4) shows how con-sumers change their health-related behaviours as income increases, ceteris paribus. Thisincome-consumption curve (ICC) becomes steeper at higher levels of utility, showing that adecreasing proportion of income is spent on u (the demand for u increases, but less thanincome). According to our results, this is the case in low, middle and upper-middle incomecountries, where ηUY is less than one, and tends to diminish as income rises. Conversely, thebackward bending portion of ICC above point S indicates a shifting toward more healthy life-styles. This case applies to high income countries, where ηUY is negative; hence, u become aninferior good (that is, a good for which consumption decreases when income rises).
Fig 4. The income consumption curve for u and h.
doi:10.1371/journal.pone.0141834.g004
The Unhealthy Behaviour Index
PLOS ONE | DOI:10.1371/journal.pone.0141834 October 29, 2015 10 / 14
These findings may have several interesting implications for public health. The income elas-ticity of health outcomes (ηHY) is a frequently used metric to summarise the impact of eco-nomic growth on people’s health [31]. Specifically, ηHY is the percentage change in a givenmeasure of a population’s health status (H) divided by the percentage change in income percapita (Y). That is, (ΔH/H)/(ΔY/Y), or more usefully:
Z HY ¼ dHdY
� YH
ð10Þ
which gives the percentage change in health outcomes resulting from a 1% change in aver-age income. Now, let us denote with H the age-standardised incidence rate of the leadingNCDs. In any population, given the inborn characteristics of individuals (Z),H depends on atleast two fundamental factors: health care (HC) and health-related behaviours (HB) [32]. Thisrelationship between health inputs and outcome may be described by a ‘health productionfunction’ [33] as follows:
H ¼ f ðHC;HB;ZÞ ð11Þ
whereHC is a measure of the resources devoted to preventing NCDs, and HB is a summarymeasure of people’s exposure to NCD lifestyle risk factors.
In this paper, we focus on HB. For our purposes, both Z andHC can be treated as exogenousvariables of the model, whose value is taken as given. Thus, we can rewrite Eq 11 as a relationbetween incidence rate and health-related behaviours—i.e. H = f(HB)—holding all other fac-tors affecting H constant. Moreover, we are able to replace the generic HB variable with theUBI, and make the dependence of health-related lifestyles from income per capita explicit: UBI= g(Y). As a result, Eq 11 becomes:
H ¼ f ½gðYÞ� ð12Þ
This expression simply states that changes in income lead to changes in health-related hab-its; in turn, changes in health-related habits affect a population’s exposure to lifestyle risk fac-tors, and thus, lead to changes in health outcomes.
Finally, in order to measure the magnitudes of these changes [34], let us differentiateH withrespect to Y in Eq 12. By applying the chain rule, this gives:
dHdY
¼ dHdUBI
� dUBIdY
ð13Þ
Remembering (from Eq 10) that ηHY is dH/dYmultiplied by the income-health ratio (Y/H),and since Y/H can also be written as (Y/UBI) × (UBI/Y), after some manipulations, the expres-sion for ηHY becomes:
Z HY ¼ dHdUBI
UBIH
� dUBIdY
YUBI
ð14Þ
In Eq 14, the ‘reactivity’ of the NCD incidence rate to economic growth results from theproduct of two key factors: the elasticity of a population’s health status with respect to health-related lifestyles (ηHU) multiplied by the elasticity of a population’s health-related lifestyleswith respect to income per capita (that is, by the income elasticity of the UBI, ηUY):
Z HY ¼ ZHU � ZUY ð15Þ
It is worth noting that ηHU and ηUY are output and income elasticity, respectively. On theone hand, ηHU tells us how much H responds to a 1% change in the UBI. Its value is, therefore,
The Unhealthy Behaviour Index
PLOS ONE | DOI:10.1371/journal.pone.0141834 October 29, 2015 11 / 14

largely determined by the technical and biological constraints that characterise the health pro-duction process. On the other hand, ηUY tells us how much the UBI responds to a 1% change inY. Its value depends mainly on people’s preferences as consumers and citizens about health-related lifestyle choices; thus, it could be properly manipulated by public health preventionprogrammes.
As a result, to understand and predict, at a macroeconomic level, howHmay evolve in agrowing economy—given Z and HC–it is crucial to measure not only ηHU, but also ηUY, whichgives both the direction and magnitude of a population’s changes in health-related lifestyles inresponse to better living standards. In light of Eq 15, our results suggest that, other things beingequal, up to a per capita income of about $40,500 (i.e., an extremely high income level), eco-nomic growth tends to increase unhealthy habits. Therefore, albeit decreasing and less thanone, the positive value of ηUY for a large majority of countries strongly confirms the role of pri-mordial and primary prevention to reduce the incidence of NCDs throughout the world.
ConclusionsThe main purpose of this study was to describe a straightforward method for calculating, at amacroeconomic level, an index of NCD-related unhealthy behaviours. Despite its highly sim-plified nature, the UBI creates a meaningful country ranking and offers some insights into therelation between economic development and the incidence rate of the main NCDs. Our resultssuggest that a significant part of the world’s population still lives in regions where economicgrowth tends to push people toward ‘Westernised’, unhealthy behaviours, and, thus, supportsthe need for worldwide effective policy action to control lifestyle-related risk factors for NCDs.
Further research, however, needs to be done in order to develop a more comprehensivemeasure. The UBI suffers from a number of important limitations; it should be considered afirst attempt in this research line. Specifically, although data on alcohol consumption includeboth recorded and unrecorded (i.e., homemade alcohol, illegally produced or sold outside nor-mal government controls) alcohol [17], we do not distinguish between different alcoholic bev-erages or between moderate consumption and heavy episodic drinking. Similarly, data oncigarette consumption record manufactured and non-manufactured tobacco [18], but we donot consider that the total exposure to tobacco health risks is related to both intensity and prev-alence of smoking. Furthermore, a correct measure of eating habits, as noted in the Appendix,has to be based on more dietary characteristics and different nutrient intake besides calorie,total fat and protein consumption. Finally, and perhaps more crucially, working with averagecountry data fails to capture the key role of income inequality in health-related lifestyles withinpopulations.
Supporting InformationS1 Appendix. The nutrition dimension index (NUTX), containing Fig A ECI and obesityprevalence, and Fig B. NBD and obesity prevalence.(DOC)
S1 File. Data and results, containing Tables A, B, C, D and E. Table A, Source and shortdescription of each variable. Table B, Raw data (full database, with 159 countries). Table C,Indicators and indices (reduced database, with 112 countries). Table D, Country ranking.Table E, ECI, NBD and obesity.(XLS)
The Unhealthy Behaviour Index
PLOS ONE | DOI:10.1371/journal.pone.0141834 October 29, 2015 12 / 14
AcknowledgmentsThe author would like to thank the anonymous reviewers for their helpful and constructivecomments that greatly improved the final version of the paper. All remaining errors are myown.
Author ContributionsConceived and designed the experiments: FF. Performed the experiments: FF. Analyzed thedata: FF. Wrote the paper: FF.
References1. Bloom DE, Cafero ET, Jané-Llopis E, Abrahams-Gessel S, Bloom LR, Fathima S, et al. The global eco-
nomic burden of non-communicable diseases. Geneva: World Economic Forum and Harvard Schoolof Public Health; 2011.
2. WHO. Global status report on non-communicable diseases. Geneva: World Health Organization;2014.
3. Suhrcke M, Nugent RA, Stuckler D, Lorenzo R. Chronic disease: An economic perspective. London:Oxford Health Alliance; 2006.
4. WHO. Globalisation, diets, and NCDs. Geneva: World Health Organization; 2002.
5. WHO. Global strategy on diet, physical activity and health. Geneva: World Health Organization; 2004.
6. NCD Alliance. Annual report 2014–2015. Geneva: Non-Communicable Diseases Alliance; 2015.
7. WHO. Preventing chronic diseases: A vital investment. Geneva: World Health Organization; 2005.
8. Bonita R, Beaglehole R, Kjellström T. Basic epidemiology. 2nd ed. Geneva: World Health Organiza-tion; 2006.
9. Ezzati M, Riboli E. Can non-communicable diseases be prevented? Lessons from studies of popula-tions and individuals. Science. 2012; 337(6101): 1482–1487.
10. Kontis V, Mathers CD, Rehm J, Stevens GA, Shield KD, Bonita R, et al. Contribution of six risk factorsto achieving the 25×25 non-communicable disease mortality reduction target: A modelling study. TheLancet. 2014; 384(9941): 427–437. doi: 10.1016/S0140-6736(14)60616-4
11. Loef M, Walach H. The combined effects of healthy lifestyle behaviours on all cause mortality: A sys-tematic review and meta-analysis. Preventive Medicine. 2012; 55(3): 163–170. doi: 10.1016/j.ypmed.2012.06.017 PMID: 22735042
12. Ding D, Do A, Schmidt H-M, Bauman AE. A widening gap? Changes in multiple lifestyle risk behavioursby socioeconomic status in New South Wales, Australia, 2002–2012. PLoS ONE. 2015; 10(8):e0135338. doi: 10.1371/journal.pone.0135338 PMID: 26291457
13. UNDP. Human development report 2013 –Technical notes. New York: United Nations DevelopmentProgramme; 2013.
14. OECD. Handbook on constructing composite indicators. Paris: Organisation for Economic Co-opera-tion and Development; 2005.
15. WHO. Global health risk. Mortality and burden of disease attributable to selected major risks. Geneva:World Health Organization; 2009.
16. Klugman J, Rodríguez F, Choi H-J. The HDI 2010: New controversies, old critiques. Human Develop-ment Reports; 1 April 2011.
17. WHO. Global status report on alcohol and health, 2014. Geneva: World Health Organization; 2014.
18. NgM, Freeman MK, Fleming TD, Robinson M, Dwyer-Lindgren L, Thomson B, et al. Smoking preva-lence and cigarette consumption in 187 countries, 1980–2012. JAMA. 2014; 311(2): 183–192. doi: 10.1001/jama.2013.284692 PMID: 24399557
19. FAO. Food and nutrition in numbers, 2014. Rome: Food and Agriculture Organization of the UnitedNations; 2014.
20. FAO, WHO. Diet, nutrition and the prevention of chronic diseases. Geneva: World Health Organiza-tion; 2003.
21. Ronksley PE, Brien SE, Turner BJ, Kenneth J Mukamal KJ, Ghaly WA. Association of alcohol con-sumption with selected cardiovascular disease outcomes: A systematic review and meta-analysis. Brit-ish Medical Journal. 2011; 342(22): 671–671. doi: 10.1136/bmj.d671
The Unhealthy Behaviour Index
PLOS ONE | DOI:10.1371/journal.pone.0141834 October 29, 2015 13 / 14
22. WCRF/AICRWorld Cancer Research Fund and American Institute for Cancer Research. Food, nutri-tion, physical activity, and the prevention of cancer: A global perspective. Washington, DC: AICR;2007.
23. Schutze M, Boeing H, Pischon T, Rehm J, Kehoe T, Gmel G, et al. Alcohol attributable burden of inci-dence of cancer in eight European countries based on results from prospective cohort study. BritishMedical Journal. 2011; 342(7); 1584–d1584. doi: 10.1136/bmj.d1584
24. Nichols M, Scarborough P, Allender S, Rayner M. What is the optimal level of population alcohol con-sumption for chronic disease prevention in England? Modelling the impact of changes in average con-sumption levels. British Medical Journal. 2012; 2(3): 957. doi: 10.1136/bmjopen-2012-000957
25. Arranz S, Chiva-Blanch G, Valderas-Martínez P, Medina-Remón A, Lamuela-Raventós RM, Estruch R.Wine, beer, alcohol and polyphenols on cardiovascular disease and cancer. Nutrients. 2012; 4(7):759–781. doi: 10.3390/nu4070759 PMID: 22852062
26. UNDP. Human development report, 2014. New York: United Nations Development Programme; 2014.
27. Auld MC, Powell LM. Economics of food energy density and adolescent body weight. Economica.2009; (76: ): 719–740. doi: 10.1111/j.1468-0335.2008.00709.x
28. Forster M. The meaning of death: Some simulations of a model of healthy and unhealthy consumption.Journal of Health Economics. 2001; 20(4): 613–638. doi: 10.1016/s0167-6296(01)00080-7 PMID:11463191
29. Argyrous G. Endogenous demand in the theory of transformational growth. In: Setterfield M, editor. Theeconomics of demand-led growth. New York: Edward Elgar; 2002.
30. Kearney J. Food consumption trends and drivers. Philosophical Transactions of the Royal Society B:Biological Sciences. 2010; 365(1554): 2793–2807. doi: 10.1098/rstb.2010.0149
31. Bishai D, O’Neil J. Economic growth and better health: The UK’s surprising progress. The Lancet.2012; 380: 649. doi: 10.1016/S0140-6736(12)61370-1
32. Folland S, Goodman AC, Stano M. The economics of health and health care. 7th ed. New York: Pren-tice Hall; 2012.
33. Sloan FA, Hsieh CR. Health economics. Cambridge: MIT Press; 2012.
34. Cohen IK, Ferretti F, McIntosh B. A simple framework for analysing the impact of economic growth onnon-communicable diseases. Cogent Economics & Finance. 2015; 3: 1045215. doi: 10.1080/23322039.2015.1045215
The Unhealthy Behaviour Index
PLOS ONE | DOI:10.1371/journal.pone.0141834 October 29, 2015 14 / 14