unfulfilled expectations? the returns to international hedge fund activism marco becht solvay...
TRANSCRIPT

Unfulfilled Expectations? The Returns to International Hedge Fund Activism
Marco BechtSolvay Brussels School, Université Libre de Bruxelles, CEPR and ECGI
Julian FranksLondon Business School, CEPR and ECGI
Jeremy GrantUniversity of Cambridge
December 2011

1. Introduction

Hedge Fund Activism Country Studies: Disclosure & Buy and Hold Returns
United States• Brav, Jiang, Partnoy and Thomas (2008), JF
– 2001-2006 : 236 activist hedge funds, 882 unique targets, 1059 events
• Greenwood and Schor (2008) JFE– 1994-2006 : 177 activist funds, 990 events
• Klein and Zur (2008), Clifford (2008), Boyson & Mooradin (2007)
Japan• Hamao, Kenji, Matos (2010)
– 1998-2009 : 34 activist funds, 916 investments• Uchida and Zu (2008) 41 interventions of two aggressive funds
Germany• Achleitner et. al. (2010)
– 1998-2007 : all hedge funds, 96 investments
© 2011 Marco Becht, Julian Franks, Jeremy Grant

Clinical Studies of Private Activism
United States• Carleton, Nelson and Weisbach (1998), JF
– TIAA-CREF letter writing campaign
United Kingdom• Becht, Franks, Mayer, Rossi (2009), RFS
– Clinical study of the Hermes U.K. Focus Fund
© 2011 Marco Becht, Julian Franks, Jeremy Grant

This Study
• Estimates disclosure, outcome & buy and hold returns for a large sample of activist interventions
• Compares returns from public versus private activism (Europe only)
• Jurisdiction effects (not explored yet)
© 2011 Marco Becht, Julian Franks, Jeremy Grant

Two Hand-Collected Datasets
• Public Engagements Database• January 1997 to December 2008
15 European countries 3 Asian countries (Japan, South Korea, Hong Kong) North America (Canada and the United States)
• Proprietary Fund Databaseo information on public and private engagementso Five funds included at the moment [but only to end 2007]o 57 private and 74 public engagements
© 2011 Marco Becht, Julian Franks, Jeremy Grant

Public Database Coverage
• Europe– 1997-2009 : 409 cases
• Asia– 2000-2009 : 210 cases
• North America– 1997-2009 : 1267
© 2011 Marco Becht, Julian Franks, Jeremy Grant

International Public Activism Cases Initiated
© 2011 Marco Becht, Julian Franks, Jeremy Grant

Average Stake Size
© 2011 Marco Becht, Julian Franks, Jeremy Grant
Europe Asia US0.00%
2.00%
4.00%
6.00%
8.00%
10.00%
12.00%
14.00%
6.2%
7.3%6.3%*
10.7%
12.2%
9.1%*
* US stakes from Brav et al (2009)

Average Holding Period (Days)
Europe Asia US0
100
200
300
400
500
600
700
800
900
1000
752
870
731
514
805
462 MeanMedian
© 2011 Marco Becht, Julian Franks, Jeremy Grant

2. Public Database Results

1
Abnormal Returns around Activist Block Acquisition Disclosure
[-20,20 days]
1 : 5%+ block disclosed
© 2011 Marco Becht, Julian Franks, Jeremy Grant
Timeline

1 2 2
Abnormal Returns around Disclosure of Activist Outcomes
[-20,20] [-20,20]
2 : engagement outcomes linked to activism
© 2011 Marco Becht, Julian Franks, Jeremy Grant
Timeline

1 2 2 3
Buy & Hold Returns (pre-transactions costs)
Disclosure CAR
Holding Period BHAR
Exit
© 2011 Marco Becht, Julian Franks, Jeremy Grant
Timeline

Abnormal Returns Around Activist Block Acquisition Disclosure - Date 1
Country Study Number of Events \ Period CAR
United States Brav et. al. (2008) 1,059 targets2001-2006
7.2%[-20,+20]
United States Greenwood and Schor (2008)
980 targets1993-2006
3.6%[-10,+5]
Japan Hamao, Kenji and Matos (2010)
916 targets1998-2009
1.8%[-5,+5]
© 2011 Marco Becht, Julian Franks, Jeremy Grant

Date 1: Block Disclosure CARs by Region and Fund Style:
N CAR[-10,10]
CAR[-20,20]
Europe 405 Mean 4.0%*** 4.4%***
Asia 210 Mean 7.0%*** 7.62%***
North America
1,212 Mean 6.6%*** 6.4%***
1997 - 2009, Benchmark MSCI Country Indices
N CAR[-10,10]
CAR[-20,20]
All 1,827 Mean 6.1%*** 6.3%***
Activist 1,379 Mean 6.3%*** 7.1%***
Other 448 Mean 5.5%*** 3.8%**
© 2011 Marco Becht, Julian Franks, Jeremy Grant

Date 1: European and Asian Block Disclosure CARs by Engagement Approach (where known):
N CAR[-10,10]
CAR[-20,20]
Hostile 296 Mean 4.9%*** 6.2%***
Cooperative 67 Mean 2.6%** 3.9%**
1997 - 2009, Benchmark MSCI Country Indices
© 2011 Marco Becht, Julian Franks, Jeremy Grant
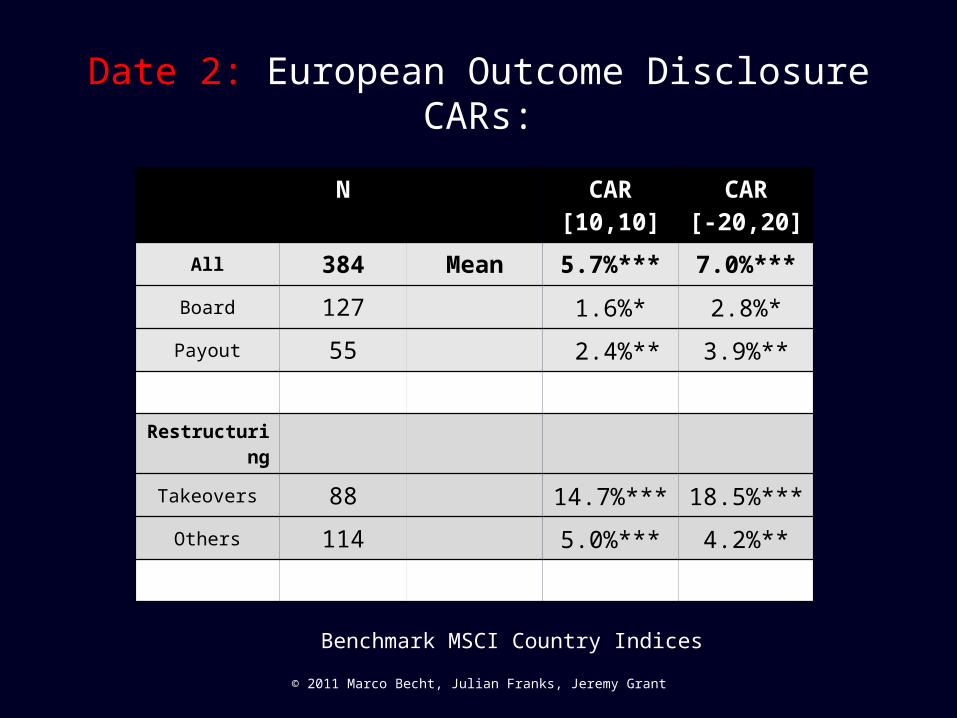
Date 2: European Outcome Disclosure CARs:
N CAR[10,10]
CAR[-20,20]
All 384 Mean 5.7%*** 7.0%***
Board 127 1.6%* 2.8%*
Payout 55 2.4%** 3.9%**
Restructuring
Takeovers 88 14.7%*** 18.5%***
Others 114 5.0%*** 4.2%**
© 2011 Marco Becht, Julian Franks, Jeremy Grant
Benchmark MSCI Country Indices

Date 2: Asian Outcome Disclosure CARs:
N CAR[-10,10]
CAR[-20,20]
All 67 Mean 3.3%** 3.5%**
Board 16 -1.3% 0.7%
Payout 28 4.7%** 4.2%**
Restructuring
Takeovers 7 6.4%* 4.8%
Others 16 4.2%** 4.3%**
© 2011 Marco Becht, Julian Franks, Jeremy Grant
Benchmark MSCI Country Indices

Date 2: US Outcome Disclosure CARs:
N CAR[-10,10]
CAR[-20,20]
All 864 Mean 4.9%*** 5.1%***
Board 316 2.0%* 1.5%
Payout 210 1.5%* 1.2%
Restructuring
Takeovers 204 14.3%** 16.4%**
Others 134 2.7%* 2.4%
© 2011 Marco Becht, Julian Franks, Jeremy Grant
Benchmark MSCI Country Indices

Dates 1 – 3: Buy and Hold Returns – Public Database
1997 - 2009, Benchmark MSCI Country Indices
Region (N) 1997 to 2009
BH Raw BHR CAR
Asia (210) 1.9% 8.0%
Europe (355) 33.3% 21.0%
North America (1,208) 20.7% 11.2%
Total (1,773) 21.0%*** 13.9%***
© 2011 Marco Becht, Julian Franks, Jeremy Grant

2 4 4
3
6
Decomposition of Holding Period Returns
[-20,20] [-20,20][-20,20]
In CAR Sum Out CAR
Holding Period BHAR
© 2011 Marco Becht, Julian Franks, Jeremy Grant

Decomposition of Buy and Hold Abnormal Returns: 2000 - 2009
N Mean BHAR
Disclosure CAR
Sum Outcome
CAR
Europe All 298 20.2%*** 5.4%*** N.A.
With Outcomes
No Outcomes
154
144
26.6%***
13.4%*
5.7%***
4.9%**
17.2%***
0.0
N Mean BHAR
Disclosure CAR
Sum Outcome
CAR
Asia All 200 9.0%*** 9.0%*** N.A.
With Outcomes
No Outcomes
33
167
39.2%***
2.9%
21.5%***
4.4%***
6.8%*
0.0
© 2011 Marco Becht, Julian Franks, Jeremy Grant

Decomposition of Buy and Hold Abnormal Returns
N Mean BHAR
Disclosure CAR
Outcome CAR
US All 936 12.2%*** 6.2%*** N.A.
With Outcomes
No Outcomes
494
442
16.2%***
7.7%*
7.5%***
4.8***
8.7%***
0.0%
© 2011 Marco Becht, Julian Franks, Jeremy Grant

European Fund Database Results

1 3 3 3 4
2 : Mandatory Disclosure (?) 3 : outcomes linked to activism 4: position closed
Proprietary Data: Fully Observed Private Engagement
2
1 : 1st share purchase
© 2011 Marco Becht, Julian Franks, Jeremy Grant

Dates 1 to 4: Fund Database Buy and Hold Returns
Engagements 1997 to 2008
Annualised
N=131 BHR Raw BHR CAR Ann. BHR Raw
Ann. BHR AR
Mean 24.8%*** 8.3%** 11.9%*** 4.0%*
Private 22.5%* 10.0% 14.8%** 6.2%
Public 26.5%** 6.9% 9.6%* 2.1%
© 2011 Marco Becht, Julian Franks, Jeremy Grant

Date 3: Fund Database Outcome Disclosure CARs:
N CAR[-10,10]
CAR[-20,20]
All 319 Mean 3.2%*** 5.0%***
Board 88 1.4% 2.9%**
Payout 42 3.0%** 4.6%***
Restructuring 189 4.0%*** 6.0%***
of which
Takeovers 20 14.4%*** 18.3%***
Others 169 2.8%*** 4.5%***
© 2011 Marco Becht, Julian Franks, Jeremy Grant
Private 124 Mean 5.4%*** 8.3%***
Public 195 1.7%** 2.9%***

Conclusions
• Activism is profitable for target shareholders (but more sophisticated benchmarks required).
• For fund shareholders (gross vs net of fees)?• Takeovers more profitable than restructuring but
still significant?• Private similar in profitability to public
engagements • Specialist funds do better than non specialist
(on disclosure) • Does jurisdiction matter? To be explored
© 2011 Marco Becht, Julian Franks, Jeremy Grant

Disclaimer
This presentation does not provide investment advice nor recommendations to buy or sell securities. The public database
results presented from Becht, Franks and Grant (2010) are based on public information only. No guarantee is given as to
the accuracy of information collected from public sources.
The authors are not liable for any errors, inaccuracies or omissions in content, or for any actions taken in reliance thereon.
The copyright owners of the presentation are the authors. It may not be reproduced, redistributed, passed to any other person or
published, in whole or in part, in any format, for any purpose,
without prior written consent.