unep collaborating centre on energy and environment sustainable development and climate change...
Post on 19-Dec-2015
214 views
TRANSCRIPT

UNEP Collaborating Centre on Energy and Environment
Sustainable Development and Climate Sustainable Development and Climate Change Policies in Developing Countries Change Policies in Developing Countries
Kirsten Halsnæs

UNEP Collaborating Centre on Energy and Environment
The growth of CO2 emissions from developing countries

UNEP Collaborating Centre on Energy and Environment

UNEP Collaborating Centre on Energy and Environment
IPCC Conclusions
• CC is part of a larger challenge of SD.
• CC policies are more effective when embedded in broader development strategies.
• SD policies affect the potential and costs of CC policies
• SD can be used as a framework for understanding society’s ability to respond to CC impacts (adaptation and mitigation), but more work is needed to understand and assess the capacity for policy implementation.

UNEP Collaborating Centre on Energy and Environment
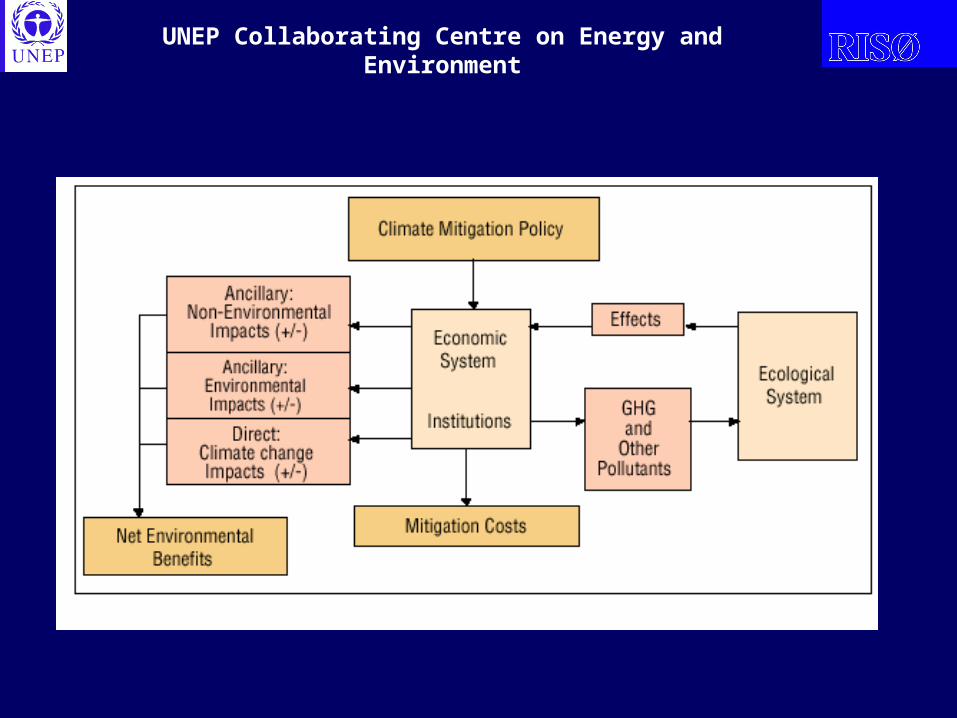
Conceptual Basis of SD and CC Studies
The capacity for policy implementation depends on:
• Manmade capital: Production technologies in manufacture, energy systems, land use sectors, transport.
• Natural capital: Energy sources, forestry, soil quality, ecological systems.
• Human capital: Educational level and professional skills.
• Social capital: Institutions, information sharing systems, government regulation, property rights, trust and enforcement.
Most adaptation and mitigation studies have only addressed
manmade and natural capitals

UNEP Collaborating Centre on Energy and Environment
Difficulties in Assessing the “Capitals”
• Capitals are stocks of resources that constitute the basis for development and human response.
• Complexities when substitution between the capitals are constrained (strong sustainability)
• Intergenerational equity: Uncertainty, preferences of future generations.
• Social capital and institutional aspects embody intangible attributes, which only show up in relation to policy implementation. Unpredictable?
• Human and social capital have a public ”good character”.
• Investements in these capitals can go beyond the scope of climate change policies.
UNEP Collaborating Centre on Energy and Environment

UNEP Collaborating Centre on Energy and Environment
Study Area and sectors
Scenarios, US$ 1996
Average ancillary benefit
$ per t C
Key pollutants Major endpoints
Dessus and O’Connor, 1999
Santiago Chile Tax of $67
Tax of $157
Tax of $284
251
254
267
Seven air pollutants
Health – morbidity and mortality, IQ
Cifuentes et al., 2000
Santiago Chile Energy efficiency
62 SO2, NOx, CO, NMHC, PM10, dust.
Health
Gabaccio et al., 2000
China – 29 sectors
Tax of $1
Tax of $2
52
52
PM10, SO2 Health
Wang and Smith, 1999
China – power and households
Energi efficiency, fuel substitution
PM, SO2 Health
Barker and Rosendahl, 2000
Western Europe, 19 regions
Tax of $161 153 SO2, NOx, PM10
Human and animal health and welfare, materials, buildings and other physical capital, vegetation
Burtraw et. al.,,1999
USA Tax of $10
Tax of $25
Tax of $50
3
2
2
SO2, NOx Health

UNEP Collaborating Centre on Energy and Environment

UNEP Collaborating Centre on Energy and Environment
Sustainable Development Addressed as a Public Planning Problem
•Various SD definitions in the literature. Commonality is that they try to integrate development, environment and social dimensions in a short- and long time frame.
•Approach:
•Use experiences from literature on public planning and decision making.
•Define indicators that reflect major policy priorities.
•Use analytical approaches that can facilitate an evaluation of multiple objectives.

UNEP Collaborating Centre on Energy and Environment
Potential Sustainable Development Indicators
Economic
•GDP growth
•Sectoral development
•Employment
•Foreign exchange
•Investments
•Regional structure
Human:
• Education
• Health
• Capabilities: Freedom, well
being, living standards
Environment
•Air pollution
•Water pollution
•Waste discharge
•Exhaustible resources
•Biodiversity
Social
•Local participation and
sharing of benefits
•Income distribution
•Information sharing systems
•Institutional capacity building

UNEP Collaborating Centre on Energy and EnvironmentExamples of linkages between general policy priorities and indicators that can be integrated in technical assessments
Policy priorities in general development
programme
Examples of arguments included in the technical assessment
Economic development Macro indicators e.g. GDP growth.
Social cost of the project.
Employment Impacts on employment for different
labour market segments.
Rural development programmes
Economic activity generated in rural area.
Energy supply to rural area.
Local air pollution improvement
SO2 , NO x and particulate emissions.
Acid depositions.
Health impacts.
Increasing activity in the manufacturing
sector
Investments in manufacture.
Energy supply to manufacture.
Poverty alleviation
Change in numbers under various poverty lines.

UNEP Collaborating Centre on Energy and Environment
W(x)
x10
x20
x30
x40
X1
X2
X3
X4
X0 Xi
Indicators in the baseline case
Indicators in the policy case
Preference function for the indicators

UNEP Collaborating Centre on Energy and EnvironmentOverview of main structural elements in CBA, CEA, and MCA
Cost Benefit
Analysis Cost Effectiveness Analysis .
Multi-criteria Analysis
Selection of state variables x
Based on welfare concepts – e.g. defined to reflect policy priorities.
Partly based on welfare concepts – e.g. defined to reflect policy priorities.
Indicators representing policy priorities.
Standard for measurement of x
Welfare, eventually in monetary units.
Welfare, eventually in monetary units. GHG emissions in physical units or other policy goals.
Quantitative and/or qualitative units.
Weighting rules
Individual preferences as stated on markets.
Individual preferences as stated on markets.
Alternatives: no weighting. preferences of
policy makers. broader policy
process.
Preference function
Maximise welfare. Minimise welfare loss of achieving a target reduction of GHG.
Total score on indicators if weighting rules are applied. Individual indicators. Sensitivity analysis. Tradeoff analysis.

UNEP Collaborating Centre on Energy and Environment
Objective/Welfare Functions

UNEP Collaborating Centre on Energy and Environment
Matrix for Evaluating Biogas and Windturbine Case Examples
Non-policy state
State with biogas project
State with windturbine project
Impact biogas project
Impact windturbine project
Cost
x10 BX1 TX1 (BX1 –x10) (TX1 -x10)
Energy Consumption
x20 BX2 TX2 (BX2- x20) (TX2-x20)
Local environment
x30 BX3 TX3 (BX3- x30) (TX3- x30)
Employment
x40 BX4 TX4 (BX4– x40) (TX4 – x40)
GHG emissions
x50 BX5 TX5 (BX5-x50) (TX5-x50)

UNEP Collaborating Centre on Energy and Environment

UNEP Collaborating Centre on Energy and Environment

UNEP Collaborating Centre on Energy and Environment
Case Studies
UNEP Collaborating Centre on Energy and Environment
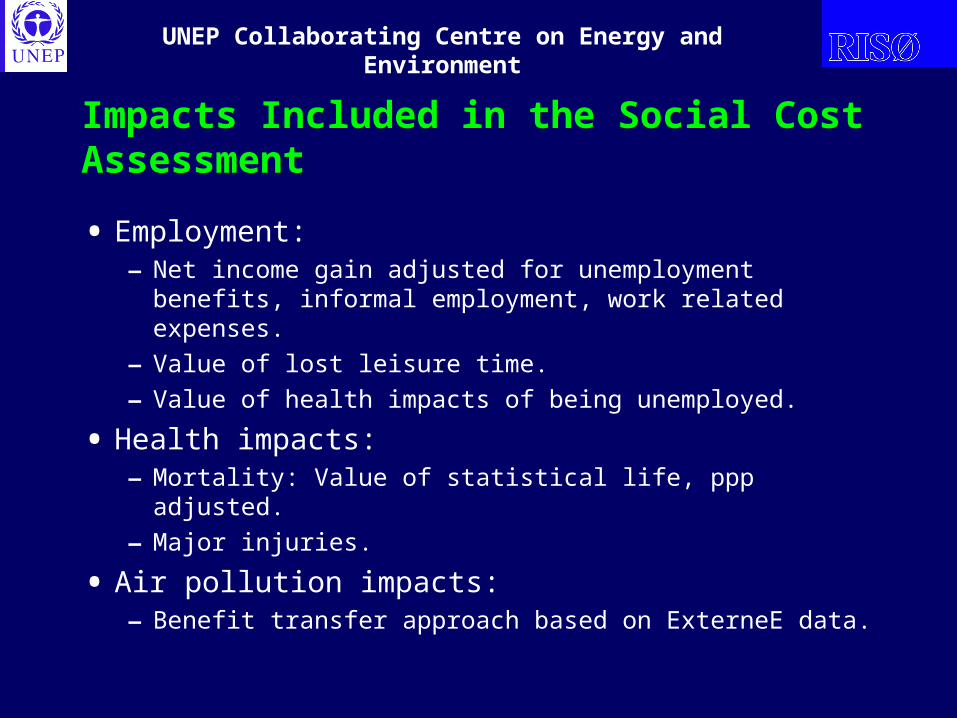
Impacts Included in the Social Cost Assessment
• Employment:– Net income gain adjusted for unemployment benefits,
informal employment, work related expenses.
– Value of lost leisure time.
– Value of health impacts of being unemployed.
• Health impacts:– Mortality: Value of statistical life, ppp adjusted.
– Major injuries.
• Air pollution impacts:– Benefit transfer approach based on ExterneE data.

UNEP Collaborating Centre on Energy and Environment
Cost Concepts

UNEP Collaborating Centre on Energy and Environment
Botswana
Cases
Project Baseline Social cost
adjustment
Road pavement Pavements of sandy roads
Sandy roads, 50% higher fuel consumption
Reduced SO2,Nox and particulates
Employment
Efficient lighting Introduction of compact fluorescent lamps, 11 watt.
Incandescent lamps 60 watt.
Coal fired power
Reduced SO2,Nox and particulates
Central PV 2 MW capacity of PV additional to baseline capacity
Coal fired power Reduced SO2,Nox and particulates
Coal mining health impacts
Industrial Boilers Improved coal fired boiler with 85% efficiency
Existing coal boiler with 79 % efficiency
Reduced SO2,Nox and particulates
Power factor correction
Installation of power factor correction.
Coal fired power without p.f.c.
Reduced SO2,Nox and particulates

UNEP Collaborating Centre on Energy and Environment
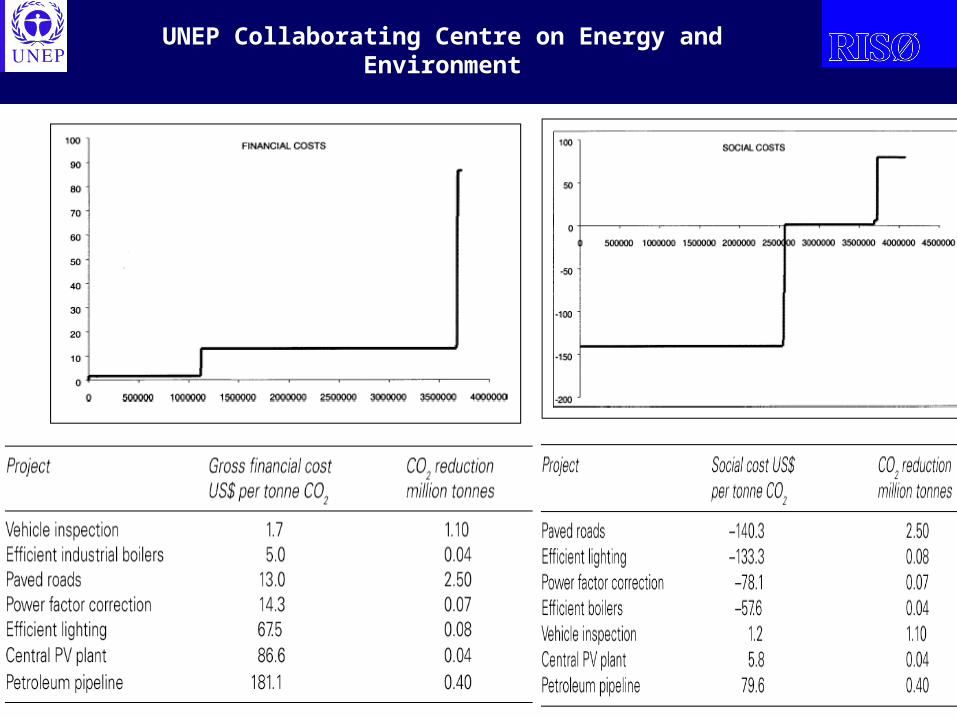
Financial and social costs of GHG emission reduction projects in Botswana, all costs are in $ per t. CO2 reduction, 10 % discount rate
Gross
Financial costs
Net Financial costs
Local air pollution Impacts
Employment impacts
Social costs alt. 1
Coal mining health impacts
Social costs alt. 2
Vehicle inspection
1.7
1.6
-0.3
-
1.2
0
1.2
Efficient industrial boilers
5.0 -5.9 -51.7 - -57.6 -180.6 -221.8
Paved roads
13.0 -101.2 -28.3 -0.6 -140.3 0 -140.3
Power factor correction
14.3 -7.9 -70.2 - -78.1 -184.0 -262.2
Efficient lighting households
67.5 -113.7 -19.65 - -133.3 -51.4 -184.7
Central PV
86.6 67.1 -60.2 - 5.8 -184.2 -161.7
Petroleum pipeline
181.1 125.6 -47.0 - 79.6 0 79.6
UNEP Collaborating Centre on Energy and Environment

UNEP Collaborating Centre on Energy and Environment
Botswana Conclusions
• Large national ancillary benefits of GHG emission reduction case projects.
• Fuel saving benefits are significant due to energy efficiency improvements.
• Local air pollution reduction benefits – low estimate compared with urban air pollution damages.
• Health benefits are in conflict with employment issues for the coal mining sector.
• Project ranking differ for the financial- and social cost perspective.
• Botswana can maximise local benefits of CC policies if project supply is based on development priorities.

UNEP Collaborating Centre on Energy and Environment
Alternative Approaches and Objectives
• CBA: Decision criteria to maximise the total net economic impact of implementing the individual projects.
• CBA: Decision criteria to maximise the economic benefits relative to the gross financial project costs.
• CEA: Decision criteria to minimise financial project costs per unit of GHG emission reduction.
• CEA: Decision criteria to minimise social costs per unit of GHG emission reduction.
• MCA: Decision criteria to maximise the project score on indicators with equal weights to all impacts.
• MCA: Decision criteria to maximise the project score on indicators. Particular high weights to reduced SO2 and NOx emissions.

UNEP Collaborating Centre on Energy and Environment
Ranking order of Botswana case projects
CBA
Net Benefits
CBA Benefit/cost ratio
CEA Net financial costs
CEA Social costs
MCA Equal weights
MCA High weights to SO 2 and NO x emissions
Road pavement
1
5
2
1
1
3
Efficient lighting
4 1 1 2 4 5
Industrial boilers
5 3 4 4 2 1
Central PV
2 4 5 5 5 4
Power factor correction
3 2 3 3 3 2

UNEP Collaborating Centre on Energy and Environment
Conclusions
• Normative element in the selection of policy objectives.
• Project ranking change with different analytical approach and different policy objective weights.
• Major differences in approaches relate to the establishment of weights.
• In particular MCA are very sensitive to assumptions about weights – no rule exist.
• Policy evaluation depends on:
– Chosen SD indicators
– Measurement and valuation approach
– Overall policy objectives.

UNEP Collaborating Centre on Energy and Environment
Sustainable Development GHG Emission Reduction
Projects
Development, Local Environment, Social Impacts, GHG Emissions
Joint International Policies
Developing Countries Industrialised Countries