unemployment in jordan - europa...one area of activity, education, a significant proportion of...
TRANSCRIPT
TA-69-05-763-E
N-C
UNEMPLOYMENT IN JORDAN
National Center For Human Resources
Deve
lopm
ent

THE EUROPEAN TRAINING FOUNDATION (ETF) IS THE EUROPEAN UNION’S CENTRE OF EXPERTISE SUPPORTING VOCATIONAL EDUCATION AND TRAINING REFORM IN THIRD COUNTRIES IN THE CONTEXT OF THE EU EXTERNAL RELATIONS PROGRAMMES
SALES AND SUBSCRIPTIONS
Publications for sale produced by the Office for Official Publications of the EuropeanCommunities are available from our sales agents throughout the world.
You can find the list of sales agents on the Publications Office website (http://publications.eu.int)or you can apply for it by fax (352) 29 29-42758.
Contact the sales agent of your choice and place your order.
HOW TO CONTACT US
Further information on our activities, calls for tender and job opportunities can be found on our web site: www.etf.eu.int
For any additional information please contact:
External Communication UnitEuropean Training FoundationVilla GualinoViale Settimio Severo 65I – 10133 TorinoT +39 011 630 2222F +39 011 630 2200E [email protected]

UNEMPLOYMENT IN JORDAN
This report has been prepared by a team of experts: Ms Christine Guégnard, Mr Xavier Matheu and Mr Musa Shteiwi, under the supervision of Mr Gérard Mayen, ETF Jordan desk officer. Thanks to Ms Ummuhan Bardak and Mr Henrik Huitfeld, labour market experts at theETF, for their participation.
ETF, 2005

Europe Direct is a service to help you find answers to your questions
about the European Union
Freephone number (*):
00 800 6 7 8 9 10 11(*) Certain mobile telephone operators do not allow access to 00 800 numbers or these calls may be billed.
A great deal of additional information on the European Union is available on the Internet.It can be accessed through the Europa server (http://europa.eu.int).
Cataloguing data can be found at the end of this publication.
Luxembourg: Office for Official Publications ofthe European Communities, 2005
ISBN 92-9157-453-8
© European Communities, 2005Reproduction is authorised provided the source is acknowledged.
Printed in Italy
PRINTED ON WHITE CHLORINE-FREE PAPER

3
CONTENTS
FOREWORD 5
EXECUTIVE SUMMARY 7
1 INTRODUCTION 13
1.1 Context and background 13
1.2 Presentation of the report 15
2 DEFINITIONS 17
3 EMPLOYMENT BY SECTORS AND ECONOMIC ACTIVITY RATES 21
3.1 Employment sectors and economic activity rates 21
3.2 Employment, education and occupation 23
3.3 Non-Jordanian employees 23
3.4 Employment and the informal economy 25
4 ANALYSIS OF INFORMATION ON JOBSEEKERS 27
4.1 Unemployment and gender 27
4.2 Unemployment and youth 28
4.3 Unemployment and qualifications 28
4.4 Duration of unemployment and methods of jobseeking 32
5 SUPPLY AND DEMAND IN THE GOVERNMENT SECTOR 37
6 UNEMPLOYMENT IN URBAN AND RURAL GOVERNORATES 41
7 CONCLUSIONS AND RECOMMENDATIONS 45
7.1 Specific recommendations for tackling unemployment 46
7.2 Technical recommendations for improving the information system 51
ANNEXES 55
Annex 1: Jordanian Task Force members 55
Annex 2: Information contained in the Al Manar database 56
Annex 3: List of tables, figures and boxes 63
ACRONYMS 65

5
FOREWORD
This pilot study report was initiated by the European Training Foundation (ETF), in close cooperation with the National Center for Human Resources Development (NCHRD) in Jordan, in the framework of the ETF multiannual project Observatory Function Development in Jordan. The project was set up through the cofunding mechanism of the ETF and the Italian Ministry of Foreign Affairs, using a Trust Fund established in 2003 in the region covered by the MEDA programme.
Special thanks are extended to the Jordan Observatory Function Task Force members, who gave their time and
expertise, and to the institutions to which they belong (see list in annex 1). The network that has been formed has reinforced considerably the validity of the recommendations and the ownership of its members, and reflects positively theinstitutional abilities of the main human resource information providers in Jordan.
The support provided by NCHRD staff, and in particular the high level of commitment and assistance given by the president, Dr Masri, and by the entire Al Manar team, led by Dr Nader Mryyan, was greatly appreciated.


7
EXECUTIVE SUMMARY
The total population of Jordan in 2003 was an estimated 5.4 million, of whom 1.2 million represented the labour force. According to the Department of Statistics the unemployment rate was around 15% of the labour force, which means that around 180,000 Jordanians who wanted to work were left without a job. Yet these general statistics on the country as a whole conceal important differences related to gender, age, training level and governorate. An initial analysis reveals the need to improve the mechanisms by which the successful transition from education to work is managed, especially for young people, and to develop training and work opportunities for women, with more support being necessary in rural governorates. Being young and being female represent the two main difficulties for individuals in terms offinding a permanent job in Jordan.
The labour market in Jordan displays particular characteristics that have significant implications for understandingunemployment. First, the low economic participation rate is a result of the population’s age structure, the large number of students, low female participation in the labour market and the early retirement age in the public sector. Second, there is an imbalance in the sectoral and gender distribution of economic activities. In recent decades trade has become increasingly important, while agriculture, construction and the public sector have declined. The public sector remains one of the largest (39% of workers), and it is still seen as an attractive option: more people are applying for government jobs, though the public sector cannot match this growing demand. In only one area of activity, education, a significantproportion of women are employed (41%),
which contrasts with the dominance of male employees across other sectors.
Third, the regional distribution of labour is unbalanced, since Amman has more than a third of the country’s active population, both employed and unemployed. Fourth, small firms with 1–19 workers account for 65% oftotal private employment outside agriculture. Furthermore, the informal economy or hidden employment (outside legal and regularly frameworks) represents a substantial and active part of the private sector workforce. Finally, the labour market is distorted by the number of Jordanian labour expatriates, many of them in highly skilled and professional occupations, and non-Jordanian workers in low-skilled and manual jobs in agriculture and personal services. Although no official statistics areavailable, it is estimated that some 350,000 Jordanians are working abroad, mainly in the Gulf, while around 200,000 foreign workers are employed in Jordan.
UNEMPLOYMENT AND THE DIPLOMA
Over half of unemployed Jordanians (53%) have less than the secondary level of education. Women looking for a job tend to have a higher level of education than men looking for a job: in 2003, 76% of female jobseekers had an intermediate diploma or higher, while 64% of unemployed males had less than secondary education.
In fact, employment data show that education has a significant impact on jobopportunities. Among employed Jordanians there are also more men whose education is below secondary level (55%), while a

UNEMPLOYMENT IN JORDAN
8
significant proportion of female workershave a higher diploma (31% have a college diploma and 37% have a bachelor’s degree or above). Many women continue their studies before entering the labour market in order to be eligible for positions with favourable conditions. Because of the lower female activity rate (11%, as against 63% for the rate for males), the highest proportions occur after the intermediate and university diplomas (36% and 63% respectively). The higher economic activity rates for both women and men in the labour force are related to their higher levels of education.
A THIRD OF YOUNG PEOPLE ARE SEARCHING FOR A JOB
The population structure in Jordan is very young, with 21% of individuals being in the age group 15–24 years. Young people are at greater risk of unemployment than any other segment of the population: almost 60% of jobseekers, both men and women, are below the age of 25. The 25–39 age group represents a third of the total number of unemployed persons. The 40–54 age group constitutes 7% of the jobseekers, with a slight male majority. While 55% of
unemployed women are in the 20–24 age group, compared with 38% of unemployed men, only 4% are in the younger group (15–19 years old), compared with 21% of unemployed men. More women who are unemployed are in the middle age groups than in the younger groups (19 years or less) and older groups (40 years or over).
Distribution of unemployed people by age in 2003 (%)
Male Female Total
15–19 years
20–24 years
25–39 years
40–54 years
55 +
20.7
37.6
31.6
8.7
1.3
3.6
54.6
39.4
2.3
0.1
17.0
41.2
33.3
7.3
1.2
Total 100 100 100
Source: Al Manar (Department of Statistics)
The causes of youth unemployment include: lack of career guidance counselling for students and unemployed people; lack of opportunities to findsatisfying work following graduation; the difficulty for individuals of obtaining jobscompatible with their qualifications; thepoor wages and working conditions offered by firms; the gap between the skills ofgraduates and the needs of employers;
The European Training Foundation (ETF), in close cooperation with the National Center for Human Resources Development (NCHRD), initiated the present study on unemployment in Jordan. The analysis was based on the data contained in the Al Manar Information System. This report has been produced by a group of Jordanian experts involved in the Observatory Function Task Force, a body representing the major institutions providing or using information on human resources. A networking approach to processing the available information helped both the individuals and the institutions to develop their knowledge on the subject, and allowed proposals and recommendations for action to be elaborated.
Some definitions
Unemployed: any person of 15+ years of age who is without a job, but who is able to work, available for work and looking for work.
Unemployment rate: the total number of people who are unemployed as a proportion of the labour force, which itself is the sum of employed and unemployed people.
Economic activity rate: the number of employed and unemployed people as a proportion of the working-age population.
Labour force: the whole of the economically active population, including employed and unemployed Jordanians.
EXECUTIVE SUMMARY
9
social and cultural obstacles for the full integration of women into the labour market (families are more selective when choosing workplaces for females); and the wider international and economic situations. Also, 40% of employed people who want another job are less than 25 years old. The main reason given by Jordanians for seeking a different or an additional job is insufficientearnings, followed by unsatisfactory working conditions.
Compared to the overall unemployment rate of 15% in Jordan, the high unemployment rate among young people (32%) suggests that support is required for this group, particularly during the first fewyears after they have left school. Youth unemployment could be reduced through a combination of encouragement to firms toimprove the quality of jobs on offer, counselling and better guidance in schools to support the entrance of graduates into society and professional life (through curriculum design and vocational orientation tools) and, in the labour market, through upgrading of the roles and capacities of labour offices and theVocational Training Corporation (VTC) (through the development of their range of services and training sessions, and the creation of an enterprise culture). In view of the challenging role facing Jordan’s younger generation in the near future, it is anticipated that new public and private sector policies will focus on this group.
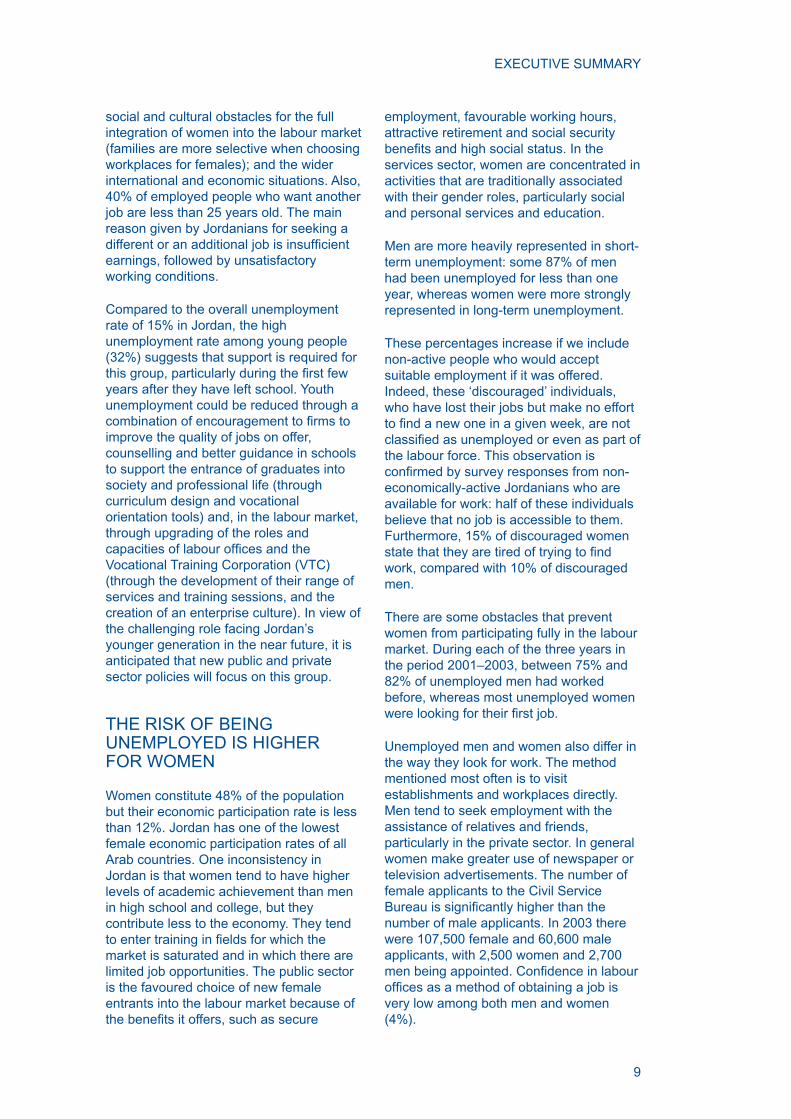
THE RISK OF BEING UNEMPLOYED IS HIGHER FOR WOMEN
Women constitute 48% of the population but their economic participation rate is less than 12%. Jordan has one of the lowest female economic participation rates of all Arab countries. One inconsistency in Jordan is that women tend to have higher levels of academic achievement than men in high school and college, but they contribute less to the economy. They tend to enter training in fields for which themarket is saturated and in which there are limited job opportunities. The public sector is the favoured choice of new female entrants into the labour market because of the benefits it offers, such as secure
employment, favourable working hours, attractive retirement and social security benefits and high social status. In theservices sector, women are concentrated in activities that are traditionally associated with their gender roles, particularly social and personal services and education.
Men are more heavily represented in short-term unemployment: some 87% of men had been unemployed for less than one year, whereas women were more strongly represented in long-term unemployment.
These percentages increase if we include non-active people who would accept suitable employment if it was offered. Indeed, these ‘discouraged’ individuals, who have lost their jobs but make no effort to find a new one in a given week, are notclassified as unemployed or even as part ofthe labour force. This observation is confirmed by survey responses from non-economically-active Jordanians who are available for work: half of these individuals believe that no job is accessible to them. Furthermore, 15% of discouraged women state that they are tired of trying to findwork, compared with 10% of discouraged men.
There are some obstacles that prevent women from participating fully in the labour market. During each of the three years in the period 2001–2003, between 75% and 82% of unemployed men had worked before, whereas most unemployed women were looking for their first job.
Unemployed men and women also differ in the way they look for work. The method mentioned most often is to visit establishments and workplaces directly. Men tend to seek employment with the assistance of relatives and friends, particularly in the private sector. In general women make greater use of newspaper or television advertisements. The number of female applicants to the Civil Service Bureau is significantly higher than thenumber of male applicants. In 2003 there were 107,500 female and 60,600 male applicants, with 2,500 women and 2,700 men being appointed. Confidence in labouroffices as a method of obtaining a job isvery low among both men and women (4%).
UNEMPLOYMENT IN JORDAN
10
It is clear that more employment prospects need to be created to enable women to satisfy their willingness to work, with the involvement of all actors. Unless there is specific action in the field of equality, theinequalities in the labour market will persist. The enhancement of women’s participation in the labour force is crucial for Jordan’s economy; action is needed to develop job opportunities so that women can secure decent and remunerative work in conditions that offer flexibility, social security,economic independence and equal wages with men. This will only be possible if policymakers recognise that women’s problems in the labour market are as important as those of men. The main proposal will be ‘gender mainstreaming’, which refers to the incorporation of equal opportunities for both men and women into all policies and activities, taking into consideration their different conditions, situations and needs.
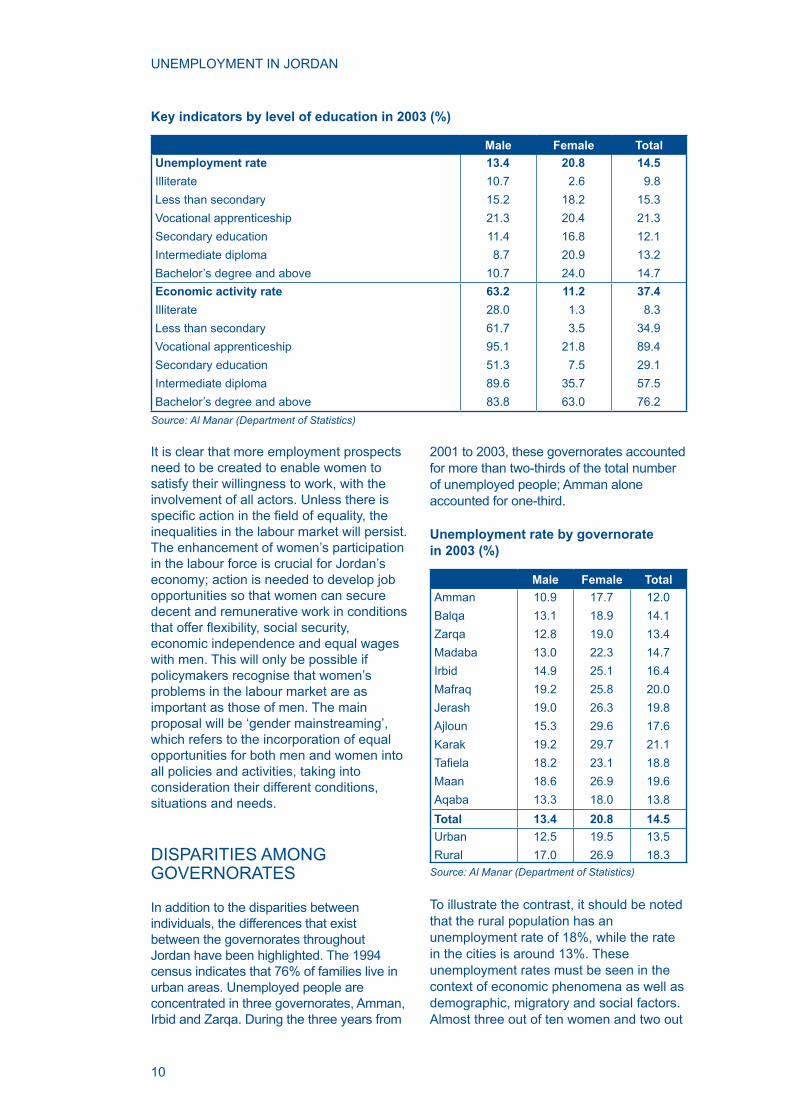
DISPARITIES AMONG GOVERNORATES
In addition to the disparities between individuals, the differences that exist between the governorates throughout Jordan have been highlighted. The 1994 census indicates that 76% of families live in urban areas. Unemployed people are concentrated in three governorates, Amman, Irbid and Zarqa. During the three years from
2001 to 2003, these governorates accounted for more than two-thirds of the total number of unemployed people; Amman alone accounted for one-third.
Unemployment rate by governorate in 2003 (%)
Male Female Total
Amman
Balqa
Zarqa
Madaba
Irbid
Mafraq
Jerash
Ajloun
Karak
Tafiela
Maan
Aqaba
10.9
13.1
12.8
13.0
14.9
19.2
19.0
15.3
19.2
18.2
18.6
13.3
17.7
18.9
19.0
22.3
25.1
25.8
26.3
29.6
29.7
23.1
26.9
18.0
12.0
14.1
13.4
14.7
16.4
20.0
19.8
17.6
21.1
18.8
19.6
13.8
Total 13.4 20.8 14.5
Urban
Rural
12.5
17.0
19.5
26.9
13.5
18.3Source: Al Manar (Department of Statistics)
To illustrate the contrast, it should be noted that the rural population has an unemployment rate of 18%, while the rate in the cities is around 13%. These unemployment rates must be seen in the context of economic phenomena as well as demographic, migratory and social factors. Almost three out of ten women and two out
Key indicators by level of education in 2003 (%)
Male Female Total
Unemployment rate
Illiterate
Less than secondary
Vocational apprenticeship
Secondary education
Intermediate diploma
Bachelor’s degree and above
13.4
10.7
15.2
21.3
11.4
8.7
10.7
20.8
2.6
18.2
20.4
16.8
20.9
24.0
14.5
9.8
15.3
21.3
12.1
13.2
14.7
Economic activity rate
Illiterate
Less than secondary
Vocational apprenticeship
Secondary education
Intermediate diploma
Bachelor’s degree and above
63.2
28.0
61.7
95.1
51.3
89.6
83.8
11.2
1.3
3.5
21.8
7.5
35.7
63.0
37.4
8.3
34.9
89.4
29.1
57.5
76.2
Source: Al Manar (Department of Statistics)
EXECUTIVE SUMMARY
11
of ten men are unemployed in the rural governorates of Karak, Ajloun, Maan, Mafraq and Jerash. In rural areas women face much greater difficulties in accessingdecent work.
There are also differences between the experiences of applicants and appointees for public jobs in the various governorates. Despite the fact that one-third of applicants for government posts are from Amman and a quarter from Irbid, appointees from these governorates account for only 21% and 17% of the total, respectively.
The limited range of job offers, the reduced autonomy of jobseekers, their geographical isolation and the difficulties they have inaccessing information need to be addressed through specific labour marketand local measures.
In view of the wide variety of local circumstances and the socioeconomic characteristics of the country, the other key proposal will be to increase cooperation among key actors in the fields of educationand employment, local authorities, municipalities and other services.
WORKERS IN THE INFORMAL ECONOMY
There are two major issues relating to this sector and its role in the overall employment/unemployment situation in Jordan. The first is the lack of informationon the definition, size, characteristics andpotential of the informal economy. The second relates to the acquisition of the skills required in order to work in the informal economy, and hence the possibility of identifying bridges and pathways to facilitate the transition from these jobs to formal employment. Informal workers are particularly vulnerable to exploitation through forced labour, with no legal and social protection. It is rather difficult to arrive at an accurate assessmentof the scale of the informal economy, although it is estimated that around 200,000 people in Jordan are currently working in this sector.
In order to manage the informal economy in the context of the labour market, national
framework measures and local applications should be implemented. These include treating informal work as a legal issue, strengthening dialogue with social partners and chambers of industry or commerce, and promoting a local development approach that encourages partnerships between the different stakeholders. The emergence of legislative measures to protect workers (including rights, minimum wages, acceptable hours and conditions of work, and social security), to decrease the taxes paid by employers and to foster entrepreneurship will also contribute effectively to the informal economy’s decline.
THREE STRATEGIC PRIORITIES FOR ACTION
As a result of this report, three priorities have been identified: tackling youthunemployment and facilitating the integration of young people into the labour market; promoting equal opportunities between women and men; and fostering the transition of employment from informal to formal activities.
In pursuit of these objectives, the following general recommendations are designed to create education and employment opportunities and to manage labour market risks.
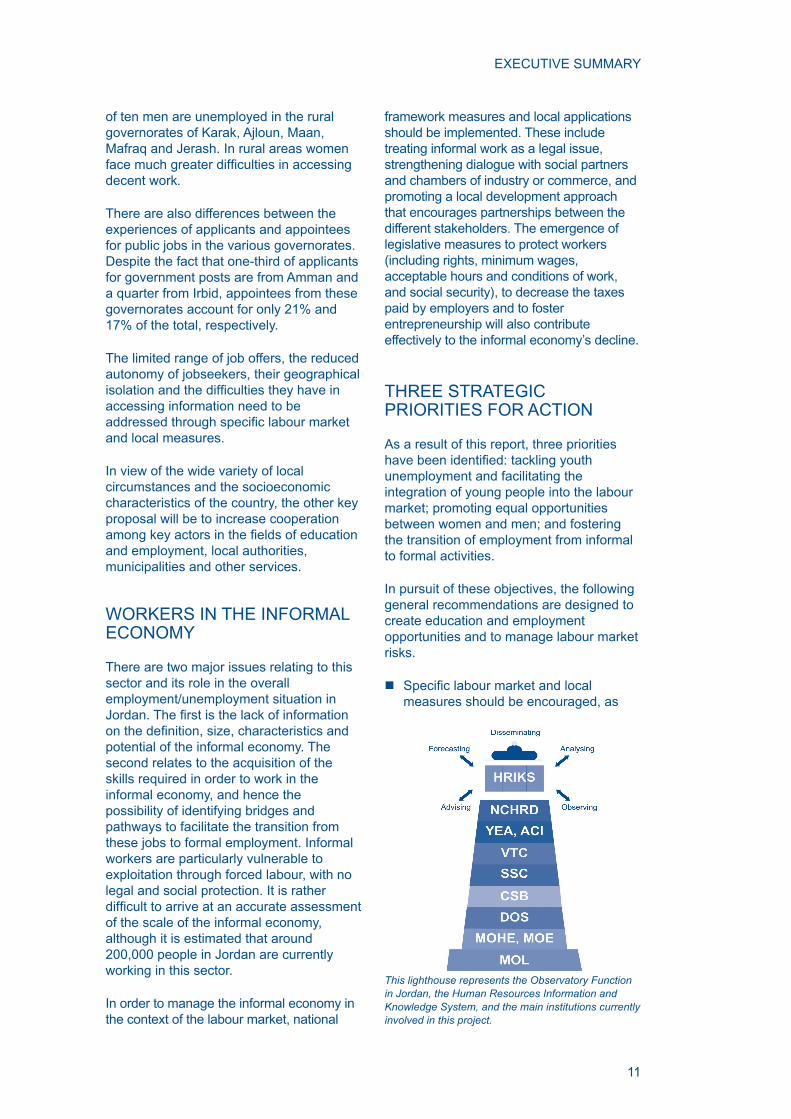
n Specific labour market and localmeasures should be encouraged, as
This lighthouse represents the Observatory Function in Jordan, the Human Resources Information and Knowledge System, and the main institutions currently involved in this project.

UNEMPLOYMENT IN JORDAN
12
should increased cooperation among key actors in the fields of education andemployment, regional authorities and other services.
n The roles and capacities of labour offices, the VTC, the MOE and Al BaquaUniversity need to be improved and upgraded throughout the country, and their relationships with each other strengthened, in order to provide
counselling guidance support to each inhabitant of Jordan, with specificsupport being given to the most vulnerable population groups (young people, women and discouraged workers).
n The roles of social partners and companies in sharing responsibility for the formulation of education and training policies should be enhanced.
How can the HR information system be improved?
Completion of the study has ensured that the characteristics of unemployment in Jordan are better known. There is still a need for a clearer definition of thedifferences between unemployed people, jobseekers and discouraged persons, who represent those excluded from the labour market.
According to the International Labour Organization (ILO) definition, it is expected thata person who is not working will be actively seeking a job. Some individuals may not fulfilall the criteria, and are therefore considered to be non-active. This is the case with individuals who, after looking for work and being unable to find a job appropriate to their qualifications,have not been actively seeking work during the previous four weeks; or if, in the absence of unemployment benefits, they have beenworking for a limited number of hours in a job not appropriate to their professional potential, because they need to generate essential family income.
If jobs are not available (as indicated by the responses from discouraged workers that were recorded in the study), after a certain period of jobseeking the search might be reduced. Moreover, if no other income is available, jobseekers might accept work in the informal economy or in employment fields outside their ownprofession.
Since most of the data sources have limited scope, some weaknesses have emerged from the analysis of unemployment. However, information from the latest population census (November 2004) should improve the situation by providing a more comprehensive picture.
The main technical recommendation for increasing the transparency of the Jordanian labour market is a reinforcement of the quality of data by developing:
n common classifications;n tracer studies (to analyse the professional circumstances of school leavers in the
labour market);n more qualitative and quantitative information relating to unemployed people and
the informal economy;n further studies in specific areas (including wage levels, the public sector,
expatriate Jordanians, non-Jordanian workers and the skill needs of companies).
Unemployed people
Jobseekers
Discouragedworkers
13
11 INTRODUCTION
1.1 CONTEXT AND BACKGROUND
Jordan’s achievements in human development during the past 30 years have been impressive.1 Being a middle-income country without significant naturalresources, Jordan relies primarily on human capital for development and, in comparison with most other countries in the Middle East and North Africa region, the country has achieved a significantreduction in illiteracy, thanks to the continuous improvement of the training and education system. Over the decades, the economy has distinguished itself as one of the better business environments in the region in terms of macroeconomic stability, trade access, and regulatory climate. Remittances from Jordanians working overseas have contributed as much as
25% to the country’s gross domestic product (GDP).2
The signing of the Euro-Mediterranean Free Trade Agreement and Jordan’s recent entry into the World Trade Organization (WTO) require responsive local labour markets and a labour force prepared to face new challenges and make Jordan a competitive actor in a global environment. To prepare for the necessary modernisation of its society, the Jordanian government has set out a National Social and Economic Action Plan (2004–2006) which aims to develop a sustainable socio-economic process and contribute significantly topoverty reduction. Nevertheless, with the labour force currently growing at 4% per year, poverty and unemployment still at 11.6% and 15% respectively, creating additional new jobs for young jobseekers is
1 World Bank, Country Assistance Strategy for Jordan. 2 A country’s gross domestic product is the total output of goods and services for final use produced by an
economy by residents and non-residents, regardless of the allocation to domestic and foreign claims.

UNEMPLOYMENT IN JORDAN
14
imperative in the interests not only of economic growth but also of social stability.
In order to comply with the strategy outlined in the National Social and Economic Plan, Jordan has initiated the development of a labour market information system managed by the National Center for Human Resources Development (a national agency in charge of coordinating educational reforms and foreign aid support in the human resources sector) with the support of the Canadian International Development Agency. Since 2001 the European Training Foundation (ETF) has contributed to these coordinated efforts by supporting the reinforcement of Jordanian structures and mechanisms in charge of providing adequate and strategic information, indicators and analysis which can contribute to an efficient decision-makingprocess in the development of human resources policies and, more specifically,vocational education and training strategies responsive to labour market needs (the Observatory Function).
To achieve this goal through the involvement of a permanent and active network of the main institutions able to provide statistical data as well as the main
social partners and civil society partners, a series of actions has been undertaken:
(i) raising awareness about the concept of an Observatory Function (OF);
(ii) development of a strategy paper and an action plan3 which would help the Jordanian government to develop a sustainable OF capable of providing analyses and scenarios for decision-making;
(iii) implementation of capacity-building initiatives in order to reinforce the capacities of Jordanian institutions and partners involved;
(iv) reinforcement of national, regional and international networking, including, at the regional level, the exchange of good practices with neighbouring countries.
An OF cycle ‘from data to policies’ or ‘from results to impact’ was proposed in the strategy paper and action plan, which were prepared by a Jordanian Task Force composed of representatives of the main stakeholders active in the collection and use of labour market information. The following diagram summarises this cycle:
Data
Information
Knowledge
Policy design&
decision making
Results
Outputs
Outcomes
Parties involved
Agency orinstitution concerned
HRIKS
HRIKS, individuals,agencies, researchers,reporting agencies
Politicians anddecision makersImpact
3 ‘Strategy and Action Plan for a Human Resources Information and Knowledge System (HRIKS) in Jordan‘, ETF, December 2002.

1 INTRODUCTION
15
The action plan recommended conducting a pilot analysis in the field of humanresources, an area of particular interest for Jordan, in order to test the capacity of the information system developed through the Al Manar project. A list of 12 themes was proposed, among which an analysis of the unemployment situation in Jordan seemed to be a priority. The objective of the pilot study was to undertake an assessment of the information on unemployment in Jordan, with the support of ETF experts, by processing and analysing the available data and promoting discussions among the Jordanian Observatory Function members. This would enable the building of consensus on the interpretation of the available information and, in due course, through an ownership process, on the recommendations at policy level.
More specifically, the pilot study would aim to:
n improve the Human Resources Information and Knowledge System (HRIKS) through feedback acquired during the study;
n enhance the potential of the national HRIKS for utilisation in policy-oriented research and studies;
n transform the information identified inthe HRIKS into knowledge that can be utilised by decision makers to have an impact on labour market policies and targeted activities.
The methodology applied consisted of asking a network of partners involved in OF development from the outset to discuss and compare their views and understanding about unemployment on the basis of the information available in the Al Manar database. This was done by processing, analysing and interpreting the available information and promoting qualitative discussions among the Jordanian OF stakeholders. For that purpose two workshops were held on 12 July and 18 September 2004 at NCHRD premises in Amman, with ETF experts’ support. A first draft of the pilot studyprepared by ETF experts was presented during the first workshop and discussed bymembers of the OF Task Force. Their comments and discussions, and some
missing data, were incorporated into a second draft. During the second workshop on 18 September 2004 the Task Force members finalised the report anddiscussed a set of recommendations. In addition, a permanent electronic exchange of information was activated.
A final seminar held in Amman inNovember 2004 provided the opportunity to disclose the results of the pilot study in front of an audience of key, high-level Jordanian and international stakeholders.
The present document represents the finaland shared version of this first pilot study.
1.2 PRESENTATION OF THE REPORT
The focus of this report is unemployment. However, considering that unemployment information in itself should not be used or analysed in isolation from other indicators or data, the report begins by providing an overview of the general labour market situation in Jordan. After the main data on employment by sector, age, gender and level of education are presented, on the basis of the available information, the specific cases of non-Jordanian employeesand employment in the informal economy are highlighted as topics requiring special attention in the Jordanian labour market.
When analysing unemployment it is important to note that in countries without a comprehensive social security system such as Jordan many workers cannot afford to be openly unemployed while searching for scarce formal-sector jobs. Instead, they are often forced to accept low-productivity jobs in the informal economy. Also, the definitionand criteria of ‘informality’ may require a different approach, as employees of micro- and small enterprises (those with 1–4 employees) may not automatically be considered part of the informal economy because these companies are not legally obliged to participate in the Jordanian social security system. Therefore, openly unemployed people may not always be the most disadvantaged or vulnerable in the labour market. The informal economy, with its many different variations, represents a
UNEMPLOYMENT IN JORDAN
16
significant part of the economy and playsan important role in job creation. It is acknowledged that specific attention needsto be given to analyse these aspects of Jordanian labour market, which are still not well known.
The report also addresses the question of how to define the unemployed populationin Jordan better on the basis of personal and professional characteristics. Particular attention is given to groups that are more likely to be affected, such as women, young people and a specific populationdefined as ‘discouraged workers’ orunderemployed persons. The report looks at the impact of education on the capacity to find (and keep) a job. Because the publicsector is very important in Jordan, further research and interpretation of data are
needed to explain both the incentives and disincentives created by the public sector for young labour market entrants and women’s particular interests as regards public sector jobs. Finally, the report attempts to analyse the regional disparities in employment.
In conclusion, two groups of recommendations are proposed: (i) technical recommendations to main information providers for improving the quality of the information collected, and (ii) a set of policy recommendations for tackling unemployment. These recommendations are intended to support policymakers in their commitment and willingness to adapt both the formal and informal education and training system and the whole labour market in Jordan.

17
The principal data used in this study report come from the Al Manar information system. Al Manar has published labour market and human resource development indicators since the year 2000. Every year Al Manar collects statistics on employment and unemployment directly from the Department of Statistics (DOS), the Ministry of Labour (MOL), the Civil Service Bureau (CSB) and the Social Security Corporation (SSC). In this report the institutional source of data is indicated (in brackets) and a detailed list of information contained in the database is set out (see annex 2). The main data from DOS are figures from the Employment andUnemployment Survey. The following are the definitions of employment-relatedconcepts used in this document.
UNEMPLOYED
Any person 15 years of age or over who is without work or a job, is able to work, is available for work and is looking for work.
Persons are considered unemployed if:
n they do not practise any work (i.e., they are without work or a job); specifically,they have worked for one hour or less during the reference period and have not been temporarily absent from work;
n they are available for work, i.e., they have been ready or prepared to undertake work immediately during the seven days preceding the date of interview or are ready to do so within 15 days following the date of interview;
n they are searching for work, i.e., they have taken specific steps and havespent some or all of the time in search of work over a period of up to four weeks prior to the date of interview. These steps may include: registration and applying directly to employers, searching for work at workers’ gatherings; placing or answering advertisements in newspapers; seeking the assistance of friends or relatives, etc.
2 DEFINITIONS 2

UNEMPLOYMENT IN JORDAN
18
TYPES OF UNEMPLOYED PEOPLE
a. Unemployed people who have worked previously, i.e. any person aged 15 or over who has not practised any work or job during the four weeks prior to the date of interview, but who is able to work, available for work, looking for work, and has ever worked either inside or outside Jordan;
b. Unemployed people who have never worked, that is, any person aged 15 or over who has not practised any work or job during the four weeks prior to the date of interview, but who is able to work, available for work, and has never worked inside or outside Jordan.
UNEMPLOYMENT RATE
The unemployment rate is defined as thequotient resulting from dividing the total number of unemployed people by the size of the relevant labour force, which itself is the sum of the employed and the unemployed. The DOS, which draws on household labour force surveys to calculate this indicator (currently undertaken on a quarterly basis), uses the definition ofunemployed adopted by the 13th International Conference of Statisticians. The indicator on the unemployment rate is probably the best-known labour market measure. The unemployment rate and the employment-to-population ratio together represent the broadest indicators of economic activity and status in terms of the labour market.
YOUTH UNEMPLOYMENT
For the purpose of this study, the term ‘youth’ refers to persons aged 15–24.4 In this report the indicator consists of two distinct measurements: (a) the youth unemployment rate (youth unemployment as a percentage of the youth labour force);
(b) youth unemployment as a proportion of total unemployment.
LONG-TERM UNEMPLOYMENT
Long-term unemployment refers to unemployment which lasts for one year or longer.
LABOUR FORCE
The labour force is the whole of the economically active population, including employed and unemployed Jordanians.
ECONOMIC ACTIVITY RATE
The economic activity rate is the number of employed and unemployed people as a proportion of the working age population. It gives an indication of how many people of working age are actively participating in the labour market. This concerns population aged 15 to 64.
INSUFFICIENT EMPLOYMENT (UNDEREMPLOYMENT)
Insufficient employment refers to employedpersons aged 15 and over who wish to obtain a new or additional job and are available for work during the reference period. Such persons should meet the following criteria: (a) their current work is insufficient in terms ofsalary or incentives; (b) their current work does not suit their educational qualifications;(c) the hours spent in their current work are short. However, the ILO definition ofunderemployment refers only to short working hours.
INFORMAL ECONOMY
This is a rather complicated and controversial concept. There is general agreement that the informal economy (or
4 At 15 years of age most young people are at school and very few are already working. However, we retain this starting age as a standard definition of youth.

2 DEFINITIONS
19
hidden employment) is usually outside legal and regulatory frameworks and is characterised by a high level of vulnerability for workers. Workers in informal employment normally have unstable and insecure jobs, with no legal and social protection, consisting of periods of very long working hours followed by inactive periods. The term is used in this text to refer to micro- and small enterprises that employ four employees or fewer. However, this definition is based on the availability of data
only and does not correspond to a particular conceptual framework.
URBAN AND RURAL
Any locality with a population of 5,000 persons or more as revealed by the 1994 Census is considered urban. Localities with fewer than 5,000 persons are defined asrural.

21
3 EMPLOYMENT BY SECTORS AND ECONOMIC ACTIVITY RATES
A key feature of the Jordanian labour market is that Jordan has one of the lowest female economic participation rates among Arab states.5 The total population of Jordan was estimated at 5,4 million in 2003, of whom 21% were young Jordanians aged 15–24. Jordan has a labour force of 1,175,109,6 with a large gender disparity. Women constitute 48% of the population but their economic activity rate does not exceed 12%, whereas male participation in the labour force is as high as 63%. Young people aged 15–24 years have a labour force participation rate of 28%.
3.1 EMPLOYMENT SECTORS AND ECONOMIC ACTIVITY RATES
The public sector and the services sector constitute the largest sectors of
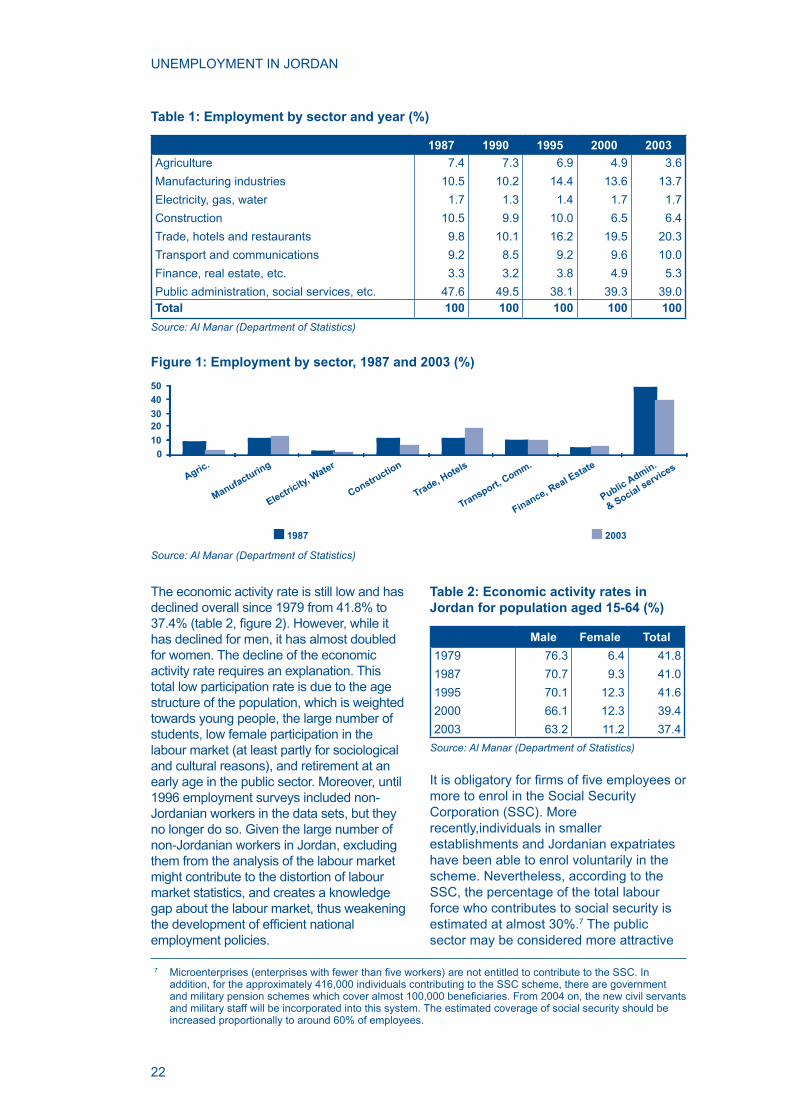
employment in Jordan. The evolution of employment by sector reveals very interesting trends, with significantimplications for understanding unemployment in Jordan. As table 1 and figure 1 show, agriculture andconstruction declined by almost 50% between 1987 and 2003. The majority of people working in those sectors are non-Jordanian workers. Another significantdecline over the same period has taken place in the public sector. This trend can be attributed to cuts in public spending and the privatisation of large state enterprises. The implications here are far-reaching, especially for college and university graduates. On the other hand, the services sector has witnessed the highest growth and accounts today for more than a third of the labour force. Trade is an increasing sector, accounting for nearly 20% of workers in 2003.
3
5 This contrasts with the female economic activity rates in, e.g., Syria (16%), Egypt (22%), Morocco (27%) and Arab states (nearly 19%), and in the European Union (49%). (Ministry of Planning / UNDP, Jordan Human Development Report 2000).
6 Cf. Al Manar, ‘Human Resources Biannual Report‘, July 2004.
UNEMPLOYMENT IN JORDAN
22
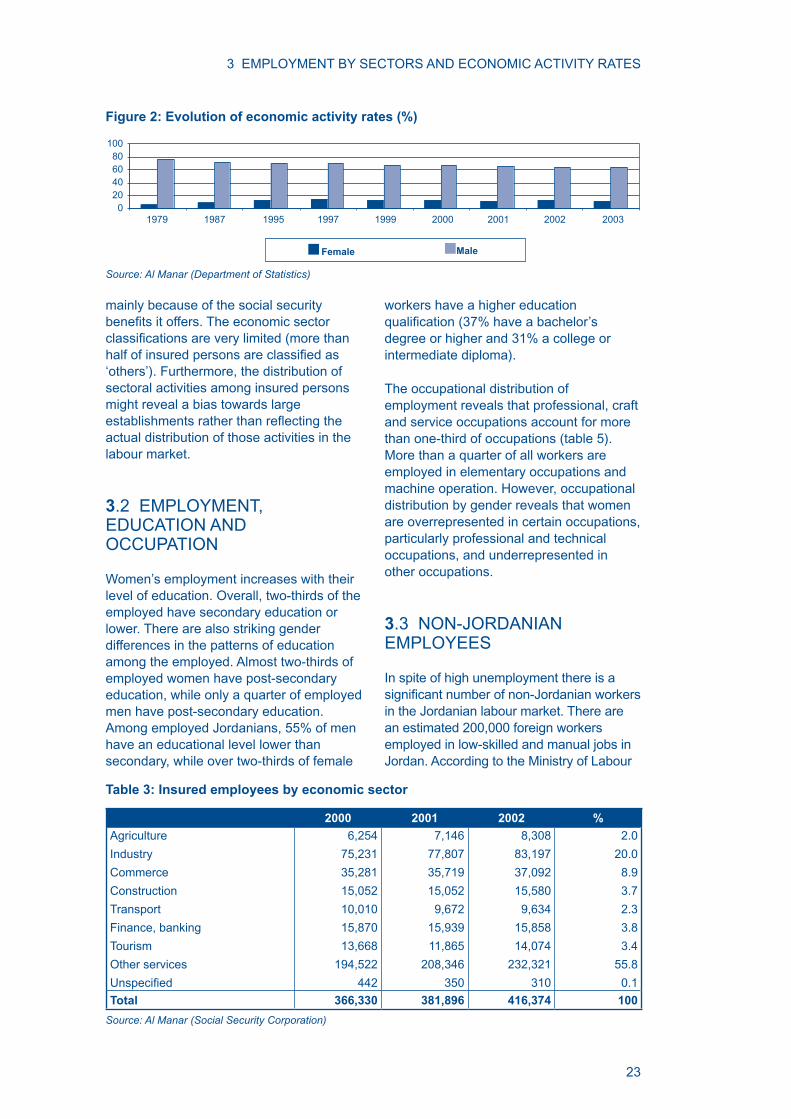
The economic activity rate is still low and has declined overall since 1979 from 41.8% to 37.4% (table 2, figure 2). However, while ithas declined for men, it has almost doubled for women. The decline of the economic activity rate requires an explanation. This total low participation rate is due to the age structure of the population, which is weighted towards young people, the large number of students, low female participation in the labour market (at least partly for sociological and cultural reasons), and retirement at an early age in the public sector. Moreover, until 1996 employment surveys included non-Jordanian workers in the data sets, but they no longer do so. Given the large number of non-Jordanian workers in Jordan, excluding them from the analysis of the labour market might contribute to the distortion of labour market statistics, and creates a knowledge gap about the labour market, thus weakening the development of efficient nationalemployment policies.
Table 1: Employment by sector and year (%)
1987 1990 1995 2000 2003
Agriculture
Manufacturing industries
Electricity, gas, water
Construction
Trade, hotels and restaurants
Transport and communications
Finance, real estate, etc.
Public administration, social services, etc.
7.4
10.5
1.7
10.5
9.8
9.2
3.3
47.6
7.3
10.2
1.3
9.9
10.1
8.5
3.2
49.5
6.9
14.4
1.4
10.0
16.2
9.2
3.8
38.1
4.9
13.6
1.7
6.5
19.5
9.6
4.9
39.3
3.6
13.7
1.7
6.4
20.3
10.0
5.3
39.0Total 100 100 100 100 100
Source: Al Manar (Department of Statistics)
Table 2: Economic activity rates in Jordan for population aged 15-64 (%)
Male Female Total
1979
1987
1995
2000
2003
76.3
70.7
70.1
66.1
63.2
6.4
9.3
12.3
12.3
11.2
41.8
41.0
41.6
39.4
37.4
Source: Al Manar (Department of Statistics)
It is obligatory for firms of five employees ormore to enrol in the Social Security Corporation (SSC). More recently,individuals in smaller establishments and Jordanian expatriates have been able to enrol voluntarily in the scheme. Nevertheless, according to the SSC, the percentage of the total labour force who contributes to social security is estimated at almost 30%.7 The public sector may be considered more attractive
7 Microenterprises (enterprises with fewer than five workers) are not entitled to contribute to the SSC. Inaddition, for the approximately 416,000 individuals contributing to the SSC scheme, there are government and military pension schemes which cover almost 100,000 beneficiaries. From 2004 on, the new civil servantsand military staff will be incorporated into this system. The estimated coverage of social security should be increased proportionally to around 60% of employees.
Figure 1: Employment by sector, 1987 and 2003 (%)
0
10
2030
40
50
1987 2003
Agric.
Manufacturing
Electricity, W
ater
Constructio
n
Trade, Hotels
Transport, Comm.
Finance, Real E
state
Public Admin.
& Social services
Source: Al Manar (Department of Statistics)
3 EMPLOYMENT BY SECTORS AND ECONOMIC ACTIVITY RATES
23
mainly because of the social security benefits it offers. The economic sectorclassifications are very limited (more thanhalf of insured persons are classified as‘others’). Furthermore, the distribution of sectoral activities among insured persons might reveal a bias towards large establishments rather than reflecting theactual distribution of those activities in the labour market.
3.2 EMPLOYMENT, EDUCATION AND OCCUPATION
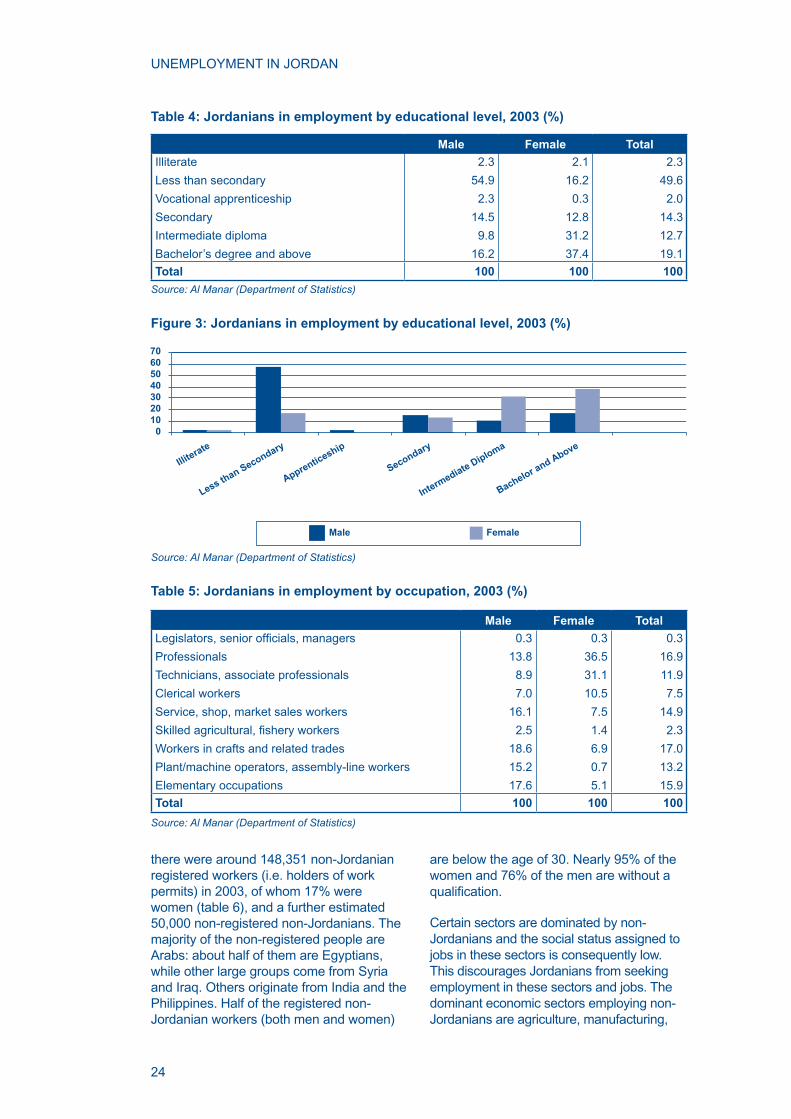
Women’s employment increases with their level of education. Overall, two-thirds of the employed have secondary education or lower. There are also striking gender differences in the patterns of education among the employed. Almost two-thirds of employed women have post-secondary education, while only a quarter of employed men have post-secondary education. Among employed Jordanians, 55% of men have an educational level lower than secondary, while over two-thirds of female
Figure 2: Evolution of economic activity rates (%)
Source: Al Manar (Department of Statistics)
10080604020
0
Female Male
1979 1987 1995 1997 1999 2000 2001 2002 2003
workers have a higher education qualification (37% have a bachelor’sdegree or higher and 31% a college or intermediate diploma).
The occupational distribution of employment reveals that professional, craft and service occupations account for more than one-third of occupations (table 5). More than a quarter of all workers are employed in elementary occupations and machine operation. However, occupational distribution by gender reveals that women are overrepresented in certain occupations, particularly professional and technical occupations, and underrepresented in other occupations.
3.3 NON-JORDANIAN EMPLOYEES
In spite of high unemployment there is a significant number of non-Jordanian workersin the Jordanian labour market. There are an estimated 200,000 foreign workers employed in low-skilled and manual jobs in Jordan. According to the Ministry of Labour
Table 3: Insured employees by economic sector
2000 2001 2002 %
Agriculture
Industry
Commerce
Construction
Transport
Finance, banking
Tourism
Other services
Unspecified
6,254
75,231
35,281
15,052
10,010
15,870
13,668
194,522
442
7,146
77,807
35,719
15,052
9,672
15,939
11,865
208,346
350
8,308
83,197
37,092
15,580
9,634
15,858
14,074
232,321
310
2.0
20.0
8.9
3.7
2.3
3.8
3.4
55.8
0.1
Total 366,330 381,896 416,374 100
Source: Al Manar (Social Security Corporation)
UNEMPLOYMENT IN JORDAN
24
Table 4: Jordanians in employment by educational level, 2003 (%)
Male Female Total
Illiterate
Less than secondary
Vocational apprenticeship
Secondary
Intermediate diploma
Bachelor’s degree and above
2.3
54.9
2.3
14.5
9.8
16.2
2.1
16.2
0.3
12.8
31.2
37.4
2.3
49.6
2.0
14.3
12.7
19.1
Total 100 100 100
Source: Al Manar (Department of Statistics)
there were around 148,351 non-Jordanian registered workers (i.e. holders of work permits) in 2003, of whom 17% were women (table 6), and a further estimated 50,000 non-registered non-Jordanians. The majority of the non-registered people are Arabs: about half of them are Egyptians, while other large groups come from Syria and Iraq. Others originate from India and the Philippines. Half of the registered non-Jordanian workers (both men and women)
are below the age of 30. Nearly 95% of the women and 76% of the men are without a qualification.
Certain sectors are dominated by non-Jordanians and the social status assigned to jobs in these sectors is consequently low. This discourages Jordanians from seeking employment in these sectors and jobs. The dominant economic sectors employing non-Jordanians are agriculture, manufacturing,
Figure 3: Jordanians in employment by educational level, 2003 (%)
����������
���������������
��������
��
�������
�����
������
�
�����
����
������
������
��������
������
�������
�
�������
�����
������
Source: Al Manar (Department of Statistics)
Table 5: Jordanians in employment by occupation, 2003 (%)
Male Female Total
Legislators, senior officials, managers
Professionals
Technicians, associate professionals
Clerical workers
Service, shop, market sales workers
Skilled agricultural, fishery workers
Workers in crafts and related trades
Plant/machine operators, assembly-line workers
Elementary occupations
0.3
13.8
8.9
7.0
16.1
2.5
18.6
15.2
17.6
0.3
36.5
31.1
10.5
7.5
1.4
6.9
0.7
5.1
0.3
16.9
11.9
7.5
14.9
2.3
17.0
13.2
15.9
Total 100 100 100
Source: Al Manar (Department of Statistics)

3 EMPLOYMENT BY SECTORS AND ECONOMIC ACTIVITY RATES
25
and social and personal services, followed by construction, restaurants and hotels. Private sector employers also prefer non-Jordanian workers, for a variety of reasons (willingness to work longer hours, greater compliance). This segmentation of the labour market along nationality lines creates a huge barrier to entry into the labour market for Jordanians in general and Jordanian women in particular. However, information about non-Jordanian workers based solely on work permits is not accurate and can be misleading.8 First, non-Jordanian workers do not necessarily work in the occupations registered in their permits. Second, the figures do not cover those whoare working without work permits or illegally.
At the same time, the Jordanian labour market is also distorted by large numbers of Jordanian labour expatriates. Although there are no official statistics, an estimated350,000 Jordanians are working abroad, mainly in the Gulf. Many of them are in highly skilled and professional occupations.9
3.4 EMPLOYMENT AND THE INFORMAL ECONOMY
Unfortunately, no specific study or surveydocuments the activities of the informal economy in Jordan or gives an overview of
Table 6: Non-Jordanian workers holding work permits by economic sector, 2003
Male Female Total %
Agriculture
Mining, quarrying
Manufacturing
Electricity, gas, water
Construction
Trade, restaurant, hotels
Transport, communications
Finance and business
Social and personal services
43,162
1,968
22,055
89
22,405
16,054
1,120
1,762
14,609
224
8
9,657
3
38
271
51
30
14,845
43,386
1,976
31,712
92
22,443
16,325
1,171
1,792
29,454
29.2
1.3
21.4
0.1
15.1
11.0
0.8
1.2
19.9
Total 123,224 25,127 148,351 100
Source: Al Manar (Ministry of Labour)
its size, characteristics and problems. Haan and Mryyan10 have tried to estimate the size and features of the informal economy using the Employment and Compensation of Employees Surveys carried out by the Department of Statistics in 2001 and 2002. They estimated that about 200,000 persons were currently working in the informal economy. The surveys also present statistics on numbers of firms andemployment by different firm sizes.However, Haan and Mryyan identity two major limitations of the surveys.
(i) Only registered business activities are covered.
(ii) Home- and street-based activities are not included, which means that the surveys leave out precisely those activities which are possibly among the most important in the informal economy, accounting for at least 50% of total informal employment.
The DOS surveys show that firms with 1–4workers make up more than 90% of the total number of firms surveyed and firmswith 5–19 workers another 8%. In other words, micro- and small enterprises constitute 98% of all firms in Jordan.
Haan and Mryyan estimate that persons employed in firms with 1–4 workers account
8 Unfortunately, the DOS no longer includes information about non-Jordanian workers in its employment surveys. It is therefore quite difficult to estimate accurately the number or distribution of non-Jordanianworkers in Jordan.
9 Hans Christiaan Haan and Nader Mryyan, ‘Skills acquisition for the informal micro-enterprise sector in Jordan’, Draft report, World Bank, European Training Foundation, 2003.
10 Ibid.
UNEMPLOYMENT IN JORDAN
26
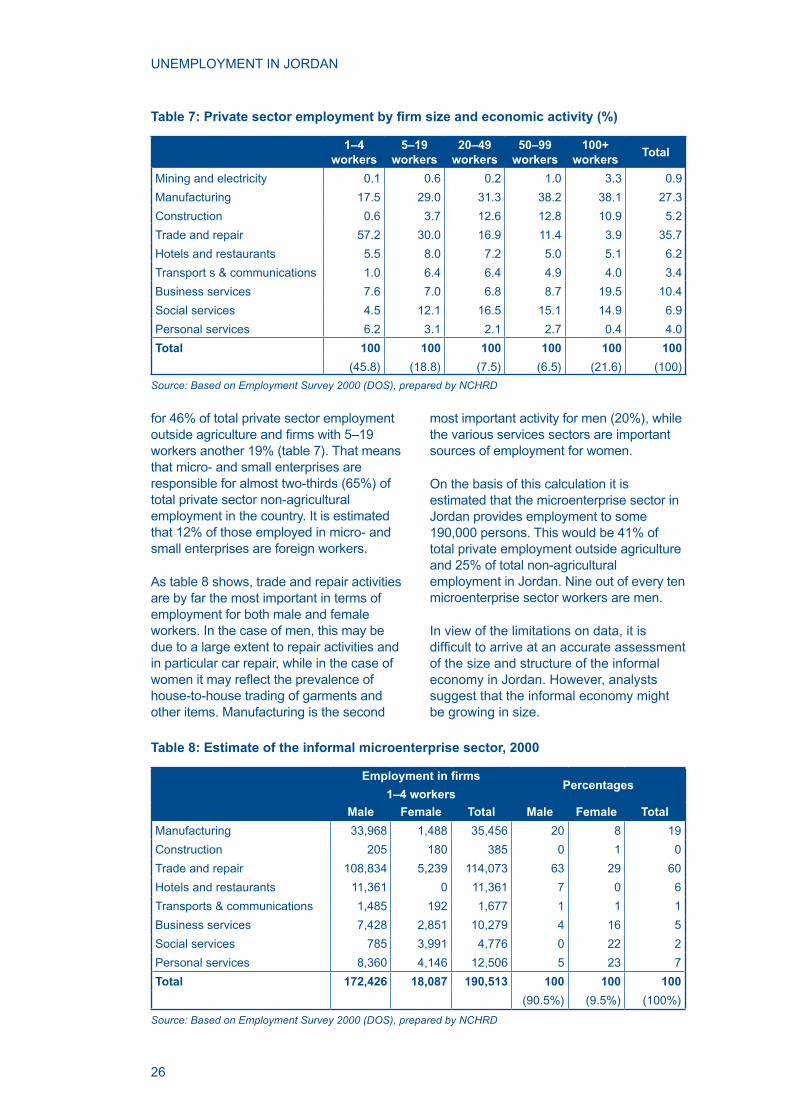
for 46% of total private sector employment outside agriculture and firms with 5–19workers another 19% (table 7). That means that micro- and small enterprises are responsible for almost two-thirds (65%) of total private sector non-agricultural employment in the country. It is estimated that 12% of those employed in micro- and small enterprises are foreign workers.
As table 8 shows, trade and repair activities are by far the most important in terms of employment for both male and female workers. In the case of men, this may be due to a large extent to repair activities and in particular car repair, while in the case of women it may reflect the prevalence ofhouse-to-house trading of garments and other items. Manufacturing is the second
Table 7: Private sector employment by firm size and economic activity (%)
1–4 workers
5–19 workers
20–49 workers
50–99 workers
100+ workers
Total
Mining and electricity 0.1 0.6 0.2 1.0 3.3 0.9
Manufacturing 17.5 29.0 31.3 38.2 38.1 27.3
Construction 0.6 3.7 12.6 12.8 10.9 5.2
Trade and repair 57.2 30.0 16.9 11.4 3.9 35.7
Hotels and restaurants 5.5 8.0 7.2 5.0 5.1 6.2
Transport s & communications 1.0 6.4 6.4 4.9 4.0 3.4
Business services 7.6 7.0 6.8 8.7 19.5 10.4
Social services 4.5 12.1 16.5 15.1 14.9 6.9
Personal services 6.2 3.1 2.1 2.7 0.4 4.0
Total 100 100 100 100 100 100
(45.8) (18.8) (7.5) (6.5) (21.6) (100)
Source: Based on Employment Survey 2000 (DOS), prepared by NCHRD
most important activity for men (20%), while the various services sectors are important sources of employment for women.
On the basis of this calculation it is estimated that the microenterprise sector in Jordan provides employment to some 190,000 persons. This would be 41% of total private employment outside agriculture and 25% of total non-agricultural employment in Jordan. Nine out of every ten microenterprise sector workers are men.
In view of the limitations on data, it is difficult to arrive at an accurate assessmentof the size and structure of the informal economy in Jordan. However, analysts suggest that the informal economy might be growing in size.
Table 8: Estimate of the informal microenterprise sector, 2000
Employment in firms
1–4 workersPercentages
Male Female Total Male Female Total
Manufacturing 33,968 1,488 35,456 20 8 19
Construction 205 180 385 0 1 0
Trade and repair 108,834 5,239 114,073 63 29 60
Hotels and restaurants 11,361 0 11,361 7 0 6
Transports & communications 1,485 192 1,677 1 1 1
Business services 7,428 2,851 10,279 4 16 5
Social services 785 3,991 4,776 0 22 2
Personal services 8,360 4,146 12,506 5 23 7
Total 172,426 18,087 190,513 100 100 100
(90.5%) (9.5%) (100%)
Source: Based on Employment Survey 2000 (DOS), prepared by NCHRD

27
4 ANALYSIS OF INFORMATION ON JOBSEEKERS
Unemployment is the main challenge facing the Jordanian labour market. According to the estimates of the Department of Statistics, the unemployment rate is around 15%. This means that some 160,000 persons who want to work are without a job.11
This analysis of the existing information sketches a picture of unemployment in Jordan. During the year 2002, the number of Jordanian jobseekers, mainly unskilled or low-skilled people, registered at different labour offices in all governorates was10,031 and 5,159 of these people found a job. However, according to other sources, the jobseekers who registered at the Ministry of Labour account for less than 10% of unemployed persons.
4.1 UNEMPLOYMENT AND GENDER
Although it is difficult to establish thenumber of unemployed people in Jordan, it
is known that they are mostly men: in the three years reviewed (2001–03), 75–80% of the unemployed were men.
Figure 4: Distribution of unemployed Jordanians by gender (%)
100
80
60
40
20
0
male
female
2001 2002 2003
Source: Al Manar (Department of Statistics)
However, it is important to contrast this ratio with the unemployment and activity rates by gender, which underline the fact that women experience unemployment to a greater extent than men. In 2003, among the economically active population, 21% of women and 13% of
4
11 Al Manar, ‘Human Resources Biannual Report’, July 2004.

UNEMPLOYMENT IN JORDAN
28
men were jobseekers (table 9). One in five economically active women waslooking for a job. The female unemployment rate was 50% higher than the male rate.
4.2 UNEMPLOYMENT AND YOUTH
A characteristic of youth in Jordan is the difficulty in obtaining a job. Almost 60% ofjobseekers, both male and female, are below the age of 25 (table 10). (As a comparison, the 25–39 age group represents about a third of the total number of unemployed persons, 39% in the case of women. The 40–54 age group constitutes 7% of jobseekers, with a slight male majority.)
There is a gender-based difference in the category of young unemployed people: whereas 55% of unemployed women are in
Table 9: Unemployment and economic activity rates in Jordan (%)
Male Female Total
Unemployment rate
1995
1997
2000
2003
13.0
11.7
12.3
13.4
29.4
28.5
21.0
20.8
15.3
14.4
13.2
14.5Economic activity rate
1995
1997
2000
2003
70.1
69.2
66.1
63.2
12.3
13.9
12.3
11.2
41.6
42.0
39.4
37.4
Source: Al Manar (Department of Statistics)
Table 10: Distribution of unemployed Jordanians by gender and age group, 2003 (%)
Male Female Total
15–19 years
20–24 years
25–39 years
40–54 years
55 +
20.7
37.6
31.6
8.7
1.3
3.6
54.6
39.4
2.3
0.1
17.0
41.2
33.3
7.3
1.2
Total 100 100 100
Source: Al Manar (Department of Statistics)
the 20–24 age group compared with 38% of men, only 4% of unemployed women are in the 15–19 age group compared with 21% of young men. More women are unemployed in the middle age groups and fewer among those under 19 and over 40 years of age.
Young people, and especially young women, are more at risk of unemployment than any other segment of the population. As table 11 shows, a third of young people are seeking a job. The highest unemployment rates for women are found in the 20–24 age group (44%) and for men in the 15–19 age group (37%).
4.3 UNEMPLOYMENT AND QUALIFICATIONS
Analysing the composition of unemployment in Jordan by educational level (table 12), we find that the largestunemployed group is that of people with an educational level lower than secondary (53%). Unemployed people with only primary and basic education constitute 38% of the total, and men constitute 93% of this group. A low level of education is therefore a key factor in unemployment among the male population.
Women seeking jobs have a higher qualification than men. Some 76% offemale jobseekers have an intermediate diploma and above, whereas 65% of
Table 11: Key indicators in 2003 by age (%)
Male Female Total
Unemployment rate
15–19 years
20–24 years
25–39 years
40–54 years
55 +
13.4
36.9
24.8
9.5
5.7
3.1
20.8
38.6
43.6
15.1
2.9
3.0
14.5
37.0
28.2
10.5
5.3
3.1Economic activity rate
15–19 years
20–24 years
25–39 years
40–54 years
55 +
63.2
22.8
69.1
92.9
82.6
43.2
11.2
1.1
18.3
18.8
10.3
1.3
37.4
12.4
45.8
55.0
44.2
22.6Source: Al Manar (Department of Statistics)

4 ANALYSIS OF INFORMATION ON JOBSEEKERS
29
unemployed men have less than a secondary education (table 12). In the three years reviewed, unemployment affected 31–35% of women with an intermediate diploma but only 5–6% of men at this educational level, 6–7 times fewer than women (figure 6). The samepattern applies to those with a bachelor’s degree: only 10–11% of unemployed men have this educational qualification, while3–4 times more women with a first degreeare unemployed.
It is at university level that the gap between men and women is the most telling. However, for a variety of reasons women in Jordan tend to have a higher qualification. A serious analysis of thispoint requires an examination of the nature of women’s higher education qualifications and their period ofunemployment.
The unemployment rate of women with a higher than secondary education seems to increase as their level of educational attainment rises (see table 13). While lower educational levels do not necessarily hinder men from finding a job, women continuetheir studies before entering the labour market in order to be eligible for positions with acceptable conditions. The highest economic activity rates for women are found at the level of intermediate and university diplomas (36% and 63% respectively). In short, the economic activity rates for both women and men in the labour force is related to their level of education.
It is also noticeable that the economic activity rate is twice as high for unmarried women as for married women (16% and 8% respectively) while the rate is the highest for married men (73% against 54% for unmarried men).
Figure 5: Distribution of unemployed Jordanians by gender and age group (%)
Source: Al Manar (Department of Statistics)
60
50
40
30
20
10
0male2001
female2001
male2002
female2002
male2003
female2003
15-19
20-24
25-39
40 +
Table 12: Distribution of unemployed Jordanians by level of education, 2003 (%)
Level of education Male Female Total
Illiterate
Lower than secondary
Vocational apprenticeship
Secondary education
Intermediate diploma
Bachelor’s degree and above
1.9
63.6
4.0
12.0
6.0
12.5
0.2
13.6
0.3
9.8
31.2
44.9
1.5
53.0
3.2
11.5
11.4
19.4
Total 100 100 100
Source: Al Manar (Department of Statistics)

UNEMPLOYMENT IN JORDAN
30
Table 13: Key indicators in 2003 by level of education (%)
Male Female Total
Unemployment rate
Illiterate
Lower than secondary
Vocational apprenticeship
Secondary education
Intermediate diploma
Bachelor’s degree and above
13.4
10.7
15.2
21.3
11.4
8.7
10.7
20.8
2.6
18.2
20.4
16.8
20.9
24.0
14.5
9.8
15.3
21.3
12.1
13.2
14.7Economic activity rate
Illiterate
Lower than secondary
Vocational apprenticeship
Secondary education
Intermediate diploma
Bachelor’s degree and above
63.2
28.0
61.7
95.1
51.3
89.6
83.8
11.2
1.3
3.5
21.8
7.5
35.7
63.0
37.4
8.3
34.9
89.4
29.1
57.5
76.2
Source: Al Manar (Department of Statistics)
Figure 6: Distribution of unemployed men and women by educational level (%)
Source: Al Manar (Department of Statistics)
0
10
20
30
40
50
60
70
80
male
2001
female
2001
male
2002
female
2002
male
2003
female
2003
Illiterate
Lower than secondary
Secondary
Intermediate diploma
Bachelor+
4 ANALYSIS OF INFORMATION ON JOBSEEKERS
31
Tracer studies following up VTC training programmes
The Vocational Training Corporation (VTC), Jordan’s main vocational training provider, has carried out tracer studies analysing the professional situation of school leavers on the labour market. The data obtained in these follow-up studies could indicate the employment opportunities graduates in the different specialisms might encounter when seeking a job. The total number of graduates in the VTC’s different training programmes was 7,783 in 2002 and 6,420 in 2001.
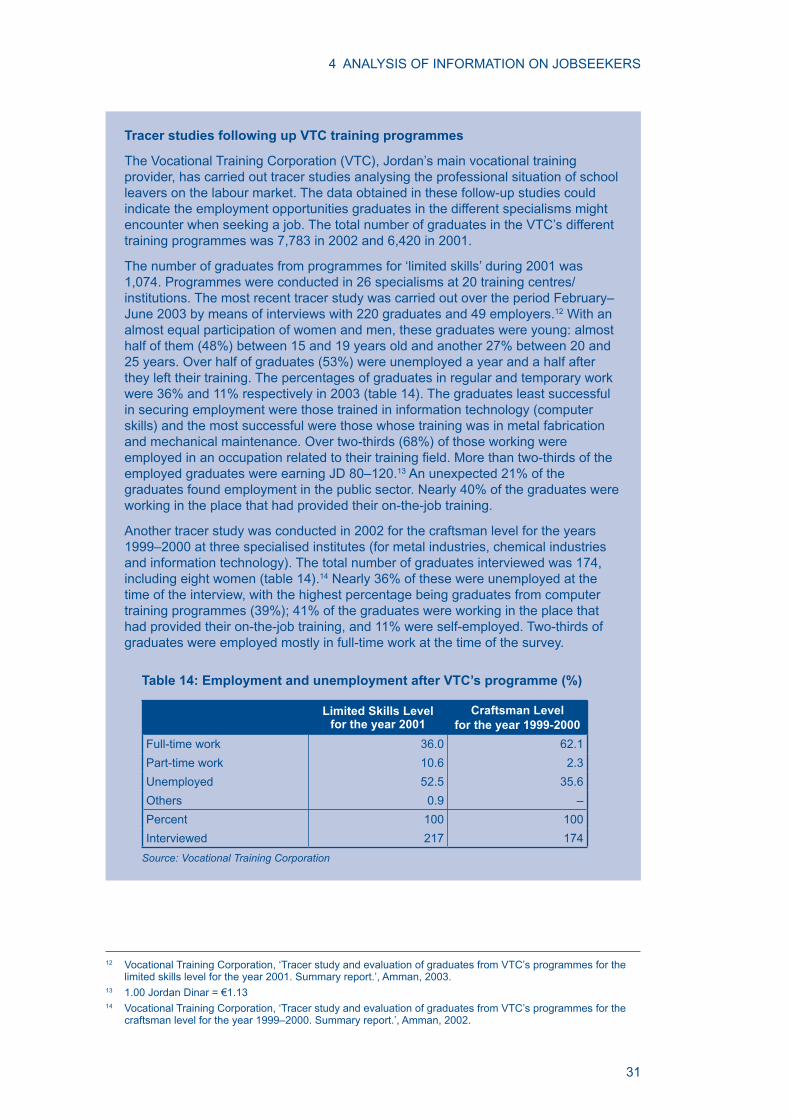
The number of graduates from programmes for ‘limited skills’ during 2001 was 1,074. Programmes were conducted in 26 specialisms at 20 training centres/institutions. The most recent tracer study was carried out over the period February–June 2003 by means of interviews with 220 graduates and 49 employers.12 With an almost equal participation of women and men, these graduates were young: almost half of them (48%) between 15 and 19 years old and another 27% between 20 and 25 years. Over half of graduates (53%) were unemployed a year and a half after they left their training. The percentages of graduates in regular and temporary work were 36% and 11% respectively in 2003 (table 14). The graduates least successful in securing employment were those trained in information technology (computer skills) and the most successful were those whose training was in metal fabrication and mechanical maintenance. Over two-thirds (68%) of those working were employed in an occupation related to their training field. More than two-thirds of theemployed graduates were earning JD 80–120.13 An unexpected 21% of the graduates found employment in the public sector. Nearly 40% of the graduates were working in the place that had provided their on-the-job training.
Another tracer study was conducted in 2002 for the craftsman level for the years 1999–2000 at three specialised institutes (for metal industries, chemical industries and information technology). The total number of graduates interviewed was 174, including eight women (table 14).14 Nearly 36% of these were unemployed at the time of the interview, with the highest percentage being graduates from computer training programmes (39%); 41% of the graduates were working in the place that had provided their on-the-job training, and 11% were self-employed. Two-thirds of graduates were employed mostly in full-time work at the time of the survey.
12 Vocational Training Corporation, ‘Tracer study and evaluation of graduates from VTC’s programmes for the limited skills level for the year 2001. Summary report.’, Amman, 2003.
13 1.00 Jordan Dinar = €1.1314 Vocational Training Corporation, ‘Tracer study and evaluation of graduates from VTC’s programmes for the
craftsman level for the year 1999–2000. Summary report.’, Amman, 2002.
Table 14: Employment and unemployment after VTC’s programme (%)
Limited Skills Level for the year 2001
Craftsman Level for the year 1999-2000
Full-time work 36.0 62.1
Part-time work 10.6 2.3
Unemployed 52.5 35.6
Others 0.9 –
Percent 100 100
Interviewed 217 174
Source: Vocational Training Corporation

UNEMPLOYMENT IN JORDAN
32
Table 16: Duration of unemployment (%)
2000 2001 2002 2003
Less than a month
1-11 months
A year or more
20
37
41
23
60
17
20
59
20
17
69
14
Total 100 100 100 100
Source: Al Manar (Department of Statistics)
4.4 DURATION OF UNEMPLOYMENT AND METHODS OF JOBSEEKING
Men are more heavily represented in short-term unemployment: 87% of men in table 15 had been unemployed for less than one year, whereas women were more strongly represented in long-term unemployment.15 In 2003, around 3% of jobseekers had been out of the system for over two years. Some 20% of unemployed women had been out of work for at least one year.
If the characteristic feature of youth employment is difficulty in obtaining a firstjob, precariousness and short-time working appear to be typical constraints for the 25–40 age group and especially for the least qualified. For people over 40,unemployment leading to exclusion from the labour market is caused by a lesser adaptability to the constraints of new working structures.
As shown in table 16, an estimated 14% of unemployed people were in long-term unemployment in 2003. This figure is verylow when compared both with other international data and with the data from
15 Long-term unemployment = unemployment of one year or more.
previous years. However, the discrepancy could be explained by the quality of the data used to obtain the result. Some cross-analysis should be done in this respect to improve the data quality.
The sharp reduction in long-term unemployment between 2000 and 2003 may also have been caused by the analysis’s own definition of theunemployment situation. ‘Discouraged workers’ who had lost a job but had not made an effort to find a new job in a givenweek were not classified as unemployed oreven as being in the labour force. This view is confirmed by the answers given byJordanians not in the economically active population but available to work, about half of whom believed that no job was available (table 17). Among those, men (57% of non-active adults) were more strongly represented than women (47%). There are clear gender disparities in the reasons given for not seeking a job. More severely discouraged than men, 15% of women (in contrast to 10% of men) reported being tired of trying to find work, but 17%,especially women in the youngest age groups (24%), gave other explanations. It would be interesting to know what factors – including marriage and children – influenced these answers from women.
If these data could be extrapolated to the 14% of the population in long-term unemployment, they should be added to the number of non-active (discouraged) persons who would accept a suitable employment offer.
The fact that the Jordanian labour market system does not have a set of passive measures for protecting the unemployed for a number of months until they get a
Table 15: Unemployed Jordanians by duration of unemployment, 2003 (%)
Male Female Total
Less than 1 month
1–12 months
13–24 months
25+ months
18.0
69.4
9.9
2.7
12.5
67.5
14.6
5.4
16.8
69.0
10.9
3.3
Total 100 100 100
Source: Al Manar (Department of Statistics)

4 ANALYSIS OF INFORMATION ON JOBSEEKERS
33
Table 17: Reasons for not seeking work given by economically inactive population available for work (%)
Male Female Total
Believe no work available
Tired of seeking work
Do not know how to seek work
Cannot find suitable work
Not qualified
Other
57.5
9.6
1.4
14.8
6.1
10.6
46.7
15.4
2.3
12.2
6.4
17.0
53.1
12.0
1.8
13.7
6.2
13.2
Total 100 100 100
Source: Department of Statistics
new job (unemployment benefit) couldalso explain the different behaviour of long-term unemployment in Jordan compared with OECD countries. In 2003, in the OECD countries overall, long-term unemployment represented 30% of the unemployed (figure 7). This proportionwas increased up to 45% for the countries of the European Union. In three out of the 30 OECD countries – Germany (50%), Italy (58%), and Greece (56%) – more than 50% of the unemployed were long-term unemployed. The data indicate that from the point of view of policy design, active employment measures should concentrate on the unemployed at the very beginning of their jobseeking period, in order to prevent discouragement.
Unemployed men and women behave differently when seeking a job. The most common first method of jobseeking (table18) is to pay direct visits to establishments and workplaces. Direct contacts and visits with employers are more characteristic for men (66%) than for women (51%). Probably for sociological and cultural reasons, women tend to rely on a more structured and formalised system such as enrolment at public job services: some 19% apply to the Civil Service Bureau compared to only 3% of men. For men, using networks of relations in the private sphere is a common method: some 13% of men seek the assistance of relatives and friends. Although women have a lower economic activity rate than men and there is a higher incidence of unemployment (in
Figure 7: Long-term unemployment (12 months or more) by gender (%)
Sources: OECD, Al Manar (Department of Statistics)
70
60
50
40
30
20
10
0Italy Greece Germany EU OECD Jordan
MenWomenTotal

UNEMPLOYMENT IN JORDAN
34
Table 18: Distribution of unemployed Jordanians by first jobseeking method, 2003 (%)
Male Female Total
Reading, watching, responding to ads in newspapers, TV
Visits to establishments and workplaces
Seeking assistance of relatives, friends, etc.
Applying to labour offices
Applying to Civil Service Bureau
Other
12.7
66.1
13.2
3.5
2.7
1.8
13.9
50.8
8.6
5.2
19.3
2.2
13.0
62.7
12.2
3.9
6.3
1.9
Total 100 100 100
Source: Al Manar (Department of Statistics)
absolute terms) among men than women, the number of applicants to the Civil Service Bureau is significantly higher inthe case of women.
Generally, women tend to use the method of reading/watching and responding to ads in newspapers and TV more than men. In general, confidence in labour offices is verylow, although women use them a little more than men.
As figure 8 shows, while most malejobseekers (81%) in 2003 already had experience of work, a small majority of female jobseekers (57%) were without previous experience. Overall during the three years under review, between 75% and 82% of unemployed men had worked before, but most unemployed women were seeking their first job. This suggeststhat there are some obstacles that prevent women from fully participating in the labour market.
Nearly 81% of male and 43% of female jobseekers have previous job experience. It is interesting to observe the types of sector or industry where employed men and women have worked before seeking a job.16 Table 19 shows the distribution of employed Jordanians by main current industries during the year 2003. It shows that 41% of women were concentrated in just one economic activity – education – whereas men were present across various industries.
The main reason given by Jordanians for seeking different or additional work is wages, followed by working conditions. A category of ‘insufficient’ or ‘unsatisfactory’employment is used to refer to the situation of employed persons of 15+ years of age who want a new or additional job and are available for work. Nearly eight out of 10 employed persons who want another job are paid employees; 40% are aged under 25. As table 20 indicates, about 70% of
Figure 8: Unemployed Jordanians by employment status (%)
Source: Al Manar (Department of Statistics)
0
20
40
60
80
100
male
2001
female
2001
male
2002
female
2002
male
2003
female
2003
Ever worked
Never worked
16 No data are available about the industries and occupations in which unemployed men and women worked before seeking a job, nor for how long they worked there or the reasons why they lost/quit their job.

4 ANALYSIS OF INFORMATION ON JOBSEEKERS
35
Table 19: Employed Jordanians by main current industry, 2003 (%)
Male Female Total
Agriculture, hunting, forestry
Manufacturing industries
Mining and quarrying
Electricity, gas, water supply
Construction
Wholesale, retail trade, repair, etc.
Hotels and restaurants
Transport and communications
Financial services
Real estate, renting, business activities
Public administration, defence, etc.
Education
Health and social work
Other community social and personal services
Private household with employed persons
Extraterritorial organisations and bodies
3.8
12.6
1.4
1.9
7.2
19.8
2.7
11.1
1.4
3.2
18.4
7.0
3.2
5.7
0.2
0.3
2.1
10.7
0.3
0.4
1.1
5.7
0.7
2.8
4.1
5.5
5.2
40.7
13.8
4.9
1.3
0.7
3.6
12.4
1.3
1.7
6.4
17.8
2.5
10.0
1.8
3.5
16.6
11.7
4.7
5.6
0.2
0.3Total 100 100 100
Source: Al Manar (Department of Statistics)
Table 20: Reasons given by employed persons for wanting different or additional work, 2003 (%)
Male Female Total
Insufficient earnings
Does not suit the educational qualification
Short hours
Long hours
Working conditions
Far from residence
Transportation difficulties
Does not like the present job
Other
70.1
2.4
0.2
4.0
15.7
0.5
0.2
4.1
2.9
57.6
5.0
0.4
7.6
17.6
1.3
0.4
2.5
7.6
69.0
2.6
0.2
4.3
15.8
0.6
0.2
4.0
3.3
Total 100 100 100
Source: Department of Statistics
people seeking different or additional work cite insufficient earnings as a reason. Infact, the monthly wages of Jordanian social security participants averaged JD 230 in 2000 – JD 245 for men and JD 192 for women.17 Women also consider poor working conditions and long hours detrimental and cite them as a reason for wanting to change their employment.
To develop this analysis further, it is essential to obtain more information
about the wage rates throughout the workforce, especially at the lower end of the spectrum,18 in relation to variables such as working conditions, working hours, industry or sector, and job description. Department of Statistics data indicate that half of employed Jordanians earned JD 100–199 per month in 2003; as for weekly hours of work, 38% of employed persons said they worked 37–50 hours a week and 21% reported 51–70 hours.
17 Social Security Corporation, ‘Annual report 2000‘.18 The definition of ‘low-waged’ used by OECD is a wage less than two-thirds of the median wage.

37
55 SUPPLY AND DEMAND IN THE GOVERNMENT SECTOR
The public sector is one of the largest sectors of the Jordanian labour market, with 141,000 employees working in the government departments, according to the Civil Service Bureau (CSB). This sector is also a favoured choice of new entrants into the labour market.
The number of female applicants is significantly higher than that of maleapplicants. The number of persons applying to the CSB jumped from 77,625 in 1992 to 168,133 in 2003. Women were 64% of this total in 2003, compared with 47% ten years earlier. It seems that women tend to prefer government jobs, probably for the stability and security, shorter working hours and work–family balance they offer. While two-thirds of the applicants for government posts are
women, there is almost gender parity among those finally appointed: womenrepresented 48% of the successful candidates in 2003, down from 51% in 2002. The Ministry of Education makes the highest number of appointments – nearly 60% of the total in 2003, with a slight female majority – followed by the Ministry of Health, with 30% of total appointees.
In 2003, nearly 2,700 male and 2,500 female applicants were finally appointed.Because the available vacancies were limited and the number of graduates increasing, only 3.1% out of the total number of applicants were appointed. Looking at the general trend, we can see that men show better results than women in this respect: their recruitment rate19 is 4.5% whereas the rate for women is 2.3%.
19 Recruitment rate = number of appointees/number of applicants X 100.

UNEMPLOYMENT IN JORDAN
38
As table 21 shows, holders of bachelor’s degrees make up about half of the total number of applicants, followed by holders of community college diplomas (intermediate diplomas). The largest category of applicants is represented by female holders of community college diplomas (47,758). It is noticeable that, although a significant number of studentsend their schooling at intermediate diploma level, the labour market (judging by the public employment offers) relies much more heavily on those with a bachelor’s degree. This would explain, on the one hand, the great demand for jobs among
Table 21: Applicants and appointees during the year 2003
QualificationsNumbers of applicants Numbers of appointees
Male Female Total Male Female Total
Doctorate
Specialised degree
Master’s degree
Higher diploma
Bachelor’s degree
Intermediate diploma
General secondary
506
128
1,764
260
38,164
15,210
4,592
17
40
932
494
47,758
51,485
6,783
523
168
2,696
754
85,922
66,695
11,375
3
12
68
18
2,310
292
0
0
2
75
30
1,876
486
0
3
14
143
48
4,186
778
0
Total 60,624 107,509 168,133 2,703 2,469 5,172
Source: Al Manar (Civil Service Bureau)
those with intermediate diplomas (40% of the total number of applicants, and 48% of female applicants). On the other hand, the recruitment rate for this group is very low: while the appointment rate for all applicants is 3.1%, for those with intermediate diplomas it is only 1.2%. There are also gender differences: the recruitment rate for women with intermediate diplomas is even lower than the overall rate (0.9%), while for men it is slightly larger, at 1.9%.
Applicants with educational qualificationshigher than a bachelor’s degree record a good success rate, even better for the young
Recruitment examples by field of education
The following information indicates some gaps between supply and demand in the government sector according to applicants’ field of education. For instance, therecruitment rate is relatively high for nursing, at 40% for men and 29% for women. On the contrary, there is a significant number of applicants who have studiedGeneral Science or Finance and Banking, for whom the recruitment rate is very low, as table 22 shows.
Table 22: Applicants and appointees by field of education in 2003
Applicants Appointees
Male Female Male Female
Nursing
Geography
Financing and Banking
General Sciences
Computer Sciences
Mathematics
Midwife
Business administration
879
432
1,046
121
1,766
605
0
2,745
913
1,074
1,558
1,120
1,180
2,492
134
3,940
356
34
1
1
179
174
0
45
267
31
1
1
103
153
81
52
Source: Al Manar (Civil Service Bureau)
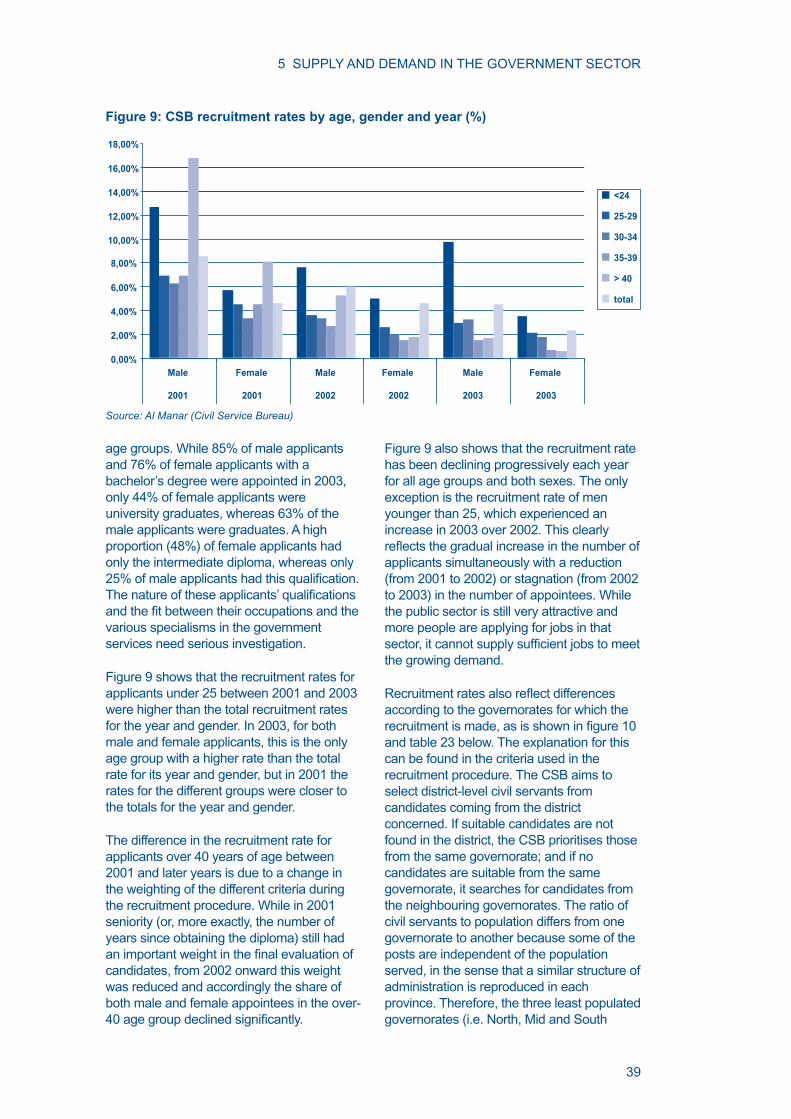
5 SUPPLY AND DEMAND IN THE GOVERNMENT SECTOR
39
Figure 9: CSB recruitment rates by age, gender and year (%)
Source: Al Manar (Civil Service Bureau)
0,00%
2,00%
4,00%
6,00%
8,00%
10,00%
12,00%
14,00%
16,00%
18,00%
Male Female Male Female Male Female
2001 2001 2002 2002 2003 2003
<24
25-29
30-34
35-39
> 40
total
age groups. While 85% of male applicants and 76% of female applicants with a bachelor’s degree were appointed in 2003, only 44% of female applicants were university graduates, whereas 63% of the male applicants were graduates. A high proportion (48%) of female applicants had only the intermediate diploma, whereas only 25% of male applicants had this qualification.The nature of these applicants’ qualificationsand the fit between their occupations and thevarious specialisms in the government services need serious investigation.
Figure 9 shows that the recruitment rates for applicants under 25 between 2001 and 2003 were higher than the total recruitment rates for the year and gender. In 2003, for both male and female applicants, this is the only age group with a higher rate than the total rate for its year and gender, but in 2001 the rates for the different groups were closer to the totals for the year and gender.
The difference in the recruitment rate for applicants over 40 years of age between 2001 and later years is due to a change in the weighting of the different criteria during the recruitment procedure. While in 2001 seniority (or, more exactly, the number of years since obtaining the diploma) still had an important weight in the final evaluation ofcandidates, from 2002 onward this weight was reduced and accordingly the share of both male and female appointees in the over-40 age group declined significantly.
Figure 9 also shows that the recruitment rate has been declining progressively each year for all age groups and both sexes. The only exception is the recruitment rate of men younger than 25, which experienced an increase in 2003 over 2002. This clearly reflects the gradual increase in the number ofapplicants simultaneously with a reduction (from 2001 to 2002) or stagnation (from 2002 to 2003) in the number of appointees. While the public sector is still very attractive and more people are applying for jobs in that sector, it cannot supply sufficient jobs to meetthe growing demand.
Recruitment rates also reflect differencesaccording to the governorates for which the recruitment is made, as is shown in figure 10and table 23 below. The explanation for this can be found in the criteria used in the recruitment procedure. The CSB aims to select district-level civil servants from candidates coming from the district concerned. If suitable candidates are not found in the district, the CSB prioritises those from the same governorate; and if no candidates are suitable from the same governorate, it searches for candidates from the neighbouring governorates. The ratio of civil servants to population differs from one governorate to another because some of the posts are independent of the population served, in the sense that a similar structure of administration is reproduced in each province. Therefore, the three least populated governorates (i.e. North, Mid and South
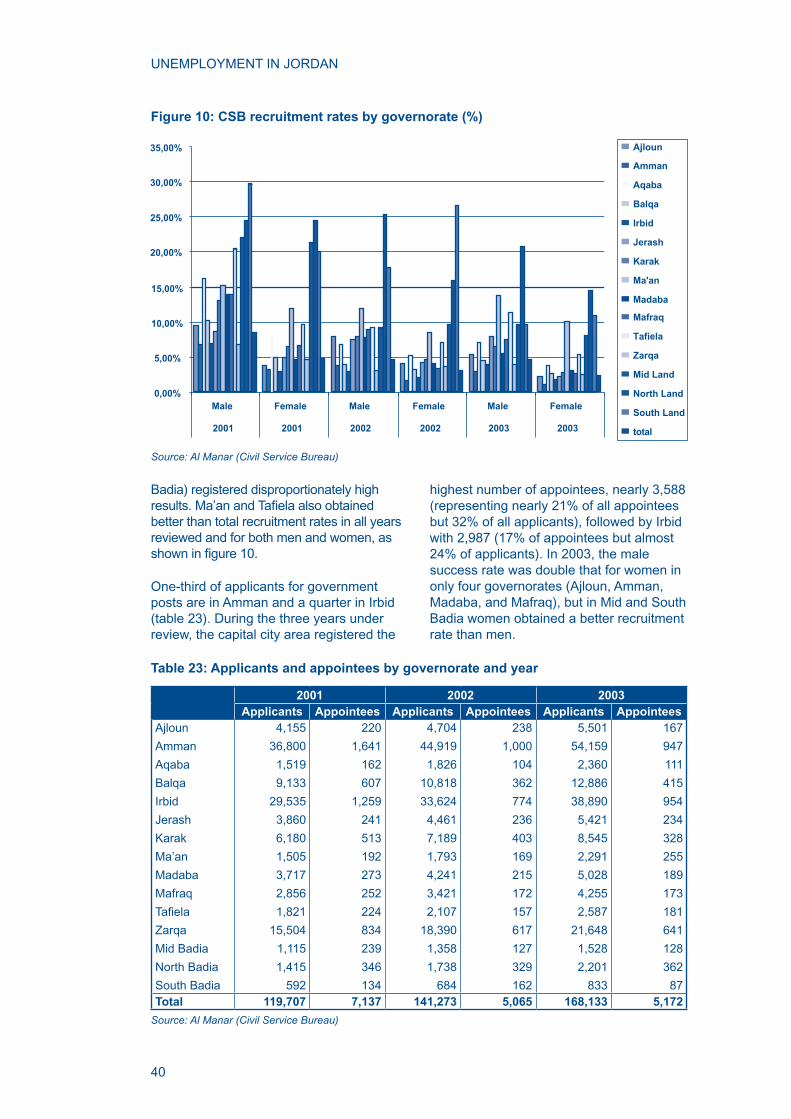
UNEMPLOYMENT IN JORDAN
40
Figure 10: CSB recruitment rates by governorate (%)
Source: Al Manar (Civil Service Bureau)
0,00%
5,00%
10,00%
15,00%
20,00%
25,00%
30,00%
35,00%
Male Female Male Female Male Female
2001 2001 2002 2002 2003 2003
Ajloun
Amman
Aqaba
Balqa
Irbid
Jerash
Karak
Ma'an
Madaba
Mafraq
Tafiela
Zarqa
Mid Land
North Land
South Land
total
Badia) registered disproportionately high results. Ma’an and Tafiela also obtainedbetter than total recruitment rates in all years reviewed and for both men and women, as shown in figure 10.
One-third of applicants for government posts are in Amman and a quarter in Irbid (table 23). During the three years under review, the capital city area registered the
highest number of appointees, nearly 3,588 (representing nearly 21% of all appointees but 32% of all applicants), followed by Irbid with 2,987 (17% of appointees but almost 24% of applicants). In 2003, the male success rate was double that for women in only four governorates (Ajloun, Amman, Madaba, and Mafraq), but in Mid and South Badia women obtained a better recruitment rate than men.
Table 23: Applicants and appointees by governorate and year
2001 2002 2003Applicants Appointees Applicants Appointees Applicants Appointees
Ajloun
Amman
Aqaba
Balqa
Irbid
Jerash
Karak
Ma’an
Madaba
Mafraq
Tafiela
Zarqa
Mid Badia
North Badia
South Badia
4,155
36,800
1,519
9,133
29,535
3,860
6,180
1,505
3,717
2,856
1,821
15,504
1,115
1,415
592
220
1,641
162
607
1,259
241
513
192
273
252
224
834
239
346
134
4,704
44,919
1,826
10,818
33,624
4,461
7,189
1,793
4,241
3,421
2,107
18,390
1,358
1,738
684
238
1,000
104
362
774
236
403
169
215
172
157
617
127
329
162
5,501
54,159
2,360
12,886
38,890
5,421
8,545
2,291
5,028
4,255
2,587
21,648
1,528
2,201
833
167
947
111
415
954
234
328
255
189
173
181
641
128
362
87Total 119,707 7,137 141,273 5,065 168,133 5,172
Source: Al Manar (Civil Service Bureau)
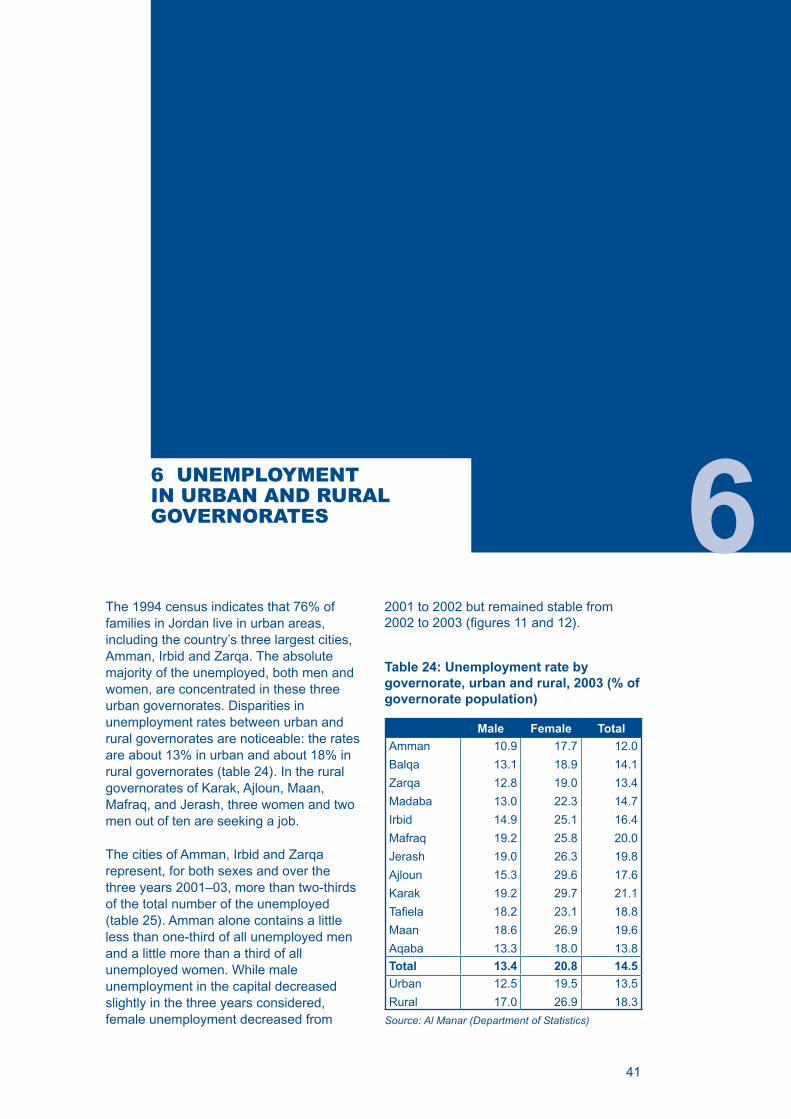
41
6 UNEMPLOYMENT IN URBAN AND RURAL GOVERNORATES 6
The 1994 census indicates that 76% of families in Jordan live in urban areas, including the country’s three largest cities, Amman, Irbid and Zarqa. The absolute majority of the unemployed, both men and women, are concentrated in these three urban governorates. Disparities in unemployment rates between urban and rural governorates are noticeable: the rates are about 13% in urban and about 18% in rural governorates (table 24). In the rural governorates of Karak, Ajloun, Maan, Mafraq, and Jerash, three women and two men out of ten are seeking a job.
The cities of Amman, Irbid and Zarqa represent, for both sexes and over the three years 2001–03, more than two-thirds of the total number of the unemployed (table 25). Amman alone contains a little less than one-third of all unemployed men and a little more than a third of all unemployed women. While male unemployment in the capital decreased slightly in the three years considered, female unemployment decreased from
2001 to 2002 but remained stable from 2002 to 2003 (figures 11 and 12).
Table 24: Unemployment rate by governorate, urban and rural, 2003 (% of governorate population)
Male Female Total
Amman
Balqa
Zarqa
Madaba
Irbid
Mafraq
Jerash
Ajloun
Karak
Tafiela
Maan
Aqaba
10.9
13.1
12.8
13.0
14.9
19.2
19.0
15.3
19.2
18.2
18.6
13.3
17.7
18.9
19.0
22.3
25.1
25.8
26.3
29.6
29.7
23.1
26.9
18.0
12.0
14.1
13.4
14.7
16.4
20.0
19.8
17.6
21.1
18.8
19.6
13.8
Total 13.4 20.8 14.5
Urban
Rural
12.5
17.0
19.5
26.9
13.5
18.3
Source: Al Manar (Department of Statistics)
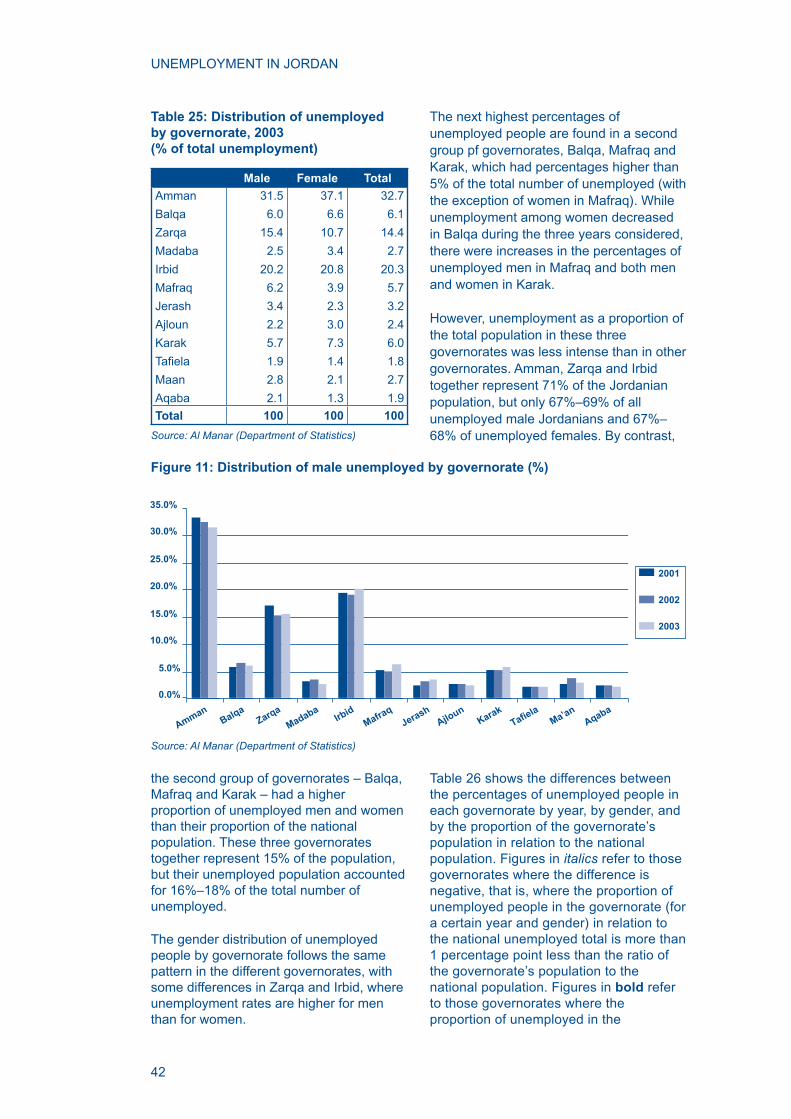
UNEMPLOYMENT IN JORDAN
42
Table 25: Distribution of unemployed by governorate, 2003 (% of total unemployment)
Male Female Total
Amman
Balqa
Zarqa
Madaba
Irbid
Mafraq
Jerash
Ajloun
Karak
Tafiela
Maan
Aqaba
31.5
6.0
15.4
2.5
20.2
6.2
3.4
2.2
5.7
1.9
2.8
2.1
37.1
6.6
10.7
3.4
20.8
3.9
2.3
3.0
7.3
1.4
2.1
1.3
32.7
6.1
14.4
2.7
20.3
5.7
3.2
2.4
6.0
1.8
2.7
1.9
Total 100 100 100
Source: Al Manar (Department of Statistics)
The next highest percentages of unemployed people are found in a second group pf governorates, Balqa, Mafraq and Karak, which had percentages higher than 5% of the total number of unemployed (with the exception of women in Mafraq). While unemployment among women decreased in Balqa during the three years considered, there were increases in the percentages of unemployed men in Mafraq and both men and women in Karak.
However, unemployment as a proportion of the total population in these three governorates was less intense than in other governorates. Amman, Zarqa and Irbid together represent 71% of the Jordanian population, but only 67%–69% of all unemployed male Jordanians and 67%–68% of unemployed females. By contrast,
Figure 11: Distribution of male unemployed by governorate (%)
0.0%
5.0%
10.0%
15.0%
20.0%
25.0%
30.0%
35.0%
2001
2002
2003
AmmanBalqa
Zarqa
MadabaIrb
idMafra
qJerash
Ajloun
KarakTafie
laMa’an
Aqaba
Source: Al Manar (Department of Statistics)
the second group of governorates – Balqa, Mafraq and Karak – had a higher proportion of unemployed men and women than their proportion of the national population. These three governorates together represent 15% of the population, but their unemployed population accounted for 16%–18% of the total number of unemployed.
The gender distribution of unemployed people by governorate follows the same pattern in the different governorates, with some differences in Zarqa and Irbid, where unemployment rates are higher for men than for women.
Table 26 shows the differences between the percentages of unemployed people in each governorate by year, by gender, and by the proportion of the governorate’s population in relation to the national population. Figures in italics refer to those governorates where the difference is negative, that is, where the proportion of unemployed people in the governorate (for a certain year and gender) in relation to the national unemployed total is more than 1 percentage point less than the ratio of the governorate’s population to the national population. Figures in bold refer to those governorates where the proportion of unemployed in the

6 UNEMPLOYMENT IN URBAN AND RURAL GOVERNORATES
43
Figure 12: Distribution of female unemployed by governorate (%)
Source: Al Manar (Department of Statistics)
0.0%
5.0%
10.0%
15.0%
20.0%
25.0%
30.0%
35.0%
40.0%
45.0%
2001
2002
2003
AmmanBalqa
Zarqa
MadabaIrb
idMafra
qJerash
Ajloun
KarakTafie
laMa’an
Aqaba
governorate (for a certain year and gender) compared with the national total of unemployed is bigger than the ratio of the governorate’s population to the national population.
Some figures from specific governoratesmay be highlighted. In Amman, the unemployment figures for men were lowerthan the proportion of men in the governorate’s population by 5–6%. Unemployment among women was higher in 2001 but decreased in the following two years.
In Irbid, unemployed women were less represented (except in 2003, when there was a difference of 3 percentage points), whereas the proportion of unemployed men to the governorate’s total male population was higher than the governorate population as a percentage of the overall population.
Karak was the only governorate in the second group where the representation of both male and female unemployed was higher in the total number of unemployed people than their respective proportions of the overall population.
Table 26: Comparison between unemployment and population distribution by governorate (%)
2001 2002 2003
Male Female Male Female Male Female
Amman -4.9 1.3 -5.5 -1.0 -6.5 -0.8
Balqa -1.1 1.9 -0.2 1.0 -0.6 0.0
Zarqa 1.2 -4.2 -0.5 0.6 -0.3 -5.0
Madaba 0.5 1.0 0.7 1.8 -0.1 0.8
Irbid 1.5 -1.2 1.3 -2.1 2.4 3.0
Mafraq 0.6 -1.1 0.3 -1.6 1.6 -0.7
Jerash -0.6 0.1 0.1 -0.9 0.5 -0.6
Ajloun 0.4 -0.2 0.4 0.1 0.0 0.9
Karak 1.2 1.9 1.2 1.9 1.7 3.3
Tafiela 0.5 0.7 0.5 0.0 0.4 -0.1
Ma’an 0.7 0.0 1.6 0.5 0.9 0.2
Aqaba 0.2 0.0 0.3 0.0 0.1 -0.7
Source: Al Manar (Department of Statistics), prepared by ETF


45
77 CONCLUSIONS AND RECOMMENDATIONS
This pilot study of unemployment in Jordan has been produced using information and data contained in the Al Manar Information System. It has been necessary to use information from other sources in only a few cases. One positive conclusion to be drawn is that the Human Resources Information and Knowledge System (HRIKS) developed during the last years in Jordan is now capable of providing data for analysing most of the relevant information produced by the different national suppliers of statistics. A networking approach to processing the information available enables proposals and recommendations for action to the main actors to be elaborated and knowledge to be developed for both individuals and institutions.
This study is the result of years of patient and constant work to bring together the main actors involved in producing the information in a format compatible with the different sources used and in the process reducing the gaps and ‘dark areas’ in the information. But it also owes much to a
capacity-building process aimed at developing a network of relevant actors from the public and private sectors active in the fields of human resources and thelabour market. Together these actors encompass a sound and diverse set of competences and expertise, enabling the development of a deep and comprehensive interpretation of the available information. The analysis done by the network has produced new knowledge which can be used to feed the decision-making process and identify proposals for improving the information system itself. It has also introduced new competences and skills to the participants. From this perspective, the progress of the Observatory Function in Jordan is impressive. This study bears witness to its analytical capacity and should be considered as a first step on the way toa regular process of undertaking new analysis by using this methodology.
The recommendations that follow are intended to address unemployment in the country through a set of proposals emerging

UNEMPLOYMENT IN JORDAN
46
directly from an assessment of the unemployment situation, defined by theavailable data and the analysis undertaken. This section also contains recommendations for improving the information system itself, based on the recognition that despite the progress already achieved there is still room to improve the quality of the information and increase the transparency of the Jordanian labour market. Only through these kinds of effort will the different actors in the field beable to put forward policy options to tackle the huge challenges that current unemployment trends represent for the future.
At the end of this study, we can say confidently that the characteristics ofunemployment in Jordan are better known. Nevertheless there is a need, for instance, to define more clearly the differencesbetween unemployed people (according to the international standard definition agreedby the International Labour Organization (ILO)), jobseekers and discouraged workers, who together make up the population excluded from the labour market.
The ILO definition is convenient forcountries where unemployed persons receive social protection, and labour offers are not covered. In such a situation, a person not working is expected to be actively seeking a job. However, if jobs are not available (as indicated in the information from discouraged workers recorded in this study) after a certain period of jobseeking, the search might be reduced. Alternatively, in the absence of any other income, jobseekers might accept work in the informal economy or in professional fields outside theirprofessions.
7.1 SPECIFIC RECOMMENDATIONS FOR TACKLING UNEMPLOYMENT
According to the information and analysis contained in this study report many aspects of unemployment both at institutional and individual levels require specific attention.
The unemployment rate in Jordan is 15%, the greatest differentials being between men and women, between community college graduates and female graduates. Being young and female represents a double constraint to finding a permanentjob in the Jordan labour market. Several causes for unemployment among youth and women can be identified, for instance:
n little or no career guidance counselling for students and unemployed people;
n limited possibilities of finding satisfyingwork after graduation;
n difficulty in obtaining jobs compatiblewith qualifications;
n low wages and working conditions set by firms;
n the gap between graduates’ skills and employers’ needs (which are not clearly expressed);
n social and cultural obstacles to women’s full integration into the labour market (families, especially fathers or husbands, are more selective about where their daughters or wives work);
n for women, a critical mismatch between education curricula, women’s aspirations and family life;
Unemployed
Jobseekers
Discouragedworkers
The ILO establishes criteria for considering a person as unemployed (see section 2). When producing surveys calculating the number of unemployed in a country, it is possible that some individuals do not fulfilall these criteria, and these people are therefore considered ‘non-active’. This means that they have not been actively seeking for a job during the four weeks previous to being surveyed, for one or another of a variety of reasons: for example, after a period of searching they have not found an opportunity that matches their qualifications; they have been workingfor a limited number of hours (only one hour during the reference period!) in a job not adequate to their professional potential because they need to generate income for essential family expenses, etc.).
7 CONCLUSIONS AND RECOMMENDATIONS
47
n the wider international and economic context.
This report identifies three strategicpriorities for action:
n tackling youth unemployment and facilitating young people’s integration in the labour market;
n promoting equal opportunities between women and men;
n developing ways of transition in employment from the informal to the formal economy.
The following general recommendations aim to achieve these priorities by creating education and employment opportunities and managing labour market risks:
n encourage specific labour market andlocal measures, as well as increasing cooperation among key actors in the fields of education and employment,regional authorities, and other services;
n improve and upgrade the roles and capacities of labour offices, the VTC,the Ministry of Education and Al Baqua University all over the country in order to provide counselling guidance support to every Jordanian inhabitant and to give specific support to the mostvulnerable population groups (youth, women, discouraged workers);
n enhance the role of social partners and firms in sharing responsibility forformulating education and training policies.
Youth and social integration
Jordan has a very young population. According to the DOS, at present the under-15 age group represents 38% of the population, with a population growth rate of 2.8% and a population doubling time of less than 25 years. In 2020 the present under-15 age group (numbering over 2 million) will have attained working age. Since the present economically active population (employed and unemployed) is estimated at 1,200,000, if all those attaining working age were to become active, this would represent three times today’s economically active population. In other words, the active population would be four times the one in
2003. Even keeping the present low activity rate stable (which would not be desirable in particular for women), new entrants to the labour market would represent 630,000 men and 120,000 women – 50,000 more than the active population in 2003. In other words, in line with World Bank projections, the active population would double before 2020.
Providing jobs for this growing young population is thus one of the country’s central concerns. With a current youth unemployment rate of 30% and a labour force growing by 4% a year, it is imperative to create additional new jobs for young jobseekers, in the interests not only of economic growth but also of social stability. This report shows that 60% of unemployed Jordanians are below the age of 25. The highest activity rates are among women aged 24–30 (44%) and men aged 15–19 (37%). Young school graduates often seek a job in the public sector because it offers attractive benefits, in contrast with thelack of social security and poor working conditions found in other sectors. Employment data show that education has a significant impact on jobopportunities, especially for young women. The high unemployment rate among youth indicates the need to support young people particularly during the first few years after they leaveeducation. Because young people make both the greatest demands on society and the greatest contributions to it, targeting young Jordanians is the most effective entry point for new public and private sector policies.
Reducing youth unemployment as well as preparing and facilitating the entrance of graduates to social and professional life require a combination of institutional and private initiatives. The most evident is the development and systematic use of professional guidance and counselling support both for students and jobseekers. This report recommends that labour offices and all providers of training andeducation (VTC, Ministry of Education, universities and colleges) improve their guidance and counselling capacities in professional and structured ways.
UNEMPLOYMENT IN JORDAN
48
Detailed measures proposed are:
In schools, colleges, universities and training institutions:
n Implement counselling programmes for students in schools (curriculum design, labour market orientation and tools for achieving the latter);
n Disseminate Al Manar counselling experiences in universities;
n Fight school drop-out and support students before they leave school (e.g. via short training sessions to prepare them for working life: CV drafting, jobseeking training, training services).
In labour offices and VET institutions:
n Develop infrastructure or a network of services on labour and education for youth at the local level (e.g. a ‘one-stop shop’ where all information can be found and individual support and guidance provided);
n Create continuing training opportunities;n Increase the potential benefits of
registration for young jobseekers in labour offices and VET institutions (e.g.support measures at the outset of their jobseeking period, job clubs, etc.);
n Develop specific measures, open to all,to support entrepreneurship and self-employment by training in basic business skills, providing opportunities in non-traditional sectors, helping to overcome specific constraints such aslimited access to credit or communications technologies;
n Encourage graduates of such training to establish their own businesses, with specific support for women (e.g.financial advice, training on rights etc.);
n Redefine a functioning and attractivedual training system developed on the basis of coordination and partnership with the private sector.
Gender and employment
Women constitute 48% of the Jordanian population but their economic participation rate does not exceed 12% of the total labour force. The female unemployment rate is slightly higher than the male rate. It is a distortion of the labour market in Jordan that women show superior
academic performance to men at high school and college but do not contribute to the economy to the same extent as men. Women tend to choose training and educational fields in which the market issaturated and which therefore cannot offer them job opportunities. The data show that education has a significant impact on jobopportunities. The public sector accounts for the largest share of the job market in Jordan and is the favoured choice of new female entrants into the labour market. Female graduates are attracted to public sector jobs because of the benefits it offers– long-term employment, tolerable working hours, pension, social security and social status. In the services sector, women are concentrated in activities associated with their traditional gender roles, particularly in education and social and personal services.
The difficulty of finding a job is even moredrastic for young women. It could be argued that not all women of working age want jobs. However, the data on female unemployment indicate that there are many Jordanian women who want waged work but are unable to find it and are tired ofsearching for a job. It is clear that more employment opportunities need to be created for women to satisfy their willingness to work. Without particular attention to greater gender equality, the inequalities in the labour market will continue to increase. Efforts in this respect could be made towards equal representation of male and female workers, equal pay for work of equal value, gender balance across all occupations, and a change in the balance of women’s work between waged employment and domestic labour.
Enhancing women’s participation in the labour market is crucial for the Jordanian economy. Women’s high educational and economical potential must be seriously taken into consideration. Undertaking measures to facilitate their integration in the labour market is a priority. It is recommended that a gender mainstreaming strategy be developed that takes into account the differences between the conditions, situations and needs of women and men and incorporates equal opportunities for

7 CONCLUSIONS AND RECOMMENDATIONS
49
women and men into all policies and activities. This strategy will develop job opportunities that will enable women to secure decent and remunerative work in conditions of freedom, social security, economic independence and equal wages with men. This is only possible if policymakers recognise that women’s problems in the labour market are as important as those of men.
Detailed measures proposed are:
n Diversify the professional horizons of female students by developing a set of activities and experiences in schools (meetings with professional women or businesswomen in various occupations, awareness campaigns to raise women’s ability to fill technicaljobs, social roles of males and females, etc.);
n Encourage the practice of providing various experiences introducing students to companies during training courses for female students (e.g. through summer jobs);
n Implement specific counselling andinformation programmes to attract women and girls into vocational programmes;
n Develop and implement counselling support for women in labour offices(e.g. on careers guidance counselling, women workers’ rights);
n Support women workers with childcare facilities in workplaces or pre-school facilities;
n Develop social security insurance benefits;
n Promote equal remuneration;n Ensure proportionate representation of
female employees in workers’ committees;
n Strengthen the role of the cooperative sector in various fields (especially inrural areas) and encourage women’s participation in those fields;
n Promote networking and associations of women workers and entrepreneurs;
n Expand the range of professional occupations and career paths in the public sector for women;
n Promote the appointment of women to high positions in different ministries.
From informal to formal employment
There are two major issues concerning the informal economy and its incidence in the overall employment situation in Jordan. The first is the lack of knowledge on thedefinition, dimension, characteristics andpotential of the informal economy. The second concerns the acquisition of the skills required for working in the informal economy and therefore the possibility of identifying bridges and routes to facilitate the transition from informal economy jobs to formal employment. Informal workers may be particularly vulnerable to exploitation in a number of ways, including forced labour.
As regards the first of these issues, thelack of transparency of the informal economy is mainly due to the nature of the informal economy itself. In Jordan the microenterprise sector includes at least three types of activity:
n registered microenterprises with fewer than five employees, which are notobliged to contribute to the social security system and therefore do not provide information about themselves; this creates an information gap about this sector, even though it might involve a significant number of people;
n the so-called ‘real’ informal economy, which consists of organisations that undertake a productive activity but are not registered and have low levels of productivity, added value and employee skills;
n economic activities which are illegal and non-productive.
As regards the second major issue, the European Training Foundation (ETF)20 has analysed how, while most reform initiatives are aimed at the formal training sector, a significant number of businesses in theMiddle East and North Africa region operate in the informal economy with low productivity, employing workers with low
20 ETF, ‘Looking ahead: regional working sessions. Knowledge and skills in the Middle East and North Africa’. Background note tabled at the second Mediterranean regional workshop (2003).

UNEMPLOYMENT IN JORDAN
50
levels of education and skills. Improvements in the education system in the last two decades have raised the educational attainment of new labour market entrants who participate in apprenticeships in the informal economy. Their employers, whose role is to transfer skills and knowledge, often possess lower levels of formal education than their trainees.
This problem is not confined to Jordan. Inall countries of the region the percentage of operating micro- or small firms is huge.The informal economy represents a substantial and active part of the private sector workforce. A large number of new entrants to the labour force findemployment in the informal economy, and most of them acquire their skills outside formal arrangements, through non-structured apprenticeships in the informal economy. Also, many graduates of formal education and training schemes end up earning their living in the informal economy. In spite of the importance of the informal economy as a source of employment, our understanding of the role it plays in the supply and demand for knowledge and skills in the region is at present very limited. NGOs working with the informal economy have developed some innovative approaches to skills development, but their initiatives tend to be very small-scale and underresourced. Apprenticeships in the informal economy account for a large number of participating trainees, but they are constrained by the low level of education of both the employers and the apprentices, thus holding down the level of the skills transferred.
The main recommendation of this study as regards the informal economy is to promote a local development approach that encourages partnership between the different stakeholders at municipality level. The partnership would be aimed at creating effective measures enabling entrepreneurs to create more and better jobs, conditioning the granting of aid on the formal registration of firms andemployers. Strengthening dialogue with social partners and chambers of industry or commerce in developing a national strategy is also recommended.
As in other countries that lack functioning national unemployment insurance systems, active labour market programmes would constitute relevant instruments for tackling labour market dislocations. The emergence of legislative measures to protect workers, to decrease the taxes paid by employers, to sustain the creation of quality jobs (with rights, a minimum wage, tolerable hours and conditions, social security, etc.) can contribute efficaciously to areduction in the informal economy.
Detailed measures proposed are:
n Increase the potential benefits of legalregistration for enterprises (easier procedures, reasonable taxation, more credit markets, social protection), through local development projects that provide assistance to entrepreneurs conditional upon formal registration of their firms;
n Improve the capacities of the SSC and local actors (mainly in municipalities) to collect information on the local economy and employment;
n Systematise, for all informal enterprises, accreditation through registration in the VET system;
n Create and support training opportunities through a continuing training mechanism to upgrade the skills of employers, employees and trainees working in the informal economy;
n Generate a system to identify, recognise and certificate the skillsobtained by employees in the informal economy, in order to facilitate their transition to formal employment;
n Develop women’s role in the informal economy through entrepreneurship training in basic business skills, opportunities in non-traditional sectors, helping women to overcome specific constraints such as access tocredit and communications technology, and promoting networking and associations of women entrepreneurs.

7 CONCLUSIONS AND RECOMMENDATIONS
51
7.2 TECHNICAL RECOMMENDATIONS FOR IMPROVING THE INFORMATION SYSTEM
Analysis of the information available on unemployment in Jordan has revealed some weaknesses in the information system. Most of the data sources have a limited scope, and in some cases it is difficult to assess their coverage. Inaddition to the following recommendations it is expected that the population census to be conducted in 2004 should improve the situation by providing a comprehensive basis for statistical analysis.
The main technical recommendation is to reinforce the quality of data by improving common classifications, unemploymentsystem statistics, tracer studies, and reliable qualitative and quantitative information about the informal economy, and by undertaking further studies in specific areas.
Common classifications
As regards the more technical aspects, this report recommends, as a priority, the development of a common language among all actors by means of an agreed set of codes and classifications complyingwith the national and international systems. There is general consensus on the need to adopt common classifications and toproceed towards harmonisation and standardisation of questionnaires and forms (for example with the support of chambers of industry or commerce for employers). This would entail the revision of data produced by these institutions and the establishment of agreement on the data required. For example, the DOS household survey distinguishes public sector employees whereas the CSB refers to government employees; data comparison between these two classifications is thusdifficult. Some data are also difficult to usebecause the classification systems used foreconomic activity, occupation, fields of
Lessons drawn from past and current experience to ensure that local employment strategies are successful
No single universal or prescriptive formula can take into account the huge variety of different local situations. However, the experience of regional and local actors, elicited through consultation, suggests that several factors can contribute to the success of local employment strategies.
n First, a clear, coherent and strategic action plan, involving as many local partners as possible, is crucial. A good plan must take into account the political, administrative and socio-economic characteristics of the territory involved, which are, to a great extent, unique to that territory. Likewise, specific objectives – suchas the promotion of tourism or new technologies – rather than general, all-embracing ones, should be selected and adhered to.
n Second, the territory or area targeted must be large enough to give the action a critical mass and small enough to make the most of the proximity of local actors. The focus must be on creating networks, for example networks of municipalities, with an overall potential for development.
n Third, the mobilisation and capacity building of local actors working in partnership is fundamental. The local level cannot play a more strategic role in the promotion of employment unless local actors are equipped with the necessary skills, both technical and social.
n Finally, gender equality at local level must be promoted by all available means. Local authorities, local businesses, voluntary bodies, social partners and local employment services can all contribute to the enhancement of women’s participation either as model employers or as promoters of special measures for improving women’s access to the labour market.
Source: http://europa.eu.int/comm/employment_social/local_employment/lessons_en.htm
UNEMPLOYMENT IN JORDAN
52
education etc. in MOL, SSC, CSB, VTC and other institutions are not harmonised (see annex 2). The objective will be to require institutions to commit themselves to harmonising their classifications asproposed by Al Manar.
Unemployment system statistics
The main definitions of unemploymentexclude persons who want to work but are not actively seeking work because they feel that no work is available or because they face discrimination or social and/or cultural barriers. For example, the available statistics do not give enough information about unemployed persons: not enough is known about the length of their working experience, their previous jobs, the skills they can still mobilise and their real qualifications, andeven less about their expectations. The findings of this report show, therefore, that aclearer picture of people in long-term unemployment and of the ‘discouraged workers’ is needed. The proposal, therefore, is to request labour offices and the DOS toprovide more qualitative and quantitative information, in order to identify who is really unemployed and searching for a job. It would be useful to compare qualitative data concerning jobseekers, information about occupations, professions or trades for which development in the enterprises becomes noticeable, and/or important areas of fluidityin the labour market. Later, the implementation of a jobseekers’ panel of people who are interviewed at regular intervals over several years would allow their career paths to be followed and would improve knowledge of the efficiency of publicmeasures or training courses carried out for people facing difficulties.
Tracer studies
The relationship between the educational system and the labour market is a key issue in the achievement of better integration of young people into jobs. This study recommends the development of surveys enabling young people’s position in the labour market to be better understood. These surveys addressing the education-to-work transition would help clarify the effectiveness of training courses in giving young people access to the labour market and job opportunities in professional
sectors or trades according to their educational qualifications.
More reliable qualitative and quantitative information about the informal economy
The informal economy is not a negligible element in the upheaval of the Jordanian economy. Most countries confronted with the informal economy encounter a common difficulty in quantifying the extent of theinformal economy and of addressing it. There exists no single formula by which this hidden face of the labour market can be accurately defined. So it would be usefulto arrive at a common definition of theinformal economy in Jordan, to analyse its activities, the characteristics of its workers and the way it operates in general. The fact that microenterprises are not obliged to contribute to the SSC generates a ‘dark area’ in labour market information that reduces the transparency of the labour market. In view of the nature of new labour organisations, the non-repressive analysis of informal economy practices can reveal the existence of job ‘niches’ which can be especially helpful for jobseekers.
Specific areas for further study
To identify labour market training needs, knowledge of the evolution of the national productive system is necessary. Currently some aspects of this are not well documented or understood in either quantitative or qualitative terms. Such aspects include:
n comparison of the statistics on median wages produced by DOS and SSC by gender, level of education, sector, occupation and age;
n examination of the effects of public sector incentives on the total labour market in Jordan, in comparison with other Arabic countries;
n identification of expatriate Jordaniansand non-Jordanian workers;
n investigation of enterprises’ current and future needs.
The following table contains detailed proposals, addressed to the institutions in charge of providing information in the field, toimprove the collection of information to enhance the analysis of unemployment in Jordan.

7 CONCLUSIONS AND RECOMMENDATIONS
53
In conclusion, we can say that improving Jordan’s Human Resource Information and Knowledge System through an Observatory Function approach requires:
n interinstitutional involvement, initiated by policymakers;
n a functioning network focused on a specific theme of interest for thecountry and relevant to its political agenda;
n structured mechanisms for processing information in such a way as to ensure
Table 27: Detailed technical proposals for improving information systems in institutions
Technical proposals for Al Manar Technical proposals for DOS
- Add in LMI unemployment activity rates by gender, level of education, age.
- Include LMI economic activity rates by gender, level of education, age (with series of main indicators since many years).
- Gather data on working conditions (median wage, working hours…) by gender, sector, age, level of education, occupation...
- Insert youth transition indicators in Al Manar when available and reliable data.
- Adjoin some indicators of economic activity rates, etc. among Arab states, for purposes of comparison.
- Further develop the database and explain publicly available statistics thus making them easily understood (data source, methodology, coverage, frequency, a short description of the statistical variables and indicators).
- Develop data about the type of occupations and industries where employed men and women worked before seeking a job and the reasons of departure.
- Increase qualitative statistics in order to identify who is really unemployed and searching for a job.
- Identify the reasons given by men and women (not economically active population available to work) for not seeking work.
- Distinguish reasons declared by employed persons (women and men) wanting another or additional work with questions such as: Do you want an additional job and why? Do you want to change your job and why?
- Insert a question asking if workers have a second job (type of occupation, sector, etc.?).
- Improve the quality of household employment surveys by increasing the size of clusters so as to provide representativity of governorates and localities.
- Provide accurate information on non-Jordanian workers.
Technical proposals for SSC Technical proposals for CSB
- Include information on level of education or educational specialism.
- Process data on occupations using common definitions with those used by Al Manar.
- Compile and process data on fields ofoccupation in the public sector with common definitions.
the full participation of key actors and the transfer of knowledge.
This pilot exercise on unemployment in Jordan has enabled the shared analysis and understanding of the issue among individuals and institutions to be upgraded. In view of this, it is recommended that a regular publication be developed, designed to strengthen the Observatory Function in Jordan and provide policymakers with a more in-depth analysis of the relationship between training and employment.

55
ANNEXES
ANNEX 1: JORDANIAN TASK FORCE MEMBERS
The Task Force consists of a group of Jordanian experts representing the major institutions that provide or use information on human resources, on both the supply and demand sides. The following list is of Task Force members who contributed to the preparation of this study and who represent the various institutions involved in the Observatory Function:
H.E. Dr Munther Masri, National Center for Human Resources Development
Dr Nader Mryyan, National Center for Human Resources Development, Al Manar
Mr Adel Lutfi, National Center for Human Resources Development, Al Manar
Mr Mamduh Salamat, National Center for Human Resources Development, Al Manar
Ms Manal Al Ziq, National Center for Human Resources Development, Al Manar
Mr Kamis Raddad, National Center for Human Resources Development, Al Manar
Ms Khadijeh Al Azzeh, Ministry of Higher Education
Mr Naser Sulehat, Ministry of Labour
Mr Sameh Al Naser, Civil Service Bureau
Mr Fahim Fawzi, Department of Statistics
Mr Mouhamad Aljonde, Department of Statistics
Ms Rima Abu El Failat, Vocational Training Corporation
Ms Tayeed Alaleem, Vocational Training Corporation
Mr Nawaf Al Kalaldeh, Social Security Corporation
Mr Ahmed El Saadi, Amman Chamber of Industry
Ms Hala Ayoubi, Young Entrepreneurs Association

UNEMPLOYMENT IN JORDAN
56
ANNEX 2: INFORMATION CONTAINED IN THE AL MANAR DATABASE
In 1999 the Jordanian and Canadian governments signed a memorandum of understanding to develop human and institutional resources in the area of human resources development. The project aimed to increase the efficiency of Jordan’s use oftraining and educational resources through a closer link with the private sector, and to meet the needs of industry by providing Jordanian businesses and industries with access to information on skilled labour responding to productivity and national development priorities. Since 2001 the European Training Foundation (ETF) has supported the development of the Al Manar project mainly through strategic and capacity-building support initiatives. This has contributed to the forging of an institutional network and to better ownership of the project by the individuals and institutions participating in it.
A principal collaborator in the implementation of the project is the National Center for Human Resources Development (NCHRD). This centre was established in 1990 in accordance with applicable Jordanian legislation related to the Higher Council of Science and Technology. Its mandate is to enhance and promote human resources development and make the outputs of education and training programmes relevant to labour market needs. The centre’s ultimate goal is to keep abreast of the accelerating changes in socioeconomic requirements nationwide and to contribute to them. The NCHRD’s major tasks are improving the effectiveness and efficiency of education and training systems,supporting reform plans in education and training, making education and training programmes more relevant to labour market sectors; and providing training and consultation in HRD.
The NCHRD is chaired by his Excellency Dr Munther Al Masri, former Minister of Education. Its members include the Higher Council of Science and Technology, the ministries of Education, Labour, Planning and Higher Education, the Vocational Training Corporation, and two representatives of the private sector.
The Al Manar mission is to contribute to human resources development on a national level and increase the effectiveness of the labour market. The project has three major components, the Electronic Labour Exchange (ELE), the Professional Career Counselling (PCC), and the Human Resources Information and Knowledge System (HRIKS). The ELE is a free web-based employment service that matches employers and employees or jobseekers using technical internet tools. The PCC increases the awareness of career counselling in educational institutions, developing tools and access to accurate labour market information which provides both counsellors and individuals with on-line career development. The HRIKS aims at creating a specialised national labour market database, maintaining and updating it, publishing labour market and human resource development indicators, and coordinating among LMI producers and users.

ANNEXES
57
In its current stage of development, the Al Manar database contains data in the following fields:
Demand side Supply side
- Employed population (DOS, employment survey)
- Participants and drop-outs from the Social Security Corporation (administrative records)
- Government appointees and employees (CSB, administrative records)
- Foreign workers (MOL, administrative records)
- University students (enrolled students and graduates of all public and private universities in Jordan)
- VTC trainees (administrative records)
- Unemployed people (DOS, employment survey)
- Applicants to government posts and government employment (CSB, administrative records)
A future development of the Al Manar project will be the inclusion of more educational information. At present, data about higher education and VTC trainees are available. The higher education database contains 393,003 individual academic profiles for enrolledstudents and graduates of all universities in Jordan, i.e. eight public and eight private universities. This Information has been collected, filtered, cleansed, unified and loaded intothe database. The database currently has information about enrolled students for the firstsemester of the year 2003/04 and graduates from 1995 to 2004.
The main information held on each student and graduate is:
- student ID- gender- nationality- age- governorate- level of education- faculty- specialism- study type- tawjihi (or equivalent) grade- secondary school stream- grade point average (GPA) (for graduates)
The information held on VET trainees for first semester 2003/04 is:
- gender- birth date (age)- nationality- governorate- centre/institute- training programme- occupational group- educational level- training duration- year (semester)- trainee status (graduated, enrolled, etc.)

UNEMPLOYMENT IN JORDAN
58
Tab
le 2
8: L
abo
ur
mar
ket
info
rmat
ion
in t
he
Al M
anar
dat
abas
e
Dep
artm
ent
of
Sta
tist
ics
So
cial
Sec
uri
ty C
orp
ora
tio
n
Civ
il S
ervi
ce B
ure
au
Min
istr
y o
f L
abo
ur
Em
plo
ymen
t su
rvey
dat
a, 1
999–
2002
LMI d
atab
ase
cont
ains
dat
a ab
out
Jord
ania
n em
ploy
ees
and
firm
sby
the
follo
win
g ca
tego
ries:
Jord
ania
n e
mp
loye
esn
gend
ern
leve
l of e
duca
tion
n
occu
patio
nn
educ
atio
nal s
peci
alis
mn
paid
sta
tus
n
age
grou
pn
size
of w
orkp
lace
(fir
ms)
n
sect
orn
lega
l aut
horit
y (fi
rms)
n
econ
omic
act
ivity
n
gove
rnor
ate
Fir
ms
(exc
ept
1999
)n
econ
omic
act
ivity
n
empl
oym
ent s
ize
(firm
s)n
sect
orn
lega
l aut
horit
y (fi
rms)
n
gove
rnor
ate
Ho
use
ho
ld s
urv
ey d
ata,
200
0–20
04LM
I dat
abas
e co
ntai
ns d
ata
abou
t Jo
rdan
ian
unem
ploy
ed b
y th
e fo
llow
ing
cate
gorie
s:
Jord
ania
n u
nem
plo
yed
n
gend
ern
leve
l of e
duca
tion
n
age
grou
pn
gove
rnor
ate
n
fam
ily r
elat
ions
hip
n
educ
atio
nal s
peci
alis
mn
prev
ious
wor
k st
atus
n
unem
ploy
men
t dur
atio
nn
jobs
eeki
ng m
etho
dn
reas
on fo
r no
t see
king
job
SS
C d
ata,
200
0–20
03LM
I dat
abas
e co
ntai
ns d
ata
abou
t pa
rtic
ipan
ts, d
rop-
outs
and
firm
sby
the
follo
win
g ca
tego
ries:
Par
tici
pan
tsn
gend
ern
natio
nalit
yn
age
n
year
s of
ser
vice
n
econ
omic
act
ivity
n
firm
wor
ked
inn
wag
en
gove
rnor
ate
Dro
p-o
uts
fro
m S
SC
n
gend
ern
natio
nalit
yn
age
n
year
s of
ser
vice
n
econ
omic
act
ivity
n
firm
wor
ked
inn
wag
en
gove
rnor
ate
n
reas
on fo
r dr
op-o
ut
Fir
ms
n
gove
rnor
ate
n
firm
natio
nalit
yn
firm
owne
rshi
pn
econ
omic
act
ivity
n
num
ber
of e
mpl
oyee
s
CS
B d
ata,
200
1–20
03LM
I dat
abas
e co
ntai
ns d
ata
abou
t ap
plic
ants
, app
oint
ees,
em
ploy
ees
and
drop
-out
s by
the
follo
win
g ca
tego
ries:
Ap
plic
ants
an
d a
pp
oin
ted
n
year
of a
pplic
atio
nn
leve
l of e
duca
tion
n
educ
atio
nal s
peci
alis
mn
grad
uatio
n ye
arn
gend
ern
univ
ersi
tyn
grad
uatio
n co
untr
yn
age
grou
pn
gove
rnor
ate
n
mar
ital s
tatu
s
Go
vern
men
t em
plo
yees
n
year
app
oint
edn
leve
l of e
duca
tion
n
educ
atio
nal s
peci
alis
mn
grad
uatio
n ye
arn
gend
ern
univ
ersi
tyn
grad
uatio
n co
untr
yn
inst
itutio
nn
empl
oym
ent t
ype
n
cate
gory
n
degr
een
occu
patio
nn
age
grou
p
Dro
p-o
uts
n
year
app
oint
edn
leve
l of e
duca
tion
n
educ
atio
nal s
peci
alis
mn
grad
uatio
n ye
arn
gend
ern
univ
ersi
tyn
grad
uatio
n co
untr
yn
inst
itutio
nn
empl
oym
ent t
ype
n
cate
gory
n
degr
een
occu
patio
nn
age
grou
pn
year
of d
rop-
out
Min
istr
y o
f L
abo
ur
dat
a fo
r ye
ars
2000
–200
3LM
I dat
abas
e co
ntai
ns d
ata
abou
t for
eign
w
orke
rs a
nd fi
rms
byth
efo
llow
ing
cate
gorie
s:F
ore
ign
wo
rker
sn
gend
ern
natio
nalit
yn
age
grou
pn
leve
l of e
duca
tion
n
educ
atio
nal s
peci
alis
mn
wor
k de
part
men
tn
perm
anen
tn
occu
patio
nn
econ
omic
act
ivity
n
wag
en
gove
rnor
ate
n
mar
ital s
tatu
sF
irm
sn
econ
omic
act
ivity
n
wor
k de
part
men
tn
num
ber
of e
mpl
oyee
s

ANNEXES
59
Tab
le 2
9: L
abo
ur
Mar
ket
Info
rmat
ion
Sys
tem
Tit
le
DO
SC
SB
MO
LS
SC
Co
vera
ge
Est
ablis
hmen
ts a
nd h
ouse
hold
s C
SB
em
ploy
ees,
CS
B a
pplic
ants
an
d re
tiree
s F
orei
gn w
orke
rs
Priv
ate
busi
ness
es, p
artic
ipan
ts
and
retir
ees
Dat
a C
olle
ctio
n
Met
ho
d
Sam
ples
and
sur
veys
R
ecor
ds
Rec
ords
R
ecor
ds
Dat
a C
olle
ctio
n
Sta
ge
Dat
a co
llect
ed q
uart
erly
and
an
nual
ly
Con
tinuo
us
Con
tinuo
us
Con
tinuo
us
Dat
abas
e S
oft
war
e O
racl
e D
atab
ase
RD
B (
Rel
atio
nal D
atab
ase)
and
C
OB
OL
prog
ram
s fo
r th
e in
terf
ace
Ora
cle
Dat
abas
eO
racl
e D
atab
ase
Net
wo
rkLo
cal A
rea
Net
wor
k (L
AN
)Lo
cal A
rea
Net
wor
k (L
AN
)
and
WA
N
Loca
l Are
a N
etw
ork
(LA
N)
Loca
l Are
a N
etw
ork
(LA
N)
and
WA
N
Web
site
ww
w.d
os.g
ov.j o
ww
w.c
sb.g
ov.jo
ww
w.m
ol.g
ov.jo
ww
w.s
sc.g
ov.jo

UNEMPLOYMENT IN JORDAN
60
Tab
le 3
0: L
abo
ur
Mar
ket
Info
rmat
ion
dat
abas
e b
y so
urc
e
Cat
ego
ryD
epar
tmen
t o
f S
tati
stic
s S
urv
eys
So
cial
Sec
uri
ty
Co
rpo
rati
on
Civ
il S
ervi
ce
Bu
reau
M
inis
try
of
Lab
ou
r
Em
plo
ymen
tTr
ansp
ort
atio
nC
on
stru
ctio
nA
gri
cult
ure
Ho
use
ho
ldS
oci
al S
ecu
rity
P
arti
cip
ants
Go
v. E
mp
loye
eF
ore
ign
W
ork
ers
1G
ende
rP
PP
PP
PP
P
2N
atio
nalit
yP
PP
OP
PP
P
3A
geO
OO
PP
PP
P
4N
atio
nal I
DO
OO
OP
PU
U
5G
over
nora
teP
OO
PP
PP
P
6M
arita
l sta
tus
OO
OP
OP
OP
7E
duca
tiona
l lev
elP
OO
PO
PP
P
8E
duca
tiona
l spe
cial
ism
PO
OO
OP
OP
10Y
ear
of g
radu
atio
nO
OO
OO
PO
O
11C
ount
ry o
f gra
duat
ion
OO
OO
OP
OO
12U
nive
rsity
nam
eO
OO
OO
PO
O
13O
ccup
atio
nP
OO
PO
PP
P
14E
cono
mic
act
ivity
P
PP
PP
PP
P
15E
mpl
oym
ent s
tatu
sP
OO
PO
PP
P
16W
age
PO
OU
PO
PP
17S
ecto
r (p
ublic
, priv
ate)
PO
OU
OP
PP
18E
xper
ienc
eO
OO
OO
OO
O
19W
orki
ng h
ours
PO
OU
OO
OP
20Ty
pe o
f rec
ruitm
ent
UU
UU
UU
PU
21C
lass
ifica
tion
grou
pU
UU
UU
UP
U
P
Dat
a av
aila
ble
O
Dat
a no
t ava
ilabl
e
U
Not
app
licab
le
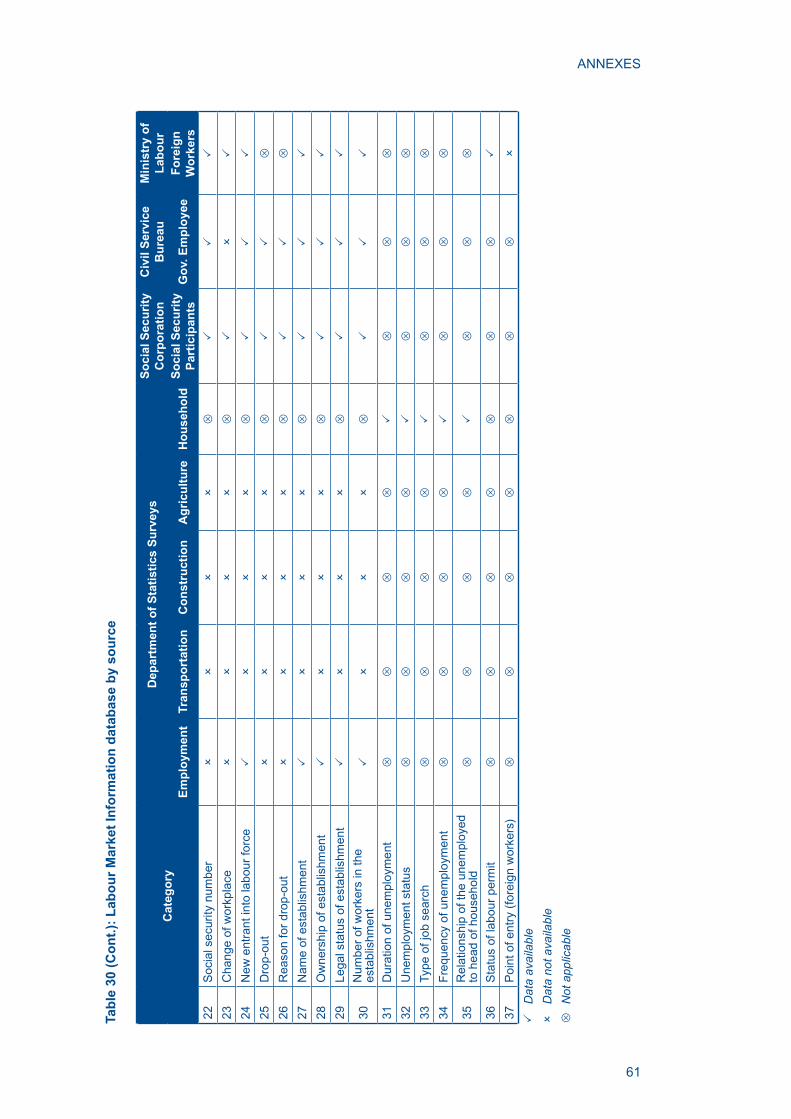
ANNEXES
61
Cat
ego
ryD
epar
tmen
t o
f S
tati
stic
s S
urv
eys
So
cial
Sec
uri
ty
Co
rpo
rati
on
Civ
il S
ervi
ce
Bu
reau
M
inis
try
of
Lab
ou
r
Em
plo
ymen
tTr
ansp
ort
atio
nC
on
stru
ctio
nA
gri
cult
ure
Ho
use
ho
ldS
oci
al S
ecu
rity
P
arti
cip
ants
Go
v. E
mp
loye
eF
ore
ign
W
ork
ers
22S
ocia
l sec
urity
num
ber
OO
OO
UP
PP
23C
hang
e of
wor
kpla
ceO
OO
OU
PO
P
24N
ew e
ntra
nt in
to la
bour
forc
eP
OO
OU
PP
P
25D
rop-
out
OO
OO
UP
PU
26R
easo
n fo
r dr
op-o
utO
OO
OU
PP
U
27N
ame
of e
stab
lishm
ent
PO
OO
UP
PP
28O
wne
rshi
p of
est
ablis
hmen
tP
OO
OU
PP
P
29Le
gal s
tatu
s of
est
ablis
hmen
tP
OO
OU
PP
P
30N
umbe
r of
wor
kers
in th
e es
tabl
ishm
ent
PO
OO
UP
PP
31D
urat
ion
of u
nem
ploy
men
tU
UU
UP
UU
U
32U
nem
ploy
men
t sta
tus
UU
UU
PU
UU
33Ty
pe o
f job
sea
rch
UU
UU
PU
UU
34F
requ
ency
of u
nem
ploy
men
t U
UU
UP
UU
U
35R
elat
ions
hip
of th
e un
empl
oyed
to
hea
d of
hou
seho
ldU
UU
UP
UU
U
36S
tatu
s of
labo
ur p
erm
itU
UU
UU
UU
P
37P
oint
of e
ntry
(fo
reig
n w
orke
rs)
UU
UU
UU
UO
P
Dat
a av
aila
ble
O
Dat
a no
t ava
ilabl
e
U
Not
app
licab
le
Tab
le 3
0 (C
on
t.):
Lab
ou
r M
arke
t In
form
atio
n d
atab
ase
by
sou
rce

UNEMPLOYMENT IN JORDAN
62
Tab
le 3
1: C
od
es a
nd
cla
ssifi
cati
on
su
sed
by
each
inst
itu
tio
n
Cla
ssifi
cati
on
DO
SM
OL
SS
CC
SB
Occ
up
atio
nIS
CO
-88
New
occ
upat
ions
IS
CO
2–
–
Eco
no
mic
act
ivit
yIS
IC3
17 m
ajor
eco
nom
ic a
ctiv
ities
ISIC
2
9 m
ajor
eco
nom
ic a
ctiv
ities
ISIC
2
9 m
ajor
eco
nom
ic a
ctiv
ities
–
Ed
uca
tio
n
ISC
ED
––
Ow
n cl
assi
ficat
ion
Co
un
trie
s O
wn
clas
sific
atio
nO
wn
clas
sific
atio
nO
wn
clas
sific
atio
nO
wn
clas
sific
atio
n
Ad
min
istr
ativ
e u
nit
s
(cit
ies
and
vill
ages
) O
wn
clas
sific
atio
n–
––
ISC
O: I
nter
natio
nal S
tand
ard
Cla
ssifi
catio
nof
Occ
upat
ion
ISIC
: Int
erna
tiona
l Sta
ndar
d In
dust
rial C
lass
ifica
tion
ISC
ED
: Int
erna
tiona
l Sta
ndar
d C
lass
ifica
tion
ofE
duca
tion

ANNEXES
63
ANNEX 3: LIST OF TABLES, FIGURES AND BOXES
Tables and figures
Table 1: Employment by sector and year (%) 22
Figure 1: Employment by sector, 1987 and 2003 (%) 22
Table 2: Economic activity rates in Jordan for population aged 15-64 (%) 22
Figure 2: Evolution of economic activity rates (%) 23
Table 3: Insured employees by economic sector 23
Table 4: Jordanians in employment by educational level, 2003 (%) 24
Figure 3: Jordanians in employment by educational level, 2003 (%) 24
Table 5: Jordanians in employment by occupation, 2003 (%) 24
Table 6: Non-Jordanian workers holding work permits by economic sector, 2003 25
Table 7: Private sector employment by firm size and economic activity (%) 26
Table 8: Estimate of the informal microenterprise sector, 2000 26
Figure 4: Distribution of unemployed Jordanians by gender (%) 27
Table 9: Unemployment and economic activity rates in Jordan (%) 28
Table 10: Distribution of unemployed Jordanians by gender and age group, 2003 (%) 28
Table 11: Key indicators in 2003 by age (%) 28
Figure 5: Distribution of unemployed Jordanians by gender and age group (%) 29
Table 12: Distribution of unemployed Jordanians by level of education, 2003 (%) 29
Figure 6: Distribution of unemployed men and women by educational level (%) 30
Table 13: Key indicators in 2003 by level of education (%) 30
Table 14: Employment and unemployment after VTC’s programme (%) 31
Table 15: Unemployed Jordanians by duration of unemployment, 2003 (%) 32
Table 16: Duration of unemployment (%) 32
Table 17: Reasons for not seeking work given by economically inactive population available for work (%) 33
Figure 7: Long-term unemployment (12 months or more) by gender (%) 33
Table 18: Distribution of unemployed Jordanians by first jobseeking method, 2003 (%) 34
Figure 8: Unemployed Jordanians by employment status (%) 34
Table 19: Employed Jordanians by main current industry, 2003 (%) 35
Table 20: Reasons given by employed persons for wanting different or additional work, 2003 (%) 35
Table 21: Applicants and appointees during the year 2003 38
Table 22: Applicants and appointees by field of education in 2003 38
Figure 9: CSB recruitment rates by age, gender and year (%) 39
Figure 10: CSB recruitment rates by governorate (%) 40
Table 23: Applicants and appointees by governorate and year 40
Table 24: Unemployment rate by governorate, urban and rural, 2003 (% of governorate population) 41
Table 25: Distribution of unemployed by governorate, 2003 (% of total unemployment) 42
Figure 11: Distribution of male unemployed by governorate (%) 42
Figure 12: Distribution of female unemployed by governorate (%) 43
Table 26: Comparison between unemployment and population distribution by governorate 43
Table 27: Detailed technical proposals for improving information systems in institutions 53
Table 28: Labour market information in the Al Manar database 58
Table 29: Labour Market Information System 59
Table 30: Labour Market Information database by source 60
Table 31: Codes and classifications used by each institution 62
Boxes
Tracer studies following up VTC training programmes 31
Recruitment examples by field of education 38
Lessons drawn from past and current experience to ensure that local employment strategies are successful 51


65
ACI Amman Chamber of Industry
CSB Civil Service Bureau
DOS Department of Statistics
ETF European Training Foundation
EU European Union
GDP gross domestic product
HR human resources
HRD human resources development
HRIKS Human Resources Information and Knowledge System
ILO International Labour Organization
ISCED International Standard Classification of Education
ISCO International Standard Classification of Occupation
ISIC International Standard Industrial Classification
JD Jordanian Dinar
LM labour market
LMI labour market information
MOE Ministry of Education
MOHE Ministry of Higher Education
MOL Ministry of Labour
NCHRD National Center for Human Resources Development
NGO non-governmental organisation
OECD Organisation for Economic Cooperation and Development
OF Observatory Function
SSC Social Security Corporation
VET vocational education and training
VTC Vocational Training Corporation
WB World Bank
WTO World Trade Organization
YEA Young Entrepreneurs Association
ACRONYMS


European Training Foundation
Unemployment in Jordan
Luxembourg: Office for Official Publications of the European Communities
2005 — 65 pp. — 21 x 29.7 cm
ISBN 92-9157-453-8


THE EUROPEAN TRAINING FOUNDATION (ETF) IS THE EUROPEAN UNION’S CENTRE OF EXPERTISE SUPPORTING VOCATIONAL EDUCATION AND TRAINING REFORM IN THIRD COUNTRIES IN THE CONTEXT OF THE EU EXTERNAL RELATIONS PROGRAMMES
SALES AND SUBSCRIPTIONS
Publications for sale produced by the Office for Official Publications of the EuropeanCommunities are available from our sales agents throughout the world.
You can find the list of sales agents on the Publications Office website (http://publications.eu.int)or you can apply for it by fax (352) 29 29-42758.
Contact the sales agent of your choice and place your order.
HOW TO CONTACT US
Further information on our activities, calls for tender and job opportunities can be found on our web site: www.etf.eu.int
For any additional information please contact:
External Communication UnitEuropean Training FoundationVilla GualinoViale Settimio Severo 65I – 10133 TorinoT +39 011 630 2222F +39 011 630 2200E [email protected]

TA-69-05-763-E
N-C
UNEMPLOYMENT IN JORDAN
National Center For Human Resources
Deve
lopm
ent