unearthing the subsoil - world...
TRANSCRIPT

Unearthing the SubsoilMining and Its Contribution to National Development
August 2014 | Edition No. 6
Pub
lic D
iscl
osur
e A
utho
rized
Pub
lic D
iscl
osur
e A
utho
rized
Pub
lic D
iscl
osur
e A
utho
rized
Pub
lic D
iscl
osur
e A
utho
rized


Mining and Its Contribution to National DevelopmentUnearthing the Subsoil
Rwanda Economic Update

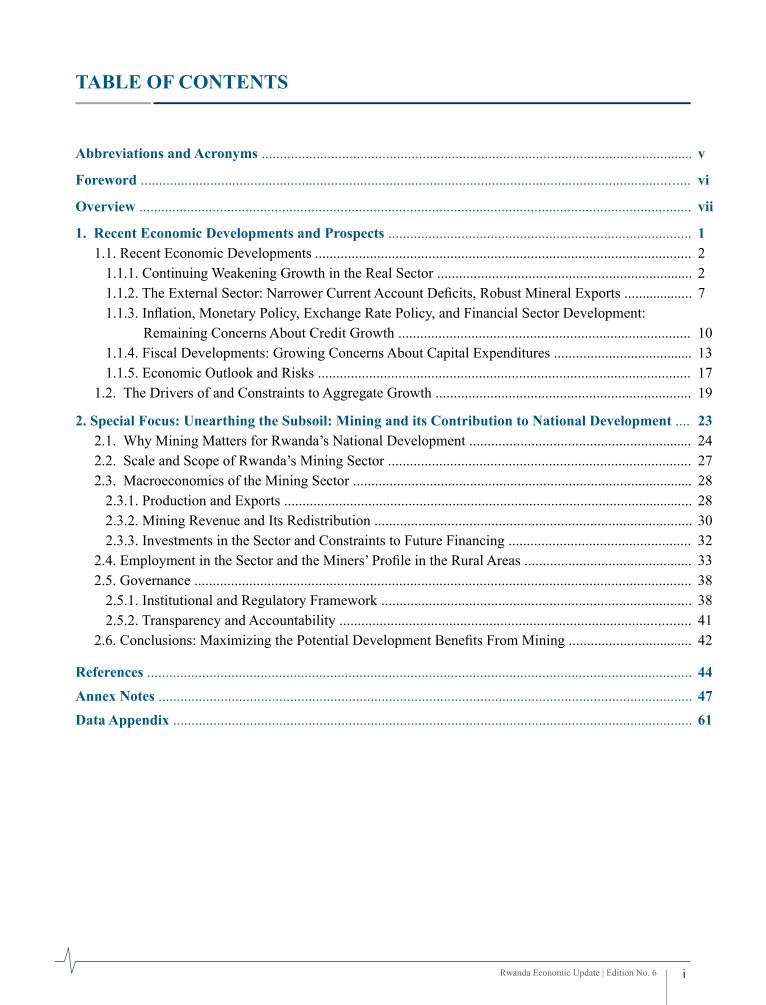
TABLE OF CONTENTS
Abbreviations and Acronyms ...................................................................................................................... v
Foreword ...................................................................................................................................................... vi
Overview ....................................................................................................................................................... vii
1. Recent Economic Developments and Prospects ................................................................................... 11.1. Recent Economic Developments ....................................................................................................... 2
1.1.1. Continuing Weakening Growth in the Real Sector ...................................................................... 21.1.2. The External Sector: Narrower Current Account Deficits, Robust Mineral Exports ................... 71.1.3. Inflation, Monetary Policy, Exchange Rate Policy, and Financial Sector Development: Remaining Concerns About Credit Growth ................................................................................ 101.1.4. Fiscal Developments: Growing Concerns About Capital Expenditures ...................................... 131.1.5. Economic Outlook and Risks ...................................................................................................... 17
1.2. The Drivers of and Constraints to Aggregate Growth ...................................................................... 19
2. Special Focus: Unearthing the Subsoil: Mining and its Contribution to National Development .... 232.1. Why Mining Matters for Rwanda’s National Development ............................................................. 242.2. Scale and Scope of Rwanda’s Mining Sector ................................................................................... 272.3. Macroeconomics of the Mining Sector ............................................................................................. 28
2.3.1. Production and Exports ................................................................................................................ 282.3.2. Mining Revenue and Its Redistribution ....................................................................................... 302.3.3. Investments in the Sector and Constraints to Future Financing .................................................. 32
2.4. Employment in the Sector and the Miners’ Profile in the Rural Areas .............................................. 332.5. Governance ........................................................................................................................................ 38
2.5.1. Institutional and Regulatory Framework ..................................................................................... 382.5.2. Transparency and Accountability ................................................................................................ 41
2.6. Conclusions: Maximizing the Potential Development Benefits From Mining .................................. 42
References ..................................................................................................................................................... 44Annex Notes .................................................................................................................................................. 47Data Appendix .............................................................................................................................................. 61
Rwanda Economic Update | Edition No. 6 i

LiST OF FigURES
Figure 0.1: 2013 Growth Rate Was Lowest Since 2002 .............................................................................. viiFigure 0.2: Domestic Demand Negatively Contributed in 2013 ................................................................. viiFigure 0.3: Sectoral Economic Structure ..................................................................................................... viiiFigure 0.4: Contributions to Growth in 2006–13 ......................................................................................... viiiFigure 0.5: Economic Structure By Expenditures ....................................................................................... ixFigure 0.6: Credit to the Private Sector Has Remained Low, Although Liquidity Constraints Have Been Eased xFigure 0.7: Mining’s Contribution to GDP Still Remains Low at 2 percent ................................................ xiiFigure 0.8: Export Earnings From Mining Have Risen Sharply Within a Decade ...................................... xiiFigure 0.9: Mining is the Biggest Foreign Exchange Earner ....................................................................... xiiFigure 0.10: Mining’s Contribution to Total Revenue ................................................................................... xiiiFigure 1.1: 2013 Growth Rate Was Lowest Since 2002 .............................................................................. 2Figure 1.2: Domestic Demand Negatively Contributed in 2013 ................................................................. 2Figure 1.3: Consumption and Investment Remained Weak in 2013 ............................................................ 3Figure 1.4: Private Investment and Durable Capital Goods Investment Led Weak Investment Growth .... 3Figure 1.5: Delayed Disbursement of Capital Expenditures and Low Net Lending ................................... 3Figure 1.6: Improvements in Net Exports .................................................................................................... 3Figure 1.7: Low Imports Reflect Low Domestic Demand ........................................................................... 4Figure 1.8: Services Sector Slowed Down ................................................................................................... 4Figure 1.9: Growth in Services Sectors Slowed .......................................................................................... 4Figure 1 10: Mining Growth was High in 2013, But its Growth Pattern is Volatile ...................................... 5Figure 1.11: Mineral Exports of Main Products ............................................................................................ 8Figure 1.12: Tourism Receipts ....................................................................................................................... 8Figure 1.13: Sectoral Share in Foreign Direct Investment ............................................................................ 9Figure 1.14: Export Growth Momentum Has Been Lost in the First Six Months of 2014 ............................ 9Figure 1.15: Imports Have Gained Momentum in the First Six Months of 2014 .......................................... 9Figure 1.16: Inflation Brought Down by Moderate Import Prices ................................................................ 10Figure 1.17: Rwanda Franc against U.S. Dollar and Real Effective Exchange Rate Depreciated in 2013 .. 11Figure 1.18: Lending Rate Did Not Respond to Policy Rate Cut .................................................................. 11Figure 1.19: Credit to the Private Sector has Remained Low, Although Liquidity Constraints Have Been Eased ... 12Figure 1.20: Credit Decelerated Across All Sectors of the Economy ............................................................ 12Figure 2.1: World Bank’s Extractive Industries Value Chain ...................................................................... 26Figure 2.2: Number of Mining Permits Held at Year End ........................................................................... 27Figure 2.3: Total Mineral Exports ................................................................................................................ 29Figure 2.4: Production of Rwanda’s Major Export Minerals ....................................................................... 29Figure 2.5: Exports for Rwanda’s Major Minerals ...................................................................................... 29Figure 2.6: Minerals Revenues .................................................................................................................... 30Figure 2.7: Mining Employment and its Concentration in the Northwest ................................................... 35Figure 2.8: Miners Are Somewhat Better Educated Than Farm Wage Workers But Significantly Worse Than The Overall Labor Force .................................................................................................. 36Figure 2.9: Average and Median Annual Wage Incomes ............................................................................. 37Figure 2.10: Institutional Mapping ................................................................................................................ 40
Rwanda Economic Update | Edition No. 6 ii
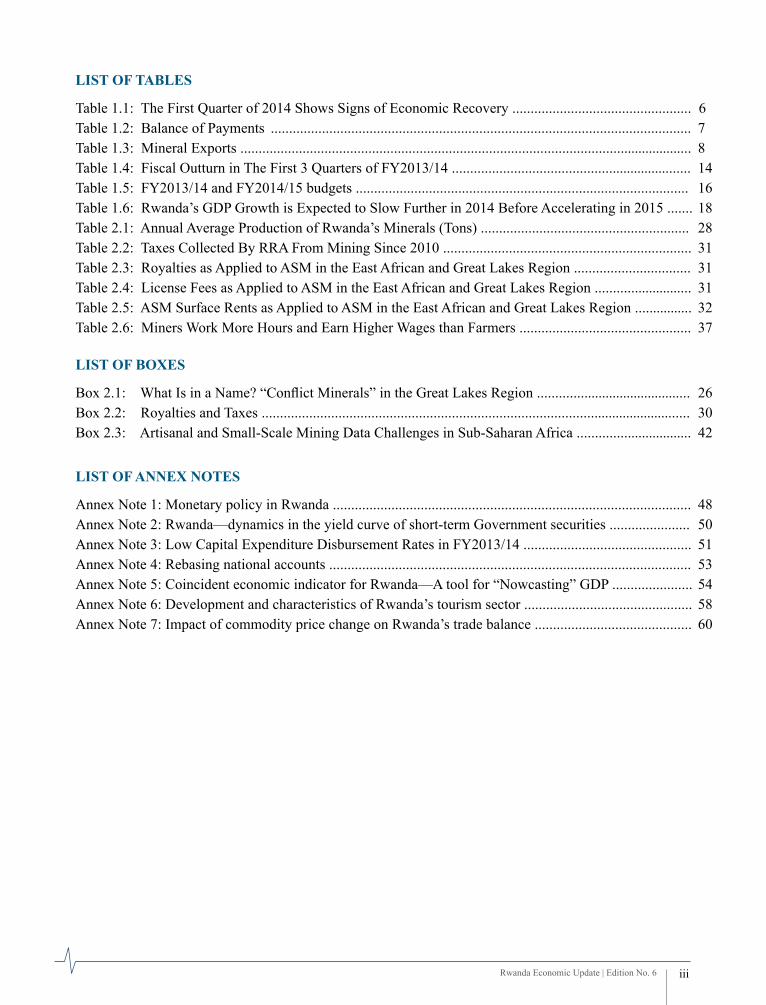
LiST OF TABLES
Table 1.1: The First Quarter of 2014 Shows Signs of Economic Recovery ................................................. 6Table 1.2: Balance of Payments ................................................................................................................... 7Table 1.3: Mineral Exports ............................................................................................................................ 8Table 1.4: Fiscal Outturn in The First 3 Quarters of FY2013/14 .................................................................. 14Table 1.5: FY2013/14 and FY2014/15 budgets ........................................................................................... 16Table 1.6: Rwanda’s GDP Growth is Expected to Slow Further in 2014 Before Accelerating in 2015 ....... 18Table 2.1: Annual Average Production of Rwanda’s Minerals (Tons) ......................................................... 28Table 2.2: Taxes Collected By RRA From Mining Since 2010 .................................................................... 31Table 2.3: Royalties as applied to ASM in the East African and Great Lakes Region ................................ 31Table 2.4: License Fees as applied to ASM in the East African and Great Lakes Region ........................... 31Table 2.5: ASM Surface Rents as applied to ASM in the East African and Great Lakes Region ................ 32Table 2.6: Miners Work More Hours and Earn Higher Wages than Farmers ............................................... 37
LiST OF BOxES
Box 2.1: What is in a name? “Conflict Minerals” in the Great Lakes Region ........................................... 26Box 2.2: Royalties and Taxes ...................................................................................................................... 30Box 2.3: Artisanal and Small-Scale Mining Data Challenges in Sub-Saharan Africa ................................ 42
LiST OF ANNEx NOTES
Annex Note 1: Monetary policy in Rwanda .................................................................................................. 48Annex Note 2: Rwanda—dynamics in the yield curve of short-term Government securities ...................... 50Annex Note 3: Low Capital Expenditure Disbursement Rates in FY2013/14 .............................................. 51Annex Note 4: Rebasing national accounts ................................................................................................... 53Annex Note 5: Coincident economic indicator for Rwanda—A tool for “Nowcasting” GDP ...................... 54Annex Note 6: Development and characteristics of Rwanda’s tourism sector .............................................. 58Annex Note 7: Impact of commodity price change on Rwanda’s trade balance ........................................... 60
Rwanda Economic Update | Edition No. 6 iii


ABBREViATiONS AND ACRONYMS
ASM Artisanal and Small-scale MiningBgR Bundesanstalt fur Geowissenschaften und RohstoffeBNR Banque Nationale du Rwanda (National Bank of Rwanda)CEi Coincident Economic IndicatorCPi Consumer Price IndexEDPRS 2 Second Economic Development and Poverty Reduction StrategyEiCV Integrated Household Living Conditions SurveyEiTi Extractive Industries Transparency Initiative DRC Democratic Republic of CongoFDi Foreign Direct InvestmentFECOMiRWA Federation des Cooperatives Minieres Rwanda FY Fiscal YeargDP Gross Domestic ProductgMD Geology and Mining DepartmentgNi Gross national incomeiCgLR international Conference on the Great Lakes RegioniMF International Monetary FundiTSCi Tin Supply Chain InitiativeiTRi international Tin Research instituteKCC Kigali Convention CenterMiNECOFiN Ministry of Finance and Economic PlanningMiNiCOM Ministry of Trade and IndustryMiNiRENA Ministry of Natural ResourcesMPC Monetary Policy CommitteeMTEF Medium-Term Expenditure FrameworkNiSR National Institute of Statistics of RwandaOECD Organisation for Economic Co-operation and DevelopmentPFM Public Financial ManagementRDB Rwanda Development BoardRRA Rwanda Revenue AuthorityREER Real Effective Exchange Rate REU Rwanda Economic UpdateRwf Rwandan franc SOMiRWA Société Minière de RwandaUN United Nations
Rwanda Economic Update | Edition No. 6 v

Rwanda Economic Update | Edition No. 6 vi
FOREWORD
The Rwanda Economic Update reports on and synthesizes recent economic developments and places them in a medium-term and global context. It analyzes the implications of these developments and
policies for the outlook of Rwanda’s economy. These reports attempt to make an analytical contribution to the implementation of Rwanda’s national development strategy. Each edition of the report includes a special feature on a selected topic. The report is intended for a wide audience, including policy makers, business leaders and other market participants, and the community of analysts engaged in Rwanda’s economy.
The sixth edition of the Rwanda Economic Update was prepared by the Rwanda Macroeconomics and Fiscal Management Global Practice team at the World Bank. Toru Nishiuchi (Economist) led the team and the recent economic developments section. Rachel Perks (Mining Specialist) led the special focus section. Other team members who contributed to the sixth edition are Yoichiro Ishihara (Senior Economist), Jane Bogoev (Economist), Valence Kimenyi (Economist), and Peace Aimee Niyibizi (Consultant). Apurva Sanghi (Program Leader) supervised the team. Diarietou Gaye (Country Director), Carolyn Turk (Country Manager), and Pablo Fajnzylber (Practice Manager) provided overall guidance. The team was supported by Sylvie Ingabire (Team Assistant), Martin Buchara (Team Assistant) and Sherrie Brown (Editor).
Although this report does not represent the official views of the authorities, the macroeconomic unit of the Ministry of Finance and Economic Planning (MINECOFIN) and the National Bank of Rwanda (BNR) were engaged in the formulation of this report and provided valuable comments. The Bank team appreciates their contributions.
The findings, interpretations, and conclusions expressed herein are those of the authors and do not necessarily reflect the views of the World Bank’s Board of Executive Directors or the countries they represent. The World Bank does not guarantee the accuracy of the data included in this report. For more information about the World Bank and its activities in Rwanda, please visit www.worldbank.org/rw. To be included in the email distribution list of this semiannual series and related publications, please contact [email protected]. For questions and comments about this publication, please contact Toru Nishiuchi ([email protected]).
OVERViEW
Rwanda Economic Update | Edition No. 6 vii
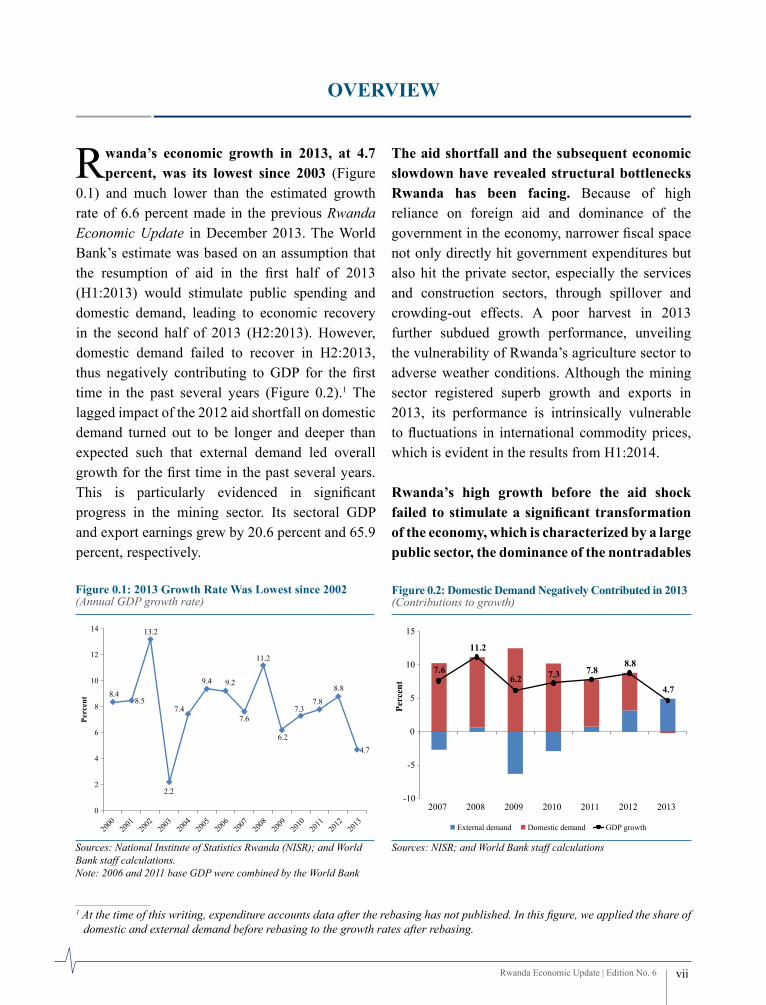
Rwanda’s economic growth in 2013, at 4.7 percent, was its lowest since 2003 (Figure
0.1) and much lower than the estimated growth rate of 6.6 percent made in the previous Rwanda Economic Update in December 2013. The World Bank’s estimate was based on an assumption that the resumption of aid in the first half of 2013 (H1:2013) would stimulate public spending and domestic demand, leading to economic recovery in the second half of 2013 (H2:2013). However, domestic demand failed to recover in H2:2013, thus negatively contributing to GDP for the first time in the past several years (Figure 0.2).1 The lagged impact of the 2012 aid shortfall on domestic demand turned out to be longer and deeper than expected such that external demand led overall growth for the first time in the past several years. This is particularly evidenced in significant progress in the mining sector. Its sectoral GDP and export earnings grew by 20.6 percent and 65.9 percent, respectively.
The aid shortfall and the subsequent economic slowdown have revealed structural bottlenecks Rwanda has been facing. Because of high reliance on foreign aid and dominance of the government in the economy, narrower fiscal space not only directly hit government expenditures but also hit the private sector, especially the services and construction sectors, through spillover and crowding-out effects. A poor harvest in 2013 further subdued growth performance, unveiling the vulnerability of Rwanda’s agriculture sector to adverse weather conditions. Although the mining sector registered superb growth and exports in 2013, its performance is intrinsically vulnerable to fluctuations in international commodity prices, which is evident in the results from H1:2014.
Rwanda’s high growth before the aid shock failed to stimulate a significant transformation of the economy, which is characterized by a large public sector, the dominance of the nontradables
Figure 0.1: 2013 growth Rate Was Lowest since 2002(Annual GDP growth rate)
8.48.5
13.2
2.2
7.4
9.4 9.2
7.6
11.2
6.2
7.37.8
8.8
4.7
0
2
4
6
8
10
12
14
2000
2001
2002
2003
2004
2005
2006
2007
2008
2009
2010
2011
2012
2013
Perc
ent
Sources: National Institute of Statistics Rwanda (NISR); and World Bank staff calculations.Note: 2006 and 2011 base GDP were combined by the World Bank
Figure 0.2: Domestic Demand Negatively Contributed in 2013 (Contributions to growth)
7.6
11.2
6.2 7.3 7.88.8
4.7
-10
-5
0
5
10
15
2007 2008 2009 2010 2011 2012 2013
Perc
ent
External demand Domestic demand GDP growth
Sources: NISR; and World Bank staff calculations
1 At the time of this writing, expenditure accounts data after the rebasing has not published. In this figure, we applied the share of domestic and external demand before rebasing to the growth rates after rebasing.

Rwanda Economic Update | Edition No. 6 viii
Executive Summary
sectors, and limited private investment. Between 2006 and 2013, the economy was led by services (45 percent), followed by agriculture (33 percent).2 The share of industry (15 percent) somewhat increased thanks to construction, but manufacturing remains low at 5 percent (Figure 0.3). Growth was driven by the nontradables sector while the contribution from the tradables sector (agricultural products, manufacturing, and mining) has been limited (panel (a) of Figure 0.4). This is reflected in the high services sector contribution (54 percent) to
overall growth followed by agriculture (21 percent) and industry (18 percent) (panel (b) of Figure 0.4). In the expenditure account, although the share of investment increased from 16 percent in 2006 to 25 percent in 2013, the increase was mainly due to investment in construction, whereas investment in capital goods increased only marginally (Figure 0.5), and public investment financed by foreign aid accounted for more than 50 percent of total investment. Although the share of exports increased to 17 percent in 2013, there has been little progress toward export diversification. Traditional products (coffee, tea, and minerals) accounted for almost 60 percent of exports in 2013.
Foreign aid and effective use of it have played a critical role in growth and macroeconomic stability.3 Net official development assistance as a share of GNI remained high at 20 percent in 2011, or 86 percent of gross fixed capital formation, though it declined from more than 150 percent in the early 2000s.4 Aid flows into Rwanda have been redistributed through public expenditures. In the past decade, foreign aid (accounting for 30–
Figure 0.3: Sectoral Economic Structure
38 33
710
7 5
42 45
6 7
0
20
40
60
80
100
2006 2013
Perc
ent
Adjustments Services Manufacturing Industry (without manufacturing)Agriculture
Sources: NISR; and World Bank staff calculations.
Figure 0.4: Contributions to growth in 2006–13Panel (a). By Tradables vs. Nontradables Sectors Panel (b). By Sector
Tradable,27%
Nontradable,73%
Agriculture, 21%
Industry, 18%
Public services, 10%
Private services, 44%
Adjustments, 7%
Sources: NISR; and World Bank staff calculations
2 A More than 60 percent of poor households had an income-earning activity outside of agriculture in 2011. This seems to be reflected in the increase in the share of services.
3 Rwanda’s performance on aid effectiveness is the best among 77 participating countries (Ishihara 2012).4 The ratios fell to 12 percent of GNI and 51 percent of gross fixed capital formation in 2012 because of the aid shock. Neighboring
countries rely much less on net official assistance against their GNI: Kenya (7.2 percent), Tanzania (10.4 percent), Uganda (10.4 percent), and Sub-Sahara African average (3.4 percent).

Rwanda Economic Update | Edition No. 6 ix
Executive Summary
40 percent of the budget) has supplemented low domestic tax collections and created fiscal space. Although the direct impact of public recurrent expenditures has been relatively small (public services contributed 10 percent to the increase in GDP between 2006 and 2013, as illustrated in Figure 0.4, panel (b)), public expenditures, both recurrent and capital, indirectly stimulated private services such as trade and real estate. Foreign exchange inflows through aid have also financed the current account deficit (excluding official transfers) and made the overall balance of payments positive in the past decade.
Under the current macroeconomic environment, the sixth edition of the Rwanda Economic Update (REU-6) seeks to answer three questions: Why did the economy not begin to recover in H2:2013? What are the expected growth rates in 2014 and 2015? What policies could prevent growth from further deceleration and, in the medium term, actually accelerate it by overcoming the structural bottlenecks? Furthermore, given the increasing importance of the mining sector as a future driver of economic growth and poverty reduction, the REU-6 proposes answers to the following questions: What is the profile of Rwanda’s mining sector? How can Rwanda benefit from its development?
(1) Recent Macroeconomic Developments and Outlook
Why did the economy not begin to recover in H2:2013?
The economy has been suffering from the lagged impact of the aid shortfall, which
continued to affect domestic demand in H2:2013. The economic slowdown in H1:2013, caused by the aid shortfall, resulted in a lagged withering of banks’ appetite for lending to the private sector in H2:2013. The slow credit growth, coupled with structural bottlenecks such as the nascent private sector and weak infrastructure, and with poor performance in the agricultural sector, further decelerated economic growth in H2:2013. Although the funding constraints in the budget have been eased with the resumption of aid in H1:2013, execution of capital expenditures has not yet accelerated as planned. The credit slowdown and the lower execution of the budget led to a continued slowdown in domestic demand. In the national accounts, growth of the services sector, previously the main growth driver, sharply decelerated to 5.3 percent in 2013 from 11.6 percent in 2012. For the first time since 2003 the contribution of domestic demand to economic growth turned negative and that of external demand (net exports) outpaced domestic demand (Figure 0.2). The moderate narrowing of the trade deficit is attributable to the continuing growth of exports and decelerating growth of imports. Despite declining exports earnings in coffee and tea due to low international prices, total exports increased by 19 percent because of the robust performance of mineral exports in 2013. Mining exports increased by 65 percent. The solid growth in mining production and exports was attained by the opening of new mines and rising international mineral prices.
Figure 0.5: Economic Structure by Expenditures
98 90
12 184 711 17
-25-
-31
-40
-20
0
20
40
60
80
100
120
140
2006 2013
Perc
ent
Imports Exports Investment (capital goods) Investment (construction) Consumption
Sources: National Bank of Rwanda (BNR); and World Bank staff calculations.

Rwanda Economic Update | Edition No. 6 x
Executive Summary
in H1:2014, continued stagnation of credit growth to the private sector has not resulted from limited liquidity but from a combination of lower credit demand and continued prudent behavior of commercial banks. In H2:2013, despite strong credit demand from the private sector, credit to the private sector was not extended because prudent commercial banks invested in Treasury bills instead. In contrast, in the first quarter of 2014, even though the growth rate of deposits at commercial banks accelerated, the growth rate of credit to the private sector remained stagnant (Figure 0.6). This situation suggests the effects of a combination of low credit demand from the private sector and continued prudent behavior of commercial banks in light of the economic slowdown and an increase in nonperforming loans.5
What growth rates are expected in 2014 and 2015?
Growth rates are unlikely to recover to the pre–aid shortfall levels, with growth
projected at 5.7 percent in 2014 and 6.6 percent in 2015. The projected growth rate for 2014 is
downgraded from 7.2 percent in the December 2013 edition of the Rwanda Economic Update, reflecting delayed implementations of capital expenditures and a continued slowdown of credit growth to the private sector. The growth recovery from 4.7 percent in 2013, however, is contingent on timely implementation of government capital expenditures.
What policies could prevent growth from further deceleration and act to accelerate it?
in the short term, proactive macroeconomic management seems feasible, given that
policy buffers have been restored with the aid resumption. With regard to monetary policy, although reserve money—the National Bank of Rwanda’s (BNR) monetary policy anchor—increased in H2:2013, the increase was mostly absorbed by increases in commercial banks’ reserves. In other words, credit to the private sector has not yet recovered. The lending rate remained high and unresponsive to a revision in the policy interest rate in June 2013. Credit growth to the private sector decelerated considerably, leading to a further slowdown in economic activity. The unchanged lending rate and the deceleration in credit growth can be attributed to limited transmission of monetary policy and a deterioration in banks’ lending appetite. In this regard, BNR pursued a further reduction in the policy interest rate from 7 percent to 6.5 percent in June 2014 to sustain economic recovery. From the standpoint of short-term fiscal policy, given the improved fiscal space since the resumption of aid and ongoing capacity constraints for budget execution at certain ministries, the authorities might consider accelerating implementation of delayed investment projects where capacity constraints do not exist, and prioritizing recruitment of public servants in these ministries.
5 BNR’s monetary policy statement reports that in 2013, 5,940 loan applications were rejected representing 7.5 percent of total applications against 4,865 rejections recorded in 2012, equivalent to a 6.7 percent rejection rate.
Figure 0.6: Credit to the Private Sector Has Remained Low, Although Liquidity Constraints Have Been Eased (Year-on-year growth rate)
0
5
10
15
20
25
30
35
40
Dec-11
Mar-12
Jun-1
2
Sep-12
Dec-12
Mar-13
Jun-1
3
Sep-13
Dec-13
Mar-14
Perc
ent
Credit to the private sector
Deposit
Sources: National Bank of Rwanda (BNR); and World Bank staff calculations.
Rwanda Economic Update | Edition No. 6 xi
Executive Summary
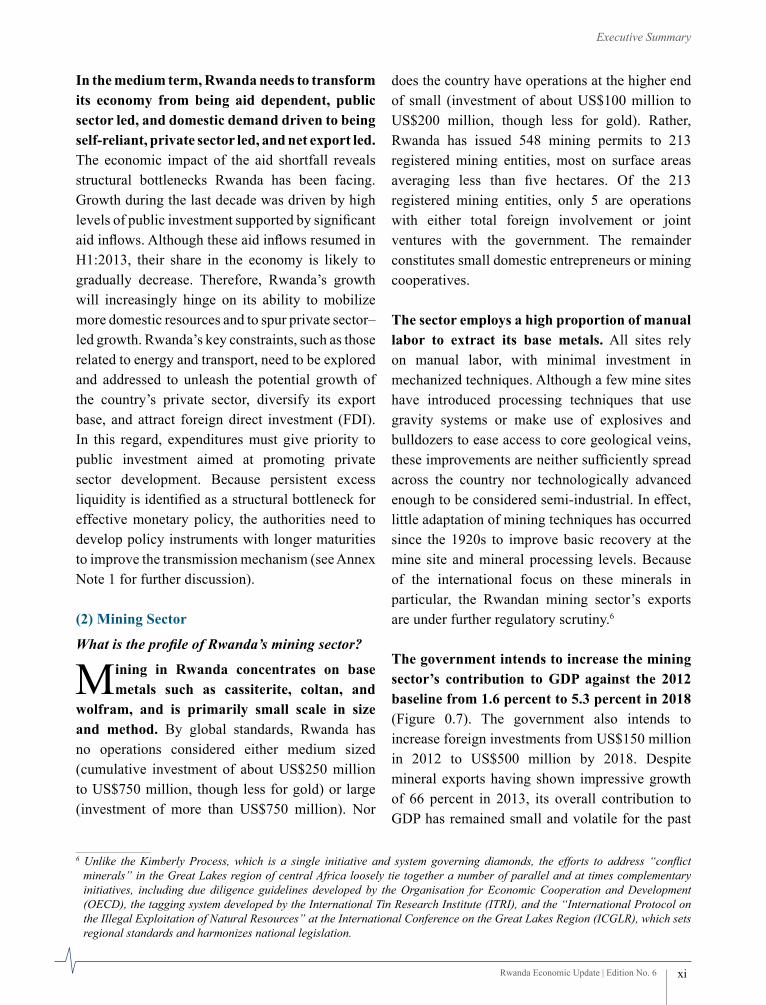
in the medium term, Rwanda needs to transform its economy from being aid dependent, public sector led, and domestic demand driven to being self-reliant, private sector led, and net export led. The economic impact of the aid shortfall reveals structural bottlenecks Rwanda has been facing. Growth during the last decade was driven by high levels of public investment supported by significant aid inflows. Although these aid inflows resumed in H1:2013, their share in the economy is likely to gradually decrease. Therefore, Rwanda’s growth will increasingly hinge on its ability to mobilize more domestic resources and to spur private sector–led growth. Rwanda’s key constraints, such as those related to energy and transport, need to be explored and addressed to unleash the potential growth of the country’s private sector, diversify its export base, and attract foreign direct investment (FDI).In this regard, expenditures must give priority to public investment aimed at promoting private sector development. Because persistent excess liquidity is identified as a structural bottleneck for effective monetary policy, the authorities need to develop policy instruments with longer maturities to improve the transmission mechanism (see Annex Note 1 for further discussion). (2) Mining Sector
What is the profile of Rwanda’s mining sector?
Mining in Rwanda concentrates on base metals such as cassiterite, coltan, and
wolfram, and is primarily small scale in size and method. By global standards, Rwanda has no operations considered either medium sized (cumulative investment of about US$250 million to US$750 million, though less for gold) or large (investment of more than US$750 million). Nor
does the country have operations at the higher end of small (investment of about US$100 million to US$200 million, though less for gold). Rather, Rwanda has issued 548 mining permits to 213 registered mining entities, most on surface areas averaging less than five hectares. Of the 213 registered mining entities, only 5 are operations with either total foreign involvement or joint ventures with the government. The remainder constitutes small domestic entrepreneurs or mining cooperatives.
The sector employs a high proportion of manual labor to extract its base metals. All sites rely on manual labor, with minimal investment in mechanized techniques. Although a few mine sites have introduced processing techniques that use gravity systems or make use of explosives and bulldozers to ease access to core geological veins, these improvements are neither sufficiently spread across the country nor technologically advanced enough to be considered semi-industrial. In effect, little adaptation of mining techniques has occurred since the 1920s to improve basic recovery at the mine site and mineral processing levels. Because of the international focus on these minerals in particular, the Rwandan mining sector’s exports are under further regulatory scrutiny.6
The government intends to increase the mining sector’s contribution to gDP against the 2012 baseline from 1.6 percent to 5.3 percent in 2018 (Figure 0.7). The government also intends to increase foreign investments from US$150 million in 2012 to US$500 million by 2018. Despite mineral exports having shown impressive growth of 66 percent in 2013, its overall contribution to GDP has remained small and volatile for the past
6 Unlike the Kimberly Process, which is a single initiative and system governing diamonds, the efforts to address “conflict minerals” in the Great Lakes region of central Africa loosely tie together a number of parallel and at times complementary initiatives, including due diligence guidelines developed by the Organisation for Economic Cooperation and Development (OECD), the tagging system developed by the International Tin Research Institute (ITRI), and the “International Protocol on the Illegal Exploitation of Natural Resources” at the International Conference on the Great Lakes Region (ICGLR), which sets regional standards and harmonizes national legislation.

decade. When measured against the government’s targets for the mining sector, its performance in 2013 was still not satisfactory.
in 2013, the value of mining exports reached US$225 million, slightly more than half way to reaching its 2017 target of US$400 million set by the second Economic Development and Poverty Reduction Strategy (EDPRS 2) (Figure 0.8). Mining exports account for 32 percent of total goods exports, making mining the largest foreign
exchange earner (Figure 0.9). Although export earnings from mining have been progressively rising, this rise is largely due to favorable mineral prices rather than substantive increases in domestic production. To see more sustainable, far-reaching development impacts from mining, significant efforts, as are being pursued by the government at present, will need to remain on both (1) increasing and improving methods for domestic production at existing mining sites and (2) increasing exploration activities that might lead to new mineral discoveries. At present, US$110.5 million in mining investment commitments is concentrated in exploration projects, though it is not clear whether these commitments will materialize.
Despite the small-scale nature of the mining sector, Rwanda has high hopes for the sector’s contribution to national development. it recognizes mining’s potential to contribute to jobs, exports, and FDI. The government’s poverty reduction target, from 45 percent to 30 percent by 2017, will require expansion of “off-farm” jobs7 through income diversification.8 Mining provides such an opportunity, though the sector is still in
Figure 0.7: Mining’s Contribution to gDP Still RemainsLow at 2 Percent
0
1999
2000
2001
2002
2003
2004
2005
2006
2007
2008
2009
2010
2011
2012
2013
1
2
3
4
Perc
ent o
f GD
P
Sources: NISR; and World Bank staff calculations
Figure 0.8: Export Earnings from Mining Have Risen Sharply within a Decade
0
50
100
150
200
250
Mill
ions
of U
S$
Sources: NISR; and World Bank staff calculations.
Figure 0.9: Mining is the Biggest Foreign Exchange Earner
0
20
40
60
80
100
Perc
ent o
f tot
al ex
port
s
Tea Coffee Mineral
Sources: NISR; and World Bank staff calculations.
7 The second Economic Development and Poverty Reduction Strategy (EDPRS 2).8 Diversification is relevant, given that, particularly in rural areas, more than 78 percent of the rural population still relies on
farming (EICV 3).
Rwanda Economic Update | Edition No. 6 xii
Executive Summary

need of further support to ensure fair salaries and sound working conditions. Job creation is also showing promise with 33,638 miners9 registered as of early 2014, slightly more than half of the 2017 target of 60,000. The latest job figures in mining place the sector above the services and tourism sectors, according to data from the third round of the Integrated Household Living Conditions Survey (EICV 3). The government’s intention to increase the sector’s professional educated skills base from fewer than 50 to 600 persons through a variety of external university opportunities and development of an undergraduate geology and mine engineering program at the Kigali Institute for Technology will also contribute to poverty reduction.
Beyond export earnings and employment, the sector’s producing operations brought in 1 percent of total revenues in 2013 though the sector has performed better on export earnings due to favorable international mineral prices (Figure 0.10). Revenue remained constant in 2013, despite the introduction of a royalty tax on select mines. Since 2010, total revenues from mining have been roughly US$22.2 million.
How can Rwanda benefit from mining development?
The government’s ongoing efforts to transform its predominantly small-scale
mining sector into semi-industrial and industrial activities will benefit from the government’s renewed strategic focus on broader development outcomes as opposed to a concentration on increasing export earnings alone. The reliance on export earnings to demonstrate mine development has prevented an examination of how effective mine development could occur with more strategic but fewer mine sites. Focusing on the type of sector the country wishes to build instead of on export volumes could provide government and industry efforts with a more efficient orientation. As it stands now, the burden of regulating a proliferated and geographically dispersed mining sector is evident. The Ministry of Natural Resources’ (MiNiRENA’s) target for 2017–18 to have on stream three medium-scale mines and 100 small-scale mines is worth recalling and revisiting. A series of objectives for the sector, based on this ratio, could be as follows:
a. Secure the Enabling Legal and Regulatory Environment for investment
Investment in Rwanda’s mining sector depends on clear and stable laws and their consistent application. Of key interest for mining investors is the transparent manner in which mine licenses are awarded and the tenure and fiscal stability offered through their agreements. With the changes to Rwanda’s mining law, the regularization of all outstanding mining permits should be addressed. Two areas are of concern: (1) renegotiating the larger producing licenses given their more immediate impact on fiscal revenue potential and foreign investment and (2) reviewing the status
Figure 0.10: Mining’s Contribution to Total Revenue
0
0.2
0.4
0.6
0.8
1.0
1.2
2010 2011 2012 2013
Perc
ent
% of GDP % of budget
Sources: Rwanda Revenue Authority (RRA); and World Bank staff calculations.
9 Figure provided by Rwanda Ministry of Natural Resources (MINIRENA). This figure excludes another 14,100 persons working in quarries. In email correspondence dated May 19, 2014, the International Tin Research Institute put the figure at 32,115 for the three principal minerals: cassiterite, coltan, and wolfram.
Rwanda Economic Update | Edition No. 6 xiii
Executive Summary

of existing small-scale mining licenses with attention to harmonizing exploitation licenses and potentially reducing the number of permits to a more manageable volume according to the stated target. A due process for all future contracts, based on streamlined institutional responsibilities and clear guidelines from a model mine agreement, may further enhance investor confidence in Rwanda’s mining sector for some of the larger assets, though may not be necessary for the majority of small-scale permits. The cadastre will play an essential role in harmonizing all existing permits, thereby reducing existing conflicts surrounding overlapping rights. It will also make available to interested private companies, through one centralized geographic information system map, data on prospective areas.
b. Build the geological Knowledge Base for Future investment
Detailed and publicly available geological knowledge plays a leading role in attracting future exploration investment for eventual mine development. The government’s commitment to invest US$2 million per year, on average, in potential target areas from the national budget is well noted, and should continue to be supported, perhaps even through development partners. It is likely that without any significant new discoveries, the size of the mining sector in Rwanda will remain limited.
c. increase Fiscal Receipts and Ensure Revenue Management
Three key measures to be undertaken by the government would assist in increasing mining revenues. First, effectively apply the new royalty rate through design and implementation of accompanying regulations. Second, support a third-party audit of the entire production and export chain to ensure conformity with new legislation on rents and rates but also on mineral classifications and export declarations. In that audit, look in particular
at how small-scale operators and cooperatives do, or do not, benefit from legislation and practices geared toward development of small and medium-sized enterprises. Rethink, if necessary, an adjusted tax model for the smaller operators, including cooperatives. Third, enhance the Rwanda Revenue Authority’s (RRA’s) capacity to administer taxation policies and collect revenues in the sector. The increase in revenue benefits from further fiscal receipts will require clear rules, guidelines, and procedures for retrocession, if at all, of mining revenues to the provinces, districts, and sectors, and accountability for their use by subnational authorities. These efforts would be enhanced by implementation of the Extractive Industries Transparency Initiative (EITI) to disclose revenue flows to the public.
d. improve Recovery and Domestic Processing
An additional strategy to increase production is to improve recovery techniques at sites. Rwanda has significant tailings dumps at its oldest concessions that could be cleaned up, treated, and processed for further economic gain. The government could consider making available, through a specific local loan program with leading banks, a revolving credit facility to provide an incentive to small-scale miners to invest in small recovery and processing equipment. The outcome would serve multiple agendas: environmental stewardship, small-business development, and export growth. Furthermore, it would not require allocation of new permits.
e. Strengthen Human Development (Skills and Labor Conditions)
By way of its workforce alone, Rwanda’s mining sector can make tangible and significant development impacts in the rural economy. A policy focus on the “good job” would see miners earn more pay for their labor, work in safe conditions, and be integrated into the social safety net of the formal
Rwanda Economic Update | Edition No. 6 xiv
Executive Summary

labor market. Building on existing work with Germany’s Bundesanstalt fur Geowissenschaften und Rohstoffe (Federal Institute for Geosciences and Natural Resources; BGR), the necessary small-scale mining regulations relating to occupational health and safety should be completed. It would be useful to perform an audit of existing labor practices used by subcontractors operating at the larger concessions, by small operators, and by cooperatives, and identify areas for improved
inspection practices. Frequency and efficiency of mine site inspections would benefit from the establishment of a fully functioning small-scale mining unit in the Geology and Mining Department (GMD), given the high number of mining licenses in the country. The targets set by the government to foster a new generation of skilled mine professionals should continue to be supported.
Rwanda Economic Update | Edition No. 6 xv
Executive Summary

Recent Economic Developments and Prospects
PART ONE

Rwanda Economic Update | Edition No. 6 2
Part 1: Recent Economic Developments
1.1 Recent Economic Developments
1.1.1. Continuing Weakening growth in the Real Sector
in 2013, Rwanda’s economic growth decelerated to 4.7 percent, the lowest growth
rate since 2003 (Figure 1.1). The fifth Rwanda Economic Update (REU-5) projected that the services sector would lead growth recovery from H2:2013 because the aid resumption would enable the government to accelerate its spending. REU-5 revised the 2013 growth rate projection from 7.0 percent made in June 2013 to 6.6 percent, mainly reflecting the lean agricultural harvest in H2:2013 and the further slowing of credit growth to the private sector. Despite the downward revision of the growth projection, the 2013 growth rate turned out to be 1.9 percentage points lower than projected.
The lagged effects of the aid shortfall on the country’s economic slowdown were more pronounced than projected. Following the significant aid shortfall in H2:2012, the lagged effects of the shortfall started to be felt in H1:2013. Although the authorities’ quick and adequate fiscal and monetary responses had contained the first-round impacts in H2:2012, the lagged effects were more pronounced because of the following
factors: First, lower government spending than budgeted, especially for capital expenditure, led to a pronounced economic slowdown through deceleration in the services sector. Second, a sharp deceleration in credit growth to the private sector resulted from reductions in both demand and supply caused by the economic slowdown and subsequently accumulated nonperforming loans. Third, the poor agricultural harvest added further downward pressure on growth. These recent developments illustrate the vulnerabilities created by the high reliance on foreign aid, the dominance of the government in the economy, and rain-fed nature of most agricultural production. This suggests that the focus in the medium term should be on domestic resource mobilization, private sector development and further agricultural development.
a. Expenditure AccountDomestic demand negatively contributed to overall growth for the first time in the past several years. In 2013, external demand contributed 4.8 percentage points to the overall growth rate of 4.6 percent, whereas domestic demand contributed −0.2 percentage point (Figure 1.2).10
Figure 1.1: 2013 growth Rate was Lowest Since 2002(Annual GDP growth rate, percent)
8.48.5
13.2
2.2
7.4
9.4 9.2
7.6
11.2
6.2
7.37.8
8.8
4.7
0
2
4
6
8
10
12
14
2000
2001
2002
2003
2004
2005
2006
2007
2008
2009
2010
2011
2012
2013
Perc
ent
Source: NISR; World Bank staff calculation.Note: 2006 and 2011 base GDP were combined by the World Bank.
Figure 1.2: Domestic Demand Negatively Contributed in 2013(Contributions to growth)
7.6
11.2
6.27.3 7.8
8.8
4.7
-10
-5
0
5
10
15
2007 2008 2009 2010 2011 2012 2013
Perc
ent
Domestic demand External demand GDP growth
Sources: NISR; and World Bank staff calculations.
10 At the time of this writing, expenditure accounts data after the rebasing has not published. In this figure, we applied the share of domestic and external demand before rebasing to the growth rates after rebasing.

Rwanda Economic Update | Edition No. 6 3
Part 1: Recent Economic Developments
Of the components of domestic demand, consumption contracted by 0.6 percent, the first contraction since 2003. Private consumption continued to contract by 1.2 percent in 2013, following a contraction of 1.1 percent in 2012 (Figure 1.3). Government consumption growth decelerated significantly from 14.5 percent in 2012 to 2.8 percent in 2013, reflecting delays in recruitment of new staff and purchases of goods and services by various ministries in the first half of FY2013/14.11 Significant deceleration of investment growth—to 1.1 percent in 2013 from 16.2 percent in 2012—was mainly caused by a
drop in private investment and durable capital goods investment (reflected in capital goods imports) (Figure 1.4). Private investment fell by 3.5 percentage points of GDP, reflecting slow credit growth to the private sector. The decline in durable capital goods investment was caused by delayed disbursement of capital expenditures and significantly lower net lending to government investment projects (Figure 1.5). Weak domestic demand is also reflected in the weak growth of goods imports, at 7.6 percent in 2013, down from 16.0 percent in 2012.
Figure 1.3: Consumption and investment RemainedWeak in 2013 (Annual growth rate)
10.37.3 6.9
14.9
3.8 5.0 9.3
-4.1
14.5
-1.1
16.3
-16.6
2.8
-1.2
1.1
-38.7-40
-30
-20
-10
0
10
20
Government Private Investment Net exports
Perc
ent
2010 2011 2012 2013
Consumption
Sources: NISR; and World Bank staff calculations.
Figure 1.4: Private investment and Durable Capital goods investment Led Weak investment growth (Annual growth rate)
13.2
1.19.0
3.9
-3.6
22.7 24.5
-13.8
35.0
1.1
15.7 17.2
29.4
-29.6
11.6
-21.5
-40
-30
-20
-10
0
10
20
30
40
Public Private Construction Durable capital goods
Perc
ent
2010 2011 2012 2013
By sector By goods
Sources: World Bank World Development Indicators; NISR; and World Bank staff calculations.
Figure 1.5: Delayed Disbursement of Capital Expenditures and Low Net Lending (Execution rate)
9487
9
8593
110
90 89
31
0
20
40
60
80
100
120
Domestically financed
Foreign financed
Net lending
Perc
ent
Jul-Dec 2013 Jan-Mar 2014 July 2013-Mar 2014
Capital expenditures
Sources: MINECOFIN;and World Bank staff calculations.
11 Rwanda’s fiscal year starts July 1 and ends June 30.
Figure 1.6: improvements in Net Exports
-700
-500
-300
-100
100
300
500
700
-50
-40
-30
-20
-10
0
10
20
30
40
50
2010 2011 2012 2013
Con
stan
t val
ue, R
wf i
n bi
llion
s
Year
-on-
year
grow
th ra
te, p
erce
nt
Net exports (Rwf billions, right scale)
Export growth (%, left scale)
Import growth (%, left scale)
Sources: NISR;and World Bank staff calculations.

Rwanda Economic Update | Edition No. 6 4
Part 1: Recent Economic Developments
improvements of net exports were driven by high export growth and low import growth (Figure 1.6). In 2013, exports grew by 41 percent. Since 2011, high export growth rates have been supported by high international commodity prices for Rwanda’s traditional export products, especially coltan. In contrast, import growth decelerated to single digits in 2012 and 2013. The combination of high export growth and low import growth contributed to the improvement in net exports. However, it is important to note that for Rwanda, where reliance on imports is relatively high, domestic demand and imports are highly correlated (Figure 1.7). Thus, low import growth suggests low domestic demand.
b. Production Accountin the production account, the services sector is the main cause of the growth slowdown (Figure 1.8). The services sector, which accounts for 45 percent of GDP, grew by 5.3 percent in 2013, down from 11.6 percent in 2012. The services sector has been the single biggest contributor to economic growth since 2003, compensating for smaller contributions by agriculture and industry. The contribution of the services sector to growth was at 2.5 percentage points in 2013, down from 5.4 percentage points in 2012. The deceleration of growth in the services sector mainly resulted from deceleration in public consumption and the stagnation of credit to the private sector.
growth moderated in both public and private sector services in 2013 (Figure 1.9). In the services sector, public services (sum of public administration, health, and education) account for 18 percent, while private services account for the remaining 82 percent. In 2012, growth in both public and private sector services accelerated thanks to increased public consumption. However, in 2013, growth in both private and public sector services sharply decelerated, led by the sharp reduction in public consumption and continued contraction in private consumption. In private services, wholesale and retail trade (25 percent of the sector) and real estate activities (12 percent) are the major services subsectors. Growth in the wholesale and retail trade subsector declined from 14.2 percent in 2012
Figure 1.7: Low imports Reflect Low Domestic Demand
Import growth
Growth of domestic demand
-20
-10
0
10
20
30
40
2000
2002
2004
2006
2008
2010
2012
2001
2003
2005
2007
2009
2011
2013
Year
-on-
year
gro
wth
, per
cent
Sources: NISR;and World Bank staff calculations.
Figure 1.8: Services Sector Slowed Down
1.0 2.3 2.6 1.7 1.6 2.11.0
1.2
2.0 0.2 1.12.3
1.21.3
5.2
6.2
2.8 4.23.7 5.4
2.5
0.3
0.8
0.7
0.40.1
0.1
-0.2
-2
0
2
4
6
8
10
12
2007 2008 2009 2010 2011 2012 2013
Perc
enta
ge p
oint
con
trib
utio
n to
rea
l GD
P gr
owth
Agriculture Industry Services Adjustment Real GDP growth (percent)
Sources: NISR; and World Bank staff calculations.
Figure 1.9: growth in Services Sectors Slowed
Private sector services
Public sector services
0
2
4
6
8
10
12
14
16
18
2007 2008 2009 2010 2011 2012 2013
Perc
ent
Sources: NISR; and World Bank staff calculations.
Rwanda Economic Update | Edition No. 6 5
Part 1: Recent Economic Developments
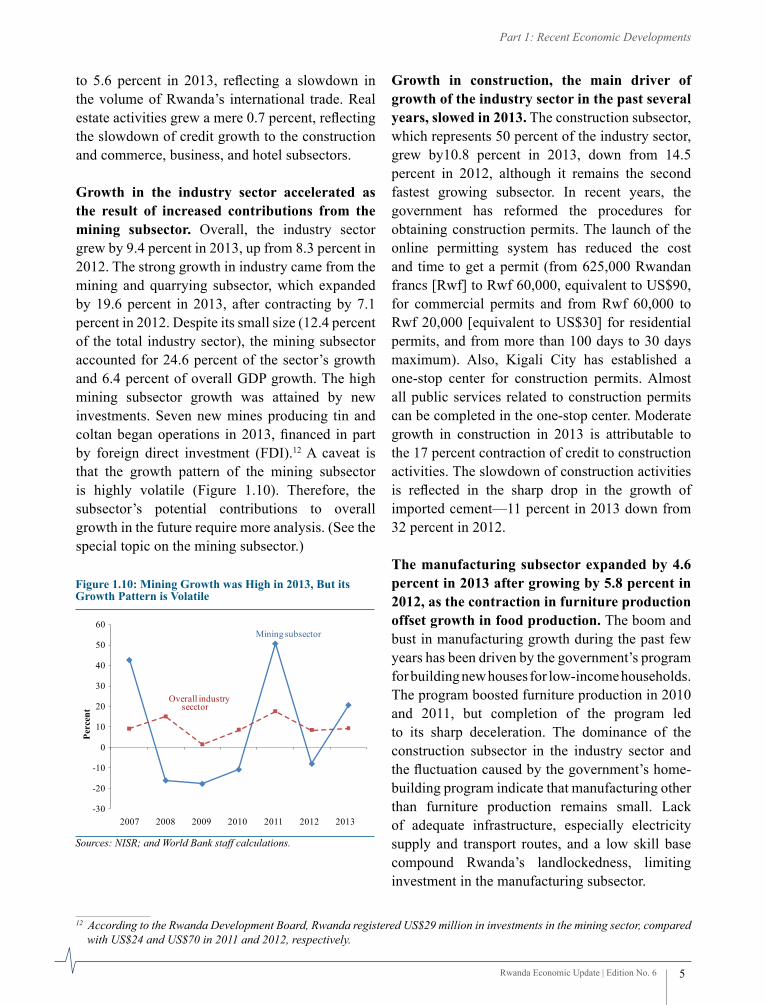
to 5.6 percent in 2013, reflecting a slowdown in the volume of Rwanda’s international trade. Real estate activities grew a mere 0.7 percent, reflecting the slowdown of credit growth to the construction and commerce, business, and hotel subsectors. growth in the industry sector accelerated as the result of increased contributions from the mining subsector. Overall, the industry sector grew by 9.4 percent in 2013, up from 8.3 percent in 2012. The strong growth in industry came from the mining and quarrying subsector, which expanded by 19.6 percent in 2013, after contracting by 7.1 percent in 2012. Despite its small size (12.4 percent of the total industry sector), the mining subsector accounted for 24.6 percent of the sector’s growth and 6.4 percent of overall GDP growth. The high mining subsector growth was attained by new investments. Seven new mines producing tin and coltan began operations in 2013, financed in part by foreign direct investment (FDI).12 a caveat is that the growth pattern of the mining subsector is highly volatile (Figure 1.10). Therefore, the subsector’s potential contributions to overall growth in the future require more analysis. (See the special topic on the mining subsector.)
growth in construction, the main driver of growth of the industry sector in the past several years, slowed in 2013. The construction subsector, which represents 50 percent of the industry sector, grew by10.8 percent in 2013, down from 14.5 percent in 2012, although it remains the second fastest growing subsector. In recent years, the government has reformed the procedures for obtaining construction permits. The launch of the online permitting system has reduced the cost and time to get a permit (from 625,000 Rwandan francs [Rwf] to Rwf 60,000, equivalent to US$90, for commercial permits and from Rwf 60,000 to Rwf 20,000 [equivalent to US$30] for residential permits, and from more than 100 days to 30 days maximum). Also, Kigali City has established a one-stop center for construction permits. almost all public services related to construction permits can be completed in the one-stop center. Moderate growth in construction in 2013 is attributable to the 17 percent contraction of credit to construction activities. The slowdown of construction activities is reflected in the sharp drop in the growth of imported cement—11 percent in 2013 down from 32 percent in 2012.
The manufacturing subsector expanded by 4.6 percent in 2013 after growing by 5.8 percent in 2012, as the contraction in furniture production offset growth in food production. The boom and bust in manufacturing growth during the past few years has been driven by the government’s program for building new houses for low-income households. The program boosted furniture production in 2010 and 2011, but completion of the program led to its sharp deceleration. The dominance of the construction subsector in the industry sector and the fluctuation caused by the government’s home-building program indicate that manufacturing other than furniture production remains small. Lack of adequate infrastructure, especially electricity supply and transport routes, and a low skill base compound Rwanda’s landlockedness, limiting investment in the manufacturing subsector.
Figure 1.10: Mining growth was High in 2013, But its growth Pattern is Volatile
Mining subsector
Overall industry secctor
-30
-20
-10
0
10
20
30
40
50
60
2007 2008 2009 2010 2011 2012 2013
Perc
ent
Sources: NISR; and World Bank staff calculations.
12 According to the Rwanda Development Board, Rwanda registered US$29 million in investments in the mining sector, compared with US$24 and US$70 in 2011 and 2012, respectively.

Rwanda Economic Update | Edition No. 6 6
Part 1: Recent Economic Developments
The agriculture sector expanded by 3.3 percent in 2013, dropping from 6.4 percent in 2012. Export crop production (coffee and tea) contracted by 4.7 percent, after growing by 9.0 percent in 2012. Coffee and tea production contracted by 9.4 percent and 1.3 percent, respectively, as a result of adverse weather conditions. Food crops, accounting for 68 percent of total agriculture production, grew by 3.6 percent in 2013, dropping from 7.1 percent in 2012 because of adverse weather conditions. Low growth in food crops is attributable to production of legumes, and roots and tubers, which grew by 3.2 percent and 3.4 percent, respectively. Rwanda’s agriculture is characterized by cultivation on rain-fed land and undeveloped irrigation. Some 79 percent of Rwanda’s land is classified as agricultural; 11 percent of total land is permanent cropland, of which only 0.6 percent is irrigated. Reliance on rain-fed production and vulnerability to weather conditions remain a structural bottleneck, indicating the urgent need for structural reforms to increase and stabilize agricultural production in the medium term.
The economy showed signs of recovery in the first quarter of 2014.13 The economy grew at 7.4 percent (year-on-year), compared with 4.7 percent in the same quarter in 2013 (Table 1.1). The economic recovery was driven by expansion in the services sector. The services sector grew by 8.3 percent, contributing 4.0 percentage points to overall growth. Among the services subsectors, the wholesale and retail trade subsector grew by 12.3 percent, contributing 1.5 percentage points to overall growth. The agriculture sector grew by 5.5 percent, contributing 1.7 percentage points to overall growth. The recovery in agriculture production reflects good weather conditions in the first agriculture season (season A). The industry sector grew by 8.8 percent, contributing 1.3 percentage points to overall growth. The mining subsector grew by 22.2 percent, contributing 0.4 percentage point to overall growth.
Table 1.1: The First quarter of 2014 Shows Signs of Economic Recovery(Growth rates, year-on-year basis, percent)
item2013 q1:2014
q1 q2 q3 q4 growth ContributiongDP 4.7 7.4 2.9 4.1 7.4 7.4Agriculture 6.2 7.1 1.4 −0.8 5.5 1.7
Food crops 6.5 6.5 0.8 0.8 5.7 1.2Export crops 10.0 23.1 −3.6 −22.9 9.1 0.1
industry 12.8 14.8 8.4 2.4 8.8 1.3Mining and quarrying 5.9 40.0 23.5 15.8 22.2 0.4Manufacturing 4.0 6.0 5.2 3.4 7.7 0.4Construction 22.4 17.5 9.7 0.0 7.3 0.6
Services 3.9 6.3 3.9 7.0 8.3 4.0Public expenditure–led services 6.0 7.2 4.9 6.0 6.7 0.6Other services 3.3 6.0 3.7 7.0 7.8 3.4
Sources: NISR
13 The National Institute of Statistics of Rwanda (NISR) recently rebased the national accounts. See Annex Note 4 for a detailed analysis. Because the revision process is still under way at the time of this writing, the NISR published only production data.
Rwanda Economic Update | Edition No. 6 7
Part 1: Recent Economic Developments
1.1.2. The External Sector: Narrower Current Account Deficits, Robust Mineral Exports
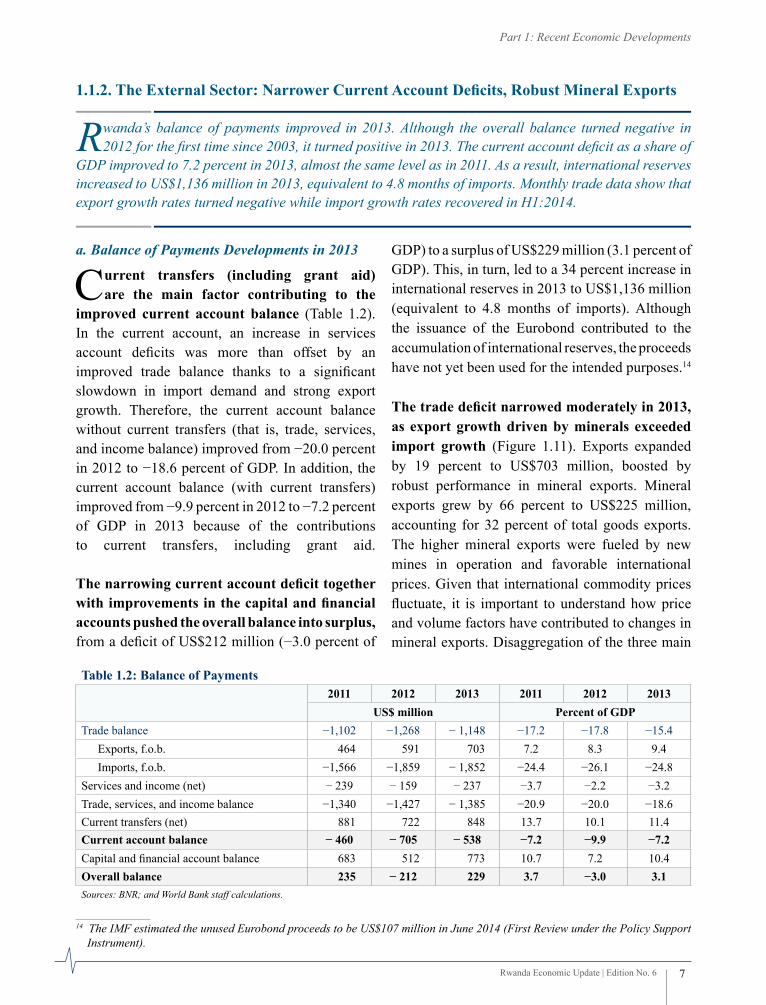
Rwanda’s balance of payments improved in 2013. Although the overall balance turned negative in 2012 for the first time since 2003, it turned positive in 2013. The current account deficit as a share of
GDP improved to 7.2 percent in 2013, almost the same level as in 2011. As a result, international reserves increased to US$1,136 million in 2013, equivalent to 4.8 months of imports. Monthly trade data show that export growth rates turned negative while import growth rates recovered in H1:2014.
a. Balance of Payments Developments in 2013
Current transfers (including grant aid) are the main factor contributing to the
improved current account balance (Table 1.2). In the current account, an increase in services account deficits was more than offset by an improved trade balance thanks to a significant slowdown in import demand and strong export growth. Therefore, the current account balance without current transfers (that is, trade, services, and income balance) improved from −20.0 percent in 2012 to −18.6 percent of GDP. In addition, the current account balance (with current transfers) improved from −9.9 percent in 2012 to −7.2 percent of GDP in 2013 because of the contributions to current transfers, including grant aid.
The narrowing current account deficit together with improvements in the capital and financial accounts pushed the overall balance into surplus, from a deficit of US$212 million (−3.0 percent of
GDP) to a surplus of US$229 million (3.1 percent of GDP). This, in turn, led to a 34 percent increase in international reserves in 2013 to US$1,136 million (equivalent to 4.8 months of imports). Although the issuance of the Eurobond contributed to the accumulation of international reserves, the proceeds have not yet been used for the intended purposes.14
The trade deficit narrowed moderately in 2013, as export growth driven by minerals exceeded import growth (Figure 1.11). Exports expanded by 19 percent to US$703 million, boosted by robust performance in mineral exports. Mineral exports grew by 66 percent to US$225 million, accounting for 32 percent of total goods exports. The higher mineral exports were fueled by new mines in operation and favorable international prices. Given that international commodity prices fluctuate, it is important to understand how price and volume factors have contributed to changes in mineral exports. Disaggregation of the three main
Table 1.2: Balance of Payments2011 2012 2013 2011 2012 2013
US$ million Percent of gDPTrade balance −1,102 −1,268 − 1,148 −17.2 −17.8 −15.4
Exports, f.o.b. 464 591 703 7.2 8.3 9.4 Imports, f.o.b. −1,566 −1,859 − 1,852 −24.4 −26.1 −24.8
Services and income (net) − 239 − 159 − 237 −3.7 −2.2 −3.2Trade, services, and income balance −1,340 −1,427 − 1,385 −20.9 −20.0 −18.6Current transfers (net) 881 722 848 13.7 10.1 11.4Current account balance − 460 − 705 − 538 −7.2 −9.9 −7.2Capital and financial account balance 683 512 773 10.7 7.2 10.4Overall balance 235 − 212 229 3.7 −3.0 3.1Sources: BNR; and World Bank staff calculations.
14 The IMF estimated the unused Eurobond proceeds to be US$107 million in June 2014 (First Review under the Policy Support Instrument).

Rwanda Economic Update | Edition No. 6 8
Part 1: Recent Economic Developments
Figure 1.12: Tourism Receipts
0.0
0.5
1.0
1.5
2.0
2.5
3.0
3.5
4.0
4.5
0
50
100
150
200
250
300
350
2006 2007 2008 2009 2010 2011 2012 2013
Perc
ent
US$
mill
ion
Value (left scale) Share of GDP (right scale)
Sources: BNR; and World Bank staff calculations.
commodities by price and volume shows that the increase in mineral exports in 2013 was mainly due to coltan, whose export value increased by 136 percent (volume increased by 115 percent, and price increased by 10 percent) (Table 1.3).
Driven by the economic slowdown, import values contracted by 0.4 percent in 2013, down from the solid growth of 18.7 percent in 2012. The contraction was mostly attributable to the slowdown in imports of capital and intermediate
goods.15 As a result, the trade deficit narrowed by 9.5 percent to US$1,148 million in 2013.
Tourism remained the single biggest export earner in the balance of payments (see Annex Note 6). Whereas the net services and income account deteriorated from –US$159 million in 2012 to –US$237 million in 2013, gross tourism receipts increased to US$294 million in 2013 (3.9 percent of GDP). The value is higher than mineral exports (US$225 million). Nevertheless, tourism receipts as a share of GDP have been stagnant in the past three years (Figure 1.12).
FDi to Rwanda has been concentrated in the services sector and nontradables, limiting its benefits for foreign exchange earnings (Figure 1.13). FDI remains small relative to GDP (2 percent of GDP) and declined from US$166 million in 2012 to US$163 million in 2013. According to the BNR’s annual FDI survey, while the share of services in total FDI is dominant at80 percent, the share of manufacturing and mining, in addition to tourism, has been rising in recent years. This increase in the share of foreign exchange earners in FDI can have an impact in reducing Rwanda’s current account deficit and promoting import substitution.
Figure 1.11: Exports of Main Mineral Products
0
50
100
150
200
250
2004 2005 2006 2007 2008 2009 2010 2011 2012 2013
Mill
ion
U.S
. dol
lars
Wolfram Coltan Cassiterite
Sources: BNR; and World Bank staff calculations.
Table 1.3: Mineral Exports(Year-on-year percent change)
2011 2012 2013 2014 (Jan-Apr)
ValueOverall 123.4 −10.1 65.9 −18.6
Cassiterite 129.4 −45.4 15.5 23.4Coltan 108.8 47.5 136.5 −40.8Wolfram 125.7 63.9 14.4 −4.1
Price (US$/kg)Cassiterite 27.8 −18.1 9.4 −6.5Coltan 75.6 14.7 9.8 −30.5Wolfram 89.2 −5.8 −9.7 −9.9
Volume (ton)Cassiterite 79.4 −33.3 5.6 32.0Coltan 18.9 28.6 115.4 −14.9Wolfram 19.3 74.0 26.7 6.4
Sources: BNR; and World Bank staff calculations.
15 Imports of capital goods expanded by only 1.2 percent in 2013, down from 26.6 percent in 2012. Growth of imports of intermediate goods declined to 1.6 percent in 2013, down from 18.2 percent in 2012. Consistent with lower construction activity, cement imports grew by 11 percent in volume as compared with 32 percent in 2012.

Rwanda Economic Update | Edition No. 6 9
Part 1: Recent Economic Developments
b. International trade in the first six months of 2014
Export growth decelerated significantly in H1:2014. Having benefited from higher international commodity prices, especially for minerals, export values increased by 24.9 percent in 2012 and 18.7 percent in 2013. However, in the H1:2014, export growth rates (year-on-year) fell close to zero at 1.2 percent (Figure 1.14).The growth rate of mineral exports reversed from 66 percent in 2013 to −19 percent in H1: 2014 (Table 1.3). Of the three main minerals, the sharp decline in coltan exports by 41 percent contributed most to the growth rate reversal. although the mining sector registered superb growth and exports in
2013, its performance is intrinsically vulnerable to fluctuations in international commodity prices, which is evident in H1:2014. This sharp fall of exports growth reveals the vulnerability of Rwanda’s narrow export base to international commodity prices, which is one of the structural bottlenecks to be overcome in the medium term.
in contrast, imports have been recovering in H1:2014. The growth rate in the first six months reached 13.0 percent (year-on-year). The recovery is observed across major categories such as consumer goods (8.3 percent), capital goods (14.0 percent), and intermediate goods (26.6 percent) (Figure 1.15).
Although import value expanded by 13.0 percent, import volume increased only marginally, by 0.9 percent (year-on-year). Contraction is observed in intermediate goods (−1.3 percent) although growth of consumer goods (0.8 percent) and capital goods (17.1 percent) was positive. Given that imports of capital and intermediate goods are considered coincident and leading economic indicators, the conflicting developments in capital and intermediate goods imports are a mixed sign for the economy (see detailed discussion in Annex Note 5). The negative growth in intermediate goods imports was caused by delays in new construction activities, for instance, the Kigali Convention Center.
Figure 1.13: Sectoral Share in Foreign Direct investment(2008–12 average)
ICT 46.0%
Trade 9.6
Financial sector9.8%
Mining9.6%
Manufacturing,7.9%
Agriculture5.7%
Accommodation activities 4.2%
Construction, 0.7% Other 2.5%
Sources: BNR; and World Bank staff calculations.Note: ICT = information and communication technology.
Figure 1.14: Export growth Momentum Has Been Lost in the First Six Months of 2014
52
2519
1
-40
-20
0
20
40
60
80
100
120
140
2011 2012 2013 2014 (Jan-Jun)
Yea
r-on
-yea
r gr
owth
, per
cent
Coffee Tea Minerals Others Total
Sources: BNR; and World Bank staff calculations.
Figure 1.15: imports Have gained Momentum inthe First Six Months of 2014
2124
2
13
-10
0
10
20
30
40
50
60
2011 2012 2013 2014 (Jan-Jun)
Year
-on-
year
gro
wth
, per
cent
Consumer goods Capital goods Intermediate goodsEnergy and lubricants Total
Sources: BNR; and World Bank staff calculations.

Rwanda Economic Update | Edition No. 6 10
Part 1: Recent Economic Developments
1.1.3. Inflation, Monetary Policy, Exchange Rate Policy, and Financial Sector Development: Remaining Concerns About Credit growth
Inflation rates remained low as of June 2014. The low inflation rates are attributable to lower import prices, especially for energy and food products. Even though the Rwanda franc depreciated in H2:2013,
Rwanda’s import prices remained low thanks to lower global commodity prices. Although reserve money, the BNR’s monetary policy anchor, increased in H2:2013, the increase was mostly absorbed by commercial banks’ reserves and therefore had limited impact on the economy. Because of an underdeveloped monetary policy transmission mechanism, the revision in the policy rate in June 2013 failed to lower lending rates. The pronounced economic slowdown withered both credit demand from the private sector and banks’ lending appetite, resulting in a sharp drop of credit growth to the private sector in H2:2013 and the first quarter of 2014. The BNR cut its policy rate further in June 2014 to stimulate private sector credit growth.
a. Inflation
inflation rates continued to fall through H1:2014 as a result of lower imported food
and fuel prices (Figure 1.16).16 annual average headline inflation declined to 4.2 percent in 2013 from 6.3 percent in 2012, with a spike between July and October due to the poor harvest in season B.17 Import prices remained low in 2013, mainly reflecting moderate global food and energy prices that outweighed the sharp depreciation of the Rwanda franc in H2:2013 (right panel of Figure 1.16).18 Imported energy and food prices increased by 0.8 percent and 4 percent, respectively, in 2013. Core inflation, which excludes fresh food and energy, remained moderate throughout 2013
(4.0 percent in 2013, the same level as in 2012) reflecting weak domestic demand (left panel of Figure 1.16). Prices of locally produced food picked up between July and October 2013 as a result of the poor season B harvest (right panel of Figure 1.16). This pressure eased between October 2013 and January 2014 because sufficient rains in season A improved the harvest.
b. Exchange Rates
Depreciation of the Rwandan franc accelerated in H2:2013 (left panel of Figure 1.17). After moderate depreciation of 1.6 percent against the U.S. dollar in H1:2013, depreciation accelerated in H2:2013, to 4.1 percent, before stabilizing in the
Figure 1.16: Inflation Brought Down by Moderate import Prices
0
July-1
1Oct-
11Jan
-12
Apr-12
July-1
2Oct-
12Jan
-13
Apr-13
July-1
3Oct-
13Jan
-14
Apr-14
2
4
6
8
10
Perc
ent
Headline inflation Core inflation
-2
0
2
4
6
8
10
12
Perc
ent
Local goods inflation Imported goods inflation
July-1
1Oct-
11Jan
-12
Apr-12
July-1
2Oct-
12Jan
-13
Apr-13
July-1
3Oct-
13Jan
-14
Apr-14
Sources: BNR; and World Bank staff calculations.
17 Rwanda’s agriculture season A runs from September to February. Agriculture season B runs from February to June. 18 According to World Bank global commodity price data, between July and December 2013, energy prices increased by only 3
percent, while food prices declined by 10.4 percent.

Rwanda Economic Update | Edition No. 6 11
Part 1: Recent Economic Developments
first four months of 2014 (depreciation of only 1.5 percent between January and April 2014). Exchange pressures felt in H2:2013 could be attributable to higher-than-expected demand for foreign exchange. Despite the increased intervention by the BNR of 68 percent, to US$201.7 million in H2:2013, the pace of depreciation did not slow. The Rwandan franc also depreciated against regional currencies in H2:2013, and against all major trading partner currencies including regional currencies. Rwanda’s real effective exchange rate (REER), calculated as a trade-weighted average of bilateral exchange rates, continued to depreciate, which is attributable to Rwanda’s lower inflation as well as the nominal depreciation against the U.S. dollar (right panel of Figure 1.17).
c. monetary Policy and Interest Rates
Lending rates remained high and unchanged even after the revision of the policy rate in June 2013, revealing the ineffective transmission of the policy rate to the financial market (Figure 1.18). Increased demand for Treasury bills by commercial banks, reflecting their prudent lending to the private sector, led to a decline in the Treasury bill rate in H2:2013.19 Although deposit rates declined from 10.6 percent in June 2013 to 8.5 percent in December 2013, lending rates did not
decline, fluctuating around 17.5 percent between June 2013 and June 2014. The unresponsiveness of the lending rate has been attributed to the heavy reliance on cash in the economy, the small and concentrated banking sector, and an underdeveloped financial market. Following the unresponsive lending rate, BNR pursued a further reduction in the policy interest rate from 7 percent to 6.5 percent in June 2014 to sustain economic recovery. Although reserve money, the BNR’s monetary policy anchor, increased in H2:2013 by Rwf 10.7 billion, the increase was mostly absorbed by commercial banks’ reserves of Rwf 8.1 billion (see Annex Note 1 on monetary policy in Rwanda and Annex Note 2 on dynamics in the yield curve of short-term government securities).
Figure 1.17: Rwanda Franc Against U.S. Dollar and Real Effective Exchange Rate Depreciated in 2013
540Jan-12 Jul-12 Jan-13 Jan-14Jul-13
560
580
600
620
640
660
680
700
720R
wan
da fr
anc t
o U
.S. d
olla
r Depreciationof 4.5% in 2012
of 4.1% in H2:2013
Depreciationof 1.9%
in H1: 2014
Depreciationof 1.6%
in H1:2013
Depreciation of 5.8% in 2013
Period average
Daily rate
90
95
100
105
110
115
Dec-11
Mar-12
Jun-12
Sep-12
Dec-12
Mar-13
Jun-13
Sep-13
Dec-13
Mar-14
Jun-14
Rea
l and
nom
inal
eff
ectiv
e ex
chan
ge r
ates
Real effective exchange rate Nominal effective exchange rate
Source: World Bank staff calculations based on data from the BNR.
Figure 1.18: Lending Rate did not Respond to policy Rate Cut
0
2
4
6
8
10
12
14
16
18
20
Inte
rest
rate
, per
cent
Policy rate Deposit rate Lending rate Treasury bill rate
May-11
Aug-11
Feb-12
May-12
Aug-12
Nov-12
Feb-13
May-13
Aug-13
Nov-13
Feb-14
May-14
Nov-11
Sources: BNR; and World Bank staff calculations.
19 The share of commercial banks’ holdings in Treasury bill stock (outstanding) was 92.9 percent of the total in December 2013 compared with 70.5 percent in June 2013.

Rwanda Economic Update | Edition No. 6 12
Part 1: Recent Economic Developments
d. Banking sectorThe economic slowdown led to reductions in both private sector credit demand and banks’ appetite for lending. The result was a sharp deceleration in credit growth to the private sector in 2013 (Figure 1.19), constraining private investment and consumption. Credit growth to the private sector declined markedly from 34 percent in 2012 to 11 percent in 2013, followed by a slight increase to 11.7 percent in the first quarter of 2014. Between 2012 and 2013, newly authorized loans declined by 5.3 percent (from Rwf 499 billion to Rwf 473 billion). The subdued growth in credit to the private sector in H2:2013 can be attributed to prudent commercial banks’ lending behavior. This is reflected in the fall of the Treasury bill rate, the accumulation of nonperforming loans, and the increased rejection rate of borrowing applications.20 The lagged impact of the 2012 aid shortfall on the economy has been compounded through a vicious circle. The first-round economic slowdown in H1: 2013 led to a credit slowdown, which, in turn, coupled with structural bottlenecks, resulted in a further economic slowdown in H2:2013.
The slowdown in credit growth was observed across key sectors of the economy (Figure 1.20). In the services sector, credit growth to the commerce, business, and hotels subsector, the main driver of growth in services, declined from 51 percent in 2012 to 6 percent in 2013. The significant decline in credit underpins the deceleration in growth in services in 2013. Credit growth to subsectors in industry dropped as well in 2013—credit to the construction sector suffered a cutback of 17 percent and credit to the manufacturing subsector grew at only 19 percent in 2013, falling from 85 percent in 2012. Although the mining sector grew robustly in 2013, the sector received a negligible amount of credit, registering no growth in 2013. Credit to the agriculture sector continued to decline, dropping by 17 percent in 2013. Preliminary new loan numbers in the first six months of 2014 show that credit growth remains moderate. Although total credit grew by 47.8 percent (year-on-year), the growth is attributable to two big loans: one to the Rwanda Cement Factory of about Rwf 30 billion and the other to the Energy, Water and Sanitation Authority of Rwf 14.7 billion. Once these two big loans are excluded, total credit grew at 27.5 percent, compared with 66.0 percent and −12.4 percent in the first six months of 2012 and 2013, respectively.
Figure 1.20: Credit Decelerated Across All Sectors of the Economy
-100 -50 0 50 100 150
Water & energy
Financial services
Manufacturing
Commerce, business & hotels
Transport & warehousing
Community services
Construction
Agriculture
Annual growth, percent
2012 2013
Sources: BNR; and World Bank staff calculations.
Figure 1.19: Credit to the Private Sector has Remained Low, Although Liquidity Constraints have been Eased(Year-on-year growth rate)
0
5
10
15
20
25
30
35
40
Perc
ent
Growth rate of credit to the private sector
Deposit growth rate
Dec-11
Mar-12
Jun-12
Sep-12
Dec-12
Mar-13
Jun-13
Sep-13
Dec-13
Mar-14
Sources: BNR; and World Bank staff calculations.
20 The ratio of nonperforming loans rose marginally from 6 percent in December 2012 to 7 percent in December 2013. Similarly, in 2013, 5,940 loan applications were rejected representing 7.5 percent of total applications against 4,865 rejections recorded in 2012, equivalent to a rejection rate of 6.7 percent.

Rwanda Economic Update | Edition No. 6 13
Part 1: Recent Economic Developments
1.1.4. Fiscal Developments: growing Concerns About Capital Expenditures
The fiscal outturn in the first three quarters of FY2013/1421 shows that actual expenditures were 10 percentage points below projections. Although total revenue and grants were almost as projected,
tax revenues were 6.6 percent lower than the projection although improved from the previous fiscal year. Given that reducing the reliance on donor funding is the key objective for the government, the Medium-Term Expenditure Framework (MTEF) assumes fiscal consolidation through increased revenue mobilization and expenditure prioritization to reduce the fiscal gap. The FY2014/15 budget is consistent with the MTEF, being based on conservative assumptions about donor funding.
a. Revenue and Grants
aid inflows returned to pre–aid shortfall levels in the first three quarters of
FY2013/14. Total grants were projected to be Rwf 333 billion (equivalent to35 percent of projected revenue), but were 4 percent higher at Rwf 346 billion (Table 1.4). The higher-than-projected grants resulted from high capital grants. Capital grants were projected to be Rwf 184 billion (equivalent to 19 percent of the budget). Eventually, more than 110 percent of the projected amount was realized thanks to the frontloading of grants from the Global Fund to Fight AIDS, Tuberculosis, and Malaria. In contrast, actual disbursement of the budgetary grants was lower than projected because of disbursement delays by the European Union and Germany.
Although improved from the previous fiscal year, domestic revenue collection fell below projections by 1.6 percent, which is attributable to lower-than-projected tax revenue. Preliminary numbers from the Rwanda Revenue Authority (RRA) indicate that tax revenue for FY2013/14 was Rwf 759 billion against the target of Rwf 783 billion in the revised budget. Although a series of tax administration measures have been implemented
in the past few years, actual tax revenue was low as a result of the pronounced economic slowdown and delays in implementation of further tax administration measures (for example, the rollout of electronic billing machines22). In contrast, actual nontax revenue exceeded projections by 59 percent because of higher receipts from peacekeeping operations.
in the FY2014/15 budget, the government projects that it will mobilize more tax revenues (Table 1.5). While the ratio of domestic revenue to GDP remains unchanged between the FY2013/14 revised budget (17.1 percent) and the FY2014/15 budget (17.2 percent), tax revenue is projected to increase by 0.5 percentage point of GDP from 15.3 percent in the FY2013/14 revised budget to 15.8 percent in the FY2014/15 budget. The unchanged domestic revenue is attributable to a decline in nontax revenue, which bounces back from higher-than-projected reimbursements from the United Nations for peacekeeping operations in FY2013/14.Tax revenue is consistent with medium-term targets for progressively increasing domestic revenue collection and reducing aid dependence.23 To increase tax revenue, the RRA has been implementing numerous tax reforms.24
21 MINECOFIN has published budget execution reports in the first three quarters of FY2013/14 (http://www.minecofin.gov.rw/index.php?id=2).
22 http://www.rra.gov.rw/rra_article1035.html.23 Under the MTEF, the government aims to increase tax revenue, on average, 0.8 percentage point of GDP a year by broadening
the tax base and reducing exemptions; domestic revenue is projected to increase from 15.3 percent of GDP in FY2013/14 (Rwf 874 billion) to 15.8 percent in FY2014/15 (Rwf 986 billion) and 17.2 percent in FY2015/16 (Rwf 1,205 billion). Total grants are projected to increase to Rwf 545 billion in FY2014/15 from Rwf 463 billion, but to decline to Rwf 482 billion in FY 2015/16.
24 These reforms include an increase of excise duty on airtime from 8 percent to 10 percent, continued roll-out of electronic billing machines, taxpayers’ education, and investment in information technology facilities to ease the services to the taxpayers.

Rwanda Economic Update | Edition No. 6 14
Part 1: Recent Economic Developments
Despite the medium-term objective of reducing aid dependency, total grants are projected to increase from 9.1 percent of gDP (Rwf 463 billion) in the FY2013/14 budget to 9.5 percent (Rwf 545 billion) in the FY2014/15 budget. Budgetary grants are expected to increase by 1.8 percent from 3.9 percent of GDP (Rwf 201 billion) to 5.7 percent of GDP (Rwf 328 billion) in FY2014/15. The significant increase reflects a pledge by the Global Fund to Fight AIDS, Tuberculosis, and Malaria to the health sector. On the other hand, capital grants are expected to decline from 5.1 percent of GDP (Rwf 262 billion) in the FY2013/14 budget to 3.8 percent of GDP (Rwf 216 billion) in the FY2014/15 budget.
b. Expenditures and Net Lending
The resumed aid inflows and improved domestic revenue, however, have not led to accelerated execution of capital expenditure and net lending. In the first three quarters of FY2013/14, capital expenditures and net lending registered execution rates of 89 percent and 31 percent, respectively. The budget execution report by the Ministry of Finance and Economic Planning (MINECOFIN) attributes the low execution rate to delayed finalization of disbursement documents and delayed implementation, for instance, in the Energy, Water and Sanitation Authority’s hydro project (Nyabarongo power project). Net lending to the Kigali Convention Center (KCC), one
Table 1.4: Fiscal Outturn in the First Three quarters of FY2013/14(Billions of Rwandan francs, except as noted)
Jul–Dec 2013 Jan–Mar 2014 Jul 13–Mar 2014
Projection Actual Projection Actual Projection Actual gap (%)
Revenue and grants 677 702 287 266 964 968 0.4Total revenue 403 408 228 213 631 621 −1.6
Tax revenue 373 357 211 187 583 545 −6.6nontax revenue 30 51 18 26 48 76 59.1
Total grants 274 293 59 53 333 346 4.0Budgetary grants 143 136 6 0 149 136 −8.5Capital grants 131 157 53 53 184 210 14.3
Total expenditure and net lending 795 684 404 397 1,200 1,082 −9.8Current expenditure 364 362 181 194 545 555 1.8Wages and salaries 102 93 51 47 154 140 −9.1Purchases of goods and services 72 63 35 39 107 102 −4.1Interest payments 18 21 3 5 22 26 16.8Transfers 139 151 59 70 198 221 11.8Exceptional social expenditure 33 34 33 33 65 67 2.2
Capital expenditure 354 316 201 180 555 496 −10.7Domestic 121 114 93 78 214 193 −10.1Foreign 233 202 109 101 341 303 −11.1
Net lending 77 7 22 24 99 31 −69.0Change in arrears (− : net reduction) −7 −8 −10 34 −17 26 −249.3Overall deficit (cash basis)
Including grants −125 9 −128 −97 −253 −88 −65.2Excluding grants −400 −284 −186 −150 −586 −435 −25.8Financing 125 −9 128 97 253 88 −65.2Foreign financing (net) 55 25 43 43 98 68 −30.5Domestic financing 71 −34 84 54 155 20 −87.1
Sources: MINECOFIN; and World Bank staff calculations.

Rwanda Economic Update | Edition No. 6 15
Part 1: Recent Economic Developments
of the largest government investment projects, was significantly lower than initial projections because of delays in construction; the government was estimated to spend Rwf 68 billion, but as of December 2013 had actually spent only Rwf 16 billion. MINECOFIN expects further delays in implementation of the KCC in the second half of FY2013/14. These delays can be attributed to capacity constraints on executing capital expenditures by ministries with large budgets (see Annex Note 3 on low capital expenditure disbursement rates in FY2013/14). Although the government ensured full execution of spending for interest payments and social expenditures, neither spending for wages and salaries nor purchases of goods and services were fully executed. This lower expenditure was mainly caused by delays in new recruitment of staff, and delays in processing payment documents for goods and services and teachers’ salaries by various ministries, agencies, and districts.
in the FY2014/15 budget, total expenditures as a share of GDP are projected to fall, reflecting the medium-term fiscal consolidation. Total expenditures and net lending are projected to decline from 31.3 percent of GDP (Rwf 1,599 billion) in the FY2013/14 to 30.5 percent (Rwf 1,753 billion). The decline is observed in both recurrent expenditures and capital expenditures by 1.0 percentage point and 1.1 percentage points of GDP, respectively. Although recurrent expenditures are projected to decline, purchases of goods and services related to social protection increases by 0.4 percentage point of GDP because of expenditure prioritization. Similarly, capital expenditures shift toward strategic investments to boost economic growth, aligning with EDPRS 2 priorities. A large fraction of capital expenditure
will go to infrastructure projects, especially energy and roads. Net lending is expected to increase from Rwf 88 billion in FY2013/14 to Rwf 105 billion in FY2014/15 as the ongoing KCC project moves toward completion. Under the MTEF, Rwanda plans to reduce the share of expenditure to GDP to 26.6 percent in FY2016/17, while prioritizing expenditure toward strategic investments to achieve the EDPRS 2 objectives and social protection projects.
c. Overall Balance and financing
The overall fiscal deficit in the first three quarters of FY2013/14 was much lower than expected (Table 1.4). Despite budgetary grants that were 10 percent lower than projected, the overall fiscal deficit was only Rwf 88 billion (−2.3 percent of GDP in the first three quarters) rather than the projected Rwf 253 billion (−6.5 percent of GDP). The low deficit was caused primarily by the delayed disbursement of capital expenditures and significantly low net lending to government investment projects. The fiscal deficit was mostly financed by external borrowing.
in the FY2014/15 budget, a combination of slightly higher domestic revenue and lower expenditure will contribute to shrinking the overall deficit from 5.3 percent of GDP to 4.0 percent. External borrowing is projected to finance Rwf 137 billion (2.4 percent of GDP) and domestic borrowing is expected to cover the remainder (Rwf 96 billion, 1.7 percent of GDP). The majority of domestic borrowing relies on drawing against the unused Eurobond, resulting in an increase in new borrowing to Rwf 16 billion, which will be financed by the use of the overdraft at BNR or sales of Treasury bills in the financial markets.

Rwanda Economic Update | Edition No. 6 16
Part 1: Recent Economic Developments
Table 1.5: FY2013/14 and FY2014/15 budgetsFY2013/14 FY2014/15
initial budget Revised budget MiNECOFiN projection initial budget
Billion Rwf
% of gDP
Billion Rwf
% of gDP
Billion Rwf
% of gDP
Billion Rwf
% of gDP
Revenue and grants 1,314.1 24.4 1,336.7 26.1 1,336.8 26.1 1,530.8 26.6Total revenue 843.5 15.6 873.7 17.1 873.8 17.1 986.0 17.2Tax revenue 775.4 14.4 782.4 15.3 782.5 15.3 906.8 15.8nontax revenue 68.0 1.3 91.3 1.8 91.3 1.8 79.3 1.4Total grants 470.6 8.7 463.0 9.1 463.0 9.1 544.8 9.5Budgetary grants 170.6 3.2 201.2 3.9 201.2 3.9 328.4 5.7Capital grants 300.0 5.6 261.8 5.1 261.8 5.1 216.4 3.8
Total expenditure and net lending 1,653.4 30.7 1,677.7 32.8 1,598.8 31.3 1,753.3 30.5Current expenditure 850.7 15.8 798.1 15.6 760.9 14.9 855.2 14.9Wages and salaries 181.7 3.4 195.2 3.8 195.2 3.8 207.0 3.6Purchases of goods and services 319.2 5.9 130.1 2.5 130.1 2.5 164.7 2.9Interest payments 40.4 0.7 37.5 0.7 37.5 0.7 41.4 0.7Transfers 268.4 5.0 273.7 5.4 273.7 5.4 317.5 5.5Exceptional social expenditure 72.4 1.3 124.4 2.4 124.4 2.4 83.4 1.5
Capital expenditure 802.7 14.9 750.1 14.7 750.1 14.7 783.4 13.6Domestic 314.8 5.8 365.2 7.1 365.2 7.1 444.2 7.7Foreign 487.9 9.1 384.9 7.5 384.9 7.5 339.2 5.9
Net lending 114.8 2.1 120.3 2.4 87.8 1.7 104.7 1.8Change in arrears (− : net reduction) -9.2 -0.2 -9.2 -0.2 -9.2 -0.2 -10.0 -0.2Overall deficit (cash basis) Including grants -348.5 -6.5 -350.2 -6.9 -271.2 -5.3 -232.5 -4.0 Excluding grants -819.1 -15.2 -813.2 -15.9 -734.2 -14.4 -777.3 -13.5Financing 348.5 6.5 350.2 6.9 271.2 5.3 232.5 4.0Foreign financing (net) 197.0 3.7 164.9 3.2 109.9 2.2 136.9 2.4Domestic financing 151.5 2.8 185.3 3.6 161.3 3.2 95.6 1.7
Sources: MINECOFIN; and World Bank staff calculations.
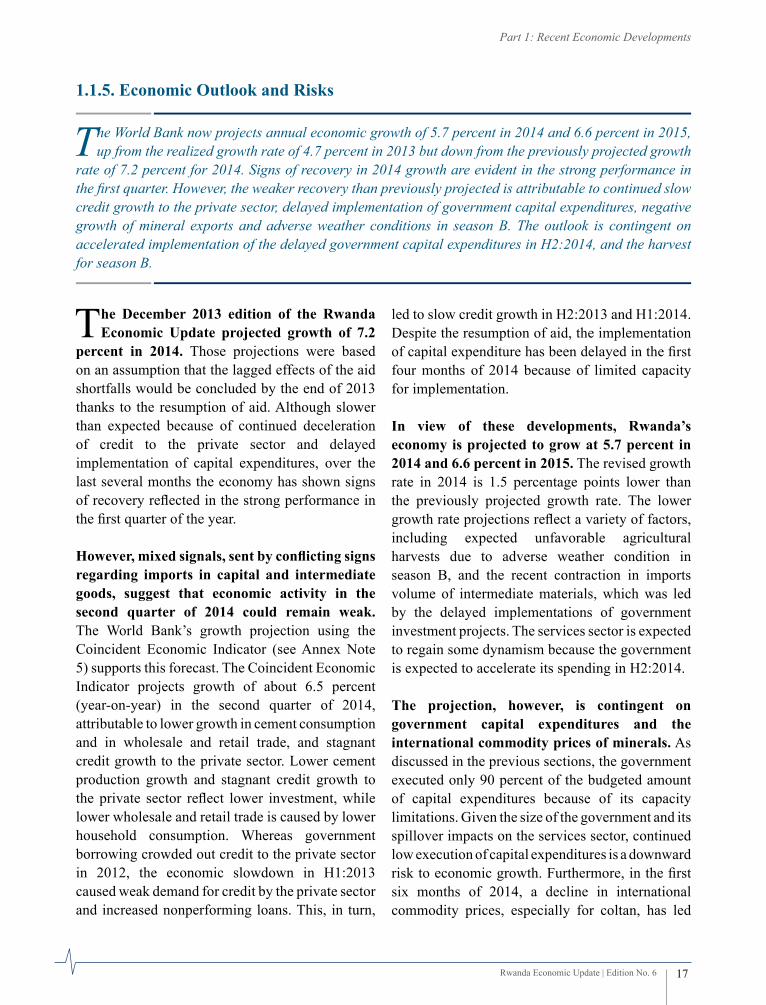
Rwanda Economic Update | Edition No. 6 17
Part 1: Recent Economic Developments
1.1.5. Economic Outlook and Risks
The World Bank now projects annual economic growth of 5.7 percent in 2014 and 6.6 percent in 2015, up from the realized growth rate of 4.7 percent in 2013 but down from the previously projected growth
rate of 7.2 percent for 2014. Signs of recovery in 2014 growth are evident in the strong performance in the first quarter. However, the weaker recovery than previously projected is attributable to continued slow credit growth to the private sector, delayed implementation of government capital expenditures, negative growth of mineral exports and adverse weather conditions in season B. The outlook is contingent on accelerated implementation of the delayed government capital expenditures in H2:2014, and the harvest for season B.
The December 2013 edition of the Rwanda Economic Update projected growth of 7.2
percent in 2014. Those projections were based on an assumption that the lagged effects of the aid shortfalls would be concluded by the end of 2013 thanks to the resumption of aid. Although slower than expected because of continued deceleration of credit to the private sector and delayed implementation of capital expenditures, over the last several months the economy has shown signs of recovery reflected in the strong performance in the first quarter of the year.
However, mixed signals, sent by conflicting signs regarding imports in capital and intermediate goods, suggest that economic activity in the second quarter of 2014 could remain weak. The World Bank’s growth projection using the Coincident Economic Indicator (see Annex Note 5) supports this forecast. The Coincident Economic Indicator projects growth of about 6.5 percent (year-on-year) in the second quarter of 2014, attributable to lower growth in cement consumption and in wholesale and retail trade, and stagnant credit growth to the private sector. Lower cement production growth and stagnant credit growth to the private sector reflect lower investment, while lower wholesale and retail trade is caused by lower household consumption. Whereas government borrowing crowded out credit to the private sector in 2012, the economic slowdown in H1:2013 caused weak demand for credit by the private sector and increased nonperforming loans. This, in turn,
led to slow credit growth in H2:2013 and H1:2014. Despite the resumption of aid, the implementation of capital expenditure has been delayed in the first four months of 2014 because of limited capacity for implementation.
in view of these developments, Rwanda’s economy is projected to grow at 5.7 percent in 2014 and 6.6 percent in 2015. The revised growth rate in 2014 is 1.5 percentage points lower than the previously projected growth rate. The lower growth rate projections reflect a variety of factors, including expected unfavorable agricultural harvests due to adverse weather condition in season B, and the recent contraction in imports volume of intermediate materials, which was led by the delayed implementations of government investment projects. The services sector is expected to regain some dynamism because the government is expected to accelerate its spending in H2:2014. The projection, however, is contingent on government capital expenditures and the international commodity prices of minerals. as discussed in the previous sections, the government executed only 90 percent of the budgeted amount of capital expenditures because of its capacity limitations. Given the size of the government and its spillover impacts on the services sector, continued low execution of capital expenditures is a downward risk to economic growth. Furthermore, in the first six months of 2014, a decline in international commodity prices, especially for coltan, has led

to a significant deceleration in mineral exports, a contraction of overall exports, and deterioration of net exports. A further decline in international commodity prices would put downward pressure on growth prospects.
in contrast, in April 2014, the government projects gDP growth rates to be 6.0 percent in 2014 and 6.7 percent in 2015. The projection relies on an assumption that aggressive reforms will be implemented to address the vulnerability of agriculture production, to accelerate both private and public investment projects, and to promote growth in the services sector. all sectors are expected to grow strongly in 2014. Even though adverse weather conditions were observed in H1:2014, strong performance in agriculture is projected, with growth of 5 percent, compared with 3 percent in 2013. The services sector is expected to grow at 7 percent, based on an assumption that government consumption and credit growth to the private sector will increase. Growth in the industry sector is projected to decelerate, reflecting slower construction activity. The main difference in projections by the government and the World Bank is attributable to the agriculture sector. The government projects stronger growth in the agriculture sector, while the World Bank forecasts
weaker growth, reflecting adverse weather condition in season B. Both the government and the World Bank project lower growth in the mining sector. The sector’s superb performance in 2013 was fueled by favorable international commodity prices. Mining production in 2014 is expected to grow moderately because of a drop in commodity prices in 2014.
The inflation outlook is negative because of insufficient rainfall in season B. Although food prices have been low, they are expected to spike in H2:2014 as a result of food shortages similar to those observed in October 2013. Faster depreciation of the exchange rate and an increase in domestic fuel prices are upside risks to the inflation outlook. The weakening of the Rwanda franc is expected to increase import prices, which account for 20.5 percent of the household consumption basket. It is important to monitor inflation trends especially as the recovery in domestic demand strengthens.
The government’s fiscal policy buffers are being rebuilt thanks to the aid resumption, enabling proactive macroeconomic management. The improved macroeconomic environment is reflected in the recent upgrade in Fitch’s Issuer Default Ratings. From the standpoint of short-term fiscal
Table 1.6: Rwanda’s gDP growth is Expected to Slow Further in 2014 Before Accelerating in 2015(Annual percent change)
itemActual World Bank
ProjectionMiNECOFiN
Projection2011 2012 2013 2014 2015 2014 2015
GDP 7.9 8.8 4.7 5.7 6.6 6.0 6.7Agriculture 4.7 6.4 3.3 3.4 4.1 5.0 5.0
Food crops 5.0 7.1 3.6 3.5 3.5 4.0 5.0Export crops 2.6 9.0 -4.7 0.1 12.0 12.0 13.0
industry 17.6 8.5 9.3 5.1 8.9 6.0 9.0Mining and quarrying 51.0 -8.1 20.6 3.7 5.0 4.0 5.0Manufacturing 7.9 5.9 4.6 6.2 6.4 4.0 5.0Construction 23.6 14.7 10.8 8.6 11.3 6.0 12.0
Services 8.0 11.6 5.3 7.6 8.0 7.0 7.0Public expenditure-led services 14.4 14.5 6.3 8.5 7.8 7.5 4.7Other services 4.9 10.9 5.3 7.4 8.1 7.0 7.6
Sources: NISR; and World Bank staff calculations.
Rwanda Economic Update | Edition No. 6 18
Part 1: Recent Economic Developments

policy, given the improved fiscal space and ongoing capacity constraints for budget execution at certain ministries, the authorities might consider accelerating implementation of delayed investment projects where capacity constraints do not exist, and resuming recruitment of public servants. At the same time, given the highly sticky lending
rate and banks’ excessive reserves at BNR, the monetary authority needs to consider alleviating the limited transmission of monetary policy and to directly affect credit growth to the private sector by promoting competition in the banking sector and developing the money market to expand the scope of open market operations.
1.2. The Drivers of and Constraints to Aggregate growth
In addition to recent economic developments, the previous section discussed the aid shortfall and the subsequent economic slowdown that revealed Rwanda’s structural bottlenecks and vulnerabilities.
High reliance on aid leaves the economy highly vulnerable to fluctuation in aid inflows. The private sector is small and largely reliant on government demand. Rain-fed agriculture makes harvests vulnerable to adverse weather conditions. The narrow exports base is vulnerable to fluctuations in international commodity prices, which intrinsically results in volatile exports growth. The country’s relatively weak infrastructure base and the low skill base of the workforce restrict private investment. This section discusses the medium-term policy priorities to overcome these structural bottlenecks.
Rwanda’s economy grew at more than 7 percent per year between 2001 and 2013,
mostly driven by domestic demand supported by aid-financed public expenditures. Despite high growth, the economic structure did not change significantly. The public sector plays a critical role (accounting for more than half of total investment, for example), the nontradables sectors are dominant, and private investment is limited, fluctuating around 10 percent of GDP.
The aid shortfall and the resulting economic slowdown revealed structural bottlenecks. Because ofthe high reliance on aid and the dominance of the public sector in the economy, the narrower fiscal space created by the aid shortfall had not only the direct effect of slowing down government expenditures but also a significant indirect effect on private sector economic activity. The services and construction sectors were especially affected, through reduced public sector demand and crowding-out of credit to the
private sector. The poor harvest in 2013 further subdued growth performance, unveiling the vulnerability of Rwanda’s rain-fed agriculture to adverse weather conditions. Although the mining sector registered impressive growth and exports in 2013, its performance is intrinsically vulnerable to fluctuations in international commodity prices, which is evident in the sharp drop in export growth in H1:2014.
given a possible decline in the share of aid in the economy in coming years, the role of public expenditures is expected to shift from driving growth to catalyzing it. Maintaining high growth will require a shift from an aid-dependent, public-sector-led development process to growth driven by the private sector. Such a structural transformation will depend on addressing constraints to private investment and on continuing to make effective and efficient use of public resources through enhanced public financial management (PFM). In particular, it would be important to mobilize
Rwanda Economic Update | Edition No. 6 19
Part 1: Recent Economic Developments

Rwanda Economic Update | Edition No. 6 20
Part 1: Recent Economic Developments
additional domestic resources to create fiscal space and to further prioritize expenditures including through improved public investment management. Furthermore, for growth to be accompanied by even faster poverty reduction, further progress in policy reforms will be key in a number of areas. These include the accountable governance pillar of the Government’s medium term plan, encompassing not only enhanced PFM but also more effective decentralization, so as to ensure greater equality in public services delivery. Moreover, continued growth in agricultural productivity and an extensive and effective social protection system will sustain or even accelerate the rate of poverty reduction by supporting the incomes of the poorest and most vulnerable.
Some of the key constraints to private sector development driven and inclusive growth that have been identified in Rwanda include the following.
• Small financial sector. Access to and the cost of borrowing is an important constraint to a climate conducive to business (Private Sector Federation Rwanda 2013). Rwanda’s financial sector is small; for example, the number of borrowers from commercial banks is much lower than in other East african Community countries. In 2011, 8.8 out of 1,000 adults borrowed from a commercial bank in Rwanda while 83.1, 35.4, and 18.3 out of 1,000 adults borrowed in Kenya, Tanzania, and Uganda, respectively. The cost of borrowing money has recently remained high and unchanged to the change in monetary policy stance, revealing the ineffective transmission of the policy rate to the financial market. The unresponsiveness of the lending rate has been attributed to the heavy reliance on cash in the economy, the small and concentrated banking sector, and an underdeveloped financial market (see Annex Note 1 for detailed discussion).
• Productivity gains in the nonagricultural sector. Despite its superb performance as demonstrated in the World Bank’s Doing Business indicators, the private nonfarm sector shows evidence of various bottlenecks to productivity growth and investment. Business surveys point to numerous layers of bureaucracy in the public sector and weak coordination between public institutions, which particularly affects foreign investors’ decisions to invest in Rwanda. Two areas of the business environment that particularly stand out are land acquisition and tax payments. Investors report long delays caused by the public sector in acquiring land. In addition, the transparency of the tax system seems to be weak, with numerous taxes and payments required by both the central and district governments.
• Weak infrastructure, particularly electricity. Firms in Rwanda pay the highest electricity costs in the region at US$0.24 per kilowatt-hour (kWh) compared with US$0.15 per kWh in Kenya and US$0.17 per kWh in Uganda; businesses experience, on average, 10 power outages per month. The availability and cost of electricity is ranked as the third most serious problem facing Rwanda (Private Sector Federation Rwanda 2013). And because Rwanda is a landlocked country, the limited transport infrastructure makes transport of goods very expensive; it is more expensive to bring goods from Dar es Salaam to Kigali than from Europe to Dar es Salaam. The lack of adequate electricity supply and insufficient transport routes are major barriers to investment in manufacturing capacity, and prevent the export base from expanding, thereby constraining growth and job creation. The need for significant enterprise development is particularly important given the rapidly increasing labor force: an estimated 200,000 people will join the labor force each year during the EDPRS 2 period, which is almost double the past rate of job creation. A vibrant private sector will be needed to absorb this burgeoning labor force.

Rwanda Economic Update | Edition No. 6 21
Part 1: Recent Economic Developments
• Low human capital and qualified workers. The skills of the current labor force need to be improved to allow workers to increase their productivity and facilitate the move from subsistence agriculture toward a higher-value, market-oriented mode of production or into higher-productivity, nonfarm occupations. The services sector has been expanding faster than education enrollment, and skills have become a binding constraint to growth also in that sector. Business surveys show that firms are finding it increasingly difficult to hire workers with the right skills and often hire foreign skilled labor. At the same time, the share of the working-age population is increasing; but taking advantage of this “demographic dividend” will require efforts to expand the skills of the labor force, particularly among new labor market entrants and youth. Enhancing human capital requires improving the quantity (enrollment) and quality of education, but also improving health services given that labor productivity is directly tied to health outcomes.
The median level of education of the labor force amounts to the fourth grade of primary school, and more than 16 percent of the labor force has never been to school. The situation is, however, improving for the younger generations: net enrollment in primary school stands at 92 percent while gross enrollment in secondary school more than doubled in only five years (41 percent in 2011 up from 20 percent in 2006). Despite these positive changes, the Rwandan labor force is projected to remain relatively low skilled for the foreseeable future. The types of efforts that would be needed in this area include the provision of basic skills training for farm workers in functional and financial literacy, specialized agricultural skills, and targeted vocational training to build basic skills for employment in labor-intensive subsectors (construction, transport, light manufacturing).
• Productivity gains in the agricultural sector. Smallholder farms and reliance on rain-fed production characterize agriculture in Rwanda, which accounts for one-third of GDP and 70 percent of employment. Small farms face challenges accessing input and output markets owing to weak rural infrastructure and low use of irrigation and fertilizer as well as limited market information. Some 79 percent of Rwanda’s land is classified as agricultural; 11 percent of total land is permanent cropland, of which only 0.6 percent is irrigated. Reliance on rain-fed production and vulnerability to weather conditions make it urgent that structural reforms be undertaken to increase and stabilize agricultural production in the medium term. Various policy actions, including legislative reform, investment in rural infrastructure (feeder roads, markets, and post-harvest storage facilities), education of specialized agricultural skills and land administration reform, could raise productivity in the sector and agricultural incomes and, hence, result in sustained rapid poverty reduction. Furthermore, while improvements in agriculture and rural infrastructure will go a long way toward increasing the incomes of the poor, they are unlikely to reach the most destitute households. The poorest households are often landless or have landholdings that are grossly insufficient to provide for even their most basic food needs, which means that improvements in agriculture will largely bypass them. These households either need direct support to their incomes or the opportunity to participate in wage employment in public infrastructure projects. The government’s flagship social protection program (Vision 2020 Umurenge Program) currently covers half of the country’s 416 sectors (sub-districts), and a targeted and evidence-based scale-up could result in more poverty reduction and continued pro-poor growth.

Rwanda Economic Update | Edition No. 6 22
Part 1: Recent Economic Developments
While removing the obstacles to private sector development is imperative, there is also scope for stimulating the economy by improving the effective and efficient use of public resources. Fast-growing, non-resource-rich countries typically have sustained investment rates of 25 percent of GDP or higher, and the bulk of it comes from the private sector. In contrast, more than half of Rwanda’s investment (at 24 percent of GDP) is from the public sector and is financed by aid. Aid accounts for 30–40 percent of the budget while the tax-to-GDP ratio remains at 14 percent of GDP (much lower than Sub-Saharan Africa’s average of 18 percent). Because aid as a share of GDP is likely to decline in the medium term, it is essential to accelerate domestic resource mobilization.
• Improving Pfm. Mobilizing domestic resources through tax policy and administration reforms will secure fiscal space for public expenditures in general and public investment in particular. Building on the progress to date, domestic
resource mobilization should be accompanied by improvements in other aspects of PFM, such as a tighter link between planning and budget and improved public investment management. Furthermore, given the disparity of access to public services across districts, public expenditures should be allocated so that they increase access equity. Indeed, despite strong improvements, large inequality in services delivery across districts remains. Access to basic health facilities (health centers), for example, varies from 32 percent of the population in certain districts to almost 100 percent in other districts. Decentralization reform, if done well, can provide a stronger match between services delivered at local levels and services actually needed, and hence benefit local populations. It should be supported by improvements in PFM, both at the national and subnational levels, to optimize allocation of scarce resources to identified priority areas.
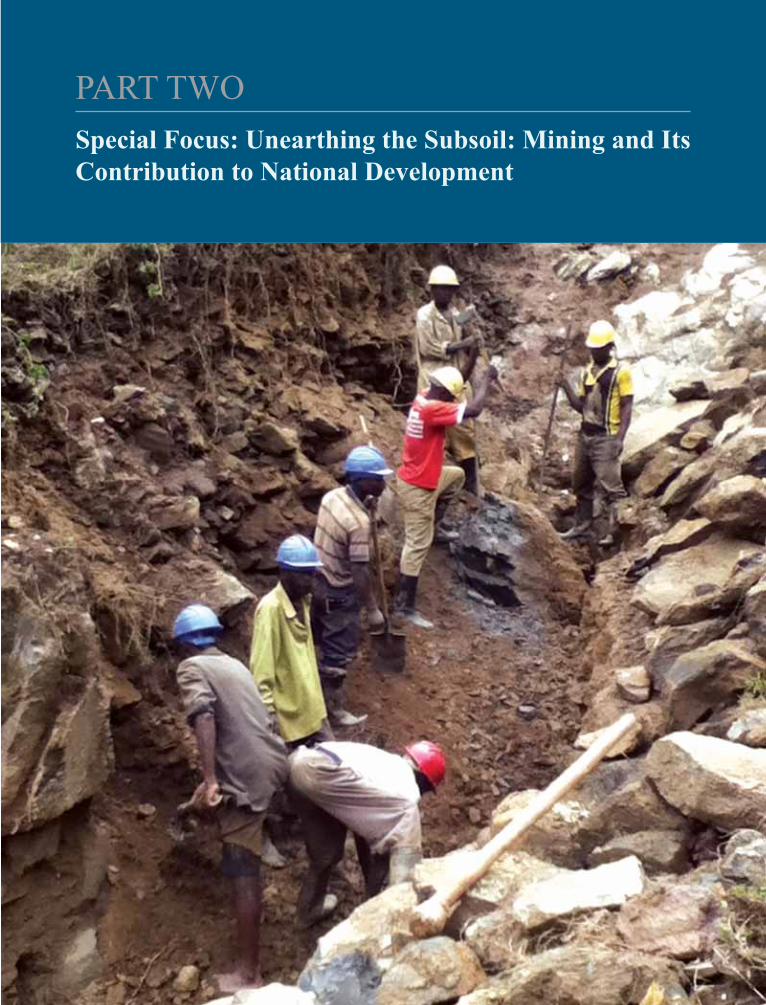
Special Focus: Unearthing the Subsoil: Mining and its Contribution to National Development
PART TWO

Rwanda Economic Update | Edition No. 6 24
Part 2: Special Focus
Rwanda has high hopes for its mining sector’s contribution to national development.
Expressed in its Economic Development and Poverty Reduction Strategy (EDPRS 2) and Mining Sub-Sector Strategy 2013/2014–2017/2018, the government recognizes mining’s potential to contribute to jobs, exports, and foreign direct investment (FDI). The government’s poverty reduction target, from 45 percent to 30 percent by 2017, will require expansion of “off-farm” jobs through income diversification.25 Mining provides such an opportunity, with 33,638 miners26 registered as of early 2014, representing slightly more than half of the Ministry of Natural Resources’ (MINIRENA’s) 2017 target of 60,000. In fact, the latest job figures in mining place the sector above the services and tourism sectors, according to data from the third round of the Integrated Household Living Conditions Survey (EICV 3). The government further intends to increase the sector’s professional educated skills base from fewer than 50 skilled, tertiary educated persons in mining to 600 persons. A range of university and polytechnic programs are in development, including at the Kigali Institute for Technology, which will make further contributions toward poverty reduction. Already, 40 persons within the ministry are currently benefiting from various tertiary training programs, mainly abroad.
The production capacity of Rwanda’s mining sector has progressively increased, yet its contribution to national accounts is small, and remains vulnerable to fluctuating mineral prices. impressive mineral export earnings in the past few years, mainly driven by increased international prices for the country’s key minerals, have strengthened the case for this sector’s development.
In 2013, for instance, the value of mining exports reached US$225 million, positioning it more than half way to reaching its 2017 target of US$400 million (EDPRS 2; MINIRENA 2013). However, the increase in the value of exports, which is reliant on higher mineral prices, has masked the structural inefficiencies of the country’s production model, dependent principally on small production sites, high manual labor, and rudimentary technology. The small-scale mining sector, which at present delivers considerable employment and income distribution in the rural areas, needs to be capitalized alongside further development of a few larger projects capable of creating additional skilled jobs. The government concurs, stating that its mining sector is performing suboptimally: “Our industry is producing at 20 percent of full potential; with increased operations and proper management, the sector has the ability to increase production five times” (Esiara 2013, 16). Improved mineral recovery and increased geological works have become among the government’s priority policy topics to help realize greater mineral production potential.
Beyond export earnings and employment, the government intends to increase against the 2012 baseline the contribution made by mining to gDP (from 1.6 percent to 5.3 percent), FDi (from US$150 million to US$500 million), and tax revenues to US$30 million by FY2017/18. Despite mineral exports having shown impressive growth of 66 percent in 2013, its overall contribution to GDP remains insignificant and volatile. According to the National Bank of Rwanda (BNR), FDI inflows in 2012 of US$73 million were mainly concentrated in the mining sector. Promising commitments made by new investors in the sector may draw in further FDI should these projects materialize.
25 Diversification is relevant, given that, particularly in rural areas, more than 78 percent of the rural population still relies on farming (EICV 3).
26 Figure provided by Rwanda Ministry of Natural Resources (MINIRENA). This figure excludes another 14,100 persons working in quarries. In email correspondence dated May 19, 2014, the ITRI Ltd. put the figure at 32,115 for the three principal minerals—cassiterite, columbite-tantalite, and wolfram.
2.1. Why Mining Matters for Rwanda’s National Development

Rwanda Economic Update | Edition No. 6 25
Part 2: Special Focus
Yet mining can contribute to national development through other impacts felt at both the national and subnational levels. Rwanda could benefit from further subnational impacts should it institutionalize policies regarding company commitments to local content development, skills training, and infrastructure development. These concepts are reflected in the newly revised Mining and Quarries Law of 2008, to be enshrined in a Model Mine Agreement with larger companies, which provides a legal basis for translating subnational development opportunities into concrete policy and practice. Spin-offs in many mineral-rich countries are witnessed in infrastructure and subsidiary business development and fiscal contributions made to local or regional government development plans (McMahon and Moreira 2014). Social development investments, commonly referred to as corporate social responsibility, may contribute further to development in domains such as education, water, health, and sanitation services (McMahon and Moreira 2014). For these reasons, mining matters for national development: it acts as an engine for growth, and if properly harnessed, serves as a catalyst for subnational employment and as a partner in meeting socioeconomic and human development goals.
Rwanda has a relatively well organized yet under-capitalized artisanal and small-scale mining (ASM) sector with potential for better economic and social performance. ASM is a form of rural livelihood diversification according to mounting evidence from several Sub-Saharan African countries (Kamete 2008; Hilson 2010; Maconachie and Binns 2007; Banchirigah 2008; and Perks 2011. Rwanda too has witnessed rising
participation in this subsector, driven in part by the continued high level of youth unemployment and de-agrarianization occurring in the rural areas, providing further grounds for mining’s continued development as an “off-farm” job, as cited above.27 The advantage in Rwanda is ASM’s relatively high level of organization, including a professional federative apex for mining cooperatives. Yet the sector suffers much the same as in other countries from the lack of significant technological development, in part hindered by lack of financing and access to modern mining techniques for ASM. As a result, undercapitalization of small-scale mining assets is commonplace in Rwanda (Veiga and Shefa 2009).The country could learn further from other countries that have surmounted undercapitalization through local banking loan programs, technology exchanges and government subsidies, some of which have been supported by the World Bank.28
Unlike the mining sectors in most of Sub-Saharan Africa, Rwanda is affected by geopolitical issues in the great Lakes region, with implications for its domestic mining policy and practice. The Dodd-Frank Wall Street Reform and Consumer Protection Act requirements on so-called conflict minerals sourced from the Democratic Republic of Congo (DRC) and its adjoining countries has ushered in a series of mineral export regulatory requirements with additional costs to Rwanda’s mining industry (see Box 2.1).29 Though still too early to tell whether the requirements will dissuade potential investors from pursuing new mining projects in Rwanda, it is certain that the additional Geology and Mining Department (GMD) personnel required to supervise the country’s mineral traceability systems, the
27 De-agrarianization refers to the movement out of smallholder farming into other rural sectors such as trade, mining, and small business development, driven by the declining terms of trade for smallholder farmers.
28 Examples include the Democratic Republic of Congo, Ghana, Madagascar, Sierra Leone, Tanzania, and Zimbabwe.29 Unlike the Kimberly Process, which is a single initiative and system governing diamonds, the efforts to address conflict minerals
in the Great Lakes region of central Africa loosely tie together a number of parallel and at times complementary initiatives, including due diligence guidelines developed by the Organisation for Economic Co-operation and Development (OECD), the tagging system developed by the International Tin Research Institute (ITRI), and the “International Protocol on the Illegal Exploitation of Natural Resources”of the International Conference on the Great Lakes Region (ICGLR), which sets regional standards and harmonizes national legislation.

Rwanda Economic Update | Edition No. 6 26
Part 2: Special Focus
Tin Supply Chain Initiative (iTSCi), and the levy required by the International Tin Research Institute (ITRI) to implement the system impose further costs to mining operations in Rwanda. However, the alternative—noncompliance and therefore a veritable ban on the country’s exports—would have far more disastrous consequences for development through employment and fiscal losses. From this perspective, Rwanda’s continued leadership in meeting these new international requirements has a resoundingly positive impact on the country’s development, and deserves recognition.
Last, maximizing potential socioeconomic benefits from mining in Rwanda depends on continued efforts to ensure institutional stability and overall good sector management. a “growth with governance” approach to enhancing the contribution of mineral development to national development is reflected in institutional frameworks, with the World Bank’s Extractive Industries Value Chain (Alba 2009) (Figure 2.1) or the Extractive Industries’ Transparency Initiative (EITI) Standard (EITI 2013) serving as leading examples. First is the need for a legal and regulatory framework that outlines the principles and processes for accessing, developing, and trading minerals, and that also outlines the various roles and responsibilities of agencies meant to govern the sector. The national framework starts with a mining policy, supported by a national mining code or law, and accompanying regulations. Second, transparent and equal access to mineral endowments, and a clear and consistent process for managing mineral licensing and maintaining
stability in agreements with companies, are needed. A first-come, first-serve basis is the most common approach to ensuring transparency in access to mineral endowments, supported through a cadastre system, and has proven to be effective in maintaining responsible and robust investment, provided that the government is vigilant in ensuring that the ground is worked and not simply held for speculative purposes (Girones, Pugachevsky, and Walser 2009). The third requirement is the capacity of government institutions to effectively collect and manage mineral revenues. Fourth is enhancement of downstream linkages or local business development through policies and practices of local sourcing and beneficiation, and support of sound environmental and social management practices in the sector. Governance thus matters to ensuring mining’s contribution to national development (Weber-Fahr 2002; McMahon and Moreira 2014).
Popular media use a variety of mineral names when discussing the common minerals mined in the Great Lakes region. Below is an overview:
Cassiteriteis a tin oxide mineral (SnO2). Tin is commonly used in solders, tin plating, electrical conductors, and other applications in the electronics industry.
Coltan. Two ore groups, columbite and tantalite, share similar features and are often grouped together into one mineral series and referred to as coltan (Ta). Tantalum is used in fabricating capacitors for electric products.
Wolframiteis an iron manganese tungstate mineral from which tungsten (W) is derived. Tungsten and its alloys are important electrical conductors. Wolframite is often associated with cassiterite.
Box 2.1 What is in a Name? “Conflict Minerals” in the great Lakes Region
Figure 2.1: World Bank’s Extractive industries Value Chain
Non-renewableresources
SustainabledevelopmentEITI
Award of contracts and licenses
Regulationand monitoringof operations
Collectionof taxes androyalities
Revenuedistributionandmanagement
Implementation ofsustainabiledevelopment policiesand projects
1 2 3 4 5
Source: Alba 2009.Note: EITI = Extractive Industries Transparency Initiative.

Rwanda Economic Update | Edition No. 6 27
Part 2: Special Focus
Mining operations in Rwanda are small as measured by investment. By global
standards, Rwanda has no operations that would be considered either medium sized (cumulative investment of about US$250 million to US$750 million, though less for gold) or large (investment of more than US$750 million). Nor does the country have operations at the higher end of small (investment of about US$100 million to US$200 million, though less for gold).Actual investment figures are not available at present; however, since 2011 the Rwanda Development Board (RDB) has signed 22 new projects, mainly in exploration, for a total of $110.5 million in investment commitments. If successful, such exploration activities could lead to one, if not more, small-scale mines with a minimum capital investment of US$100 million.
Rwanda’s mining operations are small but numerous and geographically dispersed. as of April 2014, Rwanda had accorded 548 mining permits to 213 registered mining entities, most on surface areas averaging less than five hectares with average monthly production of under one ton of ore. Of the 213 registered mining entities, 38 are cooperatives recognized by the national mining cooperative federation (FECOMIRWA); 5 are foreign-operated companies, 2 of which are in joint venture with the government; and all operate on special mining permits accorded during the denationalization of the sector in the early-tomid-2000s. The remaining 170 entities are domestic small entrepreneurs, or cooperatives without membership in FECOMIRWA. In addition, there are 28 registered mineral traders and exporters. Since 2012 the government has signed 22 new mining investment projects, as referred to by the RDB, most focused on exploration, and at various stages of implementation.
For the relative size of the country, this level of permitting is high and appears to be rising (Figure 2.2). By comparison, Tanzania and the DRC have active small-scale mining populations of 600,000 and 2 million, but with less than half the number of equivalent small-scale mining licenses than registered in Rwanda. The apparent proliferation of permits, particularly between 2013 and 2014, presents a challenge to effective site regulation because of the wide geographic spread of these relatively small operations and the large number of government agents required to monitor site activities. Furthermore, with implementation of the iTSCi traceability program, each new additional mine requires new GMD staff to be hired for program monitoring.
Mining in Rwanda comprises three stages: production, domestic commercialization, and export. In the first stage, miners work on permitted sites granted by the minister in charge of mining. Sites are organized according to working teams that perform extraction, washing, and minimal processing at the site. Typically once a week, minerals are washed, sorted, dried, and bagged for
Figure 2.2: Number of Mining Permits Held as of April 2014
0
100
200
300
400
500
600
2007 2008 2009 2010 2011 2012 2013 2014
Num
ber
of p
erm
its
Source: Geology and Mining Department, MINIRENA (2014).
2.2. Scale and Scope of Rwanda’s Mining Sector

transport to Kigali. In the second stage, mineral traders purchase production from the various mine sites. In Kigali, this domestic production is aggregated either from mine sites or through middlemen to a few mineral traders who carry out processing and exporting. Although traders typically have long-standing relationships with specific mine sites, ultimately the price offered and the time lag between purchase and payment determine to whom a mine operator sells. In the third stage, following the structure of the global manufacturing industry, Rwanda’s principle minerals are exported to Asia (principally Malaysia) for smelting and onward to Asia, Europe, and North America for addition into final manufactured products. The road journey from Kigali to the key ports (Mombasa and Dar es Salaam) can take up to three weeks, followed by port clearance time in Kenya or Tanzania. For the product to reach Asian smelters and for payment to be received by a mineral trader back in Kigali
can take up to three months. These wait times create cash flow problems for Kigali-based mineral exporters and wider instability in the local mineral economy through price variations.
Rwanda employs today, as it has in the past, a high proportion of manual labor to extract its principal minerals. All sites rely on manual labor, with minimal investment in mechanized techniques. Although a few mine sites have introduced processing techniques that use gravity systems or make use of explosives and bulldozers to ease access to core geological veins, these improvements are neither sufficiently spread across the country nor technologically advanced enough to be considered semi-industrial. In effect, little adaptation of mining techniques has occurred since the 1920s to improve basic recovery at the mine site and mineral processing levels (Perks 2013).
2.3. Macroeconomics of the Mining Sector
Mineral production volumes have increased marginally, but strong exports earnings have resulted principally from favorable international mineral prices. Investment by foreign companies is minimal,
and tax contributions from the sector are insignificant.
2.3.1. Production and Exports
Rwanda’s domestic production fluctuates because of its small-scale characteristics
and historical externalities, making it difficult to draw conclusions about the sector’s potential to generate benefits. From 1985 through 1989 the country’s mining activities were more or less suspended when the key mining entity, Société Minière de Rwanda (SOMIRWA), filed for bankruptcy after the collapse of the international tin market. During 1989–94 many rural smallholder farmers were driven to small-scale mining by structural adjustment along with the collapse of the international coffee market. The period immediately thereafter saw new domestic interest
in tantalum (coltan), hitherto not privileged as an export mineral in Rwanda. Rwanda also liberalized third-party mineral trading licenses to nonmining entities during this period, thereby opening up its domestic trade market to neighboring country sources (see Table 2.1 for the evolution of mining production in the country).
Table 2.1: Annual Average Production of Rwanda’s Minerals (tons)Period Cassiterite Wolfram Coltan1958–85 1,935 518 441985–89 - - -1989–94 751 161 1211995–98 469 238 116Source: Adapted from Bidega (2006).Note: — = not available.
Rwanda Economic Update | Edition No. 6 28
Part 2: Special Focus

Since privatization of Rwanda’s major mining assets, productive capacity has marginally improved according to export statistics since 1999 (Figure 2.3). Major assets under the stewardship of the mining parastatal Regied’ Exploitation et de Developpement des Mines were leased out, of which only two were maintained as joint ventures with the government. In the last few years rising domestic production has largely been attributable to small new investments, introduction of some mineral recovery techniques on some mining sites, but more importantly the proliferation of mining permits. The increase in permits seems to be the most plausible reason for the rise in production given the relative absence of investment in mechanization.
Cassiterite remains the major mineral produced for export by volume, though coltan’s higher market value makes it more financially lucrative to mine (Figure 2.4).30 Based on export figures disaggregated since 2010, the government’s 2017/18 targets of 8,000, 2,000, and 1,000 annual tons of exports for cassiterite, wolframite, and coltan, respectively, may be achievable (Figure 2.5) (MINIRENA 2013).
Recent shares of total export earnings from minerals are consistent with historical data but remain vulnerable to fluctuations in international mineral prices. Between 1967 and 1973, mineral export values as a percentage of total exports were significant, ranging from 23 percent to 30 percent, and peaking at 42 percent in 1969 (Perk 2013). From 2010 to 2013, mining ranged between 27 percent and 42 percent of total export value, and has contributed roughly US$592 million to export earnings since 2010. The Mining Sub-Sector Strategic Plan under EDPRS 2 aims
Figure 2.3: Total Mineral Exports
0
2,000
4,000
6,000
8,000
10,000
12,000
1999 2001 2003 2005 2007 2009 2011 2013
Volu
me,
in to
ns
Source: MINIRENA.
30 Data provided by the ITRI, which works in partnership with the government of Rwanda to implement the mineral traceability program in Rwanda. Mixed cassiterite product (Sn/Ta, Sn/W, and Sn/W/Ta) and mixed tantalite (Ta/W) have been included under Sn and Ta respectively. See https://www.itri.co.uk/index.php?option=com_mtree&task=viewlink&link_id=55074&Itemid=11.
Rwanda Economic Update | Edition No. 6 29
Part 2: Special Focus
Figure 2.4: Production of Rwanda’s Major Export Minerals
0
500
1,000
1,500
2,000
2,500
Vol
ume,
in to
ns
Cassiterite Coltan Wolfram
Source: BNR.
Figure 2.5: Exports of Rwanda’s Major Minerals
0
200
400
600
800
1,000
1,200
1,400
1,600
1,800
2,000V
olum
e, in
tons
Cassiterite Coltan Wolfram
Source: BNR.
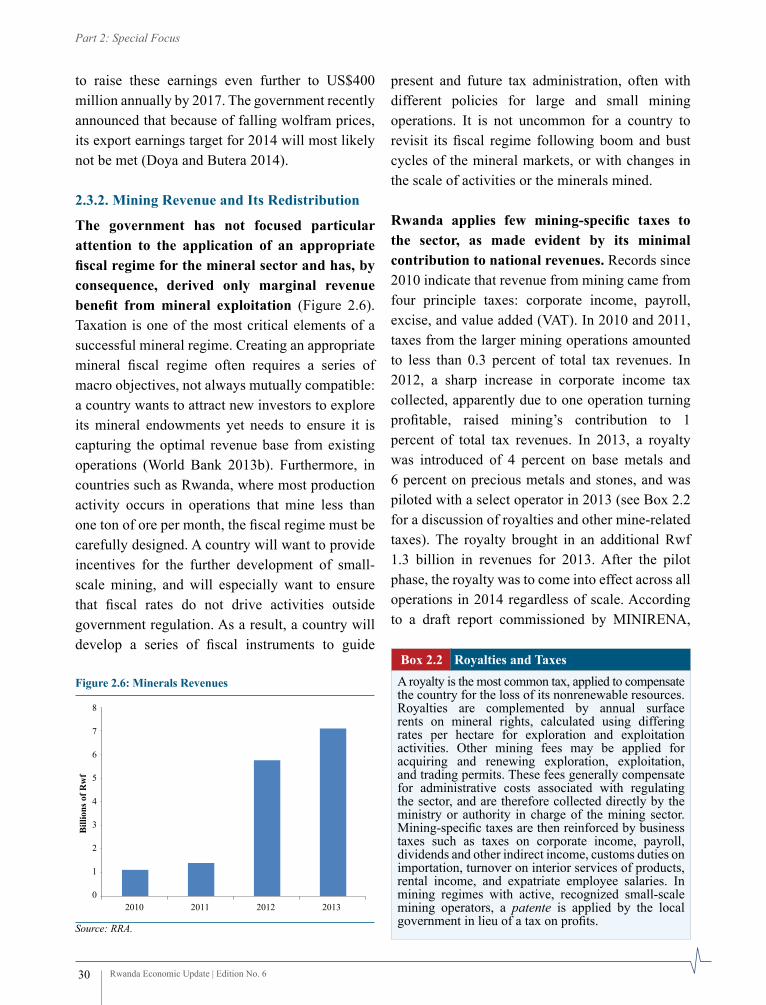
to raise these earnings even further to US$400 million annually by 2017. The government recently announced that because of falling wolfram prices, its export earnings target for 2014 will most likely not be met (Doya and Butera 2014).
2.3.2. Mining Revenue and its Redistribution
The government has not focused particular attention to the application of an appropriate fiscal regime for the mineral sector and has, by consequence, derived only marginal revenue benefit from mineral exploitation (Figure 2.6).Taxation is one of the most critical elements of a successful mineral regime. Creating an appropriate mineral fiscal regime often requires a series of macro objectives, not always mutually compatible: a country wants to attract new investors to explore its mineral endowments yet needs to ensure it is capturing the optimal revenue base from existing operations (World Bank 2013b). Furthermore, in countries such as Rwanda, where most production activity occurs in operations that mine less than one ton of ore per month, the fiscal regime must be carefully designed. A country will want to provide incentives for the further development of small-scale mining, and will especially want to ensure that fiscal rates do not drive activities outside government regulation. As a result, a country will develop a series of fiscal instruments to guide
present and future tax administration, often with different policies for large and small mining operations. It is not uncommon for a country to revisit its fiscal regime following boom and bust cycles of the mineral markets, or with changes in the scale of activities or the minerals mined.
Rwanda applies few mining-specific taxes to the sector, as made evident by its minimal contribution to national revenues. Records since 2010 indicate that revenue from mining came from four principle taxes: corporate income, payroll, excise, and value added (VAT). In 2010 and 2011, taxes from the larger mining operations amounted to less than 0.3 percent of total tax revenues. In 2012, a sharp increase in corporate income tax collected, apparently due to one operation turning profitable, raised mining’s contribution to 1 percent of total tax revenues. In 2013, a royalty was introduced of 4 percent on base metals and 6 percent on precious metals and stones, and was piloted with a select operator in 2013 (see Box 2.2 for a discussion of royalties and other mine-related taxes). The royalty brought in an additional Rwf 1.3 billion in revenues for 2013. After the pilot phase, the royalty was to come into effect across all operations in 2014 regardless of scale. According to a draft report commissioned by MINIRENA,
Rwanda Economic Update | Edition No. 6 30
Part 2: Special Focus
Figure 2.6: Minerals Revenues
0
1
2
3
4
5
6
7
8
2010 2011 2012 2013
Bill
ions
of R
wf
Source: RRA.
A royalty is the most common tax, applied to compensate the country for the loss of its nonrenewable resources. Royalties are complemented by annual surface rents on mineral rights, calculated using differing rates per hectare for exploration and exploitation activities. Other mining fees may be applied for acquiring and renewing exploration, exploitation, and trading permits. These fees generally compensate for administrative costs associated with regulating the sector, and are therefore collected directly by the ministry or authority in charge of the mining sector. Mining-specific taxes are then reinforced by business taxes such as taxes on corporate income, payroll, dividends and other indirect income, customs duties on importation, turnover on interior services of products, rental income, and expatriate employee salaries. In mining regimes with active, recognized small-scale mining operators, a patente is applied by the local government in lieu of a tax on profits.
Box 2.2 Royalties and Taxes

a well-applied royalty across the sector should provide US$6 million in annual revenue, based on the current scale of production.31 This amount is, however, still far below the projected revenue base of Rwf 20 billion (US$30 million) targeted for 2020. Table 2.2 shows the progression of revenue collection since 2010.
A fiscal regime heavily dependent on only a few more-substantial operations and hundreds of small mining operations presents a series of challenges that MiNECOFiN acknowledges. Experiences in other mining regimes in the East African and Great Lakes region are mixed when it comes to setting fiscal rates that accommodate the varied scales of mining activity in a given country. In some cases, such as Burundi, a lower royalty rate is applied to small-scale permit holders; in all other countries, the royalty is not differentiated between large and small operations (Table 2.3). In the latter cases, it is assumed that the exporters will pay the royalty on behalf of the cooperatives and small-scale operators. Inevitably, however,
this often results in a lowering of the price per kilo offered to miners on their production, as witnessed in the DRC and Tanzania.
Apart from royalties, small-scale operators pay other mining fees, but inconsistently. The majority of small-scale permits are research permits, though operators are, in practice, producing. It is unclear the extent to which surface land rents are properly applied given the permit status. For instance, some small operations pay surface rents to districts while others pay them to the sector administration. This diverges from the general principle of surface rents applied per hectare used in some countries, such as the DRC and Tanzania, where the price per hectare differs according to the mineral mined (Table 2.4). In addition, a patente (see Box 2.2 for an explanation)is applied to cooperatives and small-scale operators by local governments in Rwanda, but again some pay to the district and some to the sector. The extent to which these data are captured at present by the Rwanda Revenue Authority (RRA) is not clear, nor is it clear
Rwanda Economic Update | Edition No. 6 31
Part 2: Special Focus
Table 2.2: Taxes Collected by RRA from Mining Since 2010 (Millions of Rwf)
YearValue-Added
TaxPay As You Earn Tax
CiT-PiT ExciseWithholding
TaxOther Royalty
Total Taxes from Mining
Mining Contribution
(percent)
Total RRA Collections
2010 89.7 712.5 171.8 6.1 90.7 47.4 - 1,118.3 0.3 412,489.72011 55.7 761.6 238.3 11.7 158.6 180.9 - 1,406.8 0.3 501,803.32012 2,662.6 1,164.7 1,580.0 30.9 103.3 214.6 - 5,756.2 1.0 602,557.42013 2,420.6 1,392.3 611.1 17.8 1,233.5 160.5 1,263.1 7,099.1 1.0 706,776.6Source: Rwanda Revenue Authority.Note: — = Not applicable.
31 Draft report (Wilson 2013) submitted to MINIRENA and shared with delegation.
Table 2.3: Royalties as Applied to ASM in the East African and great Lakes Region(Percent)Mineral Burundi The DRCa Tanzania UgandaCassiterite 3 2 3 3Wolfram 3 2 3 3Coltan 3 2 3 3Gold 2 2.5 4 3Source: World Bank staff data assembled from current Mining Codes and Regulations. Note: ASM = artisanal and small-scale mining.a. DRC is currently revising its mining code and the royalty rates may change.
Table 2.4: ASM Surface Rents as Applied to ASM in the East African and great Lakes Region(US$ per year)
Burundi The DRC
(per km²)
Tanzania(per
hectare)Uganda
Cassiterite 3,182 257 7 120Wolfram 3,182 257 7 120Coltan 6,364 257 7 120Gold 12,758 257 12 120Source: World Bank staff data assembled from current Mining Codes and Regulations. Note: ASM = artisanal and small-scale mining.

Rwanda Economic Update | Edition No. 6 32
Part 2: Special Focus
how local administrations use these fees in their administrative budgeting. Finally, mineral traders and exporters pay a license fee, applicable for three years, and renewable (Table 2.5). Although administered by the Ministry of Trade and Industry (MINICOM), this fee (US$441 for the three-year period)is paid directly to the RRA.
Though perhaps too early to discuss, it is worth highlighting that Rwanda’s national mining legislation contains no model for revenue redistribution, nor does it discuss the role of decentralized tax collection. Both issues matter greatly to effective mine revenue management. In Rwanda, several revenue distribution models and mechanisms could be used. A centralized tax collection system could redistribute revenue through the national budget to sector ministries based on priorities and needs. Alternatively, a percentage of total revenue could be redistributed to provincial, district, and sector administrations. A decentralized tax collection system could determine percentages to be collected and retained at source between national and subnational governments. Each model has advantages and disadvantages, though given Rwanda’s well-performing decentralized political system, a model that simply streamlines roles and responsibilities for provincial and district administration in mineral tax collection and distribution could reinforce the need for these levels of government to play a more consistent role
in the regulation of the small-scale mining sector. This has proven to be a critical ingredient to success in other small-scale mining sectors in countries such as Ghana and Tanzania (World Bank 2013a).
2.3.3. investments in the Sector and Constraints to Future Financing
Should two or three of the new exploration projects for which agreements have been
signed lead to actual mines, the government’s 2017 target of US$500 million in mining investment may be reached, albeit in 2019 or 2020 (MiNiRENA 2013). investment in mining comes from either new mine development or current mine expansion. in looking at the investment portfolio for the country’s sector, it is difficult to see how this target will be met. Twenty-two new projects have been signed with the government, totaling US$110.5 million in investment commitments. The government has no actual investment figures available at this time though the RDB intends to carry out a survey later in 2014. Of these 22 new projects, more than two-thirds are for exploration activities with a preliminary permit period of four years. As of 2014 the majority of these exploration projects had yet to begin. One impact beyond FDI would be the distributive investment impact made by larger mining projects to social infrastructure in the outlying mining areas.
Both mine expansion and new project development depend on availability of finance, which is difficult to acquire at present. Constraints to financing are driven by two factors cited by mine operators in Rwanda: continued absence of up-to-date exploitation permits for the country’s largest mining operations (those that formed the core of the denationalization process) and an inexperienced local banking sector. It is assumed that with the new mining law, as discussed further below, the government will complete
Table 2.5: License Fees as Applied to ASM in the East African and great Lakes Region
Burundi The DRC Tanzania Ugandaartisanal license
US$318/hectarea n.a.b n.a. n.a.
Small-scale license
n.a. US$500 US$12 US$160
License renewal
US$318/ha
US$250/year US$60c US$240
Source: World Bank staff data assembled from current Mining Codes and Regulations.Note: ASM = artisanal and small-scale mining; n.a. = not applicable.a. Valid for two years.b. To be determined by Inter-Ministerial Decree.c. Valid for seven years.

Rwanda Economic Update | Edition No. 6 33
Part 2: Special Focus
the revision of the pending mining contracts. Industry has cited this as a key reason for why investments in the mining sector have not been as robust as predicted. However, the overall lack of financing made available by the local banking sector deserves examination, particularly if the government, as stated, seeks to support further national entrepreneurship in the mining sector for its smaller operators. Financing, however, requires that some prerequisites be met by prospective mine applicants, including geological data leading to estimates of total reserves. In the absence of such data, other countries have piloted loan programs, guaranteed by the government and development partners, including the World Bank, with small credit banks to support small-scale mining enterprises. The success of microfinance and credit to the smallholder farming sector in Rwanda provides precedent for a similar program in mining. In fact, MINIRENA defines it as a policy area in its 2010 Revised Mining Policy, though it has yet to be addressed.
in the meantime, mineral traders are providing stop-gap financing to local small-scale entrepreneurs and mining cooperatives to make marginal improvements to production and recovery techniques. FECOMIRWA has secured a line of credit from one of its foreign mineral buyers so it can invest in machinery and other equipment at its members’ sites. One mineral trader in Kigali has provided more than US$6 million in small loans to its mining partners to do the same. In one case, an investment of less than US$100,000 was used to triple site production by making use of old tailings. If properly set up and put in place, a more robust and streamlined loan program, managed by a Rwandan bank with a guarantee from the government, could make a considerable and immediate impact on small operations—boosting their recovery and production through improved technologies. The World Bank in partnership with the government of Tanzania and the Tanzanian Investment Bank (TIB Ltd) has put in place a successful small-scale mining loan model that could inspire a similar model in Rwanda.32
2.4. Employment in the Sector and the Miners’ Profile in the Rural Areas
Evidence suggests that Rwandan miners are not simply farmers who mine in the off-season. Their continued contribution to development will depend on targeted enforcement of Rwanda’s labor
standards in the mining sector. More long-term investment in education will, however, provide more gainful employment opportunities for Rwandans.
The labor market in Rwanda is characterized by widespread underemployment.
According to the EICV 3, the average employed person in Rwanda works 22 hours per week, which roughly corresponds to half-time employment. Underemployment is especially acute in the agricultural sector; independent farmers work, on
average, 17 hours per week while wage farmers work an average of 19 hours. Underemployment is less of a problem in the mining sector; miners work on average 30 hours per week; 42 percent of miners work more than 35 hours per week and thus approach full-time employment.
32 In Tanzania, the World Bank is supporting the Ministry of Energy and Minerals to implement the Sustainable Management of Mineral Resources Project, a US$50 million loan to the government of Tanzania. As part of its support to the small-scale mining sector’s development, a percentage of the total project loan has been given to TIB Ltd to manage a revolving loan scheme for small-scale operators.

Rwanda Economic Update | Edition No. 6 34
Part 2: Special Focus
RDB indicates that there are significant gaps in professional, technical, and trade skills in the sector. At present, to fill the skills gap, waivers are being granted to foreign mining operators to bring additional qualified expatriates under the existing visa waiver policy. Even then, however, the number of waivers is most likely not that significant given the scale of the mineral economy. Furthermore, given the weight of the labor sector’s reliance on unskilled rural miners, the gaps identified by RDB are not that pressing. However, if the mining sector is to grow by way of more semi-industrial operations in the next several years, skills development must become a crucial policy focus; it will, to the greatest degree possible, ensure Rwanda’s access to higher-earning opportunities.
There are discrepancies in the mine employment figures provided by different institutions, though this is common with small-scale mining economies throughout Sub-Saharan Africa. Whereas the national 2012 population census shows that 18,000 people are directly employed in the mining sector, MINIRENA’s latest figure suggests that there are 33,638 miners (with an additional 14,000 in quarrying), and ITRI confirms 32,115 miners involved at least in the 3Ts (Cassiterite, Coltan and Wolframite). Fluctuations in actual employment figures are often attributable to the informality of the activity and the assumption that miners move from farming to mining depending on the season (World Bank 2005; Hilson and Maponga 2004).Historical fluctuations in Rwanda’s mining sector employment have been noted previously, with, for instance, threefold increases during specific periods of the year in the late 1990s (Uwizeyimana 1986). Seasonality is one variable that may explain the more recent discrepancies between Rwanda’s
2012 population census and statistics provided by MINIRENA. Seasonality may also explain the EICV 3 aggregate figure of 72,000 miners (both full-time and secondary). Other factors beyond seasonality should, however, be considered. For instance, given the continued increase in mine permit allocations, it is plausible that employment continues to rise in the sector. Furthermore, income diversification means that more rural households pursue multiple income sources. Several factors are discussed to help understand potential causes and consequences of increased mine employment in the rural areas.33
Longitudinal data suggest the number of miners has consistently increased since the late 1970s, expanding strongly since the early 2000s. at the height of SOMIRWA’s operations, 8,000 miners were directly employed and an additional 3,000 workers were organized into subcontractor arrangements. By 1990, employment had dropped by a third, to 5,298 miners, with an additional 1,500 working under subcontractor arrangements. Since the resumption of activities in the early 2000s, mining employment has risen by 22 percent per year, making it the fastest growing sector as measured by employment (NISR 2012).34 The EICV 3 indicates that slightly less than 1 percent of Rwanda’s labor force was engaged in mining as a primary occupation in 2011. If primary and secondary occupations are summed, 1.5 percent of Rwanda’s labor force (approximately 72,000 people) was engaged in mining and quarrying at the time of the EICV3 survey.35 At the district level, employment in mining ranged from a low of zero to a high of 6.8 percent in Rulindo District in the Northern Province.
33 Work by the World Bank (2005) and Hilson and Maponga (2004) provide insight into navigating data collection hurdles in small-scale mining economies.
34 For instance, wage labor in farming grew by 14 percent per year during the same period (2001–11).35 Note that the 2012 Population and Housing census estimates the number of people with mining and quarrying as primary
occupation to be much lower, at 18,171.

Rwanda Economic Update | Edition No. 6 35
Part 2: Special Focus
These steep rises in employment would seem to suggest that Rwanda is displaying de-agrarianization trends commensurate with other small-scale mining environments in Sub-Saharan Africa. De-agrarianization has proved useful in critically reassessing traditional assumptions about small-scale miner behavior and profiling.36 In particular, research in the DRC, Ghana, and Tanzania has challenged the assumption that small-scale miners are driven by short-term gains and opportunism and, if given another choice, would abandon mining altogether (Jønsson and Bryceson 2009; Perks 2012; Hilson 2010).Although youth may enter the sector because of low education, little access to jobs, or constraints in the household, evidence is emerging to suggest that people will remain in the sector for the long term. These case studies indicate the emergence, since the 1990s, of “career” small-scale miners. Career miners are men and women who self-identify as full-time miners and treat mining as their primary source of income.
Therefore, Rwandan miners cannot simply be considered farmers who mine in the off-season. For instance, in a project baseline study from 2011, miners were asked to identify their profession. Out of 227 respondents, only 20 self-identified with a profession other than mining. Of those 20, only one considered himself, first and foremost, a farmer. Such preliminary evidence on the nature of miners in Rwanda raises some important considerations for policy. For instance, this evidence provides a rationale for developing strategic investment in improved mining practices as a means to develop further efficiencies in production. In
Tanzania, small-scale miners receive operational grants and loans from the government to improve technology and recovery practices on site. MINIRENA’s 2010 Revised Mining Policy already identifies such formalization mechanisms, enabling potential further work on small-scale mining formalization to occur.
Women make up 16 percent of the total mine employment figure.37 The gender ratio is lower than average estimates for Sub-Saharan Africa (Hinton, Veiga, and Beinhoff 2003). In fact, in Sub-Saharan Africa, women may make up anywhere from 40 percent to 100 percent of the workforce (World Bank 2012; Amutabi and Lutta-Mukhebi 2001; Jennings 1999; Lahiri-Dutt 2008; Onuh 2002).
Mining employment is concentrated in the northwest of the country (Figure 2.7). Almost 10,000 persons in Rulindo District are employed in mining, and in each of the neighboring districts of Gakenke and Gicumbi, mining provides
36 For an introduction to the de-agrarianization literature, see Hilson (2010). 37 The government intends to see mining employ at least 60,000 persons by 2017, of which 30 percentare expected to be women.
Figure 2.7: Mining Employment and its Concentration in the Northwest (Employment in mining and number of mines by district)
Sources: EICV3; and MINIRENA.

Rwanda Economic Update | Edition No. 6 36
Part 2: Special Focus
direct employment to more than 5,000 people. Employment in mining is marginal in the south and east. The number of mine licenses per district (in 2011) is only weakly correlated with district-level employment in mining. For instance, Rulindo, which has the highest mining employment figures, had only one mine license in 2011: Rutongo Mines.This company has the largest number of miners on any mine license in the country. In contrast, Kamonyi District, where 2,000 people work in mining, had 10 mine licenses.
Miners are mainly young men, and largely unskilled. Some 50 percent of miners are 27 years old or younger. The concentration of young men is consistent with evidence found in the literature profiling small-scale mining male labor forces (World Bank 2005). Miners are also largely unskilled. Almost 25 percent of miners never went to school or did not complete the first year of primary school. Slightly more than 16 percent of miners completed primary school and almost 6 percent went beyond primary. Miners are, on average, somewhat better skilled than farm wage workers—a particularly disadvantaged group on the labor market—but much lower skilled than the
overall labor force (Figure 2.8). The median level of education for both miners and farm wage workers equates to the third grade of primary school.
Miners seem to come from disadvantaged households. Compared with other households, households that earn income through mining have significantly smaller landholdings and are more likely to also earn income through farm wage employment, an activity that is typically reserved for the poor. Mining households are larger than average and more likely to have an illiterate household head. The disadvantaged position turns up in the poverty statistics: 48 percent of mining households live below the poverty line, compared with 40 percent of households overall.38
mining Income
Though driven by poverty into mining, once in the mines, miners earn good incomes relative to other wage workers (Figure 2.9). According to the EICV 3, the annual income for miners was almost Rwf 200,000 compared with Rwf 69,000 for farm wage workers and Rwf 270,000 for all categories of wage workers. Dropping the relatively well-paid civil servants, miners actually have higher incomes than other wage earners. Miners have a higher median income than wage workers in general. Income of miners is comparable to that of construction workers (Rwf 209,000). To complement the EICV 3 data, a separate survey conducted in 2011 on mining income with 227 small-scale miners and mine manager respondents provides an average daily income of Rwf 7,391. Taken as one sample group, miners and mine managers, on average, may be netting roughly Rwf 3,000 per day, after daily average household and individual expenses are deducted A case study of cane sugar workers in Kabuye, Western Province, shows the average daily wage of farmers to be equivalent to Rwf 400 (Ansoms 2007).
Figure 2.8: Miners are Somewhat Better Educated than Farm Wage Workers but significantly Worse than the Overall Labor Force(Education level by occupation, 2011)
24.8
3222.7
52.7
50.8
40.9
16.614.3
18.3
5.9 2.9
18.1
0
10
20
30
40
50
60
70
80
90
100
Miners Farm wage workers Overall labor force
Perc
ent
No education Incomplete primary Complete primary Higher than primary
Source: EICV3, 2011.
38 The figures in this paragraph need to be interpreted with caution, given that fewer than 3 percent of households actually earn income through mining.

Rwanda Economic Update | Edition No. 6 37
Part 2: Special Focus
Figure 2.9: Average and Median Annual Wage incomes
0
50,000
100,000
150,000
200,000
250,000
300,000
Miners Farm wage workers Overall labor force
Ann
ual i
ncom
e, in
Rw
f
Average annual income Median annual income
Source: World Bank staff calculations based on EICV3.
However, a significant difference in earnings is observed between small-scale miners and mine managers, though not between small-scale miners and cooperative presidents. If the 2011 mine survey is disaggregated according to category of employment, the average daily wage of small-scale miners was Rwf 5,400 with average daily expenses of Rwf 2,950. Small-scale miners may be earning an average of Rwf 2,450 in daily net profits. Mine managers may earn upward of Rwf 17,000 per day with Rwf 9,400 in expenses. Hence, net earnings may be closer to Rwf 7,600, which is triple what miners earn. Small-scale miners earn roughly the same as presidents of mining cooperatives. For instance, whereas presidents of cooperatives may earn, on average, Rwf 8,400 per day, their expenses come to Rwf 5,300, meaning their net earnings are only Rwf 3,100, slightly above the average of a small-scale miner. This rather small variation in income suggests greater parity in cooperatives, based on the membership philosophy, though further research is warranted to understand this observation in greater detail.
The relatively high incomes for miners are explained in part by longer work hours but more generally by a wage premium tied to the manner in which earnings are calculated. Miners work an average of 30 hours per week, which is significantly longer than the 25-hour overall average for wage earners (Table 2.6). Longer hours can be attributed to the payment incentive driving the sector whereby miners are paid according to quantity of minerals produced. Controlling for differences in education and demographic characteristics, miners earn Rwf 95 (US$0.28) per hour more than workers of similar skills levels in other sectors.39 This premium is substantial, amounting to 34 percent of the overall average wage. This premium is mainly influenced by the price resulting from international demand for the commodities. The steady performance in international prices for Rwanda’s main commodities has provided an attractive environment for premium wages to combine with a youthful working population. These factors help to explain why wage labor in mining has significantly higher returns than wage labor in agriculture, where the hourly wage is 40 percent lower (Rwf 136). This suggests that mining offers a more attractive alternative for unskilled laborers than wage work in the agricultural sector.
Table 2.6: Miners Work More Hours and Earn Higher Wages than Farmers(Hours worked per week and hourly wage for different wage categories)
Mining Farm wage laborNumber of hours per week 30.1 18.8
Hourly wage (Rwf) 230.6 136.0
Source: World Bank staff calculations based on data from EICV 3.
39 This assertion is based on a regression of hourly wage on education, age, and sex of unskilled labor and sector of employment.
Rwanda Economic Update | Edition No. 6 38
Part 2: Special Focus
2.5. governance
Rwanda has initiated important institutional and regulatory reforms that, if brought to a successful conclusion, could contribute to increased foreign investment, revenues, and job creation.40 The sector will, however, need
to navigate a transition from predominantly small-scale to semi-industrial mining activities while simultaneously responding to international regulatory requirements on its export market.
2.5.1. Institutional and Regulatory framework
Rwanda has made significant strides to improve its regulatory policies and
practices so that they approach international best practice.41 Actions include the appointment of a State Minister for Mines,the development of a national mining policy and supporting strategic plans, a national mining law, and a national cadastre system (which has yet to become fully operational).42 Rwanda’s comprehensive mining policy sets forth a clear rationale for the sector’s development, accompanied by concrete actions and measurable results. It makes a concise link to broader national development frameworks, outlines actions required to improve governance and performance, and provides a direct link to the mining subsector strategies. Key areas of intervention in the policy reflect the pillars described by the World Bank’s Extractive Industries’ Value Chain (Alba 2009) as essential to a well-performing and transparent mining sector, such as increasing geological data related to national mineral potential, building institutional capacity, and adhering to social and environmental standards for mine development. It is less explicit on revenue management.
MiNiRENA has also established important mine management targets. These targets demonstrate the government’s commitment to a well-regulated sector that responds to social and environmental standards laid out in partnership with the Rwanda Environmental Management Agency and other international standards and regulations particular to the Great Lakes region.43 MINIRENA aims to ensure that by 2017 all mines operating in the country have efficient water and waste management systems, and that 80 percent of the country’s mines adhere to safety regulations and the country’s “no child labor” policy.
Rwanda has a national mining law, supported by related ministerial orders. The Law on Mines and Quarries Exploitation of 2008 is supported by a variety of ministerial orders: requirements for granting a license for purchasing and selling mineral substances in Rwanda; modalities of environmental conservation in mining and quarrying; procedures for requesting licenses; conditions and classification of mineral substances; procedures for license limits on mining and quarry extraction; and the determination of taxes applicable to mines and quarries. Two additional ministerial regulations are Fighting Smuggling in Mineral Trading and the Regional Certification Mechanism for Minerals.44
40 Although the World Bank’s mineral sector review process provides a more comprehensive assessment of Rwanda’s mining sector, the following paragraphs highlight some critical elements for discussion.
41 Alba (2009) and the World Bank’s Template for Evaluation of Mineral Policy and Mineral Law provide a basis for discussing the status of Rwanda’s institutional and regulatory framework.
42 A mining cadastre is the principal public institution that manages mining titles in a country (Girones, Pugachevsky, and Walser 2009).43 Those include the Organisation for Economic Co-operation and Development’s Due Diligence Guidance for Responsible
Supply Chains of Minerals from Conflict Affected and High-Risk Areas(OECD 2013),Provision 1502 of the 2010 Dodd-Frank Wall Street Reform and Consumer Protection Act, and the International Conference on the Great Lakes Region’s“Protocol Against the Illegal Exploitation of Natural Resources”(ICGLR 2006).
44 Corresponding law numbers areNo. 003/2010/MINIFORM of September 10, 2010; No. 004/2010/MINIFORM of September 14, 2010; No. 005/2010/MINIFORM of September 14, 2010; No. 006/2010/MINIFORM of September 14, 2010; No. 001/2011/MINIFORM of March 10, 2011; and No. 002/2012/MINIRENA of March 28, 2012.
Rwanda Economic Update | Edition No. 6 39
Part 2: Special Focus
The Law on Mines and quarries Exploitation of 2008 was reviewed to further improve opportunities for responsible and sustainable investment. Revisions were intended to bring Rwanda’s national mining law closer to international best practice. In addition to exploration and small and large mining licenses, the revised law has created a fourth category of mine licenses, the artisanal license. The revised law has also extended the potential length of lease on both exploration and mining licenses to up to 25 years, depending on the size of the proposed project, which should encourage longer investment opportunities in the sector. Investment is further enhanced by the first-come, first-served philosophy found in the revised mining law, which allows a company that has invested in sufficient exploration work with proof of resource to have first rights on converting the exploration permit into an exploitation license. At the same time, to avoid speculative practices, the government has adopted stringent criteria for mine license applications and conditions for exploration licenses. These criteria, covering mine depth, length of lease, and other conditions, are comparable to most mining codes or national laws globally. The law also makes reference to several important conditions for maximizing subnational development impacts, such as local content and skills development. A model mine agreement is under development and should, if completed, provide a consistent template for negotiating future mine contracts with the private sector.45
given the characteristics of Rwanda’s mining sector, managing the issuance of its small-scale mining licenses is critical. Although Rwanda does not have specific artisanal zones, it has a large number of small-scale permits that would
benefit from registration in a national cadastre system.46 International best practice would encourage a holistic approach to the mineral rights licensing system (including quarries and small-scale activity) (Girones, Pugachevsky, and Walser 2009).Its benefits are, in fact, mutually serving: on the one hand, registration in the national system serves to provide small-scale miners with security of tenure, and on the other hand, registration aids the government in tracking small-scale mining activities in an efficient manner. When ASM or quarrying licenses fall outside the general mining regime, “it is impossible for the state administration to adequately manage the activities for issues related to environment, safety, health, and control of production” (Girones, Pugachevsky, and Walser 2009, 42).A further area not yet properly defined is GMD’s small-scale mining unit proposed in the 2010 Mining Policy, though, according to GMD, given the centrality of small-scale operations in the sector this structure may no longer be necessary.
Several important measures under discussion will further enhance clarity and transparency of the sector’s functioning. Two important reforms are under way and set to conclude by June 30, 2014. First is the revision to the mineral trading license. MINICOM alongside MINIRENA is revising the terms and conditions for mineral trading licenses in Rwanda to limit middle-level buying and selling. As of June 30, 2014, any mineral trader in Rwanda will need to demonstrate its capacity to export. This is an important policy reform measure to curb domestic mineral theft and to increase, in theory, the prices offered to miners at the lowest level of the mineral value chain. These revisions offer an important opportunity to impress greater clarity on the domestic trade chain, increase efforts to
45 The Model Mining Development Agreement Project, a project of the Mining Law Committee of the International Bar Association, provides one template under use in other countries. See http://www.mmdaproject.org/?page_id=340. Provisions such as tax rates, social obligations, and mine development timelines are typically defined beforehand in the country’s national mining legislation (code or otherwise), so there should be no discrepancies between the content of the mine agreement and prevailing national laws.
46 In the DRC, for instance, government-regulated artisanal zones do appear on the mining cadastre though are not subject to permitting by the cadastre itself.

Rwanda Economic Update | Edition No. 6 40
Part 2: Special Focus
process and add minimum value domestically, and limit middlemen buyers in the domestic system. It falls in line with broader international practices on mineral traceability and transparency. Second is the review of permits, particularly those issued to cooperatives not registered with FECOMIRWA. This is particularly useful because the ASM formalization agenda in Rwanda’s national mining policy has received the least attention to date in practice, and the proliferation of small-scale mining permits has been significant, increasing from 4 permits in 2007 to 534 in H1:2014, with the most significant jump in permits occurring between 2013 and 2014.
The organizational structure of agencies supporting the mining sector deserves further consideration and strengthening. The current institutional mapping is provided in Figure 2.10. As mentioned, a mining cadastre service would typically hold and manage the cadastre alongside a Geological Survey, both retaining some level of independence from the central administration. The Geological Survey would manage geological mapping, geophysics, and earth sciences, and make available new preliminary geological data to
prospective foreign investors. The organizational structure is, however, unique in Rwanda with the RDB playing an allocation role in the permit process alongside the GMD, but further legislative clarity, particularly on the role and limits of responsibility of the RDB, is required.47 The role of a mining cadastre is not discussed in the national mining law. There is also a pressing need for a dedicated mines inspection service—attached to the GMD—for monitoring ASM activities. The sector lacks in most instances basic occupational safety standards, related often to lack of financing for operators but also knowledge and technology (van Teeffelen 2012). Bundesanstalt fur Geowissenschaften und Rohstoffe (BGR) has provided training on improved mine development practices in cooperation with GMD, including environmental audit practices. Other partners have also provided inputs to the development of improved environmental and social standards applicable to the sector. Given that a state-of-the-art “green” model mine is a priority for the Rwandan government, MINIRENA can further enhance its practices by drawing on international best practices, such as International Council on Mining and Metal’s Sustainable Development Framework.48
47 See, for instance, the draft report prepared by Wilson (2013) for the government of Rwanda. The report’s focus was to assess and propose current practices—both regulatory and industry—in managing environment and social impacts in the mining sector in which the role of RDB was questioned on legislative grounds.
48 http://www.icmm.com/our-work/sustainable-development-framework.
Figure 2.10: institutional Mapping
Rwanda Development Board• Promote investment• Company registration• Build capacity toward promotion of export• Set the Environment Impact Assessment (EIA) terms of reference and offer EIA certificates• Public-Private Partnership (PPP) investment
Rwanda Revenue Authority• Set fair taxation procedures
MINICOM• Trade licenses• Certificates of origin
MINECOFIN• Budget allocation• Fiscal policies in mining• Mobilize external financial resources
Rwanda Cooperative Agency• Register cooperatives• Support capacity building, auditing, soliciting support for cooperative development
Rwanda Environment ManagementAuthority• Set environmental standards• Environment inspection of mining projects• Rehabilitation of exhauseted mines and quarries
Geology and Mining Department• Enhance geological and mining knowledge of the country• Improve exploitation and investment conditions• Monitor whether the mining activities are complying with the law• Increase value added of Rwanda’s mines and quarries
Rwanda Natural Resource Authority(Lands, Forestry and Conservationand Water Departments• Land titles to mining projects• Expropriation and leasing• Water use licenses and standard setting • Advise on reforestation• Land use master plan
MINIRENA• Design policy and strategies, laws and regulations elaboration and supervision• Issue licenses• Promote mining sector at national and international levels• International cooperation• Capacity building
Sources: World Bank Staff.
Rwanda Economic Update | Edition No. 6 41
Part 2: Special Focus
2.5.2. Transparency and Accountability
Rwanda has been leading efforts to ensure the transparency of its mineral supply chains. Transparency can be further enhanced through complementary frameworks such as the EITI.
in the great Lakes region of central Africa, access to informal mineral supply chains has
long been argued to be a key driver of ongoing regional instability and protracted conflict in the eastern DRC. International norms and legislation require robust mineral traceability and certification systems to be put in place by governments in the region as a first response. Rwanda was the first to do so, in 2012, pursuant to Provision 1502 of the Dodd-Frank Wall Street Reform and Consumer Protection Act; the OECD voluntary directive, Due Diligence Guidance for Responsible Supply Chains of Minerals from Conflict-Affected and High-Risk Areas; and the ICGLR Protocol against the Illegal Exploitation of natural Resources. The most notable program in support of these international norms is the mineral traceability scheme, iTSCi. At present, the iTSCi system covers all existing mines in exploitation in Rwanda.
The implementation of iTSCi has provided a basis for establishing greater clarity on the scale and scope of Rwanda’s 3Ts sector. Mining operators and exporters are required to maintain record systems in conformity with established international guidelines under the management of iTSCi. These records include mine origin of mineral; volumes at exit from the mine; the domestic transport route; individual, new volumes after processing and sorting in Kigali; and the route
from Rwanda to the buyer’s destination. Supporting domestic legislation in Rwanda, conforming to the ICGLR Protocol, further reinforces trade chain transparency. Soon it is also expected that the RRa will issue new instructions to all mining companies and mineral traders to use the formal banking system for all payments to suppliers with the aim of further clarifying the chain of actors in Rwanda’s mining sector.
Real-time data on Rwanda’s mining sector can only further enhance the government’s own efforts to implement evidence-based policy interventions in the sector and respond to international concerns for “conflict-free” mines in the great Lakes region.49 Sufficient data are now available on Rwanda’s mining sector, providing an opportunity to disaggregate data according to specific variables (for instance, geographic region, mines, miners, price, trade volumes, and domestic production). In fact, the iTSCi data management system provides a sound basis for improved national mineral data management, should the government approach data collection and analysis in the mining sector as it does in other ministries, such as agriculture and gender. Efforts to further modernize data collection in the system could offer additional opportunities to pilot a national database capable of serving both policy development and public outreach functions , as suggested in Box 2.3
49 Basic ASM data concerns include the following: (1) production statistics—both disaggregated by mine site and mineral, and aggregated at the national level generally as export statistics; (2) formal revenue streams derived from licensing permits, leases paid to traditional chiefs or landholders (often paid in addition to licensing permits if they exist), ad valorem taxes at export, import taxes for transiting minerals from a neighboring country, production taxes at mine sites, potential in-country processing taxes, or fees associated with trading (third-party buyers); and (3) composition and scale—people and sites.
The government’s ongoing efforts to transform its predominantly small-scale
mining sector to include semi-industrial and industrial activities will benefit from the government’s renewed strategic focus on broader development outcomes as opposed to concentrating on increasing export earnings alone. The reliance on export earnings to demonstrate mine development has prevented an examination of how effective mine development could occur with more strategic but fewer mine sites. Focusing on the type of sector the country wishes to build instead of on export values could provide government and industry efforts with a more efficient orientation. As it stands now, the burden of regulating a proliferated and geographically dispersed mining sector is evident.
MiNiRENA’s 2017/18 target to have on stream three medium-scale mines and 100 small-scale mines is worth recalling and revisiting. A series of objectives for the sector, based on this ratio, could be as follows:
a. secure the Enabling Environment for Current Investment
Current and future investment in Rwanda’s mining sector depends on clear and stable laws and their consistent application. Of key interest for mining
investors is the transparent manner in which mine licenses are awarded, and the tenure and fiscal stability offered through their agreements. With the changes to Rwanda’s mining law, the regularization of all outstanding mining permits should be addressed. Two areas are of concern: (1) renegotiating the larger producing licenses given their more immediate impact on fiscal revenue potential and foreign investment; and (2) reviewing the status of existing small-scale mining licenses with attention to harmonizing exploitation licenses and potentially reducing the number of permits to a more manageable volume according to the stated target. A due process for all future contracts, based on streamlined institutional responsibilities and clear guidelines from a mine model agreement, may further enhance investor confidence in Rwanda’s mining sector for some of the larger assets, though may not be necessary for the majority of small-scale permits. The cadastre will play an essential role in harmonizing all existing permits, thereby reducing existing conflicts surrounding overlapping rights. It will also make available to interested private companies, through one centralized geographical information system map, data on prospective areas.
b. Build the Geological Knowledge Base for future Investment
Detailed and publicly available geological knowledge plays a leading role in attracting future exploration investment for eventual mine
National governments may have two reasons for their renewed interest in their artisanal and small-scale mining (ASM) sectors: (1) domestic pressure to increase revenue mobilization and hence tackle typical informality in the sector; and (2) domestic policy interest in enhancing data and evidence on the sector’s contribution to GDP. The new Extractive Industries Transparency Initiative (EITI) Standard, endorsed in April 2013, is a credible platform for piloting new approaches to ASM data management. Whereas the original EITI standard dealt with mineral revenue reconciliation between what companies declared as taxes paid and what government recorded as taxes earned, the new standard requires countries to provide better data on the size, structure, and potential contribution to be made by ASM in the mineral economy. In recent years, some EITI countries—such as Ghana, Nigeria, and Tanzania—have supported the concept of revenue tracking in their ASM subsectors. In Burundi, the World Bank is supporting the Ministry of Energy and Mines in its piloting of a national database capable of reconciling production and export figures alongside revenues gained. This pilot, in cooperation with the Tin Supply Chain Initiative (iTSCi), could lead to a model replicable in other countries in the region implementing iTSCi—such as Rwanda and the DRC.
Box 2.3 Artisanal and Small-Scale Mining Data Challenges in Sub-Saharan Africa
Rwanda Economic Update | Edition No. 6 42
Part 2: Special Focus
2.6. Conclusions: Maximizing the Potential Development Benefits from Mining

Rwanda Economic Update | Edition No. 6 43
Part 2: Special Focus
development. The government’s commitment to invest an average of US$2 million per year in potential target areas from the national budget is well noted, and should continue to be supported, perhaps even through development partners. It is likely that without sufficient new discoveries, the size of the mining sector in Rwanda will remain fairly limited.
c. Increase fiscal Receipts and Ensure Revenue management
Three key measures to be undertaken by the government would assist in increasing mining revenues: First, effectively apply the new royalty rate through the implementation of accompanying regulations. It is understood that the MINECOFIN will complete this in the mediumterm and is seeking technical support from interested partners for this task. Second, support a third-party audit of the entire production and export chain to ensure conformance with new legislation on rents and rates but also on mineral classifications and export declarations. In that audit, examine how small-scale operators and cooperatives do, or do not, benefit from legislation and practices geared toward development of small and medium-sized enterprises. Rethink, if necessary, an adjusted tax model for the smaller operators, including cooperatives. Third, enhance RRA’s capacity to administer taxation policies and collect revenues in the sector. The commitment made by the Netherlands to enhancing RRA’s audit capacity is recognized as timely and essential. The increase in revenue benefits from further fiscal receipts will require clear rules, guidelines, and procedures for retrocession, if at all, of mining revenues to the provinces, districts, and sectors, and accountability for their use by subnational authorities. These efforts would be enhanced by implementation of the EiTi50 to disclose revenue flows to the public.
d. Improve Recovery and Domestic Processing
An additional strategy to increase production is to improve recovery techniques at sites. Rwanda has significant tailings dumps at its oldest concessions that could be cleaned up, treated, and processed for further economic gain. The government could consider making available, through a specific local loan program with leading banks, a revolving credit facility to provide an incentive to small-scale miners to invest in small recovery and processing equipment. The outcome would serve multiple agendas: environmental stewardship, small-business development, and export growth. It would not require allocation of new permits.
e. strengthen Human Development (skills and Labor Conditions)
By way of its workforce alone, Rwanda’s mining sector can make tangible and significant development impacts in the rural economy. A policy focus on the “good job” would see miners earn more pay for their labor, work in safe conditions, and be integrated into the social safety net of the formal labor market. Building on existing work with Germany’s BGR, the necessary small-scale mining regulations relating to occupational health and safety should be completed. It would be useful to perform an audit of existing labor practices used by subcontractors operating at the larger concessions, by small operators, and by cooperatives, and identify areas for improved inspection practices. Frequency and efficiency of mine site inspections would benefit from the establishment of a fully functioning small-scale mining unit in the GMD, given the high number of mining licenses in the country. The targets set by the government to foster a new generation of skilled mine professionals should continue to be supported.
50 http://eiti.org/. The Extractive Industries Transparency Initiative (EITI) and its Standard is an international initiative to ensure transparency around countries’ oil, gas, and mineral resources. It is developed and overseen by a coalition of governments, companies, civil society, investors, and international organizations. When implemented, the EITI ensures more transparency in how the country’s natural resources are governed, and full disclosure of government revenue from its extractive sectors.
▪ Alba, E. M. 2009. “Extractive Industries Value Chain: A Comprehensive Integrated Approach to Developing Extractive Industries.” Extractive Industries for Development Series No. 3. Washington, DC: World Bank.
▪ Amutabi, M., and M. Lutta-Mukhebi. 2001. “Gender and Mining in Kenya: The Case of the Mukibira Mines in the Vihiga District.” Jenda: A Journal of Culture and African Women’s Studies 1(2):1–23.
▪ Ansoms, A. 2007.“How Successful Is the Rwandan PRSP? Growth, Poverty & Inequality.” Review of african Political Economy 34(112):371-379.
▪ Banchirigah, S. M. 2008. “Challenges with Eradicating Illegal Mining in Ghana: Perspectives from the Grassroots.” Resources Policy 33: 29–38.
▪ Bidega, D. 2006. “Reorganisation de l’artisanat minier au Rwanda.” Mémoire de fin d’études du Centre d’Etudes Supérieures de l’Administration publique des Mines (CESAM). France: Fontainebleau.
▪ BNR (National Bank of Rwanda). 2012. “Assessing the Stability of the Money Multiplier.” Economic Review No. 5. BNR, Kigali.
———. 2013. “Foreign Private Investment in Rwanda, 2013.” BNR, Kigali.▪ Doya, D. M., and S. Butera. 2014. “Rwanda Mining Revenue to Decline on Lower Tantalum Export Prices.”
Bloomberg News, May 23. http://www.bloomberg.com/news/2014-05-23/rwanda-mining-revenue-to-decline-on-lower-tantalum-export-prices.html.
▪ EITI (Extractive Industries Transparency Initiative). 2013. The EITI Standard. Oslo, Norway: EITI. http://eiti.org/files/English_EITI%20STANDARD_11July_0.pdf.
▪ Esiara, K. 2013. “Rwanda Puts Three Mines on the Block.” The East African, March 23–29.▪ Girones, E.O., A. Pugachevsky, and G.Walser. 2009. “Mineral Rights Cadastre. Extractive Industries for
Development Series No. 30.” Washington, DC: World Bank.▪ Hilson, G. 2010. “‘Once a Miner, Always a Miner’: Poverty and Livelihood Diversification in Akwatia, Ghana.”
Journal of Rural Studies 26 (3):296–307.▪ Hilson, G, and O. Mapunga. 2004. “How Has a Shortage of Census and Geological Information Impeded the
Regularization of Artisanal and Small-Scale Mining?” Natural Resources Forum 28(1): 22–33.▪ Hinton, J., M. Veiga, and C. Beinhoff. 2003. “Women and Artisanal Mining: Gender Roles and the Road
Ahead.” In Socio-Economic Impacts of Artisanal and Small-Scale Mining in Developing Countries, edited by G. Hilson. Rotterdam: Balkema.
▪ ICGLR (International Conference on the Great Lakes Region). 2006. “Protocol Against the Illegal Exploitation of Natural Resources.” ICGLR, Bujumburi, Burundi. http://www.lse.ac.uk/collections/law/projects/greatlakes/2.%20Democracy%20and%20Good%20Governance/2c.%20Protocols/protocol.ienr.30.11.%2006%20-%20en,%20final%20revised.pdf.
▪ International Council on Mining and Metals (ICMM). 2003. “Sustainable Development Framework.” London. ▪ Ishihara, Yoichiro. 2012. “Identifying Aid Effectiveness Challenges in Fragile and Conflict-Affected States.”
World Bank Policy Research Working Paper No. 6037, World Bank, Washington, DC.▪ iTSCi (ITRI Tin Supply Chain Initiative) Secretariat. 2013. “Data on the Minerals Trade within the iTSCi
Programme, Q2 2011 to Q2 2013: Rwanda.” International Tin Research Institute, Hertfordshire, U.K.▪ Jennings, N. 1999. “Social and Labour Issues in Small Scale Mines.” Report for discussion at the Tripartite
Meeting on Social and Labour Issues in Small-scale Mines, International Labour Organization, Geneva.▪ Jønsson, J. B., and D. F. Bryceson. 2009. “Rushing for Gold: Mobility and Small-Scale Mining in East Africa.”
Development and Change 40(2):249–79. ▪ Kamete, A. 2008.“When Livelihoods Take a Battering: Mapping the ‘New Gold Rush’ in Zimbabwe’s Angwa-
Pote Basin.” Transformation: Critical Perspectives on Southern Africa 65(1):36–67.▪ Lahiri-Dutt, K. 2008.“Digging to Survive: Women’s Livelihoods in South Asia’s Small Mines and Quarries.”
South Asian Survey 15 (2):217–44.▪ Maconachie, R., and T. Binns. 2007. “‘Farming Miners’ or ‘Mining Farmers’? Diamond Mining and Rural
Development in Post-Conflict Sierra Leone.” Journal of Rural Studies 23(3):367–80.
REFERENCES
Rwanda Economic Update | Edition No. 6 44

▪ McMahon, G., and S. Moreira. 2014. “The Contribution of the Mining Sector to Socioeconomic and Human Development.” Extractive Industries for Development Series No. 30. Washington, DC: World Bank.
▪ MINIRENA (Ministry of Natural Resources). 2013. “Subsector Strategy 2013.” MINIRENA, Kigali.▪ NISR (National Institute of Statistics of Rwanda).2012a. “EICV3 Thematic Report – Economic Activity.” Kigali. ———. 2012b. “EICV3 Thematic Report: Income.” Kigali. ▪ OECD (Organisation for Economic Co-operation and Development). 2013. Due Diligence Guidance for
Responsible Supply Chains of Minerals from Conflict Affected and High-Risk Areas, 2nd ed. Paris: OECD Publishing.http://www.oecd.org/daf/inv/mne/GuidanceEdition2.pdf.
▪ Opoku-Afari, Maxwell, and Shiv Dixit. 2012. “Tracking Short-Term Dynamics of Economic Activity in Low-Income Countries in the Absence of High-Frequency GDP Data.” Working Paper No. 12/119, International Monetary Fund, Washington, DC.
▪ Perks, R. 2011.“‘Can I Go?’—Exiting the Artisanal Mining Sector in The Democratic Republic of Congo.” Journal of International Development 23: 1115–27. doi: 10.1002/jid.1835.
———. 2012. “How Can Public-Private Partnerships Contribute to Security and Human Rights Policy and Practice in the Extractive Industries? A Case Study of The Democratic Republic of Congo (DRC).” Resources Policy 37 (2): 251–60.
———. 2013.“Digging into the Past: Critical Reflections on Rwanda’s Pursuit for a Domestic Mineral Economy.” Journal of Eastern African Studies7 (4): 732–50.
▪ Private Sector Federation Rwanda. 2013.“Rwanda Prosperity Ecosystem Survey: Evaluating Rwanda’s Business and Investment Climate 2013.” Kigali, Rwanda.
▪ Siegel, Shefa, and Marcello Veiga. 2009. “Artisanal and Small-Scale Mining as an Extralegal Economy: De Soto and the Redefinition of Formalization.” Resources Policy34: 51–56.
▪ Rwanda Development Board. 2012. “Rwanda Skills Survey 2012: Mining Sector Report.” Rwanda Development Board, Kigali.http://www.lmis.gov.rw/scripts/publication/reports/Mining.pdf.
▪ Uwizeyimana, Laurent. 1986. “L’Activité Minière au Rwanda: d’Une exploitation marginale à l’éffondrement.” PhD dissertation, Université de Bordeaux III.
▪ VanTeeffelen, Jasper. 2012. “The EU Raw Materials Policy and Mining in Rwanda: Policy Coherence for Development in Practice.” Amsterdam: Evert Vermeer Foundation.
▪ Weber-Fahr, M. 2002.“Treasure or Trouble? Mining in Developing Countries” Mining and Development Extractive Industries Series. Washington , DC: World Bank and International Finance Corporation.
▪ Wilson, I. 2013. “Environmental, Social and Economic Dimensions to Consider in the Development of the Mining Industry in Rwanda.” Draft Report, Brisbane.
▪ World Bank. 2005. “Toolkit for Implementing of Artisanal and Small-Scale Mining Baseline Surveys in Africa.” Washington, DC.
▪ World Bank. 2013a. “Best Practices in the Small-Scale Gold Sector.” Unpublished, Washington, DC.▪ World Bank. 2013b. “How to Improve Mining Tax Administration and Collection Frameworks: A Sourcebook.“
Washington, DC: World Bank.▪ World Bank. 2013c. “Rwanda Economic Update 4: Maintaining Momentum, with a Special Focus on Rwanda’s
Pathway out of Poverty.” Washington, DC: World Bank.▪ World Bank. 2014. “Rwanda Economic Update 5: Seizing Opportunities for Growth, with a Special Focus on
Harnessing the Demographic Dividend.” Washington, DC: World Bank.
References
Rwanda Economic Update | Edition No. 6 45


ANNEx NOTES

Rwanda Economic Update | Edition No. 6 48
Annex Notes
Annex Note 1: Monetary Policy in Rwanda
The main missions of the National Bank of Rwanda (BNR) are to (1) ensure and maintain price stability; (2) enhance and maintain a stable and competitive financial system without any exclusion;
and (3) support the government’s general economic policies, without prejudice to the two missions referred to in (1) and (2) above.51
BNR follows a monetary policy framework that targets reserve money. To achieve its missions, especially price stability, BNR targets the level of broad money (M3). However, because BNR cannot directly control the level of M3, it focuses on reserve money (mostly banks’ reserves) as the operational target. In implementing its monetary policy, BNR uses indirect instruments such as open market operations (Treasury bills and short-term repurchase agreements) to control the level of reserve money. The key assumption of this framework is that the money multiplier (the relationship between M3 and reserve money) is stable in the short term.
The framework follows the formula below:
i) Broad money = β × Reserve money(β stands for money multiplier52)ii) Reserve money = Currency in circulation+ Reserves of banks iii) Reserves of banks = Required reserves+ Excess reserves.
For Rwanda’s monetary policy to achieve price stability, the following three key assumptions must hold: (1) the money multiplier must be stable in the short term to ensure that control of reserve money is effective for control of broad money; (2) the BNR has the ability to control reserve money; and (3) broad money and inflation must be positively correlated. However, these assumptions do not seem to be ensured.
(1) The money multiplier is unstable in the short term (BNR 2012).53 The money multiplier in Rwanda has not been stable (Annex Figure 1) in the short term, but shows a gradual upward trend. Thus, M3 can differ from its target level when monetary policy decisions are made.
(2) BNR has limited control of reserve money. Currency in circulation accounts for more than 70 percent of reserve money, and currency is out of BNR’s control. Thus, BNR has control of less than 30 percent of reserve money (bank reserves at BNR).Although the payment system has developed in the recent past, Rwanda remains a cash-based economy, a factor that limits monetary policy effectiveness.
(3) Weak relationship between inflation rates and M3. Inflation rates and M3, as measured by year-on-year growth rates, are weakly correlated (Annex Figure 2). A few possible factors behind the weak correlation are (i) imported goods in the consumer price index (CPI) basket (imported goods account for about 20 percent of the CPI basket; these goods are affected by international commodity prices and exchange rates) and (ii) food prices (food prices are affected by agricultural production).
Annex Figure 1: Money Multiplier is Unstable in the Short Term
4.5
4.6
4.7
4.8
4.9
5.0
Jan-13 Mar-13 May-13 Jul-13 Oct-13 Dec-13 Feb-14
Mon
ey m
ultip
lier
Sources: BNR; and World Bank staff calculations.
51 http://www.bnr.rw/index.php?id=180.52 “Money multiplier”is the rate at which the money supply changes in response to a change in reserve money.53 Economic Review No. 5 (May 2012) published by BNR includes an article on “Assessing the Stability of the Money Multiplier.”

Rwanda Economic Update | Edition No. 6 49
Annex Notes
BNR also uses its policy rate to signal its monetary policy and to influence interest rates. The BNR Monetary Policy Committee (MPC) determines its monetary policy stance on a quarterly basis. To achieve the monetary policy missions, the MPC determines the level of the policy rate. The MPC expects to influence credit to the economy by the banking sector through changes in interest rates.
However, the change in the policy rate has not effectively influenced market interest rates. Market rates do not respond to changes in the policy interest rate (Annex Figure 3). Factors hindering the transmission between policy interest rates and market rates include the following:
(1) High bank concentration and limited competition. The Rwandan banking system is still concentrated, with four banks holding more than 54 percent of the total assets of the banking sector. The largest bank holds 32 percent of the total assets of commercial banks. The high concentration and resulting limited competition imply that interest rates are not influenced by policy interest rates, but instead by decisions and circumstances of the large banks.
(2) Shallow and illiquid money market and interbank market. Excess reserves have accumulated in the banking system, and the excess reserves absorb the impacts of monetary policy. The undeveloped government securities market also limits the scope of open market operations to BNR short-term instruments.
(3) Large informal economy. The existence of the informal economy54 reduces the role monetary policy can play in influencing financing costs, a factor that could go hand in hand with a higher share of currency in circulation. The size of the informal economy and share of currency in circulation could become less of a binding constraint if interest rates fully reflect liquidity conditions and monetary policy and if the public becomes aware of the cost of holding idle money balances.
Annex Figure 2: Inflation Rates and M3
-5
0
5
10
15
20
25
30
35
Jan-09
Jul-09
Jan-10
Jul-10
Jan-11
Jul-11
Jan-12
Jul-12
Jan-13
Jul-13
Jan-14
Yea
r-on
-yea
r gr
owth
, per
cent
M3
Inflation rates
Sources: BNR; and World Bank staff calculations.Note: M3 = broad money.
Annex Figure 3: Changes in Policy Rate and Reserve Money Have Had Limited impact on Market interest Rates and Lending
0
2
4
6
8
10
12
14
16
18
20
Policy rate Deposit rate Lending rate Tresury bill rate
-5
0
5
10
15
20
25
30
35
40
Jan-10
Jul-10
Dec-10
May-11
Oct-11
Jan-11Aug
-11
Oct-11Dec-
11
Feb-12 Mar-
12
Aug-12
Jan-13
Jun-13
Nov-13
Perc
ent
Reserve money (growth rate) Credit to private sector (growth rate)Policy rate
Apr-11
Jun-12Aug
-12
Oct-12Dec-
12
Feb-13
Apr-13
Jun-13Aug
-13
Oct-13Dec-
13
Feb-14
Apr-14
Perc
ent
Sources: BNR; and World Bank staff calculations.
54 According to the NISR, the share of the informal sector in the economy is nearly 50 percent.

Annex Note 2: Rwanda—Dynamics in the Yield Curve of Short-Term government Securities
Shifts in yield curves of short-term government securities (g-securities)55 are often interpreted as changes in the monetary and fiscal policy stances, as well as expectations of future economic activity,
real interest rates, and inflation.
Developments in the yield curves of Rwanda’s g-securities during the past three years can be divided into two phases: the yield curve shifted upward between December 2010 and December 2012 then shifted downward through mid-2014. From a nearly flat shape in December 2011, the yield curve moved up in 2012, with large increases across all maturities except for operations of less than seven-day maturities. By end-2012, the yield curve reached the highest levels in all Treasury bill maturities, levels never seen before (black dotted line in Annex Figure 4). Since then, the yield curve has pivoted downward to the lowest levels in the last three years (red line of Annex Figure 4).
The upward shifts of the yield curve were observed during the period of high inflation and strong growth in credit to the public and private sectors. The inflation rates increased from 0.2 percent in December 2010 to 8.0 percent by end-December 2011. A large increase in credit to the private sector (22.5 percent on average from 13.0 percent in the previous year) was also seen in 2011. In addition, the demand for financing of the public sector rose sharply, shown by the 34 percent increase in outstanding Treasury bills. In 2012, the yield curve continued to shift upward, with large increases compared with 2011 levels. Several factors led to this upward shift. First, the central bank raised its policy rate, the Key Repo Rate,56 three times, for a cumulative 150 basis points between October 2011 and May 2012 to curb inflation. Second, the private and public sectors sustained their demand for financing with more than 30 percent increases in their stocks of credit and Treasury bills during H1:2012. Third, the public sector intensified its demand to offset the aid reduction that occurred in H2:2012 (see REU-4), while credit to the private sector started to slow.
In 2013, the yield curve shifted downward across all maturities, reflecting low inflationary expectations and a lower growth forecast. In addition, the momentum of financing to the private sector continued to decline as commercial banks became prudent in extending further credit given that their balance sheets were impaired by rising nonperforming loans. The reduction in new credit to the private sector had left banks with one investment option: Treasury bills. In fact, subscriptions to Treasury bills were nearly double the public offer, pushing competitive investors to reduce their interest rates. However, interest rates remained positive in real terms because the inflation rate remained moderate.
Annex Figure 4: Trends in Yield Curve of Short-Term government Securities
Jun-12
Dec-12
Jun-13
Apr-14Dec-11
Dec-12
2
5
8
11
14
≤ 7-D 1-M 3-M 6-M 1-YPe
rcen
tDuration
Sources: BNR; and World Bank staff calculations.
55 Here, G-securities refer to the Treasury bills issued by the central bank on behalf of the government for budget financing purposes and the central bank’s mop-up operations for the purpose of monetary policy. They include repo operations (http://bnr.rw/index.php?id=205) and the Treasury bills market (http://bnr.rw/index.php?id=328).
56 The Key Repo Rate serves as a ceiling rate for repo operations, which goes a long way toward explaining why interest rates on less than 7-day securities remained almost the same in 2012, while interest rates for other maturities increased by more than 450 basis points.
Rwanda Economic Update | Edition No. 6 50
Annex Notes

Annex Note 3: Low Capital Expenditure Disbursement Rates in FY2013/14
Capital expenditures account for about half of total expenditures in the central government budget. Given the share of public investment in total investment (55 percent), quality management of capital expenditures, such as timely disbursement, is critical for development in general and growth in particular, especially when growth is low.
Despite the current critical need to accelerate capital expenditures, the disbursements of capital expenditures were low in FY2012/13 and the first three quarters of FY2013/14. Disbursement rates have been declining from greater than 100 percent in FY2006/08 to about 90 percent in FY2012/13 and the first three quarters of FY2013/14 (Annex Figure 5).
Budget execution reports prepared by MiNECOFiN57 explain that “delays in finalizing disbursement documentations for projects funded with capital grants and concessional loans particularly in the energy and road sectors accounted for this underspending in the July–December 2013 period,” and for the implementation delays in the Energy, Water and Sanitation Authority (both for domestic and foreign capital) and the Rwanda Transport Development Agency for domestically funded capital projects.
The disbursement information by ministries and agencies for domestically funded projects58 enables the progress of domestically funded capital expenditures to be tracked against the annual budget.59 Annex Figure 6 shows that several line ministries have made slow progress. Ministries in the bottom right quadrant have higher-than-average projected capital expenditures and yet lower-than-average disbursement rates (against the annual budget). For example, the Ministry of Infrastructure (MININFRA) was projected to spend Rwf 157 billion (US$230 million), but actual spending reached only 46 percent of budget.
One possible cause for the low and declining disbursement rates is capacity constraints to execute capital expenditures. Without enhanced institutional, organizational, and individual capacities, ministries and agencies find it difficult to execute capital expenditures beyond certain levels. The negative relationship between disbursement rates and the size of the budget suggests that these capacity constraints are major hurdles (Annex Figure 7). In the future, more detailed analyses are required of low capital expenditures by projects and by ministries and agencies. Then, to address the low capital expenditure disbursement rate caused by capacity constraints in certain ministries and agencies, the government should (1) address the constraints in the medium term and (2) consider allocating more budgetary resources to ministries and projects for which capacity constraints do not exist.
Rwanda Economic Update | Edition No. 6 51
Annex Notes
Annex Figure 5: Declining Disbursement Rates
70
80
90
100
110
120
130
Act
ual d
isbur
sem
ent r
ate
to b
udge
ted,
per
cent
Total capital expenditure Domestically financed Foreign financed
Source: World Bank staff calculations based on MINECOFIN data.
57 http://www.minecofin.gov.rw/uploads/media/BudgetExecutionReport3rdQuarter2013-2014.pdf; http://www.minecofin.gov.rw/fileadmin/user_upload/Budget_Execution_Report_July-December_2013.pdf.
58 Because of data constraints, externally funded capital expenditure data are not available at a disaggregated level.59 Note this is a comparison of actual spending in the first three quarters to the annual budget.
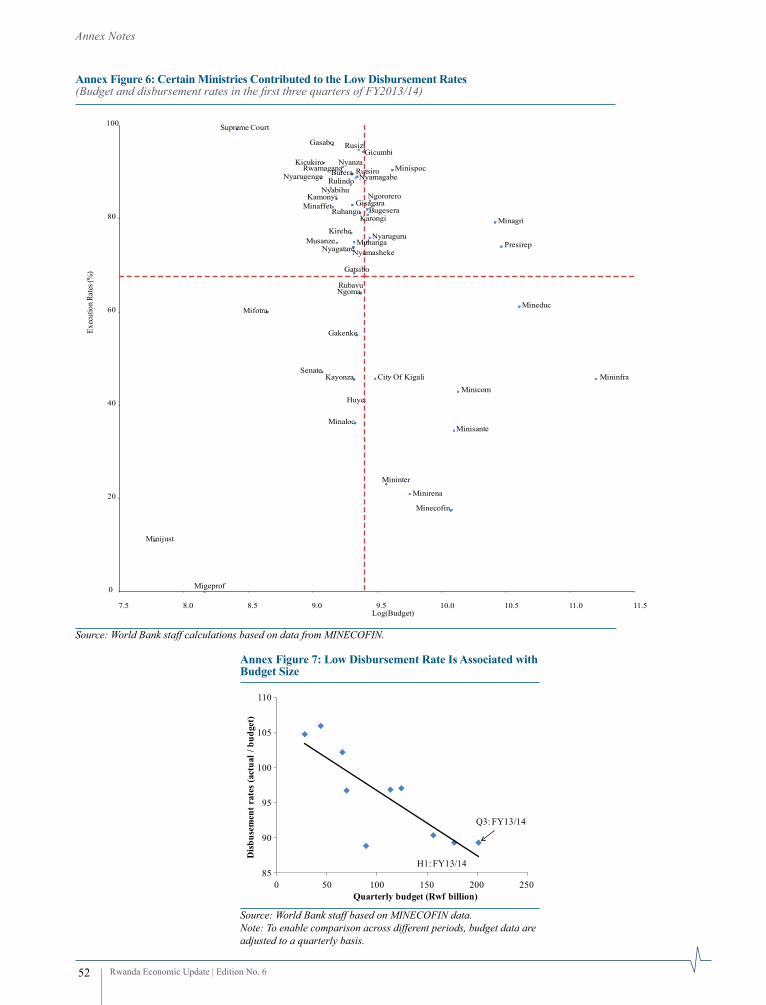
Rwanda Economic Update | Edition No. 6 52
Annex Notes
Annex Figure 7: Low Disbursement Rate is Associated with Budget Size
85
90
95
100
105
110
0 50 100 150 200 250
Dis
buse
men
t rat
es (a
ctua
l / b
udge
t)
Q3: FY13/14
H1: FY13/14
Quarterly budget (Rwf billion)
Source: World Bank staff based on MINECOFIN data.Note: To enable comparison across different periods, budget data are adjusted to a quarterly basis.
Source: World Bank staff calculations based on data from MINECOFIN.
Annex Figure 6: Certain Ministries Contributed to the Low Disbursement Rates (Budget and disbursement rates in the first three quarters of FY2013/14)

Rwanda Economic Update | Edition No. 6 53
Annex Notes
Annex Note 4: Rebasing National Accounts
Rwanda is one of several African countries rebasing their national accounts. Rebasing replaces the old base year used for compiling constant price estimates with a more recent base year.
Changing the base year means (1) changing the price and quantity base for the individual price and quantity relatives and (2) updating the weights used to aggregate the individual quantity relatives into sub-indices and to aggregate these sub-indices into more aggregated indices.60 Thus, rebasing tends to result in changes to both nominal and constant values in the national accounts.
The results of this rebasing exercise have attracted much attention in recent years. Rebasing in Nigeria showed that its economy was larger than that of South Africa, making it the largest economy in Africa. Ghana has moved from a low-income to a lower-middle-income country because some informal sector activities are now taken into consideration in the calculation of GDP. In Ethiopia, in contrast, double-digit economic growth, meeting the country’s growth target, was revised downward to single-digit growth, which failed to meet the growth target. Thus, rebasing the national accounts can have a considerable impact on a country’s macroeconomic strategy, especially when the rebasing paints an unexpected picture.
The rebasing exercise in Rwanda61 has resulted in relatively minor changes in the national accounts (Annex Table 1). The size of the economy as measured by nominal GDP was revised upward by 0.8 percent in 2011 and 0.4 percent in 2012. However, real growth rates turned out to be lower than previously estimated by about 1 percentage point. For example, the 2012 growth rate was revised down to 7.3 percent from 8.0 percent.
Annex Table 1: Comparison Between 2006 Base and 2011 Base gDP2009 2010 2011 2012 2013
Nominal
2011 base (a) (billion Rwf) 2,960 3,280 3,846 4,382 4,819
2006 base (b) (billion Rwf) 2,985 3,280 3,814 4,363 —
Gap (a/b, %) −0.8 0.0 0.8 0.4 —
Real growth
2011 base (%) 6.2 6.3 7.5 7.3 4.6
2006 base (%) 6.2 7.2 8.2 8.0 —
Gap (%) 0.0 −1.0 −0.8 −0.7 —Sources: NISR; and World Bank staff calculations.Note: — = not available.
60 http://unstats.un.org/unsd/DA-SEA-Asia/Documents%20-%20Lao%20WS/Lao%20WS-Country%20practices%20on%20rebasing%20and%20linking%20NA.pdf.
61 For example, results of the third household survey (EICV 3) and the national agriculture survey were used for Rwanda’s rebasing exercise.

Rwanda Economic Update | Edition No. 6 54
Annex Notes
The growth rates of all three sectors in the production account were revised downward, although partly offset by the growth in the adjustment (which includes value-added taxes and other taxes on products) (Annex Table 2). For example, growth in services was revised to 10.8 percent, 1.5 percentage points lower than previously estimated. In the expenditure account, the results of rebasing show that the slowdown in domestic demand started earlier than previously thought in 2012 (Annex Table 3). Most notably, the growth rate of private consumption became negative at −1.1 percent, and the improvement in net exports (that is, the reduction in deficits) was more pronounced than previously reported.
Annex Table 2: 2012 growth Rate Comparison of the Production Account Between 2006 Base and 2011 Base
Sector a. 2011 Base (percent)
b. 2006 Base(percent)
Gap (a − b)(percentage points)
agriculture 2.7 3.0 −0.3
Industry 6.2 7.2 −1.0
Services 10.8 12.2 −1.5
Adjustment 7.8 5.1 2.7
Overall growth 7.3 8.0 −0.7
Annex Table 3: 2012 growth Rate Comparison of the Expenditure Account Between 2006 Base and 2011 Base a. 2011 Base
(percent)b. 2006 Base
(percent)Gap (a − b)
(percentage points)Gross domestic product 7.3 8.0 −0.7Total final consumption expenditure 1.0 6.4 −5.4 Government 14.5 15.2 −0.8 Private (includes changes in stock) −1.1 4.6 −5.7Gross capital formation 16.3 16.1 0.1 Construction 15.7 15.8 −0.1 Durable capital goods 17.2 17.2 −0.1Resource balance −16.6 9.4 −26.1 Exports of goods and services 35.0 34.3 0.7 Imports of goods and services 7.2 20.0 −12.8

Rwanda Economic Update | Edition No. 6 55
Annex Notes
Annex Note 5: Coincident Economic indicator for Rwanda—A Tool for “Nowcasting” gDP
Consistent with worldwide practices of estimating gDP data, Rwandan gDP numbers are usually published with a delay of about 90 days. The construction of a coincident economic
indicator (CEI) for Rwanda is based on high-frequency data for estimating the change of GDP in the current period. The CEI should help to avoid the typical delay by giving an approximate indication of the current state of the economy for prompt policy reaction. Having real-time information on economic activity provides two benefits to policy makers. First, GDP estimates based on the CEI will allow monetary and fiscal institutions to make more-informed policy decisions. Second, policymakers can use it as an input in preparing medium-term macroeconomic projections.
The CEi is based on monthly data that are published in a timely manner and that span seven years. In selecting the initial pool of coincident variables, it should be taken into account that the variables share a common trend of movement with GDP as determined by the business cycle in the country. The methodology for constructing the CEI is based on Opoku-Afari and Dixit (2012), who describe a multistep procedure.62 The first selection step for the initial set of variables considers those variables that have a correlation sign with GDP according to prior expectations; those that are strongly correlated with GDP are selected for further consideration in the model. The model is then evaluated according to several criteria such as correlation between the levels and quarterly growth rates of GDP and the CEI, goodness of fit coefficient (R2), and closeness of their quarterly growth rates. By conducting iterations of the model that include and exclude some of the variables and by testing various combinations of variables from a broader pool,63 the final model is selected (the variables included and their respective weights are described in Annex Table 4). The highest weight in the composite index goes to credit to the private sector, consistent with the estimated weight in Opoku-Afari and Dixit. This underscores the importance of credit as a source of external financing to the private sector in Rwanda.
The results from the final model suggest that the correlation and the R2 coefficient between the levels of gDP and the CEi are estimated to be quite high, 0.98 and 0.96, respectively. The correlation between the annual and quarterly rates of growth is calculated to be 0.63 and 0.60, respectively. The R2 coefficient calculated for the annual and quarterly growth rates between GDP and the CEI are estimated to be 0.40 and 0.36, respectively.
62 Due to its technical nature, the procedure is not explained in detail here. It is available from the authors upon request.63 The broader pool of variables includes net exports (calculated as a difference of exports and imports of goods); exports of coffee;
VAT revenues; M0, M1, M2, and M3 monetary aggregates instead of credit to the private sector; turnover of manufacturing goods; turnover of intermediate goods; and turnover of agricultural products.
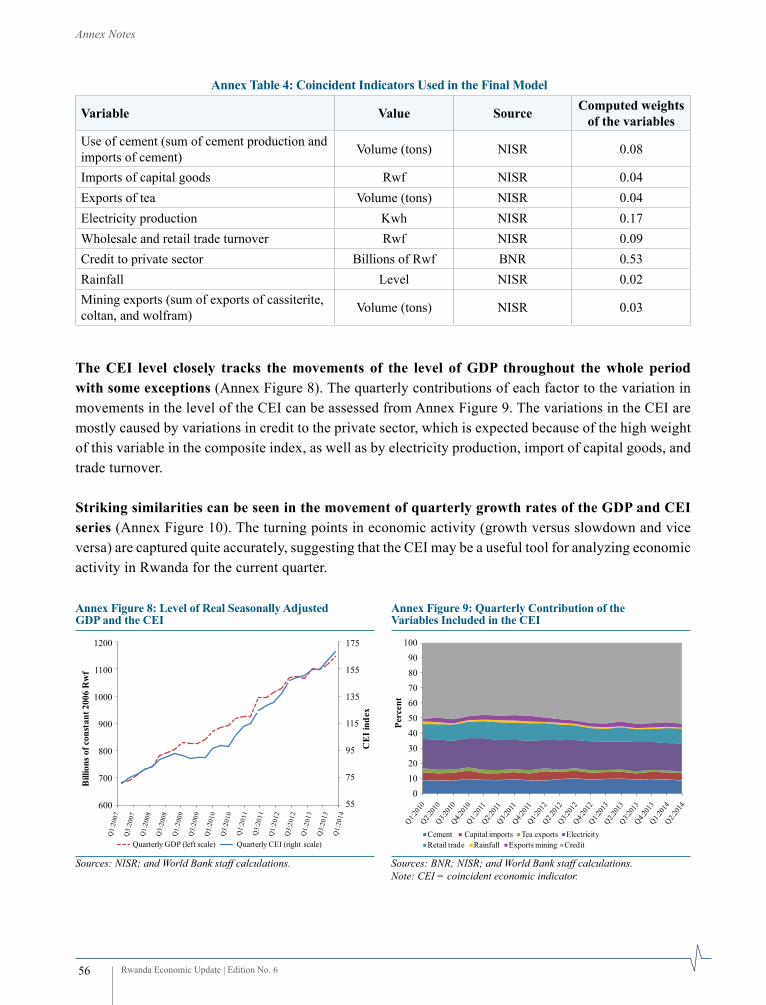
Rwanda Economic Update | Edition No. 6 56
Annex Notes
Annex Table 4: Coincident indicators Used in the Final Model
Variable Value Source Computed weights of the variables
Use of cement (sum of cement production and imports of cement) Volume (tons) niSR 0.08
Imports of capital goods Rwf niSR 0.04Exports of tea Volume (tons) niSR 0.04Electricity production Kwh niSR 0.17Wholesale and retail trade turnover Rwf niSR 0.09Credit to private sector Billions of Rwf BNR 0.53Rainfall Level niSR 0.02Mining exports (sum of exports of cassiterite, coltan, and wolfram) Volume (tons) niSR 0.03
The CEi level closely tracks the movements of the level of gDP throughout the whole period with some exceptions (Annex Figure 8). The quarterly contributions of each factor to the variation in movements in the level of the CEI can be assessed from Annex Figure 9. The variations in the CEI are mostly caused by variations in credit to the private sector, which is expected because of the high weight of this variable in the composite index, as well as by electricity production, import of capital goods, and trade turnover.
Striking similarities can be seen in the movement of quarterly growth rates of the gDP and CEi series (Annex Figure 10). The turning points in economic activity (growth versus slowdown and vice versa) are captured quite accurately, suggesting that the CEI may be a useful tool for analyzing economic activity in Rwanda for the current quarter.
Annex Figure 8: Level of Real Seasonally Adjusted gDP and the CEi
55
75
95
115
135
155
175
600
700
800
900
1000
1100
1200
CE
I ind
ex
Quarterly GDP (left scale) Quarterly CEI (right scale)
Bill
ions
of c
onst
ant 2
006
Rw
f
Sources: NISR; and World Bank staff calculations.
Annex Figure 9: quarterly Contribution of theVariables included in the CEi
0102030405060708090
100
Perc
ent
Cement Capital imports Tea exports ElectricityRetail trade Rainfall Exports mining Credit
Sources: BNR; NISR; and World Bank staff calculations.Note: CEI = coincident economic indicator.

Rwanda Economic Update | Edition No. 6 57
Annex Notes
To further improve the fit of the CEI, an additional exercise is conducted by including a fiscal sector variable such as execution of total budget expenditures. This can be an important factor for GDP growth in Rwanda because the government sector and its capital expenditures are quite large. The major limitation of including the fiscal sector in the model is that the data are available only with quarterly frequency and their conversion into monthly frequency induces some noise. Therefore, this exercise may not provide as accurate a picture of the current state of public spending as would be provided by using monthly budget numbers from MINECOFIN. An additional limitation in the fiscal policy data is that methodological changes throughout the sample period may introduce inconsistencies and biases. In this augmented version of the CEI, the correlation and the R2 coefficient decrease from 0.60 and 0.36 to 0.56 and 0.31, respectively, and there is a greater difference between the quarterly growth rates of GDP and the augmented CEI (Annex Figure 10).
The forecasts using the CEi presented above indicate that economic activity slows in the second quarter of 2014. The quarterly growth rate of real seasonally adjusted GDP in the second quarter of 2014 should be between 1.2 percent and 2.8 percent (quarter-on-quarter) and 5.2 percent and 6.8 percent (year-on-year). The growth slowdown is mostly a result of the reduction of the growth of cement consumption and wholesale and retail trade and the lower level of rainfall. The rest of the variables included in the index have greater positive contributions compared with the previous quarter. Any interpretation of the estimates of economic activity should take into account that the CEI comprises a narrow set of indicators and in some cases it may over- or underestimate growth.
Annex Figure 10: quarterly growth Rates of gDP, CEi, and CEi Augmented with Fiscal Data
-4
-2
0
2
4
6
8
Quarterly growth of CEI Quarterly growth of augmented CEIQuarterly growth GDP
Qua
rter
ly gr
owth
, per
cent
Sources: BNR; NISR; and World Bank staff calculations.Note: CEI = coincident economic indicator.

Rwanda Economic Update | Edition No. 6 58
Annex Notes
Annex Note 6: Development and Characteristics of Rwanda’s Tourism Sector
Tourism is the largest source of export earnings in Rwanda, but its growth
momentum has been stalled. Revenues from tourism increased from US$9 million in 2000 to US$294 million in 2013. During this period, the share of tourism in total exports (including goods, services, and income) increased from 3 percent to 25 percent. Even though tourism has remained the largest source of export earnings, its share has continued to fall from its peak of 35 percent in 2006 (Annex Figure 11). A targeted approach is required to revive the growth momentum of tourism, and the first step is to understand the characteristics of the tourism sector.
Tourism revenues are dominated by leisure. Rwanda received more than 1 million visitors in 2013 providing tourism revenues of US$294 million. Some 37 percent of visitors came to Rwanda for business purposes, followed by visiting friends and families (29 percent), and transit and other purposes (24 percent).Fewer than 10 percent of visitors came for holiday or leisure purposes. However, about half of tourism revenues were generated by tourists who came for holiday or leisure purposes (Annex Figure 12); average revenues per visitor are very different across the different purposes for visiting (Annex Figure 13).64
Annex Figure 11: Tourism Revenues and Share in Exports
0
100
200
300
400
500
600
700
0
10
20
30
40
50
60
70
80
Mill
ion
dolla
rs
Perc
ent
Share in service exports (left scale)
Share in exports of goods, services and income
Tourism receipts (right scale)
Sources: BNR; and World Bank staff calculations.
Annex Figure 12: Number of Visitors and Revenues by Purpose of Visit, 2013 (Percent of total)
9
4929
1037
33
24
8
Number of Visitors Revenues
Transit/other Business Visiting friends & families Leisure
Sources: RDB;and World Bank staff calculations.
Annex Figure 13: Average Tourism Revenues by Purposein 2013 (US$)
0
400
800
1,200
1,600
Leisure Visiting friends & families
Business Transit /other
Average
Sources: RDB;and World Bank staff calculations.
64 Key information, such as number of days in Rwanda, is not readily available.
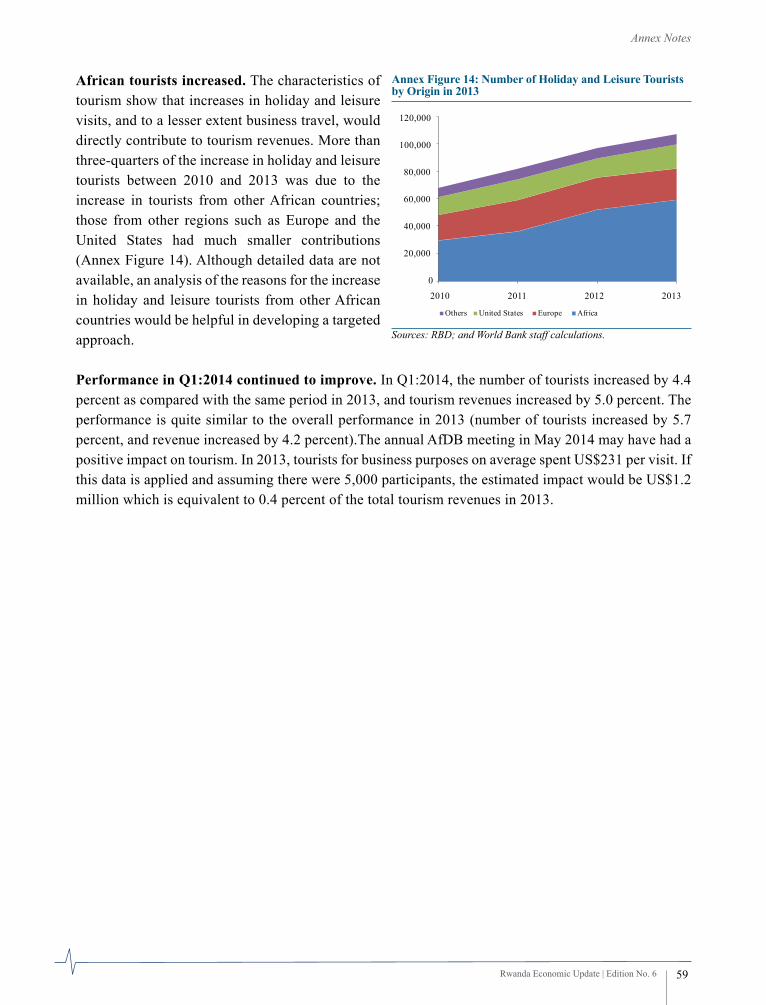
Rwanda Economic Update | Edition No. 6 59
Annex Notes
African tourists increased. The characteristics of tourism show that increases in holiday and leisure visits, and to a lesser extent business travel, would directly contribute to tourism revenues. More than three-quarters of the increase in holiday and leisure tourists between 2010 and 2013 was due to the increase in tourists from other African countries; those from other regions such as Europe and the United States had much smaller contributions (Annex Figure 14). Although detailed data are not available, an analysis of the reasons for the increase in holiday and leisure tourists from other African countries would be helpful in developing a targeted approach.
Performance in q1:2014 continued to improve. In Q1:2014, the number of tourists increased by 4.4 percent as compared with the same period in 2013, and tourism revenues increased by 5.0 percent. The performance is quite similar to the overall performance in 2013 (number of tourists increased by 5.7 percent, and revenue increased by 4.2 percent).The annual AfDB meeting in May 2014 may have had a positive impact on tourism. In 2013, tourists for business purposes on average spent US$231 per visit. If this data is applied and assuming there were 5,000 participants, the estimated impact would be US$1.2 million which is equivalent to 0.4 percent of the total tourism revenues in 2013.
Annex Figure 14: Number of Holiday and Leisure Tourists by Origin in 2013
0
20,000
40,000
60,000
80,000
100,000
120,000
2010 2011 2012 2013
Others United States Europe Africa
Sources: RBD; and World Bank staff calculations.

Annex Note 7: impact of Commodity Price Change on Rwanda’s Trade Balance
in Rwanda, the main export items are traditional products such as coffee, tea, and minerals (cassiterite, coltan, and wolframite), which accounted for 45 percent of total exports in 2012.
A decline in international commodity prices for these products is likely to have a negative impact on exports. However, as proved during the global financial crisis in 2009, the overall impact on the economy is likely to be very limited for two reasons. First, the share of exports in GDP is relatively low at 13.2 percent in 2012, which is lower than neighboring countries. Second, the impact on exports is likely to be offset by a decline in imports of fuels.
Exports in the EconomyBetween 2010 and 2012, exports grew by 38 percent per year, but decelerated in 2013 with a growth rate of 18.7 percent. The share of exports in the economy was 16.6 percent in the first three quarters of 2013, which is lower than neighboring countries such as Kenya (26.9 percent), Tanzania (30.5 percent), and Uganda (20.5 percent).65 Therefore, the relative impact of a decline in international commodity prices on the economy through exports is likely to be smaller than in the neighboring countries.
Traditional Products in ExportsThe traditional products have played a major role in exports. The share of the traditional products in total goods exports increased from 45 percent in 2012 to 62 percent in 2013. The share of minerals in total exports increased most, from 28 percent in 2012 to 40 percent in 2013. The traditional products accounted for 80 percent of export growth in 2013 (of which, coffee −5 percent, tea −8.3 percent, and minerals 190 percent. If prices of the traditional products decline by 10 percent,66 total exports will decline by US$49 million or 14 percent of total exports (Annex Table 5).
impact on importsHowever, the impact on exports is likely to be offset by a decline in imports. Rwanda has been experiencing persistent trade deficits due to large imports. In 2012, the trade deficit in goods reached US$1,376 million. Among import items, imports of energy and lubricants reached US$289 million or 16.4 percent of total imports. The value of energy and lubricants imports was larger than the sum of the traditional exports (US$263 million)67 during the same period. In other words, if prices decline to the same degree across different types of commodities, the impact on exports will be offset by that on imports.
65 The data on neighboring countries are as of 2012.66 Assuming no immediate impact on export volumes.67 Of which coffee was US$61 million, tea US$66 million, and minerals US$136 million.
Annex Table 5: impact of a 10 Percent Decline in Export Prices of the Traditional Products
2012 2013 (a)
2014 (A 10% decline of ex-port prices)
(b)
gap (b) – (a)
Unit price of traditional exports (US$ per kg) 5.03 5.6 5.04 −0.56Volume of traditional goods exports (tons) 57,037 60,893 60,893 0
Export values (in US$ million) 287 356 307−49
(14% of total exports)
Rwanda Economic Update | Edition No. 6 60
Annex Notes

DATA APPENDix

Appendix 1: Rwanda—Selected Economic indicators2010 2011 2012 2013
gDP growth Rate (percent) 7.3 7.8 8.8 4.7agriculture 5.0 4.7 6.5 3.3Industry 8.4 17.8 8.3 9.4Services 9.2 8 11.6 5.3Fiscal Framework (percent of gDP)¹Total Revenues 25.4 24.8 25.3 23.2Domestic revenue 12.4 13.8 14.3 15.5Tax revenue 11.9 13.2 13.4 13.7non-tax revenue 0.5 0.6 0.8 1.8Grants 13.0 10.8 11.0 7.7Budgetary grants 9.0 6.1 6.4 4.0Capital grants 4.0 4.7 4.6 3.7Total expenditure and net lending 25.5 27.9 26.5 28.5Current expenditure 14.5 15.5 14.8 13.4Capital expenditure 10.0 12.5 11.6 12.9Domestic 5.0 6.2 5.6 5.1Foreign 5.0 6.2 6.1 7.8Net lending 0.9 0.5 0.0 2.2Budget deficit (cash basis)Excluding grants −13.4 −14.5 −12.5 −13.2Including grants −0.5 −3.8 −1.5 −5.4External SectorExports (year-on-year growth) 26.5 56.2 27.3 19.0Imports (year-on-year growth) 8.7 44.5 18.7 −0.4Gross Reserves (MillionsUS$) 813.3 1050.0 850.3 1070.0Gross Reserves (months of imports of GS) 4.5 5.1 4.1 4.8Consumer Price Index (percentage change)End of period 0.2 8.3 3.9 3.6Period average 2.3 5.7 6.3 4.2Exchange rate (Rwf/US$)End period 594.5 603.4 631.0 667.7Period average 583.3 602.0 614.3 646.6Sources: NISR; BNR;and MINECOFIN¹ On a fiscal year basis (July–June). For example, the 2011 column refers to FY2010/2011.
Rwanda Economic Update | Edition No. 6 62
Data Appendix

Appendix 2: Rwanda—gross Domestic Product by Activity2009 2010 2011 2012 2013
(Rwf billion, current prices)gross Domestic Product 3,017 3,323 3,846 4,480 4,915agriculture 1,022 1,082 1,244 1,483 1,624 Food crops 687 719 845 1,025 1,162 Export crops 61 75 78 100 79 Livestock 104 109 122 137 152 Forestry 159 169 185 204 212 Fisheries 10 12 14 16 18Industry 372 428 554 638 724 Mining & quarrying 24 33 74 70 89 Manufacturing 159 181 204 234 253 Electricity 8 10 11 15 17 Water & waste management 10 12 14 15 15 Construction 171 193 251 304 350Services 1,435 1,604 1,790 2,123 2,327
Trade and transport 458 520 592 707 758Maintenance and repair of motor vehicles 15 16 19 21 23Wholesale & retail trade 361 408 466 553 589Transport services 82 95 107 133 147Other services 977 1,084 1,198 1,415 1,569
Taxes less subsidies on products 188 209 258 237 239(Rwf billion, constant 2011 prices)
gross Domestic Product 3,323 3,566 3,846 4,184 4,382agriculture 1,132 1,188 1,244 1,324 1,368
Food crops 767 805 845 905 938Export crops 67 76 78 85 81Livestock 113 118 122 129 138Forestry 175 180 185 191 197Fisheries 13 13 14 14 14
Industry 434 471 554 601 657Mining & quarrying 55 49 74 68 82Manufacturing 172 189 204 216 226Electricity 9 10 11 13 14Water & waste management 10 12 14 15 15Construction 187 203 251 288 319
Services 1,518 1,657 1,790 1,997 2,103Trade and transport 508 554 592 680 719Maintenance and repair of motor vehicles 16 17 19 20 21Wholesale & retail trade 396 432 466 532 562Transport services 94 102 107 127 136Other services 1,008 1,102 1,198 1,317 1,384
Taxes less subsidies on products 242 254 258 262 254Sources: NISR.
Rwanda Economic Update | Edition No. 6 63
Data Appendix
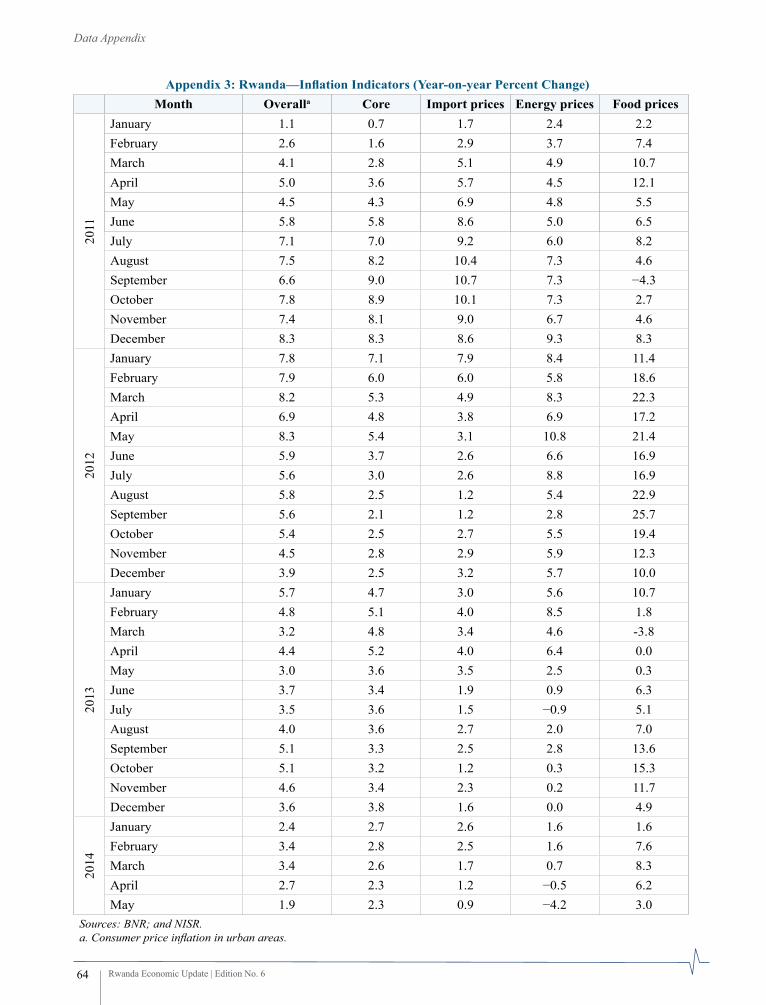
Rwanda Economic Update | Edition No. 6 64
Data Appendix
Appendix 3: Rwanda—Inflation Indicators (Year-on-year Percent Change)Month Overalla Core import prices Energy prices Food prices
2011
January 1.1 0.7 1.7 2.4 2.2February 2.6 1.6 2.9 3.7 7.4March 4.1 2.8 5.1 4.9 10.7april 5.0 3.6 5.7 4.5 12.1May 4.5 4.3 6.9 4.8 5.5June 5.8 5.8 8.6 5.0 6.5July 7.1 7.0 9.2 6.0 8.2august 7.5 8.2 10.4 7.3 4.6September 6.6 9.0 10.7 7.3 −4.3October 7.8 8.9 10.1 7.3 2.7November 7.4 8.1 9.0 6.7 4.6December 8.3 8.3 8.6 9.3 8.3
2012
January 7.8 7.1 7.9 8.4 11.4February 7.9 6.0 6.0 5.8 18.6March 8.2 5.3 4.9 8.3 22.3april 6.9 4.8 3.8 6.9 17.2May 8.3 5.4 3.1 10.8 21.4June 5.9 3.7 2.6 6.6 16.9July 5.6 3.0 2.6 8.8 16.9august 5.8 2.5 1.2 5.4 22.9September 5.6 2.1 1.2 2.8 25.7October 5.4 2.5 2.7 5.5 19.4November 4.5 2.8 2.9 5.9 12.3December 3.9 2.5 3.2 5.7 10.0
2013
January 5.7 4.7 3.0 5.6 10.7February 4.8 5.1 4.0 8.5 1.8March 3.2 4.8 3.4 4.6 -3.8april 4.4 5.2 4.0 6.4 0.0May 3.0 3.6 3.5 2.5 0.3June 3.7 3.4 1.9 0.9 6.3July 3.5 3.6 1.5 −0.9 5.1august 4.0 3.6 2.7 2.0 7.0September 5.1 3.3 2.5 2.8 13.6October 5.1 3.2 1.2 0.3 15.3November 4.6 3.4 2.3 0.2 11.7December 3.6 3.8 1.6 0.0 4.9
2014
January 2.4 2.7 2.6 1.6 1.6February 3.4 2.8 2.5 1.6 7.6March 3.4 2.6 1.7 0.7 8.3april 2.7 2.3 1.2 −0.5 6.2May 1.9 2.3 0.9 −4.2 3.0
Sources: BNR; and NISR.a. Consumer price inflation in urban areas.

Rwanda Economic Update | Edition No. 6 65
Data Appendix
Appendix 4: Rwanda—Exchange Rate (Monthly Average)
Month US dollar Euro UK pound Ugandashilling
Kenyashilling
Tanzaniashilling
Burundifranc
2011
January 604.37 779.26 936.44 0.25 7.11 0.39 0.47February 605.15 799.47 955.36 0.26 7.40 0.39 0.47March 606.75 801.24 959.52 0.25 7.44 0.39 0.47april 601.27 867.09 982.15 0.25 7.17 0.40 0.49May 599.28 860.98 979.81 0.25 7.03 0.40 0.49June 600.00 863.18 974.24 0.25 6.77 0.38 0.49July 600.51 856.74 967.83 0.24 6.66 0.38 0.49august 599.75 860.21 981.83 0.22 6.57 0.38 0.50September 599.84 828.69 951.92 0.22 6.40 0.37 0.49October 601.29 822.51 945.55 0.22 5.99 0.36 0.50November 601.77 817.69 953.91 0.24 6.48 0.35 0.49December 603.45 796.17 942.33 0.25 6.97 0.38 0.48
2012
January 604.37 779.26 936.44 0.25 7.11 0.39 0.47February 605.15 799.47 955.36 0.26 7.40 0.39 0.47March 606.75 801.24 959.52 0.25 7.44 0.39 0.47april 607.01 799.45 971.24 0.25 7.40 0.39 0.46May 608.58 780.82 970.12 0.25 7.33 0.39 0.45June 609.94 764.00 947.89 0.25 7.30 0.39 0.44July 612.95 752.14 955.23 0.25 7.40 0.39 0.44august 613.60 759.79 963.57 0.25 7.43 0.40 0.43September 618.22 794.17 995.03 0.25 7.43 0.40 0.43October 625.24 810.86 1,006.08 0.25 7.47 0.40 0.43November 628.77 806.64 1,003.95 0.24 7.46 0.40 0.43December 630.99 827.21 1,018.50 0.24 7.46 0.40 0.42
2013
January 631.29 838.05 1,008.81 0.24 7.38 0.40 0.42February 633.25 846.82 981.39 0.24 7.36 0.40 0.41March 634.98 824.27 957.00 0.24 7.52 0.40 0.41april 637.38 829.03 974.68 0.25 7.69 0.40 0.41May 640.13 831.41 979.34 0.25 7.73 0.40 0.41June 641.66 846.19 993.12 0.25 7.61 0.40 0.42July 645.22 843.25 980.34 0.25 7.55 0.41 0.42august 649.01 864.16 1,005.03 0.25 7.53 0.41 0.43September 653.26 871.37 1,033.65 0.26 7.60 0.41 0.43October 661.29 901.19 1,064.45 0.26 7.88 0.42 0.43November 664.30 897.29 1,068.75 0.27 7.84 0.42 0.43December 667.74 914.43 1,093.43 0.27 7.85 0.43 0.44
2014
January 673.60 917.68 1,110.40 0.27 7.95 0.42 0.44February 674.65 920.46 1,115.73 0.28 7.95 0.42 0.44March 676.39 935.04 1,124.54 0.27 7.95 0.42 0.44april 678.20 936.67 1,135.18 0.27 7.90 0.42 0.44May 680.70 935.44 1,146.60 0.27 7.79 0.41 0.44
Source: BNR.

Rwanda Economic Update | Edition No. 6 66
Data Appendix
Appendix 5: Rwanda—Key interest Rates (Percent)
Month Policy Rate
Average Deposit
Rate
AverageLending
Rate
interbank Rate
Treasury Bill Rate
28 days 91 days 182 days
364 days
Weighted Average
Rate
2011
January 6.0 7.5 15.6 6.7 6.1 6.4 7.2 7.7 7.2February 6.0 7.5 16.9 6.7 6.2 6.4 7.2 7.3 7.0March 6.0 7.5 16.6 6.7 6.4 6.9 7.4 7.6 7.2april 6.0 8.7 16.6 6.9 6.4 6.8 7.2 7.4 7.1May 6.0 7.9 16.9 6.9 6.2 6.7 7.2 7.3 7.0June 6.0 8.0 17.0 7.0 6.1 6.5 6.9 7.2 6.8July 6.0 6.8 16.6 6.9 6.1 6.4 7.2 7.1 6.8august 6.0 7.7 17.0 6.9 6.1 6.2 7.2 7.1 6.7September 6.0 7.7 17.0 6.9 6.3 6.5 6.9 7.0 6.7October 6.5 7.4 17.0 7.4 6.8 7.0 7.2 7.5 7.2November 7.0 8.0 16.5 7.5 6.8 7.2 7.7 8.6 7.8December 7.0 8.0 16.7 8.1 7.0 7.3 7.6 8.2 7.6
2012
January 7.0 7.4 17.0 7.3 7.1 7.3 7.7 8.4 7.6February 7.0 8.3 16.3 6.9 7.1 7.6 7.4 8.0 7.6March 7.0 8.2 16.3 7.7 7.4 7.6 7.9 7.8 7.7april 7.0 8.1 16.9 8.0 7.5 7.6 7.9 8.5 7.9May 7.5 9.9 16.7 8.6 7.9 8.1 8.3 8.9 8.3June 7.5 7.9 16.8 9.0 8.8 9.6 9.4 9.1 9.3July 7.5 8.9 16.5 9.1 9.4 10.2 - - 9.8august 7.5 8.6 17.1 9.5 10.6 10.2 10.5 11.7 11.1September 7.5 8.5 17.1 10.8 11.5 12.1 12.0 12.7 12.3October 7.5 9.2 16.6 10.9 11.9 12.4 12.5 - 12.1November 7.5 11.2 16.7 11.9 11.8 12.5 12.7 - 12.4December 7.5 10.7 16.5 11.1 11.8 12.6 12.8 - 12.4
2013
January 7.5 11.3 17.1 11.1 12.1 12.6 12.8 - 12.4February 7.5 10.3 17.0 10.4 11.6 12.3 12.7 - 12.2March 7.5 10.4 17.2 10.0 11.0 12.1 12.6 12.8 12.1april 7.5 10.7 17.3 10.9 11.2 12.3 12.8 13.0 12.0May 7.5 10.6 17.6 11.1 11.0 12.0 12.4 12.7 12.0June 7.0 10.6 17.7 9.6 10.0 10.7 11.3 11.7 10.8July 7.0 8.5 17.2 9.6 8.9 9.6 10.0 10.7 9.7august 7.0 10.5 17.5 7.6 7.8 8.3 8.9 9.3 8.6September 7.0 9.0 17.8 7.0 6.8 6.9 7.3 7.8 7.1October 7.0 9.5 17.4 6.7 6.2 6.5 6.7 7.6 6.8November 7.0 8.0 17.2 6.1 5.5 5.9 6.2 7.0 6.1December 7.0 8.5 16.9 5.6 5.0 5.3 5.9 6.4 5.6
2014
January 7.0 8.9 17.5 5.6 5.4 6.0 6.7 8.2 6.4February 7.0 8.0 17.1 5.8 5.1 5.8 6.5 8.2 6.1March 7.0 8.3 16.8 5.8 4.9 5.5 6.6 8.0 6.0april 7.0 8.1 17.4 5.6 4.8 5.3 6.3 7.8 6.0May 7.0 - - 5.7 4.5 5.3 6.3 7.4 5.9
Source: BNR.

Rwanda Economic Update | Edition No. 6 67
Data Appendix
Appendix 6: Rwanda—gross international ReservesMonth Rwf billion US$ million
2011
January 456 761February 447 747March 425 709april 494 821May 464 775June 451 749July 452 754august 480 799September 496 826October 550 913November 522 866December 634 1,050
2012
January 597 987February 582 960March 546 899april 514 845May 464 762June 526 859July 473 771august 451 733September 449 721October 471 750November 477 757December 535 850
2013
January 465 736February 436 688March 444 698april 452 707May 624 973June 653 1,016July 659 1,018august 657 1,012September 681 1,035October 691 1,045November 683 1,024December 717 1,070
2014
January 680 1,008February 648 960March 632 933
Source: BNR.
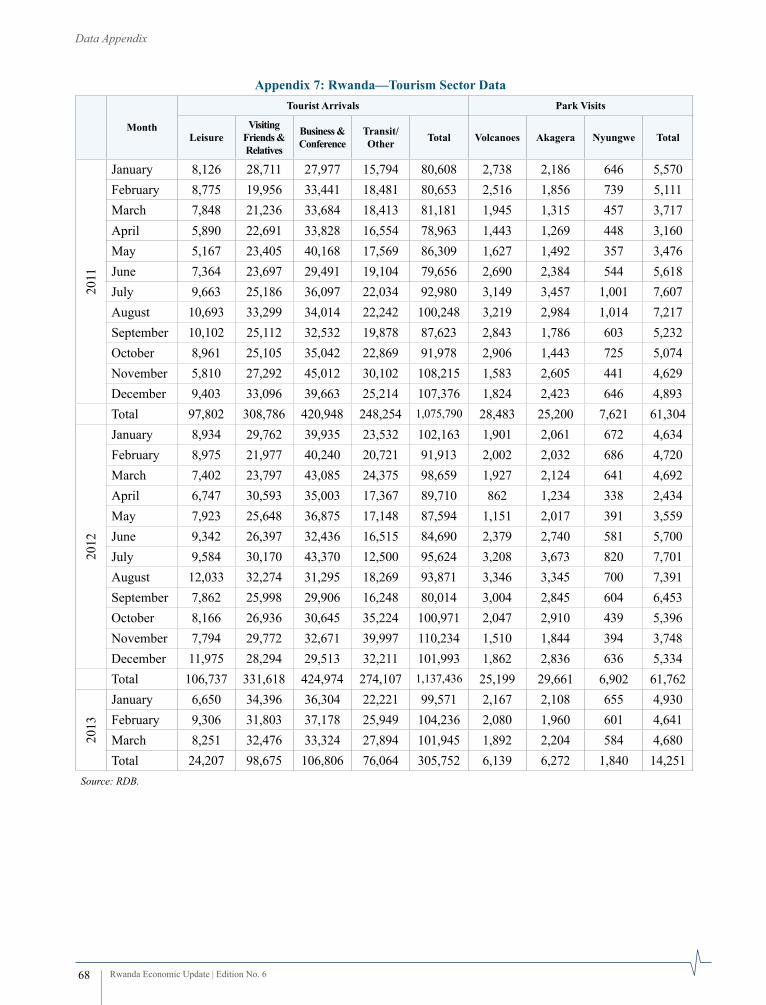
Rwanda Economic Update | Edition No. 6 68
Data Appendix
Appendix 7: Rwanda—Tourism Sector Data
Month
Tourist Arrivals Park Visits
LeisureVisiting
Friends & Relatives
Business & Conference
Transit/ Other Total Volcanoes Akagera Nyungwe Total
2011
January 8,126 28,711 27,977 15,794 80,608 2,738 2,186 646 5,570February 8,775 19,956 33,441 18,481 80,653 2,516 1,856 739 5,111March 7,848 21,236 33,684 18,413 81,181 1,945 1,315 457 3,717april 5,890 22,691 33,828 16,554 78,963 1,443 1,269 448 3,160May 5,167 23,405 40,168 17,569 86,309 1,627 1,492 357 3,476June 7,364 23,697 29,491 19,104 79,656 2,690 2,384 544 5,618July 9,663 25,186 36,097 22,034 92,980 3,149 3,457 1,001 7,607august 10,693 33,299 34,014 22,242 100,248 3,219 2,984 1,014 7,217September 10,102 25,112 32,532 19,878 87,623 2,843 1,786 603 5,232October 8,961 25,105 35,042 22,869 91,978 2,906 1,443 725 5,074November 5,810 27,292 45,012 30,102 108,215 1,583 2,605 441 4,629December 9,403 33,096 39,663 25,214 107,376 1,824 2,423 646 4,893Total 97,802 308,786 420,948 248,254 1,075,790 28,483 25,200 7,621 61,304
2012
January 8,934 29,762 39,935 23,532 102,163 1,901 2,061 672 4,634February 8,975 21,977 40,240 20,721 91,913 2,002 2,032 686 4,720March 7,402 23,797 43,085 24,375 98,659 1,927 2,124 641 4,692april 6,747 30,593 35,003 17,367 89,710 862 1,234 338 2,434May 7,923 25,648 36,875 17,148 87,594 1,151 2,017 391 3,559June 9,342 26,397 32,436 16,515 84,690 2,379 2,740 581 5,700July 9,584 30,170 43,370 12,500 95,624 3,208 3,673 820 7,701august 12,033 32,274 31,295 18,269 93,871 3,346 3,345 700 7,391September 7,862 25,998 29,906 16,248 80,014 3,004 2,845 604 6,453October 8,166 26,936 30,645 35,224 100,971 2,047 2,910 439 5,396November 7,794 29,772 32,671 39,997 110,234 1,510 1,844 394 3,748December 11,975 28,294 29,513 32,211 101,993 1,862 2,836 636 5,334Total 106,737 331,618 424,974 274,107 1,137,436 25,199 29,661 6,902 61,762
2013
January 6,650 34,396 36,304 22,221 99,571 2,167 2,108 655 4,930February 9,306 31,803 37,178 25,949 104,236 2,080 1,960 601 4,641March 8,251 32,476 33,324 27,894 101,945 1,892 2,204 584 4,680Total 24,207 98,675 106,806 76,064 305,752 6,139 6,272 1,840 14,251
Source: RDB.


Produced by Poverty Reduction and Economic Management Unit Africa Region Photo credits: © World BankDesign by: Robert Waiharo
The World BankBlvd. de la RevolutionSORAS BuildingPO Box 609 Kigali, RwandaTel: +250 252 591 300Fax: +250 252 576385Website: www.worldbank.org/rwanda